
Abstract
A speleothem collected from Palco Cave (Puerto Rico) spans the 8.2 ka event, a time interval associated with fluctuations of Atlantic Ocean circulation and possible drying in the Caribbean region. While stalagmite δ18O, δ13C, and Mg/Ca data do not show a sustained change in mean state over the 8.2 ka event, the proxies provide robust evidence for three abrupt fluctuations toward drier conditions in rapid succession, each lasting less than two decades, occurring at 8.20, 8.14, and 8.02 ka BP. A cave monitoring program at Palco Cave supports the interpretation of the speleothem proxy records. Because changes in the position of the Intertropical Convergence Zone (ITCZ) are directly coupled to sea-surface temperature variations in the North Atlantic, we hypothesize that cold events in the North Atlantic temporarily limited the northward migration of the ITCZ and tropical rain belt in boreal summer during these abrupt drying periods. The speleothem record suggests that the 8.2 ka event was associated with rapid rainfall fluctuations in the northern Caribbean followed by a comparably warm and wet phase after the 8.2 ka event. This enhanced variability during the transitional period of the deglaciation appears to be linked to a fast coupling between interacting oceanic and atmospheric processes. This involves, in particular, the Atlantic Meridional Overturning Circulation in modulating interhemispheric heat transport.
Keywords
Introduction
At the end of the last deglaciation, North Atlantic meltwater pulses from the retreating Laurentide ice sheet triggered a chain of oceanic and atmospheric responses including temporary slow-downs or even collapses of the Atlantic Meridional Overturning Circulation (AMOC) and hemispheric-scale alterations of the atmospheric circulation (Dean et al., 2002; Morrill et al., 2013; Thomas et al., 2007). Studying these pronounced meltwater pulses of the past, helps to understand how North Atlantic freshwater influxes affect the ocean-atmosphere coupled system on basin, hemispheric, and near global scales (Aguiar et al., 2021; Alley et al., 1997; Bitz et al., 2007; Carlson, 2010). The so-called 8.2 ka event that lasted up to 150 years was the most pronounced climate anomaly during the Holocene. It has been associated with North Atlantic meltwater pulses and left global climatic imprints (e.g. Alley and Agustsdottir, 2005). Especially around the North Atlantic basin, numerous records show evidence of marked environmental changes at different time scales linked to these meltwater pulses (Kilhavn et al., 2022; Morrill et al., 2013; Parker and Harrison, 2022; Thomas et al., 2007; Waltgenbach et al., 2020). Simultaneous cooling events have been also recorded in Europe, as well as pronounced hydrological changes in other parts of the globe (Duan et al., 2021, 2023; Morrill et al., 2013; Oster et al., 2017; Parker and Harrison, 2022; Waltgenbach et al., 2020; Zhao et al., 2022). However, it is still debated whether the 8.2 ka event was a single prolonged event or the result of multiple shorter abrupt climatic fluctuations (Duan et al., 2023; Ellison et al., 2006; Matero et al., 2017; Peros et al., 2017; Wiersma and Renssen, 2006). The meltwater pulses are postulated to have decreased the strength of the AMOC, cooling North Atlantic sea-surface temperatures (SSTs) (Hughen et al., 1996a), drying over Mesoamerica and the Caribbean realm (Fensterer et al., 2013; Haug et al., 2001; Lachniet et al., 2004; Medina et al., 2023), and intensifying the South American monsoon (Bustamante et al., 2016; Cheng et al., 2009; Strikis et al., 2011). However, the climate signal, and in particular the sub-structure of the 8.2 ka event in the wider Caribbean region is not fully consistent among sites, demonstrating that the mechanisms of low-latitude responses to meltwater pulses may be complex and still not well-understood (Medina et al., 2023). Variability in zonal mean tropical rainfall originating from the Intertropical Convergence Zone (ITCZ) and the associated tropical rain belts (TRB) is thought to be influenced by inter-hemispheric temperature gradient variations and cross-equatorial energy flux perturbations (Deplazes et al., 2013; Fensterer et al., 2013; Lechleitner et al., 2017; Warken et al., 2020). For example, during the last glacial maximum (LGM) and the Heinrich stadials, colder temperatures in the North Atlantic contributed to a more southern ITCZ position over the Atlantic (Chiang et al., 2003; Wright et al., 2023). In addition, the regional heterogeneous land-sea distribution, gradients between the Pacific and the Atlantic oceans, as well as other internal and external forcing mechanisms (e.g. solar or volcanic) modulate the position and extent of the ITCZ leading to complex precipitation distributions on both spatial and temporal scales (e.g. Bhattacharya and Coats, 2020; Medina et al., 2023; Ridley et al., 2015; Singarayer et al., 2017; Warken et al., 2021; Wright et al., 2023).
Available paleoclimate reconstructions illustrate the amplitude and extent of the environmental changes induced by the 8.2 ka event, but the lack of high-resolution proxy records during the early Holocene, especially in the tropics (Lechleitner et al., 2017; Parker and Harrison, 2022; Warken et al., 2021), limits our understanding of the temporal evolution of the event and the underlying dominant response mechanisms beyond the extratropical North Atlantic. Here we present geochemical results from a well-dated stalagmite (PR-PA-1), collected in Palco Cave, Puerto Rico, that grew continuously through the 8.2 ka event and provides insights on the event’s temporal structure and spatial impact on the tropical Atlantic at sub-decadal resolution.
Site and sample description
Regional setting
Puerto Rico is the easternmost island of the Greater Antilles, located in the north-eastern Caribbean between the island of Hispaniola and the Virgin Islands (Figure 1a). It lies north of the core ITCZ region. The TRB reaches Puerto Rico primarily in summer and corresponds with the northernmost ITCZ latitudinal migrations, which follows warming in Caribbean SST. In this paper, for convenience, we hereafter refer to the ITCZ/TRB system more simply as the ITCZ. Typical for the Caribbean, the seasonal meridional migration of the ITCZ influences the convection activity reaching the cave site from May to November (Hernández Ayala, 2019; Jury, 2009; Poveda et al., 2006). This region is tightly coupled to the influence of the North Atlantic subtropical high, a climatic feature located poleward of the ITCZ (Gamble et al., 2008; Hernández Ayala, 2019). As such, the area is highly sensitive to record hydrological changes related to anomalous meridional ITCZ migrations (Gamble et al., 2008; Hernández Ayala, 2019).
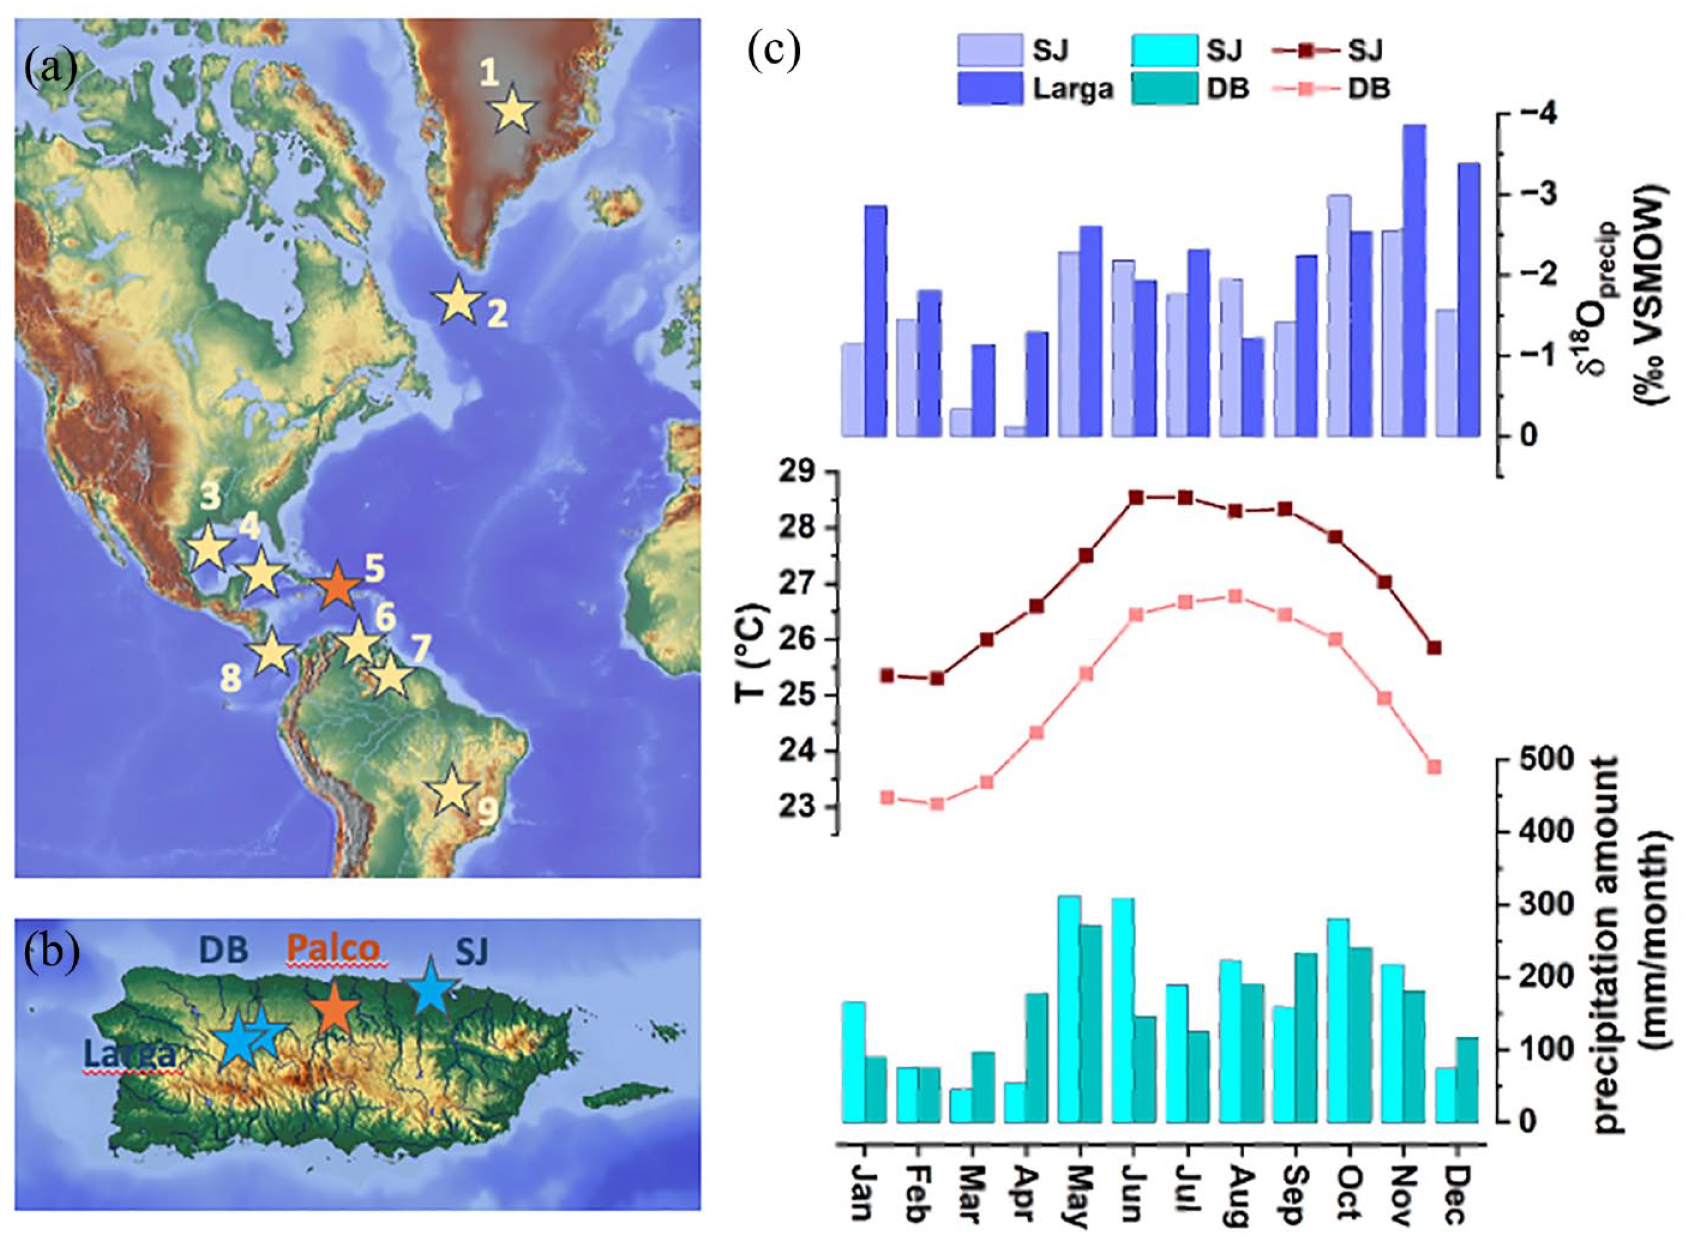
Locations and climatology. (a) Map showing the location of Palco Cave, where PR-PA-1 was collected (5) and proxy records of the 8.2 ka event which are discussed in the text (1 – Greenland (Alley et al., 1997); 2 – Labrador Basin (Kleiven et al., 2008) 3 – Orca Basin (LoDico et al., 2006); 4 – Cenote Jennifer, Cuba (Peros et al., 2017); 5 – PR-PA-1 (this study); 6 – Cariaco Basin (Hughen et al., 1996b); 7 – Alfredo Jahn Cave, Venezuela (Medina et al., 2023); 8 – Venado Cave, Costa Rica (Lachniet et al., 2004); 9 – Padre Cave, Brazil (Cheng et al., 2009)). (b) location of Palco Cave in Puerto Rico, together with the location of the Dos Bocas (DB) and San Juan (SJ) weather stations, as well as the location of near-by Larga Cave. (c) Climatology: From bottom to top: Monthly climate normals for the period 1981–2010 recorded at the Dos Bocas and San Juan weather station. The data was downloaded from the data-query tool xmACIS (http://xmacis.rcc-acis.org/) developed and maintained by NOAA’s Northeast Regional Climate Center. Top panel shows monthly mean δ18O values in precipitation at GNIP station San Juan, as well as Larga Cave (Vieten et al., 2018a, 2018b; Warken et al., 2022a).
Cave and sample description
Speleothem PR-PA-1 was collected from the remotely located Palco Cave (N 18.333°, W 66.526°, at 283 m asl, Figure 1b) situated in the north-central karst region characterized by sinkholes and mogotes. Palco Cave is found about 17 km south of the Atlantic coast and 16 km east of lake Dos Bocas weather station (Figure 1b). The area above the cave is covered by thick tropical forest with thin soil cover. The cave is predominantly a vadose cave with some phreatic features. It is located in the massive dense Oligocene Lares Limestone (Giusti, 1978). Palco Cave has a single known entrance located along an inclined surface. Speleothem PR-PA-1 was found already broken since it naturally fell over, and was collected lying on the floor at a distance of about 400 m from the entrance in the main tubular chamber.
Local climatology
Observed air temperatures near Palco Cave, measured at the nearby Dos Bocas weather station, vary from a daily average of 22°C in boreal winter to about 27°C in summer (Figure 1c). Rainfall amounts show a seasonal cycle with rainfall maxima of c. 250 mm in the summer months (April–Nov) and <100 mm of monthly rainfall in the drier winter months (Dec–March). The summer rainy season is bimodal with an early summer maximum around May, and a late summer peak in August through –November (Figure 1c, Hernández Ayala (2019). The main source of rainfall are the tropical Atlantic Ocean surface waters (Figure S1) from which precipitation is brought to Puerto Rico as low pressure systems embedded in easterly convective waves, tropical storms, trade wind convergence and occasional cold fronts from the north-west (Jury, 2009; Scholl and Murphy, 2014). Rainfall δ18O values at GNIP station San Juan as well as near-by Larga cave follow the seasonal rainfall pattern with lower values during the warm season characterized by convective rainfall, and higher values during the drier winters (Figure 1c). The interannual anticorrelation (r = −0.73) of rainfall δ18O values with precipitation amount indicates an isotopic “amount effect” of c. −0.1‰ per 100 mm of rainfall amount in Puerto Rico (Govender et al., 2013; Vieten et al., 2018a, 2018b; Warken et al., 2020). In comparison, interannual rainfall δ18O values vary by ~2.5 ‰ across a range of ~1000–3000 mm of annual rainfall. Combined with the predominantly singular easterly moisture source from the Caribbean Sea, the δ18O values of precipitation are most strongly controlled by rainfall amount contained in airmasses at and upwind of the study area (Vieten et al., 2018b; Warken et al., 2020).
Methods
Cave monitoring
Cave atmospheric measurements were taken on 8th of August 2015, 6th of November 2015, and 27th of December 2016. A drip rate data logger was placed in the cave on 8 August 2015. Cave atmosphere parameters including pCO2, temperature (T) and relative humidity (RH) were measured at the collection site of PR-PA-1 during each visit using an Amprobe CO2-100 handheld carbon dioxide meter (accuracy of ± 30 ppm / ± 5% of reading) for pCO2 between 0 and 5000 ppm; ±0.6°C for T and ± 5% for RH above 90%). The drip rate logger (Stalagmate, Driptych) recorded a slow-dripping site (SD) near the collection site of PR-PA-1 between 8th of August 2015 and 6th of July 2016, and a fast-dripping site (FD) was counted during each cave visit. Close to the collection site of PR-PA-1 on 6th of November 2015 scrapings from three actively growing stalagmite tips and contemporaneous drip water samples from several stalactites were taken to test for oxygen isotope fractionation during calcite precipitation.
Sampling
Stalagmite PR-PA-1 was cut along the growth axis and slabbed to produce a section of ca. 1 cm thickness. The slab was polished, and powder samples were taken along the growth axis, where calcite precipitation most likely occurs with a constant fractionation over time (e.g. Mickler et al., 2006). For U-Th dating, samples between 170 and 300 mg were drilled using a handheld drill with dental drill bit. The material was extracted next to the speleothem’s growth axis to allow a good depth-age correlation, and dating pits were drilled on individual growth layers. A Sherline mill connected to a digital readout was used at the University of Puerto Rico - Mayaguez (UPRM) to continuously mill proxy samples along the growth axis. A first milling line for δ18O and δ13C analysis was milled using a dental drill bit with a diameter of 1 mm and a milling depth of about 1.5 mm. Powder samples with a mass between 0.3 and 0.5 mg were milled continuously at increments of 0.5 mm along the growth axis and a duplicate sample was taken at every fifth sample. A second trench for Mg/Ca samples was milled inside the stable isotope milling track with the same sampling interval of 0.5 mm as the stable isotope sampling below a laminar flow hood to prevent any sample contamination in the Magueyes Marine Laboratory of UPRM. Prior to trace element sampling, the track was pre-milled using a dental drill bit of 2 mm diameter to ensure a clean sampling surface. Additional δ18O and δ13C samples with the same spatial resolution of 0.5 mm were drilled at the University of Nevada, Las Vegas (UNLV), for the whole section between 50 and 122 mm distance from top (dft) to reproduce major δ18O and δ13C proxy variations of the initial milling. A Sherline mill similar to the one in UPRM was used, equipped with a dental drill bit with a diameter of 0.52 mm.
230Th/U-dating
Twenty-one 230Th/U-ages were determined for stalagmite PR-PA-1. 230Th/U-dating was conducted at the Max Planck Institute for Chemistry (MPIC), Mainz, using a Nu Plasma multi-collector inductively coupled plasma mass spectrometer (MC-ICPMS). Chemical separation of U and Th isotopes was performed as described by Yang et al. (2015). Analytical details for mass spectrometric measurements of U and Th isotope ratios are described by Obert et al. (2016). Details about the calibration of the mixed U-Th spike are given by Gibert et al. (2016). Activity ratios were calculated using the half-lives from Cheng et al. (2013), and all errors are reported at the 2σ-level.
Stable isotope analysis
Stalagmite powder samples were analyzed in the Geology Department of the UPRM and at the Las Vegas Isotope Science Laboratory at UNLV. The δ-values are reported relative to Vienna Pee Dee Belemnite (VPDB). Measurements at UPRM were done on an Isoprime 100 multiflow mass spectrometer. Results were corrected based on NBS-19 standard, which was measured before and after a batch of five samples. Duplicate samples were well reproduced and long-term standard measurements indicate a precision of ± 0.06‰ for δ18O values and ± 0.04‰ for δ13C values. At the University of Nevada Las Vegas in the Las Vegas Isotope Science Laboratory, stalagmite δ18O values were determined on a Kiel IV automated carbonate preparation device via phosphoric acid digestion at 70°C connected to a ThermoElectron Delta V Plus mass spectrometer. Samples were corrected to an in-house calcite standard (USC-1) that was calibrated to NBS-19 and NBS-18 standards. The δ13C and δ18O values of USC-1 are 2.09 ± 0.05 and −2.08 ± 0.09 ‰ based on long-term monitoring.
Trace element analysis
Magnesium (Mg) and Calcium (Ca) were simultaneously measured on a Horiba Jobin Yvon Ultima inductively-coupled plasma optical emission spectrometer at Stony Brook University. Powdered samples were dissolved in 5% HNO3 in a volume sufficient to yield a Ca concentration of approx. 80 ppm. The instrument was calibrated using multi-element standards bracketing the expected range of Ca and Mg concentrations (1.6–180 ppm for Ca, and 0.8–10 ppm for Mg). Mg/Ca was corrected for any potential instrument drift (Schrag, 1999) by running standards after every fifth sample. Reproducibility of the standard in this study is ± 0.06 and ±0.08 mmol/mol, respectively.
The climate whiplash index (CWI)
The climate whiplash index (CWI) was calculated based on Loecke et al. (2017). The CWI (equation (1)) is calculated from the proxy value at the time step of interest (Pt), the proxy value measured before (Pt-1) as well as the following proxy value (Pt+1):
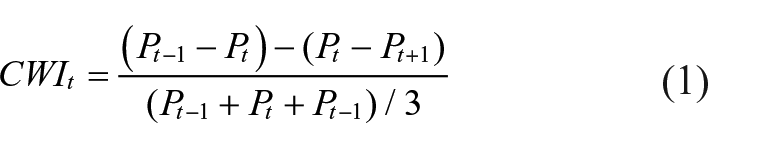
A CWI value close to 0 suggests no abrupt changes and relatively constant conditions over time. The absolute value of the CWI quantifies the intensity of that particular change: The larger the absolute value of the CWI, the more abrupt and severe is the change. The sign of CWI was adapted so that its positive (negative) values correspond to drying (wetting) events consistently across the proxy records. To account for the variable sample interval of the proxy records, the CWI calculation was also performed on linearly-interpolated proxy time series obtained for a temporal resolution of 8.2 years for the trace element data, and of 6.1 years for the stable isotope ratios.
Results
Age model
Speleothem PR-PA-1 has moderate U concentrations in the range of 300–400 ppb (Table 1). Detrital Th contamination is low with 232Th values around 0.01–0.7 ppt. Hence, (230Th/232Th) activity ratios are mostly in the range of 500 to <4000, which may require a significant correction for initial 230Th contents for most ages. Two ages (at 9.9 mm dft (7.26 ± 0.14 ka BP) and 102.2 2 mm dft (7.95 ± 0.11 ka BP), Table 1) contain no detectable 232Th, which we therefore refer to as “clean” (and the most robust) ages. The main uncertainty of the detrital correction stems from the difficulty to accurately constrain the (230Th/232Th) activity ratio of the detrital material, which varies with host rock and soil characteristics. Most commonly, a bulk Earth activity ratio of (230Th/232Th) ±0.4 is used, assuming a mean mass Th/U ratio in the continental crust of 3.8. However, in tropical regions, lower than bulk Earth Th/U values have been shown to be appropriate, including Cuba (Fensterer et al., 2010), the Bahamas (Hoffmann et al., 2010), Puerto Rico (Rivera-Collazo et al., 2015), or Mexico (Stinnesbeck et al., 2020). This also seems to be the case for stalagmite PR-PA-1 because using the a priori bulk Earth ratio to account for detrital 230Th results in age inversions compared to the two “clean” samples. Hence, a different detrital (230Th/232Th) ratio appears appropriate for stalagmite PR-PA-1.
Dating results including activity ratios and calculated ages for speleothem PR-PA-1.
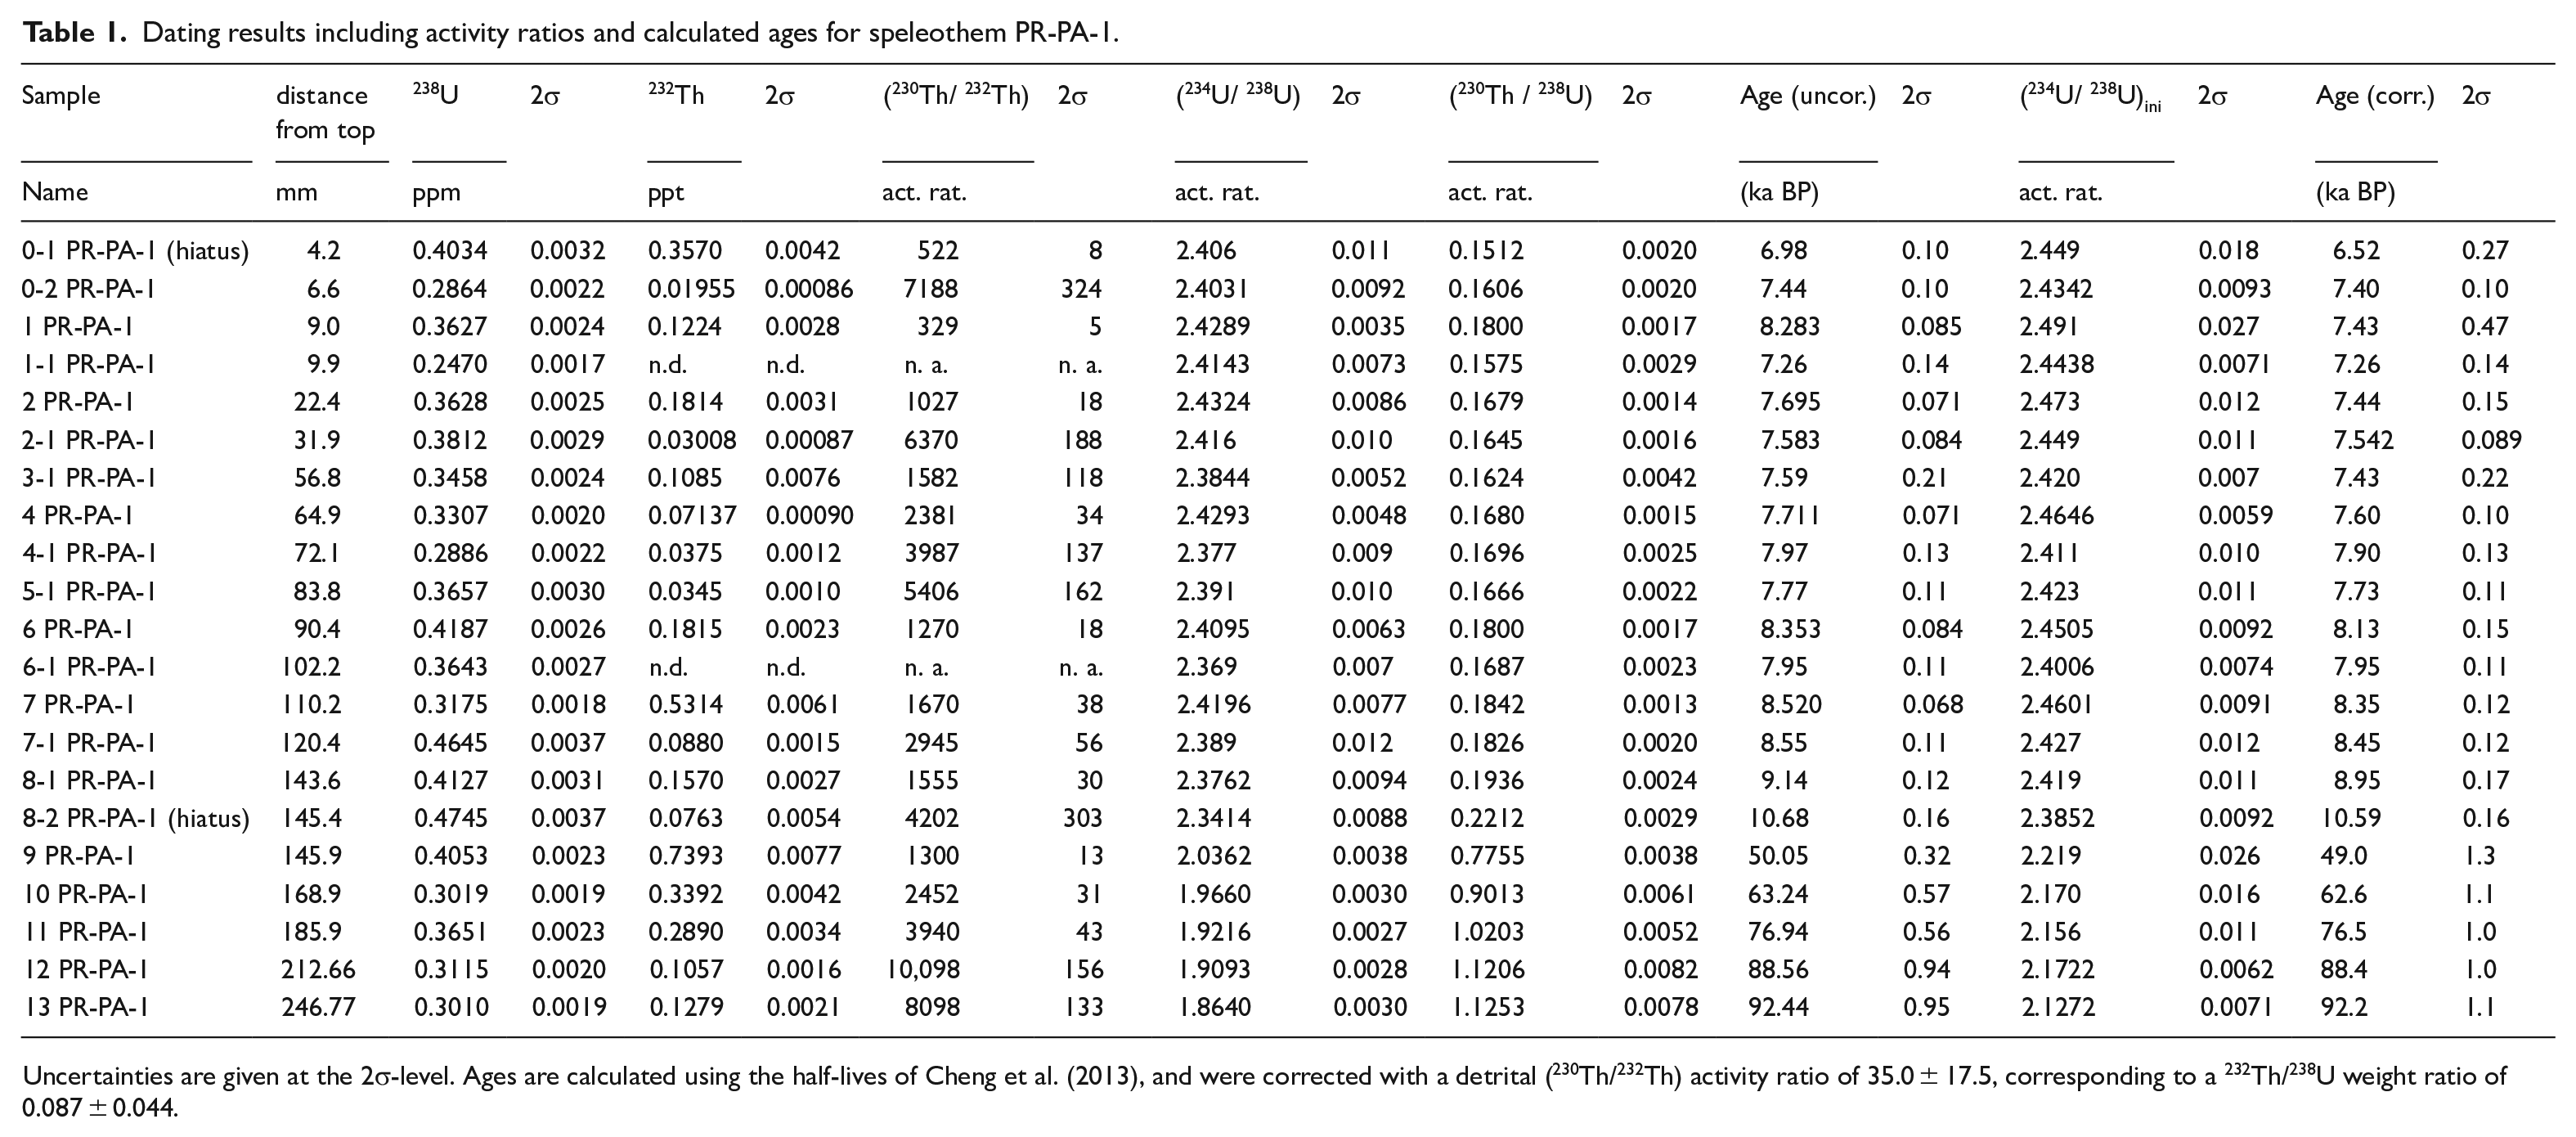
Uncertainties are given at the 2σ-level. Ages are calculated using the half-lives of Cheng et al. (2013), and were corrected with a detrital (230Th/232Th) activity ratio of 35.0 ± 17.5, corresponding to a 232Th/238U weight ratio of 0.087 ± 0.044.
Detrital correction assuming secular equilibrium of the detritus and a (230Th/232Th) activity ratio of 35.0 ± 17.5 results in all corrected ages in stratigraphic order within the uncertainties. This value is in a similar range as estimated for another stalagmite from Palco Cave (Rivera-Collazo et al., 2015), as well as the values determined via an isochron approach for a stalagmite from another cave from Puerto Rico (Warken et al., 2020). We assume a conservative error of 50% for the (230Th/232Th) ratio, resulting in uncertainties of the corrected ages in the order of 1%–3% (Figure 2).
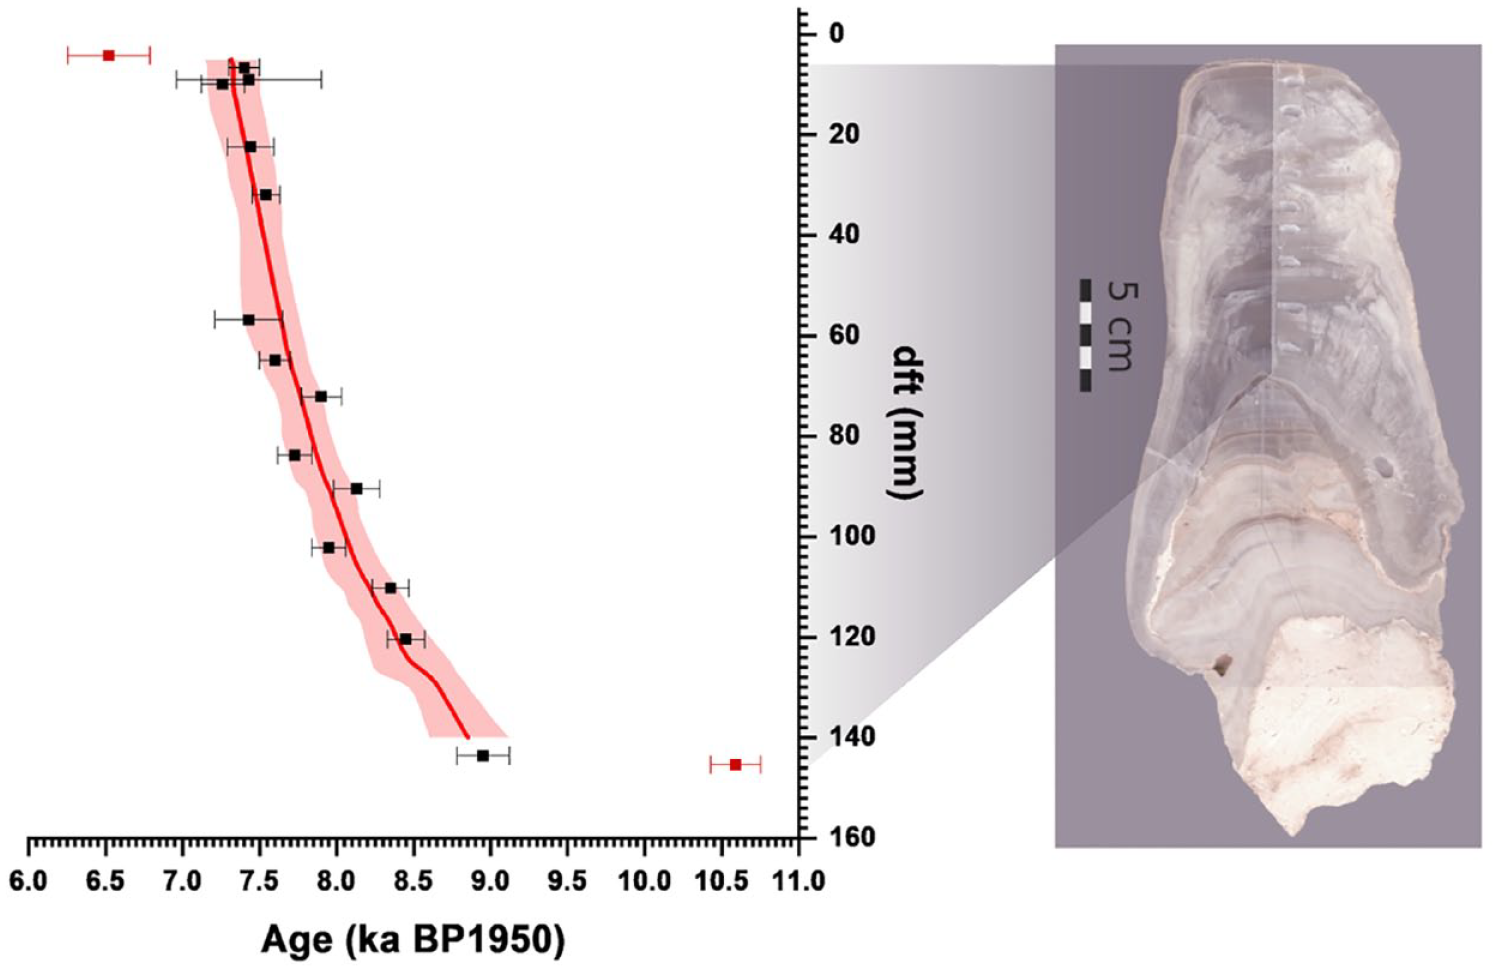
Age model of stalagmite PR-PA-1. The left panel shows the corrected 230Th/U ages versus distance from top (dft) for the Holocene growth phase between 5 and 140 mm dft. The position of this growth phase on stalagmite PR-PA-1 is indicated on the right. Solid lines show the StalAge age model (red line) and the 95% confidence limits (light red shading). Two ages (4.2 and 145.4 mm) were excluded from the age model construction because they may represent mixed ages from growth phases of significantly different ages. Two ages (at 9.9 and 102.2 mm) do not have significant amounts of detrital contamination. See text for details.
The corrected ages reveal that speleothem PR-PA-1 has two distinct growth phases. During the Holocene, it grew from 8.85 ± 0.26 to 7.32 ± 0.17 ka BP (based on the age model, BP denotes the year 1950; before 1950 (present)) and during the Upper Pleistocene, from 92.50 ± 0.95 to 50.11 ± 0.32 ka BP (based on the oldest and youngest 230Th/U-age). We focus on the Holocene growth phase, that is, the stalagmite section between 5 and 140 mm dft, to study the 8.2 ka event in high-resolution which is characterized by an average growth rate of c. 125 µm per year. Figure 2 shows the 230Th/U-dating results of this section together with a scan of stalagmite PR-PA-1. The age-depth-model was calculated using the StalAge algorithm (Scholz and Hoffmann, 2011). Two ages (marked red in Figure 3) were excluded from the age model for the early Holocene growth phase because they might constitute mixed ages due to the potential hiatuses at the beginning and end of this growth phase.
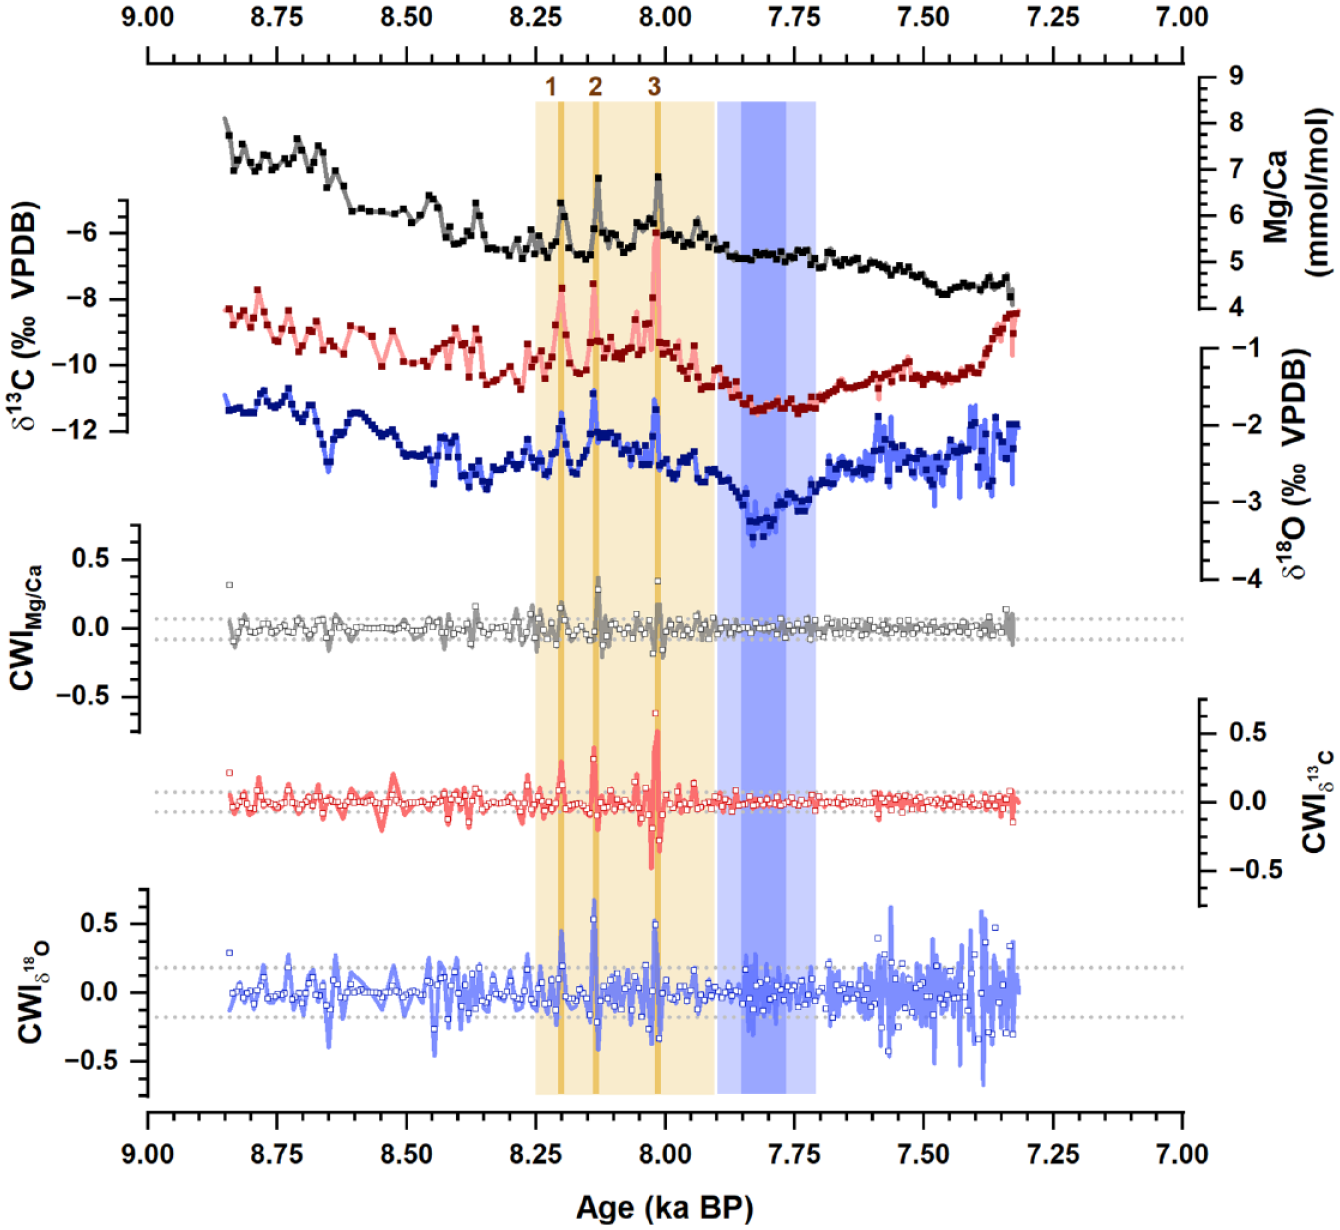
Top panels: Speleothem proxy results (Mg/Ca (dark gray, top), δ13C (red, middle), and δ18O (blue, bottom) values) and Climate Whiplash Index (CWI, bottom panels, colors and positions respectively) from the continuous growth phase of PR-PA-1 during the Holocene. Each proxy plot shows both the raw (lines) as well as the interpolated data (symbols) used for the CWI analysis. The highlighted area marks the period between 8.25 and 7.9 ka BP, which is related to the 8.2 ka event, during which three separate peaks are identified in each proxy record (marked by the vertical lines). The peaks are centered at 8.20, 8.14, and 8.02 ka BP. The dark blue highlighted area marks the pronounced negative excursion in δ18O values during the post-8.2ka event period (light blue vertical bar). Horizontal dashed lines are the 5% and 95% percentiles of each CWI.
Modern speleothem growth
The measured temperature in Palco cave at the location of PR-PA-1 is very constant with 26.4 ± 0.15 °C (Table S1) and thus likely reflects the mean annual temperature (MAT) at the cave site (Vieten et al., 2018a). It also agrees with the temperatures measured at the nearby Dos Bocas weather station. RH values are very close to 100% during summer and winter (Table S1). The cave atmosphere has slightly elevated pCO2 levels ranging from 790 to 1010 ppmV (Table S1). Both the hourly logging of drip rate of the slow drip as well as manual drip rate counting of the fast drip (Table S1) reveal a general decreasing trend between August 2015 and July 2016. The slow drip did not show a quick response to rain events (Figure S2). Thus, we assume that fracture flow is not a dominant feature of drip sites near the growth site of PR-PA-1, similarly to what is observed in Larga Cave, Puerto Rico (Vieten et al., 2018a, 2018b; Warken et al., 2022a). By assuming a drip volume of 0.23 ml/drip, we estimated the drip rate in L/sec (Collister and Mattey, 2008). This classifies both drips as dominated by seepage flow after Fairchild et al. (2006).
The analysis of drip water near the growth site of speleothem PR-PA-1 reveals a δ18O value of -2.34 ‰VSMOW, which is close to the mean monthly amount-weighted rainfall δ18O value of c. -2.5 ‰VSMOW measured at nearby Larga Cave (Figure 1c, Vieten et al., 2018a, 2018b). The tops of three actively growing stalagmites have δ18O values of −3.19, −3.24, and -3.30 ‰VPDB, respectively. Precipitation of speleothem calcite in Palco Cave occurs close to conditions of equilibrium isotope fractionation when using the fractionation factor derived from slowly growing calcite in Devil’s Hole, Nevada (Coplen, 2007) (which is within uncertainties identical to the updated equilibrium baseline defined by Daëron et al. (2019) as well as the theoretical prediction of Watkins et al. (2014). Here, the difference between measured and predicted calcite values is 0.1 ‰ or smaller (Table S2). In comparison, the modern Palco Cave calcite is more positive (+0.34 to +0.45‰) than the values predicted based on drip water δ18O values and the equation of Tremaine et al. (2011), which has been observed to be appropriate for many cave settings and recently also confirmed in cave analog experiments (Hansen et al., 2019).
Proxy results
Oxygen isotope values measured in PR-PA-1 range from −4.2 to −1.4 ‰VPDB, carbon isotope ratios range from −11.8 to 6.6 ‰VPDB, and Mg/Ca molar ratios range from 4.1·10-3 to 8.1·10-3 (Figure 3). Overall, all three proxies show a strong covarying pattern, supporting the interpretation as indicators of wet (low values) versus dry (high values) conditions, with regional speleothem δ18O values responding to the tropical amount effect (Figure 1c, Lachniet, 2009; Winter et al., 2011), and δ13C and Mg/Ca values responding to prior calcite precipitation (PCP) (Fairchild and Treble, 2009; Johnson et al., 2006; Warken et al., 2020). From 8.85 to 8.25 ka, all proxies show a decreasing, that is, wetting, trend. Between 8.25 and 7.9 ka BP, all proxies follow a rather or slightly increasing trend, interrupted by three pronounced peaks toward more positive values clearly separated in each proxy, indicating abrupt occurrences of aridity (Figure 3). According to the StalAge model, the absolute ages of the peaks are 8.20, 8.14, and 8.02 ka BP, respectively. Since the growth rate is relatively constant during this phase (Figure 2), it is possible to accurately estimate the temporal spacing between the peaks. The spacing is roughly 70 years between peak 1 and 2, and about 110 years between peak 2 and 3. The duration of the peaks in the proxy values is two decades at maximum. The youngest part of the record, from about 7.9 to about 7.3 ka, shows a slightly different relationship between Mg/Ca, δ13C and δ18O values. While the trace element ratios further decrease over the whole period, the stable isotope ratios first decrease and then increase again, reaching a minimum around 7.8 ka BP.
The strong non-stationarity observed in the isotope and trace element time series lowers the statistical confidence, the three identified peaks as exceptional and separated events. We thus use the CWI to transform the original time series into a stationary time series, where abrupt transitions between drying and wetting trends can be identified. Positive (negative) CWI values represent rapid shifts toward drying (wetting) in the proxy data (δ18O, δ13C and Mg/Ca), according to each proxy’s response to hydrological changes. Accordingly, Figure 3 shows the CWI calculated for each proxy time series. Extreme CWI values occur during the 8.2 ka event in all proxies, with especially positive peaks reflecting abrupt intense drying, and are coherently detected in δ18O and δ13C successively around 8.20 ± 0.17 ka (fluctuation 1), 8.14 ± 0.16 ka (fluctuation 2), and 8.02 ± 0.13 ka (fluctuation 3). Large CWI fluctuations corresponding to abrupt intense drying around these times are also detected in the Mg/Ca data. The peaks have different relative amplitudes in the different proxies, but the smallest peak CWIs is consistently identified at 8.20 ka, robustly indicating a less abrupt and intense hydrological change than during the previous events.
Discussion
Chronology
PR-PA-1 has a relatively low U-concentration, which makes precise dating challenging, particularly in the presence of significant detrital Th (Fensterer et al., 2010; Warken et al., 2020). As is the case for many Caribbean locations, speleothems from Palco Cave contain elevated initial Th contents (Rivera-Collazo et al., 2015; Warken et al., 2020). However, the “clean” age at 102.2 mm dft constrains the absolute age of the 8.2 ka event recorded in PR-PA-1 between 8.25 and 7.9 ka BP, with a dating error of ± 110 years. The StalAge algorithm propagates dating uncertainties, resulting in an average absolute uncertainty of the age model of PR-PA-1 of 172 ± 26 years. However, PR-PA-1 shows a remarkably constant growth rate, especially during the 8.2 ka event, supporting a clear stratigraphy and thus allowing for robust inferences on relative age differences for this section of the record, that is, on the substructure of the 8.2 ka event in Puerto Rico.
Proxy interpretation
The covarying multi-proxy data confirm that PR-PA-1 δ18O, δ13C, and Mg/Ca values are dominated by hydrological changes. This is especially the case during the period covering the 8.2 ka event. This interpretation agrees with the common argument that speleothem δ18O values in Central America and the Caribbean region including Puerto Rico, respond to the tropical amount effect (e.g. Lachniet, 2009; Warken et al., 2020; Winter et al., 2020). However, the simplification that tropical speleothem δ18O records evolve solely from varying at-a-site rainfall amounts might not always be appropriate because the drip water δ18O values are influenced by several processes including recharge and mixing above the cave, flow paths, seasonal carbonate precipitation, temperature inside the cave, changes in rain water source and upstream evolution history of water vapor, relative humidity below the cloud, cloud height and water condensation processes inside the cloud (e.g. Lases-Hernandez et al., 2019; Priestley et al., 2023; Risi et al., 2008; Scholl and Murphy, 2014; Treble et al., 2022; Vieten et al., 2018b). HYSPLIT backward trajectory frequency analysis confirms that the source of Puerto Rican rainfall is predominantly the proximal tropical Atlantic surface waters (Figure S1, Stein et al. (2016). Hence, in agreement with Scholl and Murphy (2014), we regard an influence from changing transport pathways on precipitation δ18O values as of minor importance.
Still, solely relying on δ18O values as a paleo-climate proxy can be problematic because speleothems may precipitate out of isotopic equilibrium and the degree of disequilibrium might vary over time (Daëron et al., 2019; Deininger et al., 2012; Dreybrodt and Scholz, 2011; Guo and Zhou, 2019; Hansen et al., 2013; Mickler et al., 2006; Mühlinghaus et al., 2009; Skiba and Fohlmeister, 2023). Our cave monitoring observations indicate that present-day carbonate precipitation occurs close to commonly observed cave oxygen isotope fractionation (Coplen, 2007; Daëron et al., 2019).
The covariation of δ13C and Mg/Ca values suggests that these proxies respond to local hydrological changes as observed in other cave systems including Puerto Rico (Fairchild and Treble, 2009; Johnson et al., 2006; Ridley et al., 2015; Warken et al., 2020, 2021). Prior calcite precipitation (PCP) occurs when CO2 degasses from seepage water prior to the drip, which may trigger calcite precipitation before the water reaches the speleothem top. This process, which is typically enhanced during drier periods, results in an increase in the Mg/Ca and δ13C values of the solution, and, subsequently, the speleothem (Fairchild et al., 2000; Johnson et al., 2006). Drier periods in Puerto Rico would be associated with a reduced contribution of the convective summer rainfall to the drip water reservoir, which would shift the annual mean δ18O value of the infiltrating water toward higher values. At the same time, reduced recharge leads to longer residence times and enhanced PCP, which further increases both stable isotopic and element/Ca ratios (Dreybrodt and Scholz, 2011; Mattey et al., 2010; Sinclair, 2011; Warken et al., 2020). Hence, in a setting like Palco Cave, site-specific hydrological effects and PCP are expected to accompany or even exacerbate the tropical amount effect on rainfall δ18O values. Further, the δ13C values of vegetation in wet tropical environments, such as at our cave site, also covary positively with wetness, with drier conditions associated with higher vegetation δ13C values (Leffler and Enquist, 2002). As such, we consider the combination of δ18O, δ13C, and Mg/Ca values as a multi-proxy record of past changes in rainfall amount (Cruz et al., 2007; Sinclair et al., 2012; Warken et al., 2019).
Sub-structure of the 8.2 ka event in stalagmite PR-PA-1
PR-PA-1 documents Caribbean rainfall variations during the period covering the 8.2 ka event. Between 8.25 and 7.9 ka BP, a sequence of three abrupt dry climate events occurred, which are centered around 8.20, 8.14, and 8.02 ka BP. This sequence of three abrupt and intermittent fluctuations within the 8.2 ka event indicates short-lived dry events over the north-eastern Caribbean. The observation further supports other studies suggesting that the 8.2 ka event was a sequence of events rather than one single incident (de Wet et al., 2021; Duan et al., 2023; Medina et al., 2023; Oster et al., 2017). Interestingly, high δ18O values of our record occurred prior to the 8.2 ka event, suggesting that the response of rainfall at least in Puerto Rico (if not further afield), to the 8.2 ka event was better characterized by enhanced variability occurring during the transitional deglacial period rather than a change in mean climate state.
The CWI analysis (Figure 3) confirms that especially events 2 and 3 consisted of very abrupt drying fluctuations in the Caribbean. The drying appears to have occurred within a decade, or even less, similar in duration to indications from other records (e.g. Cheng et al., 2009; de Wet et al., 2021; Duan et al., 2023; Peros et al., 2017). The fluctuations are short-lived, lasting between 10 and 20 years, where the third event appears to be the weakest and longest in duration (Figure 3). Within uncertainty, the fluctuations occur synchronously with fluctuations recorded in other archives of the 8.2 ka event, including the ITCZ-sensitive speleothem record from Venezuela (Figure 4h, Medina et al., 2023), but also the South Asian Monsoon System (SAMS) recorded in a speleothem reconstruction from Brazil (Figure 4i, Cheng et al., 2009). In the PR-PA-1 record, the temporal spacing between fluctuations 1 and 2 is about 65 years, while it is about 120 years between fluctuations 2 and 3. Our finding of three excursions toward drier conditions during the 8.2 ka event agrees with a previous regional report from Cuba (Figure 4d, Peros et al., 2017), suggesting that atmospheric drying was the likely cause for the observed geochemical variations in both records.
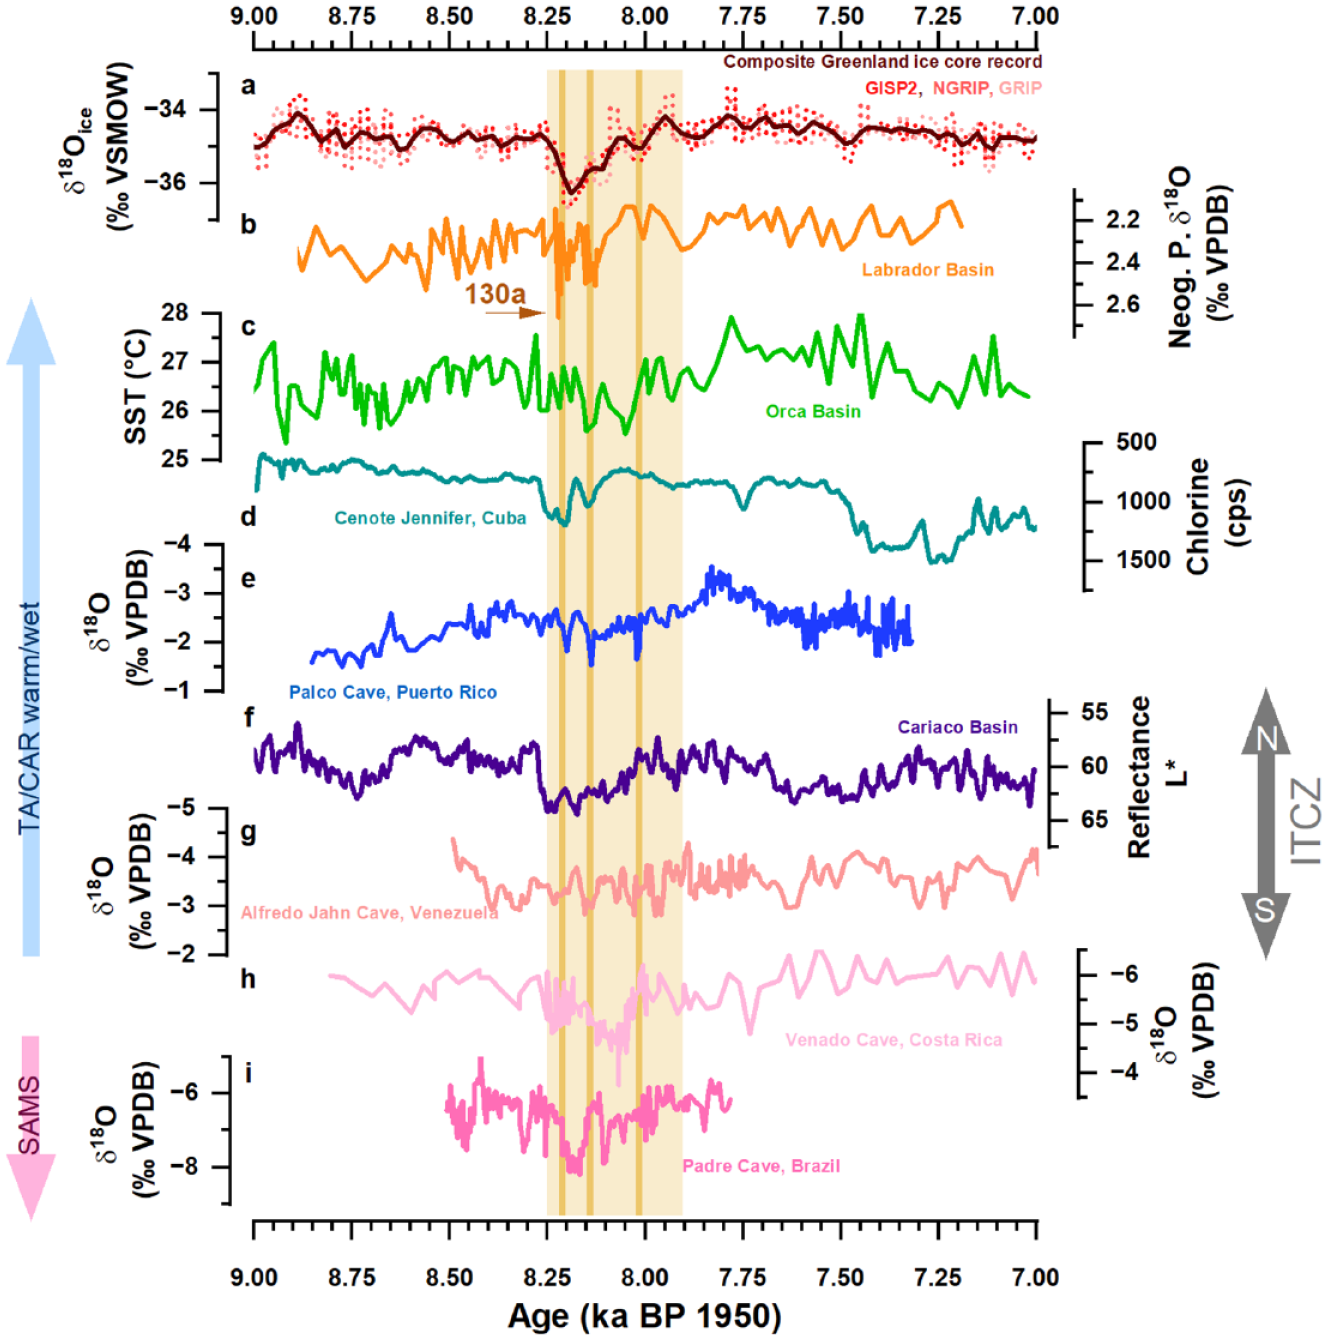
Comparison of speleothem proxies and climate records around the North Atlantic basin and the Caribbean. Records are plotted from north (top) to south (bottom). (a) Composite Greenland ice core δ18O values from GISP2, NGRIP, and GRIP records on GICC05modelext timescale (Rasmussen et al., 2014; Seierstad et al., 2014. (b) Neogloboquadrina pachyderma sinistral coiling δ18O values from the Labrador Basin (Kleiven et al., 2008). Note that the original radiocarbon-based chronology is shifted by 130 years, which is well within the observed variability of local reservoir ages in the Labrador Sea during this time interval (Lochte et al., 2019; McNeely et al., 2006. (c) Sea surface temperature (SST) from Orca Basin in the Gulf of Mexico (LoDico et al., 2006). (d) Chlorine counts from Cenote Jennifer, Cuba (Peros et al., 2017). (e) Speleothem δ18O values from Palco Cave, Puerto Rico (this study). (f) Reflectance L* from the Cariaco Basin (Deplazes et al., 2013). Note that the radiocarbon-based chronology is shifted by 80 years within reservoir age uncertainties. (g) Speleothem δ18O values from Alfredo Jahn Cave, Venezuela (Medina et al., 2023). (h) Speleothem δ18O values from Venado Cave, Costa Rica (Lachniet et al., 2004). (i) speleothem δ18O values from Padre Cave, Brazil as a record of the South American Monsoon system (SAMS) (Cheng et al., 2009). Orange vertical bars highlight the three abrupt fluctuations identified in PR-PA-1. Locations of proxy records are shown in Figure 1.
In Cuba, radiocarbon dating of sediments recovered from a cenote suggest an estimated duration of the 8.2 ka event of about 155 years, and the first two drying episodes appear to occur with less time separating them than the two previous events. Similar to our results, data from Peros et al. (2017) indicate that the first two events were larger in magnitude than the last event (Figure 4d). Differences may be due to varying expressions of climate perturbations at each location or a result of changing proxy sensitivities.
Model studies show that latitudinal ITCZ changes can lead to strongly heterogeneous zonal hydroclimate responses (McGee et al., 2014; Singarayer et al., 2017). Combining our record with the recent Cuban cenote sediment record (Peros et al., 2017), suggests that the wider Caribbean response to the 8.2 ka event was likely similar across the region in terms of enhanced climate variability on multidecadal to centennial time scales scale, with differences in the local expression in terms of length and intensity of the drying events. In particular the northern Caribbean seems to be especially sensitive to zonal ITCZ shifts. We hypothesize that this is due to the location at the northern edge of ITCZ influence region, where zonal shifts are usually linked to rainfall changes. A more southerly ITCZ will drive the Hadley cell further south, allowing an expansion of the subtropical high (Lechleitner et al., 2017) possibly leading to less rainfall over the northern Caribbean. The overall good covariation of the PR-PA-1 data with the Cariaco Basin reflectance record (Figure 4f) further supports interpretation that our record is related to movements in the meridional position of the ITCZ. This agrees with the general understanding that hemispheric temperature gradients shift the mean ITCZ position toward the warmer hemisphere and confirm freshwater hosing model experiments that postulate dry conditions over the tropical Atlantic (McGee et al., 2014). It appears that the region of decreased rainfall extends further north than predicted by recent climate models (see comparison in McGee et al., 2014). North of the Caribbean, in Florida and Texas, rainfall amounts appear to be higher during the 8.2 ka event (Ellwood and Gose, 2006; Grimm et al., 2006). This could be related to increased occurrence of cold fronts during the 8.2 ka event over these regions or a reorganization of the general atmospheric circulation during the glacial retreat (Dean et al., 2002).
Regional response and forcing processes of the 8.2 ka event
Further evidence of a sequence of several sub-events of the 8.2 ka event comes from the Cariaco basin as well as a Venezuelan speleothem record, where rainfall-sensitive proxy records suggest a number of rapid dry/wet fluctuations over northern South America (Figure 4f and g, Hughen et al., 1996b; Deplazes et al., 2013; Medina et al., 2023). In contrast, other Caribbean records show only one single drying event such as, for example, Venado Cave (Costa Rica, Figure 4h, (Lachniet et al., 2004)) but also records from Cuba or Central America (Fensterer et al., 2013; Hillesheim et al., 2005; Hodell et al., 1995), or none at all, as in the speleothem δ18O records from eastern Guatemala (Winter et al., 2020) or north-eastern Mexico (Wright et al., 2023). Again, this might be due to different regional responses or low archive resolution. LoDico et al. (2006) identify a broad event of freshwater input, which appears to precede the 8.2 ka event in the Orca Basin. The SST reconstruction from the same core indicates colder SSTs co-occurring with the dry fluctuations reconstructed in PR-PA-1, followed by warmer SSTs (Figure 4c, LoDico et al. (2006). In the North Atlantic, planktonic foraminifera recorded at least two stages of cold fresh water during the 8.2 ka event (Kleiven et al., 2008), as well as a subsequent smaller event. These freshwater intrusions align remarkably well with the recorded dry events in Puerto Rico within reservoir age and dating uncertainties (Figure 4b). In addition, more recent North Atlantic sediment studies reveal rapid repeated fresh water bursts into the North Atlantic (Lewis et al., 2012; Roy et al., 2011). Further evidence supporting the occurrence of multiple freshwater-forcing stages comes from model experiments, which were not able to reproduce the duration of a continuous 8.2 ka event with one freshwater hosing (Wiersma et al., 2006). Catastrophic freshwater forcing drastically cooled the North Atlantic region via temporary AMOC slowdown or halt, and causing hydrological changes over the tropical Atlantic (Bitz et al., 2007; Cheng et al., 2009; Lachniet et al., 2004; Peros et al., 2017; Wiersma and Renssen, 2006). Both proxy reconstructions and model studies have shown that northern hemispheric cooling is linked to a southward shift of the ITCZ on different timescales, supporting the interpretation of the observed shifts in precipitation patterns in Puerto Rico (e.g. Broccoli et al., 2006; Lechleitner et al., 2017; Winter et al., 2011).
Prior to the 8.2 ka event, the PR-PA-1 multi-proxy record indicates a continuous wetting trend in agreement with the ongoing deglaciation (Winter et al., 2020). After the 8.2 ka event, the different proxy evolutions diverge more noticeably (Figure 3). Mg/Ca might be dominantly influenced by PCP, indicating a continuation of the warming/wetting trend before the 8.2 ka event. The δ18O record and to some degree the δ13C record show a different feature: a decrease toward the most negative values of PR-PA-1 after the 8.2 ka event, lasting for about 100 years. According to the proxy interpretation, this could be related to a combination of changes in hydrology and temperature. Cross equatorial heat transport seems to be a key parameter controlling zonal ITCZ changes (Lechleitner et al., 2017; Moreno-Chamarro et al., 2020). In the tropical Atlantic, warm surface waters cross the equator as part of the AMOC, and heat up the Caribbean, Gulf of Mexico, and regions downstream via the Gulf Stream. Present understanding indicates that this cross-equatorial heat flow is an important contributor to the meridional position of the ITCZ (Frierson et al., 2013; Moreno-Chamarro et al., 2020). A weakened cross-equatorial heat flow during the 8.2 ka event possibly warmed the southern tropical Atlantic (Wiersma et al., 2011), causing a more southern ITCZ position and anomalously high rainfall amounts in parts of South America (Cheng et al., 2009; Hughen et al., 1996b). It is conceivable that, once the AMOC regained strength again, this anomalously warm water was transported over the equator into the tropical Atlantic, warming the Caribbean Sea, and the northern tropical Atlantic, resulting in warm surface waters in the region. The short-lived SST warming recorded in the Orca Basin (Figure 4c) may support this hypothesis. In addition, there is some evidence that the AMOC might even have overshot its pre-8.2 ka strength (Ellison et al., 2006).
An additional factor adding to the negative post-8.2 ka excursion of δ18O values could be partially related to an atmospheric temperature increase, raising cave temperature as well. A post-8.2 ka warming has been predicted by model results (Renold et al., 2010; Wiersma et al., 2011) and also observed as an isotopic overshoot in Central European paleoclimate δ18O records (Andersen et al., 2017; Boch et al., 2009) as well as in Greenland ice core δ18O and δ14N data (Kobashi et al., 2007; Rasmussen et al., 2007; Seierstad et al., 2014; Thomas et al., 2007). Assuming no change in rainfall amount nor the δ18O of precipitation, the 0.8 ‰ more negative PR-PA-1 speleothem δ18O values would represent a cave temperature increase of about 4°C (Coplen, 2007; Tremaine et al., 2011). Such a large amount of local warming appears unlikely, and we conclude rainfall amounts reached at least pre-event values. In summary, conditions were likely both warmer and wetter, as shown by the Mg/Ca record, and detected for more recent times in the region, where warmer conditions are linked to more rainfall in the region (e.g. Warken et al., 2022b; Winter et al., 2011).
It is notable, that this “post-8.2 ka-event” is particularly pronounced in Palco Cave, but less expressed in the other regional records. While SSTs in the Orca basin show some warming around this time (Figure 4c), hydroclimate reconstructions from Cariaco Basin or Alfredo Jahn Cave (Figure 4g and h) show only slightly wetter and warmer conditions. We hypothesize that the location close to the moisture source of the tropical Atlantic Ocean makes Puerto Rican rainfall particularly sensitive to combined changes in ocean circulation and atmospheric warming in this region.
The new multi-proxy record obtained from PR-PA-1 strengthens the evidence for a close and rapid teleconnection between freshwater forcing, North Atlantic temperatures, and hydrological changes in equatorial regions via AMOC variations (Medina et al., 2023; Moreno-Chamarro et al., 2020; Warken et al., 2020). Even though some studies suggested a weakening of the modern AMOC, there is overall still low confidence in reconstructed and modeled AMOC changes because of their low agreement in quantitative trends for the 20th century (Fox-Kemper et al., 2021; Rahmstorf et al., 2015; Smeed et al., 2014). However, all socio-economic scenarios indicate that it is very likely that the AMOC will decline over the 21st century (Fox-Kemper et al., 2021), and recent work found that the estimated meltwater flux from the Greenland Ice Sheet in the not-too-distant future may be comparable to the fluxes found as the forcing behind the 8.2 ka event (Aguiar et al., 2021). This will possibly cause widespread changes in the precipitation patterns in the tropical Atlantic region (Moreno-Chamarro et al., 2020). Puerto Rico has experienced recurring droughts in the 20th century (Larsen, 2000). More recently, in 2015, an exceptional drought impacted most of Puerto Rico (Mote et al., 2017). Our results demonstrate that abrupt sub-decadal climate fluctuations in the western tropical Atlantic region, such as the current ones, also occurred in the remote past, in concomitance with drastic oceanic changes.
Conclusions
The large similarity of the PR-PA-1 δ18O, δ13C, and Mg/Ca records, especially during the 8.2 ka event, reveals a dominant control of hydrological changes on these proxies, where decreased rainfall amounts appear to be related to higher δ18O values and simultaneously less surface water recharge allowing increased amounts of PCP as recorded in δ13C and Mg/Ca. Stalagmite PR-PA-1 grew before, during and after the 8.2 ka event allowing insights into environmental changes on sub-decadal timescales. The CWI reveals that the 8.2 ka time period (8.20–8.00 ka BP) is the most unstable period between 8.85 and 7.32 ka, where a long-term wetting trend is interrupted by a sequence of events each characterized by years of abrupt drying closely followed by years of abrupt wetting toward pre-fluctuation conditions. Three dry climate fluctuations are identified in each proxy, occurring around 8.20, 8.14, and 8.02 ka BP, and are followed by a possibly wetter and/or warmer “overshooting” period. A so far unknown feature of the 8.2 ka event appears to be a warmer and wetter post event in the Caribbean. We conclude that the 8.2 ka event caused rapid climate fluctuations in the north-eastern Caribbean, which appear to be linked to a fast coupling between interacting oceanic and atmospheric processes.
Supplemental Material
sj-pdf-1-hol-10.1177_09596836231211874 – Supplemental material for A sequence of abrupt climatic fluctuations in the north-eastern Caribbean related to the 8.2 ka event
Supplemental material, sj-pdf-1-hol-10.1177_09596836231211874 for A sequence of abrupt climatic fluctuations in the north-eastern Caribbean related to the 8.2 ka event by Rolf Vieten, Sophie F Warken, Amos W Lachniet in The Holocene
Supplemental Material
sj-xlsx-1-hol-10.1177_09596836231211874 – Supplemental material for A sequence of abrupt climatic fluctuations in the north-eastern Caribbean related to the 8.2 ka event
Supplemental material, sj-xlsx-1-hol-10.1177_09596836231211874 for A sequence of abrupt climatic fluctuations in the north-eastern Caribbean related to the 8.2 ka event by Rolf Vieten, Sophie F Warken, Amos Winter, Denis Scholz, Davide Zanchettin, David Black and Matthew Lachniet in The Holocene
Footnotes
Acknowledgements
The field work of Thomas Miller collecting the speleothem is highly appreciated. We thank the University of Puerto Rico Mayaguez (UPRM) for supporting the project over years. We thank Klaus P. Jochum, Augusto Mangini, Sylvia Riechelmann, Adrian Immenhauser, and Norbert Frank for technical and analytical assistance and valuable discussions. The authors address special thanks to José A. Santiago, Abe J. Seguí, Yelitsa Gonzalez, Wilson Ramirez, and Ernesto Otero for their service in the labs. We further appreciate the help in the field from Kathleen Wendt, Juan Estrella Martínez, Sarymar Barreto Saavedra, Jose A. Santiago-Saez and Flora Sperberg.
Data availability
The data presented in this paper is available in the supplementary material.
Funding
The author(s) disclosed receipt of the following financial support for the research, authorship, and/or publication of this article: This research was supported by grant AGS 1003502 from the National Science Foundation. The first author would like to thank the International Association of Sedimentologists for supporting his presentation at the European Geoscience Union. DS acknowledges funding of the German Research Foundation (DFG SCHO 1274/9-1 and SCHO 1274/11-1). Isotope analyses at UNLV were supported by NSF grant EAR-0521196. SW is thankful for support from the Olympia Morata program of Heidelberg University.
Supplemental material
Supplemental material for this article is available online.
References
Supplementary Material
Please find the following supplemental material available below.
For Open Access articles published under a Creative Commons License, all supplemental material carries the same license as the article it is associated with.
For non-Open Access articles published, all supplemental material carries a non-exclusive license, and permission requests for re-use of supplemental material or any part of supplemental material shall be sent directly to the copyright owner as specified in the copyright notice associated with the article.