Recent studies have raised concerns regarding the reconstruction of glacier mass balance using tree-ring data. The method relies on a stable relationship between both variables and summer (June–August) or melt season (May–September) temperature. However, with recent anthropogenic climate change the stability of this relationship is challenged by both, a divergence between tree-ring and temperature, as well as mass balance and temperature data. Establishing to what extent this divergence influences the reconstruction of mass balance using tree-ring data is important to assess the future viability and applicability of the method. In this paper we analyze the relationship between the Torneträsk tree-ring and Storglaciären mass balance records, their response to climate change, and investigate changes in the relationship. We provide evidence for a sensitivity loss in the Torneträsk record and quantify its impact on the reconstruction of summer mass balance of Storglaciären. We find that by including years post 1980, the amplitude of reconstructed variability is reduced, but it remains possible to explain the variance of the record significantly. Our results suggest that for glaciers without an extensive mass balance record the applicability of the method is challenged.
Long-term mass balance measurements provide insight into past responses of glaciers to climatic changes and can thereby help to assess the future impact of increasing temperatures on glacier mass loss. To date, the longest continuous mass balance record of annual measurements is the one of Storglaciären in northern Sweden, dating back to 1946 (e.g. Holmlund and Jansson, 2002). The glacier’s net balance is comprised of in-situ measurements of accumulation and ablation, of which the latter is mainly determined by summer temperature (Holmlund et al., 2005), here defined as the mean June to August temperature. The linear relationship between the summer mass balance and mean summer air temperature allows for the reconstruction of using temperature records (Karlén, 1984).
While historical meteorological records provide important information on previous climatic conditions, they rarely date back further than 1850 CE and are sparsely distributed over the globe (Peterson and Vose, 1997). Attempts to reconstruct temperatures further back in time therefore rely on valuable incremental proxies such as tree rings, ice cores or varves, which reflect climatic conditions with high temporal resolution. In recent decades, especially tree rings have attracted scientific interest for the reconstruction of past climates (e.g. Briffa, 1999; Zaw et al., 2020). Different tree-growth indices, namely tree ring width (TRW) or maximum latewood density (MXD) have been used in multiple instances to reconstruct temperatures, for example for Scandinavia (Grudd, 2008; Gunnarson et al., 2011; Linderholm et al., 2015; Svarva et al., 2018) and the entire northern hemisphere (Anchukaitis et al., 2017; Esper et al., 2018; Wilson et al., 2016). Especially MXD records enable accurate reconstructions of temperature, as its correlation with temperature during the growing season (June to August) exceeds that of TRW (Esper et al., 2015; Grudd, 2008). In Fennoscandia, the extensive set of MXD measurements from the Torneträsk area provides the base for one of the main temperature reconstructions of the region (Grudd, 2008, Figure 1).
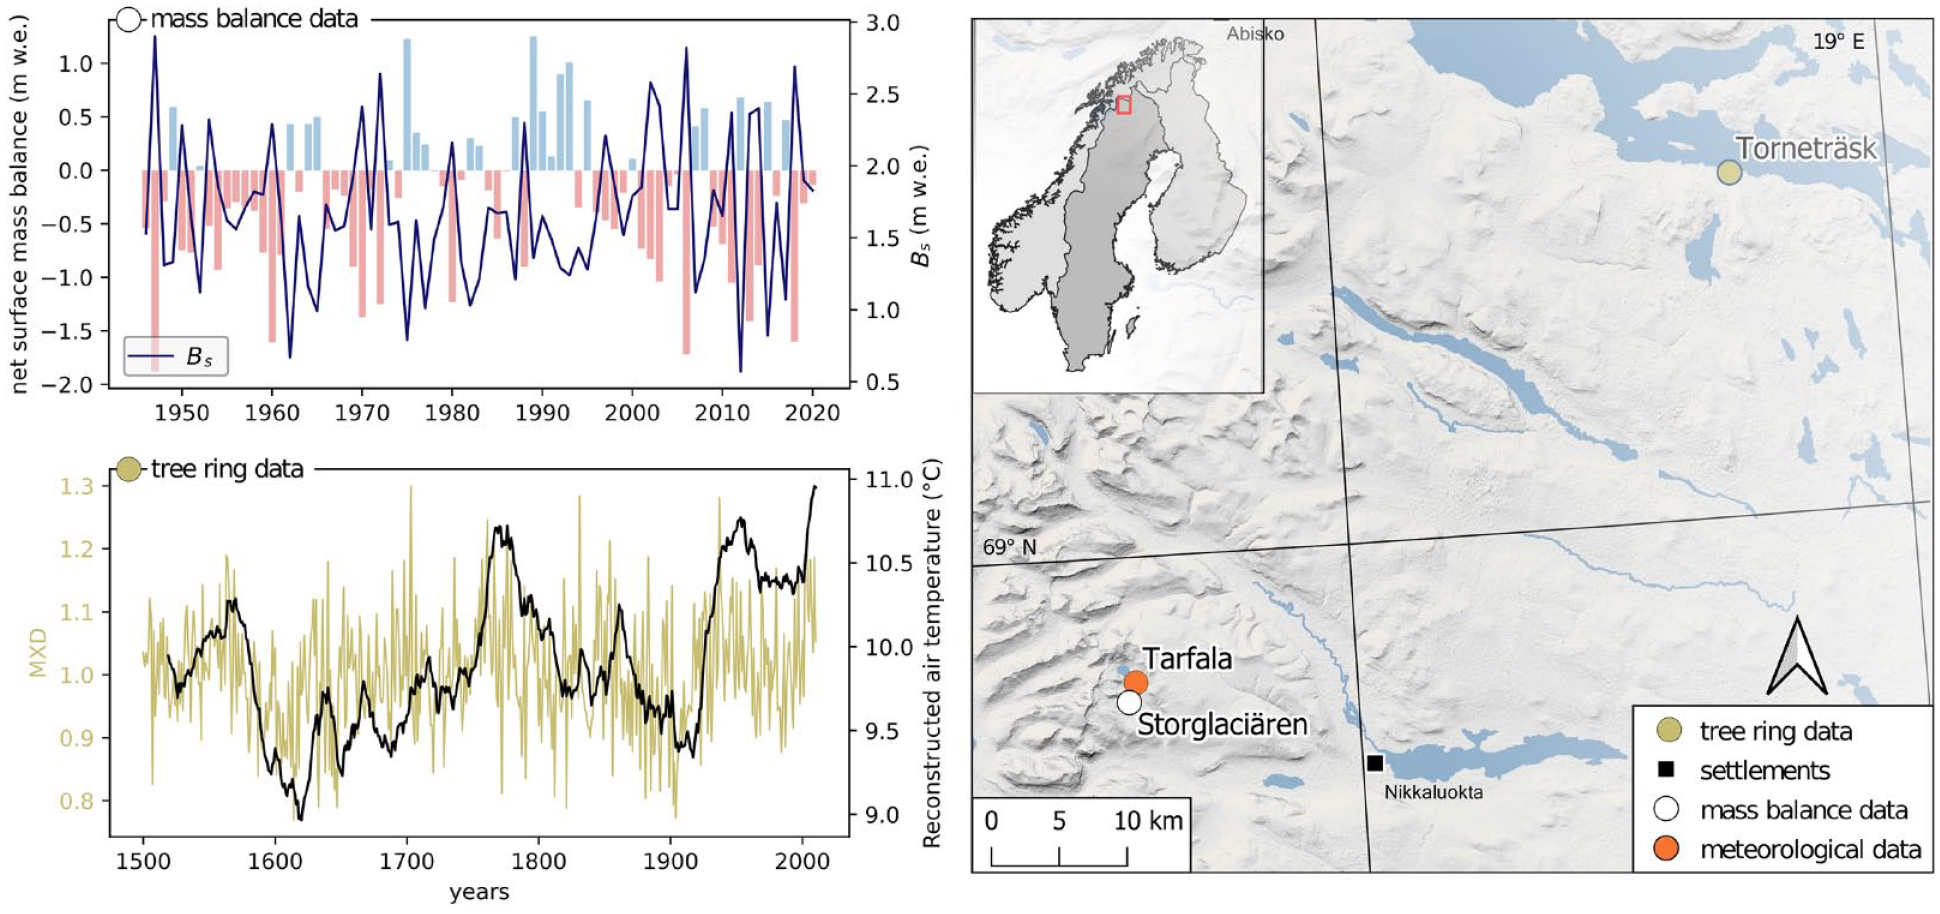
Map of the study area in the northern Scandinavian Mountain Range. Displayed on the left are Storglaciären’s mass balance record and the Torneträsk chronology with temperature reconstruction by Grudd (2008). All data for the base map is provided by Lantmäteriet.
The reason for the sensitivity loss of MXD is still debated. Schweingruber (1988) noted that both MXD and TRW are subject to physiological limitations at certain temperature thresholds that vary between tree species and may play a role in the divergence. Additionally, along with climate in general, insect and moisture stress induced by recent warming trends, as well as increases of carbon dioxide, nitrogenous compounds or ultra violet radiation, and the timing of snow melt (Briffa et al., 1998b; Taubes, 1995; Vaganov et al., 1999) may all influence the pattern of divergence. Unfortunately, this divergence might impair the reconstruction of previous climate variations (Loehle, 2009) and accordingly also that of It is therefore important to reassess the existence and magnitude of a similar loss in MXD temperature-sensitivity in Fennoscandia and to quantify its possible impact on mass balance reconstructions of Storglaciären.
In this study we update the existing reconstructions of Storglaciären (Linderholm et al., 2007; Linderholm and Jansson, 2007) by introducing additional measurements of MXD and for the period 1980–2010 into the analysis. We further reassess the applicability of the method in the face of a decrease in the strength of the MXD– relationship in the Torneträsk chronology and quantify its impact on reconstructions of of Storglaciären.
Study Area
Located approximately 150 km north of the Arctic Cirlce in the Kebnekaise massif, northern Sweden, Storglaciären terminates in the Tarfala Valley (Figure 1). The regional climate of the area is influenced by the North Atlantic Oscillation and due to the rainshadow of the Scandinavian Mountain Range in the West is more continental than the climate on the western side of the mountain range (Chen and Hellström, 1999). However, the relative proximity to the coast is still reflected in a milder climate than shown for other locations at this latitude (Linderholm et al., 2007).
With the long continuous mass balance record of Storglaciären dating back to 1946 and the meteorogical measurements from the Tarfala Research Station, the Tarfala valley provides an ideal study area. Storglaciären’s mass balance (Figure 1) is known to be well correlated with other glaciers from the Tarfala Mass Balance Program and can therefore be seen as representative of the wider area (Linderholm et al., 2007), even though this relationship might have decreased in recent years (Brugger, 2007).
Data and methods
Mass balance data
With over 70 years of data, the record of mass balance measurements at Storglaciären (Figure 1) is to date the longest continuous record of distributed mass balance measurements in the world (measurements are described in detail in Holmlund and Jansson, 1999). Its net balance is determined by separate consistent measurements of summer and winter balance at the beginning and end of each melt season (May to September). However, with MXD being determined mainly by summer temperatures, we focus on expressed in meters of water equivalent (m w.e.). The record is compiled from measurements at multiple locations throughout the glacier. Values in the observed (1946–2010, obtained from the Bolin Centre database) range from 0.67 to 2.90 m w.e. (mean: 1.67 m w.e.).
Tree-ring and meteorological data
The Torneträsk MXD chronology is one of the longest continuous MXD records in the world, covering the period from 441 CE to 2010 CE (Grudd, 2008; Schweingruber et al., 1988). The sampling site is located at Lake Torneträsk, approximately 60 km northeast of Storglaciären (Figure 1). We utilize the time period from CE 1500–2010 for the reconstruction. Until 1980, the chronology is comprised of MXD series from 65 living and fossil specimens of scots pine (Pinus sylvestris), of which fossil trees represent the period of 441–1400 CE supported by living trees from 1400 onward. For the period 1980–2010 more than 35 additional series from living trees extend the record to its full length (Briffa et al., 1990; Grudd, 2008).
To use summer temperature as the main denominator between tree growth and glacier mass balance, we obtained temperature measurements from Tarfala Research Station for 1946–2010 from the Bolin Centre database. Mean monthly values are available for the summer season (JJA) only since 1964, and for all months since 1965, when automated data collection was first established at the station. With the Torneträsk record being significantly correlated with climate data from the entire Fennoscandian North, there is no conflict in connecting Torneträsk tree growth to summer temperatures in the Tarfala Valley (Briffa et al., 1992; Gouirand et al., 2008; Grudd, 2008). We thus utilize the MXD record, standardized using signal-free regional curve standardization to preserve low frequency variability in the data, to attempt an updated reconstruction.
Regression analysis and mass balance reconstruction
To assess the impact of the impaired relationship between MXD and on mass balance reconstructions of Storglaciären, we examined temporal changes in the relationship of both MXD and with temperature. In this context we correlated the Torneträsk MXD chronology and Storglaciären’s separately with monthly mean temperatures from Tarfala Research Station for the period 1946–2010. Additionally, seasonal means for the summer (June-August) and melt (May-September) season ( and respectively) were included in the analysis. A Spearman’s rank correlation coefficient was used to identify the month or season when both MXD and show the strongest correlation with temperature. We accounted for the possibility of a lagged response of MXD and to temperature changes by introducing time lags of up to 20 years into the correlations analysis. Subsequently, the variable with the highest correlation with MXD was used as the predictor in separate least-square linear regression models with and MXD as response variables in order to quantify the explanatory power of temperature over both response variables, respectively. To account for temporal variations, the linear regression models were set up using a 30-year moving-window approach with annual steps. In doing so, changes in the relationship of temperature with both variables over time can be investigated by deriving the coefficient of determination for each 30-year window. We used bootstrapping, a commonly used resampling method to derive estimates of confidence intervals by random sampling with replacement from a dataset to obtain confidence intervals for each 30-year window. Because of seasonal variability in the time series data, a block bootstrapping approach with a random sample size of 2000 was favored over normal bootstrapping. In this approach, samples are drawn with replacement from a set of independent blocks with a length generated from a geometric distribution (Berkowitz and Kilian, 2000). Based on the fact that each window’s model shows significance and to stay consistent with previous reconstructions attempts of glacier mass balance of Storglaciären (Linderholm et al., 2007; Linderholm and Jansson, 2007), we used a simple linear regression model to predict based on MXD. The reconstruction was validated by testing whether the reconstructed distribution is significantly different from the measured using a non-parametric Mann-Whitney test (e.g. Birnbaum, 1956). Furthermore, the accuracy of the reconstruction was evaluated by calculating the root mean square error (RMSE). The time series were split into the periods 1946–1980, 1981–2010 and the entire record from 1946 to 2010 to investigate the change in sensitivity of the relationship between the variables due to changes in climate since the 2007 reconstructions (Linderholm et al., 2007; Linderholm and Jansson, 2007).
Results
Monthly mean temperatures for July and August, as well as the seasonal mean for the summer and melt season correlate significantly with both MXD and for all investigated time periods (1946–1980, 1981–2010, and 1946–2010). No significant correlation with either MXD or was found for the individual mean temperatures of May and September. The highest correlation with both parameters for all seasons (except for the 1981–2010 record where it is ) was found with . While and MXD show very strong correlations for 1946–1980 ( and respectively), the coefficients over the later period (1981–2010) are notably lower ( and respectively). Note the decrease of 0.2 for MXD.
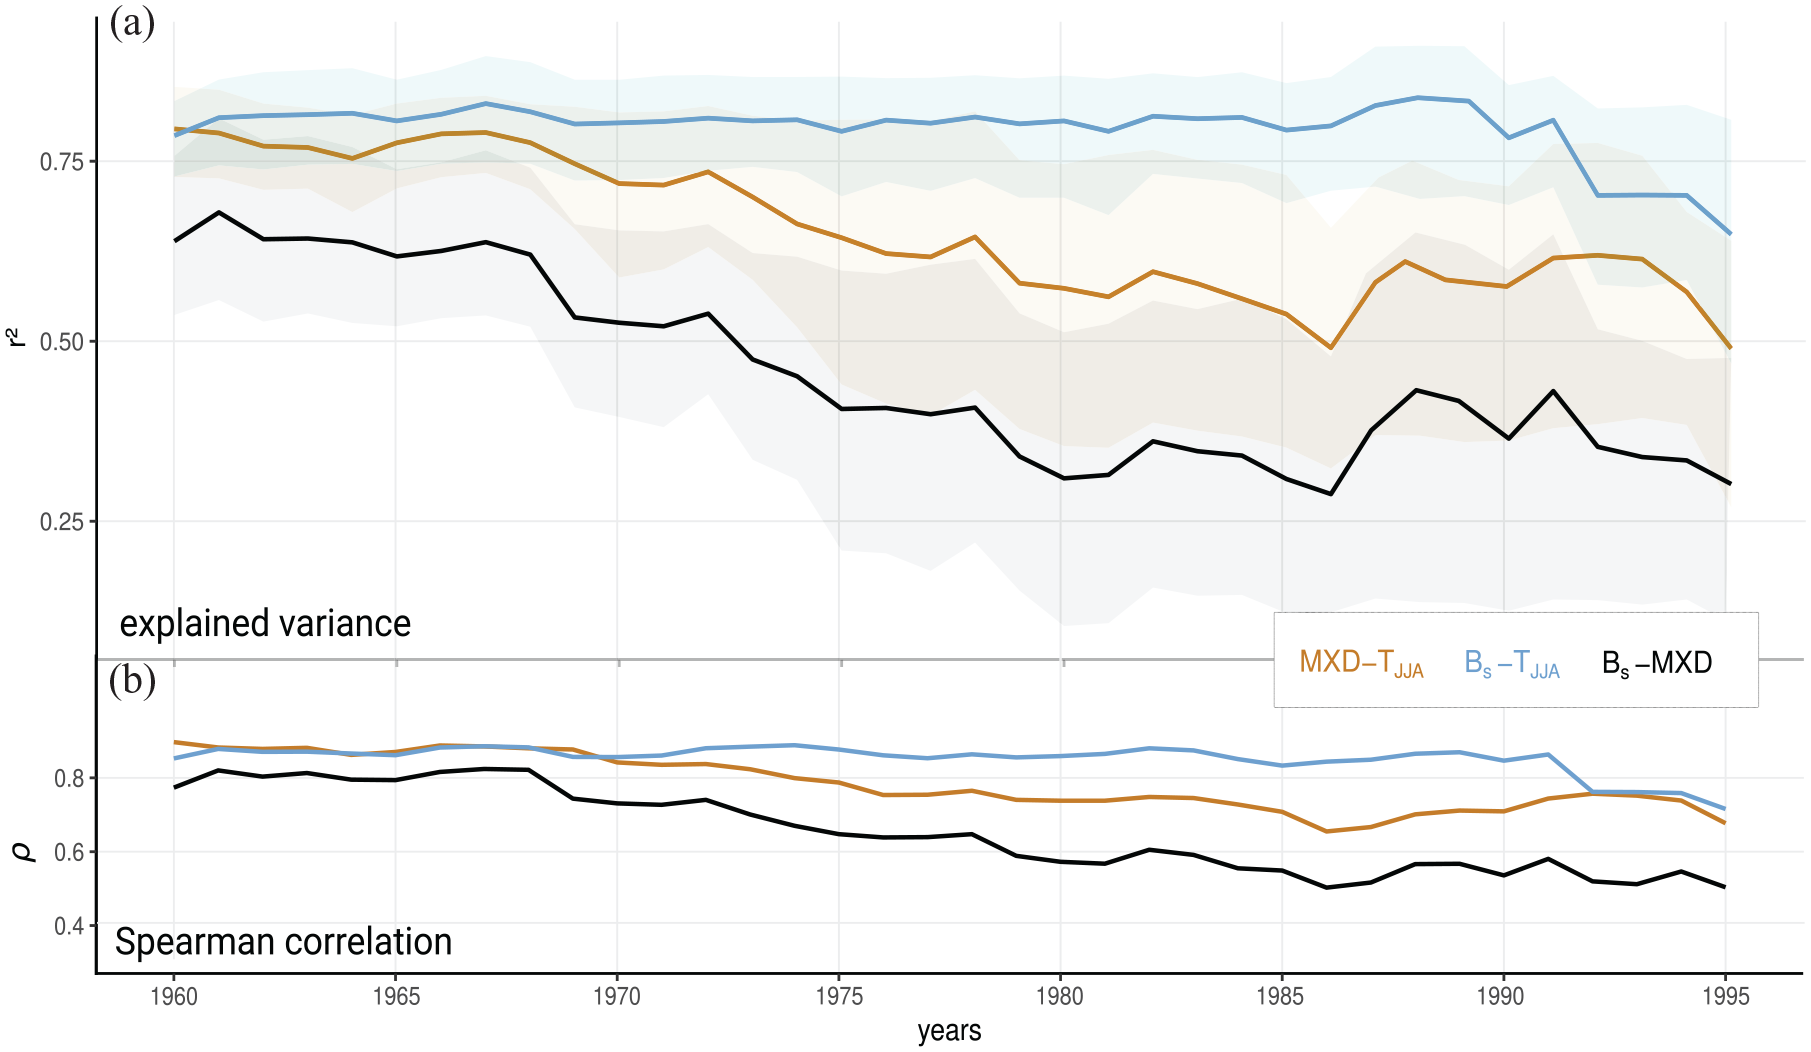
The decrease in the strength of the relationship of the two parameters is evident in the of the linear regression models (Figure 2). The necessity of introducing a time lag into the regression analysis was discarded, since we found no significant lagged response of the variables to temperature changes. While summer temperature is able to explain in a stationary fashion until the 1988 window, the temperature sensitivity of the MXD follows a downward trend over the entire time period. However, even with the identified decrease in the correlation over time, is able to explain MXD with an of 0.64.
(a) Centered 30-year moving-window for each time step (step ) for the linear regression between and MXD, and and MXD and Shaded areas indicate the bootstrapped confidence intervals of each regression. Years on the y axis indicate the central year for each 30 year time window. (b) Spearman rank correlation coefficients for the moving windows.
The observed drop in explanatory capacity of on MXD reaches its lowest point in the 1986 window (), strongly impacting the correlation between and MXD (lowest ). Nevertheless, in all three regressions the explained variance remains significant over the entire period (Figure 3). Testing the difference between reconstruction and observation using a Mann-Whitney test (1946–1980: 1946–2010:) revealed no significant stochastic difference between the distributions for the overlapping period of 1946–2010. However, the accuracy of the prediction decreased with the introduction of post 1980 years, showing RMSEs of 0.29 m w.e. (1946–1980) and of 0.33 m w.e. (1946–2010).
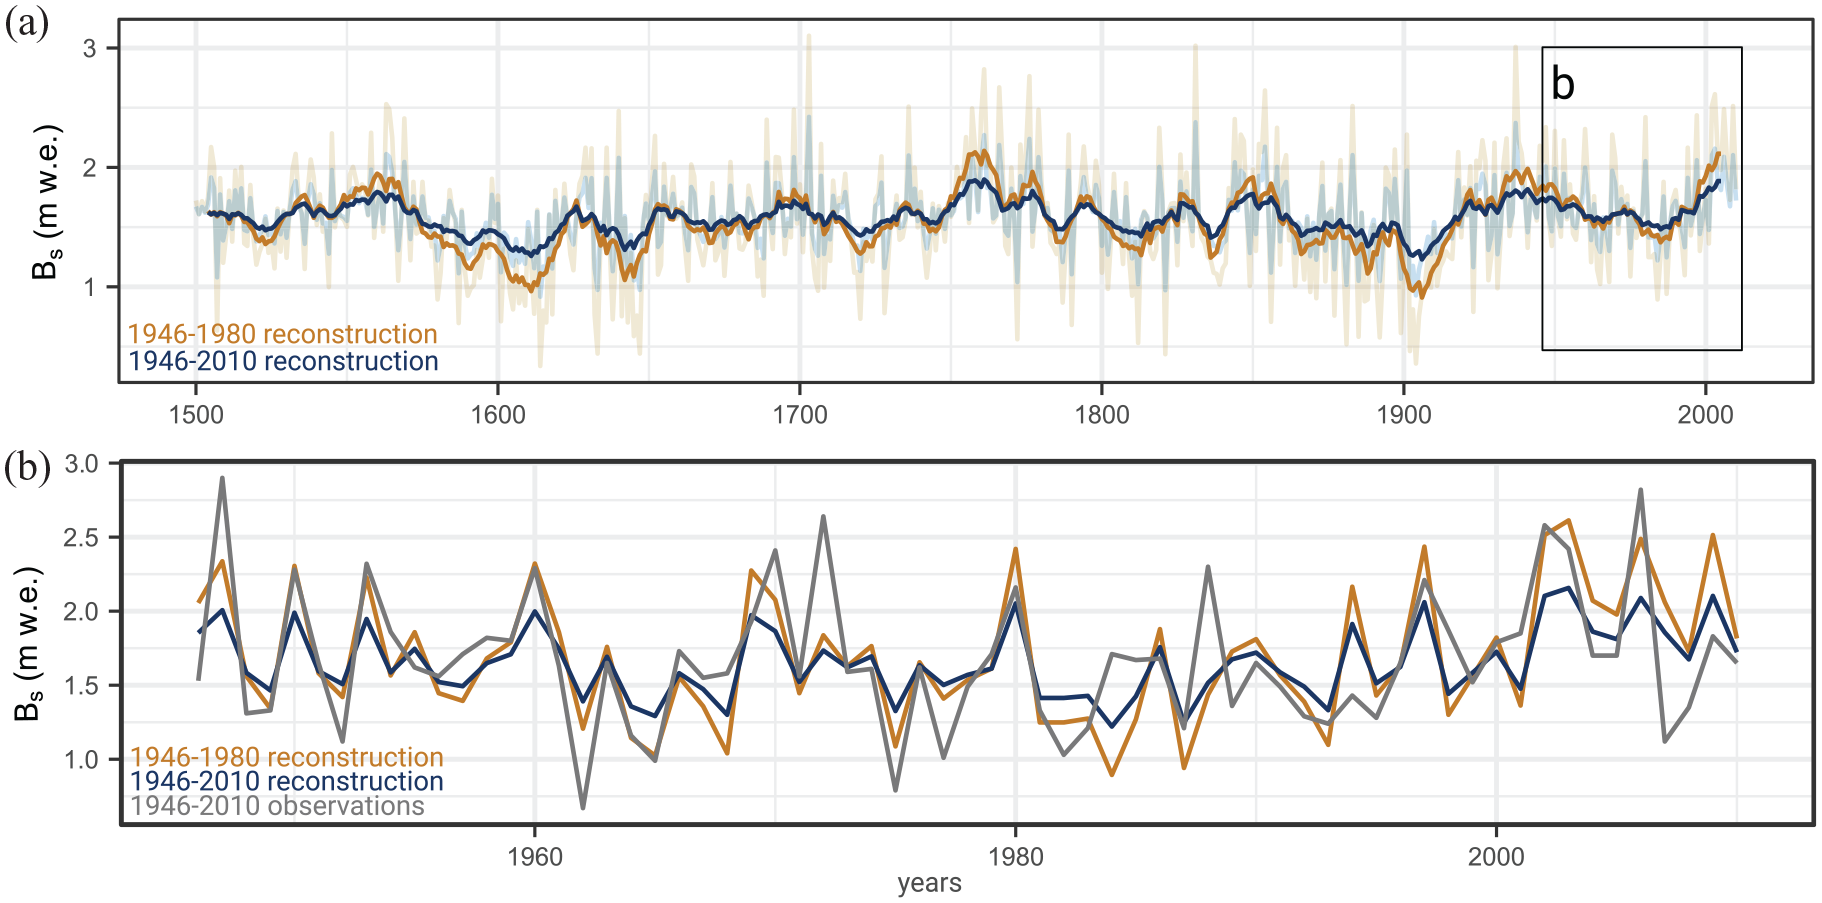
(a) Reconstructed with 10-year rolling mean (saturated lines) of both reconstructions back to CE 1500 (desaturated lines) and (b) both reconstructions compared to the 1946–2010 observations.
Discussion
Correlation analysis and divergence
Judging from our linear regression, a decrease in temperature sensitivity of MXD over the entire correlation period becomes especially clear with the introduction of more recent years into the moving windows. While other studies also mention this period as the starting point of the divergence problem (e.g. Briffa et al., 1998b), none of these studies indicates the existence of a pronounced divergence in the Torneträsk MXD record, especially after the introduction of younger trees in the most recent tree-ring record to lower the mean cambial age (Grudd, 2008). The question is thus raised, whether the divergence found in our data provides first evidence of the divergence problem reported in other studies or if some other phenomenon causes the relationship between MXD and summer temperature to decline. Having additionally tested the regression for other temperature and MXD records of the area, however, we do not believe the decline is a phenomenon caused by the choice of record, and thus argue that it does show some overall resemblance to the divergence problem observed in North America (D’Arrigo et al., 2004; Wilson and Luckman, 2003) and the European Alps (Büntgen et al., 2006, 2008; Frank and Esper, 2005a, 2005b). With the inclusion of additional young trees for the extension to 2010, there should further be no concerns regarding an apparent reduction in MXD temperature sensitivity that can be connected to a high mean cambial age toward the more recent part of the record (Grudd, 2008).
Another possible cause for the divergence in the second half of the twentieth century could be the varying annual sample size of the Torneträsk chronology. Toward the end of the chronology, fewer trees are included, possibly lowering the signal-to-noise ratio and influencing the correlation. As the sample size decreases, the risk for erroneous results in the tree-ring data is likely to increase. However, since a sensitivity loss is detectable as early as the 1960s, where a representative number of samples is still given, this might not be the determining factor for the relationship’s decline.
A loss in sensitivity to summer temperature during recent decades can also be seen in the relationship of and especially after the 1977–2006 window. A similar decrease in correlation was reported by Cerrato et al. (2020) for the Careser glacier in the European Alps when the outlier of 2003 was removed from the dataset. This speaks for a more widespread change in the response of glaciers to climate which Cerrato et al. (2020) attribute to the decay of the Careser glacier in their case. Thus, the reduction in the temperature sensitivity of Storglaciären could potentially too stem from the recent mass loss of the glacier (Koblet et al., 2010), resulting in a non-linear response to climate.
Influence of divergence on the mass balance reconstruction
Our reconstruction shows a similar synchronicity between reconstruction and observation as the reconstruction by Linderholm et al. (2007). Since their study only includes values until 1980, their reconstruction may more closely resemble the observed data than our extended version. Our reconstruction further shows a somewhat lower mean (1.55 m w.e.) than the reconstruction by Linderholm et al. (2007) (1.67 m w.e.) as well as a higher standard deviation (0.46 compared to 0.34 m w.e.) and higher variance (0.22 as opposed to 0.12 m w.e.). The difference in the statistics may arise from the calibration of the linear regression equation parameters or tree-ring standardization method applied by Linderholm et al. (2007).
The underestimation of the 1946–2010 based reconstruction can likely be traced back to the weaker correlation of MXD and toward the end of the time series and exemplifies the influence of the sensitivity loss of MXD during the late 20th century on the reconstruction. Note that in a least-square linear regression the amplitude of the reconstruction decreases by the square root of the unexplained variance (Esper et al., 2005). Since the reduction in explained variance since the 1980s can be attributed to the divergence between summer temperature and both and MXD, we consider the reduced amplitude in the reconstruction a consequence of the divergence. Although more sophisticated scaling models have been shown to better capture the amplitude (Cerrato et al., 2020), one aim of this study was to evaluate whether the methods previously used to reconstruct of Storglaciären are still applicable. Despite the reduced amplitude being a consequence of the linear regression, we find our results to be in agreement with the findings by Cerrato et al. (2020). In their reconstruction, the authors present a higher when using data until the 1980s, compared to subsequent decades. They further emphasize the leverage of outliers in the relationship between and temperature. However, we did not find similar notable changes to the correlation after removing outliers, likely due to our time series being significantly longer.
Apart from the model uncertainty, differences and uncertainties in the standardization of the tree-ring data and chronology development, as well as calibration methods could potentially also result in reconstruction differences (Cook and Peters, 1997; D’Arrigo et al., 2006).
No matter any slight disagreements between previous reconstructions of Storglaciären’s summer mass balance using MXD and our present attempt, it becomes clear that an introduction of more recent years into the reconstruction will alter the ability to detect extremes and reflect less of the variability of the record. By the use of more sophisticated scaling models this reduction in amplitude may be circumvented at the expense of variance precision (Esper et al., 2005).
Glacial conditions captured by the reconstruction
The reconstruction of back to 1500 CE allows for some comparison with local climatic events to assess whether such events are captured by our reconstruction. Notably, cold episodes during the Little Ice Age (Fuentes et al., 2018) in the early and mid 1600s, as well as during the early 18th century are captured by our reconstructions in the form of low values. They are much more pronounced, however, in the 1946–1980 based time series as anomalously low or high values are smoothed out by including the years of lower sensitivity. Generally lower values like those expected for the early 20th century, which was characterized by glacial advances (Linderholm and Jansson, 2007), are underestimated in the 1946–2010 reconstruction. Conversely, they are displayed in the 1946–1980 based reconstruction. Still, the subsequent retreat of glaciers after 1910 (Holmlund and Jansson, 1999) is depicted well by both reconstructions as an increase in Accelerated mass loss in the 1940s as described by Huss et al. (2015) for the Swiss Alps is further represented in the reconstructions by elevated values. Thus, although the 1946–2010 reconstruction shows lower amplitudes, it is still able to properly represent temperature variability in the reconstructed
Conclusions
In this study we reassess the reconstruction of of Storglaciären in the face of an impaired relationship between mean summer air temperatures and MXD, as well as in connection with current climate change.
We are able to provide evidence of a divergence for the Torneträsk chronology, identifying a loss of sensitivity in the relationship since approximately the 1980s. This divergence has a clear adverse effect on the MXD based reconstruction of reducing the explained variance from (1946–1980 based reconstruction) to by including the years 1981–2010 into the analysis. The reconstruction of is further influenced by a reduction in temperature sensitivity of itself. Thus, future reconstruction efforts are hampered by both divergences and should be attempted with caution. Utilization of more sophisticated models than linear regression may help to reduce the loss in reconstructed amplitude introduced by the use of less sensitive years for introduction, especially for areas where long term observations are not available for comparison. A simple linear regression model would likely not be able to capture the observed and therefore past extremes satisfactorily and generally underestimate observations.
Footnotes
Acknowledgements
We thank Josefine Axelsson and Qiong Zhang for their support, inspiration and thoughtful suggestions for the data analysis. Further we would like to thank Peter Jansson for his advice and corrections regarding the manuscript.
Funding
The author(s) received no financial support for the research, authorship, and/or publication of this article.
ORCID iD
Niklas Werner
References
1.
AnchukaitisKJWilsonRBriffaKR, et al. (2017) Last millennium Northern Hemisphere summer temperatures from tree rings: Part II, spatially resolved reconstructions. Quaternary Science Reviews163: 1–22.
2.
BerkowitzJKilianL (2000) Recent developments in bootstrapping time series. Econometric Reviews19(1): 1–48.
3.
BirnbaumZW (1956) On a use of the Mann-Whitney statistic. In:Proceedings of the third Berkeley symposium on mathematical statistics and probability, vol. 1, pp.13–17. Berkeley, CA: University of California Press.
4.
BriffaKR (1999) Interpreting high-resolution proxy climate data — The example of dendroclimatology. In: von StorchHNavarraA (eds) Analysis of Climate Variability. Berlin, Heidelberg: Springer, pp.77–94.
5.
BriffaKR (2000) Annual climate variability in the Holocene: Interpreting the message of ancient trees. Quaternary Science Reviews19(1-5): 87–105.
6.
BriffaKRBartholinTSEcksteinD, et al. (1990) A 1,400-year tree-ring record of summer temperatures in Fennoscandia. Nature346(6283): 434–439.
7.
BriffaKRJonesPDBartholinTS, et al. (1992) Fennoscandian summers from ad 500: Temperature changes on short and long timescales. Climate Dynamics7(3): 111–119.
8.
BriffaKROsbornTJSchweingruberFH (2004) Large-scale temperature inferences from tree rings: A review. Global and Planetary Change40(1-2): 11–26.
9.
BriffaKRSchweingruberFHJonesPD, et al. (1998a) Trees tell of past climates: But are they speaking less clearly today?. Philosophical Transactions of the Royal Society of London. Series B, Biological Sciences353(1365): 65–73.
10.
BriffaKRSchweingruberFHJonesPD, et al. (1998b) Reduced sensitivity of recent tree-growth to temperature at high northern latitudes. Nature391(6668): 678–682.
11.
BruggerKA (2007) The non-synchronous response of Rabots Glaciär and Storglaciären, northern Sweden, to recent climate change: A comparative study. Annals of Glaciology46: 275–282.
12.
BüntgenUFrankDWilsonR, et al. (2008) Testing for tree-ring divergence in the European Alps. Global Change Biology14(10): 2443–2453.
13.
BüntgenUFrankDCSchmidhalterM, et al. (2006) Growth/climate response shift in a long subalpine spruce chronology. Trees20(1): 99–110.
14.
CerratoRSalvatoreMCGunnarsonBE, et al. (2019) A Pinus cembra L. Tree-ring record for late spring to late summer temperature in the Rhaetian alps, Italy. Dendrochronologia53: 22–31.
15.
CerratoRSalvatoreMCGunnarsonBE, et al. (2020) Pinus cembra L. tree-ring data as a proxy for summer mass-balance variability of the Careser Glacier (Italian Rhaetian Alps). Journal of Glaciology66(259): 714–726.
16.
ChenDHellströmC (1999) The influence of the North Atlantic oscillation on the regional temperature variability in Sweden: Spatial and temporal variations. Tellus A51(4): 505–516.
17.
CookERPetersK (1997) Calculating unbiased tree-ring indices for the study of climatic and environmental change. The Holocene7: 361–370.
18.
DriscollWWWilesGCD’ArrigoRD, et al. (2005) Divergent tree growth response to recent climatic warming, Lake Clark National Park and Preserve, Alaska. Geophysical Research Letters32(20): DOI: 10.1029/2005GL024258
19.
D’ArrigoRDKaufmannRKDaviN, et al. (2004) Thresholds for warming-induced growth decline at elevational tree line in the Yukon Territory, Canada. Global Biogeochemical Cycles18: GB3021.
20.
D’ArrigoRWilsonRJacobyG (2006) On the long-term context for late twentieth century warming. Journal of Geophysical Research Atmospheres111(D3): DOI: 10.1029/2005JD006352
21.
D’ArrigoRWilsonRLiepertB, et al. (2008) On the ‘divergence problem’ in northern forests: A review of the tree-ring evidence and possible causes. Global and Planetary Change60(3-4): 289–305.
22.
EsperJFrankD (2009) Divergence pitfalls in tree-ring research. Climatic Change94(3-4): 261–266.
23.
EsperJFrankDCWilsonRJS, et al. (2005) Effect of scaling and regression on reconstructed temperature amplitude for the past millennium. Geophysical Research Letters32(7).
24.
EsperJGeorgeSSAnchukaitisK, et al. (2018) Large-scale, millennial-length temperature reconstructions from tree-rings. Dendrochronologia50: 81–90.
25.
EsperJSchneiderLSmerdonJE, et al. (2015) Signals and memory in tree-ring width and density data. Dendrochronologia35: 62–70.
26.
FrankDEsperJ (2005a) Characterization and climate response patterns of a high-elevation, multi-species tree-ring network in the European Alps. Dendrochronologia22(2): 107–121.
27.
FrankDEsperJ (2005b) Temperature reconstructions and comparisons with instrumental data from a tree-ring network for the European Alps. International Journal of Climatology25(11): 1437–1454.
28.
FuentesMSaloRBjörklundJ, et al. (2018) A 970-year-long summer temperature reconstruction from rogen, west-central sweden, based on blue intensity from tree rings. The Holocene28(2): 254–266.
29.
GeorgeSSEsperJ (2019) Concord and discord among northern hemisphere paleotemperature reconstructions from tree rings. Quaternary Science Reviews203: 278–281.
30.
GouirandILinderholmHWMobergA, et al. (2008) On the spatiotemporal characteristics of Fennoscandian tree-ring based summer temperature reconstructions. Theoretical and Applied Climatology91(1-4): 1–25.
31.
GruddH (2008) Torneträsk tree-ring width and density AD 500–2004: A test of climatic sensitivity and a new 1500-year reconstruction of north Fennoscandian summers. Climate Dynamics31(7-8): 843–857.
32.
GunnarsonBELinderholmHWMobergA (2011) Improving a tree-ring reconstruction from west-central Scandinavia: 900 years of warm-season temperatures. Climate Dynamics36(1-2): 97–108.
33.
HolmlundPJanssonP (1999) The Tarfala mass balance programme. Geografiska Annaler Series A Physical Geography81(4): 621–631.
34.
HolmlundPJanssonP (2002) Glaciological Research at Tarfala Research Station. Stockholm: Stockholms Universitet.
35.
HolmlundPJanssonPPetterssonR (2005) A re-analysis of the 58 year mass-balance record of Storglaciären, Sweden. Annals of Glaciology42: 389–394.
36.
HussMDhulstLBauderA (2015) New long-term mass-balance series for the Swiss Alps. Journal of Glaciology61(227): 551–562.
37.
JacobyGCD’ArrigoRD (1995) Tree ring width and density evidence of climatic and potential forest change in Alaska. Global Biogeochemical Cycles9(2): 227–234.
38.
JacobyGCLoveliusNVShumilovOI, et al. (2000) Long-term temperature trends and tree growth in the Taymir region of Northern Siberia. The Quaternary Research (Daiyonki-Kenkyu)53(3): 312–318.
39.
KarlénW (1984) Dendrochronology, mass balance and glacier front fluctuations in northern Sweden. In: MörnerNAKarlénW (eds) Climatic Changes on a Yearly to Millennial Basis: Geological, Historical and Instrumental Records. Dordrecht: Springer Netherlands, pp.263–271.
40.
KobletTGärtner-RoerIZempM, et al. (2010) Reanalysis of multi-temporal aerial images of storglaciären, sweden (1959–99) – Part 1: Determination of length, area, and volume changes. The Cryosphere4(3): 333–343.
41.
LarocqueSJSmithDJ (2005) Little Ice Age’ proxy glacier mass balance records reconstructed from tree rings in the Mt Waddington area, British Columbia Coast Mountains, Canada. The Holocene15(5): 748–757.
42.
LeonelliGPelfiniMD’ArrigoR, et al. (2011) Non-stationary responses of tree-ring chronologies and glacier mass balance to climate in the European Alps. Arctic, Antarctic, and Alpine Research43(1): 56–65.
43.
LinderholmHWBjörklundJSeftigenK, et al. (2015) Fennoscandia revisited: A spatially improved tree-ring reconstruction of summer temperatures for the last 900 years. Climate Dynamics45(3-4): 933–947.
44.
LinderholmHWJanssonP (2007) Proxy data reconstructions of the Storglaciären (Sweden) mass-balance record back to AD 1500 on annual to decadal timescales. Annals of Glaciology46: 261–267.
45.
LinderholmHWJanssonPChenD (2007) A high-resolution reconstruction of Storglaciären mass balance back to 1780/81 using tree-ring data and circulation indices. The Quaternary Research (Daiyonki-Kenkyu)67(1): 12–20.
46.
LoehleC (2009) A mathematical analysis of the divergence problem in dendroclimatology. Climatic Change94(3-4): 233–245.
47.
LuckmanBH (1996) Reconciling the glacial and dendrochronological records for the last millennium in the Canadian Rockies. In: JonesPDBradleyRSJouzelJ (eds) Climatic Variations and Forcing Mechanisms of the Last 2000 Years. Berlin, Heidelberg: Springer, pp.85–108.
48.
PetersonTCVoseRS (1997) An overview of the global historical Climatology Network temperature database. Bulletin of the American Meteorological Society78(12): 2837–2849.
49.
SchweingruberFH (1988) Tree Rings. Dordrecht: Springer.
50.
SchweingruberFHBartholinTSchaurE, et al. (1988) Radiodensitometric-dendroclimatological conifer chronologies from Lapland (Scandinavia) and the Alps (Switzerland). Boreas17(4): 559–566.
51.
SvarvaHLThunTKirchheferAJ, et al. (2018) Little Ice Age summer temperatures in western Norway from a 700-year tree-ring chronology. The Holocene28: 1609–1622.
52.
TaubesG (1995) Is a warmer climate wilting the forests of the north?Science267(5204): 1595–1595.
53.
VaganovEAHughesMKKirdyanovAV, et al. (1999) Influence of snowfall and melt timing on tree growth in subarctic Eurasia. Nature400(6740): 149–151.
54.
WatsonELuckmanBH (2004) Tree-ring-based mass-balance estimates for the past 300 years at Peyto Glacier, Alberta, Canada. The Quaternary Research (Daiyonki-Kenkyu)62(1): 9–18.
55.
WatsonELuckmanBHYuB (2006) Long-term relationships between reconstructed seasonal mass balance at Peyto Glacier, Canada, and Pacific sea surface temperatures. The Holocene16(6): 783–790.
56.
WilsonRAnchukaitisKBriffaKR, et al. (2016) Last millennium northern hemisphere summer temperatures from tree rings: Part I: the long term context. Quaternary Science Reviews134: 1–18.
57.
WilsonRJSLuckmanBH (2003) Dendroclimatic reconstruction of maximum summer temperatures from upper treeline sites in interior British Columbia, Canada. The Holocene13: 851–861.
58.
WoodLJSmithDJ (2013) Climate and glacier mass balance trends fromad1780 to present in the Columbia Mountains, British Columbia, Canada. The Holocene23: 739–748.
59.
ZawZFanZBräuningA, et al. (2020) Drought reconstruction over the past two centuries in southern Myanmar using teak Tree-Rings: Linkages to the Pacific and Indian Oceans. Geophysical Research Letters47.