
Abstract
Dendroarchaeological data from historic structures and artefacts have the potential to extend tree-ring chronologies spatially and temporally, especially where old-growth forests have been extensively modified or harvested. While these data may contribute to an improved understanding of past climate and ecology, critical differences in the properties of live-tree and historic-timber data might affect results and interpretations of large-scale studies, such as those relying on large datasets from public databases like the International Tree-Ring Data Bank (ITRDB). The objective of this work was to compare summary measures of live-tree versus historic-timber datasets likely to affect outcomes and inferences of typical paleoenvironmental applications. We used 99 live-tree (LT) and 41 historic-timber (HT) datasets collected in the Appalachian region of the eastern United States and compared common analytical measures for understanding past climate and ecology, including temporal coverage, species composition, recruitment patterns, segment length, series coherence/mean interseries correlation (as Rbar), expressed population signal (EPS), subsample signal strength (SSS) and response to drought and extreme climate events. We found that tree-ring data from historic timbers record some ecological events similarly to live trees and are sensitive to some climate conditions, with important caveats related to the influence of site and tree selection on analytical measures. In some cases, these caveats can be overcome through improved collection of metadata and additional analyses. In all cases, potential differences in LT and HT data should be considered by those who perform large-scale analyses using public tree ring databases, especially as more scientists contribute historic-timber datasets.
Introduction
Dendroarchaeology, the application of tree-ring data and methods to archaeological materials, has diversified its tools and applications in the last few decades (Domínguez-Delmás, 2020; Pearl et al., 2020), including new developments in dendroprovenancing (Gut, 2020), stable isotope analysis, non-invasive methods of data collection and more recently, examining historical land-use change (e.g. Baillie, 2002; Billamboz, 2014; Büntgen et al., 2011; Domínguez-Delmás et al., 2015; Haneca et al., 2009; Muigg et al., 2020; Sass-Klaassen, 2002). Yet, research questions in dendroarchaeology have largely, and understandably, remained focused on cultural heritage. Less attention has been paid to how these data sources inform our understanding of past climate and ecology (but see Bleicher and Staub, 2023; Büntgen et al., 2011; Haneca et al., 2006; Pederson et al., 2014b; Tegel et al., 2010; Thun and Svarva, 2018; Trouet et al., 2017). Dendroarchaeological data are simultaneously touted as potentially unfit for typical tree-ring analyses due to biases and complications related to construction preferences (Black et al., 2008; Copenheaver et al., 2017; de Graauw, 2017; Graauw and Hessl, 2020; Pederson, 2010; Skiadaresis et al., 2021; Trouet et al., 2017) and, conversely, as the only means for building temporally-extended, regional networks of tree-ring data where old-growth forests are scarce (e.g. de Graauw, 2017; Robichaud and Laroque, 2008). In regions with histories of extensive logging and landscape modification, tree-ring series from archaeological sites may: (1) be more abundant and widespread than series from old-growth forests, (2) capture earlier time periods and (3) represent sites unlike those where old-growth forests remain. Thus, dendroarchaeological data could fill important spatial and temporal gaps in existing tree-ring networks and extend tree-ring chronologies to periods not represented by living forests. Such data could prove valuable to regional paleoclimate reconstructions, as well as to analyses of past ecological change. At the same time, differences in tree and site selection, segment length and replication may hinder combining these two types of data which, historically, have been collected with different research objectives in mind.
Forests of eastern North America have been shaped by legacies of extensive human land transformation (Abrams and Nowacki, 2020; Delcourt and Delcourt, 1998; Foster and Aber, 2004) leaving limited old-growth forest (few old, undisturbed trees) suitable for tree-ring reconstructions of past climate and disturbance patterns. However, the history of European colonisation in eastern North America left an abundant resource of tree-ring data in the form of historic log structures that may provide a complementary network to aid in investigations of the past (e.g. Cockrell et al., 2017; Harley et al., 2018; Patterson et al., 2021; Rochner et al., 2019; Van De Gevel et al., 2009). Due to urban development and an expanding market for relocating salvaged historic timbers for modern construction, historic log buildings represent an important but disappearing resource of historical and environmental information for eastern North America (Bridge, 2012).
Historic-timber data have been employed in combination with live-tree datasets in studies of past climate and ecology in eastern North America, particularly when large portions of the International Tree Ring Databank (ITRDB) were sourced (e.g. North American Drought Atlas) (Cook et al., 2007; Pederson et al., 2014a; Stahle et al., 2020). Limited attention has been paid to how live-tree and historic-timber data affect ecological and climatological outcomes and inferences, likely because there are relatively few historic-timber sites from eastern North America on the ITRDB and these datasets are not clearly differentiated from live-tree collections. The lack of designation for historic-timber datasets means that they can be pulled just as easily as live-tree datasets from the ITRDB and similar databases without knowing the differences in source. For example, in the eastern United States (US), there are at least 20 chronologies from archaeological sites on the ITRDB, yet none of these are clearly identified as such, except by associated publications or by earlier outer years (assumed to be archaeological or remnant wood or stump collections). This count excludes the possibility of mixed sites that include both living trees and historic timber and/or remnant tree-ring data, which are not clearly denoted. Recently, 18 historic timber sites in Virginia and West Virginia were made public on the ITRDB (Graauw and Hessl, 2020). These and other recent contributions of historic-timber data to the ITRDB have increased the need to carefully consider principal differences between trees selected from historic-timber and live-tree data.
Trees sampled by dendrochronologists and trees felled for construction by historic or ancient builders were selected with different preferences in mind. These differences in sample selection are directly related to principles of dendrochronology known to impact the outcome of most analyses. These principles include site and tree selection, replication, ecological amplitude and segment length (Cook et al., 1995; Stokes, 1996). For example, in eastern North America and depending on the timing of construction, historic builders preferentially felled trees on flat, high-productivity sites. They likely selected species based on wood properties as well as availability, used a limited set of individual trees and preferred logs within a limited range of diameters (~10 cm range) for level construction (de Graauw, 2017; Wicks, 1900). These selection criteria result in potentially weak sensitivity to climate, different species represented, shorter segment lengths and lower replication than those typically selected by dendrochronologists (Black et al., 2008; de Graauw, 2017; Graauw and Hessl, 2020; Pederson, 2010). In contrast, dendrochronologists tend to choose sites located on steep, low-productivity hillsides or ridges at the edge of a species’ range, where conditions contribute to longevity and sensitivity to climate (i.e. the edge of the range of tolerance, or ecological amplitude of a species) (Stokes, 1996). Within and across sites, dendrochronologists sample from a limited set of species known to crossdate well, resulting in a clear climate or ecological signal. Unlike historic builders, dendrochronologists seek to replicate samples within and between trees and prefer long segment lengths. Based on these key differences in data collection, we would expect historic timber sites to yield a weaker climate signal relative to live-tree sites and yield potentially different ecological histories.
We expect differences between live-tree and historic-timber collections, including differences in site selection, tree selection (i.e. species, size) and replication, to persist even with increased sample sizes and spatial coverage. Such differences would likely impact typical ecological and climatological inferences in dendrochronology (Graauw and Hessl, 2020). We test this assumption using 99 live-tree and 41 historic-timber datasets collected in the Appalachian region in the eastern US. The data were sourced from the ITRDB and private/unpublished collections, including 21 historic-timber sites which were previously not publicly available. To address ecological inferences we compare temporal coverage, species composition, segment length and recruitment patterns. For climatological inferences we compare segment length, temporal coverage, series coherence/mean interseries correlation (as Rbar), expressed population signal (EPS), subsample signal strength (SSS) and response to reconstructed drought and documented extreme climate events. Differences in these measures have important implications for studies seeking to combine live-tree and historic-timber datasets, especially as historic-timber data become more widely available on the ITRDB and other public tree-ring databases.
Materials and methods
Study Region
Our study area includes the Piedmont, Blue Ridge, Valley and Ridge, Appalachian Plateau and Interior Low Plateau physiographic provinces within the states of North Carolina, Virginia, Tennessee, Kentucky and West Virginia (Figure 1). Due to the limited number of historic-timber sites from the Coastal Plain and Central Lowland physiographic provinces available on the ITRDB, we excluded these provinces from our analysis. Our study area reflects a region where old-growth forests are limited in extent and historic log buildings are a relatively abundant but disappearing resource (Figure 2). The study region represents an area where the dating of historic structures has been constrained by limited spatial overlap between historic-timber and ITRDB-published live-tree data. Thus, while some structures have been dated, the same region contains large spatial gaps (Figure 1) in publicly available reference chronologies, which currently limit the dating of some historic structures. As of August 2021, the ITRDB contained 35 unique live-tree sites for Virginia, 29 for West Virginia, 26 for North Carolina, 20 for Tennessee and four for Kentucky. The same region included 20 historic-timber sites, the majority (n = 19) of which are located in West Virginia and Virginia (Cockrell et al., 2017; Graauw and Hessl, 2020). Here we contribute 21 additional historic-timber datasets previously not publicly available, including personal collections from the authors and those from projects completed by students in the University of Tennessee Knoxville Environmental Change Laboratory (Brock et al., 2017; Grissino-Mayer and van de Gevel, 2007; Grissino-Mayer et al., 2017; Henderson et al., 2009; Lewis et al., 2009; Mann et al., 2009; Rochner et al., 2017, 2019; Schneider et al., 2015; Stachowiak et al., 2016; Van De Gevel et al., 2009).
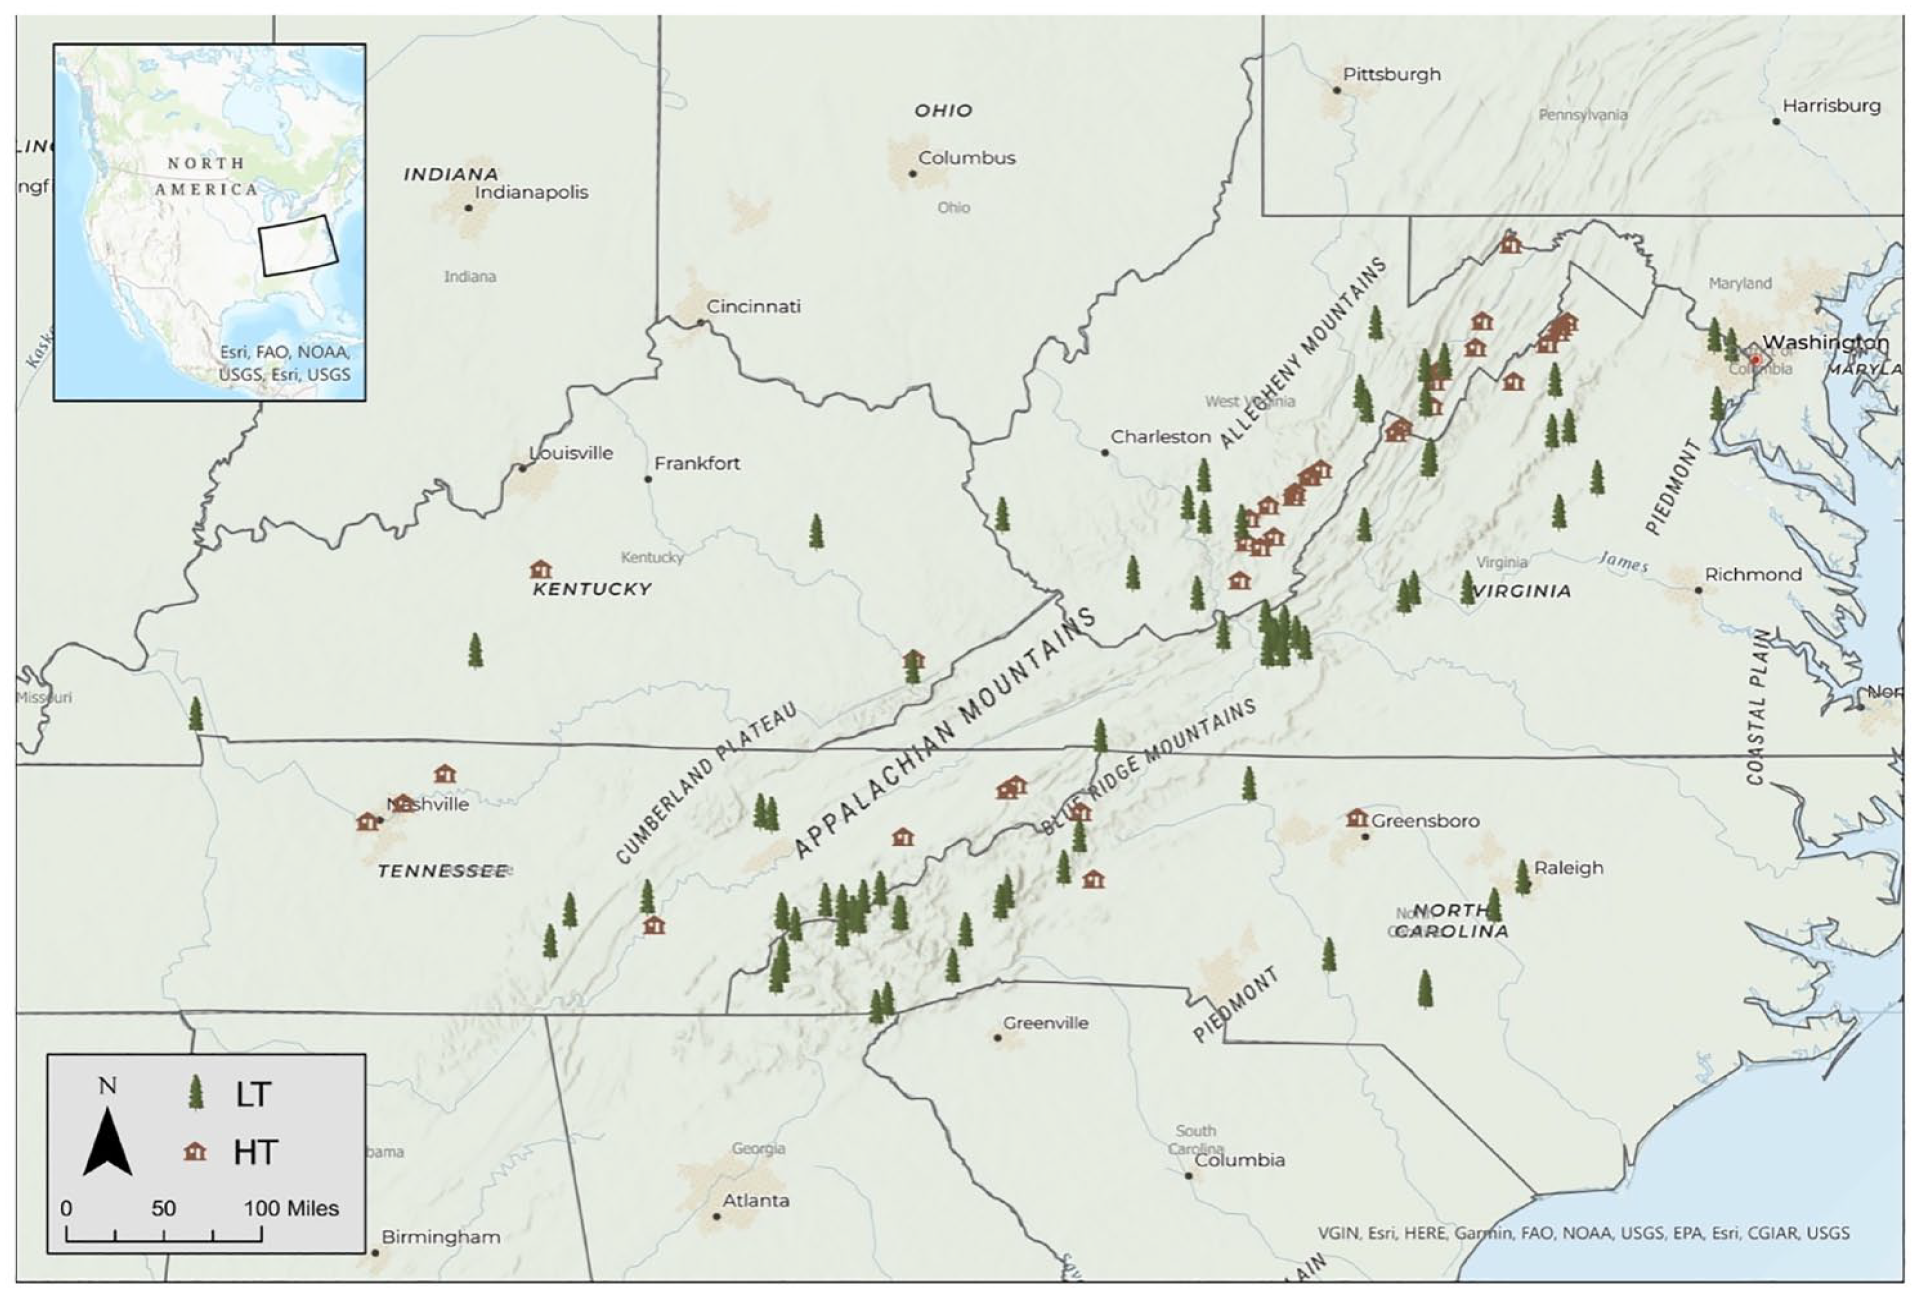
Distribution of live tree (‘LT’) sites (tree symbol) and historic timber (‘HT’) sites (building symbol) and across physiographic provinces of the central Appalachian region.
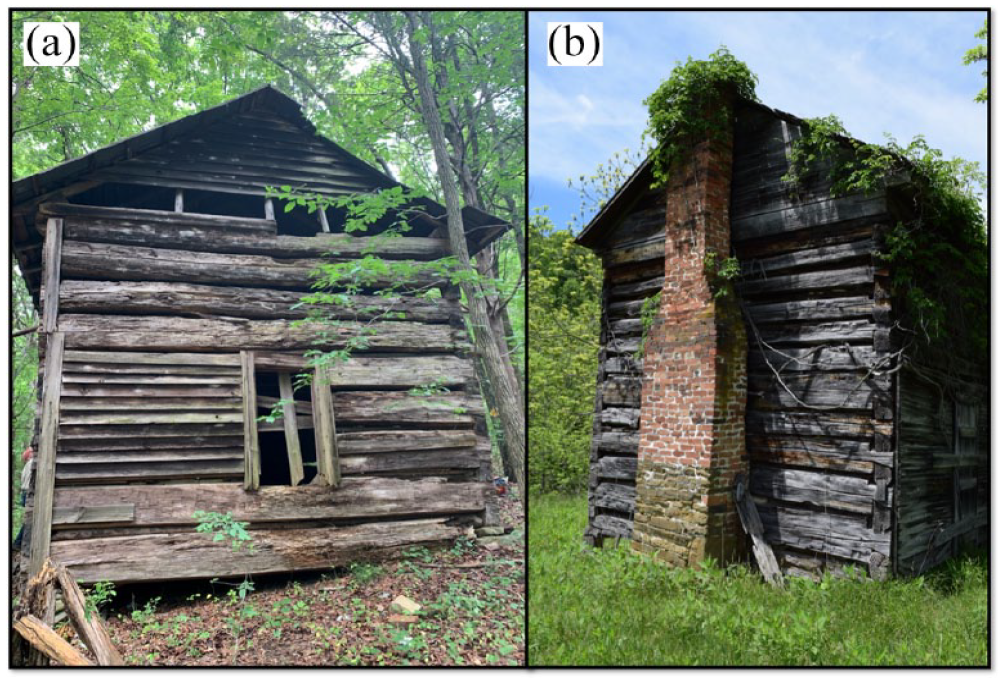
Abandoned historic log buildings such as Davidson Cabin, located in Mecklenburg County, North Carolina (a) and Hedrick House, located in Greenbrier County, West Virginia (b) are disappearing tree-ring resources for studies of past climate and ecology.
The study area contains diverse forest types affected by asynchronous patterns of European colonisation. Sites are generally located within a temperate broadleaf and mixed-forest biome with differences in dominant species composition across elevations and physiographic provinces (Braun, 1947; Dyer, 2006). High-elevation (over 1200 m) Appalachian Mountains forests were historically dominated by American chestnut (Castanea dentata) and oaks (Quercus spp.), comprising between 25% and 75% of forests (Braun, 1950; Holmes, 1911; Pinchot and Ashe, 1897). Appalachian Mountain areas were generally last to be colonised by Europeans, due to geographic/topographic restrictions to migration (Caruso, 2003; Rehder, 2004; Sparks, 1900; Williams, 1989). During the period of heightened European colonisation in eastern North America (1700s and 1800s CE), immigrants preferentially selected flat, fertile land near water for home sites and felled trees on site to clear land for agriculture and pasture (Caruso, 2003; Rehder, 2004; Williams, 1989). Logs were used to construct dwellings and outbuildings such as cabins, houses, barns and spring houses, for example (Caruso, 2003; Rehder, 2004), and thus generally reflect species and environmental conditions of these particular forested biomes. By the late 1800s, this form of whole log construction was replaced by regionally sourced milled timber, no longer representative of local forests (Williams, 1989).
Data preparation and initial comparisons
We downloaded available tree-ring datasets from 20 historic-timber and 120 live-tree sites from the ITRDB (as of August 2021). Once all datasets were assembled, we performed data filtering and initial comparisons using functions in R (R Core Team, 2023). We excluded sites that contained fewer than 10 series as well as any historic-timber sites that were mixed with living trees (21 live-tree sites excluded). We added new collections of 21 previously unpublished historic-timber data (which met the above criteria) from the same region, eight from the private collection of co-author de Graauw, one from the private collection of co-author Rochner and 12 provided with consent and/or co-authorship of relevant members of the University of Tennessee Knoxville Environmental Change Laboratory (Brock et al., 2017; Grissino-Mayer and van de Gevel, 2007; Grissino-Mayer et al., 2017; Henderson et al., 2009; Lewis et al., 2009; Mann et al., 2009; Rochner et al., 2017, 2019; Schneider et al., 2015; Stachowiak et al., 2016; Van De Gevel et al., 2009; Supplemental Table S1, available online, Figure 1). From these data, we developed two datasets (Supplemental Table S1, available online): (1) a full dataset consisting of all live-tree (hereafter LT; n = 99) and historic-timber (hereafter HT; n = 41) sites, covering the period 481–2018 CE and (2) a truncated dataset consisting of LT and HT sites constrained to a common period of temporal coverage for analyses (1580–1880 CE). We further restricted the common period dataset by requiring that each included site maintain a minimum sample depth of five trees (differentiated by unique sample IDs) covering at least 50 years of the 1580–1880 CE period. For this restriction, we assumed that HT sites do not have multiple samples from the same tree, a possibility observed in previous studies (Rochner et al., 2017) but one that is unlikely to be accounted for in large studies pulling combined LT and HT datasets from the ITRDB. All HT sites are included in both the full and common period datasets, while only 68 of the LT sites are included in both datasets. We first compared segment length and sample depth by site type, HT or LT, using the full dataset in the R package dplR (Bunn, 2008). We then compared species richness (with some species grouped by genus) between the full LT dataset, the common period LT dataset and the HT dataset. We used the common period dataset for recruitment and dendroclimatic analyses explained below.
Recruitment
We compared recruitment between LT and HT data using the common period (1580–1880 CE) dataset to evaluate how historic timbers represented past recruitment patterns relative to live-tree data. To reduce the effect of replication in HT and LT datasets, where multiple samples were derived from individual trees, we combined tree-ring series into individual tree means when possible, using common naming conventions. ‘Site-tree-core’ code (SSSTTC) is a commonly used, but not exclusive, convention. Historic-timber data often include extra metadata in sample IDs. For example, the sample ID ‘KCN04A’ includes ‘KC’ for site name but also ‘N’ for north wall, ‘04’ for tree and ‘A’ for core. ITRDB datasets do not include metadata on the presence of pith, inner-ring curvature (near pith), or coring height on the tree or log. Therefore, we estimated recruitment dates (not germination dates) by assuming that inner-ring dates represent age at coring height (Villalba and Veblen, 1997). We used the earliest ring for each mean tree-ring series to calculate frequency and percent of recruitment by decade for each site, and each site type (LT and HT). We also compared recruitment pulses (number of trees that were recruited in each decade) at both the LT and HT site types.
Because log sizes in the HT collections are affected by the construction methods used at the time, we expected that the distribution of segment lengths might also be constrained and affect the distribution of inner-ring dates and resulting recruitment patterns. To determine whether the recruitment pattern at HT sites was structured by segment length and cutting dates alone, we generated a random set of recruitment dates for comparison to the actual distributions of recruitment. Using the distribution of sample sizes from our actual dataset (mean = 22, range = 11–44), we randomly sampled 41 (to match the number of HT sites) distributions of segment lengths from the entire distribution of segments (n = 884). We identified felling dates for each structure to the year and season (Bannister, 1962), or for previously published sites, we gathered felling dates from relevant publications. We then subtracted the randomly selected segment lengths from the actual 41 felling dates creating random distributions of inner-ring dates for each ‘site’. We then repeated this procedure 1000 times and calculated upper and lower 95% confidence limits around these distributions of recruitment. We identified any actual recruitment pulses outside those confidence limits, either above or below as a pulse or deficit, respectively, in recruitment. We focused this additional analysis on the HT dataset, for which the distribution of segment lengths and sampling (cutting) dates was limited and more likely to affect outcomes.
Common and potential dendroclimatic signals
HT data are inherently limited in the signal that can be analysed because of short segment lengths, a limitation in the use of HT data that restricted our analyses to a high-frequency comparison of coherence measures and responses to annual and extreme events. We used the common-period tree means to test for differences in estimates of series coherence (Rbar) and common signal (EPS and SSS), calculated using functions in dplR (Bunn, 2008) between LT and HT sites. Both the EPS and SSS statistics are used to quantify the strength of the common ring-width signal among samples, and therefore represent the power of a tree-ring chronology, based on combined metrics of Rbar and sample size (Wigley et al., 1984). To compare measures of series quality and common signal between site types, we used the dplR (Bunn, 2008) to first power transform (Cook and Peters, 1997) and then detrend the tree-ring width data by calculating ratios from two-thirds smoothing splines (50% frequency cutoff at frequency equal to 67% series length) (Cook, 1985; Cook and Peters, 1981). We then calculated mean index values for each tree. We chose an age-dependent spline as our detrending strategy to (1) best account for artificial inflation of series ends (i.e. ‘end effects’) (Cook, 1985; Cook and Peters, 1981; Fritts, 1976), especially in means calculated from overlapping short series and (2) as the ‘trade off’ accounting for the range in segment lengths between LT and HT data in a direct comparison. A fixed spline, including one based on the mean segment length across both the LT and HT datasets, such as recommended by Klesse (2021), would likely be skewed towards the mean of longer series lengths in the LT dataset and inappropriate in all cases (e.g. fitting a 100-year smoothing spline to HT series less an 100 years in length). To address concerns regarding temporal frequency bias (Klesse, 2021) and examine if this choice affected our results, we also applied and rejected, a more conservative, hierarchical approach (i.e. modified negative exponential, negative line or mean detrending) and compared the same measures (Supplemental Figure S2 and Table S2, available online) We performed Welch two-sample t-tests to statistically compare segment length, Rbar, SSS and EPS by site type.
Because HT data do not overlap with instrumental climate data (for much of the eastern United States: 1895 earliest to present), typical climate-growth analyses could not be performed, and a direct comparison to LT climate-growth response could not be made. Instead, we used superposed epoch analysis (SEA) (Haurwitz and Brier, 1981; Lough and Fritts, 1987; Martín-Benito et al., 2008) in dplR (Bunn, 2008) to compare HT versus LT response to reconstructed annual drought events over the common period 1580–1880 CE. We built mean index chronologies for each site type using biweight robust mean estimation also in dplR (Bunn, 2008; Cook, 1985; Mosteller and Tukey, 1977). For comparison across HT and LT means, we additionally required that at least five sites were represented in the mean index calculation. We recorded drought event years as those with Palmer Drought Severity Index (PDSI) <–2.00 downloaded from the North American Drought Atlas (NADA, Cook et al., 2007) and averaged over the study region (~34.76–39.37° N, ~76.77–90.07°W), resulting in event years: 1587, 1597, 1598, 1654, 1670, 1708, 1746, 1748, 1755, 1762, 1767, 1774, 1799, 1816, 1819, 1839, 1874 and 1879. We calculated the mean positive and negative departures in ring-width indices, or superposed epoch values, for the event year (year zero) and 5 years prior to and following each drought year and calculated bootstrapped (1000 iterations) confidence intervals to identify significant departures from the mean. We additionally compared how each site type responded to two subcontinental to hemispheric extreme climatic events thought to affect the study region (Cook et al., 2007). Using the mean of chronologies for each site type, again requiring that at least five sites are represented, we compared how the two site types recorded a known frost event in 1774 CE (Barker, 1924; Pederson et al., 2014a) and a hemispheric-scale volcanic cooling event, ‘the year without a summer’, in 1816 CE (Briffa et al., 1998; D’Arrigo et al., 2013). For each event, we extracted an 11-year segment centred on the event year from site chronologies, calculated a mean value for the period across chronologies for each site type and bootstrapped 95% confidence limits around the means for each year in the 11-year period.
Results
Data descriptions and comparisons
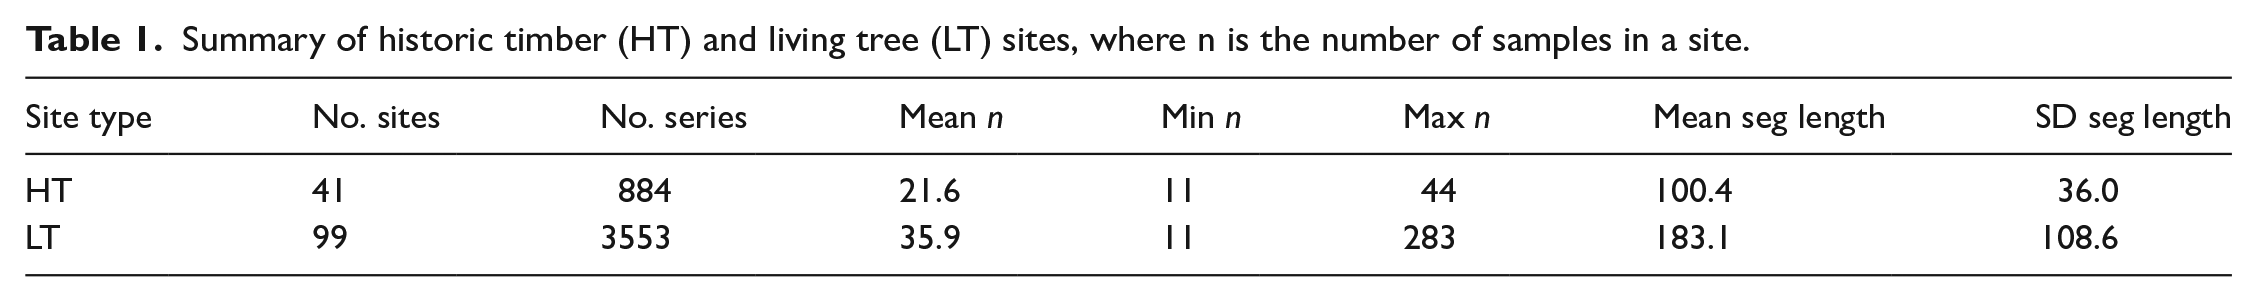
The study area represents a region of spatial overlap between HT and LT datasets with some notable spatial gaps. LT datasets are clustered in the Blue Ridge Mountain and Valley and Ridge physiographic regions with especially low representation for the Appalachian and Interior Low Plateaus and Piedmont. HT sites are clustered in the same regions, likely driven by the need for long reference chronologies required to date the structures. Temporal coverage of the HT dataset is limited for our study area after the mid-19th century due to construction dates; fewer than 25 sites extend after 1831 CE (Supplemental Table S1, available online, Figure 3a). While the LT sites have a greater temporal extent, both site types have high replication (>25 sites) beginning in the mid to late 1600s (1690 for HT and 1641 for LT). Across all datasets, eight tree genera are represented (Figure 4). White oak (Quercus alba) is dominant across all site types, and overall fewer genera are represented by HT than LT data. Genera richness is highest in the full period and common period LT datasets (n = 8 and n = 7, respectively) (Figure 4a and b) and lowest in the HT dataset (n = 5) (Figure 4c). The HT record largely represents hardwoods, especially oak, and fewer softwood species. Other genera, such as hemlock (Tsuga spp.) and American chestnut are absent from the HT record (Figure 4c) despite relative abundance in the LT record. Segment lengths are significantly longer for LT than HT (t4135 = –37.8, p < 0.001) (Table 1, Figure 3b and c).
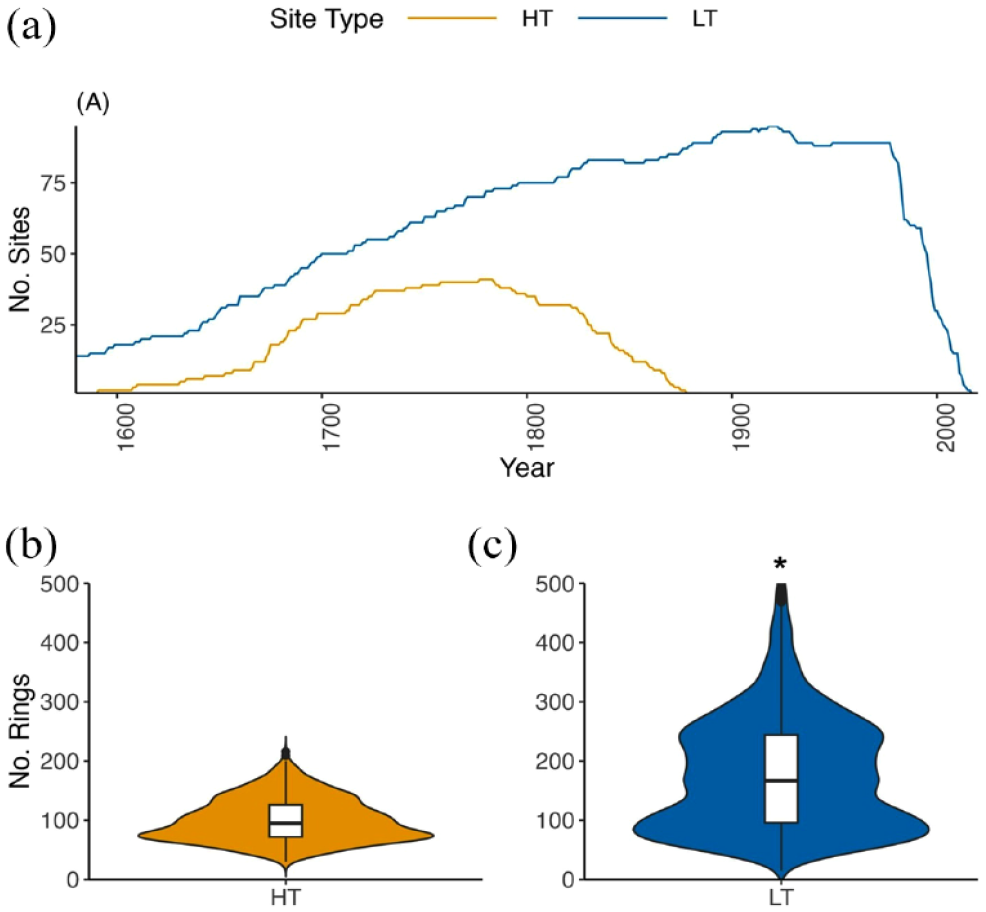
Number of sites over common time interval (1580–2020) (a) and violin plots with internal box plots of mean segment length (number of rings) of historic timbers (b) and old-growth sites* (c). The width of the violin plot indicates probability density/frequency. *There are 41 segments from three LT sites that exceed 500 years in length.
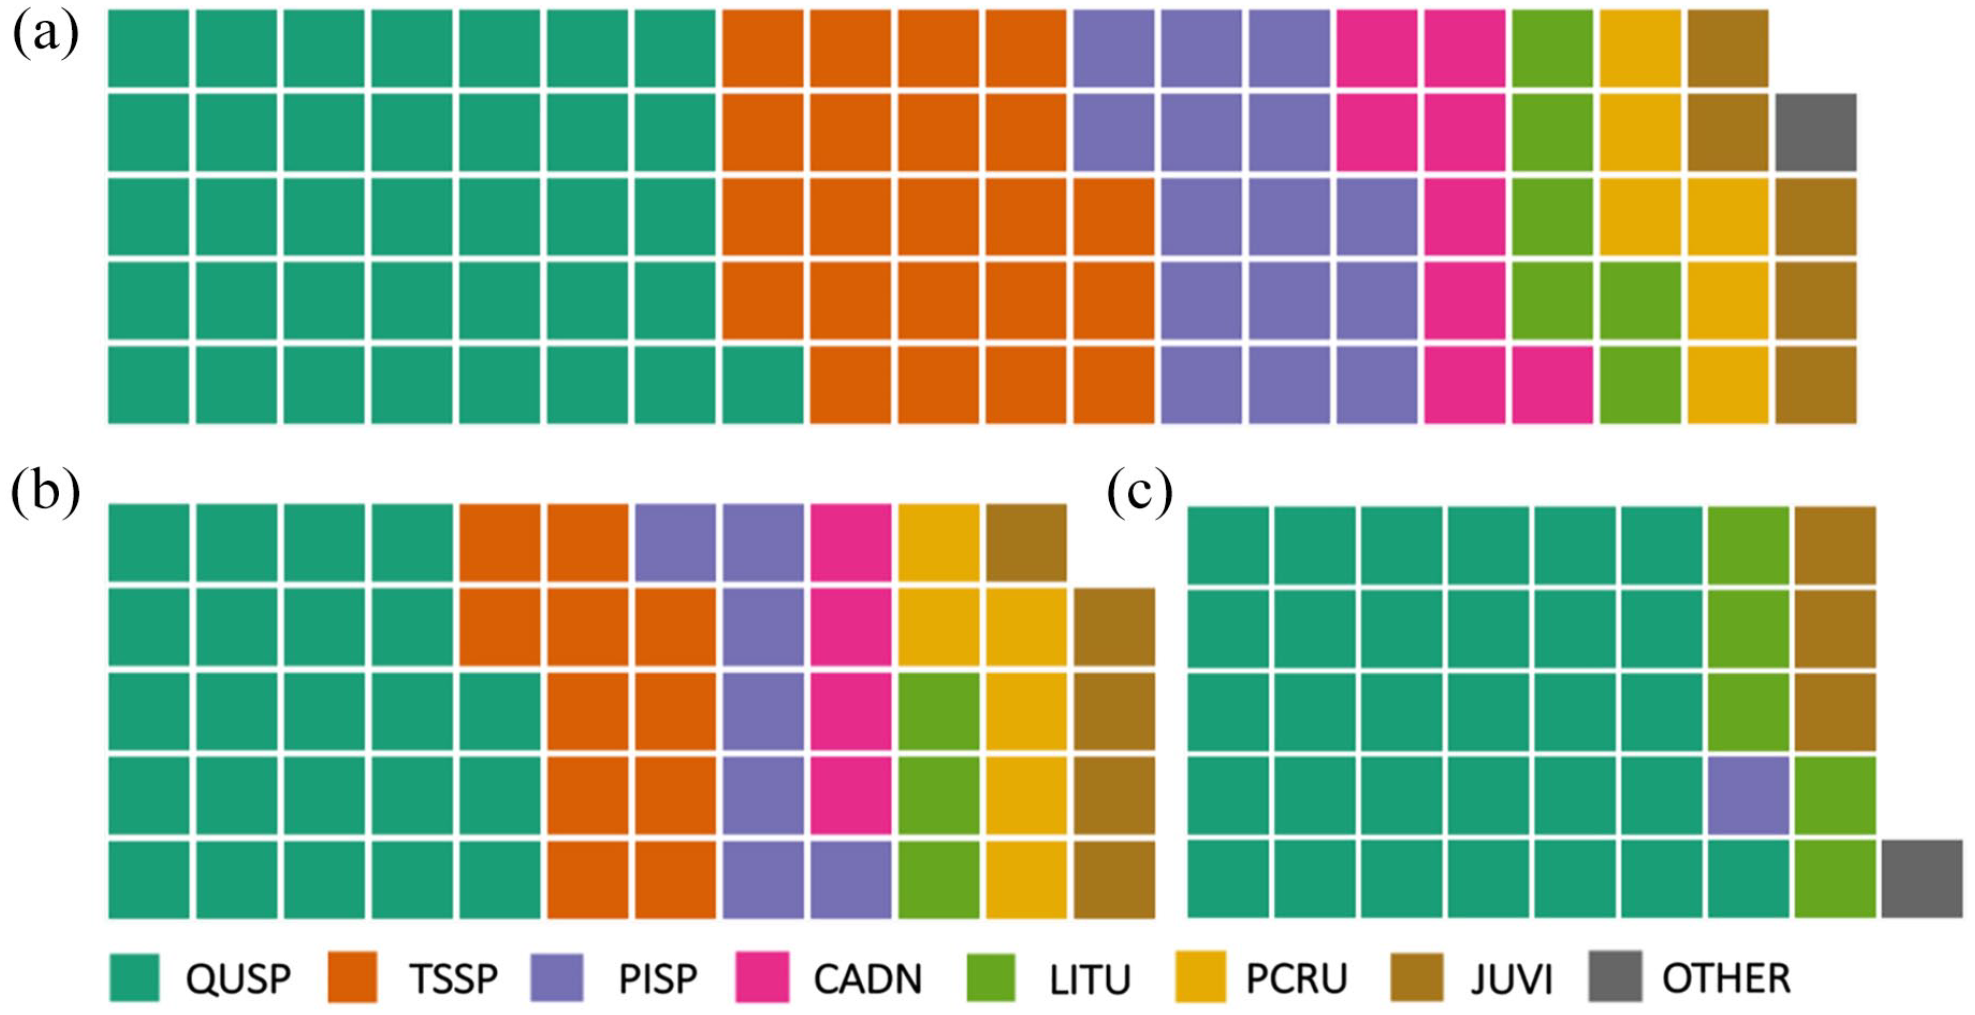
Species composition of all live-tree (LT) sites (a), live-tree sites during the common period (1580–1880 CE) (b), and all historic-timber (HT) sites (c). All historic-timber sites cover at least part of the common period. ‘QUSP’ (Quercus spp.), ‘PISP’ (Pinus spp.), ‘LITU’ (Liriodendron tulipifera), ‘JUVI’ (Juniperus virginiana), ‘TSSP’ (Tsuga spp.), ‘CADN’ (Castanea dentata), ‘PCRU’ Picea rubens), ‘OTHER’ (other species).
Summary of historic timber (HT) and living tree (LT) sites, where n is the number of samples in a site.
Recruitment
Recruitment patterns are different between the HT and LT sites. Recruitment at the HT sites is approximately normally distributed, though slightly negatively skewed (–0.277) towards earlier recruitment (Figure 5). Later recruitment is limited by the construction dates, which begin in 1780 and end in 1880, peaking in the 1850s when timbers for seven of 41 structures were cut. This contrasts with the LT sites, which continue to recruit relatively evenly through the 1860s. Skewness of the distribution of recruitment, derived from the actual cutting dates and random draws of segment lengths, is also negative (–0.167). The HT sites have four recruitment periods that exceed the narrow 95% confidence limits (CL): 1610–1630, 1.6% (CL 0.6%); 1670–1680, 5.1% (CL 3.6%); 1690–1710, 8.4% (CL 5.8%); and 1720–1740, 11.2% (CL 8.2%). The latter half of HT recruitment (1740–1820) shows a deficit compared to random recruitment.

Percent recruitment (inner ring dates) from HT sites (a) and LT sites (b) during 1580–1880. Ribbon in (a) includes the lower and upper bounds of a set of randomly generated inner ring dates derived from random samples of construction dates and segment lengths from the entire dataset. Recruitment pulses are indicated by an asterisk (*).
Of the four recruitment pulses noted at HT sites, only two are (weakly) reflected in the LT distribution. Between 1690 and 1710, average recruitment at LT sites was 2.9%, slightly above the surrounding decades. Recruitment peaked again at LT sites between 1720 and 1740 (4.4%). LT recruitment peaks were stronger between 1780 and 1800 with an average recruitment of 5.5% and from 1870 to 1880, the last decade evaluated here, with an average of 9.9% (Figure 3). An additional comparison of recruitment peaks at each site in the HT and LT site types demonstrated that periods of high recruitment were not dominated by any single site (or group of sites) (Supplemental Table S1 and Figure S1, available online).
Common and potential dendroclimatic signals
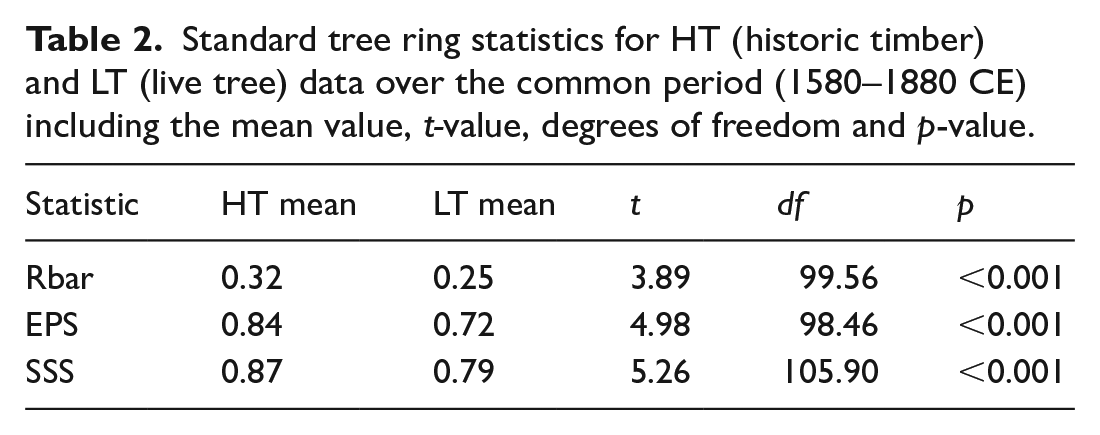
Analytical measures important for climatological inferences were also different between LT and HT sites. The standard tree-ring statistics Rbar, EPS and SSS were statistically higher for HT than LT datasets over the common period (Table 2). For SEA and analyses of extreme event response, data filters requiring that at least five sites are represented per site type limited the period of highest replication to 1660–1868, which captures 12 drought events (1670, 1708, 1746, 1748, 1755, 1762, 1767, 1774, 1799, 1816, 1819, 1839) and the two extreme events investigated (Figure 6). Over this period, mean annual growth indices of HT and LT sites were correlated (r = 0.59, p < 0.05) (Figure 6). For the SEA, both the HT and LT datasets show significant (p < 0.05) negative growth responses to the annual drought events, with a slightly stronger mean growth deviation in the HT mean chronology (Figure 6). Tree-growth responses to extreme events varied across the two tested events. We did not identify a response to the 1816 volcanic event in either dataset. Tree-growth responses to the 1774 frost event were not statistically different (p > 0.50) between the LT and HT sites (Figure 6).
Standard tree ring statistics for HT (historic timber) and LT (live tree) data over the common period (1580–1880 CE) including the mean value, t-value, degrees of freedom and p-value.
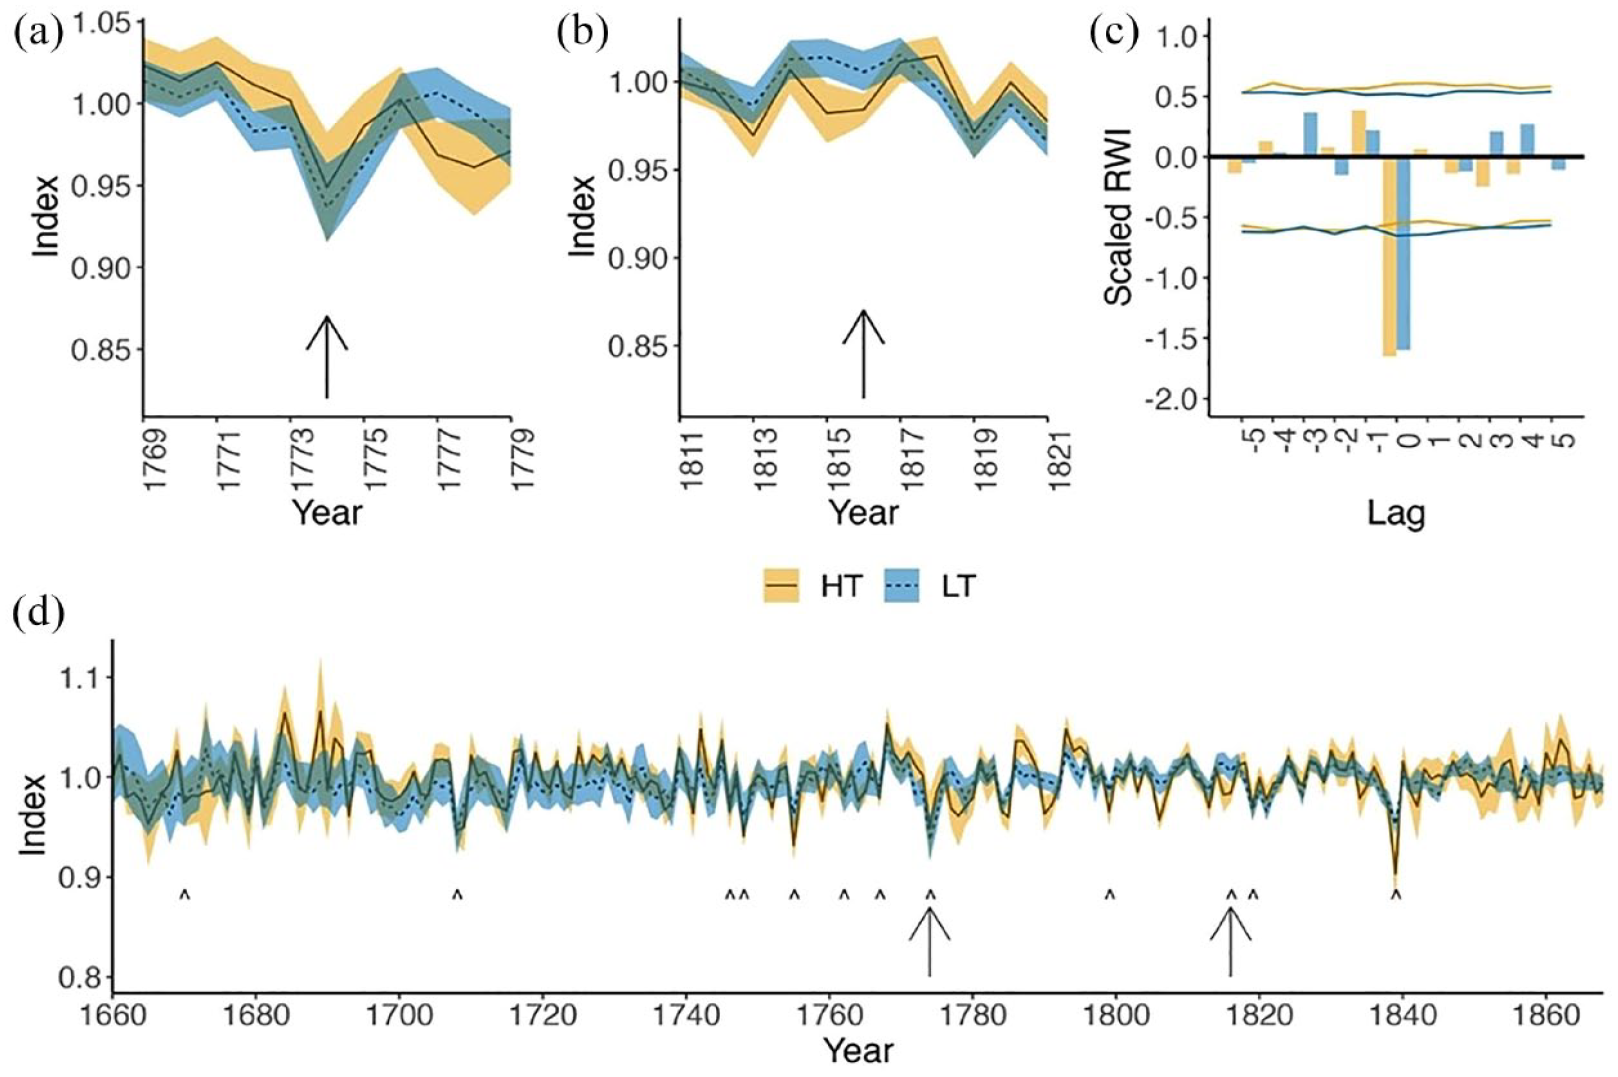
Growth response of HT (historic-timber sites, solid line) and LT (live-tree sites, dashed line) over 11-year periods centred on two extreme climate events: (a) 1774 frost event and (b) 1816 volcanic event and (c) superposed epoch analysis (SEA) of n = 12 drought events identified using 2-sigma negative departures (<–2.00 PDSI) from the North American Drought Atlas (NADA) averaged for region: 34.76–39.37°N, 76.77–90.07°W, with 95% confidence limits for each type noted by lines in blue (LT) and gold (HT). The full period of overlap between HT and LT sites (d), from 1660 to 1868, where both site types have at least five sites represented. Arrows point to the two extreme climate events represented in (a and b) and ‘^’ indicate the 2-sigma NADA drought events used for the SEA. Gold (HT) and blue (LT) ribbons represent 95% credible intervals around the mean values.
Discussion
We found that tree-ring data from historic structures in the eastern US are equally responsive to high-frequency and extreme, single-year climate conditions and record recruitment events similarly to live trees with important caveats. Selection bias during building construction (e.g. site, species and size/diameter preferences) is part of the tree-ring record in historic structures (de Graauw, 2017; Trouet et al., 2017). However, LT data are not without similar biases resulting from preferences for dendrochronological sampling (e.g. site, species, age and sensitivity preferences). In some cases, these biases lead to important differences between HT and LT datasets, and in other cases they converge. Both have implications for evaluating HT data for ecological and climatological applications.
Species influences
In the study region, both LT and HT datasets were dominated by oak species. The abundance of oak in both LT and HT datasets is likely explained by human preferences for oak as an abundant (Braun, 1950; Dyer, 2006; Holmes, 1911; Pinchot and Ashe, 1897) and rot-resistant building material (Granger and Buckley, 2021; Wicks, 1900). Oak, a dominant genus on the ITRDB, is often targeted by dendrochronologists for the genus’ longevity and sensitivity to climate variables. Alternatively, other species like hemlock, while abundant in live-tree datasets of the ITRDB, are rare to non-existent in the HT record, likely because they exhibit anatomical characteristics (e.g. ring shake in hemlock) that are unfavourable for construction purposes (Brown and Sendak, 2006).
Published, calendar-dated HT datasets are also biased towards oak species because of the abundance of reference datasets for oak relative to other tree species. The dominance of oak in LT datasets has facilitated the dendroarchaeological dating of oak structures but limited the dating of structures built from other materials (e.g. American chestnut, American beech (Fagus grandifolia), white ash (Fraxinus americana), shortleaf pine (Pinus echinata)). For example, historical records (e.g. witness trees, land survey records) indicate the dominance and importance of American chestnut in past forests (Baxter, 2009; Braun, 1950; Davis, 2006; Holmes, 1911; Pinchot and Ashe, 1897), but it is not well represented in either the live-tree record or the historic-timber record because it is now functionally extinct due to early 20th century chestnut blight (Cryphonectria parasitica (Murrill) M.E.Barr) (Säterberg et al., 2013). The lack of historic-timber American chestnut chronologies (here and on the ITRDB) does not equate to a lack of American chestnut timbers in structures (e.g. de Graauw, 2017; Rochner et al., 2017). Rather these timbers and/or structures are less likely to be selected for sampling, and if sampled, chronologies are less likely to be published because they are unlikely to be crossdated without live-tree American chestnut reference chronologies. Historic-timber chronology development for particular species, including American chestnut, has also been limited by species-specific characteristics (e.g. fast growth, ring-width complacency) and an inadequate number of rings for crossdating (de Graauw, 2017; Rochner et al., 2017).
Climatological potential
Tree-ring data from historic structures show strong coherence and are responsive to high-frequency climate conditions (in this case drought) and climate extreme events. The analytical measures EPS, Rbar and SSS were statistically higher for HT data (Table 2). HT data were equally responsive to reconstructed annual drought (as PDSI < –2.00) over the common period (Figure 6). HT data were also as responsive to the 1774 frost event as the LT data (Figure 6). The lack of response to the 1816 volcanic event in both the HT and LT datasets may in part be due to minimal impact of the event in the southeastern US (Briffa et al., 1998), although this event remains poorly understood in the region because of a relative lack of temperature-sensitive tree-ring chronologies in the eastern, and especially southeastern US (Harley et al., 2021; Heeter et al., 2019; Pearl et al., 2017). Higher coherence values and stronger responses to climate extreme events in HT data may be driven in part by the location of HT sites in high-productivity areas, where trees are typically less stressed (i.e. within the range of tolerance, or ecological amplitude of the species, Stokes, 1996) but potentially more responsive to extreme climate and disturbance events, such as those that extend outside that range of tolerance, for example, the 1839 drought, the strongest of the tested drought events, that also affected crop yields in the same areas (Boatman, 1960). The coherence and responsiveness of HT data to drought may also be driven by the prevalence of oaks in the dataset (Figure 4). Simultaneously, the more diverse mix of species in the LT dataset, with differing climate responses, may be reducing the coherence and response values (e.g. such that mixed responses confound the signal). Still, coinciding biases towards drought-sensitive oak in both the HT and LT datasets (Figure 4) may support pairing common-species LT and HT sites to temporally extend and increase sample sizes for climate analyses in spatial data gaps lacking adequate LT replication.
However, those seeking to combine HT and LT data in climatological analyses should be cognizant of the implications of unintended replication, or pseudoreplication (Hurlbert, 1984) and short segment lengths. Climate sensitivity in HT data may be inflated by pseudoreplication due to unintentional sampling of multiple logs from the same tree (e.g. halved or quartered logs, sectioned trees, or downsized and re-used timbers). For some structures, this could mean a high sample count representative of a smaller number of trees, replication that is not accounted for in the calculation of tree means. This replication, with proper sampling techniques, can be accounted for in the dating of historic structures with minimal impact to dating results (e.g. Rochner et al., 2017); however, such replication, if unaccounted for in the use of HT data for climate or ecological analyses, can bias/inflate results. Along with a bias towards one genus (in this case oak) in the HT dataset, pseudoreplication may in part explain higher analytical measures for Rbar, EPS, SSS. Shorter segment lengths in HT datasets also affect their ability to capture low-frequency climate variability (Cook et al., 1995; Pearl et al., 2020), and are prone to standardisation problems, for example, ‘end effects’ (Fritts, 1976) and false releases in growth driven by the inclusion of young, fast-growing trees in a chronology (Büntgen et al., 2019; Haneca et al., 2005). Because of these issues, the use of HT data may be limited to high-frequency climate analyses and reconstruction only. However, with consideration of such caveats, such as through additional screening to select HT sites with longer series, appropriate standardisation and additional analyses to identify same-tree log pairings, such as the calculation and reporting of t-values for log pairings (Rochner et al., 2017), HT data may be useful for climate analyses.
Ecological potential
Likewise, tree-ring data from historic structures record ecological events through recruitment pulses/deficits similarly to live trees, with important caveats. First, we found that historic structures did not add to the length of the LT record in our study region. Instead, data are highly replicated over a period already captured by LT data (ca. 1650–1850). In our study area, inner ring (i.e. recruitment) dates are potentially constrained by climate and/or land-use patterns, a limitation that has also been identified in other HT and LT datasets from eastern US forests (Pederson et al., 2014a; Trouet et al., 2017), and suggests that climate and/or widespread land-use patterns affected availability of trees of certain ages or sizes at that time. Outer ring (i.e. construction) dates are constrained by asynchronous patterns of European immigration between the 1700s and 1800s (Caruso, 2003), and a nearly complete shift from log to timber-frame construction by the late-19th century (Williams, 1989). In combination, these constraints limit temporal coverage of HT data from extending earlier or later than LT data, a result that is likely only specific to eastern North America and reflects, in part, the buildings available to sample and the histories of construction. It is not surprising then, given the history of colonisation and building construction, that the latter half of HT recruitment (1740–1820 CE) shows a deficit in recruitment events compared to random recruitment and LT recruitment peaks (1780–1800 and 1870–1880 CE). Tree availability and construction history, combined with selection biases, particularly the preference for certain size/diameter logs for construction (de Graauw, 2017), limit the segment lengths in HT data and therefore the potential for ecological (and climatological) reconstructions to extend beyond the 1600s.
Synchronous recruitment pulses at both LT and HT sites, such as the 1670–1680 pulse that is also found across the eastern U.S. (Pederson et al., 2014a; Trouet et al., 2017), are likely a response to climate. However, the specific site type represented by HT data (i.e. low elevation, flat, high productivity), and the lack of consistent synchroneity in recruitment (excluding the 1670s pulse) between the HT and LT data, suggest that HT datasets represent different sites with different histories more directly related to land-use change. Therefore, a hidden value of HT data lies in its potential to inform our understanding of different environments than LT data. While LT sites, when chosen for containing old (>200–250 years) and sensitive trees for climatological purposes, often, but not always, represent areas unsuitable for human habitation (particularly in the study area, e.g. steep slopes, unproductive soil), HT data represent areas ideal for human habitation and intensive land use (Graauw and Hessl, 2020). By focusing efforts on old-growth sites typical of LT data, we miss important events occurring at the HT site type, including potential evidence of Indigenous land management, European colonisation and land-clearing and other, more recent human-environment interactions.
Conclusions and future directions
While we found that tree-ring data from historic structures record ecological events similarly to live trees and are responsive to high-frequency and extreme climate conditions, there are important caveats to consider prior to the inclusion of HT data in large-scale ecological or climatological analyses. These caveats are driven largely by legacies of selection biases in both HT and LT datasets and include: (1) temporal coverage of HT data may be concentrated over a short period of time when structures were being built and may not extend LT records; (2) short segment lengths in HT records are prone to the ‘segment length curse’ and end effects (Cook et al., 1995; Fritts, 1976), which may limit climate analyses and reconstruction to high-frequency, and combined with cutting dates, shape recruitment patterns; (3) the tree species represented in HT data may differ, to a degree, from LT data – though in this case, both datasets are dominated by oak, a climate sensitive species; (4) the site type represented by HT data may be different (potential for human land use is much higher) from LT data; and (5) coherence measures and response to climate extreme events in HT data may be inflated by potential pseudoreplication. In some cases, these caveats can be addressed through increased metadata and additional analyses. In all cases, the influences of important differences between live-tree and historic-timber data on ecological and climatological inferences should be considered, especially as more scientists share both LT and HT datasets in a public database and work to fill in spatial data gaps.
Both the climatological and ecological application of HT data remain limited by selection bias but could be improved by more detailed and consistent sampling methods and collection of metadata. Based on the challenges we encountered in our analyses, as well as in our own experience in dendroarchaeology work, we recommend the following actions. First, we recommend collecting more metadata for dendroarchaeological samples. Important metadata to collect include: (1) diameter at breast height (DBH) or estimated diameter, when accessible, and sampling location from historic timbers and (2) presence or absence of ring curvature, or pith, for estimates of recruitment (de Graauw, 2017; Graauw and Hessl, 2020). Standard procedures, such as alphabetical sequencing in sample IDs (e.g. multiple samples collected from the same timber by the dendrochronologist), can better account for intentional replication in the calculation of tree means. However, additional analyses, such as the calculation of t-values for log pairings (Rochner et al., 2017) are also necessary to account for unintentional replication (e.g. unwittingly sampling and assigning unique IDs to multiple timbers that were segmented from the same tree by the builder – e.g. basal and distal ends of trees). These metadata should be included where tree-ring datasets are made publicly available, such as through the ITRDB, and should not be built into the naming convention for historic-timber series. We also recommend a convention for designating historic-timber from live-tree datasets on the ITRDB.
Rather than serve as a disincentive to perform dendroarchaeological analyses for applications beyond historic or archaeological dating, we suggest that the important caveats highlighted by this study motivate expansion into new areas. For example, the extension of tree-ring networks into spatial data gaps (e.g. North Carolina Piedmont, Figure 1) has the potential to deepen the temporal coverage of tree-ring records for specific regions. Additionally, we advocate for the continued advancement of dendroarchaeology alongside developing frontiers in tree-ring science (Domínguez-Delmás, 2020; Pearl et al., 2020). Here, we found climate sensitive tree-ring widths in HT data, but the collection of new metrics from HT tree rings (e.g. isotopes, blue intensity) may even better support the inclusion of HT data in ecological and climatological applications. For example, additional tree-ring metrics, such as tree-ring stable isotopes, can be valuable tools for dating wood across different tree species (e.g. Loader et al., 2021), supporting the dating of structures where same-species references are not available, such as for American chestnut.
Finally, we strongly encourage dendroarchaeologists to make their data publicly available. This paper resulted in 21 new historic-timber chronologies added to the ITRDB, including datasets that were not previously shared despite being available for over a decade. Making datasets like these publicly available is important to the continued advancement of dendrochronology because it furthers the expansion of tree-ring networks into spatial data gaps, provides reference chronologies needed to date disappearing resources, and increases accessibility for students and early-career tree-ring scientists.
Supplemental Material
sj-docx-1-hol-10.1177_09596836231200437 – Supplemental material for Comparing the impact of live-tree versus historic-timber data on palaeoenvironmental inferences in tree-ring science, eastern North America
Supplemental material, sj-docx-1-hol-10.1177_09596836231200437 for Comparing the impact of live-tree versus historic-timber data on palaeoenvironmental inferences in tree-ring science, eastern North America by Kristen de Graauw, Maegen Rochner, Saskia van de Gevel, Lauren Stachowiak, Savannah Collins-Key, Joseph Henderson, Zachary Merrill and Amy Hessl in The Holocene
Footnotes
Acknowledgements
Multiple historic-timber datasets were made available through collaborations with, and permissions from former and current members of the Environmental Change Laboratory (ECL), formerly the Laboratory of Tree-Ring Science, at the University of Tennessee Knoxville. These datasets were not previously shared on any public, open-access platform and in threat of being lost despite being available for decades. These datasets were used with permission from data owners and lead authors on related publications resulting from historic timbers projects completed by the ECL across the southeast; we thank these authors: Laura Smith, Daniel Lewis, Whitney Emch, Justin Hart, David Mann and Daniel Brock for agreeing to the use of their data on this project. Additional data contributors are included as co-authors on this manuscript and participated in data generation and manuscript editing. We thank Curtis Cox and Robert Brown of Eastern Kentucky University’s Division of Natural Areas and the Lilley Cornett Woods Appalachian Ecological Research Station for permission to sample and field assistance in the collection of tree-ring data from the Lilley Cornett Cabin (HT_LilleyCornett, ![]() , available online).
, available online).
Data availability statement
Tree-ring data are available on the International Tree Ring Data Bank (ITRDB; see Supplemental Table 1, available online).
Funding
The author(s) received no financial support for the research, authorship, and/or publication of this article.
Supplemental material
Supplemental material for this article is available online.
References
Supplementary Material
Please find the following supplemental material available below.
For Open Access articles published under a Creative Commons License, all supplemental material carries the same license as the article it is associated with.
For non-Open Access articles published, all supplemental material carries a non-exclusive license, and permission requests for re-use of supplemental material or any part of supplemental material shall be sent directly to the copyright owner as specified in the copyright notice associated with the article.