
Abstract
This study was conducted in the Middle Branch of Bue Marino Cave (Sardinia, Italy) to reconstruct paleoecological conditions during the Holocene through microfaunal proxies in seven surface sediment samples and a short sediment core (BMD-2018, 18 cm), all collected in 2018 and another core sampled in 2021 (BMD-2021, 28 cm). The first attempt at dating cave sediment through luminescence was conducted on BMD-2021; the derived age was 6.04 ± 0.47 ka at 18 cm depth. Although continuous sedimentation and constant rates are not probable in the cave, this indicates that the sedimentary record dates to the early times after the Holocene flooding of the cave by the sea. Benthic foraminifera and grain size were analyzed in all surface samples and core BMD-2018, while only benthic foraminifera were studied in BMD-2021. The recent foraminiferal assemblages, studied from an ecological point of view, were applied as modern analog to reconstruct the paleoecological conditions in sediment cores. Significant changes in the sedimentary environment were excluded; the two cores showed a similar foraminiferal turnover at a similar depth, from an older assemblage with prevailing indifferent Ammonia inflata to a younger one with prevailing opportunist Eggerelloides advena. This turnover was attributed to changes in the amount and/or quality of available nutrients. Based on these results, this event is likely related to possibly attributable to the effects of climate changes that occurred in the Holocene. However, more extensive studies are necessary to better understand the effects of the climatic/environmental events in the Late-Holocene in the caves. Although it represents a first attempt at paleoenvironmental reconstruction based on sediments from a Mediterranean marine cave, this study demonstrated that benthic foraminifera are refined paleoenvironmental proxies and that the integrated approach with the luminescence dating produces reliable results for studying the effects of global changes in these environments.
Keywords
Introduction
Marine caves are formed by karst activity due to freshwater dissolution processes along coastal environments (Romano et al., 2022) and by combining sea level changes and tectonic movements (Antonioli et al., 2004; D’Angeli et al., 2015; Florea and Vacher, 2006). Their position at the edge between the terrestrial and marine domains makes them a powerful marker of the short (seasonal, annual) and long (millennial) term environmental changes through cave sediments and living organisms (Brankovits et al., 2021; Gerovasileiou et al., 2021).
Benthic foraminifera have been extensively studied in the submerged caves of Bermuda Archipelago (North Atlantic Ocean) and Sardinia Island (Tyrrhenian Sea), demonstrating their reliability as environmental indicators of the different cave habitats (Cresswell and van Hengstum, 2022; van Hengstum and Scott, 2011). Paleoenvironmental reconstructions based on benthic foraminifera from sediment cores indicated that these communities are primarily controlled by groundwater salinity changes and secondarily by the supply of organic carbon (Brankovits et al., 2021; Cresswell and van Hengstum, 2022). Moreover, the sedimentological aspects of cave sediments (clastic and chemical) have been recognized as of scientific interest for hydrogeological and paleoclimatological records (van Hengstum et al., 2010). Therefore, sedimentological aspects combined with benthic organisms can be used to reconstruct past climatic and environmental conditions changes (Omori et al., 2010; Rosso et al., 2015) or for the assessment of the present-day ones (Gerovasileiou and Voultsiadou, 2016; Gerovasileiou et al., 2015; Romano et al., 2023; Rosso et al., 2013). However, interest in marine caves as paleoclimate archives is strictly linked to the feasibility of dating methods for assigning absolute ages to cave sediment deposition. Among all dating methods, luminescence dates the last exposition to the sunlight of minerals such as quartz and feldspar before burial and, thus, the deposition time (Lian and Roberts, 2006). The method has been successfully applied to Holocene to Middle Pleistocene Sardinian deposits using quartz and potassium-rich feldspar (K-feldspar) minerals (Casini et al., 2020; Cocco et al., 2019; Pascucci et al., 2014, 2022; Sechi et al., 2013, 2018a, 2018b, 2020, 2023; Zucca et al., 2014). Recently, Andreucci et al. (2017) successfully applied the luminescence method to date wind blow sediment filling the Bue Marino cave, which is part of a vast karst complex of the Gulf of Orosei. In particular, luminescence yield ages agreed with U/Th-series data obtained by cave flowstone. However, it remains challenging to date sediment trapped in the submerged part of the cave.
This study aims to carry out a paleoenvironmental reconstruction using an integrated approach based on benthic foraminiferal ecology associated with sediment dating through the luminescence method, which has never been attempted before in a cave environment. This could allow us to recognize the effects of climate changes in cave environments that are suitable sites for studying sea-level changes due to their position at the boundary between marine and continental realms.
Study area
The study area is in the Gulf of Orosei (East Sardinia Island, Italy), where a large karst domain part of the Supramonte karst plateau characterizes the inland of the gulf (Figure 1). This karst system is formed by the combination of coastal processes (action of waves on structurally weak areas) combined with the dissolution of carbonates due to the mixing of fresh and salt waters (D’Angeli et al., 2015 and references therein). It developed within the Mesozoic Limestone, which suffered the Quaternary climatic and sea level fluctuation, which determined an intense erosion leading to the development of coastal apron-alluvial fan systems (Pascucci et al., 2022) and the formation of numerous underground cavities (Cabras et al., 2008).
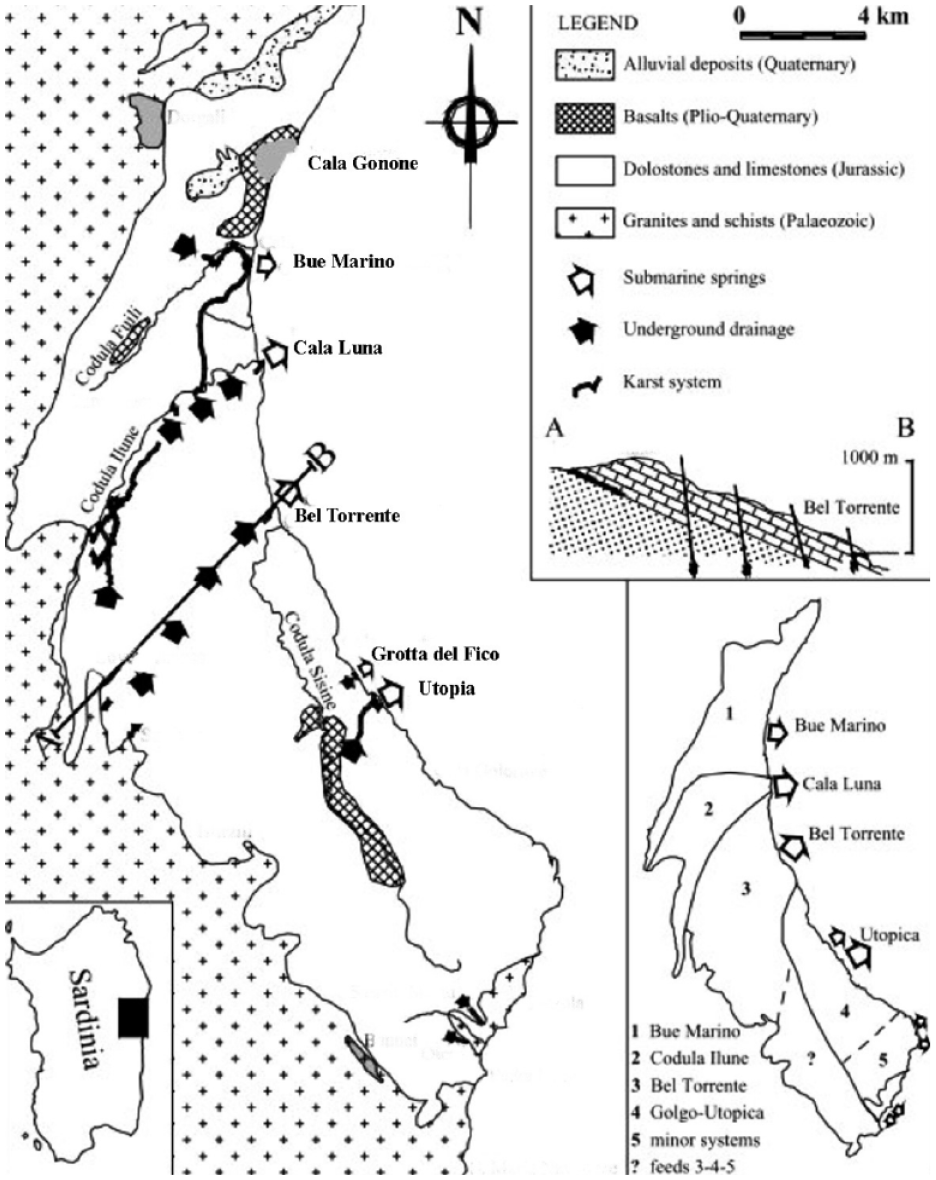
Study area – geological and hydrogeological settings (Romano et al., 2021).
Sinkholes and dry canyons (codula), active only during heavy rainfalls, are the more common karst landforms on the mainland (Romano et al., 2022). A combination of rock dissolution and structural weakness forms extensive submarine caves such as Bue Marino cave, Cala Luna spring, Bel Torrente spring, and Fico and Utopia caves (Romano et al., 2020). The system is strictly connected to the superficial hydrographic network, which feeds fresh water, sediment, and organic matter during rainy periods. Most of the coastal sector of the caves has been studied to characterize the foraminiferal faunas and single out the ecozones. These are characterized by a faunal change of prevailingly calcareous to agglutinated assemblages from the outer to the inner sector, linked to decreased salinity and pH (Bergamin et al., 2018; Romano et al., 2018a).
The Bue Marino cave
The Bue Marino cave system (Figure 2) extends for over 70 km and can be divided into three main branches with different hydrogeological characteristics: the north, middle, and south (Figure 2). Most of these have large dimensions (10 m mean diameter) and developed close to the present sea level reaching the maximum depth of 43 m in one of the sumps of the North Branch (Bergamin et al., 2018). It is characterized by large fossil tunnels where marine notches mark a higher sea level than today. The active part of this branch consists of a complex of galleries, largely flooded, which develops for about 7 km, and drains the waters from the Codula Fuili (Romano et al., 2021). The Middle Branch extends for a total of 5.5 km, and although it is probably connected to some minor wells in the Codula Ilune, it is still unknown from the hydrogeological point of view (Sanna and De Waele, 2010). Finally, the South Branch has the largest conduit and a very low base flow (a few liters per second), even though it carries large volumes of freshwater originating in the Codula Ilune during heavy rainfall (Romano et al., 2022). The three branches then merge near the coast at the cave entrance.
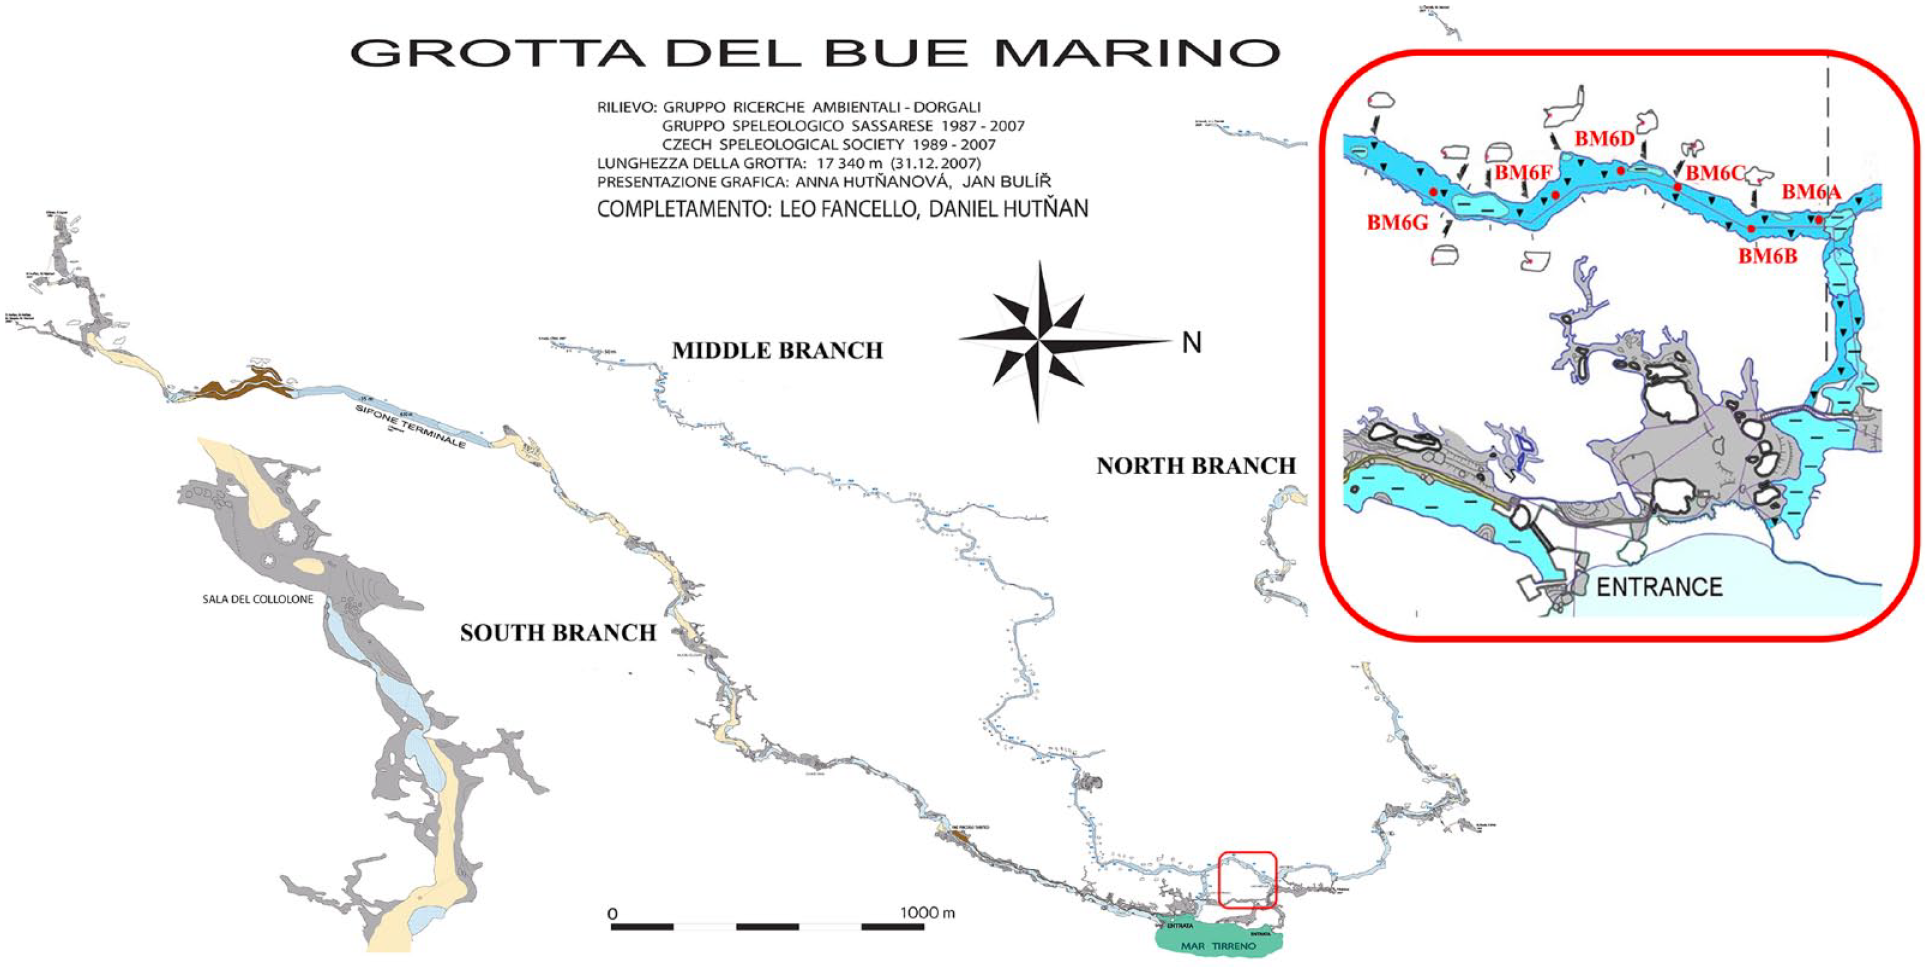
Sampling stations in the Middle Branch of Bue Marino cave (modified from Romano et al., 2021).
Meteo climatic conditions
In earlier decades (from the 1960s to the early 2000s), the rainfalls were mainly concentrated between October and January, with annual averages ranging between 700 and 900 mm (Bodini and Cossu, 2008; Maxia et al., 2003). In the period between 2014 and 2016, mean annual values varied between 160 and 314 mm (Romano et al., 2021), with more significant rainfalls concentrated in the February–April (187–366 mm) and October–December (231–731 mm) periods. The maximum rainfall rate occurred from December 2016 to January 2017, while the whole of 2017 was drier, and after this period, the highest rainfall was recorded in May 2018.
Material and methods
Water and sediment sampling
The sampling campaign was carried out in the Middle Branch in July 2018. The water parameters were collected along with surface sediment samples (0–2 cm) and core sediment. After a preliminary survey, the water and sediment samples were manually collected with the support of divers from Global Underwater Explorers (GUE) from seven stations (6A–6G) along a georeferenced line 30 m from each other (Figure 2). A core 18 cm long (BMD-2018) was also sampled in correspondence with station 6D and subsampled by extrusion for grain size and foraminiferal analyses (Figure 2).
At each station, water depth was registered by a gage (no name product, accuracy ±0.1 m). The water samples were taken at the water-sediment interface and immediately subjected to measurement of temperature (T), salinity (Sal), and pH by a multiparameter probe with a precision of ±0.15°C; Sal ± 2; pH ± 0.02 (Hanna HI 9828, Hanna Instruments, Woonsocket, RI). The superficial sediment samples were analyzed for grain size and benthic foraminifera; the last ones were stained after sampling with ethanol and Rose Bengal solution (2 g/L) (Schönfeld et al., 2012; Walton, 1952).
For sediment dating, an additional 28 cm long sediment core (BMD-2021) was sampled in July 2021 in the same station in 2018 and too subsampled by extrusion for benthic foraminiferal analysis.
Sediment analysis
Grain size analysis was carried out following the procedure described by Romano et al. (2018b). First, a pre-treatment of the samples with a solution of hydrogen peroxide (30%) and distilled water (1:3) was carried out to remove salts and organic matter, and then, the sediment was wet separated using a 63 μm ASTM series mesh sieve. Next, the coarse fraction (>63 μm) was screened using sieves between −1 and +4ϕ, while the fine fraction (<63 μm) was analyzed with an X-ray sedigraph (Sympatech Helos). The main grain size classes were used to determine the sediment type, according to Shepard’s (1954) ternary classification. The fraction >63 μm was observed under a stereomicroscope for a qualitative analysis of the inorganic and biogenic components.
Luminescence dating
From core BMD-2021, one sample at −18 cm from the top was taken for luminescence dating. All procedures were performed at the Luminescence dating laboratory of the University of Sassari. The core opening, sampling, and preparation were performed under subdued red light. The sample (BMD1) was collected by avoiding contact with core walls to exclude potential mixed sediment due to coring, and the material surrounding the sampling zone was taken for dose rate determination.
Given the high content of silt material, the fine grain (4–11 µm) polymineral mixture fraction has been extracted according to standard procedure. The material was firstly treated with HCl (40%), H2O2 (30%), and Na2C2O4 to dissolve carbonate, organic matter, and clay aggregate, and the fine-grain polymineral mixture was separated by Stokes settling separation. The fine-grained quartz was isolated from a portion of the total extracted polymineral material by immersing a part material in 35% hexafluorosilicic (H2SiF6) acid for 3 days. The quartz grains were subsequently rinsed to remove fluorides with a 30% HCl solution (Murray et al., 2012). All luminescence measurements were performed with automated Risø DA-20 TL/OSL readers with a calibrated beta source for stainless steel cups. Laboratory irradiations were performed using the incorporated 90Sr-90Y radioactive source calibrated (0.0916 Gy/s) with gamma-irradiated calibration quartz (Hansen et al., 2015). Blue light-emitting diodes (LED) (470 nm; ~80 mW/cm2) were used to stimulate the quartz samples and signals collected through a 7.5 mm UV filter (Hoya U-340). The K-feldspar IRSL signal was stimulated with IR LEDs (870 nm; ~135 mW/cm2) and detected through a blue filter combination (Schott BG-39 and Corning 7-59). Considering possible bias in the calibration of the laboratory beta source for the Equivalent dose (De) measurements (Galbraith and Roberts, 2012), a systematic error of 2% was added in quadrature to the measurement errors.
Both quartz and mixed polymineral fine-grained fractions were settled on 9.8 mm stainless steel cups with acetone (~2 mg/mL) using a pipette. Quartz and polymineral mixture (K-feldspar) were measured respectively using the standard SAR protocol (Wintle and Murray, 2006) and the modified pIRIR140 protocol based on Reimann and Tsukamoto (2012). For quartz OSL-signal, the luminescence intensities were derived from the initial 2 s subtracting the following 10 s (early background) and for K-feldspar signal by the initial 5 s minus the last 30 s (late background). The dose-response curve (DRC) for De calculation was fitted with a single saturating exponential function. The performance of the chosen protocols and the quality of measurements were monitored through dose recovery tests and standard aliquot rejection criteria: (i) recycling ratio (ratio between two identical regeneration points); (ii) recuperation (signal from a zero-dose regeneration point); and (iii) natural signal <3σ above background (Wintle and Murray, 2006).
The concentration of potassium (K), Thorium (Th), and Uranium (U), reported in Table 1, were determined on pressed powder pellets using a wavelength dispersive X-ray fluorescence (XRF) spectrometer, Panalytical Axios 4000, equipped with an Rh tube at the XRF laboratory of BiGeA performed at the University of Bologna. The reproducibility of potassium was generally better than 3%, while it was better than 10% on average for trace elements.
Summary of dry and total dose rate.
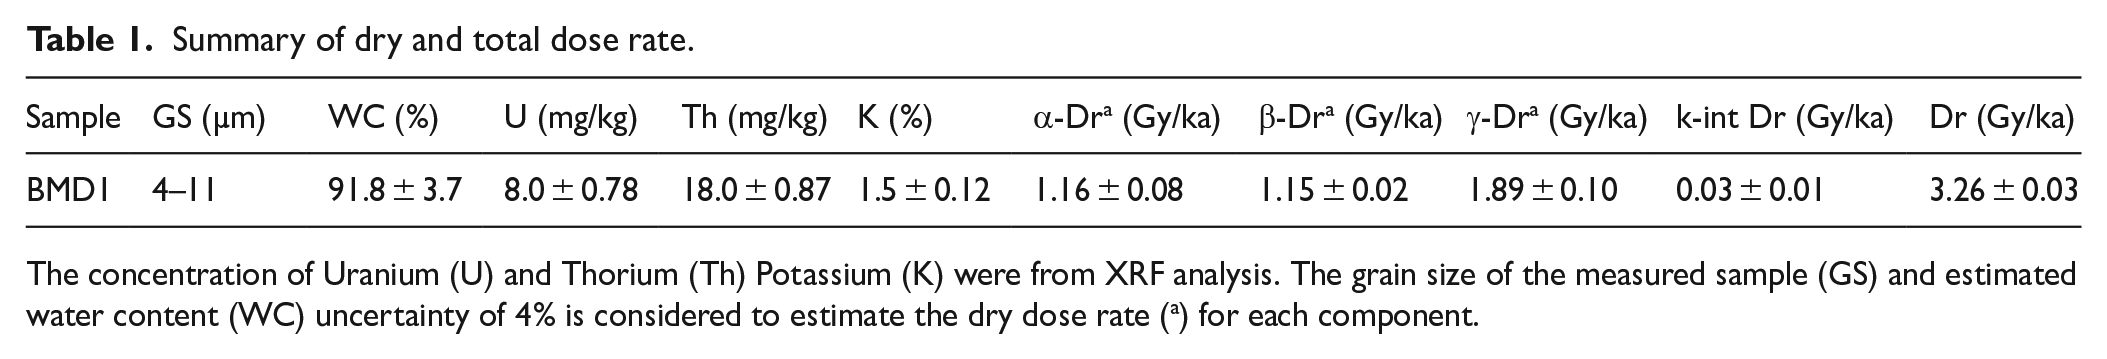
The concentration of Uranium (U) and Thorium (Th) Potassium (K) were from XRF analysis. The grain size of the measured sample (GS) and estimated water content (WC) uncertainty of 4% is considered to estimate the dry dose rate (a) for each component.
The external gamma dose rates were calculated based on the conversion factors of Guérin et al. (2011) for U and Th and K on Cresswell et al. (2018). Beta attenuation for grain size was based on Guérin et al. (2012). The cosmic dose rate contribution is considered negligible due to cave wall shielding. The sample was considered completely saturated during burial time, and a water saturation value (92% ± 4%) for moisture correction was used. For feldspar beta dose rate calculations, an internal potassium content of 12.5% ± 0.5% (Huntley and Baril, 1997), a rubidium content of 400 ± 100 ppm (Huntley and Hancock, 2001), and an α-value of 0.09 ± 0.02 were used (Table 1).
Benthic foraminiferal analysis
Foraminiferal analysis was conducted over the dry residue under a stereomicroscope (Leica M205C, Germany). After a preliminary check of faunal abundance, when necessary, it was divided into representative aliquots of the whole sample using a microsplitter; all benthic foraminifera from one of these aliquots were counted and classified. The quantitative analysis was separately conducted on living (Rose Bengal stained) and dead assemblages. For the count of dead specimens, only well-preserved tests were picked, counted, and identified to prevent the inclusion of reworked or transported tests. The identification at the genus level was carried out according to Loeblich and Tappan (1987), while species were determined following some important studies for the Mediterranean area (Cimerman and Langer, 1991; Sgarrella and Moncharmont-Zei, 1993) and according to the World Modern Foraminifera Database (Hayward et al., 2011). Only the species with at least one individual in the living assemblage of at least one sample were considered autochthonous and considered for statistical purposes (van Hengstum and Scott, 2011).
The specific diversity was calculated using the Shannon index (H) (Shannon, 1948), which considers the abundance and heterogeneity of a species within the sample, and the Fisher α-index (Fisher et al., 1943), which considers all species, including the rare ones. Furthermore, the Dominance (D) has been determined because environments affected by stress, such as marine caves, can be characterized by assemblages with low diversity and high dominance of one or a few species (Magurran, 2004). These parameters were calculated with the PAST, the paleontological STatistic software package – version 4.11 (Hammer and Harper, 2006; Hammer et al., 2001).
Statistical analysis
A multivariate analysis was carried out on three sets of foraminiferal data: one was constituted by results of cores to investigate the factors determining the faunal changes along depth; the other one included all the results from both surface and core samples to compare the recent total and subfossil assemblages, using the first ones as modern analogs. For this purpose, data concerning total (living + dead) assemblages were considered for surface samples, and the matrix was constituted by the relative abundance of commonly occurring taxa (>5% in at least one sample). More in detail, data from surface samples were processed using two-way hierarchical cluster analysis (HCA) to identify groups of samples with similar faunal content corresponding to distinct assemblages (Scott et al., 2001). The Euclidean distance coefficient was applied to compare samples and Ward’s method to define clusters (Hammer et al., 2001; Parker and Arnold, 1999). Normalized foraminiferal data from the two cores, BMD-2018 and BMD-2021, were processed using principal component analysis (PCA) to describe the faunal changes along with depth plotting of the factor scores (Bergamin et al., 2021). The cross-correlation was applied to the two series of the first component of the PCA (PC1) to demonstrate the correlation of the faunal changes between the two cores considering a possible vertical displacement (Davis, 1986; Rose and Harlock, 1999) and, consequently, the validity of the results from luminescence dating carried out for BMD-2021 also for BMD-2018. Finally, a PCA was applied to normalized foraminiferal data (commonly occurring taxa) from surface samples and core BMD-2018 and to data from surface samples collected in 2016, studied by Romano et al. (2021) to define the paleoecological significance of core assemblage based on the modern analogs. As for diversity indices, the statistical analyses have been carried out using PAST software (Hammer et al., 2001; Parker and Arnold, 1999).
Results
Water parameters
Almost all the water parameters collected in August 2018 in the Middle Branch displayed nearly constant values (Table 2): Temperature (T) ranged from 23.5°C to 24.1°C in BM6E and BM6B, respectively; Salinity (Sal) varied between 40.7 in BM6E and 41.7 in BM6B; pH was between 8.50 in BM6B and 8.56 in BM6C and BM6G.
Water depth, temperature, salinity, and pH of the sampling stations.
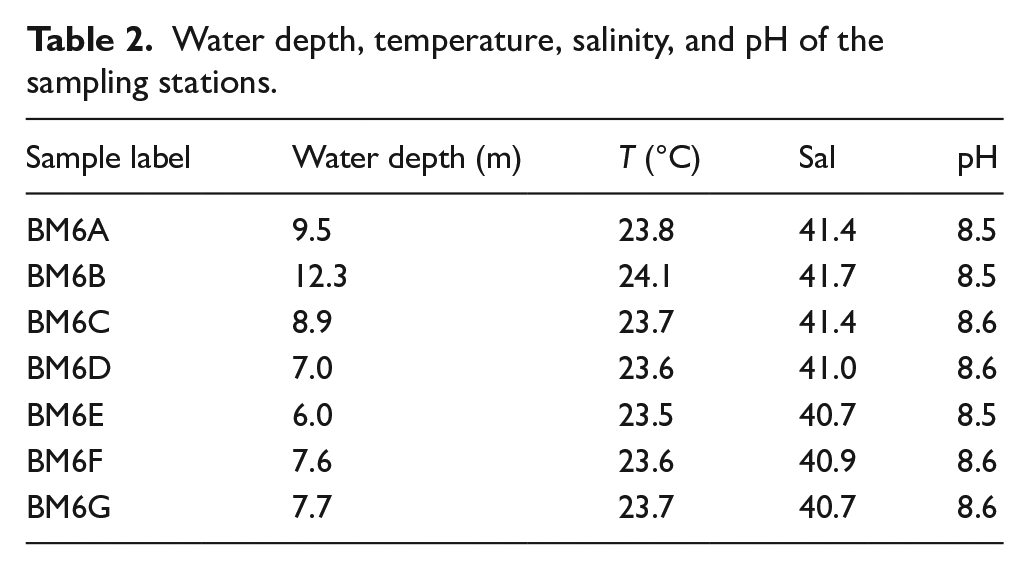
Salinity values above 40 pointed to hypersaline conditions, considering that during the sampling period, the mean seawater salinity in the Gulf of Orosei, close to the cave entrance, was 38.2 (Escudier et al., 2020). No distinct patterns were evident from the outer to the inner station, while S and T were strongly correlated between them (r = 0.83, p = 0.0020) and with water depth (r = 0.90, p = 0.005; r = 0.98, p = 0.0001, respectively).
Grain size
The grain size analysis of surface sediments showed that sand was almost always prevalent, showing an average value of 40.8% with a maximum of 63.3% in BM6G. As regards the fine component, the silty fraction (average 34.8%) was prevalent compared to clay (average 14.2%), reaching its maximum in BM6D (46.5%). On the other hand, gravel was generally very scarce except for BM6A (16.4%) and BM6B (64.5%), even if mainly represented by bioclasts. Overall, surface sediments were classified as silty sand or sandy silt, except for sample BM6B, classified as sand (Table 3).
Results of grain size analysis on surface and core samples.
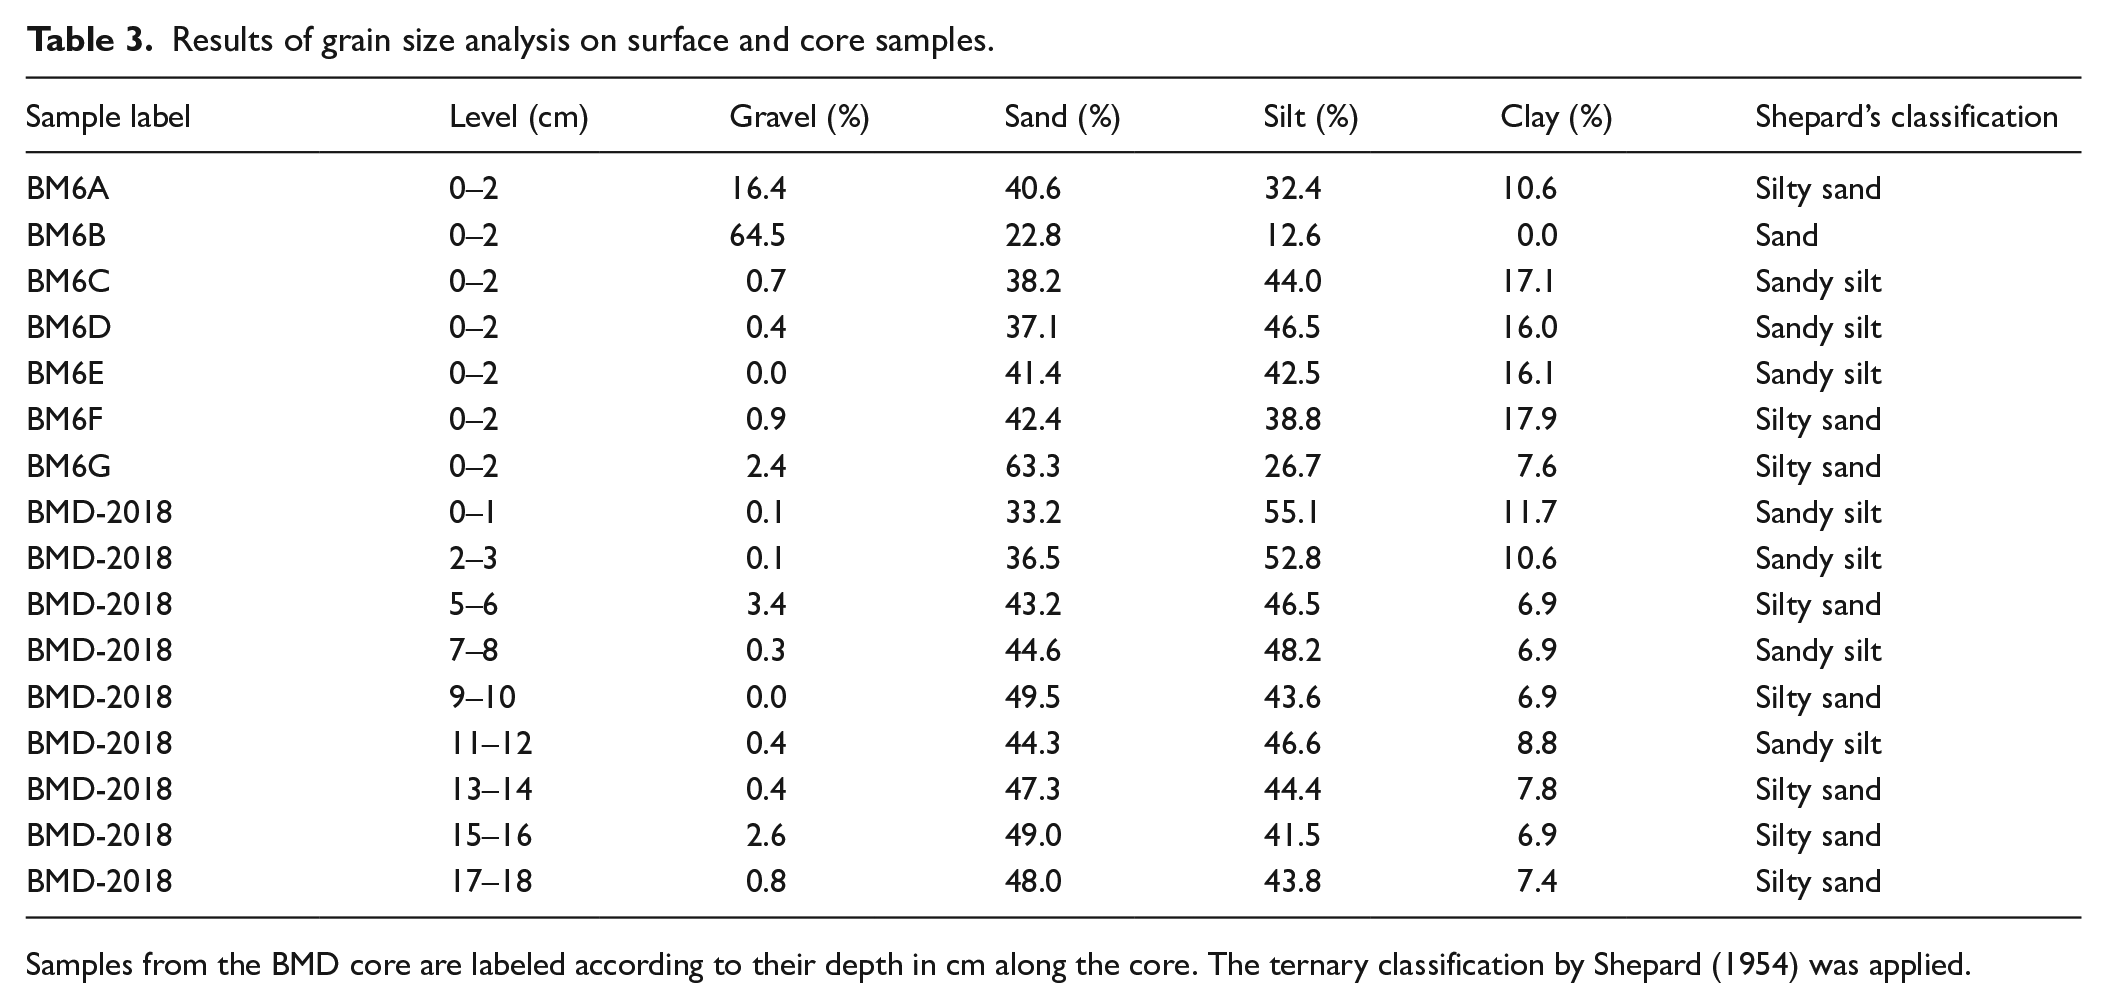
Samples from the BMD core are labeled according to their depth in cm along the core. The ternary classification by Shepard (1954) was applied.
Samples from core BMD-2018 were all very similar to the surface ones, with silt as the prevailing fraction, followed by sand (averages 47.0% and 43.9%, respectively); clay was relatively scarce, with the highest value (11.7%) at the core top, while gravel was nearly absent, except for the levels 5–6 cm and 15–16 cm where it accounted for 3.4% and 2.6%, respectively. A general pattern toward coarser sediments was recognizable from top to bottom due to decreased silt and clay and increased sand, which showed the lowest value at the core top (33.2%).
The qualitative stereomicroscope analysis highlighted a predominant organogenic component for surface and core samples (abundant plant debris, fecal pellets, shells, fragments of bivalves, gastropods, echinids, annelids, ostracods, foraminifera) and the presence of gray-brown-granules of variable texture from fine to very fine (Figure 3). Coarse bioclasts of marine mollusks were found very abundant in BM6B and BM6A, but also in the levels 5–6 cm and 15–16 cm as part of the gravelly fraction. The abiotic component was constituted by prevalent quartz grains, while plagioclase, K-feldspar, biotite, muscovite, calcite, pyroxenes, and amphiboles are present in a subordinate way.
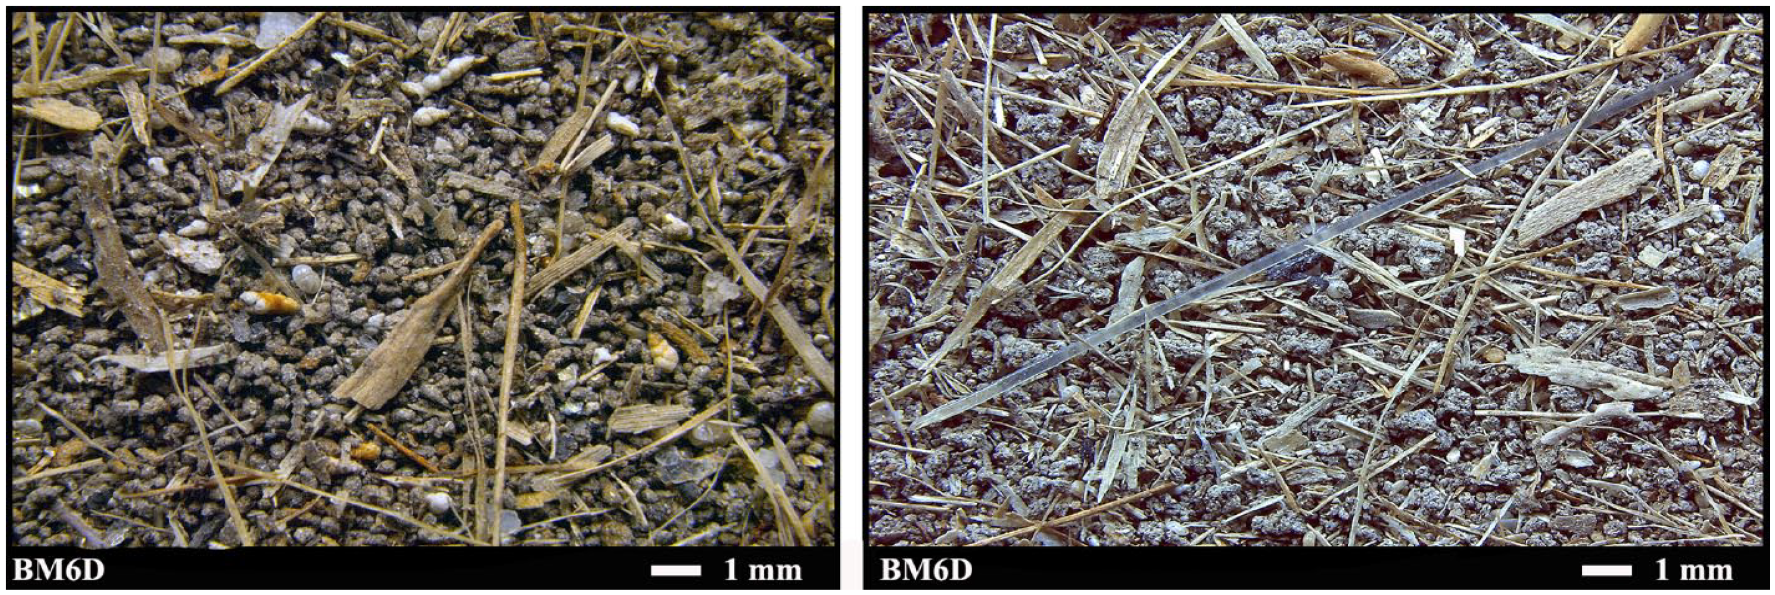
Textural characteristics of superficial levels from the two sediment cores collected in 2018 (left) and 2021 (right).
Luminescence results
The preliminary IR depletion test was conducted on quartz material to test for residual feldspar contamination. A less than 1% feldspar contamination and a depletion ratio close to the unity IR/OSL depletion ratio, 0.99; Duller (2003) support a quartz purity and insignificant IR-sensitive feldspar contributions to the net OSL decay signal. Due to the expected Holocene ages of the sample, the applied luminescence protocol on fine-grained quartz was a modified low-temperature SAR protocol set (Madsen and Murray, 2009) with a low preheating of 220°C and cut heat at 200°C. Despite the dosimeter possessing a fast-dominated shine-down curve (depletion of signal in the first 2 s of stimulation), good recycling (close to unity), and recovery (less than 5% of natural), the estimated natural equivalent dose (De) resulted close to the saturation limit (close to 85% of 2Do). Therefore, quartz grains were unsuitable for dating and were not further analyzed (Wintle and Murray, 2006) (Figure 4a).
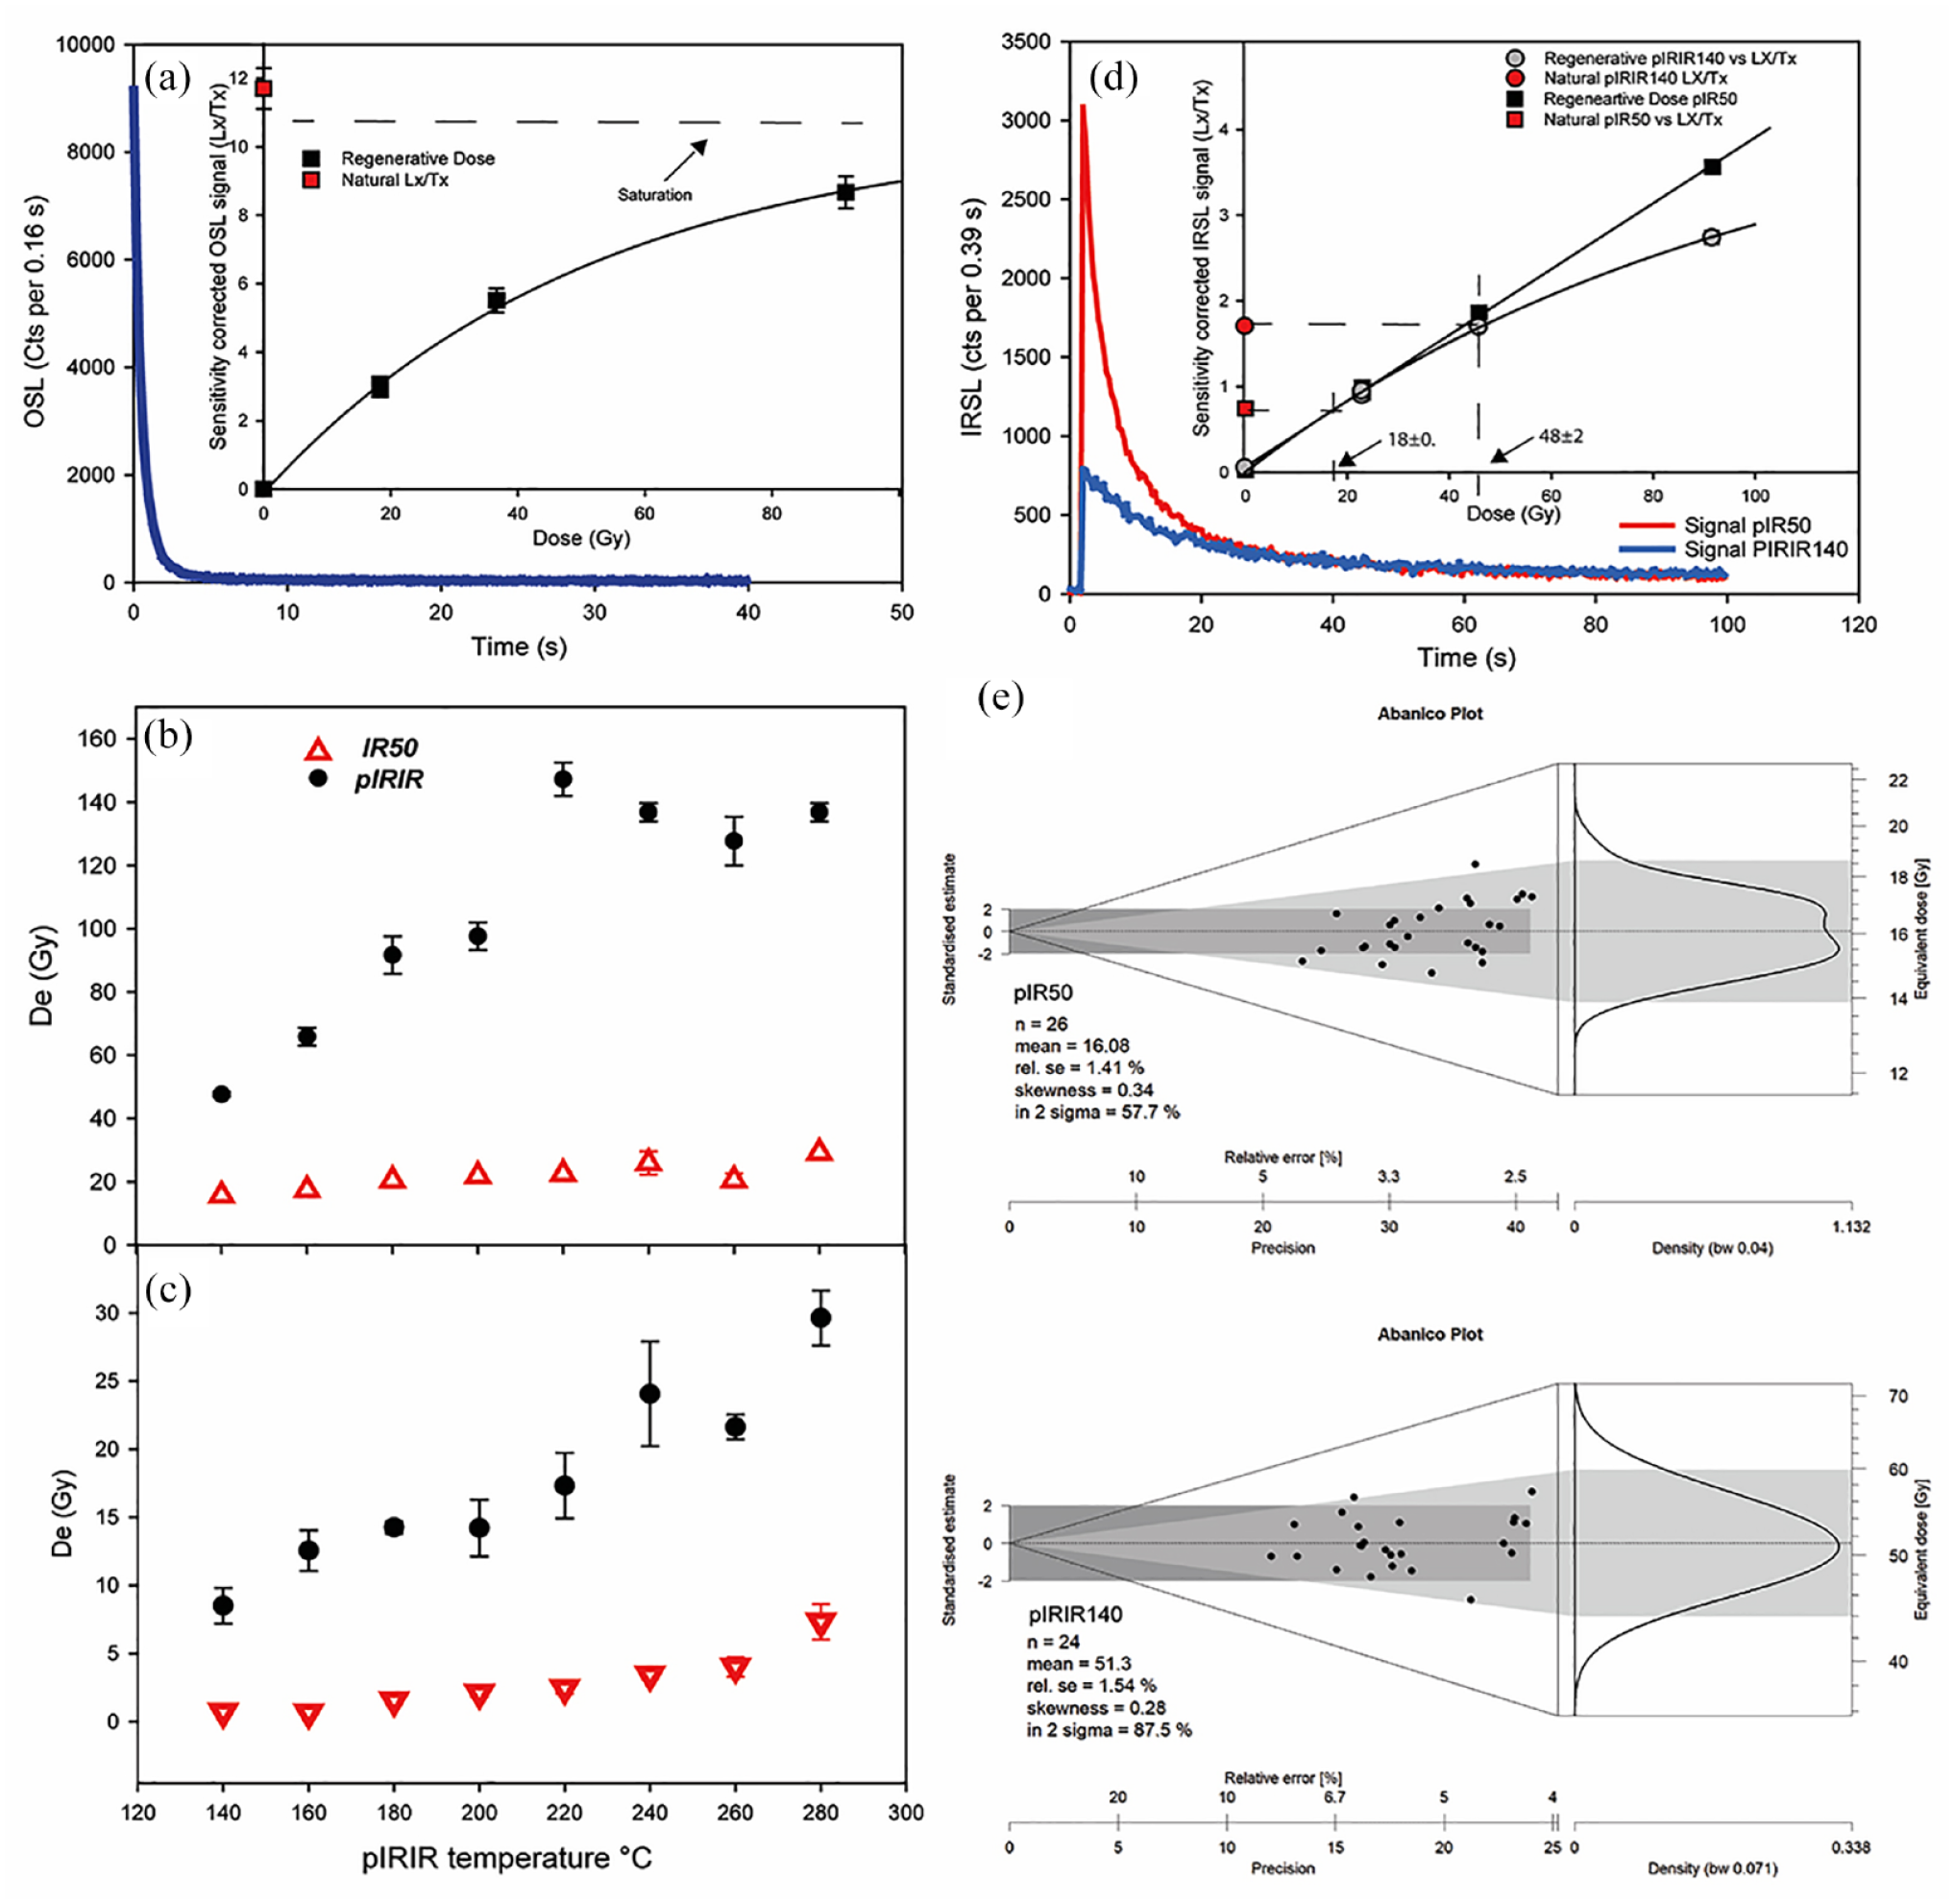
(a) OSL fast component-dominated luminescence decay from an aliquot of sample. Inset shows SAR dose–response growth curve. A repeated point and a zero-dose point are also shown. The red square shows the natural signal Lx/Tx, while the dashed line shows the saturation limit. (b) Result of preheat plateau test for pIRIR signal on 24 aliquots. (c) Result of thermal transfer (TT) test on 24 natural bleached aliquots and residual luminescence signal measured in the same temperature range as for the preheat plateau tests. (d) PIRIR140 and pIR50 luminescence signals decay from an aliquot of sample. The inset shows dose–response growth curve for both signals. A repeated point and a zero-dose point are also shown. The red square shows the natural signal Lx/Tx, while the dashed line shows the fitted De. (e) Abanico plots showing De values determined using pIR50 and pIRIR140 dating for luminescence sample.
The appropriate thermal treatment for the pIRIR protocol was decided based on preheat plateau test (Figure 4). Preheat was increased by 20°C for each step (four aliquots) up to 280°C, and the first IR stimulation was kept at 50°C (pIR50), and the second IR stimulation (pIRIR) temperature at 20°C less than respectively preheat temperature (Zhang et al., 2015). The mean De values obtained for the pIR50 and pIRIR signals for the sample are plotted against the preheat temperature in Figure 4b.
The pIR50 De is independent of the preheat temperature and shows a plateau for all preheat temperatures with a mean value of ~20 Gy, while pIRIR De systematically increases with temperatures toward 200°C, a plateau between 220°C and 280°C can be observed (Figure 4b).
For very young samples, keeping the temperature as low as possible is crucial to avoid the thermal transfer (retrapping of charge during heating) on the natural De, which can cause an equivalent dose overestimation (Madsen et al., 2011). It is known that the pIR50 signal bleaches (fully depopulate the luminescence traps involved) faster than respective pIRIR, and at higher preheat and stimulation temperatures, the pIRIR signals are harder to bleach and usually have high residual dose but less fading (Reimann and Tsukamoto, 2012; Thomsen et al., 2008). The absence of an observable natural De plateau at low temperatures for pIRIR protocol and the large offset between pIR50 and pIRIR De suggests a likely combination of the thermal instability and the likely incomplete bleaching of the pIRIR signals with respect pIR50.
To investigate this, 24 aliquots were bleached under sunlight for 10 sunny days (Sardinia summer), and the same test was performed. Figure 4c shows negligible unbleached residual for pIR50 De and a slightly increasing of this with temperatures; in contrast to the pIR50 De, the pIRIR residual shows a systematic rise trend with increasing temperatures. Thus, to avoid the thermal effect and keep the residual low, along with using the faster bleachable signal, we apply the pIRIR140.
Figure 4d shows the DRCs of pIRIR140 and pIR50 and the respective IRSL signal shine-down curve. We first tested the dose recovery from the two signals (pIR50 and pIRIR140) by giving a laboratory-administered known dose close to natural (~50 Gy) bleached aliquots; the dose was then measured in the usual manner. The dose recovery ratio is calculated after subtracting the measured unbleachable residual from the measured dose. Satisfactory results close to 10% unity for both signals pIR50 (0.96 ± 0.02) and pIRIR140 (1.03 ± 0.05) indicate that a laboratory dose given before heating can be accurately measured. To test the athermal stability of the pIR50 and pIRIR140 fading test was performed following Auclair et al. (2003). The g2days values for the pIR50 and pIRIR140 signals were obtained by fitting a linear regression model to the sensitivity-corrected signal (Lx/Tx) as a function of the logarithmic storage time. The obtained g-values are 4.7 ± 0.07 for pIR50 and 2.44 ± 0.09%/decade for pIRIR140 (Table 4). The fading correction was performed using Huntley and Lamothe (2001) and normalized the g-value to delay time (tc) of 2 days (g2days) using the R Luminescence package (Kreutzer et al., 2012).
Equivalent dose (De), residual (Rs), and obtained luminescence ages.
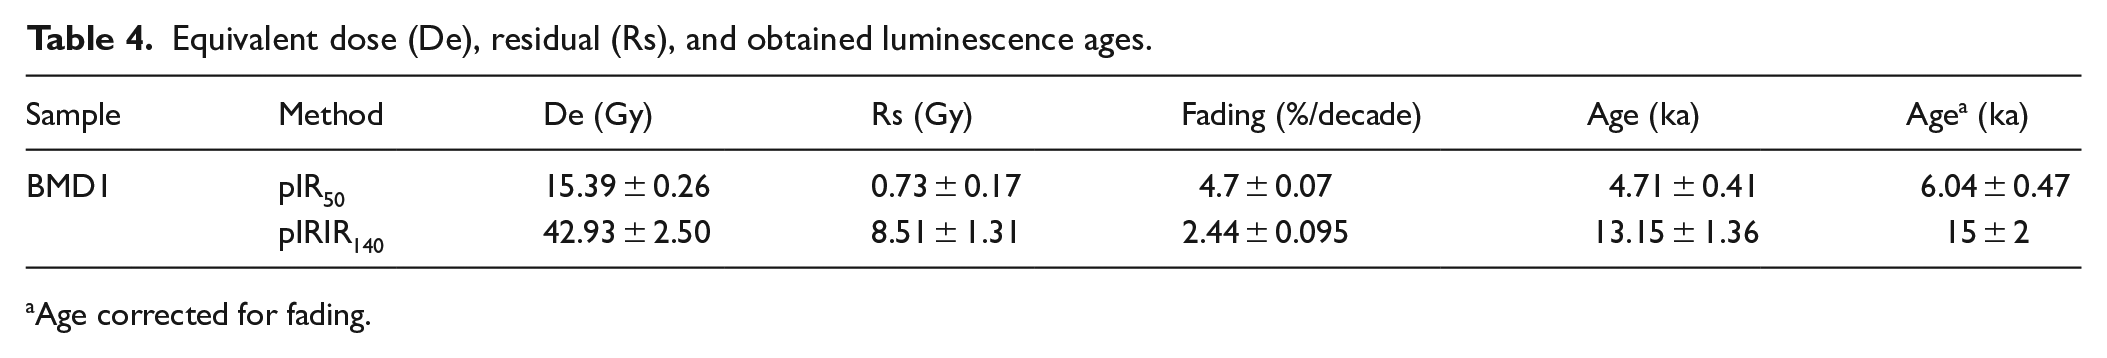
Age corrected for fading.
The shape of De dispersions and distributions, analyzed using Abanico plots (Dietze et al., 2016), do not highlight the presence of different clusters of grain De values for both signals, and in general, distributions are leptokurtic and symmetrical (skewness close to 0) with relatively low values of overdispersion of 5 (pIR50) and 6.26% (pIRIR140) respectively (Figure 4d and e).
The derived luminesce ages are 6.04 ± 0.47 ka based on faded-corrected pIR50 signal and 15 ± 2 ka (pIRIR140). The wide offset between the two presented ages can be referred to as partial bleaching, as demonstrated by Murray et al. (2012). Considering the peculiarities of this cave environment, the most reliable signal seems to be the pIR50, with a final age of 6.04 ± 0.47 ka.
Benthic foraminifera
Assemblages in the superficial sediments
Living and dead benthic foraminifera were found in all surface samples, and in both assemblages, agglutinated foraminifera were prevalent, followed by the hyaline ones, while porcelaneous species were very low in percentage and not found as living. The percentage of living specimens in the samples was generally low, ranging from 0.99% in BM6G to 12.23% in BM6C. In total, 77 species were identified, among which 24 were present with living specimens.
The dominant species, considering the absolute abundance in the total assemblage of all surface samples, were Eggerelloides advena, Ammonia inflata, and Ammonia tepida, with 1367, 497, and 334 specimens, respectively; Rosalina bradyi (167 specimens), Ammonia beccarii (124 specimens), and Cribrostomoides jeffreysii (85 specimens) were also frequent. As regards the relative abundance, the dominant species was E. advena in all the samples, ranging from 29.2% to 65.9% in BM6E and BM6C, respectively. On the other hand, A. tepida prevailed on A. inflata from BM6A to BM6D (17.2%), while A. inflata was more abundant from BM6E to BM6G, up to 35.2% in BM6F (Supplemental Material).
Despite the high number of found species, only the six mentioned above were considered as commonly occurring because >5% in at least one sample and considered for statistical analysis. The HCA identified two main clusters, A and B, constituted by samples from BM6A to BM6D and from BM6E to BM6G, respectively (Figure 5). Cluster A, which included the four samples closer to the confluence with the North Branch, was characterized by the prevalence of agglutinated specimens, due to the highest values of E. advena (median 56.6%). Ammonia tepida prevailed on A. inflata (median 10.8% and 7.9%, respectively), while other common taxa were C. jeffreysii (median 2.7%) and R. bradyi (median 2.9%). Cluster B, constituted by the three innermost samples, was characterized by a predominantly hyaline assemblage due to the highest percentages of A. inflata (median 29.6%) and R. bradyi (median 8.2%) and despite the dominance of E. advena (median 34.2%). As regards the faunal parameters, cluster A showed higher species diversity than cluster B, also considering rare species with the Fisher α-index (6.76–9.67 vs 4.79–8.38). The Shannon index (H), which considers the number of species, as well as the distribution of specimens among species, was similar in the two clusters (1.60–2.01 vs 1.59–2.10), while higher dominance (D) was recorded in cluster A (0.22–0.42) due to the uneven distribution of individuals among species, mostly for the very high percentages of E. advena.
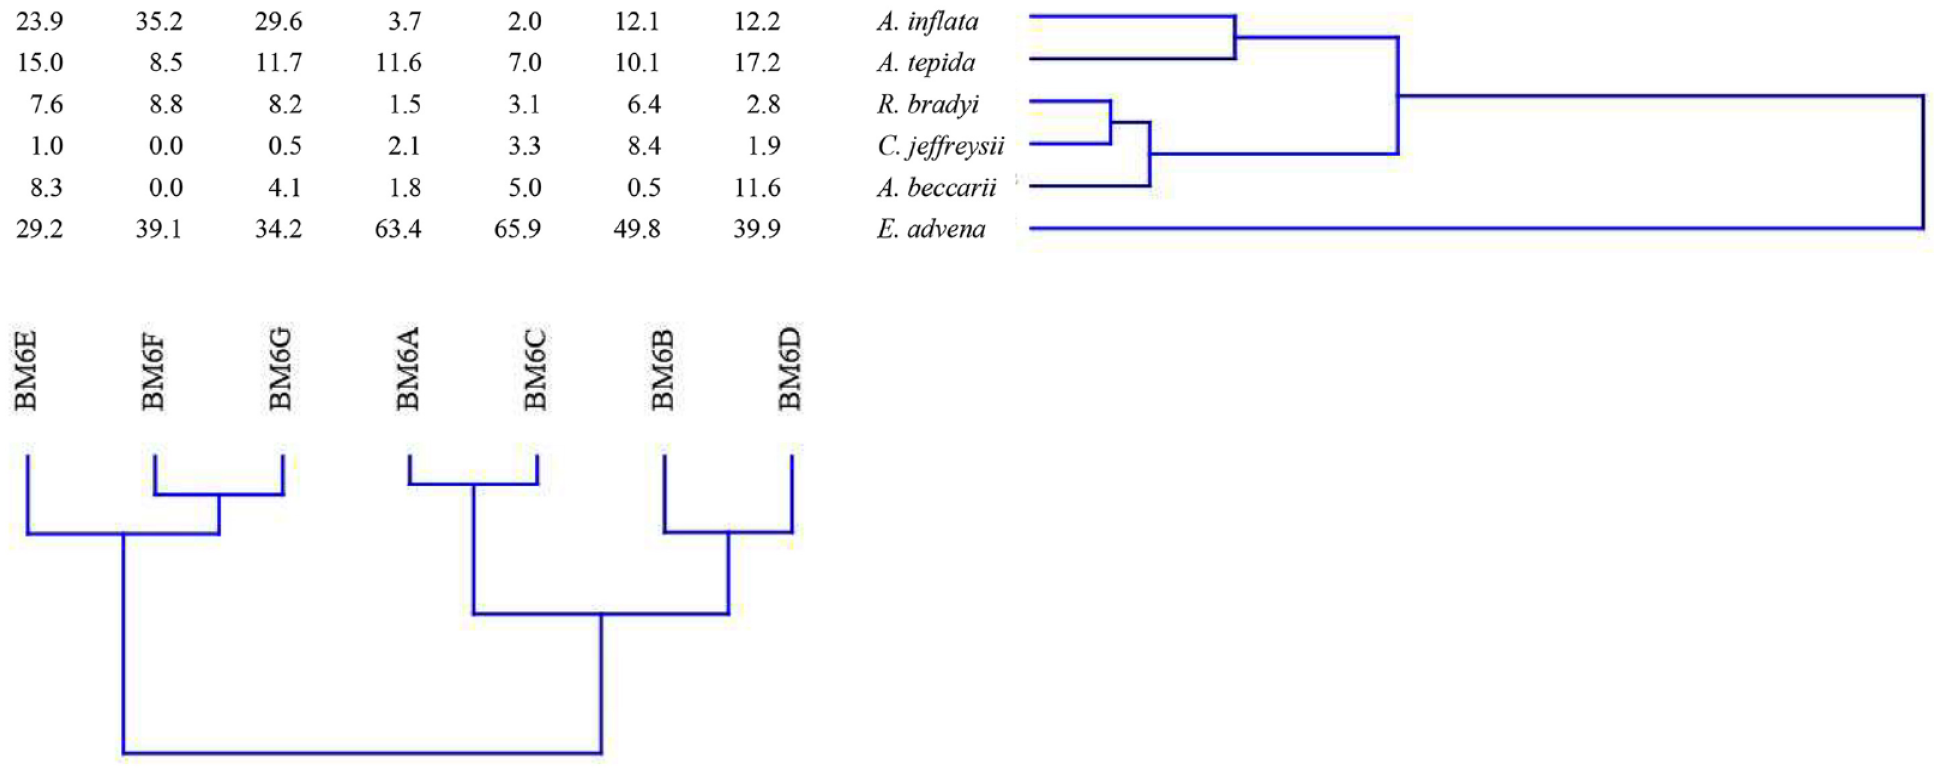
Dendrogram obtained by the two-way (Q and R-mode) HCA applied to the relative abundance of commonly occurring species of surface samples.
Assemblages in the sediment cores
Cores BMD-2018 and BMD-2021 showed high similarity as regards the main faunal characteristics. The three most abundant species in both cores were E. advena, A. tepida, and A. inflata. In BMD-2018 their ranges were 18.4%–42.6%, 6.5%−43.1%, and 6.2%–45.2%, respectively, while in BMD-2021 they were 27.3%−36%–2%, 19.6%–27.5%, and 10.4%–28.8%, respectively. Bolivina and Rosalina species were common in both cores while, in addition, Gavelinopsis praegeri was frequent only in some samples of BMD-2021.
Observing the species distribution along the core’s depth, a marked decrease of A. inflata toward the top is recognizable in both cores, starting between 11 and 13 cm. The simultaneous increase of E. advena and A. tepida was evident above this depth in BMD-2018, while the percentages of these species remained rather stable in BMD-2021. However, the upper section was characterized by E. advena > A. tepida > A. inflata in both cores (Figure 6).
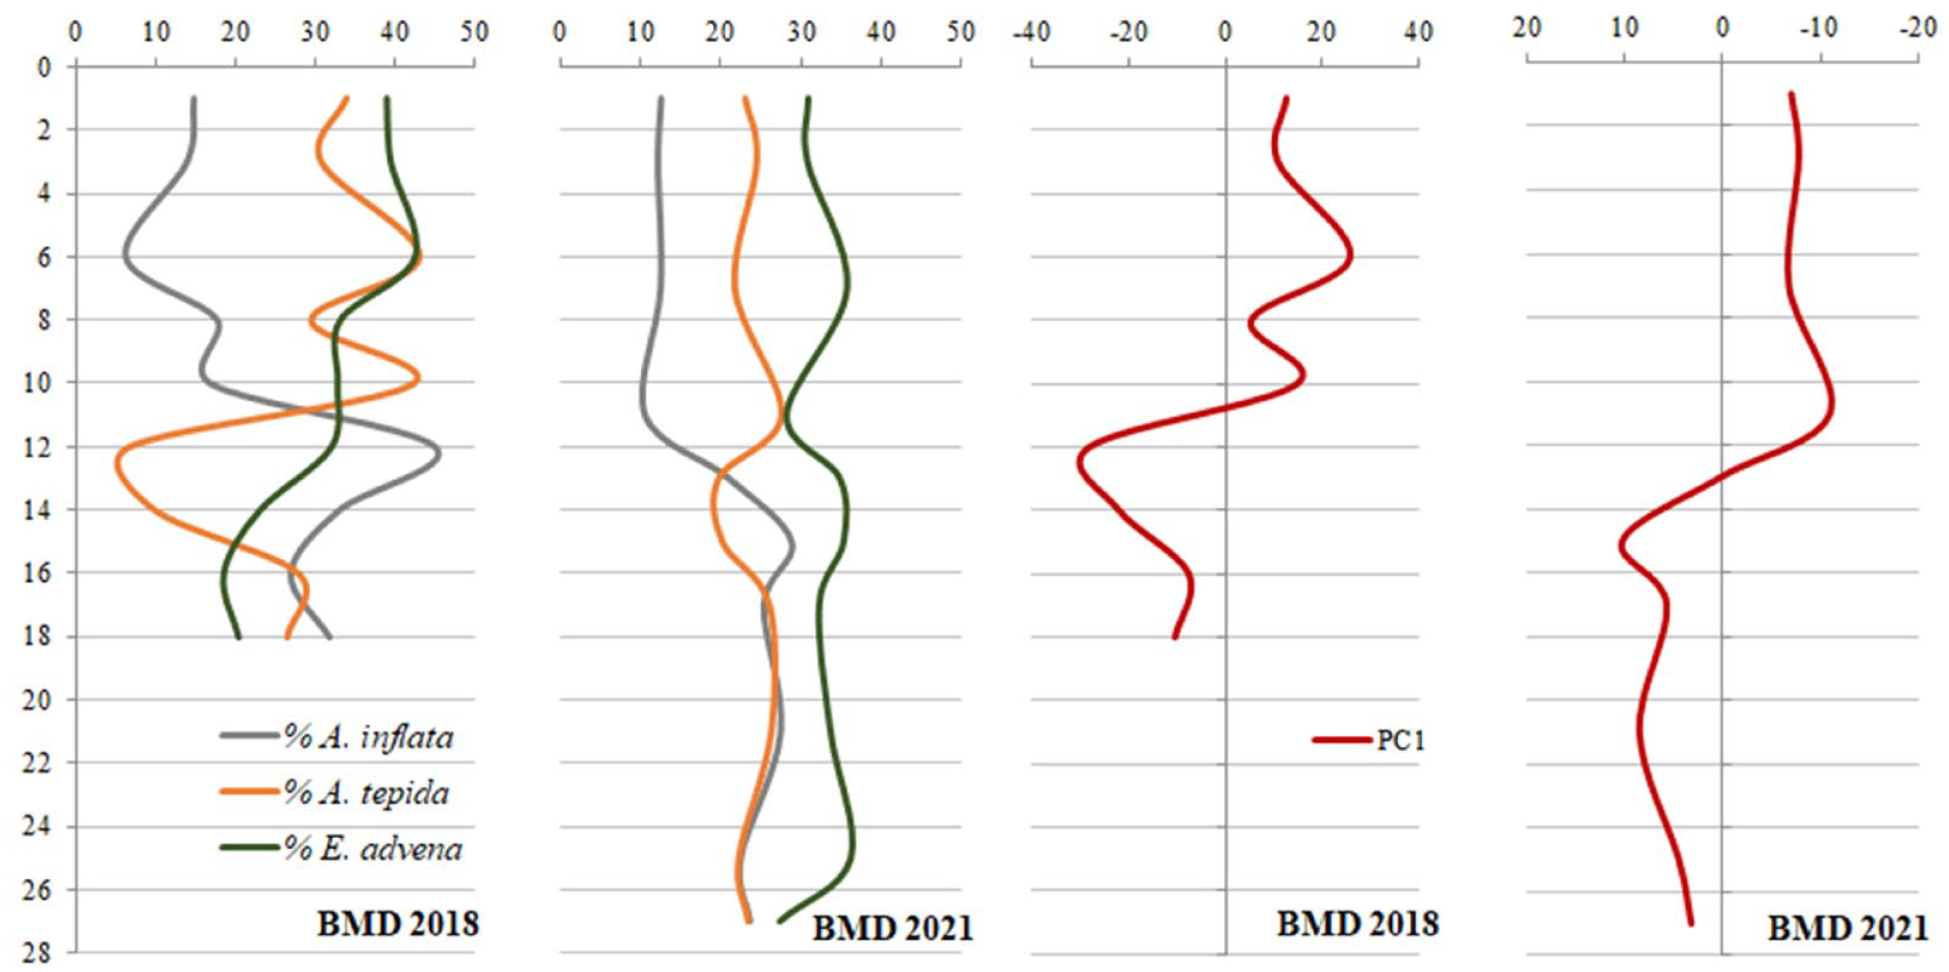
Percentages of the three most abundant species in cores BMD-2018 and BMD-2021, and plot along the depth of the scores of Component 1 obtained by the PCA applied to the relative abundance of commonly occurring species. PC1 accounted for 81.7% and 69.2% of the variance in BMD-2018 and BMD-2021, respectively.
The PCA carried out on the relative abundance of commonly occurring taxa distinctly recognized two sections in both cores by the scores of PC1. Moreover, a change in the value, indicating a faunal turnover, was recorded in the two cores at similar depths, 11 and 13 cm, for BMD-2018 and BMD-2021, respectively (Figure 6).
The cross-correlation on the PC1 values of the two cores highlighted the highest correlation of the two series (−0.929, p 0.023), in correspondence with a lag of −2 cm (Figure 7).
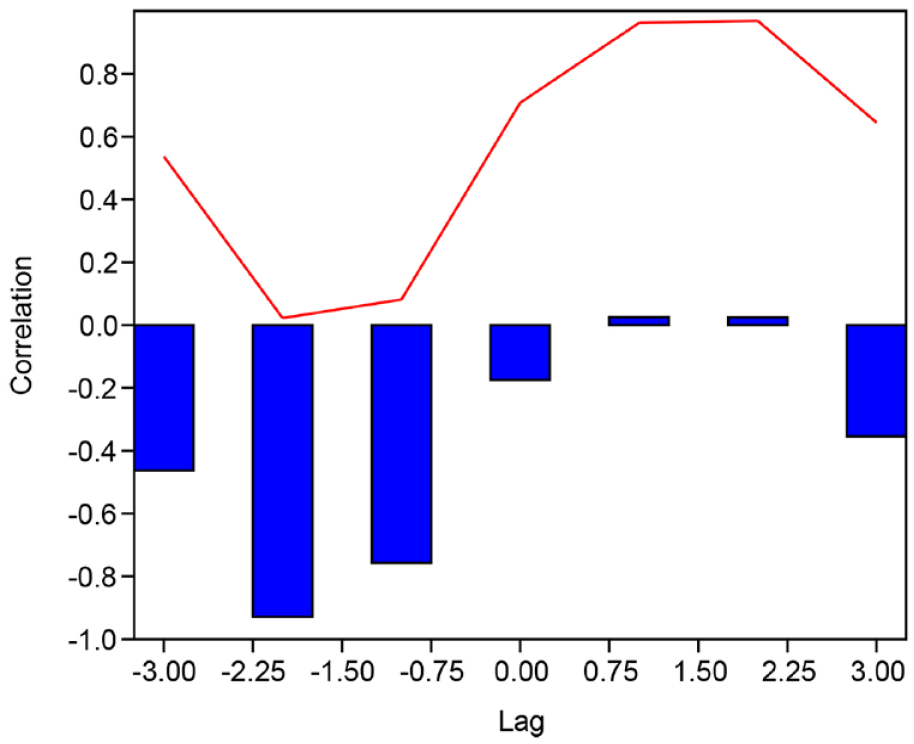
The output of cross correlation. The x-axis shows the displacement of PC1-2021 for PC1-2018, the y-axis the correlation between the two-time series for a given displacement (blue bars), and the relative p-values (red line).
Integration of surface and core foraminiferal assemblages
The PCA including the relative abundance of commonly occurring species from core BMD-2018 and surface samples was carried out for using the recent assemblages as a modern analog for the paleoenvironmental interpretation of core assemblages. The two first components, overall, explained 96% of the variance (PC1 68.8%, PC2 27.2%). Three main groups may be singled out based on values of the first component: group A with clearly negative values; B with values close to zero; group C characterized by positive values.
Group A includes exclusively surface samples; group B comprises three surface samples and the upper 10 cm core samples; in group C, three surface samples and all the lower core samples are present. These groups are associated with the three most abundant species: E. advena, A. tepida, A. inflata, respectively. While the first two species plot on the opposite side of the first axis, so that their abundance is negatively correlated, the third species plots mainly on the second axis, being independent from the other two.
Discussion
The recent foraminiferal assemblages in all samples may be associated with the confluence ecozone of Romano et al. (2021), an environment characterized by fine-grained sediment, enriched in organic matter, and waters with salinity and pH similar to the marine conditions. The composition and structure of the foraminiferal assemblage is characterized by two opportunistic taxa, E. advena and A. tepida, with the dominance of the first one, and the indifferent A. inflata. The opportunistic species suggest stress conditions due to the supply of degraded and/or refractory organic matter while, when A. inflata becomes more abundant, lower stress conditions can be inferred.
Salinity and pH in the Middle Branch indicated marine conditions, although they were slightly higher than those of seawater close to the cave entrance in the summer of 2018 (38.24 and 7.98, respectively; Cossarini et al., 2021; Escudier et al., 2020).
As regards the sediment features, they varied little in surface and core samples and agreed with an earlier study (Romano et al., 2021) both as regards the texture, characterized by a considerable amount of the pelitic (silt + clay) fraction, and the abundance of plant debris, pointing to relatively low hydrodynamic conditions. In that study, hypoxic conditions due to the degradation of organic matter were recorded for water close to the cave bottom. In core BMD-2018, sediment texture appeared to show a trend from finer (sandy silt) to slightly coarser sediments (silty sand) from the upper to the deeper levels; these two sediment types were also recognized in the surface samples, with a patchy distribution. Then, the textural change recorded in the core was interpreted more as a local variability than a general modification of hydrodynamic conditions through time.
The HCA carried out on foraminiferal data of surface samples identified two sub-environments within the confluence ecozone, and the autecology of the three main species allowed us to recognize the ecological differences between them. Eggerelloides advena is an infaunal third-order opportunistic species benefiting from degraded and refractory organic matter, tolerant to oxygen-depleted conditions (Patterson et al., 2000; Tsujimoto et al., 2006) and resistant to contamination (McGann, 2021). As regards A. tepida, it is a euryhaline species typically dominant in the Mediterranean lagoons, often contaminated (Carboni et al., 2009; Damak et al., 2019; Dasgupta et al., 2020; Frontalini et al., 2009), that was considered by Jorissen et al. (2018) as a “second-order opportunist” species. On the other hand, A. inflata was abundant in the fine-grained organically enriched sediments of an Italian river delta (Frezza and Carboni, 2009) and tidal channels of Spanish estuaries (González-Regalado et al., 2001). However, it does not tolerate high stress conditions, being an indifferent species to organic-matter enrichment, according to Jorissen et al. (2018). Based on this ecological information and considering the community structure characterized by higher dominance of E. advena in cluster A, it may be deduced that foraminiferal assemblages are more affected by stressed conditions in the four samples closer to the confluence with the North Branch, probably due to nutrient type and availability in the sediments.
Because similar assemblages, with the same three dominant species, were also recognized in the sediment core BMD-2018, the ecological information deduced from recent samples may be used as a modern analog to interpret the faunal change that occurred along the core depth, corresponding to a major paleoecological change over time. Considering the two different assemblages recognized in the core, the faunal change recorded at −11 cm can be considered as determined by increased environmental stress due to high amount degraded and/or refractory organic matter.
The plot of PCA that used recent assemblages as a modern analog (Figure 8) defined three main groups of different ecological significance along the first component (PC1). The high importance of the environmental factor corresponding to the PC1 on the foraminiferal assemblages is demonstrated by the high percentage of variance explained. The autoecology of the dominant species in the three groups and their abundance in each group point to an increasing degree of stress from negative to positive PC1 values. In fact, the lowest PC1 values are associated to the indifferent A. inflata, while the intermediate and highest values are associated to the opportunist A. tepida, and E. advena. Although A. tepida and E. advena were classified as second-order and third-order opportunist, respectively (Jorissen et al., 2018), in this study E. advena showed a stronger opportunistic behavior, demonstrated by the high dominance in group A, with percentages up to 66%. From the PCA, Eggerelloides advena resulted negatively correlated with A. inflata, along a stress gradient; instead, group B plotted mainly on PC1, indicating that a minor environmental driver, independent from the major one, promotes the presence of A. tepida. Based on these results, the foraminiferal assemblages from core BMD-2018 showed the increase of environmental stress from lower to upper samples, suggesting the increased supply of degraded refractory organic matter in more recent times.
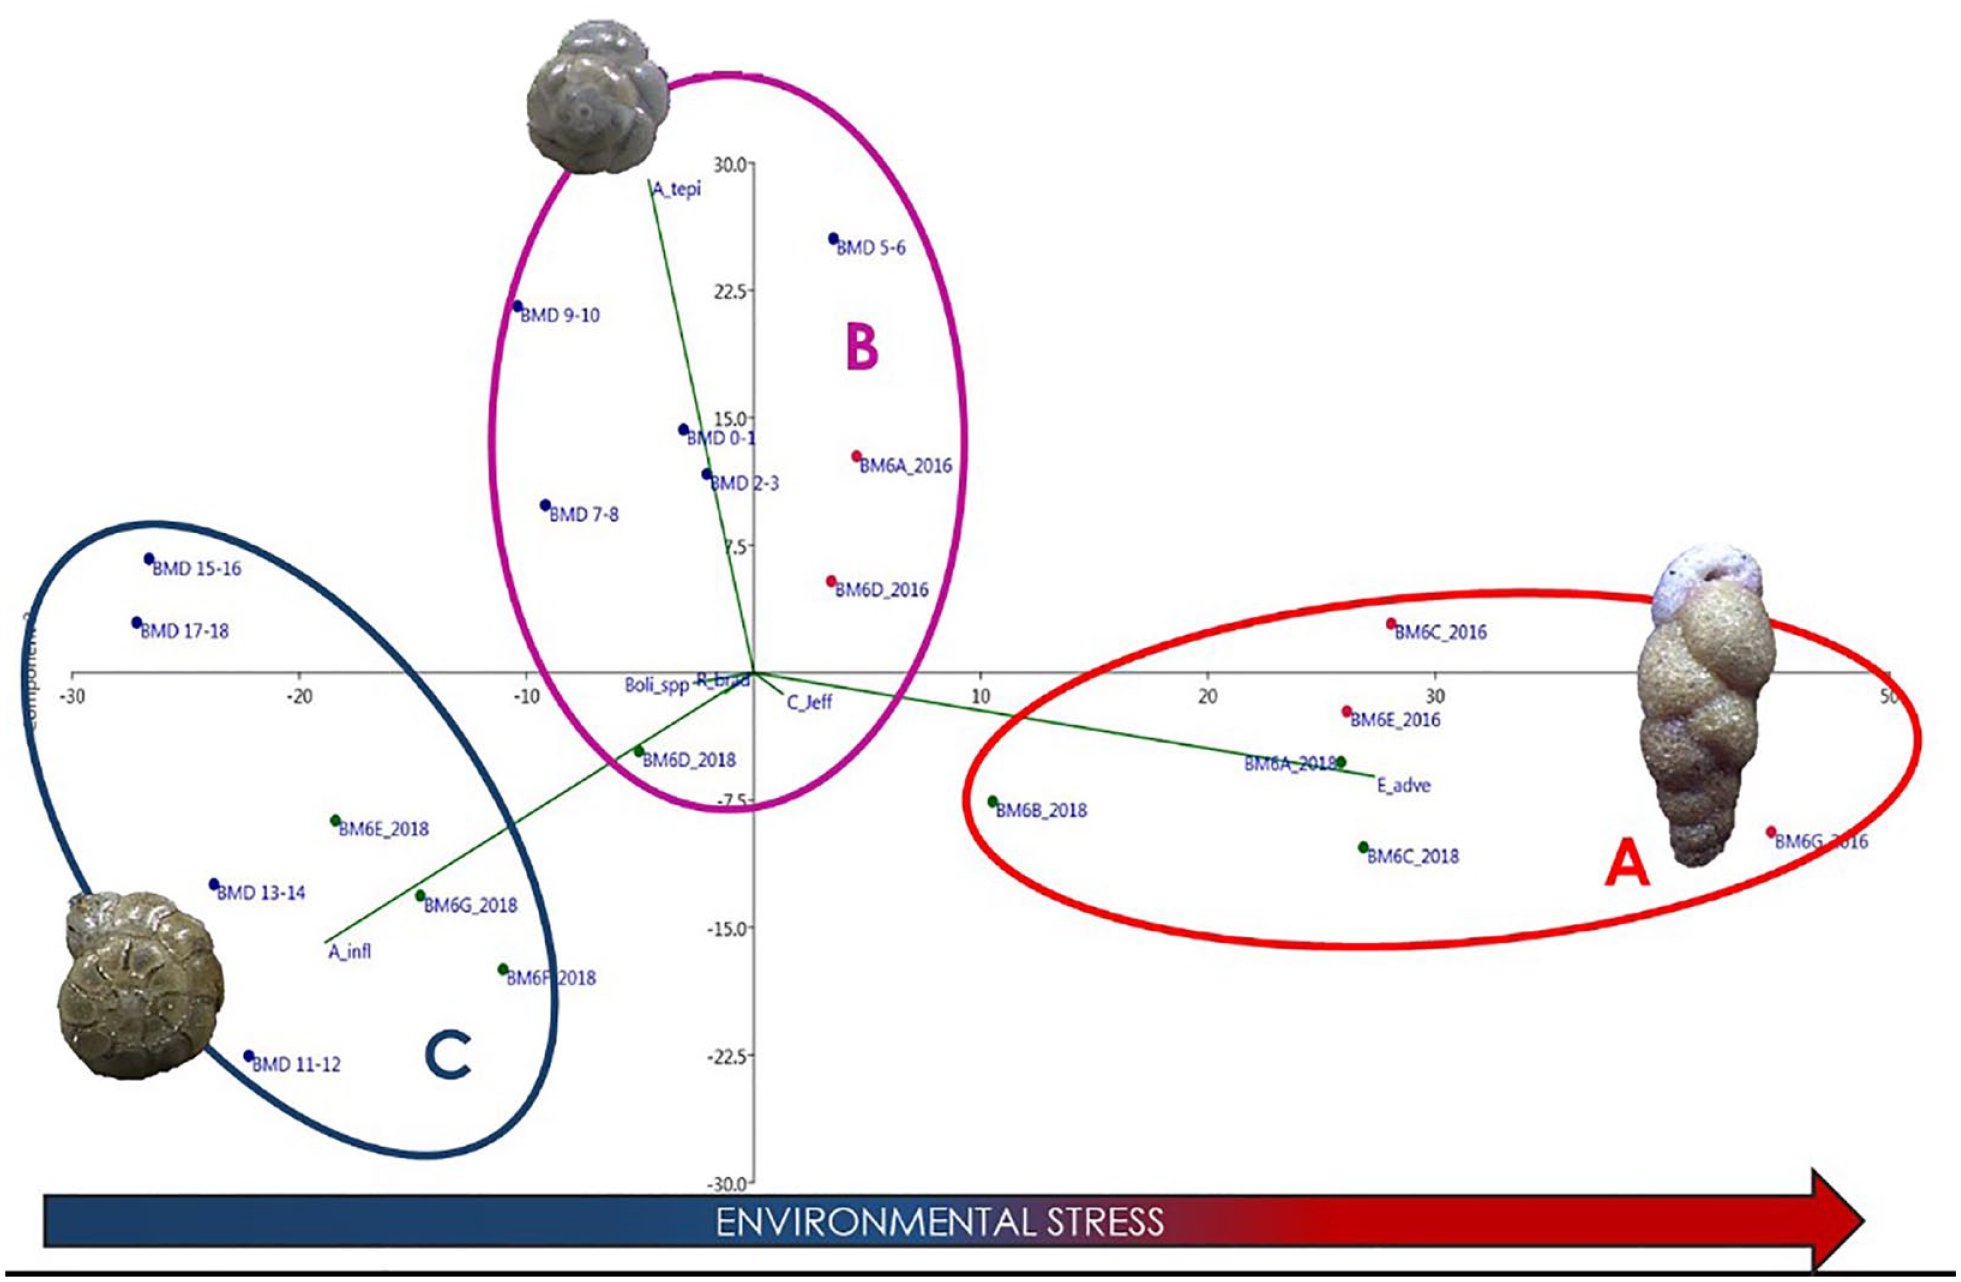
Principal Component Analysis applied to all foraminiferal data (PC1 68.8%; PC2 27.2%). It included data from all samples collected in the 2018 survey (surface samples and core BMD-2018) and surface samples collected during the 2016 survey (Romano et al., 2021). Group A is associated to Eggerelloides advena; group B to Ammonia tepida and group C to Ammonia inflata.
The luminescence dating carried out at −18 cm from the top of sediment core BMD-2021 yields a final age of 6.04 ± 0.47 ka that corresponds to the period of sea level stabilization that occurred during the Holocene climate optimum (8–6 ka; Perry and Hsu, 2000), recognized in Holocene sea-level curve available for the Mediterranean basin (Antonioli et al., 2007). These results show that despite water fluxes seasonally affecting the cave (Sanna and De Waele, 2010), a sedimentary record is registered in the Middle Branch from the time of cave flooding to the present, although it is not clear a continuous sedimentation condition. The presence of living foraminifera at the superficial level (0–2 cm) confirms current deposition highlighting their reliability as environmental proxies for interpreting ancient cave habitats.
The seawater flooding in the Bue Marino cave is also testified by typical foraminiferal marine species along the depth of the two sediment cores. The turnover of the foraminiferal assemblage found in both the sediment cores a few centimeters above the dated level highlights a change in the ecological conditions that occurred after 6 ka BP, triggering stressed conditions and favoring the presence of opportunist species (Romano et al., 2021). This assemblage has lasted from about 6 ka BP to present, testifying steady conditions regarding the organic matter supply in this time interval. This interpretation is supported by several years of studies on the recent foraminiferal assemblages of the marine caves of the Gulf of Orosei, with the definition of foraminiferal ecozones (Bergamin et al., 2018; Romano et al., 2018a, 2018b, 2020, 2021).
The causes of this change may only be hypothesized through the results of this study and could be attributable to an increase of terrestrial contributions in the cave, possibly due to the climatic instability that followed the optimum climatic (Giraudi et al., 2011) and/or to the geomorphological changes occurred along the coast, with the progradation of alluvial fans (De Falco et al., 2022; Pascucci et al., 2022).
Conclusions
In this study, as far as the authors know, the first attempt to date through the luminescence method, a sedimentary body deposited in the submerged branch of a marine cave, was carried out. The obtained data indicate that the Middle Branch of the Bue Marino cave preserves a sedimentary record from the cave flooding that occurred in the Holocene to the present. This information is in accordance with the Holocene sea-level curve available for the Mediterranean basin and the main events that occurred during that period, also confirmed by benthic foraminifera in the dated core. The paleoecological interpretation of foraminiferal assemblages in the sediment cores, supported by the study of modern analogs from recent sediments, provided a detailed environmental record from the flooding period to the present, highlighting an ecological change in the assemblages, possibly attributable to the effects of climate changes occurred in the Holocene. However more extensive studies are necessary to better understand the effects of the climatic/environmental events occurred in the Late-Holocene in the caves. In any case, this study showed that sediments of marine caves bear reliable environmental information to detect the effects of global changes on coastal environments. The multidisciplinary approach in many complex and extreme environments like marine caves provided reliable proxies for the paleoenvironmental reconstruction in coastal marine areas during periods of sea-level changes.
Supplemental Material
sj-xlsx-1-hol-10.1177_09596836231200435 – Supplemental material for Paleoecological reconstruction during the Holocene in the Middle Branch of Bue Marino Cave (Sardinia, Italy)
Supplemental material, sj-xlsx-1-hol-10.1177_09596836231200435 for Paleoecological reconstruction during the Holocene in the Middle Branch of Bue Marino Cave (Sardinia, Italy) by Elena Romano, Daniele Sechi, Stefano Andreucci, Luisa Bergamin, Andrea D’Ambrosi, Chiara De Santis, Letizia Di Bella, Enrico Dinelli, Virgilio Frezza, Vincenzo Pascucci, Giancarlo Pierfranceschi and Claudio Provenzani in The Holocene
Footnotes
Acknowledgements
We thank the reviewers for their insightful comments and suggestions for improving the manuscript.
CRediT authorship contribution statement
Led the manuscript’s conception, writing, and design: ER, LB, and LDB. Sampling activity: ER, AD, CP. Sediment analysis: ED, GP. Benthic foraminifera analysis: LB, LDB, CDS, VF. Luminescence analysis: DS. Data analysis and interpretation: ER, LB, LDB, DS, SA, VP. All authors have made a substantial, direct, and intellectual contribution to the work and approved it for publication.
Data availability
All data are included in the paper.
Funding
The author(s) disclosed receipt of the following financial support for the research, authorship, and/or publication of this article: The authors also thank Cinzia Crovato for grain size analyses and GUE divers for providing support during sediment sampling. The authors VP and DS, acknowledge the support of NBFC to University of Sassari, Institute, funded by the Italian Ministry of University and Research, PNRR, Missione 4 Componente 2, “Dalla ricerca all’impresa,” Investimento 1.4, Project CN00000033. Partial found to VP, DS and SA is from Research agreement between Autorità di Sistema Portuale del Mare di Sardegna e Università degli Studi di Sassari, Dipartimento di Architettura, Design e Urbanistica (Project Poseidonia, Resp. V. Pascucci).
Supplemental material
Supplemental material for this article is available online.
References
Supplementary Material
Please find the following supplemental material available below.
For Open Access articles published under a Creative Commons License, all supplemental material carries the same license as the article it is associated with.
For non-Open Access articles published, all supplemental material carries a non-exclusive license, and permission requests for re-use of supplemental material or any part of supplemental material shall be sent directly to the copyright owner as specified in the copyright notice associated with the article.