
Abstract
Reconstructions of past land use and related land-cover changes at local and regional scales are needed to evaluate the potential long-term impacts of land use on the coastal waters of the Baltic Sea. In this purpose, we selected the Gamleby area at the Swedish Baltic Sea coast for a case study. We use a new, high resolution pollen record from a small lake (Lillsjön) located 3.6 km NNW of the bay Gamlebyviken and detailed analysis of the available archeological data to reconstruct local land-use changes over the last 3000 years. To estimate land-cover change at local (2–3 km radius area) and regional (50 km radius area) scales we use four additional, published pollen records from two small and two large lakes (25–70 km S of Lillsjön) and the Landscape Reconstruction Algorithm, a pollen-vegetation modeling scheme. Results show that regional and local (small lakes Lillsjön and Hyttegöl) land-cover changes are comparable over the last 1500 years (Late Iron Age to present), and that landscape openness was much larger locally than regionally (difference of 20–40% cover over the last 500 years). The periods of largest potential impacts on the Gamlebyviken Bay from regional and local land use are 200–950 CE (Late Iron Age) and 1450 CE to present, and of lowest potential impacts 950–1450 CE. The question on whether the large landscape openness 1150–50 BCE and significant afforestation 50 BCE–200 CE reconstructed for Lillsjön’s area are characteristic of the Gamlebyviken region will require additional pollen records in the catchment area.
Keywords
Introduction
Current eutrophication of the Baltic Sea coastal waters caused both by point sources and diffuse input from mainly agricultural activities in its catchment is a recognized environmental problem leading to extensive areas with low oxygen content (Carstensen et al., 2014; Conley et al., 2011; HELCOM, 2018). Eutrophication of the Baltic Sea is amplified by its semi-enclosed basin configuration and the extensive freshwater runoff from the densely populated drainage area with intense agriculture (e.g. Carstensen and Conley, 2019; Snoeijs-Leijonmalm and Andrén, 2017). It is an almost isolated sea with a maximum depth of 459 m and a very narrow connection to the North Sea resulting in a long water-residence time of ca. 30–40 years (Leppäranta and Myrberg, 2009). The role played by long-term land-use and climate changes in the eutrophication of the Baltic Sea and spread of hypoxia is still not fully understood (Kabel et al., 2012; Norbäck Ivarsson et al., 2019; Schimanke et al., 2012; Zillén et al., 2008). Large scale land-use changes in the watershed have been suggested to be the source of excess nutrient input needed to develop deep water hypoxia in the open Baltic Sea already during medieval times (Åkesson et al., 2015; Funkey et al., 2014; Zillén and Conley, 2010). Other authors argued that hypoxia is a natural feature of the Baltic Sea system and is mainly controlled by climate (e.g. Andrén et al., 2020; Bianchi et al., 2000; Kabel et al., 2012). There is still limited knowledge on the extent and effect of human-induced land transformation in the Baltic Sea coastal areas prior to the industrial revolution (Jokinen et al., 2018; Ning et al., 2018). Based on paleoecological analyses of the sediment records from a large lake and the Gåsfjärden Bay (SE Sweden), located ca. 30 km apart, Ning et al. (2018) concluded that the onset of human-induced eutrophication in the bay dates from the 19th century and is related to intensified land use as its main driver. More studies of this kind are necessary to understand all mechanisms behind eutrophication of the Baltic Sea in a long-time perspective (Åkesson et al., 2015; Ning et al., 2018; Schimanke et al., 2012; Zillén and Conley, 2010).
This study is part of a larger project with the aim to disentangle the long-term role of human-induced processes from that of naturally driven ones and identify the significance of multiple stressors as causes behind events of eutrophication and hypoxia of the Baltic Sea. Here, we focus on the Gamlebyviken Bay in southeastern Sweden and its surroundings, which is a region rich in archeological findings from the Bronze Age and Iron Age in particular (Figures 1 and 2). We use a new pollen record from a small lake (Lillsjön) located a few km from the Gamlebyviken Bay and four additional published pollen records to reconstruct land-use and land-cover change at both local (2–3 km radius area) and regional (50 km radius area) scales for the last 3000 years. In this purpose, we apply the indicator species approach (e.g. Gaillard, 2013) and the Landscape Reconstruction Algorithm (LRA; Sugita, 2007a, 2007b), a modeling approach to estimate the percentage cover of plants from fossil pollen assemblages. A combined interpretation of the pollen-based reconstructions and a survey of the archeological information around Lillsjön allows us to estimate past changes in deforestation over space and time in the catchment of Gamlebyviken. The major aim of the study is to test the assumption that periods of extensive and intensive exploitation of the land by humans since the Bronze Age, both locally and regionally, led to deforestation and opening of the landscape of such a magnitude that it could already have affected the Baltic Sea before the 19th century (Ning et al., 2018), as suggested earlier by for example, Zillén and Conley (2010) but not convincingly demonstrated so far due to the lack of quantitative pollen-based land-cover reconstructions in the coastal regions for periods older than 1000 CE.
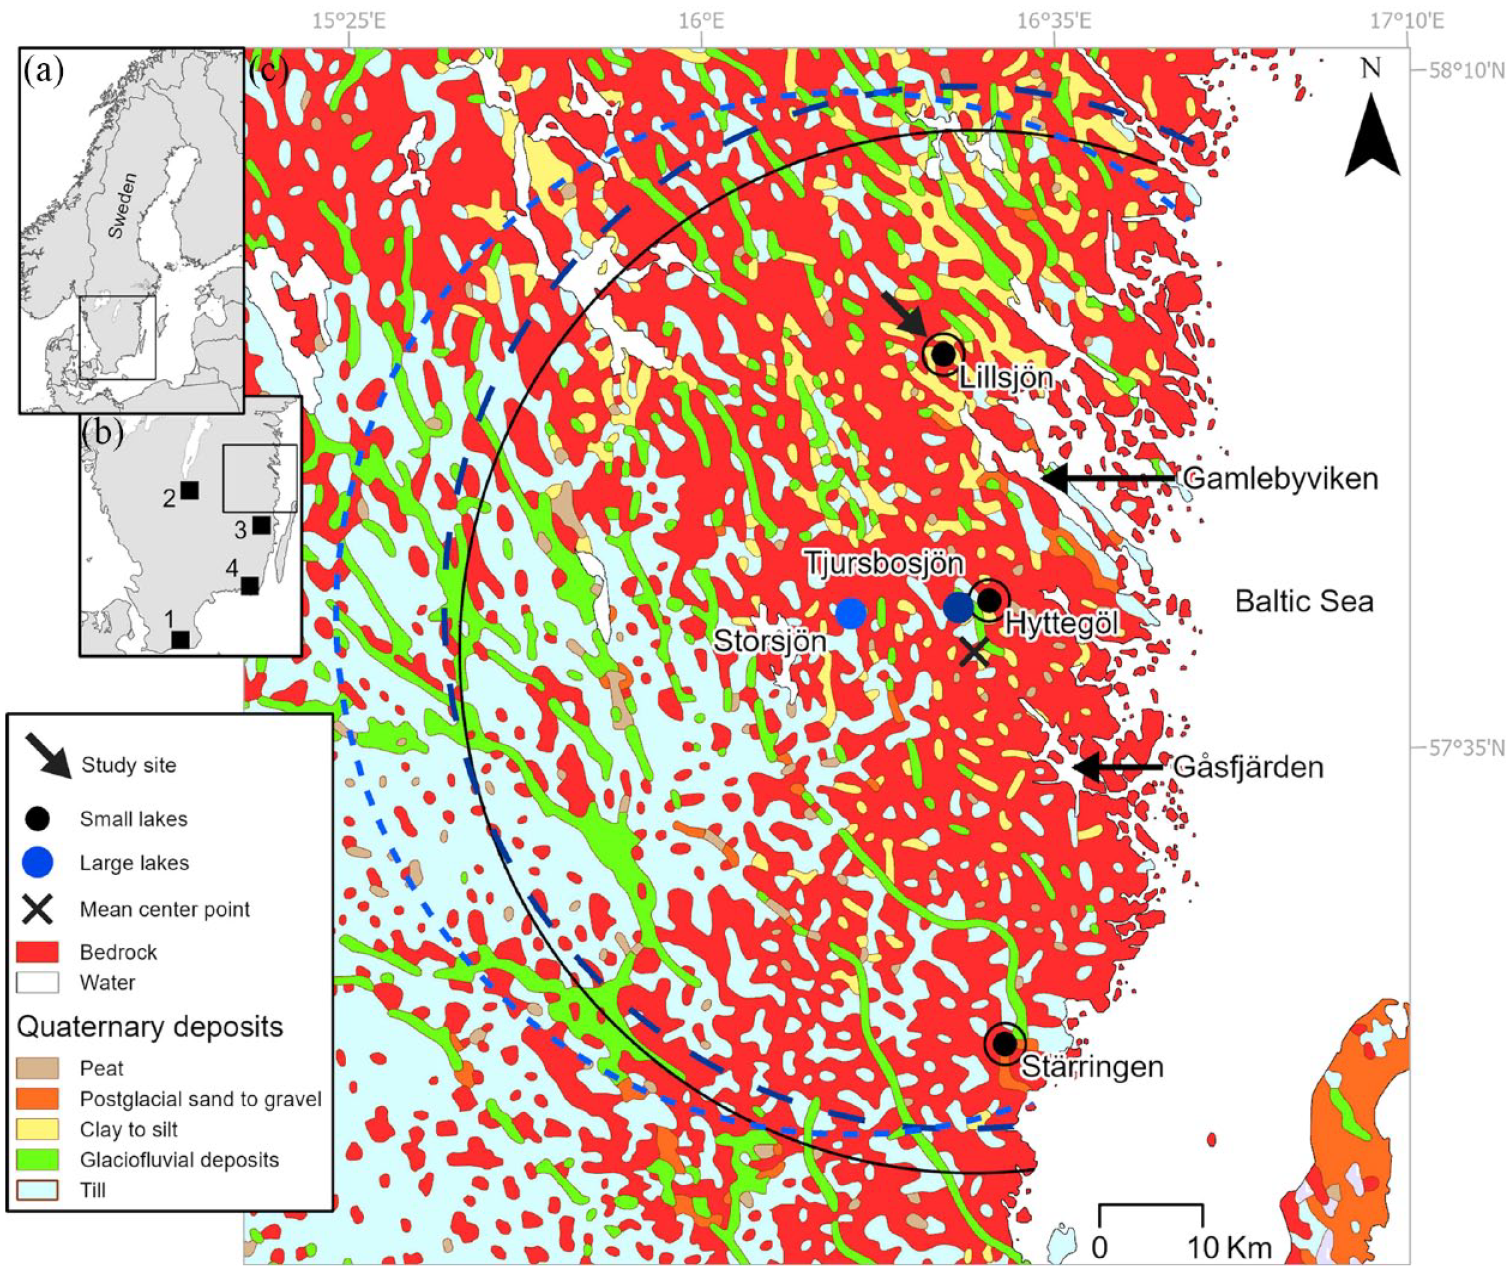
Location of the study area in (a) Scandinavia and (b) southeastern Sweden, and its geological characteristics. Of the five sites/lakes/pollen records used in the application of the Landscape Reconstruction Algorithm (LRA), only Lillsjön is a new pollen record (this paper); the other four pollen records were published earlier (see Table 1). Mean center point
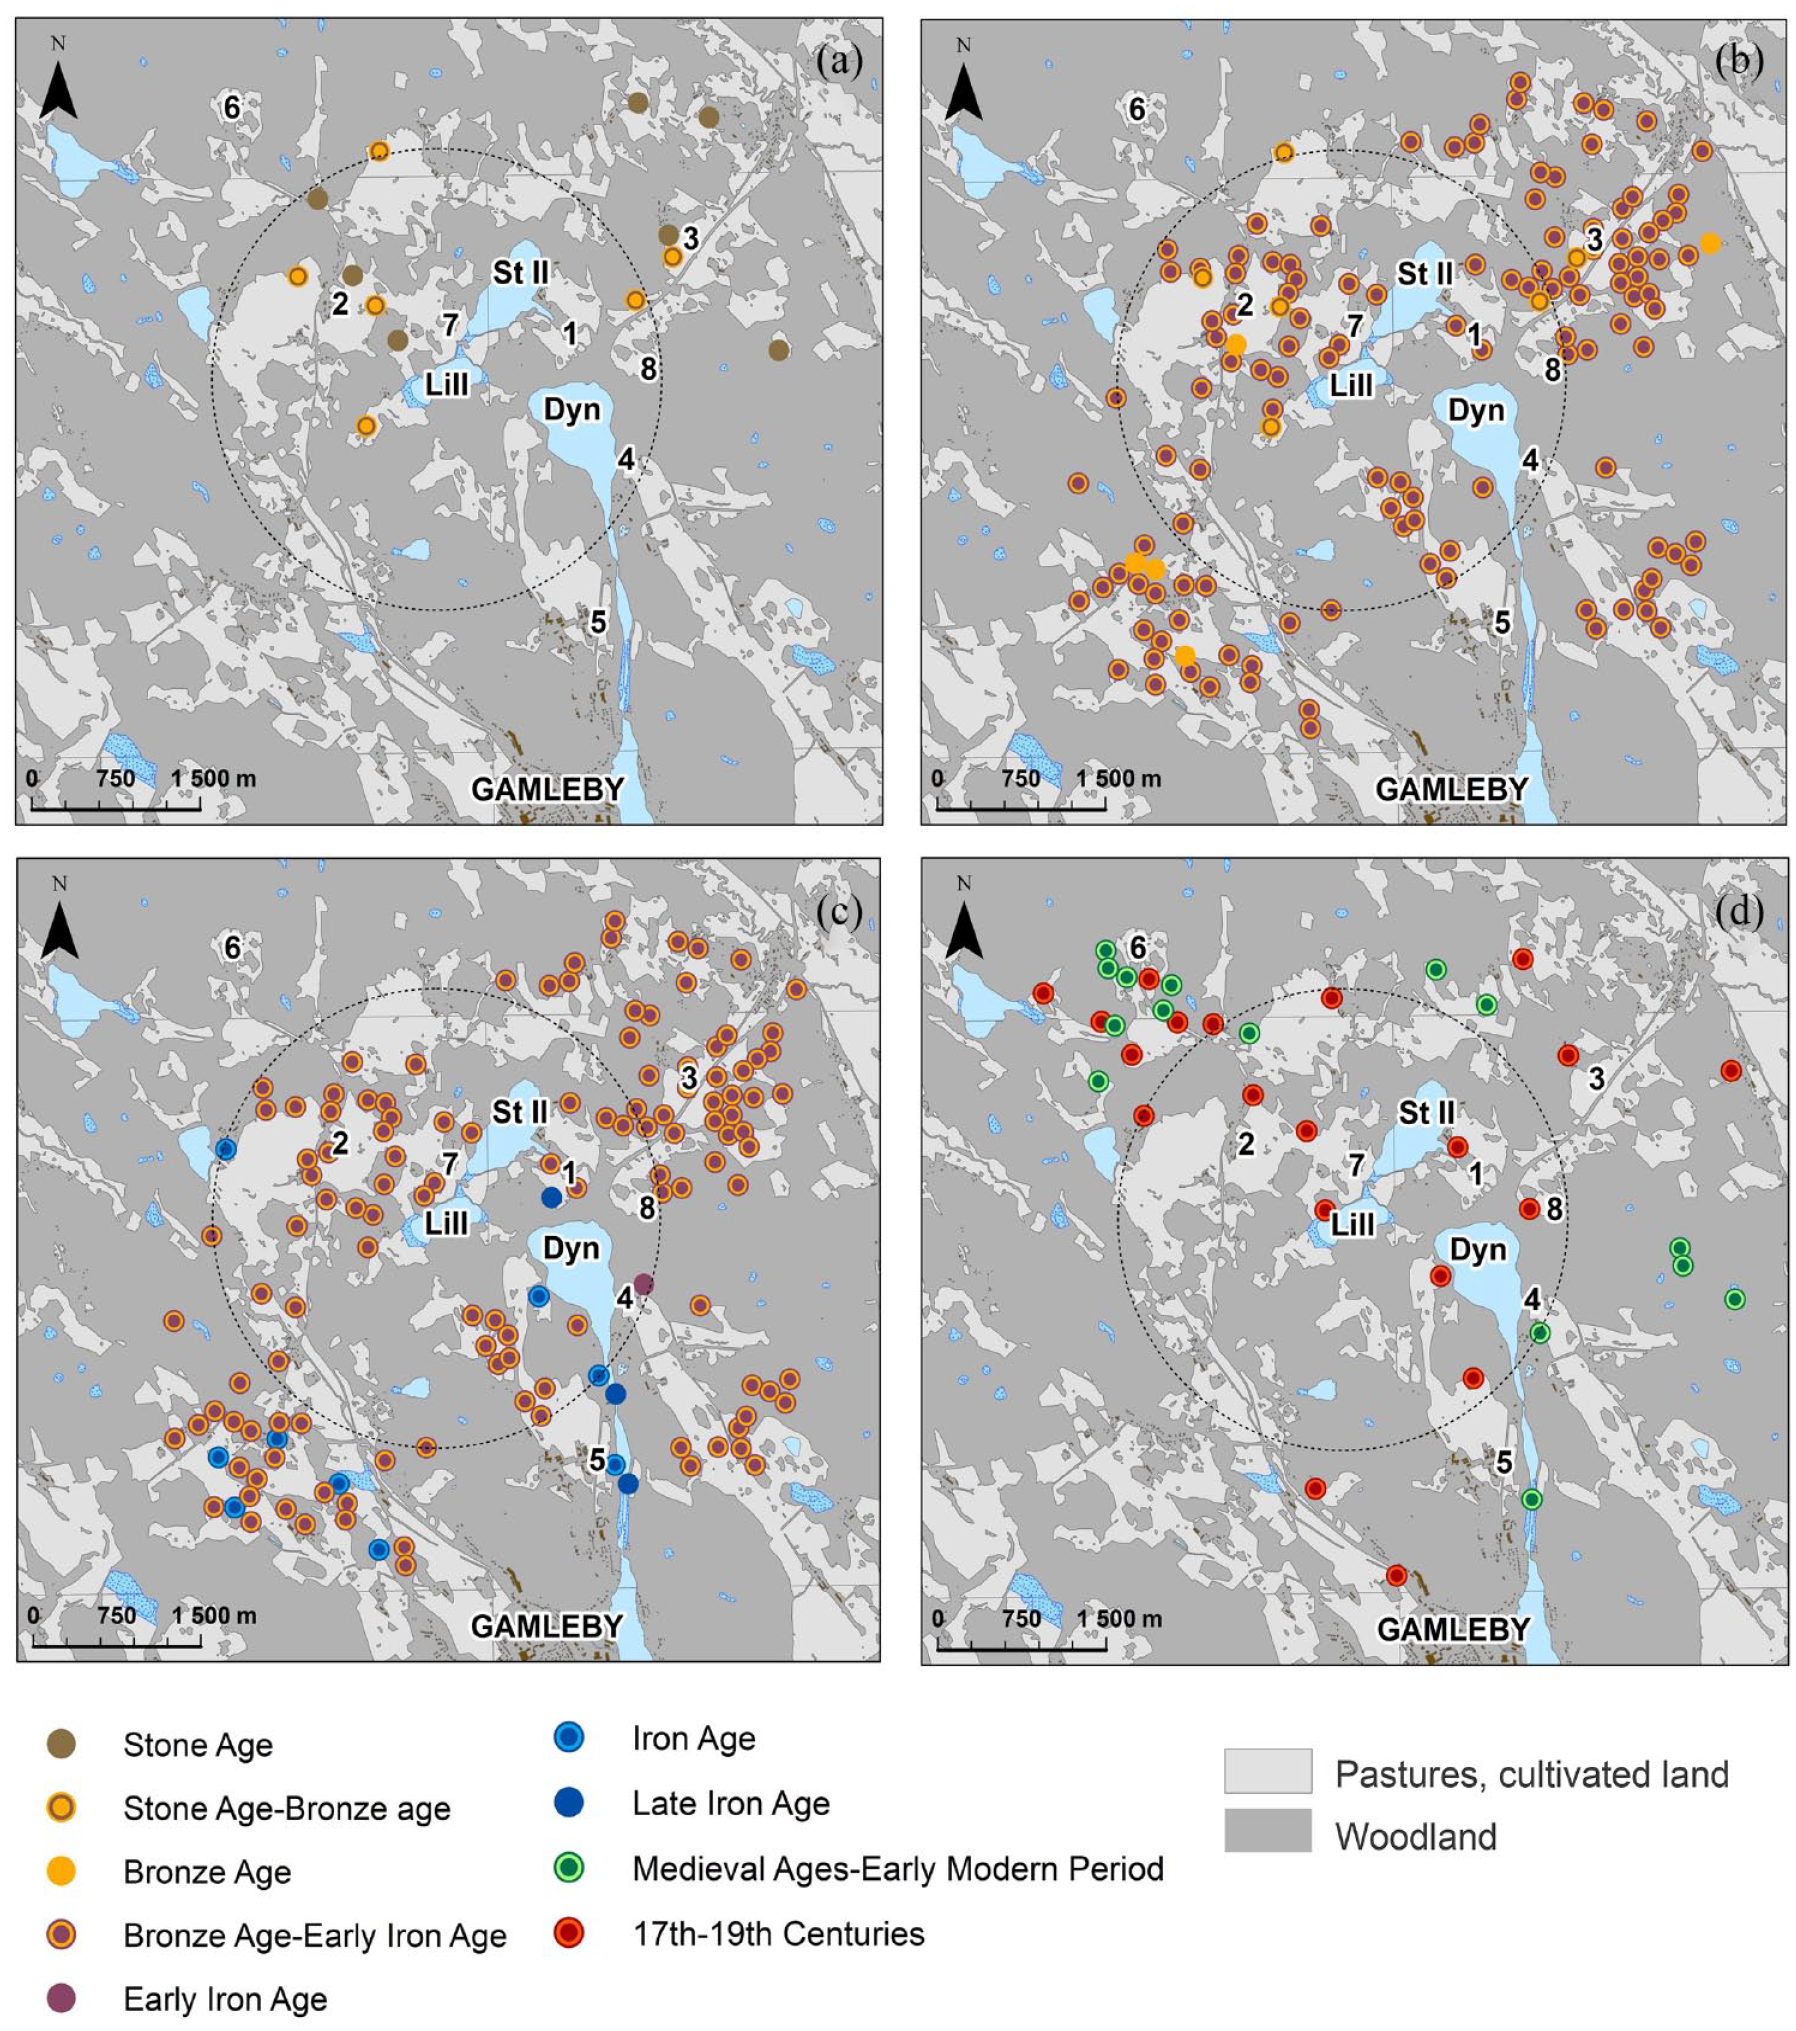
Maps of archeological findings within an area of 4 km radius around the lake Lillsjön from the Stone Age until the 19th century. Note that Storsjön II is not the large lake Storsjön used in the application of the Landscape Reconstruction Algorithm and shown in Figure 1. (a) locations with findings from the Stone Age, some also including findings that can date from the Bronze Age; (b) locations with findings from the Bronze Age, of which a large number can also date from the Early Iron Age. (c) locations with findings from the Iron Age, of which a large number can also date from the Bronze Age (see (b)). (d) locations with findings from Middle Ages to 1850 CE. 1–8 Farms known from written sources since the 14th century that may have established already in the Iron Age: 1. Gursten, 2. Fästad, 3. Vida, 4. Langeharg/Nygård, 5. Valstad, 6. Olserum, 7. Lapserum, 8. Dynestad. For details on dating, see Results.
Study region and study sites
The study region (Figure 1) belongs to the hemiboreal vegetation zone dominated by coniferous forest (Ahti et al., 1968) with widespread occurrence of deciduous trees, mainly Quercus, Betula, and Populus (Rydin et al., 1999). It is today a mosaic rural landscape with woodland and agricultural land in varying proportions. Quaternary deposits in the area are dominated by postglacial clay and glacial till, and bedrock consists mainly of quartzite and granite (geological map accessible at Geological Survey of Sweden (SGU), www.sgu.se, accessed 26 September 2023; Svenonius, 1914; Figure 1). The present temperatures and precipitations (average January, July and annual) are −2°C, 16°C, and 7°C, and 37, 60, and 484 mm, respectively (Statistical Yearbook of Sweden, 2014). The main study site, Lillsjön, is located a few kilometers north of Gamlebyviken within a landscape of coniferous and mixed woodland and agricultural land. Archeological remains are numerous and testify on continuous human activities in the lake’s surroundings during the study period (Figure 2). The lake Lillsjön (57°55.934′N, 16°23.342′E; altitude: 16 m a.s.l.; water depth: 2.2 m) is located ca. 3.6 km from the Gamlebyviken Bay and 4 km from the town Gamleby (Figure 1). It is today a eutrophic lake with a surface area of 0.16 km2 and a minor outlet to Lake Storsjön II (Figure 2). A bog situated nearby is a potential source of humic material to the lake. Further details on Lillsjön and four additional sites for the application of the Landscape Reconstruction Algorithm (Figure 1; see Methods for details) are provided in Table 1.
Pollen records used for the application of the Landscape Reconstruction Algorithm (LRA; Sugita, 2007a, 2007b).
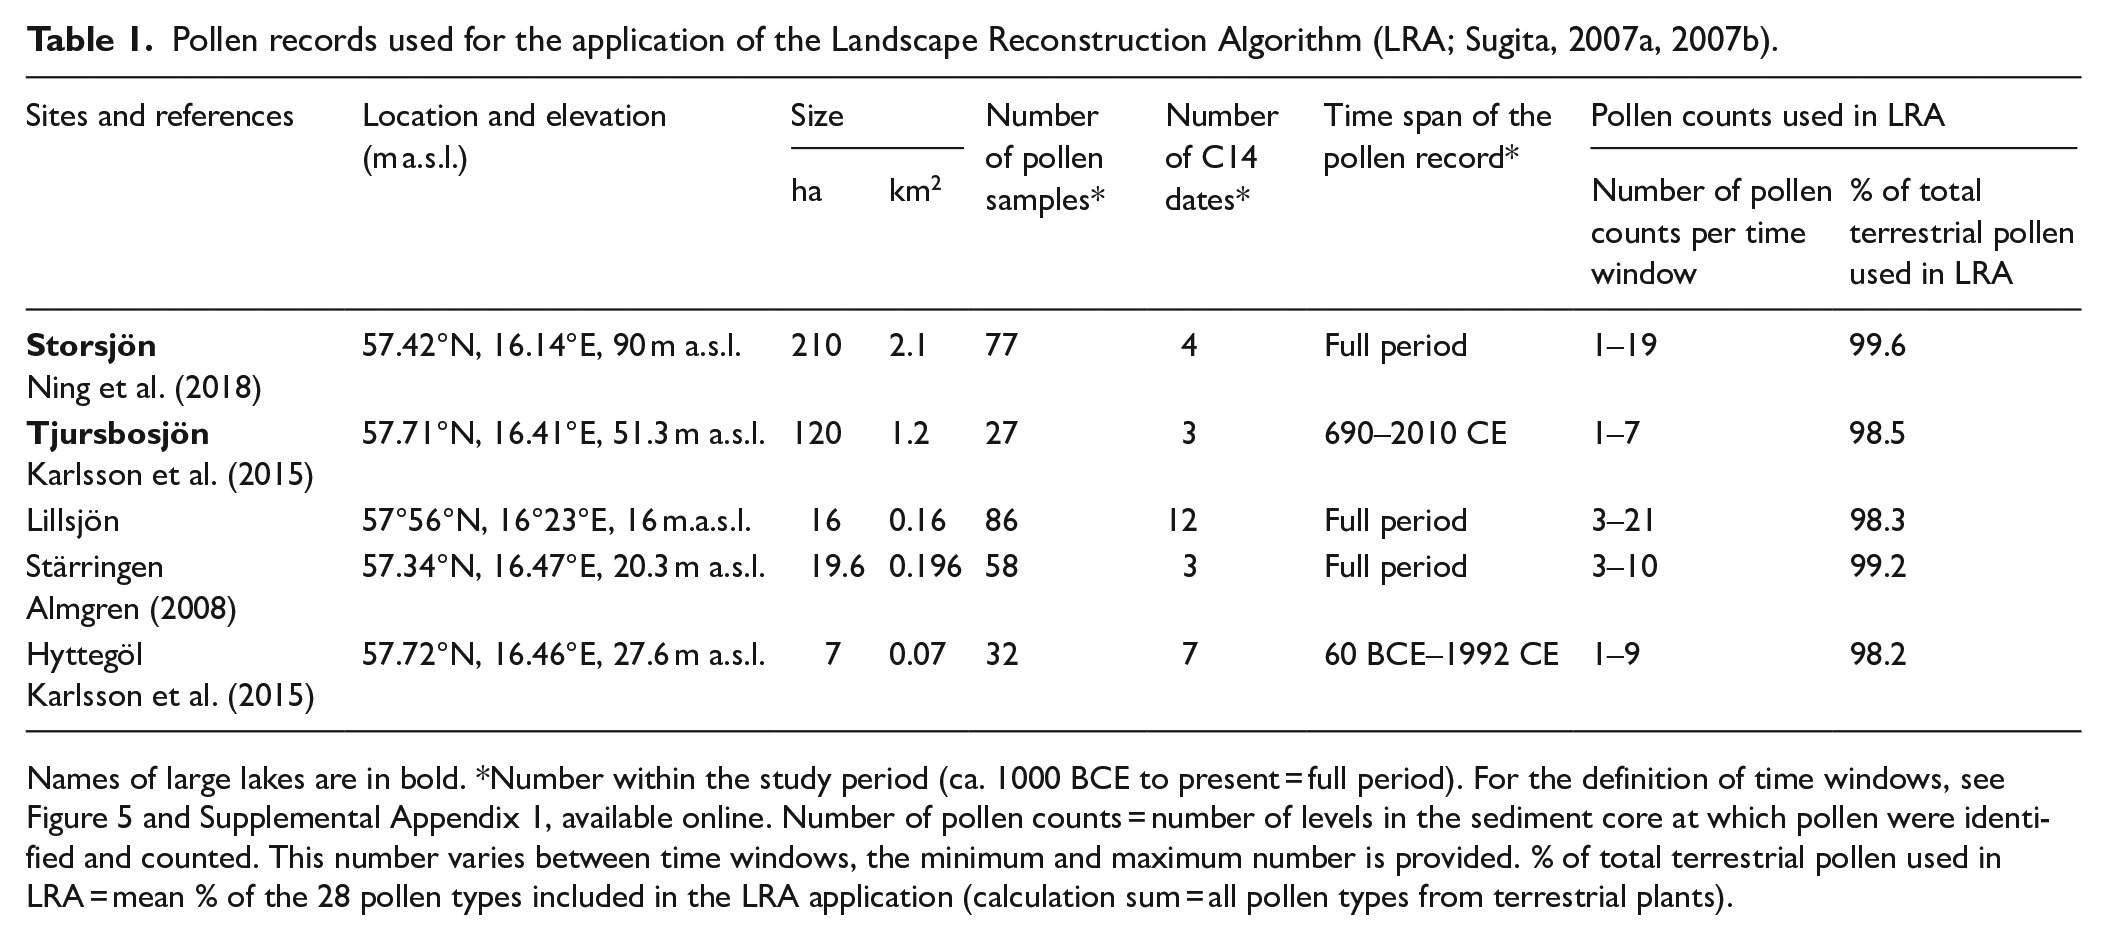
Names of large lakes are in bold. *Number within the study period (ca. 1000 BCE to present = full period). For the definition of time windows, see Figure 5 and Supplemental Appendix 1, available online. Number of pollen counts = number of levels in the sediment core at which pollen were identified and counted. This number varies between time windows, the minimum and maximum number is provided. % of total terrestrial pollen used in LRA = mean % of the 28 pollen types included in the LRA application (calculation sum = all pollen types from terrestrial plants).
Material and methods
Note that the Supplemental Appendices 1–3, available online with related Tables and Figures that we are referring to in the following sections are provided as Supplemental Material, available online.
Lillsjön
Fieldwork, lithology, subsampling, and loss-on-ignition
The sediments of the lake Lillsjön were cored in February 2017 using a 1-m-long Russian corer with a 1-m-long and 5-cm-diameter collecting chamber. The sampling site was selected in the deepest part of the lake. Nine meters of sediments were extracted as 1-m-long core sections in two parallel holes to secure overlap between them. Lithology was described in the field and checked in the laboratory after cleaning the sediment surface and before subsampling. Sediment sections (2–3.5-cm-long) were taken at regular intervals along the core to be wet sieved and select material for 14C dating. Two 1-cm3 subsamples were collected every 5 cm at the same levels for pollen analysis and loss on ignition. Loss on ignition was performed following Dean (1974). Sediment samples were weighed three times, wet, after drying overnight at 105°C, and after burning in a furnace for 1 h 25 min at 550°C.
Dating and age-depth modeling
Sixteen sediment subsamples for 14C dating were washed through a sieve (mesh size: 250 µm). Plant macrofossil remains and charcoal fragments were sorted under a binocular microscope. The material was freeze-dried and submitted to the Laboratory of Ion Beam Physics, ETH, Zürich, Switzerland for AMS 14C dating. One freeze-dried bulk sediment sample from the deepest part of the sediment sequence was submitted to Beta Analytic, USA, for an estimate of the bottom sediments’ age. The age of the sediment surface was set to 2017 CE, the year of coring. All 14C dates were calibrated using the IntCal20 calibration dataset (Reimer et al., 2020) with R ver. 4.2.0 (R Core Team, 2022). The age-depth model was produced using the Bacon ver. 2.5.7 package (Blaauw et al., 2022) with the following settings: accumulation mean 10, accumulation shape 1.5, default section thickness 5 cm, memory mean 0.5, and memory strength 10. Black spheroidal carboniferous particles (SCPs) were counted on the pollen slides to get an independent chronological marker for the uppermost sediment (Renberg and Wik, 1984; Wik and Renberg, 1996).
Pollen and microcharcoal analysis
Subsamples were treated following Berglund and Ralska-Jasiewiczowa (1986). Lycopodium spores were added before treatment to calculate pollen concentration (pollen grains/cm3) and pollen accumulation rate (pollen grains/cm2·year). A minimum of 500 pollen grains per sample were identified and counted under microscope with magnifications of 400 and 1000. We used pollen and spore identification keys (Beug, 2004; Moore et al., 1991; Punt et al., 1976–2003), the pollen and spore reference collections at the Swedish Museum of Natural History and the Department of Biology and Environmental Science, Linnaeus University (Kalmar, Sweden) for identification of pollen and spores. Two fractions of microscopic charcoal, longest axis ⩾10 – <50 µm and ⩾50 µm were also counted on the pollen slides. Pollen diagrams are plotted using the TILIA 2.0.41 software (Grimm, 1990). The percentage diagram is divided into local pollen assemblage zones (LPAZ) and subzones (LPASZ) based on a stratigraphically constrained cluster analysis (CONISS; Grimm, 1987) of the pollen percentages of all identified arboreal pollen (AP) and non-arboreal pollen (NAP) taxa.
Archeological maps
Mapping of the archeological data around Lillsjön is based on known archeological remains archived in the database of archeological sites and monuments of the Swedish National Heritage Board, Fornsök (Riksantikvarieämbetet, 2023, www.raa.se, last consulted in January 2023). It provides information on prehistoric and historical remains located on land and under water. In the area of lake Lillsjön, the data derive from field surveys in the 1940s and 1970s, and later archeological excavations and field evaluations. The archeological data were extracted within a 3.5-km-radius area around the center of Lillsjön, which is an estimate of the lake’s relevant source of pollen (see below). The criteria for selection of data were as follows: the objects had to be (1) a remnant of human activity in ancient times and permanently abandoned, (2) created and abandoned before 1850 CE, and (3) included in one of the categories listed in the Historic Environment (1988). A review of the existing dates and a new typological study of archeological objects were used for attribution of settlements and monuments to archeological periods.
Reconstruction of local and regional plant cover
We use the Landscape Reconstruction Algorithm (LRA; Sugita, 2007a, 2007b) to reconstruct changes in landscape openness in the study region, locally around the small lakes Lillsjön, Hyttegöl and Stärringen, and regionally within an area of 50 km radius around the large lakes Storsjön and Tjursbosjön (including two of the three small lakes) (Figure 1; Table 1). The LRA comprises two models, REVEALS (Regional Estimates of VEgetation Abundance from Large Sites; Sugita, 2007a) and LOVE (LOcal Vegetation Estimates; Sugita, 2007b). The theory and description of the models and their parameters are provided in Supplemental Appendix 1, available online. REVEALS was developed for pollen records from large lakes (⩾50 ha) (Hellman et al., 2008a; Sugita, 2007a) to estimate plant cover within a large area estimated to ca. 104 km2 (or ca. 50-km-radius area) in southern Sweden (e. g. Hellman et al., 2008b). REVEALS can also be applied using multiple pollen records from smaller lakes (<50 ha) (Sugita, 2007a; Trondman et al., 2016). LOVE is appropriate for pollen records from small sites only (lakes and bogs of a few hectares) and estimates the local plant cover within the relevant source area of pollen (RSAP; Sugita, 1994). The RSAP is the smallest spatial scale of a LOVE reconstruction. LOVE needs REVEALS estimates of regional plant cover as input.
The LRA application in this study is described step by step in Supplemental Appendix 1, available online (LRA strategy, chronologies, harmonization of pollen taxonomy, parameter setting, model runs and outputs) with additional information in Supplemental Table S1.1, available online. The values of relative pollen productivities and fall speed of pollen, the two most important parameters needed for the application of LRA, are provided in Table 2. For consistency, new age-depth models were performed for Storsjön, Tjursbosjön, Hyttegöl, and Stärringen using the published 14C dates (see references in Table 1) and the same methods as described for Lillsjön (see above).
Relative pollen productivities (RPPs) with their standard deviations (SDs) and fall speed of pollen (FSP) used in this study.
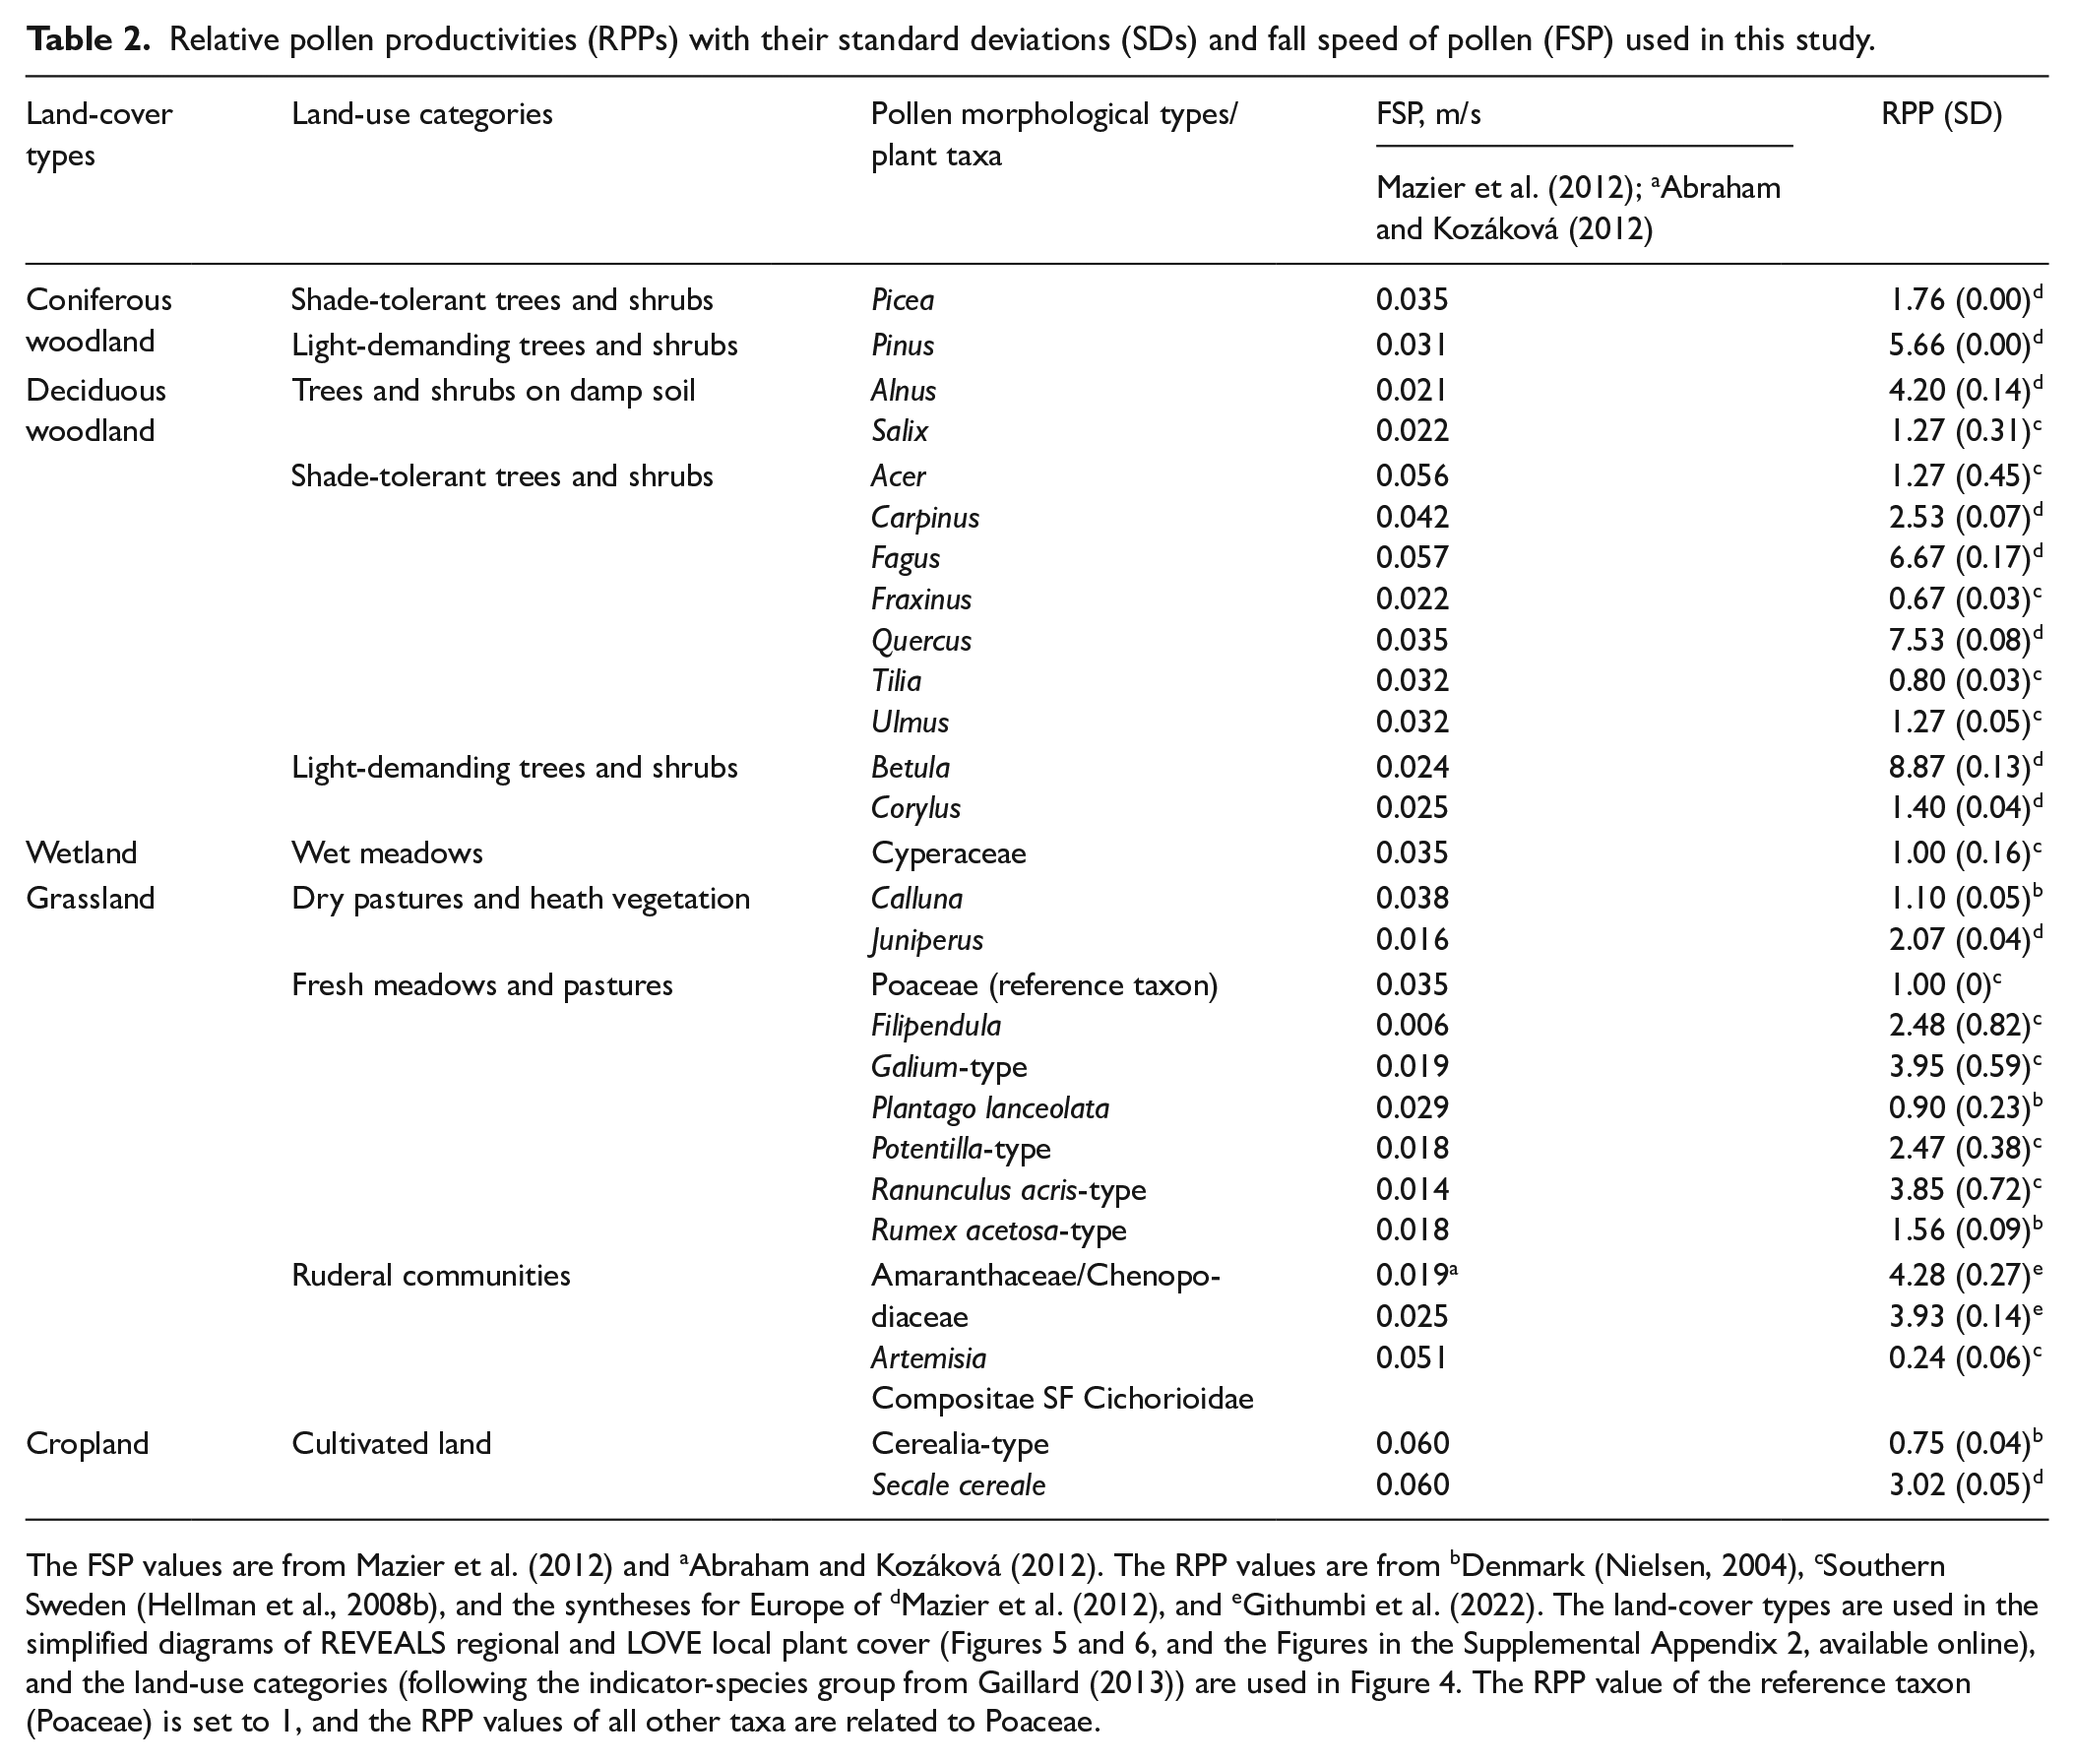
The FSP values are from Mazier et al. (2012) and aAbraham and Kozáková (2012). The RPP values are from bDenmark (Nielsen, 2004), cSouthern Sweden (Hellman et al., 2008b), and the syntheses for Europe of dMazier et al. (2012), and eGithumbi et al. (2022). The land-cover types are used in the simplified diagrams of REVEALS regional and LOVE local plant cover (Figures 5 and 6, and the Figures in the Supplemental Appendix 2, available online), and the land-use categories (following the indicator-species group from Gaillard (2013)) are used in Figure 4. The RPP value of the reference taxon (Poaceae) is set to 1, and the RPP values of all other taxa are related to Poaceae.
Results
Lillsjön
Archeology
We summarize here the main results of the archeological analysis and mapping (Figure 2). More detailed information is provided in Supplemental Appendix 2, available online (Archeology). The dates of archeological periods in southern Sweden follow the system of Hedeager and Kristiansen (1985), slightly revised by Berglund (1991).
Thirteen sites within 3-km radius around Lillsjön can be assigned to Stone Age (Figure 2a). A Late Mesolithic hunter-fisher-gatherer settlement dated to ca. 5000 BCE is located 0.5-km N of the lake’s western end (Gustafsson and Petersson, 2002). Although there is no evidence of settlements dated to the Bronze Age (1800–500 BCE) close to the lake, several of the isolated grave cairns and stone settings can be dated to this period or the Early Iron Age (Pre-Roman Iron Age, 500–0 BCE) (Figure 2b). The over 60 cairns and ca. 200 stone settings, either isolated or in grave fields, within 3-km radius of Lillsjön are all located on hill tops. Permanent settlements and prehistoric farms were probably lying at lower elevations. Rock art and cup marks of the same age at over 90 sites alongside heaps of fire-cracked stones, stone fences, clearance cairns and prehistoric fields, are all testimonies of a landscape strongly influenced by human activities.
Farms are mentioned in written sources first from the Middle Age, for example, Lapserum (1383 CE), Fästad (1370 CE), Dynestad (1382 CE), Gursten (1383 CE), Langeharg/Nygård (1380 CE), Valstad (1412 CE), and Vida (1350 CE) (Axelsson, 2008; Figure 2c). Farms located nearby large grave fields, such as Fästad, Langeharg/Nygård, Valstad, and Vida are assumed to have existed already in the middle of the Iron Age (300–550 CE) (Brink, 1999; Palm, 2001). Clusters of grave fields located outside 2 km from the lake are dated to Late Iron Age (550–1050 CE) (Figure 2c). Farms and grave fields were closer to each other and located at lower elevations than during the Bronze Age, in areas with nutrient-rich soils favorable to farming. Around the top of the Gamlebyviken Bay, 1–3 km SE of Lillsjön, several large grave fields, coins, and a Viking age maritime timber construction indicate that the area was of particular importance. A rune stone dating to the Late Iron Age standing at the farm Gursten, and other findings such as damaged graves suggest that the farm existed before Middle Ages (Rydström, 1919). Mining for copper and iron existed in the region since Late Iron Age and probably even earlier (Sandberg et al., 2011).
In the late 17th century and onward, several small farms and crofts scattered in the landscape were established, some of them under the administration of the larger farms Langeharg/Nygård in the southeast and Olserum in the northwest. Figure 2d shows only the farms that were abandoned before 1850 CE. Mining occurred from 1655 CE at Olserum. During the 17th century, the ore was still mined with fire, which required large quantities of wood.
Chronology, content in organic matter and sediment accumulation rate
The age-depth model for the lake Lillsjön (Figure 3) is based on 13 14C dates of which two have large errors, and two are inversed (Supplemental Table S2.1, Appendix 2, available online). Excluding these dates did not change the age-depth model significantly (results not shown). The decrease (at 180 cm) and increase (at 110 cm) of the estimated sediment accumulation rates (SARs) are related to parallel decreases and increases of the pollen concentrations (PCs) and pollen accumulation rates (PARs) (Supplemental Figure S2.2, Appendix 2, available online), which indicates that the low SAR values between 110 and 180 cm are an artifact, at least partly. A slight increase in organic matter at ca. 185 cm and decrease at ca. 120 cm (Supplemental Figure S2.1, available online) may be related to changes in SARs, however not certain. The peak (at 10 cm depth) and subsequent decline in spheroidal carboniferous particles (Figure 4) confirm the age-depth model of the last century (Figure 3).
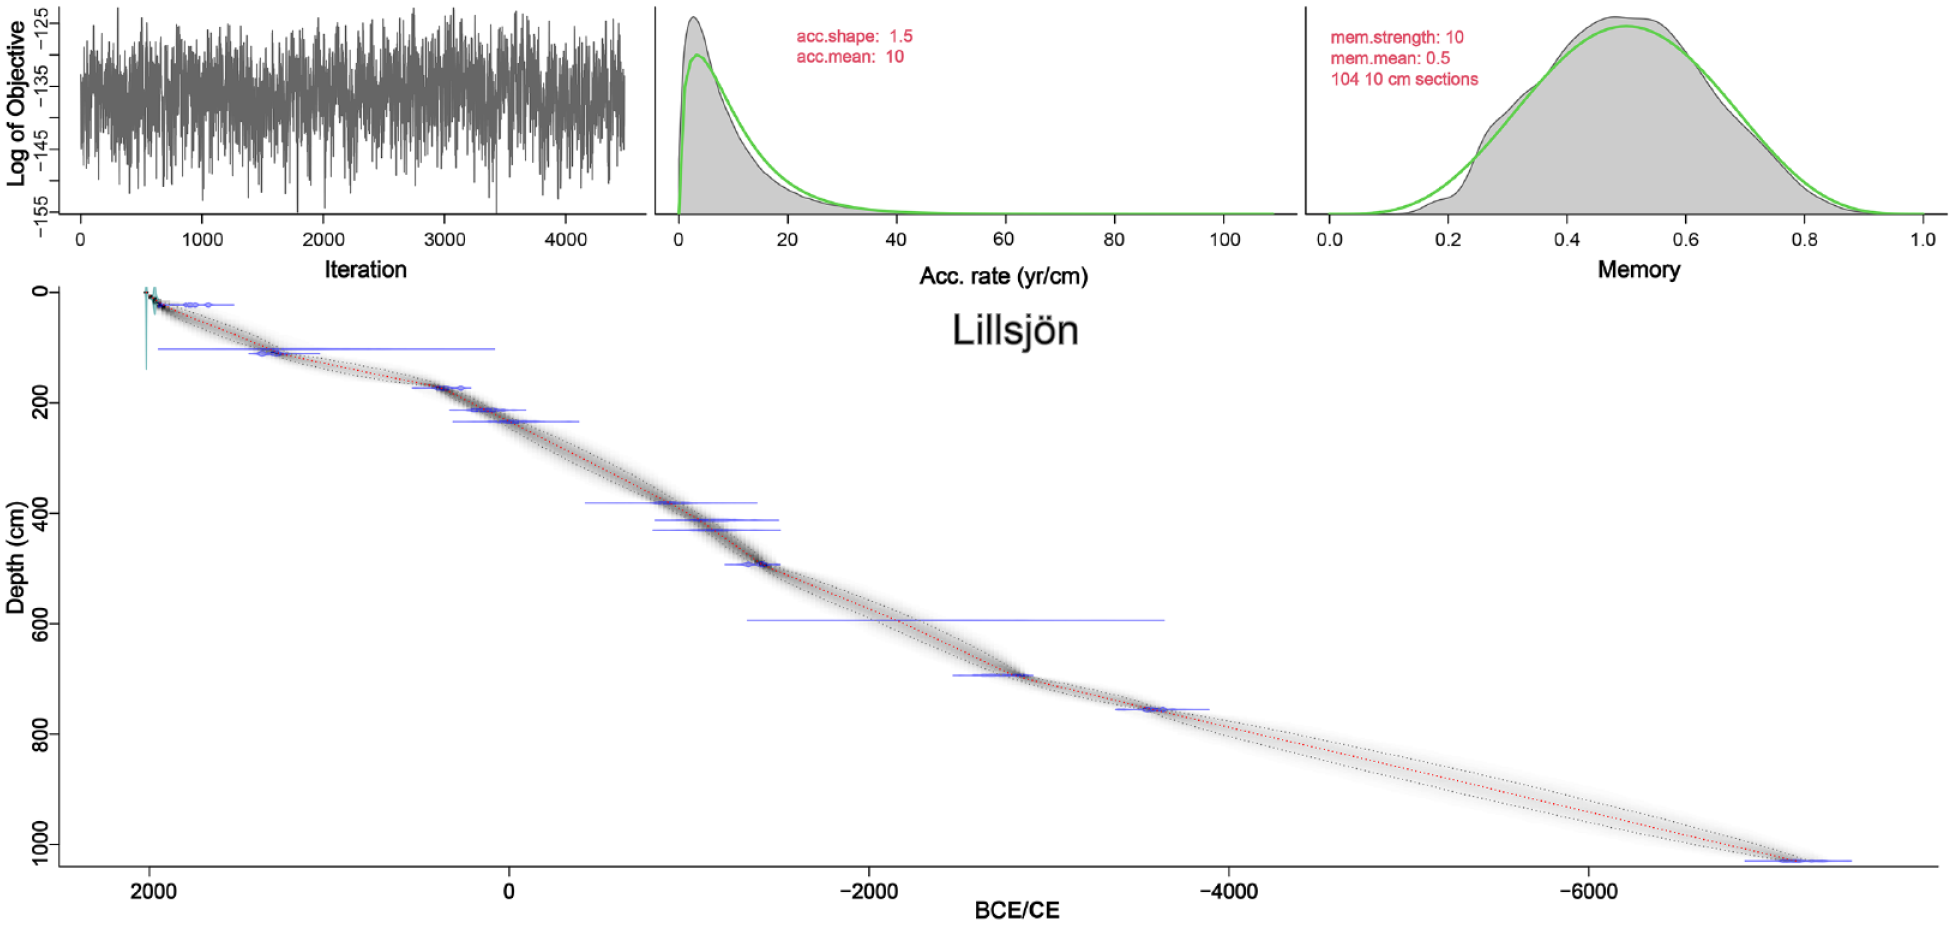
Age-depth model for the sediment cores from Lillsjön constructed using Bacon ver. 2.5.7 (Blaauw et al., 2022). 14C dates (blue) are calibrated using the IntCal20 dataset (Reimer et al., 2020); the red stippled line corresponds to the model’s best fit based on the mean age for each depth; the gray stippled lines delimit 95% confidence intervals.
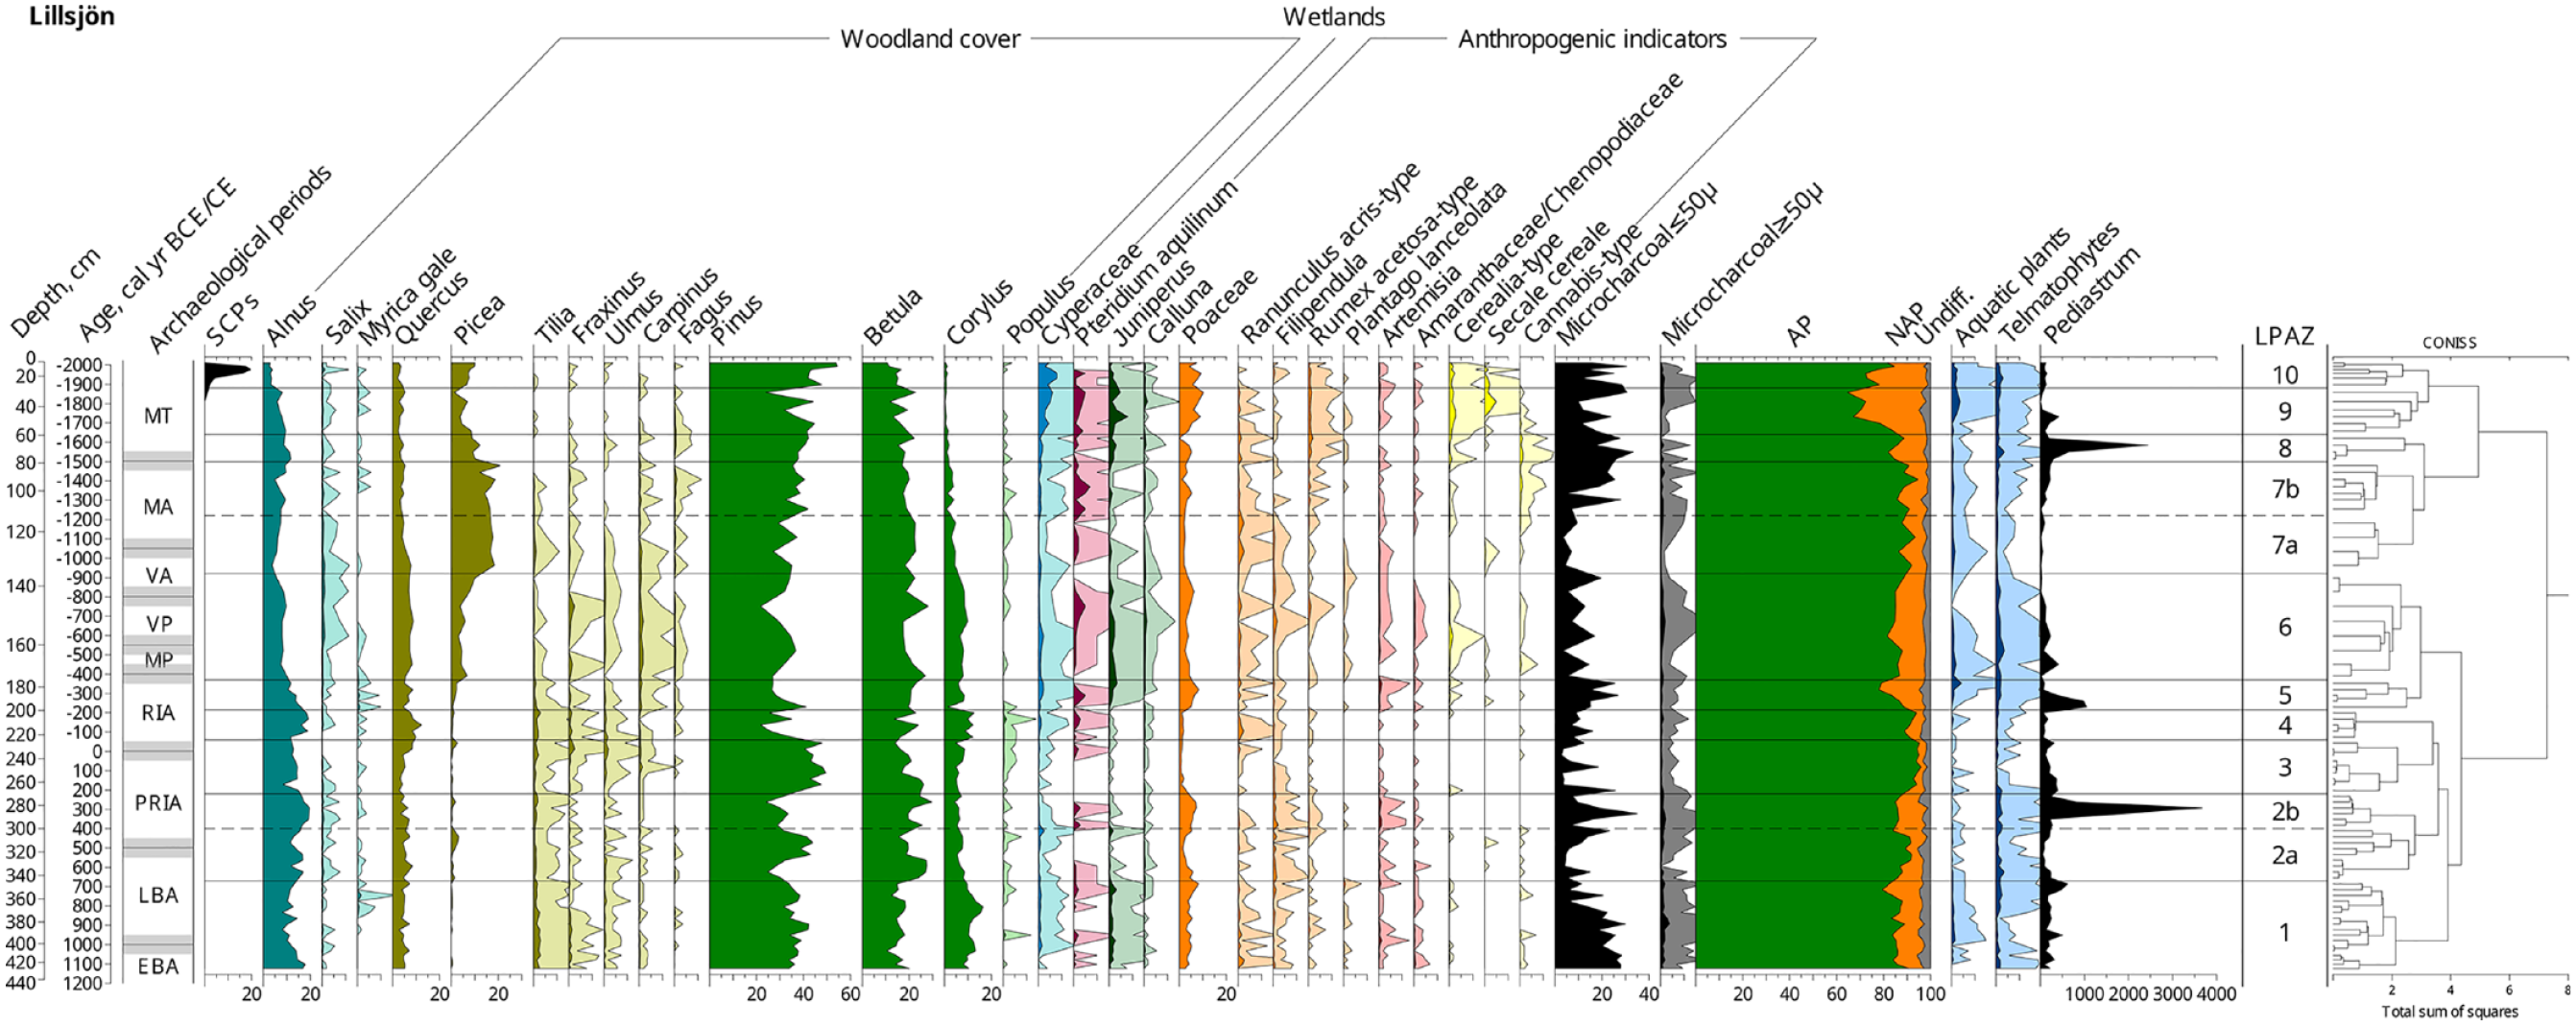
Lillsjön: percentage pollen diagram with the most common pollen taxa, Pteridium aquilinum spore, two charcoal fractions (longest axis ⩾ 10 - <50 μm and ⩾50 µm), pollen from aquatics and telmatophytes, and spheroidal carbonaceous particles (SCPs, left). The number of Pediastrum algae is the counted number for 100 Lycopodium spores (see Methods for details). The local pollen assemblage zones (LPAZ) and subzones (LPASZ) are based on a constrained cluster analysis (CONISS; Grimm, 1987). Colors represent groups of pollen taxa ascribed to different types of vegetation and land use (following Gaillard, 2013). % (dark color) and ×10 exaggeration (shaded). Bluish green: trees and shrubs on damp soil; brownish green: shade-tolerant trees and shrubs; green: light-demanding trees and shrubs; turquoise blue: wet meadows; dark pink: forest herbs and ferns; dark green: dry pastures and heath vegetation; orange: fresh meadows and pastures; dark red: ruderal communities; yellow: Cultivated land; dark blue: aquatics and telmatophytes. Archeological periods: EBA Early Bronze Age 1800–1000 BCE (only the last part represented in the pollen diagram), LBA Late Bronze Age (1000–500 BCE), PrRIA Pre-Roman Iron Age (500 BCE–0), RIA Roman Iron Age (0–400 CE), MP Migration Period 400–550 CE), VT Vendel time (550–800 CE), VA Viking Age (800–1050 CE), MA Middle Ages (1050–1500 CE), MT Modern time (1500 CE–present). Gray bands around the boundaries between archaeological periods account for uncertainties in chronologies (see main text under Discussion and Appendix 3, available online).
Pollen and microcharcoal analysis
The percentage pollen record (Figure 4) is dominated by APs (65–95%) with Pinus (25–55%) and Betula (10–30%) being the most abundant tree taxa over the entire studied sequence, although Alnus, Corylus, Picea, and Quercus have values >10% in some periods. Among NAPs (5–35%), Poaceae and Cyperaceae are dominant, followed by Ranunculus acris-type, Filipendula, Rumex acetosa-type and Artemisia. A total of 96 pollen taxa were identified including 21 AP taxa, 52 terrestrial NAP taxa, five spores (fern and moss taxa), eight aquatic taxa and 10 telmatophyte taxa (Figure 4 and rare pollen findings in Supplemental Table S2.3, Appendix 2, available online). Ten local pollen assemblage zones (LPAZs) were identified based on a CONISS analysis of the pollen percentages of terrestrial plants.
The LPAZs are described in detail in Supplemental Appendix 2, available online. The pollen diagram provides a detailed history of the local cultural landscape for the last 3000 years, from the end of Early Bronze Age to present. The LPAZs correspond roughly to fluctuations in the relationship AP/NAP, where boundaries between LPAZs correspond to an increase or a decrease in pollen % of NAP. The lowest % of NAP occurs in LPAZ 3 (ca. 2–3%), LPAZ4 and parts of LPAZ 2a and 7 (<10%), and the highest % in LPAZ 1, 2b, 5, 6, and 8 (10–20%) and 9–10 (>20% except for the most recent levels). Pollen indicators of agricultural activities (e.g. cereals, ruderals, and meadow/pastureland plants) occur from the bottom of the pollen diagram and vary in percentages throughout the diagram, the most common being Poaceae (grasses), Cyperaceae (sedges family), Ranunculus acris-type (showy buttercup and other buttercup species), Filipendula (meadowsweet and dropwort), and Artemisia (common mugwort and other mugwort species). Cereals (identified rye excluded) are most common in LPAZ 6, 9, and 10, and Secale cereale (rye) in LPAZ 9 and 10.
The largest change in tree pollen over LPAZ 1–4 is the decrease of Corylus (hazel), Tilia (linden) and Fraxinus (ash) at the end of LPAZ 1 from ca. 370 cm (ca. 850 BCE), followed by relatively low values of these taxa through LPAZ 2 and the first part of LPAZ 3, whereas Populus (aspen) increases to reach maximum percentages in LPAZ 4. Quercus (oak), Tilia, Fraxinus, and Ulmus (elm) increase at the end of LPAZ 3 and keep high percentages in LPAZ 4. Major changes in woodland pollen percentages occur from ca. 200 cm (ca. 200 CE) (LPAZ 4/5 boundary) with a decrease of Populus and all broadleaved trees (except Quercus) to very low percentages, while Alnus (alder) exhibits a progressive decrease over LPAZ 5. This change corresponds to an increase in NAP (LPAZ 5), followed by the regular occurrence of Picea (spruce) from 173 cm (ca. 400 CE) with up to ca. 5%. A second major change is the increase of Picea (>10%) from ca. 145 cm (end of LPAZ 6; ca. 800 CE) reaching close to 20% at 135 cm (ca. 950 CE) accompanied by decreases of broadleaved trees. Picea starts to decrease from LPAZ 8 (ca. 1500 CE) and most tree taxa decrease through LPAZs 7–8 to reach very low values in LPAZs 9–10, except Betula (birch) and Pinus (pine).
Pollen concentrations (PCs: # pollen per cm3; Supplemental Figure S2.2, Appendix 2, available online) and pollen accumulation rates (PARs: # pollen per cm2 and year; Supplemental Figure S2.3, available online) may provide useful information for the interpretation of pollen percentages. The major artifacts from percentage calculation are related to increases or decreases of very common pollen types such as Pinus, Betula, and Alnus, for which PCs and PARs may show that the change of percentage for one pollen type is “real” while the parallel change (decrease in %) of another taxon is an artifact, that is, there is no decrease of the absolute abundance of the pollen type. This is the case for most changes in percentages of Pinus and Betula, for example, over LPAZs 1–6. Similarly, an increase or decrease in AP % always corresponds to a decrease or increase, respectively, of NAP %, although one of the change maybe a calculation artifact. Here, PARs do not indicate this type of artifact over LPAZs 1–5 (Supplemental Figure S2.3, available online). From LPAZ boundary 5/6, the interpretation of PARs and PCs is problematic due to uncertainties in the calculation of sediment accumulation and other unknown factors. Nevertheless, the increase in PCs of AP from the middle of LPAZ 7 (increases of Betula, Pinus, and Picea) is not related to a decrease of NAP PCs. For more details on (1) PCs and PARs results and interpretation, see Supplemental Appendix 2, available online and (2) uncertainties, see Supplemental Appendix 3, available online.
Pollen-based regional and local plant cover
Age-depth models
The new age-depth models for the four additional sites used in the Landscape Reconstruction Algorithm (LRA) application are shown in Supplemental Figure S2.4, Appendix 2, available online). These models (i.e. chronologies) are based on a smaller number of 14C dates than Lillsjön’s (Table 1; Figure 3) and are less certain for some periods, that is, ca. 1000 BCE–0 (Storsjön), ca. 500–700 CE and 1500–1800 CE (Tjursbosjön), ca. 1200–600 BCE and 0–1000 CE (Stärringen), and ca. 200–1000 BCE, 200–700 CE, and 1000–1600 CE (Hyttegöl). The age-depth models also indicate the occurrence of sediment hiatuses (or very low sediment accumulation rates) at Stärringen around 1000 CE, and between ca. 1000 and 1500 CE at Hyttegöl, both confirmed by pollen data at ca. 55 cm (Almgren, 2008) and ca. 42 cm (Karlsson et al., 2015), respectively.
Regional REVEALS-based and local LOVE-based plant cover
Because REVEALS and LOVE require values of relative pollen productivities (RPPs), model-based estimates of plant cover can be achieved for taxa for which RPPs are available, in this case 28 plant taxa (harmonized with 28 pollen morphological types/taxa, see Methods for details). The 28 pollen taxa used in the REVEALS and LOVE reconstructions represent 98.2% to 99.2% of the total pollen from terrestrial plants (Table 1).
Regional REVEALS-based plant-cover estimates for the last 3000 years from the Storsjön’s pollen record are presented in Figure 5a and Supplemental Figure S2.5, Appendix 2, available online). For comparison, we show the REVEALS plant-cover estimates for the last 1300 years based on (a) the pollen record from Tjursbosjön (Supplemental Figure S2.6, Appendix 2, available online) and (b) the pollen records from two of the small lakes Lillsjön (L), Stärringen (S), and Hyttegöl (H) and the large lake Tjursbosjön (T) (Figure 5b, Supplemental Figure S2.7, Appendix 2, available online).
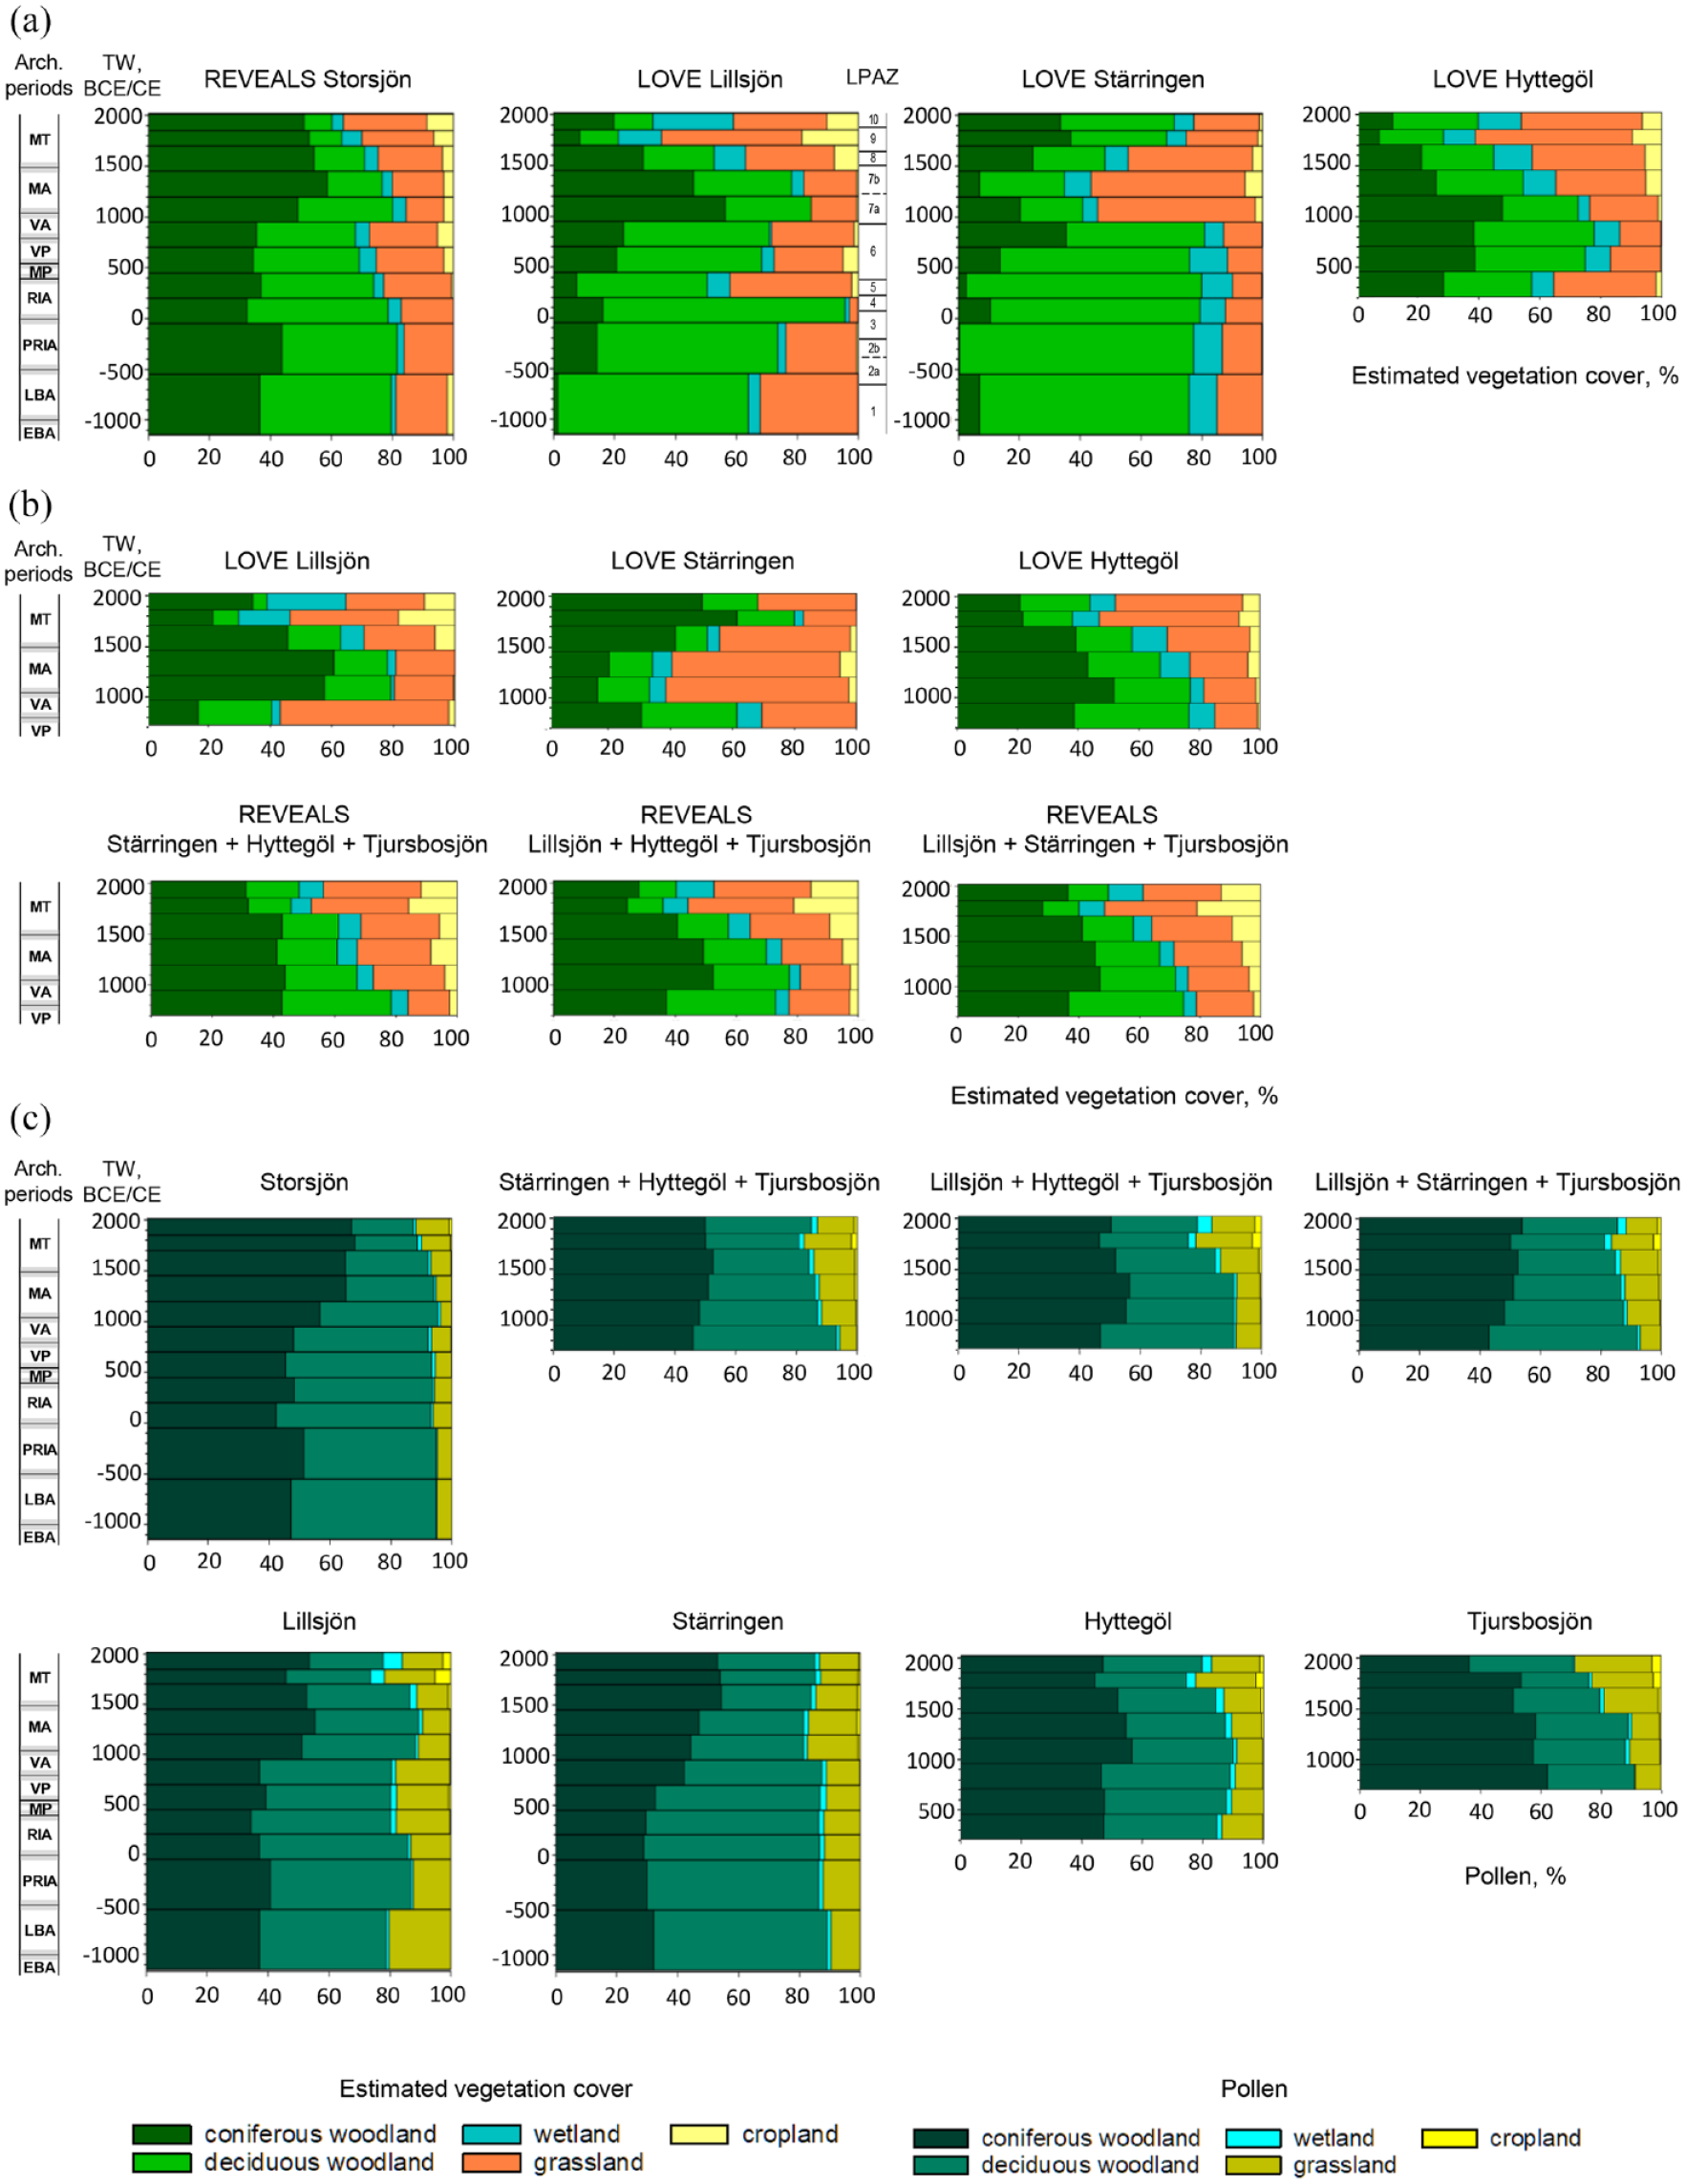
REVEALS reconstructions of regional plant cover and LOVE reconstructions of local plant cover (a and b), and pollen percentages for comparison (c). The 28 plant taxa used in the reconstructions (see Figure 6) are grouped into five land-cover types for an easier comparison. Note that Juniperus is included in grassland, and coniferous woodland includes Pinus and Picea. The study period was divided into 11 Time Windows (TW) (see Supplemental Appendix 1, available online for rationale behind the definition of TWs and Supplemental Table S1.1, available online for the TWs age boundaries). Archeological periods, see caption of Figure 4 for explanation of abbreviations and ages. (a) REVEALS reconstruction of regional plant cover using the pollen record from Storsjön, and LOVE reconstruction of local plant cover using the pollen records from the three small lakes Lillsjön (L), Stärringen (St), and Hyttegöl (H) using the regional vegetation cover from Storsjön. (b) LOVE reconstructions of the local plant cover for the same three small lakes L, St, and H, with the regional plant cover obtained from REVEALS reconstructions using the pollen records from Tjursbosjön (large lake, T) and two of the pollen records from small lakes, that is, the “leave-one-out approach,” St+H+T, L+H+T, and L+St+T for Lillsjön, Stärringen, and Hyttegöl, respectively. (c) Pollen percentages for Storsjön, the three 3-lakes alternatives StHT, LHT, and LStT, the three small lakes L, St, and H, separately, and the large lake T. For details on REVEALS and LOVE reconstructions, see Supplemental Appendix 1, available online.
Local LOVE-based plant-cover estimates around the three small lakes for the last 3000 years (Lillsjön, Stärringen) and 2000 years (Hyttegöl) using the REVEALS regional plant cover from Storsjön are presented in Figures 5a and 6 and Supplemental Appendix 2 Figures S2.8, S2.9, available online. For comparison, we show the LOVE plant-cover estimates around the three small lakes over the last 1300 years using the REVEALS plant cover based on multiple sites (two of the three small lakes and the large lake Tjursbosjön) (Figure 5b).
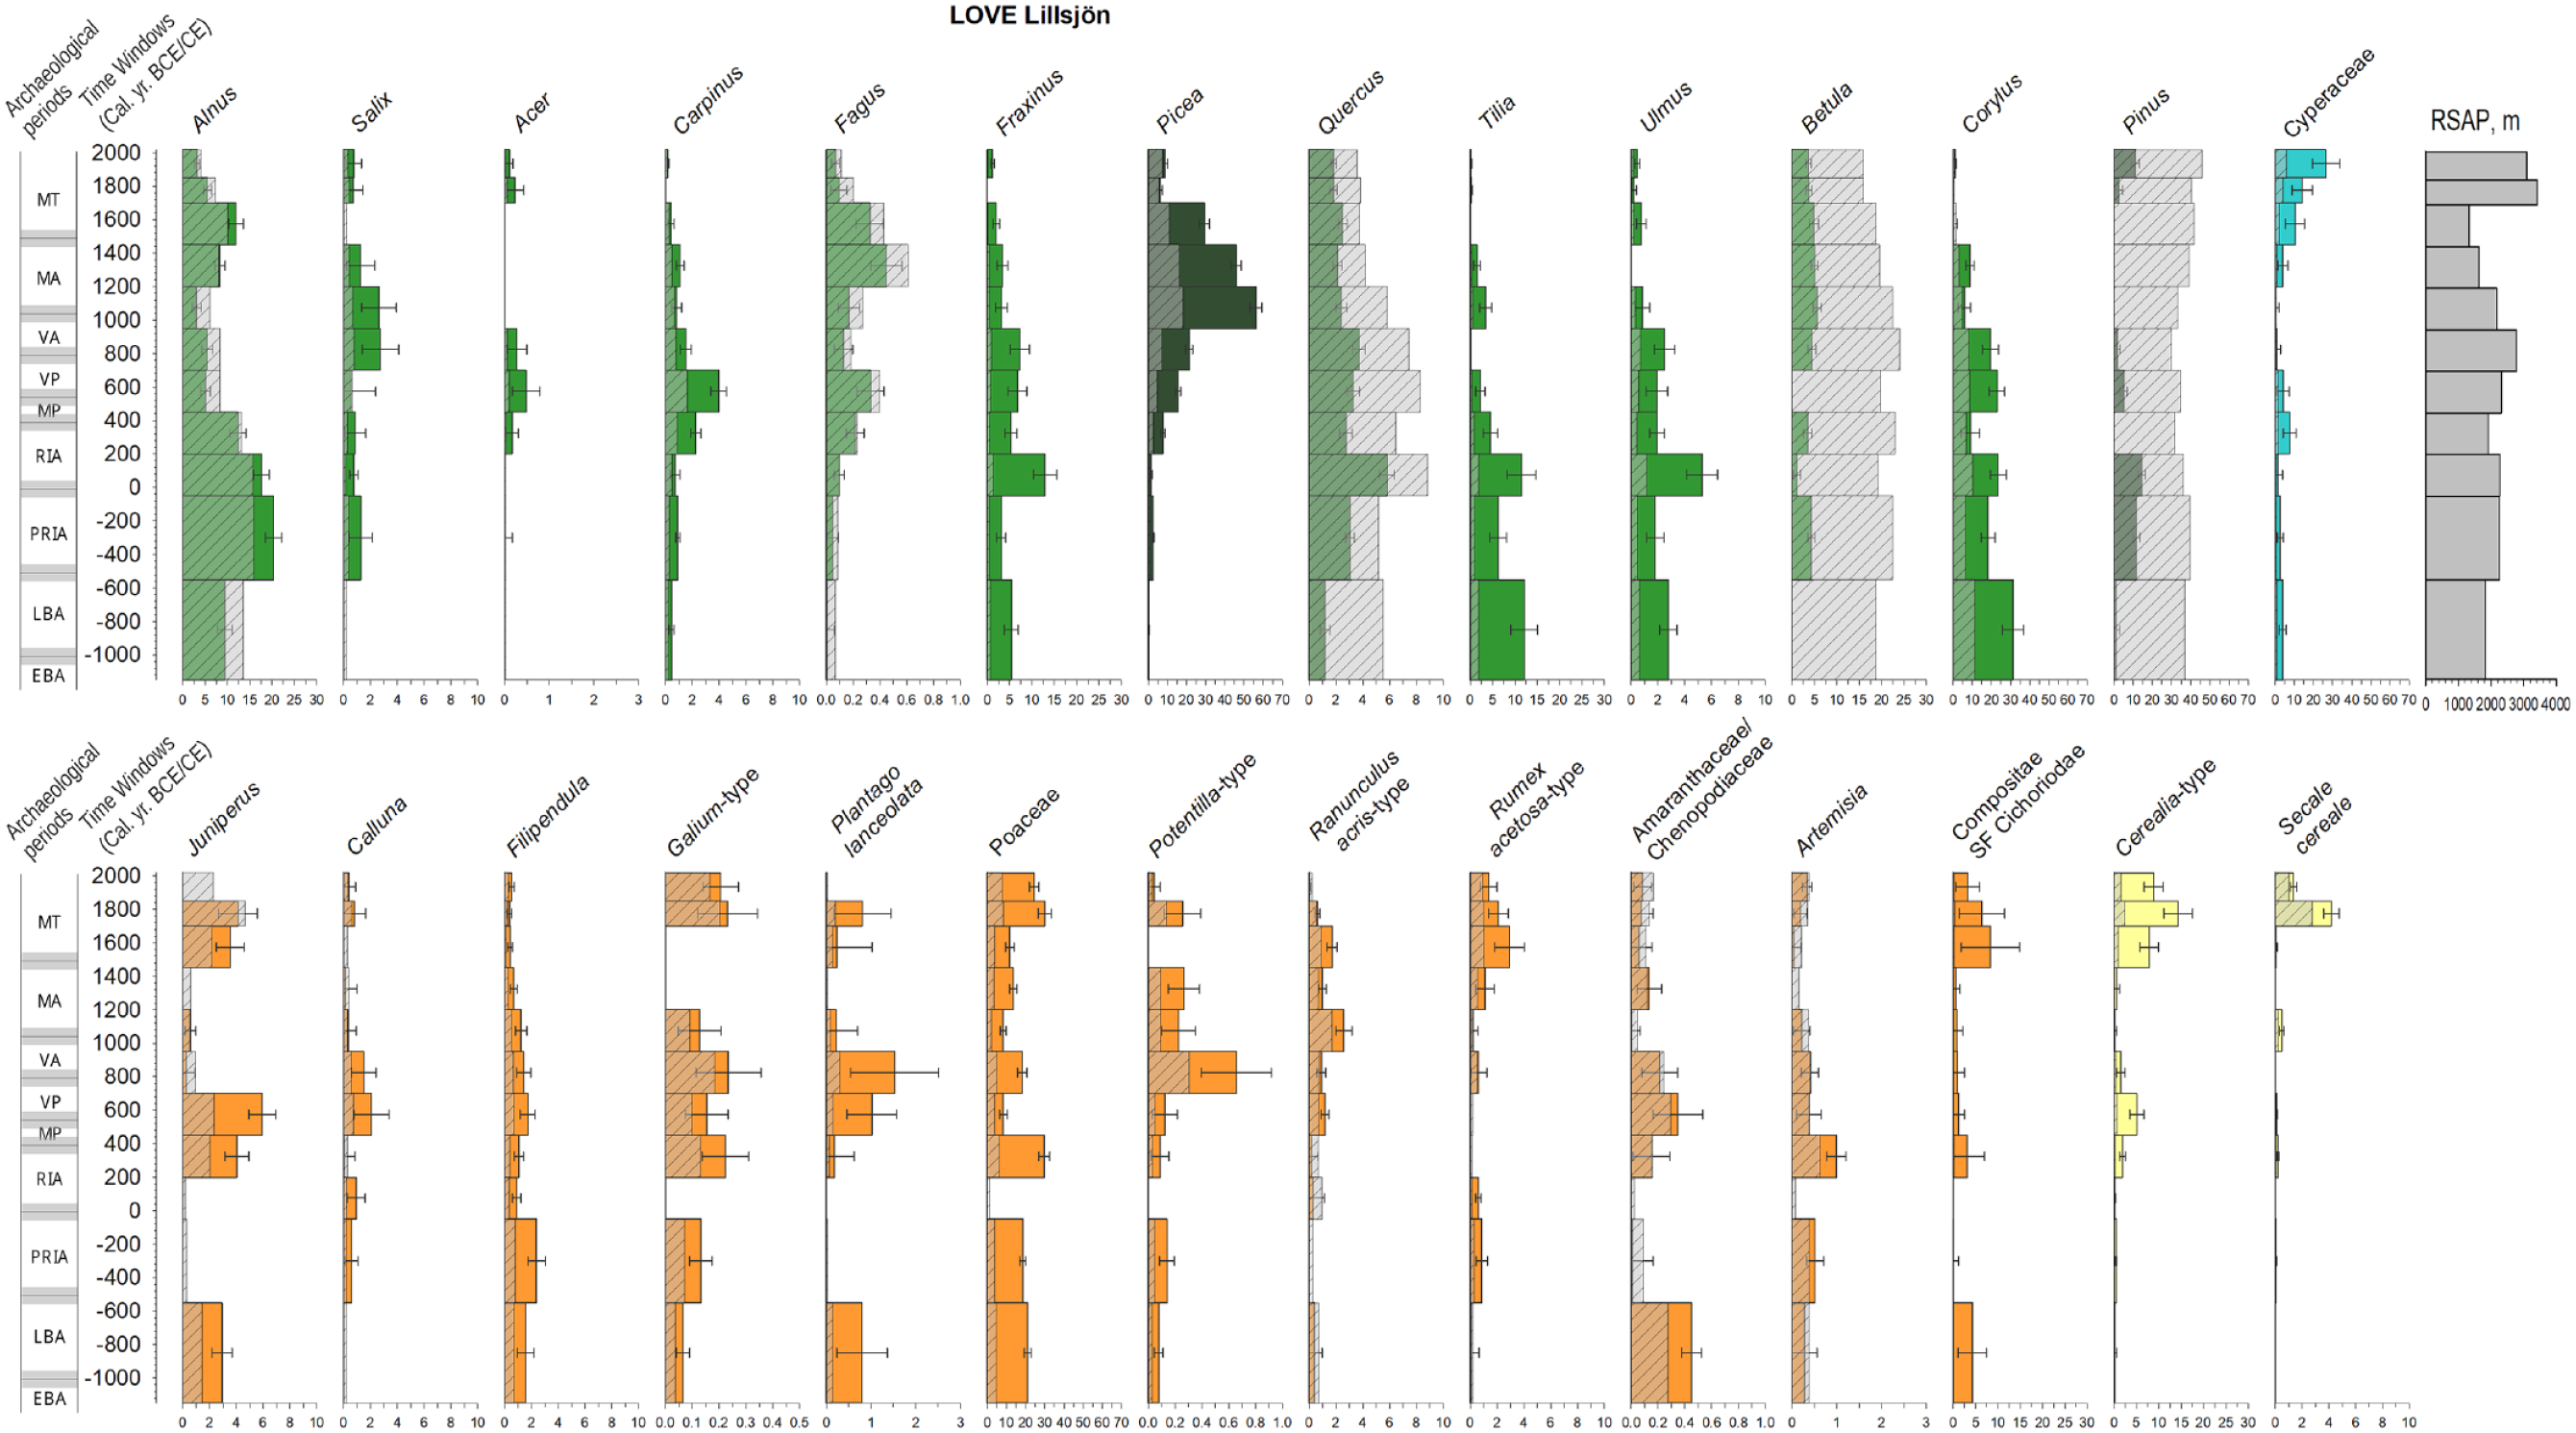
Lillsjön: LOVE estimates of local plant cover (in % cover, colored) and pollen % (gray). The REVEALS estimates of regional plant cover from Storsjön were used in the LOVE model to calculate the relevant source area of pollen (RSAP), that is, the radius of the area representing the spatial scale of the reconstruction (see Figure 1). Green: deciduous trees; dark green: conifers (except Juniperus); turquoise: Cyperaceae (wet meadows); orange: grassland; yellow: cropland. The archeological periods are shown for comparison (see caption of Figure 4 for explanation of abbreviations and ages). For details see Methods section, and Supplemental Appendix 1, available online.
A specificity of LOVE reconstructions is that plant cover is estimated for the RSAP, that is, an area specific for each small study site. RSAP is estimated by the LOVE model using regional REVEALS-based plant-cover estimates and the pollen counts from the small site. The LOVE model then subtracts the background pollen (coming from beyond the RSAP) from the small lake’s pollen assemblages. It implies that pollen of some taxa can get very low values or are absent from the pollen coming from within the RSAP, which leads to absence of the plant within the RSAP or very low cover estimates, often not different from zero when the SE is considered. This is the case for, for example, Betula (1150–550 BCE, 50 BCE–200 CE, 450–700 CE), Pinus (1150–550 BCE, 200–450 BCE, 700–1850 CE), and Juniperus (juniper) (1850 CE to present) at Lillsjön (Figure 6), although pollen percentages of these taxa are high (Figure 4). Therefore, the LOVE reconstruction is not only dependent on the pollen record from the small lake but is also influenced by the pollen record used to reconstruct regional plant cover.
The size of RSAP for the three small sites was estimated in the LOVE model runs for each of the 11time windows. When the REVEALS regional plant cover from Storsjön is used in the LOVE runs, RSAP estimates vary between 1820 and 3090 m radius, and has a mean value of 2360 m (Figure 6). These values agree with earlier RSAP estimates for small lakes in southern Sweden in several empirical and simulation studies (e.g. Cui et al., 2013; Fredh et al., 2019; Hellman et al., 2009a, 2009b) in which most of the estimates (radii) are falling in the interval 1000–3000 m.
The REVEALS and LOVE plant cover and their related standard error (SE) are plotted together with the pollen percentages (PPs) in Figure 6 and Supplemental Appendix 2, Figures S2.5 to S2.9, available online. When SE ⩾ mean REVEALS or LOVE estimate, the plant cover is not different from zero, that is, it is not reliable. To avoid repetition, the major REVEALS and LOVE results are described in the Discussion below, and details are provided in Supplemental Appendix 2, available online together with a description of the differences between PPs and estimated plant cover.
Discussion
Uncertainties in chronologies and in the interpretation of pollen data in terms of human-induced vegetation (via land use) are discussed in detail in Supplemental Appendix 3, available online. Here, we summarize the major points to be considered in the discussion below. The uncertainties in the chronology of Lillsjön imply that the attribution of inferred vegetation, land-use and land-cover changes to archeological periods must be considered with caution. A clear indication of a bias toward slightly too old ages as inferred from Lillsjön’s age-depth model is the pollen curve and LOVE-based reconstruction for Picea (Figures 4 and 6). Its earliest LOVE-based local presence is dated to 200 CE, which is too early if we rely on the studies by Bradshaw and Lindbladh (2005). These authors dated the local establishment of Picea abies at three sites ca. 50 km S of Gamlebyviken to ca. 1000 CE. This would support our assumption of too old ages by a few centuries. For comparison, the front of Picea abies migrating from Northeast and East reached Stockholm area ca. 1000 BCE and our study region ca. 0 CE according to Seppä et al. (2009), adapted from Giesecke and Bennett, 2004). More recent maps of the tree migration in Europe by Giesecke et al. (2017) based on all pollen records archived in the European Pollen Database rather than a few selected pollen records (Giesecke and Bennett, 2004; Seppä et al., 2009) indicate the regional presence of Picea abies at the location of Stockholm at 4000 BCE (approximation of the regional presence, class 1) or 2500 BCE (using a more conservative threshold for presence, class 2). At 2000 BCE an increased abundance (class 3) is suggested. In our study region, the first regional presence is dated in Giesecke et al. (2017) to 2500 BCE (class 1) or 0 CE (class 2), and an increased abundance (class 3) to 1000 CE. If establishment is defined as an increased abundance rather than just presence of the species, the results from Giesecke et al. (2017) agrees with those from Bradshaw and Lindbladh (2005) for our study region. Although recent studies of ancient DNA suggest that small populations of Picea were already present in southern Sweden since Late Glacial, it is first during a second colonization, starting 5000 BCE in northern Sweden and 4000 BCE around Stockholm (Giesecke et al., 2017), that it built continuous woodland stands (Nota et al., 2022).
The dates of each archeological period boundaries according to Berglund (1991) are given the first time the period is mentioned below. These dates provide an approximate age for the start and end of the periods based on many 14C dates from southern Scandinavia. However, the boundaries are not sharp but rather transitions that may cover several centuries. Therefore, they are represented by gray bands in Figures 4 to 6, and Figures S2.5–S2.9 (Supplemental Appendix 2, available online). Furthermore, the uncertainties in chronologies of all sites imply that the time windows used in the REVEALS and LOVE reconstructions cannot be expected to be exactly synchronous between sites/reconstructions, that is, one should consider errors of ±200 years on the ages of the boundaries between time windows.
Pollen grains can seldom be identified to the plant species, but can be ascribed to the family, group of genera, or genus. Therefore, it is not possible to quantify with precision the cover of human-induced vegetation types as many of their characteristic pollen types/plant taxa may also grow in natural vegetation. Therefore, the REVEALS- or LOVE-estimated landscape openness (herbs cover) approximates deforestation by humans, however the cover of wetland (here represented by Cyperaceae only) and grassland together may overestimate the cover of grazed land and hay meadows in various degree depending on the site and period. In contrast, the cover of cropland is always underestimated as it represents only cereals. Other crops have either poor pollen productivity (and are rare in pollen records) or cannot be distinguished from wild species and are therefore included in grassland. Finally, one should remember that LOVE and REVEALS reconstructions do not include bare ground. Because the cover of bare ground is naturally high in the study region due to exposed bedrock and thin soils, absolute changes in LOVE and REVEALS cover of wooded and herb vegetation would be smaller in actual percentage cover if the cover of bare ground was included. For instance, if bare ground represents 50% of the RSAP of a small lake, and the LOVE-based cover of total trees and total herbs is 20% and 80%, respectively, it implies that their actual cover is 10% and 40%, respectively. The values of cover we are providing below are always higher than the actual cover. Given that we have no measure of the cover of bare ground through time, we cannot adjust the REVEALS and LOVE cover estimation accordingly.
The local cultural landscape around Lillsjön during the last 3000 years
Here we discuss the cultural landscape history around lake Lillsjön using all information from the pollen record, that is, pollen percentages (PPs) (Figure 4; Supplemental Table S2.3, Appendix 2, available online), pollen concentrations (PCs) (Supplemental Figure S2.2, available online), PARs (Supplemental Figure S2.3, available online), LOVE estimates of local plant cover within the lake’s relevant source area of pollen (RSAP) (Figures 5 and 6), and the information from the analysis and mapping of the archeological findings around the lake (Figure 2).
Anthropogenic indicators of agriculture (pollen of herbs and low shrubs belonging to cereals, weeds, ruderals, and plants characteristic of hay meadows and/or pastureland; Gaillard, 2013) occur from the bottom of the pollen diagram (Figure 4). Moreover, each local pollen assemblage zone (LPAZ) is clearly defined by changes in composition and total percentage of both AP and NAP, as well as changes in LOVE-based local plant cover within the lake’s RSAP (ca. 2000–3000 m radius, Figure 6). These characteristics indicate a dynamic landscape history with continuous agricultural activities around the lake that are changing in character and intensity both in time and space.
LPAZs 1 and 2 (ca. 1200–200 BCE: Bronze Age and Early Iron Age)
The bottom of the pollen diagram is dated to the end of the Early Bronze Age (1800–1000 BCE). However, possible reservoir and hard-water effects may imply that LPAZ 1 represents only the Late Bronze Age (1000–500 BCE). Similarly, LPAZ 2 might correspond to the entire Pre-Roman Iron Age (500 BCE–0).
The archeological data indicate extensive human activities in the area during the Bronze Age and the transition to the Pre-Roman Iron Age (Figure 2b and c). The LOVE-based local cover of trees in LPAZ1 is dominated by Corylus (30%), followed by Tilia (13%). Carpinus (hornbeam) may have grown locally, although in very small quantity, whereas Pinus, Betula, and Salix (willow) were probably not growing within the RSAP of Lillsjön. Corylus and Tilia decrease in cover in LPAZ 2 to 17% and 7%, respectively, while the cover of Alnus increases from a low percentage cover to 20%. Identical relative changes are shown in the PPs, PCs, and PARs. Corylus may have been coppiced for wood and Tilia pollarded for fodder during the Bronze Age. Pinus, Betula and Salix are present with a cover of 10%, 5%, and 1%, respectively. Carpinus exhibits a slight increase of cover.
This period is characterized by a relatively high LOVE-based local cover of open land (ca. 25–32% cropland and grassland together, ca. 30–35% with Cyperaceae included). Pollen of Cerealia type (belonging to Hordeum (barley) and Triticum (wheat) pollen-morphological types) occur throughout LPAZs 1 and 2, which suggests arable land within the RSAP. The presence of Secale cereale and Centaurea cyanus (cornflower) (Supplemental Table S2.3, Appendix 2, available online) indicates that rye may have been cultivated (e.g. Behre, 1981; Gaillard and Göransson, 1991; Körber-Grohne, 1987). Herbs indicating grazing land and meadows are well represented as pollen and in the plant cover (Ranunculus acris type, Filipendula, Rumex acetosa type (sorrels and docks), Plantago lanceolata (ribwort plantain), Poaceae; with regular occurrences of Anthriscus sylvestris (cow parsley), Aster type (several genera of the aster family, e.g. asters, beggarticks, cudweeds, etc.) and Potentilla-type (cinquefoils and strawberries) (Supplemental Table S2.3, available online) as well as herbs common in ruderal land (Artemisia (mugwort, wormwood, sagebrush, etc.) in particular, but also Plantago major/media (broadleaf plantain/hoary plantain) and Urtica (nettles) (Supplemental Table S2.3, available online). The LOVE-based local cover indicates that Poaceae are dominant (20%) followed by Compositae Cichorioideae (chicory subfamily in the aster family, e.g. lettuce, dandelions, chicory, etc.) (5%) and Juniperus (3%).
Microcharcoals have relatively high values in LPAZ1, decrease over the transition to LPZA 2, and reach minimum values in subzone 2a corresponding to low PPs and LOVE cover of ruderal herbs, grazing land (Juniperus), and meadows (Plantago lanceolata) (Figures 4–6). In combination with the changes in tree composition, these changes may indicate abandonment of some open land areas within the lake’s RSAP, but it cannot be confirmed by the archeological data. The findings ascribed to Early Iron Age are numerous, but they are mostly associated to Bronze Age findings.
A decrease in open land at the beginning of the Pre-Roman Iron Age has been discussed in the southernmost province of Sweden, Scania (Berglund, 1991). Rather than representing a real decline of human pressure on the landscape, it was suggested that such a decrease could result from a concentration of agricultural land to the immediate vicinity of settlements/farms (e.g. Tesch, 1991; Tesch and Olausson, 1991), which was supported by some archeological data (e.g. Callmer, 1991a, 1991b; Olausson, 1991a, 1991b). A similar development at the transition between Bronze Age and Pre-Roman Iron Age is suggested by pollen data in the provinces of Blekinge (southeastern Sweden, e.g. Åkesson et al., 2015; Berglund et al., 2007, 2021) and Småland, (e.g. Berglund et al., 2002; Cui et al., 2013; Digerfeldt, 1972; Lagerås, 2000, 2002).
The increase in PPs and LOVE-based local cover of Alnus and decrease in PPs of aquatic plants at the LPAZ 1/2 boundary, as well as the peak in the algae Pediastrum in subzone 2b (Figure 4), may be due to a drop in lake water-level. Interpretation in terms of lake-level changes based on data from a single core is uncertain (e.g. Digerfeldt, 1988). Nevertheless, low lake-levels starting around the Bronze Age/Pre-Roman Iron Age boundary were inferred from detailed studies in Scania and Småland (Digerfeldt, 1988; Gaillard and Digerfeldt, 1991). These events may be related to the Roman Warm Period (see further discussion, below).
LPAZs 3 and 4 (ca. 200 BCE–220 CE: Early Iron Age)
This period is dated to the last part of the Pre-Roman Iron Age and the first part of the Roman Iron Age (0–400 CE). We cannot rule out the possibility of a slightly too old age (see above).
The LPAZs 2/3 boundary corresponds to a significant decrease in PPs, PCs, PARs and LOVE-based local cover of anthropogenic indicators that remain low until the end of LPAZ 4, with a minimum NAP cover of 5% during the Roman Iron Age. The tree PPs and PARs show an increase in Fraxinus, Tilia, Quercus, Ulmus (elm), and Corylus, and a decrease in Pinus over the transition between LPAZ 3 and 4. At the same time, Populus tremula (aspen) exhibits a slight, but clear increase in PPs, and keep similar values until the end of LPAZ 4. The increase in broad-leaved trees is also clear in the LOVE-based local tree composition (time window 50 BCE–200 CE (Figure 5). Corylus (27%) is still dominant in the local tree cover, followed by Tilia and Fraxinus (12%), Quercus (6%), and Ulmus (5%).
Herbs indicative of human activities have very low PPs, PAR, and LOVE cover or are absent from the record (LPAZs 3 and 4). The absence of pollen from Cerealia type and Secale cereale indicates that cereal cultivation probably ceased locally. Meadows and grazing land were probably abandoned around Lillsjön, which favored the local growth of Fraxinus, Quercus, Ulmus, and Populus.
A less intensive land use during the Roman Iron Age and Migration Period (400–550 CE) has been discussed for southern Sweden and tentatively ascribed to restructuring due to climate change and/or socio-economical changes associated with an unsustainable agrarian system during Bronze Age and Pre-Roman Age (e.g. Tesch, 1991; Tesch and Olausson, 1991). It was suggested that the Pre-Roman Iron Age and Roman Iron Age period represented the transition between an extensive use of the landscape to a more concentrated use close to settlements. Trees such as ash and elm may have been pollarded for fodder and wood, and hazel coppiced. Such an interpretation is also plausible for our study area. The archeological data (Figure 2c and d) show that the Medieval villages assumed to be related to Iron Age settlements, that is, Fästad, Vida, Langeharg and Valstad, are all located >1–2 km from Lillsjön. Our results may indicate that arable land and meadows moved progressively from the lake’s surroundings that may have been abandoned for a century.
The studies of lake-level changes available in Scania and Småland indicate low lake levels during Early Iron Age from ca. 500 BCE to ca. 500 CE (Digerfeldt, 1988; Gaillard and Digerfeldt, 1991), which may be correlated to the Roman Warm Period (generally dated to 250 BCE–400 CE, e.g. Campbell et al., 1998). Recent reanalysis of global climate proxy data has shown that there is no evidence of globally coherent warm and cold periods over the last 2000 years, except for the last 150 years of global warming (Neukom et al., 2019). Nevertheless, although not exactly of the same length in all studies, a warm period corresponding to all, or part of the Roman period was documented in Europe based on various types of climate proxy data. The evidence of a warmer climate supports the interpretation of a reorganization of land use from extensive during Bronze Age to concentrated around settlements in the Iron Age, rather than a decrease in land use with a decrease in population due to climate change. However, the Migration Period (ca. 400–550 CE) was a turbulent time in all Europe, which influenced Scandinavia. In southern Sweden, it led to regional conflicts between local kings and rich landowners, not least in our study region (Alfsdotter et al., 2018; Lindström, 2022). Such conflicts may have caused local abandonment of farms or settlements.
LPAZs 5 and 6 (ca. 220–900 CE: Late Early Iron Age–Late Iron Age)
LPAZs 5 and 6 are dated to the period from the later part of the Roman Iron Age to the first part of the Viking Age (800–1050 CE). The LPAZs 4/5 boundary may correspond to the beginning of Late Iron Age (Vendel Period, 550–800 CE). There are only three locations with archeological findings dated specifically to the Late Iron Age within 3 km of Lillsjön. Besides, findings from nine locations are dated to the Iron Age without further specification. Of these 12 locations, only four are within 2 km of Lillsjön. However, most concentrations of grave fields dated to the Late Iron Age (550–1050 CE) are situated beyond 3 km from Lillsjön and often associated to a farm. Moreover, they are located at lower elevations than during the Bronze Age and Early Iron Age. SE from the lake, close to the northern part of the bay Gamlebyviken, several large grave fields and a Viking Age maritime timber construction are testimonies of an area of particular importance during the Late Iron Age. According to the latest shore displacement curve for the Gamleby area (Katrantsiotis et al., 2023), the shoreline dropped from 11 m a.s.l. at the onset of the Bronze Age down to 3 m a.s.l. at the beginning of the Late Iron Age, which might be one of the reasons behind the move of farms and grave fields to new, lower elevations.
A significant increase of NAP PPs and a related decrease in AP PPs at the LPAZs 4/5 boundary are confirmed by PCs and PARs. PPs and PCs keep similar values until the end of LPAZ 6. The LOVE-based NAP cover is ca. 43% (50% with Cyperaceae) in LPAZ 5 and the beginning of LPAZ 6 (ca. 250–450 CE), which is significantly larger than during the Late Bronze Age. It then decreases to ca. 30% (36% with Cyperaceae). The LOVE cover of cereals reaches a maximum of ca. 5% in the time window 500–700 CE. LPAZ 5 is characterized by a peak in microcharcoal. Cultivated fields and hay meadows were close to the farms, and the rest of the landscape was used for grazing. With time, more land was needed, and Lillsjön’s RSAP was used again, however primarily for grazing. The latter is also confirmed by the LOVE-based increase in cover of Juniperus (up to 5%) and Poaceae (up to 30%). The continued presence of Juniperus and the increase in Calluna (heather) in LPZ 6 suggest that Lillsjön was used for grazing during the entire period. The increase in Cerealia type to 5% cover and the occurrence of Secale cereale and Centaurea cyanus pollen indicates the occurrence of some arable land within Lillsjön’s RSAP.
The trees favored earlier by ca. a century of land-use abandonment around Lillsjön, Fraxinus, Quercus, Ulmus, Tilia, and Populus decreased in cover. In contrast, Corylus became more abundant, which may also be an indication of coppicing. When coppiced over long time, hazel stands will become less dense, which will favor flowering and lead to an increase in pollen production. Carpinus and Fagus seem to be favored locally by the change in land-use. Picea is present locally from 200 CE (probably too old age, 500 CE is more plausible, see discussion on chronology at the beginning of the section) and increased from 5% to 20% cover in the last part of LPAZ 6. Pinus is absent again from the RSAP from 200 CE to 450 CE and represented with very low cover from 450 CE to 950 CE.
PPs, PCs, and LOVE-based cover of Alnus decrease over LPAZ 5 and remain low throughout LPAZ 6, while values of telmatophytes and aquatics increase, which may be due to a rise in lake water-level and coincide with the period of rising and high lake levels ca. 500–700 CE in southern Sweden (Digerfeldt, 1988; Gaillard and Digerfeldt, 1991).
LPAZs 7 (ca. 900–1500 CE: Late Iron Age-Middle Ages)
LPAZ 7 is dated to the later part of the Viking Age and entire Middle Age (1050–1500 CE) but may correspond to Middle Ages only. Although many farms of the area are assumed to have been established already in the Iron Age, none of them are named in written sources before the 14th and 15th centuries (1300–1400 CE). Therefore, the density and size of farms in Lillsjön’s RSAP in early Middle Ages is not known.
At the LPAZs 6/7 boundary, a slight decrease in PPs, PCs, and PARs of NAP corresponds to a very clear decrease in LOVE-based NAP cover to ca. 15% and low microcharcoal percentages. All indicators of human activities are decreasing at the LPAZs 6/7 boundary, except Ranunculus acris-type. The only tree taxon that increases significantly is Picea, from ca. 20% to 55% cover. Pinus is absent from the RSAP over LPAZ 7. There is little change in the cover of broadleaved trees, except Corylus decreasing significantly from ca. 20% to 5% in subzone 7a, which may indicate local abandonment of coppicing for a few centuries, rather than a decrease in cover. All these changes suggest a decrease in land use within the Lillsjön’s RSAP during early Middle Ages. The latter may have triggered the large increase in Picea. A similar development was described at two of the sites located south of Lillsjön studied by Bradshaw and Lindbladh (2005).
The 7a/7b boundary (1250 CE) is characterized by a slight increase in NAP PPs, PCs and PARs, an increase in LOVE-based NAP cover to 18% (22% with Cyperaceae) and in microcharcoal percentages. Subzone 7b is distinguished from 7a by slightly larger LOVE-based cover of some land-use indicators (Poaceae, Rumex acetosa-type and Amaranthaceae/Chenopodiaceae (amaranth family with e.g. goosefoots, saltbush, orach). Pollen of Cerealia-type is again more common, suggesting that cultivation of cereals occurs within Lillsjön’s RSAP. Pollen of Cannabis-type (hemp and hop (Humulus lupulus)) occur regularly for the first time, which may be related to hemp retting in Lillsjön, a procedure that existed in southern Sweden since the Vendel time to obtain fibers for making fabrics and ropes (e.g. Gaillard et al., 1991). The parallel increase in the algae Pediastrum supports this interpretation, as hemp retting led to an increase in nutrient content of lake water. Corylus shows slightly higher cover, while Quercus, Tilia and Ulmus have very low pollen values and cover. Fagus cover is still small, and its local occurrence is uncertain. Picea starts to decrease slightly. These are all indications of a renewal of land-use activities in Lillsjön’s RSAP from ca. 1250 to 1500 CE.
There is no indication that the Medieval Climate Anomaly (MCA; generally dated to ca. 950–1250 CE, for example, Mann et al., 2009) would have influenced land use in the study area. It is more likely that land-use decrease in Lillsjön’s RSAP is related to a reorganization of the agrarian system, from a one-course rotation system to a strict three-course rotation system (fallow-rye-barley) fully established from the 13th century. Such a development was proposed for southernmost Sweden by multidisciplinary studies (e.g. Engelmark and Hjelmqvist, 1991; Gaillard and Göransson, 1991). It was accompanied by the crystallization of the infield/outland agrarian system with arable land and hay meadows in the infield near the farms and grazing land outside the enclosed infields, in vast outfields.
The temporal resolution of the pollen analysis and LOVE-based reconstruction does not allow to draw clear conclusions on the possible effect of the medieval plague outbreak in Sweden ca. 1350–1450 CE (Lagerås, 2016; Myrdal and Morell, 2011).
LPAZs 8, 9, and 10 (ca. 1500 CE to present: Modern Time)
LPAZs 8–10 are dated to Modern Time. All farms dating to early Middle Age or earlier did still exist until 1850 CE.
The LOVE-based NAP cover increases from ca. 18% (22% with Cyperaceae) (LPAZ 7) to ca. 36% (47% with Cyperaceae) ca. 1500–1650 CE (LPAZ 8) and to a maximum of ca. 63% (80% with Cyperaceae) ca. 1650–1890 CE (LPZ 9). It implies a doubling of the landscape openness in Lillsjön’s RSAP at the transition between Middle Ages and Modern time, and almost a doubling from ca. 1650 to 1890 CE.
Among pollen indicators of land use, Juniperus and Rumex acetosa-type increase in cover from LPAZ 7 to LPAZ 8. Compositae Cichoriodeae and Cerealia-type, absent locally in LPAZ 7, are present in LPAZ 8 with a cover of 8% each, and Centaurea cyanus pollen occur again. Cannabis-type has its highest pollen values corresponding to a peak of the algae Pediastrum, suggesting that hemp retting in the lake was common during this period. There is a significant decrease in all tree taxa except Betula, Quercus and Alnus (PPs, PARs and LOVE-based cover). Corylus decreases from 12% to 5% cover and Picea from 35% to 20%. All these changes suggest that the area was cleared again for both grazing and cereal cultivation. The occurrence of fire is also indicated by peaks of microcharcoal values.
LPAZ 9 (ca. 1650–1890) is characterized by increases and high values of PPs and LOVE-based cover of Juniperus, Poaceae, Cyperaceae, Cerealia-type and Secale cereale, the three latter taxa reaching their largest cover of the entire studied period. Centaurea cyanus has its highest PPs in LPAZ 9, and Anthriscus sylvestris, Anthemis-type, and Trifolium repens (white clover) their highest PPs in LPAZ 9 and 10 (ca. 1890 to present). Alnus and Picea each decrease to ca. 5% cover in LPAZ 9, while Cyperaceae increases to 15% cover. Pinus is again present in the RSAP with low cover from 1700 CE. Among the remaining deciduous trees, Alnus, Betula, and Quercus have the largest cover (ca. 9% together). These changes indicate a major increase in area of managed land for grazing, hay making and cultivation of crops, with a clear maximum of cleared land representing 80% of the Lillsjön’s RSAP area in the time window 1650–1890. The significant decrease in tree cover may also partly be due to the mining activities that occurred at Olserum since 1655 CE (Figure 2). The ore was broken by fire and required a large quantity of wood until it was replaced by powder in the 18th century, and later by dynamite (Hed Jakobsson, 2012). The increase in cereals to ca. 20% cover, and abundance of Secale cereale show that the size of cultivated fields within Lillsjön’s RSAP increased significantly, and the three-course rotation system was still predominant. Alder groves were progressively cleared for mowing and grazing. Cannabis type decreases significantly together with the algae Pediastrum (Figure 4), which indicates the abandonment of hemp retting in the lake from ca. 1650 CE. There is no indication of an impact of the Little Ice Age (1450–1850 CE; IPCC, 2021) on land use.
The 20th century (LPAZ 10) is characterized by a local afforestation (increase in total tree cover from ca. 20% to ca. 32 %) due primarily to the increase in cover of Pinus and Picea. Pinus reaches ca. 10% cover (from 2% in LPAZ 9) and Picea increases to ca. 8% (from 5% in LPAZ 9). Secale cereale decreases significantly together with herbs indicative of traditional hay meadows such as Plantago lanceolata, Potentilla-type, and Ranunculus acris-type. The traditional three-course rotation system is gradually abandoned and replaced by modern agriculture with the introduction of synthetic fertilizers. The large values of Poaceae may be due partly to cultivation of leys for fodder. Brassicaceae and Caryophyllaceae pollen have their highest values of the profile in LPAZ 10 and may be related to new crops and weed species, such as Brassica napus (rape) and Stellaria media (chickweed). Ulmus and Carpinus may have been planted around farms, as well as Juglans regia (walnut) (present in LPZs 9 and 10, Supplemental Table S2.3, Appendix 2, available online), a practice that was common in southern Sweden at the end of the 19th century and beginning of 20th century (e.g. Gaillard and Göransson, 1991; Gaillard et al., 1991).
Is the land-use and land-cover history around Lillsjön representative of the Gamleby region?
The LOVE-based reconstructions of local plant cover around the small lakes Stärringen and Hyttegöl (with a RSAP of ca. 2000–3000 m radius as Lillsjön) provide a picture of the between-site variability in land-use and land-cover change. The REVEALS-based reconstructions of regional plant cover inform on the overall land-cover change, that is, they represent a “mean” of all local changes within an area of 104 km2.
Local land-use and land-cover history
Hyttegöl is located ca. 23 km south of Lillsjön in a similar geological context although till is more abundant and clay-silt less abundant than around Lillsjön (Figure 1). The LOVE-based reconstruction of local plant cover around Hyttegöl covers the last 1800 years (Figure 5 and Supplemental Figure S2.8, Appendix 2, available online). The LOVE-based reconstructions of Lillsjön and Hyttegöl are most alike when Storsjön pollen data is used for the regional plant cover rather than the combined Stärringen-Lillsjön-Tjursbosjön pollen data (Figure 5). The two sites show the same decrease in grassland from 200 to 700 CE, with almost as high cover of grassland and cropland 200–450 CE (Migration Period, possibly Vendel Period). There is a very significant increase in grassland cover (Cyperaceae included) from late Middle Ages around Hyttegöl and from the start of Modern Time around Lillsjön, with a maximum cover reached for both sites 1700–1850 CE, and a decrease thereafter. There is a larger cover of conifers at Hyttegöl than Lillsjön 200–950 CE, which is due to the presence of Pinus within the RSAP of Hyttegöl throughout the studied period, with ca. 30% cover 200–1200 CE, while Pinus is probably not growing within Lillsjön’s RSAP, except 500 BCE–200 CE and during the last century (Figure 6 and Supplemental Figure S2.8, Appendix 2, available online). The large cover of Pinus around Hyttegöl might be due to the abundance of exposed bedrock in the area. The major difference in land use between the two sites is the occurrence of intensified mining activity and the establishment of locally operated blast furnace upstream Hyttegöl as early as the end of the 12th century (Karlsson et al., 2015), which may explain the lower cover of conifers and the larger landscape openness all through Middle Ages when compared to Lillsjön.
Stärringen is located ca. 67 km south of Lillsjön and ca. 43 km South of Hyttegöl in a geological context very similar to that of Hyttegöl (Figure 1). However, its pollen-based land-use and land-cover history are very different from both Hyttegöl and Lillsjön (Figure 5, Supplemental Figure S2.9, Appendix 2, available online). From 1150 BCE to 950 CE, there is no major change in land cover within Stärringen’s RSAP. Grasslands decrease gradually from ca. 15% cover 1150–500 BCE (Bronze Age) to a minimum of 10% cover 200–450 CE (Migration Period and Vendel Period). Stärringen was probably located in the outland of settlements/farms located at some distance outside the lake’s RSAP from Bronze Age to Late Iron Age. It is first in the early Middle Ages that a major change occurred. Grassland cover increased locally from ca. 13% 700 to 950 CE (Vendel-Viking Age) to ca. 52% 950–1200 CE (Viking Age-Middle Ages), and cereals (Cerealia type and Secale cereale) reached ca. 2.5% cover. This large transformation is related to the establishment of the farm “Stenzöö” (today’s Stensjö village) documented in written sources from 1351 CE (Almgren, 2008). From that time, Stärringen is located within the infield of the medieval farm, with cultivated fields and hay meadows, which is suggested by the high cover of Plantago lanceolata, Rumex acetosa-type and cereals, with Secale cereale as an indicator of the three-course rotation system. The large cover of Juniperus and Poaceae is characteristic of both the infield and outland. Juniper was a common element of the agrarian system in southern Sweden from Early Middle Ages to ca. 1850 (e.g. Berglund et al., 2002, 2021; Gaillard et al., 1991). From 450–700 CE to 700–950 CE, Picea increased from ca. 2.5% to ca. 20% cover, which indicates a relatively rapid increase occurring within the period 700–950 CE (transition Migration Period-Viking Age). Picea started to decrease from 950 CE and reached a minimum cover 1200–1450 CE in connection with the development of the farm and a maximum cover of grassland and cereals. Land-use did not change significantly until ca. 1700 CE, except a first decrease in grassland and cereal cover from ca. 1450 CE while Picea and Pinus expanded again within the RSAP area. From the 18th century, the traditional three-course rotation system was gradually abandoned, and Picea expanded in the outland at the expense of Juniperus. Juniper does not flower in the shadow of other trees and, although it can survive for some decades, it finally dies. The change in agro-system increased the crop yield during the 19th century. However, the increase in number of fields often led to the use of land with low productivity (e.g. Olsson, 1991). Crop yields started to decrease, and farmers gradually moved out of Stensjö village from ca. 1900 CE, and the last farm was abandoned in 1951 (Almgren, 2008).
Regional land-use and land-cover history
The lake Tjursbosjön is located close to Hyttegöl and its pollen record represents the regional vegetation around Hyttegöl ca. 600 CE to present (Karlsson et al., 2015) in an area of ca. 50 km radius. The geological contexts of Tjursbosjön and Storsjön are similar, although till and glaciofluvial deposits are more abundant, and bedrock less abundant, within 50 km radius of Storsjön than Tjursbosjön (Figure 1), which may explain the main difference between the two sites in terms of plant cover, that is, larger cover of Picea and smaller cover of Pinus in the Storsjön than in the Tjursbosjön region. The alternative REVEALS-based reconstructions of regional vegetation using the pollen records of two small sites and Tjursbosjön for the last 1300 years are very similar to that from Storsjön when Lillsjön and Hyttegöl are the two small sites used (Figure 5b). Therefore, the larger grassland cover 700–950 CE compared to 950–1200 CE appears to be characteristic of the region, while the local development at Stärringen is representative of the land cover around Late Iron Age-Middle Age farms/villages, but not of the overall regional vegetation cover. The very small cover of grassland at Lillsjön during a part of the Early Iron Age (ca. 50 BCE–200 CE) has no equivalent at any of the studied sites and is obviously a time of local abandonment of the area for grazing and cultivation that did not correspond to a regional feature.
The pollen record from Storsjön provides the best possible reconstruction of regional plant cover for the period 1150 BCE to 700 CE, given that the pollen record from Tjursbosjön doesn’t cover this period (Figure 5a). For the last 1300 years, the reconstructed cover of conifers might be slightly too large, as well as the cover of Picea in relation to Pinus to represent the easternmost part of the study region, and the reconstruction from Tjursbosjön might be more appropriate for the LOVE reconstruction of local plant cover at Lillsjön, Hyttegöl and Stärringen during that period (Figure 5b). For instance, the decrease in local cover of grassland in favor of tree cover during the last century at Lillsjön, Hyttegöl, and in the REVEALS reconstruction using two small sites and Tjursbosjön (Figure 5b) is not visible in the regional vegetation cover from Storsjön.
Conclusions
This study aimed to test the assumption that periods of extensive and intensive exploitation of the land by humans before the 19th century, both locally and regionally, led to deforestation and opening of the landscape of a comparable magnitude to that shown from the 19th century at Storsjön (Ning et al., 2018) and therefore may have affected the Baltic Sea earlier.
We are showing here that the regional landscape openness inferred from the pollen record of Storsjön was almost as large as in the 19th century already 700–950 CE (Viking Age). The increase in landscape openness from 50 BCE–200 CE to 700–950 CE (Roman Iron Age to Viking Age) from ca. 22% to 32% is comparable to the increase occurring from 950-1200 CE to 1700–1850 CE (ca. 20–35%) (Figure 5).
Locally, the landscape openness around Lillsjön, the small lake closest to the Gamlebyviken Bay, is large between 200–450 CE and 700–950 CE with a maximum of 45% already 200–450 CE (Roman Iron Age-Migration Period) which is comparable to the local openness around Hyttegöl (42%) during the same time. This early local openness is also comparable to the regional openness 1700–1850 CE inferred from the pollen record of Tjursbosjön (ca. 45%, Supplemental Figure S2.6, available online) and larger than that from Storsjön (35%). The landscape openness around Lillsjön is also large during the Bronze Age and Pre-Roman Iron Age (1150–50 BCE; 36% and 25%; Figure 5). Moreover, the local landscape openness around both Lillsjön and Hyttegöl 1700–1850 is very large, that is, 70% and 60%, respectively, which is significantly larger than the regional openness (35–45%). These results provide a strong indication of the occurrence of large landscape openness, both regionally and locally (at a few kilometer from the Gamlebyviken Bay), much earlier than the 19th century, between 200–450 CE (Roman-Iron Age-Migration Period) and 700–950 CE (Viking Age) in particular. Relatively large landscape openness is also indicated during the Bronze Age around Lillsjön, which agrees with the interpretation of the archeological material in the study region for this period.
We conclude from the above that land-use and land-cover changes before the 19th century, during the Viking Age in particular but also during the Bronze Age and the Roman Iron Age, could potentially have influenced the coastal waters (the Gamlebyviken Bay in this case) through input of nutrients due to deforestation and extensive/intensive agricultural activities.
We summarize our results as follows. The pollen records from Lillsjön and Hyttegöl provide two examples of cultural landscape history close to the Gamlebyviken Bay. The archeological data from the Lillsjön area indicate significant human activities throughout the last 3000 years. Changes in the location of settlements and activities over time and space have influenced landscape openness locally in a similar way at Lillsjön and Hyttegöl through the last 1700 years. The cover of open land was relatively large (40–50%) ca. 200–450 CE (Early/Late Iron Age), lower (20–30%) ca. 450–1200 CE (Late Iron Age-Early Middle Ages), increased gradually to very large values (70–80%) ca. 1750–1850 CE, and decreased slightly (60–70%) until present. The regional vegetation cover reconstructed from the pollen record of Storsjön shows similar changes over the last 1500 years, although the cover of open land is smaller than at Hyttegöl from ca. 1200 CE and Lillsjön from ca. 1450 CE. The landscape openness in the Lillsjön area ca. 1150–0 BCE (Bronze Age-Early Iron Age) was as large as ca. 450–950 CE (Late Iron Age), which is not the case at the regional scale for which the cover of open land is lower 1150–0 BCE than 200–950 CE. There is no undisputable indication, neither in the archeological data nor in the pollen-based reconstructions, of an impact of the Roman Warm Period, Medieval Warm Period and Little Ice Age on the human-induced land-cover changes in the study region. Periods of afforestation, regionally and/or locally, are better explained by socio-economical changes. Whether the short period of afforestation at Lillsjön 50 BCE–200 CE (Roman Iron Age and/or Migration Period) is characteristic of the coastal region is not known and cannot be confirmed with the archeological data available. This period together with a second phase of afforestation 950–1450 CE related to the expansion of spruce in the region are the times of lowest potential effect of local (and regional for the latest period) landscape openness on coastal waters.
In terms of methodology issues, two points should be highlighted here. First, one must remember that both LOVE- and REVEALS-based cover is always an overestimation in a geological context with a large proportion of exposed bedrock with no vegetation, which is the case in our study region (Figure 1). Therefore, increases in LOVE and REVEALS-based cover of plants characteristic of open vegetation may not have been as large as suggested by the pollen-based reconstructions. However, an increase in for example, grazing (inferred from pollen-based REVEALS increase in pollen indicators of grazing) may also have led to an increase in exposed bedrock, although it cannot be reconstructed from pollen data so far. A single attempt at reconstructing the past cover of bare ground using pollen data is available from a study in western China in which the modern analog technique is combined with REVEALS reconstructions (Sun et al., 2022). Similar studies have not been attempted elsewhere in the world so far. Second, the size of the bay’s catchment is much larger than the spatial scale of a LOVE land-cover reconstruction but is smaller than the regional scale of a REVEALS reconstruction. To improve the representation of land-use and land-cover change within the Gamlebyviken’s hydrological catchment area in a pollen-based reconstruction, new studies should focus on pollen studies from a large lake located close to the center of that catchment area and several small lakes distributed within that catchment.
Supplemental Material
sj-docx-1-hol-10.1177_09596836231200433 – Supplemental material for 3000 Years of past regional and local land-use and land-cover change in the southeastern Swedish coastal area: Early human-induced increases in landscape openness as a potential nutrient source to the Baltic Sea coastal waters
Supplemental material, sj-docx-1-hol-10.1177_09596836231200433 for 3000 Years of past regional and local land-use and land-cover change in the southeastern Swedish coastal area: Early human-induced increases in landscape openness as a potential nutrient source to the Baltic Sea coastal waters by Olena Vinogradova, Marie-José Gaillard, Elinor Andrén, Veronica Palm, Johan Rönnby, Martin Dahl, Elisabeth Almgren, Jon Karlsson, Anne Birgitte Nielsen, Christine Åkesson and Thomas Andrén in The Holocene
Footnotes
Acknowledgements
We are thankful to the Swedish Museum of Natural History and its personal, in particular Pia Östensson for providing an access to the pollen reference collection, Johannes Bouchal and Anders Amelin (†deceased) for assistance with laboratory work and Irena Hajdas for radiocarbon dating. We also thank the Department of Biology and Environment Science, Linnaeus University, for providing laboratory facilities and chemicals for preparation of pollen samples and access to pollen reference collections and pollen identification literature. We are grateful to Siim Veski for valuable discussion and suggestions on the study and improvements of the manuscript. Marie-José Gaillard acknowledges the financial support from the Faculty of Health and Life Sciences of Linnaeus University and the Swedish Strategic Research Area (SRA) MERGE (ModEling the Regional and Global Earth system). Olena Vinogradova is grateful to the School of Natural Science, Technology and Environmental Studies, Södertörn University, for financing radiocarbon dating.
Funding
The author(s) disclosed receipt of the following financial support for the research, authorship, and/or publication of this article: The current study is a part of the SEASIDE-project funded by the Foundation for Baltic and East European Studies (grant 3146-3.1.1-2017).
Funding was provided to Martin Dahl by the Foundation for Baltic and East European studies (grant number: 21-PD2-0002).
Supplemental material
Supplemental material for this article is available online.
References
Supplementary Material
Please find the following supplemental material available below.
For Open Access articles published under a Creative Commons License, all supplemental material carries the same license as the article it is associated with.
For non-Open Access articles published, all supplemental material carries a non-exclusive license, and permission requests for re-use of supplemental material or any part of supplemental material shall be sent directly to the copyright owner as specified in the copyright notice associated with the article.