
Abstract
The analysis of exceptionally well-preserved visible clastic laminations in deep alluvial sediments at Kempsey, Worcestershire (UK), allows a new high-resolution analysis of late-Holocene flood-history in the largest UK catchment, as well as local human response. At the sample site over 4.5 m of sandy-silt overbank-alluvium accumulated on the floodplain and optically stimulated luminescence (OSL) dating of the upper 2.25 m demonstrates accretion from the late 14th century CE onwards. Sub-centimetre to centimetre resolution multi-proxy sediment analysis (loss on ignition, magnetic susceptibility, particle size, ITRAX and portable XRF) demonstrate clear variations in depositional history over the last millennium due to channel stability. Between c. 1380 and 1550 CE overbank sedimentation was driven by lower energy flood events, with negligible effect from climatic conditions during the Spörer Minimum (1460–1550 CE). After c. 1550 CE the magnitude of flooding events increased and by c. 1610 CE, the start of the visible sub-centimetre laminations, the accumulation rate regularly exceeded 3 mm year−1, which increased to 4.5 mm year−1 between c. 1690 and 1710 CE, and 3 and 3.5 mm year−1 between c. 1790 and 1840 CE before alluviation was altered by an embankment. The greatest extent of coarse overbank deposition and increased accumulation rate occur concurrently with periods of climatic instability associated with the Maunder (1645–1715 CE) and Dalton (1790–1820 CE) Minima, the periods of largest historical floods and during the intensification of arable cultivation across the middle Severn catchment. This data correlates well with other sites in the catchment suggesting that these are basin-wide forcing-responses. We also present evidence that this catchment-wide hydro-geomorphological history had local effects in shifting the geographical focus of an important settlement away from its historic floodplain edge location – which can be viewed as an adaptation to the flood risk.
Introduction
Laminated, clastic sequences in deep overbank alluvial sequences of the UK are rare, but at a world-wide scale are more common and generally associated with highly active, laterally mobile braided river systems (Best and Ashworth, 1997; Rumsby et al., 2001). In these global contexts, their formation and physical architecture tend to be well defined (Bluck, 1979; Bridge, 1993; Bridge et al., 2006; Miall, 1977; Rust, 1972), the result of very rapid deposition and subsequent burial. Laminations also occur in low-energy riverine locations, including palaeochannels (Bábek et al., 2011; Minderhoud et al., 2016; Toonen et al., 2012; Wolfe et al., 2006), lacustrine environments (Gilli et al., 2013) and backwater floodplain environments (Aslan and Autin, 1999; Toonen et al., 2017). In these instances, accretion rates are very slow, with high-resolution radiocarbon chronology and analysis able to reconstruct often annual or sub-annual depositionary histories in the Late-Holocene.
In deepened overbank alluvium such as on levees the preservation of laminated deposits can occur as a result of stable bank-aggrading channel systems outpacing bioturbation (Brown et al., 1994). The ‘stable banks’ necessary for such deposits to have been preserved often result from constriction within tall riverbanks, which are in turn created by high rates of levee development and overbank alluviation (Dixon et al., 2018). In the UK examples of such systems have been demonstrated across the River Severn catchment including the Warwickshire Avon (Shotton, 1978), Middle Severn (Brown, 1983), Lower Severn (Brown, 1983, 1985, 1987a), Ripple Brook (Brown and Barber, 1985; Miller et al., 2004), Wye (Brown, 1987b), Upper Severn (Jones et al., 2012; Macklin et al., 2002; Taylor and Brewer, 2001) and Herefordshire Frome (Brown et al., 2011, 2013). Despite the multitude of potential sites, examples of visible laminated deposits remain rare as a result of post burial bioturbation and reworking which outpaced sediment accumulation rate. Across the middle Severn reach very faint, sand-silt laminations have been demonstrated and traced across a 500 m section of the Severn-Teme confluence at Powick, Worcestershire (Brown, 1985; Pears et al., 2020a) and in the upper reach remnant flood laminations have also been found at Caersws, Wales (Jones, 2007), but in each of these examples there is not the same level of visible preservation as those identified at Kempsey.
The primary aim of this research was to refine our understanding of long term fluvial characteristics and flood histories for the Midlands of the UK by analysing the well-preserved flood laminations as a climate proxy, assess how they relate to other overbank sequences in the catchment, and secondly to elucidate any human response to this local environmental change that might constitute risk adaptation.
Fluvial geomorphology, research location and settlement history
The River Severn extends for over 350 km and drains a 4325 km2 catchment from the Cambrian Mountains to the Severn Estuary with the greatest discharge of any river in England and Wales (Figure 1). The Severn’s steep upper reach falls 75% (600–150 m) in the initial 25 km before entering the Shropshire basin and the Ironbridge Gorge and its main alluvial sections to the marine limit at Gloucester. Over this reach the discharge increase from 60–100 m³ s−1 to over 600 m3 s−1 during flood events as it drains the western Midlands of the UK. The headwaters and Ironbridge Gorge consist predominantly of sandstone and limestone lithologies of Ordovician to Carboniferous age resulting in a narrow constrained fluvial system. Downstream of the gorge the floodplain is surrounded by softer Triassic mudstone, siltstone and sandstones and six Pleistocene gravel terraces which constrain the wider floodplain (5–10 km) with largely low-sinuosity meandering channel planform. These wider, low lying areas also contain the confluences of the Severn’s major river systems including the Vyrnwy, Tern, Teme, Warwickshire Avon and Wye alongside smaller tributaries each of which have added to the extensive alluvial deposits which have created the Severn’s floodplain.
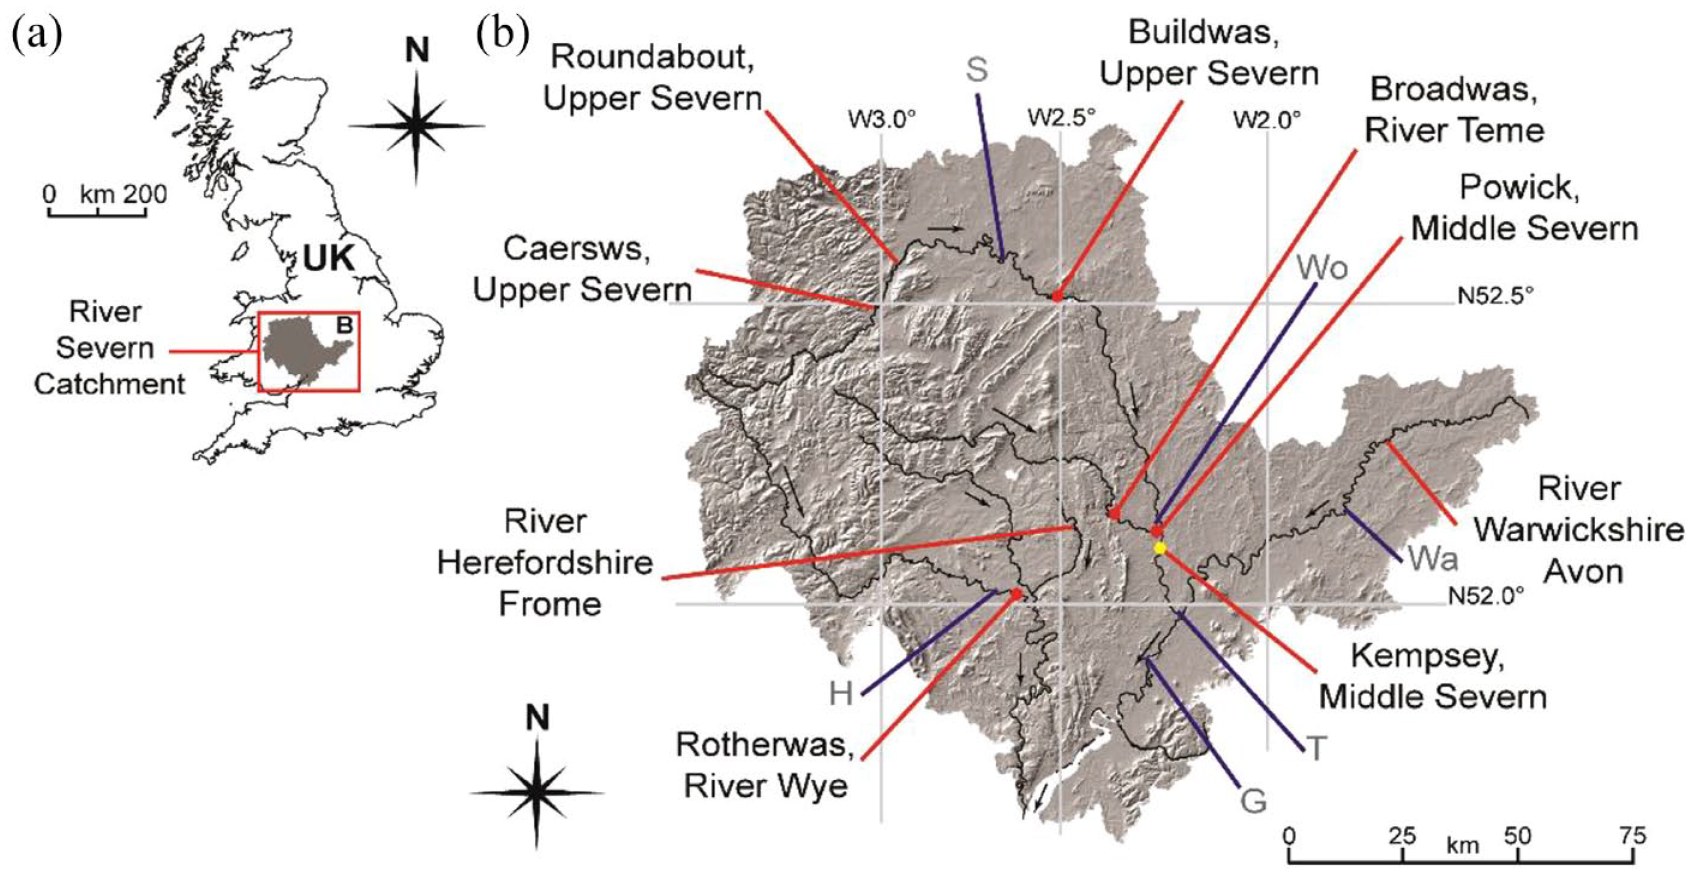
(a) Catchment location. (b) River Severn Catchment showing location of Kempsey, other deep alluvial sequences mentioned in text (red lines) and major settlements (blue lines), (S: Shrewsbury, Shropshire; Wo: Worcester, Worcestershire; Wa: Warwick, Warwickshire; T: Tewkesbury, G: Gloucester, Gloucestershire; H: Hereford, Herefordshire), basemap 50 m resolution Lidar DTM (Environment Agency, 2017).
Research on the Severn floodplain at Kempsey, Worcestershire (Figure 2) was conducted as the river contained a thickened overbank alluvial sequence in close proximity to a clearly defined gravel terrace of the Early to Middle Devensian (c. 70–40 ka) Worcester Member to the east (Barclay et al., 1997). Archaeological evidence indicates that the terrace edge has been the focus of human activity from the Iron Age, with additional earlier prehistoric settlement and funerary monuments across a wider riverine hinterland landscape to the south and northeast (O'Neill, 1956). The density of archaeology in this area demonstrates the importance of the river for settlement due to its suitability as a terrestrial crossing point as well as river transport management. This is also reflected in the derivation of Kempsey’s name, meaning (Cemmi’s/Cymi’s island) (Sims-Williams, 1990), which combines information on who owned and ultimately controlled this riverine landscape during the early mediaeval period.
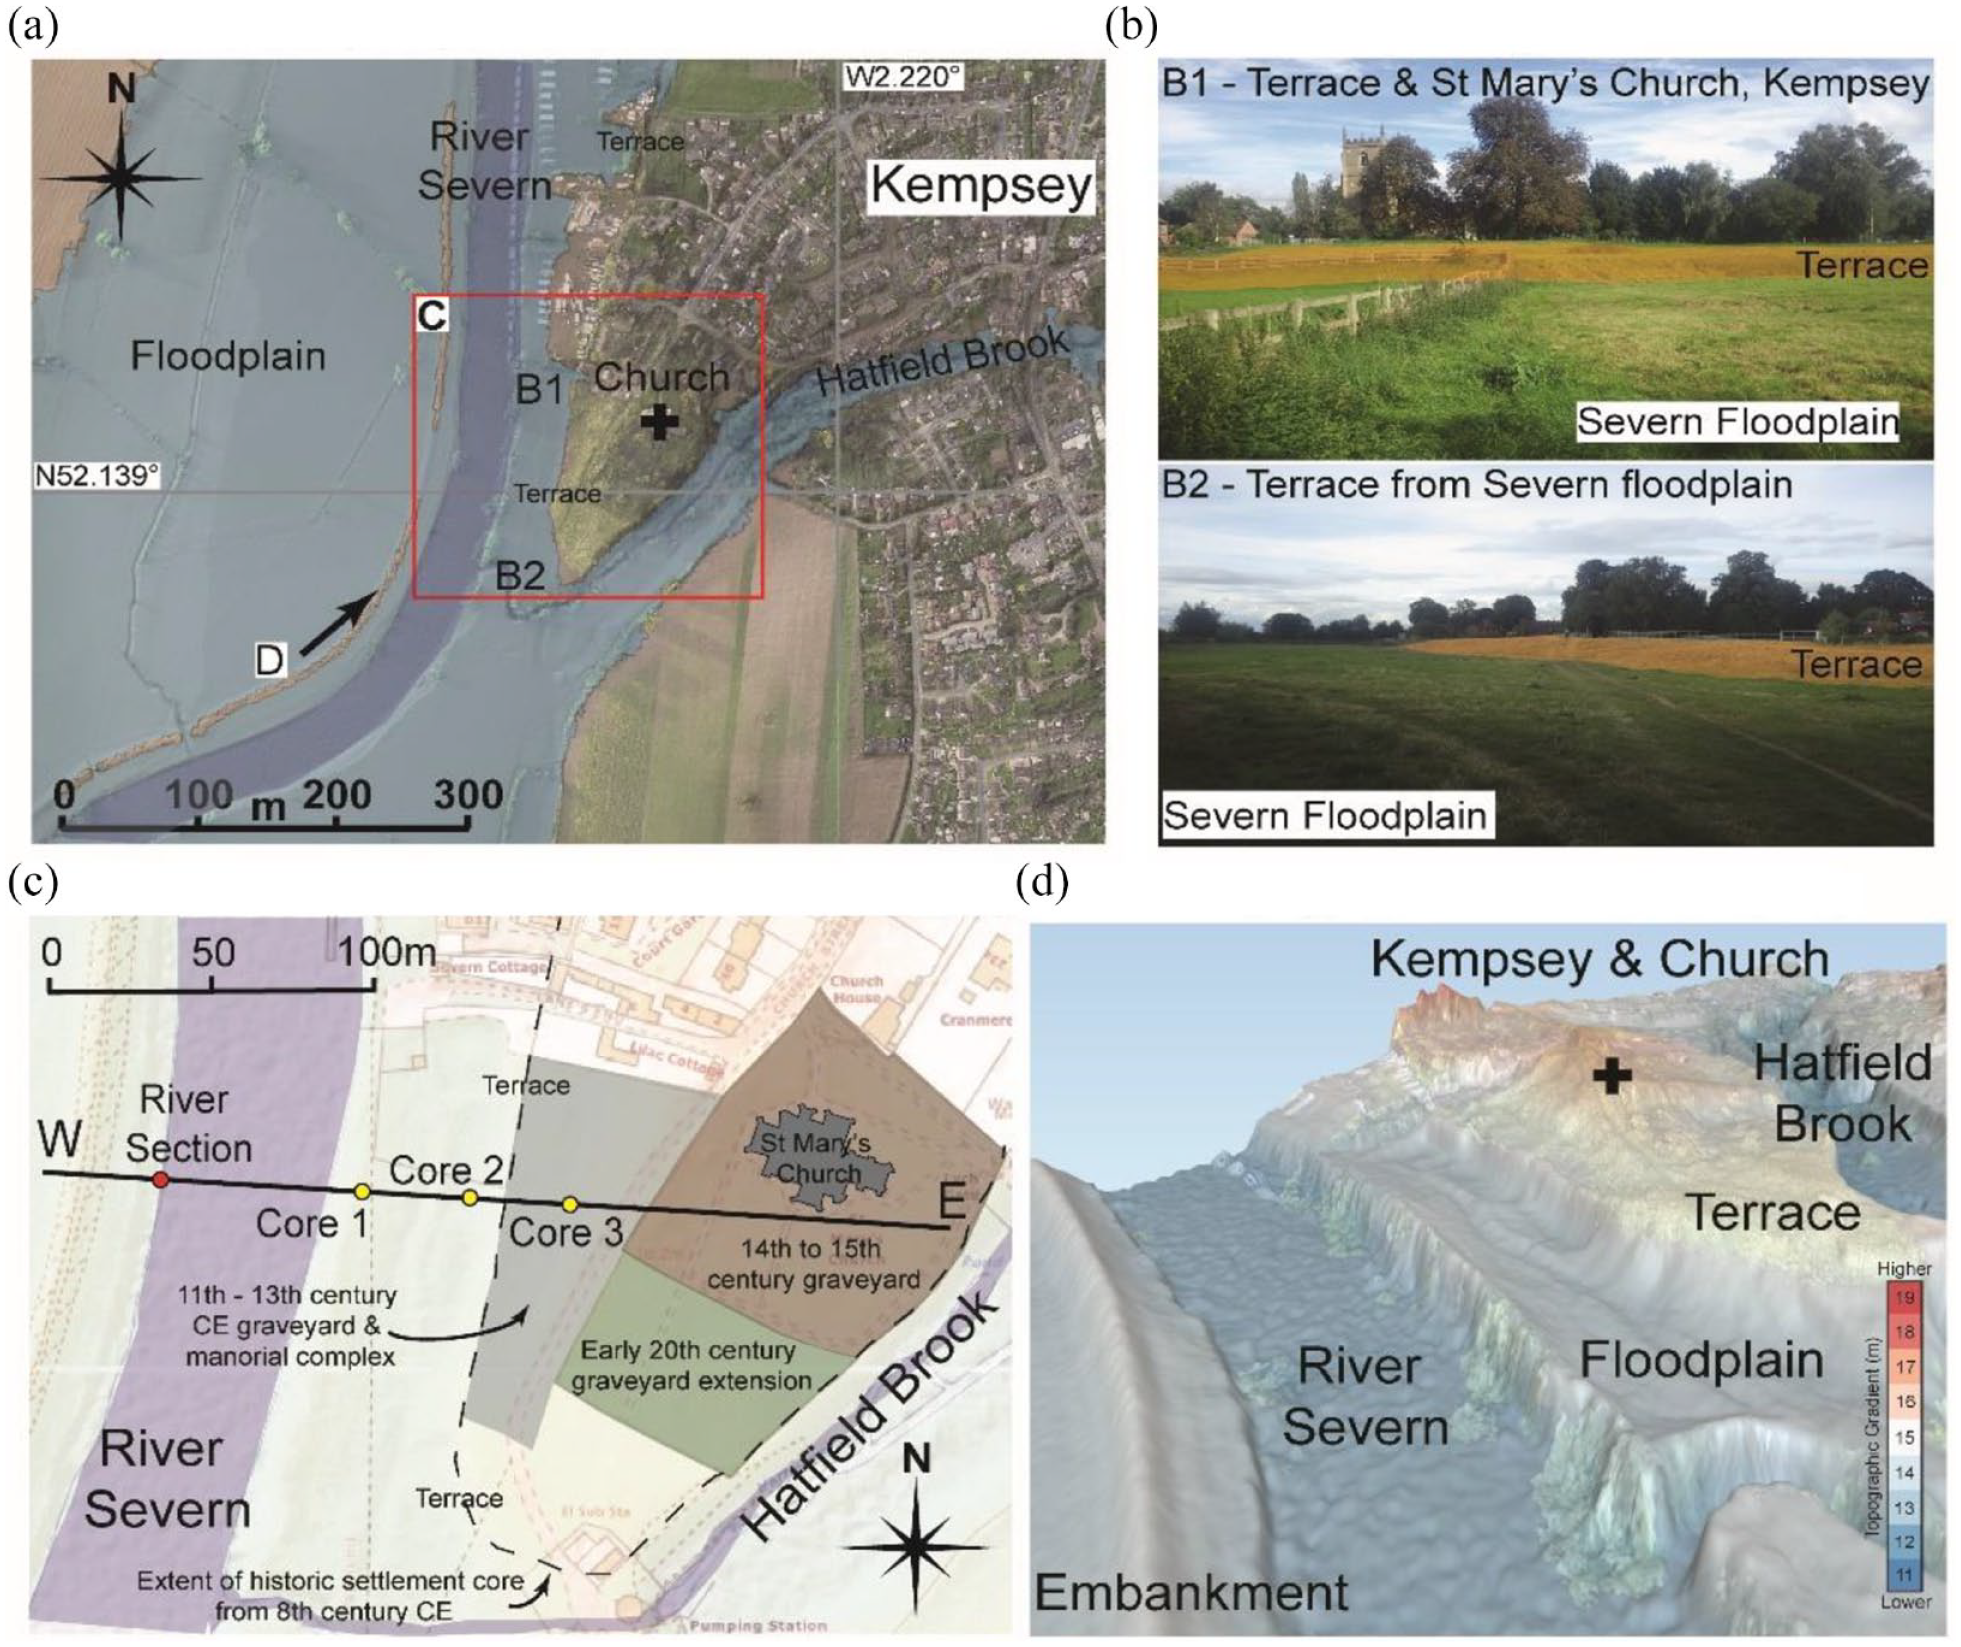
(a) Kempsey location and proximity to watercourses, 20 cm orthophotography (Environment Agency, 2007) and Environment Agency Flood Zone 3 (Environment Agency, 2016). (b) Landscape images across Severn floodplain and Kempsey gravel terrace (B1 and B2) photographs copyright of the authors. (c) Sample locations, transect and historic landscape mapping. Base maps Modern Ordnance Survey 1:2500 (Ordnance Survey, 2017) overlain by 1 m resolution Lidar DTM tiles SO84NE, SO84NW (Environment Agency, 2014). (d) 3D topographic model of Kempsey and River Severn from the southwest with a coloured topographic gradient and x5 vertical exaggeration. Modelled using 1 m Lidar DTM tiles SO84NE, SO84NW (Environment Agency, 2014).
Methodologies
Field sampling
In the field, sediment sampling was conducted at a river section adjacent to the main channel of the Severn and was complemented by three additional percussion cores (C1–C3) across the floodplain and terrace edge to Kempsey church, in order to correlate the sedimentary sequence across a wider floodplain context (Figure 1). The cores revealed alluvium to a maximum depth of 4.6 m overlying terrace gravels (Figure 2). The river section was hand excavated back to clean, undisturbed layers to a depth of 2.25 m, at the summer low-river level, and was followed by thorough graphical and descriptive recording, field analysis and sampling of the major sediment units and visible laminations.
OSL chronology and age-depth modelling
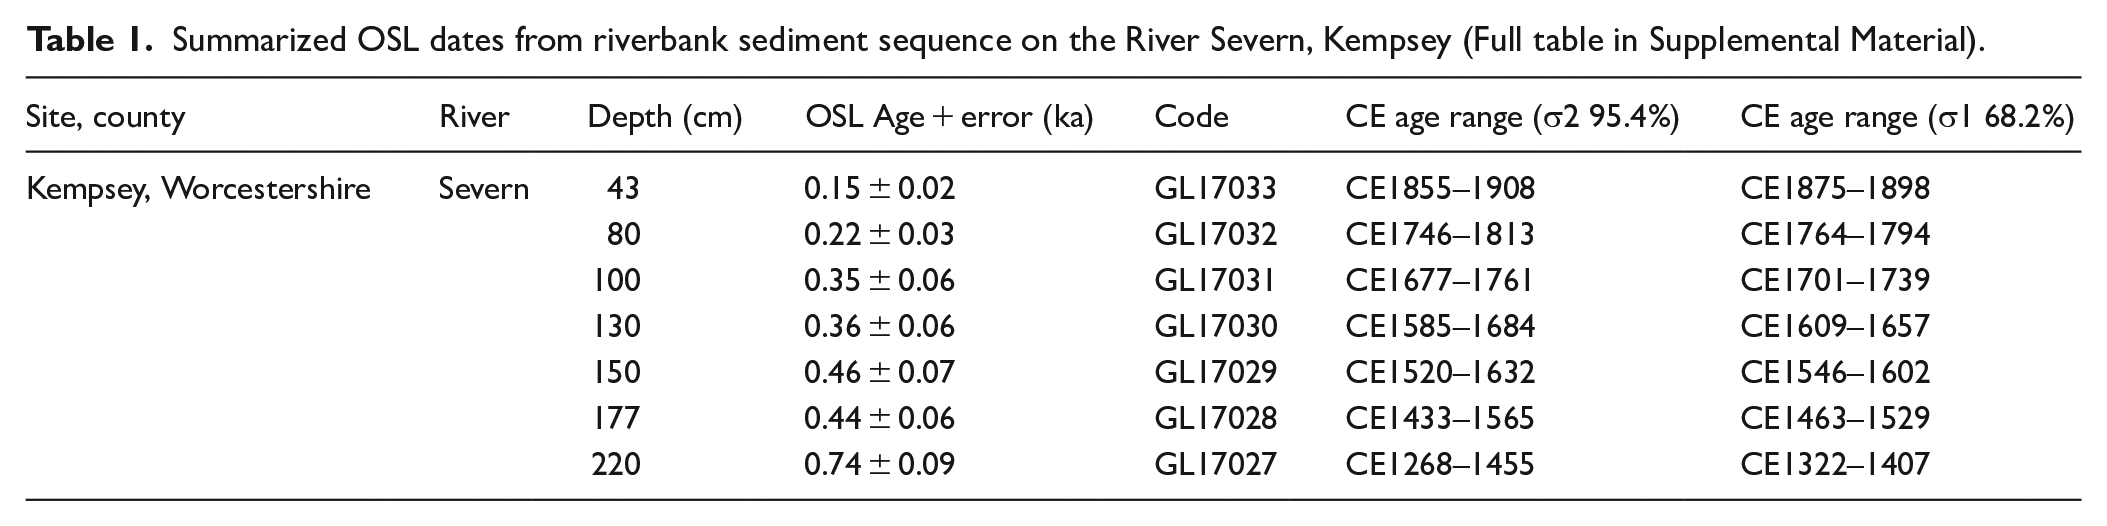
To determine a detailed chronology of the river section sequence OSL was used due to the presence of wholly clastic, minerogenic sediments (Aitken, 1998; Huntley et al., 1985). Seven sealed sediment samples were extracted in opaque tubing and submitted to the University of Gloucestershire for dating (Toms and Wood, 2018) and the full methodology is detailed in the online supplemental material section. The sample positions, OSL laboratory codes, extracted dates with errors and calculated age ranges at σ2 95.4% and σ1 68.2% are outlined in Table 1.
Summarized OSL dates from riverbank sediment sequence on the River Severn, Kempsey (Full table in Supplemental Material).
Age-depth modelling was initially conducted using OxCal, v.4.4 with IntCal20 programme (Bronk Ramsey, 2008, 2009, 2017), using the OSL setting and relevant requirements (U = linear, k-parameter = 1, Poisson interpolation rate = 0.3, General outlier model = 0.05). Further modelling with Bacon (Blaauw and Christen, 2011), specifically v2 version 3.5 (Blaauw and Christen, 2013), was run using R statistical computing (R Core Team, 2013) and specific settings (cc = 1, postbomb = 1, t.a = 3, t.b = 4, d.by = 1). The creation of both models provided cross referencing of the chronological sequence and enabled a detailed accumulation rate to be calculated and greater precision of calendrical dates at 2σ (95.4% confidence) and 1σ (68.2% confidence).
Sedimentological analyses
Samples were also subjected to a range of sedimentological analyses to interpret the depositional history of the sequence. Loss on ignition (LOI) at 1 cm resolution was conducted by drying samples at 105°C for 12 h to determine water content, then combusting at 550°C for 2 h provided the percentage organics and a final burn at 950°C for 4 h determined carbonate content. Alongside LOI, magnetic susceptibility (MS) was conducted in order to identify variations in texture, and changes in depositional conditions, possibly as a result of flooding events or anthropogenic input (Tite and Mullins, 1971). MS was undertaken using a Bartington MS2 m using the MS2B dual sensor equipment at 1 cm resolution, following Dearing (1999). Volume magnetic susceptibility in SI unit (κ) was determined using a fixed frequency of 3.41 kHz and a periodicity of 15 s, and precision was determined with randomly selected repeatability of samples.
Further analysis of micro-variant sediment texture was conducted using directly measured particle size analysis using the laser diffraction method via a Malvern digisizer, in line with similar research in the Severn catchment (Marriott, 1992; Taylor and Brewer, 2001) and followed the methodology set out by Konert and Vandenberghe (1997) and Blott et al. (2004). Despite recent research demonstrating the possible problems of thermal heating of sediment samples prior to particle size analysis leading to a bias in textural determination (Abdulkarim et al., 2021) it was decided that due to the required number of samples needed to highlight variations in the visible laminations and the very low organic content of the alluvial sediment (on average <4% as determined by the LOI), that this preparatory method would be employed on this occasion. 2–5 g of sediment was heated to 550°C for 2 h in a furnace to remove organic material and the remaining sediment sieved through a <2 mm sieve and then mixed with a deionized water and Calgon solution to disaggregate remaining components. A subsample of this was then placed into a petrie dish with more Calgon and gently agitated with a pestle before being added to a Malvern Digisizer until an optimal obscuration of 15–20% had been achieved. Background and sample measurement time was set to 90 s and each sample was analysed five times in order to get a good statistical dataset as determined by the international standard ISO-13320-1. All samples analysed had a standard deviation lower than 2% for the fine-grained percentile (<Dx10), less than 3% for the median percentile (<Dx50) and less than 5% for the coarsest percentile (<Dx90).
Multi element determination used an ITRAX XRF scanner (Croudace and Rothwell, 2015; Croudace et al., 2006) on sediment samples collected from 400 to 500 mm long ‘u-channels’, scanned at 2 mm resolution using 30 kV, 30 mA settings and a 15 s count time at the British Ocean Sediment Core Research Facility (BOSCORF), National Oceanography Centre, Southampton (NOCS). The use of XRF in fluvial landscapes has great potential to determine floodplain dynamics, depositional character and flood histories (Turner et al., 2015), and has already been used with success in the Severn catchment (Jones et al., 2010, 2012; Pears et al., 2020a, 2020b). ITRAX XRF was used in this instance as a way of determining variations in the nature and composition of the visible lamination at a higher resolution than could be physically tested by grain size and the laser diffraction method. In total 39 elements were identified including lithogenic indicators (Si, Al, K, Ti, Zr, Rb) and anthropogenic and heavy metal indicators (P, Ca, Cr, Zn, Ba, Sr, Pb). The resultant elemental intensities, measured in counts per second (cps), were vetted to remove unreliable results possibly associated with increased clays and organic matter (Weindorf et al., 2012). The remaining data were then analysed to determine the best relationship interactions in order to interpret coarse grained size indicators, organics and physical and chemical weathering indicators.
In conjunction with the ITRAX analysis a sequence of field and laboratory measurements were also made using a Niton XL3t GOLDD+ portable XRF (pXRF) analyser. The use of this technique allowed a rapid assessment of elemental potential of the sedimentary sequence (Weindorf et al., 2014) as well as providing a quantifiable dataset (in ppm) to compare against the ITRAX XRF results. In fluvial contexts pXRF has enabled sediment provenancing in the River Nile (Pennington et al., 2019), the identification of heavy metal and geochemical dispersion in Brazil (Soares de Almeida et al., 2019), pollutants (Grattan et al., 2016) and analysis of geomorphological processes (Latuso et al., 2017; Petřík et al., 2019). A total of 111 samples at 2 cm resolution were analysed down a freshly cleaned section of the riverbank profile. In addition, a further 239 samples at the same resolution were analysed in laboratory conditions from the two cores (C1 and C2) from the floodplain. In both cases, samples were added to plastic pots and covered with 160 µm Ultralene film before being placed into the mounted test stand. Readings were taken using the ‘Geochem’ mode with a dwell time of 75 s composed of 15 s ‘main’ filter (0–100 keV), 15 s ‘low’ filter (0–40 keV), 5 s ‘high’ filter (40–100 keV) and 40 s ‘light’ filter (0–10 keV).
Statistical analyses
Following data collection and quality control, statistical analysis was conducted on Log-normalized data to determine sedimentological variations. A programme of Agglomerative Hierarchical Clustering (AHC) was conducted using XLStat 2019.3.2 which enabled the detailed zonation of layers. Series dissimilarity was determined at 1 cm resolution using the Euclidean distance between nine variables, percentage organics, percentage carbonate, magnetic susceptibility, fine particulate (clay and silt content), sand content, LogZr:Rb, LogTi:K, LogSi:Al, LogCoh:Inc. Agglomeration was calculated using Ward’s Method (Ward, 1963). The results were presented in horizontal dendrograms demonstrating cophenetic distance between variables and horizons, with major classes defined by class colour variation and individual layer zonation defined by changes at the most similar level. To analyse the comparative nature of the different grain size sediment proxies, high-resolution LogZr:Fe, LogTi:K, LogSi:Al and LogZr:Fe multi-element ITRAX XRF results were investigated through Principal Component and Variable Factor Analysis. This was conducted using Pearson’s (n) Correlation through XLStat 2019.3.2. The data were clustered into 10-year averages and plotted on individual distance biplots and Varimax rotation plots with an automated coefficient.
Sediment deposition models and climatic reconstructions
To determine wider catchment variation in depositional processes at Kempsey and other high-resolution dated OSL sequences in the Upper and Middle Severn, Teme and Wye, the sedimentary data was collated into one model for each location. This was conducted by normalizing coarse and fine sediment grain-size data including texture, carbonate, magnetic susceptibility, sand content, and the proxy grain size elemental ratios listed above. The raw data were statistically tested using polynomial regression and filtered through a 20-year moving average which enabled the identification and refinement of deposition at each site between the mid-14th to mid-19th centuries CE. To interpret these sediment models further six relevant climatic datasets for the UK and Northern Europe (Büntgen et al., 2011; Charman et al., 2006; Esper et al., 2014; Phipps et al., 2013; Swindles et al., 2013; Wilson et al., 2013) were gathered from the Palaeoclimatology Data website (NOAA, 2020) https://www.ncdc.noaa.gov/data-access/palaeoclimatology-data. The raw data were normalized and the resultant datasets were then graphically illustrated with a 20-year running average to reduce ‘noise’ and re-interpreted by colour coding to demonstrate relative periods of ‘wetter’, ‘dryer’, ‘cooler’, ‘warmer’, ‘higher solar activity’ and ‘lower solar activity’.
Sedimentary analysis and chronostratigraphy
Reach floodplain alluviation
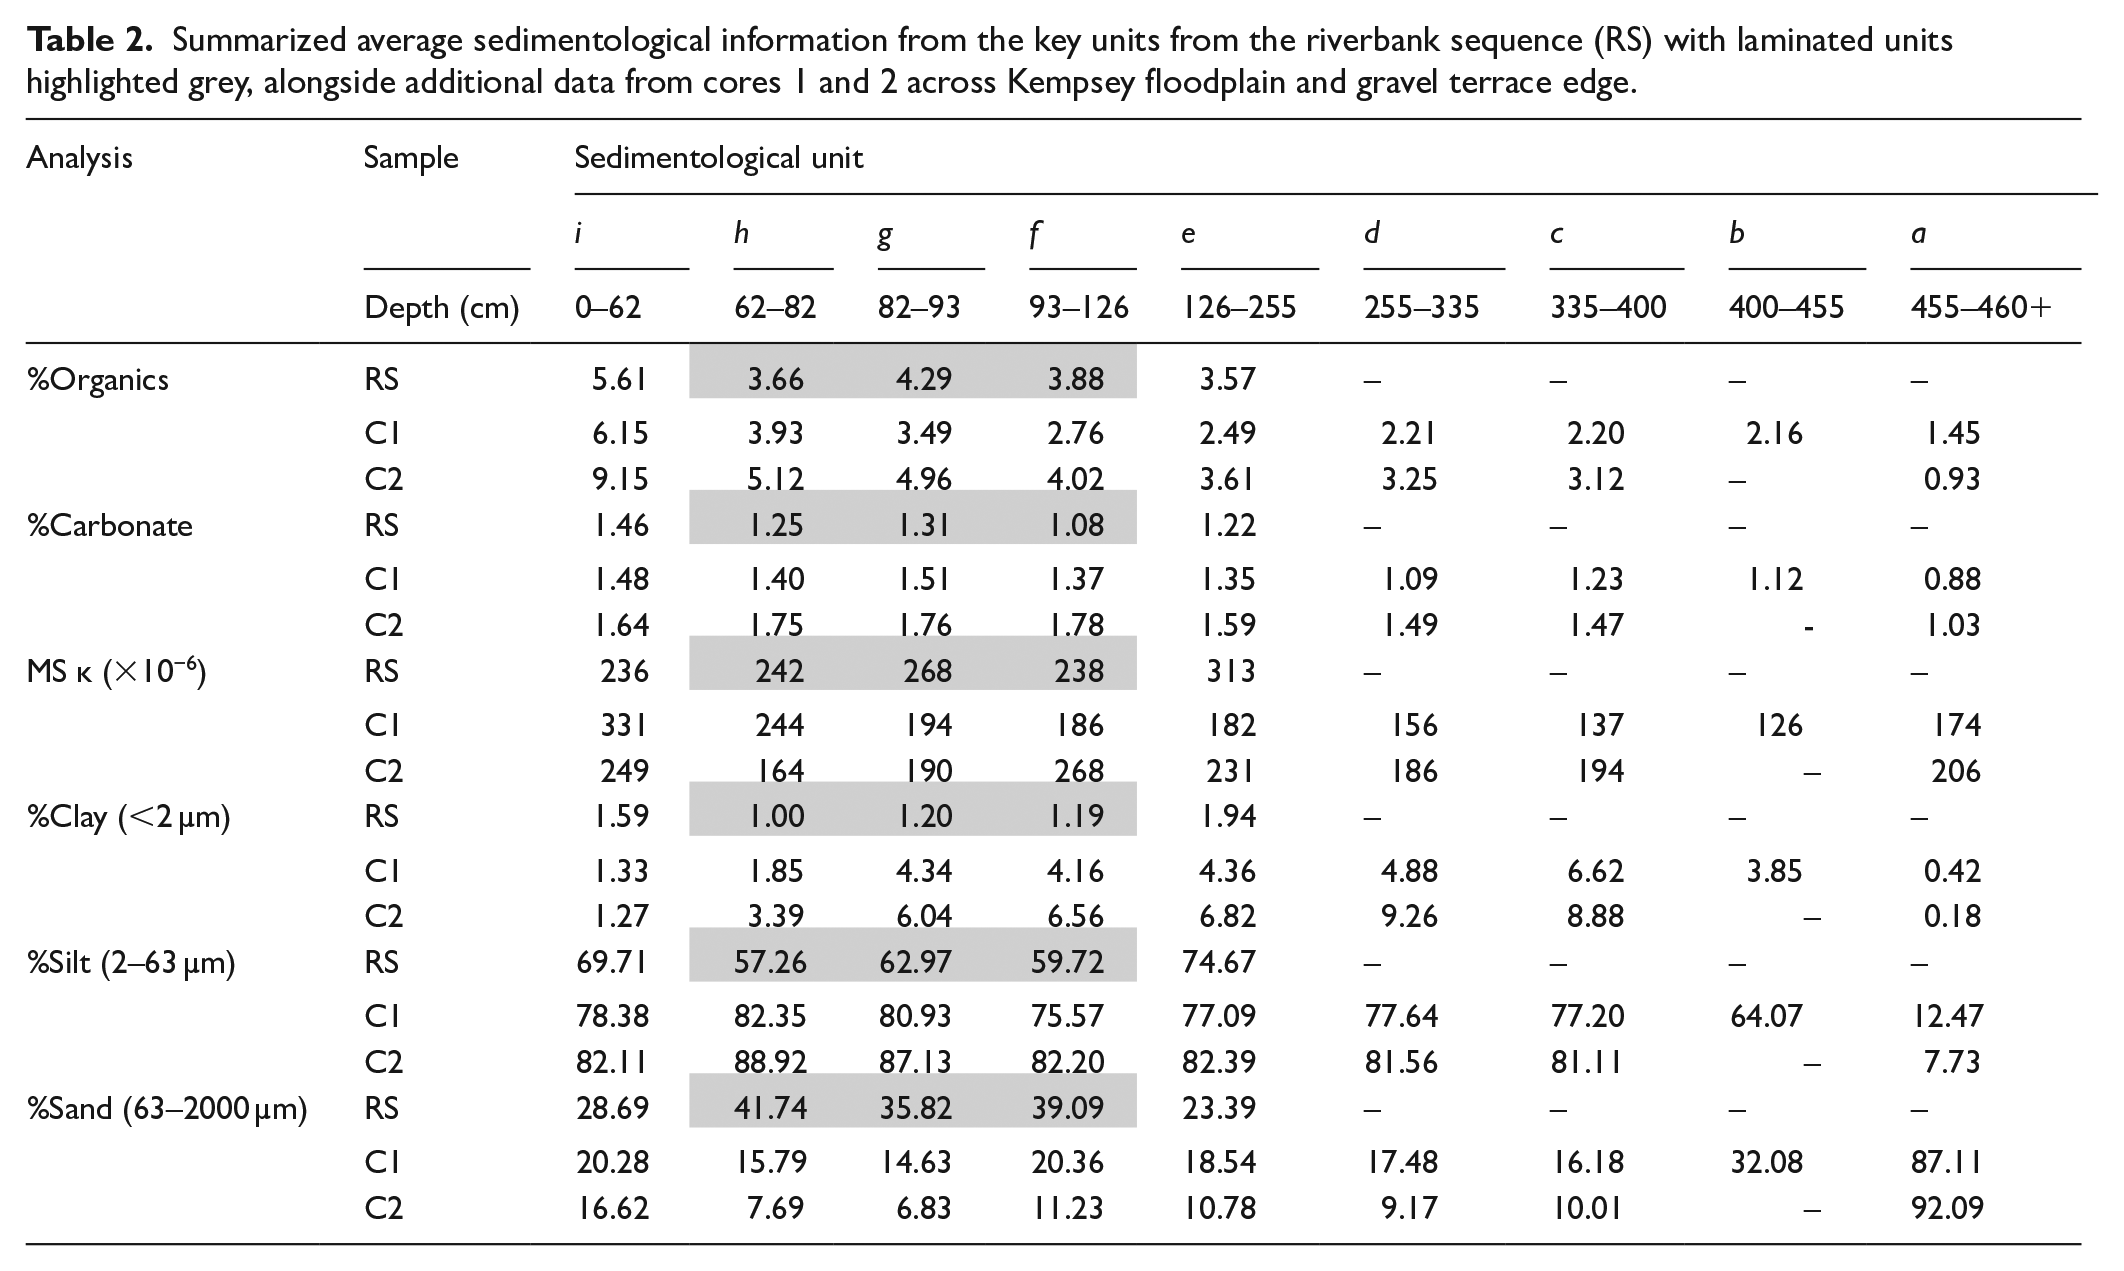
Coring across the floodplain identified 4.6 m of alluvium overlying sands and gravels in core 1, closest to the river (Table 2, Figure 3). Away from the channel the depth of alluvium gradually shallowed (3.5 m in core 2), and then decreased dramatically as it met the rising gravel terrace (unit a). The date of the onset of alluviation could not be determined from the present study (as no OSL dates were taken from the base of the sequence), but radiocarbon dates extracted from the base of the alluvial sequence to the east of the gravel terrace in the Hatfield Brook (150 m south east of the sample site) indicated overbank alluviation in the Early Bronze Age (2287–2129 cal. BCE). Further away, late Prehistoric/early Romano-British dates for the onset of alluviation have been determined 3.5 km upstream at Powick at the Severn/Teme confluence (Pears et al., 2020a, 2020b), as well as from alluvial sequences in the Upper Severn (Jones et al., 2012) and the Herefordshire Frome (Brown et al., 2013).
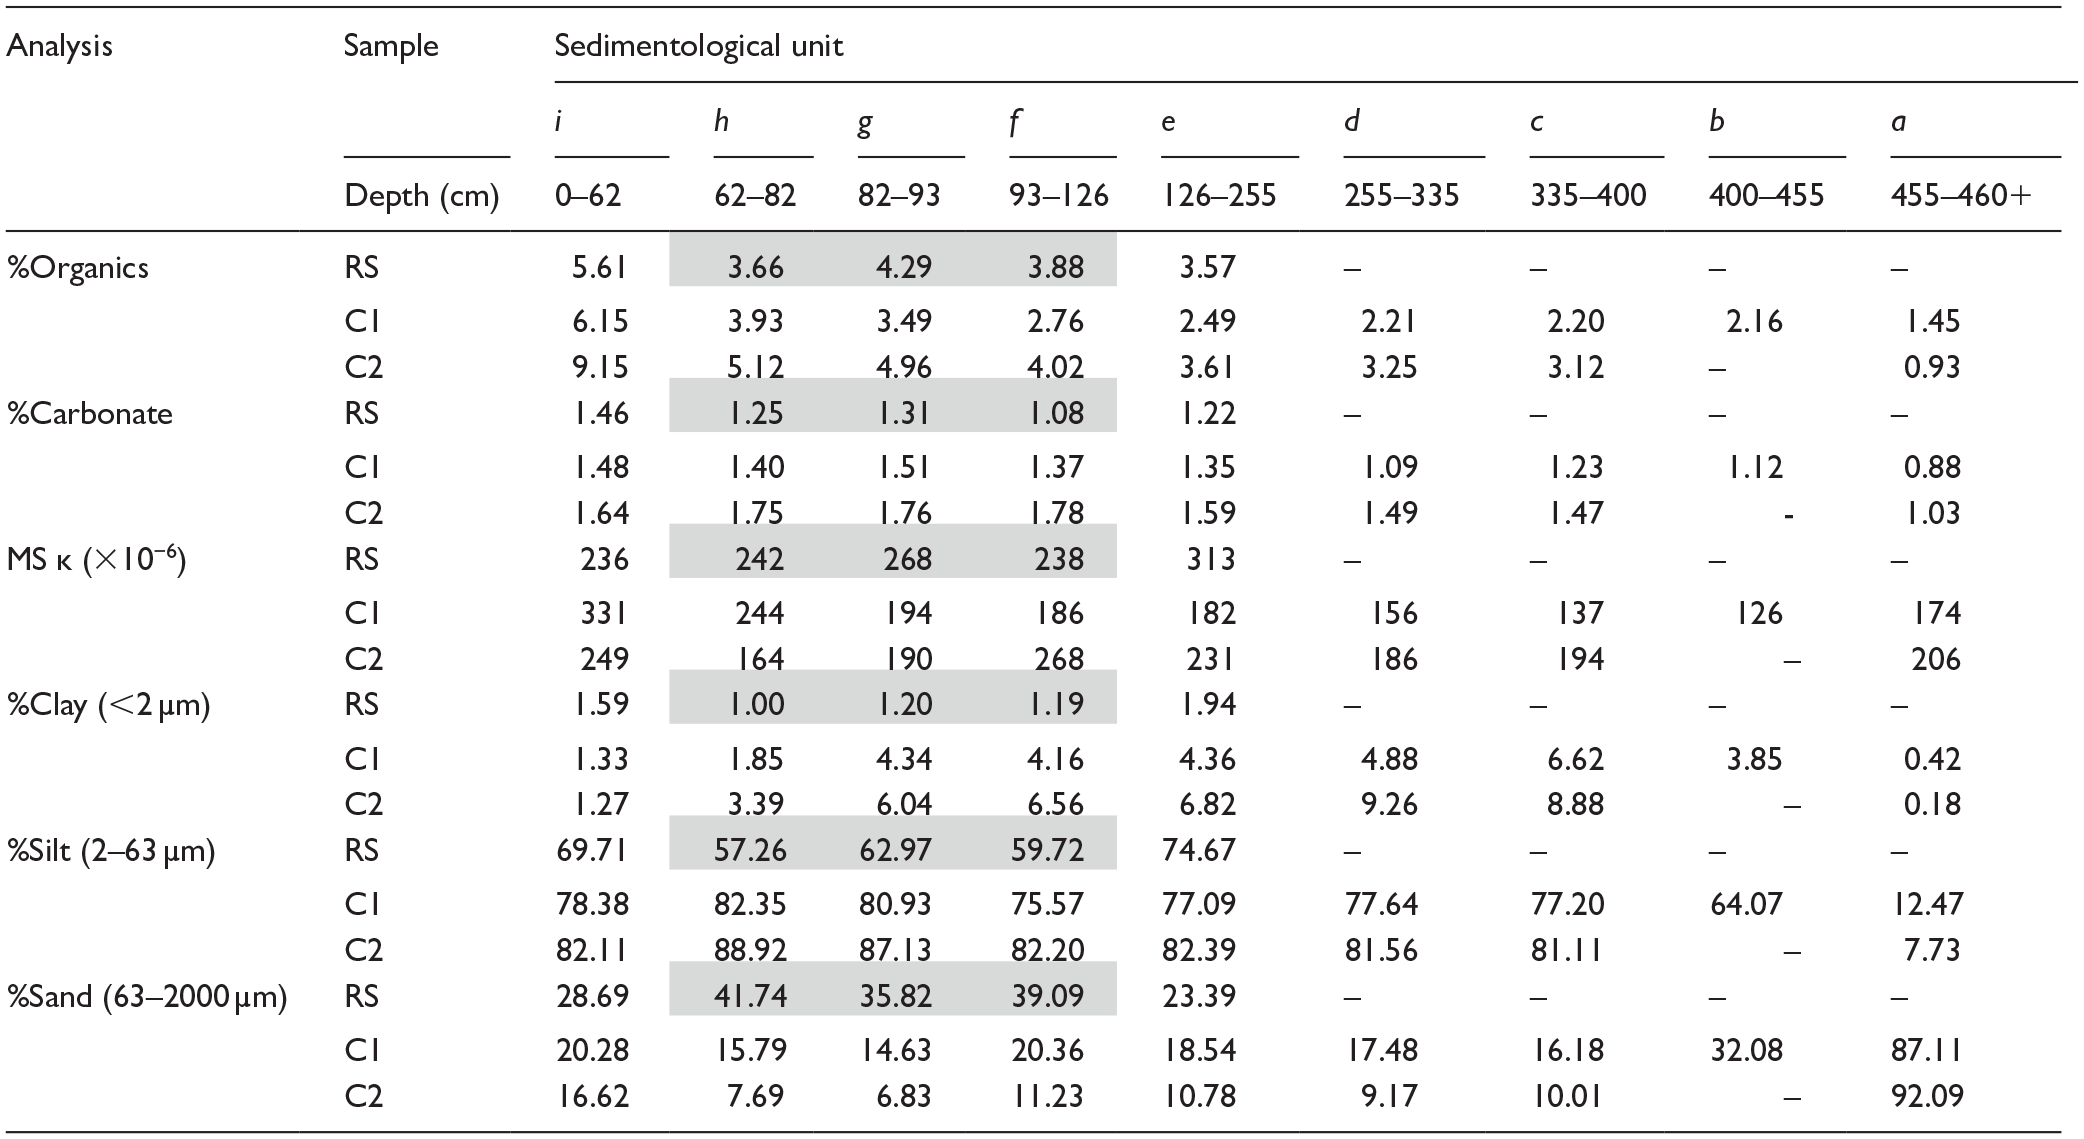
Summarized average sedimentological information from the key units from the riverbank sequence (RS) with laminated units highlighted grey, alongside additional data from cores 1 and 2 across Kempsey floodplain and gravel terrace edge.
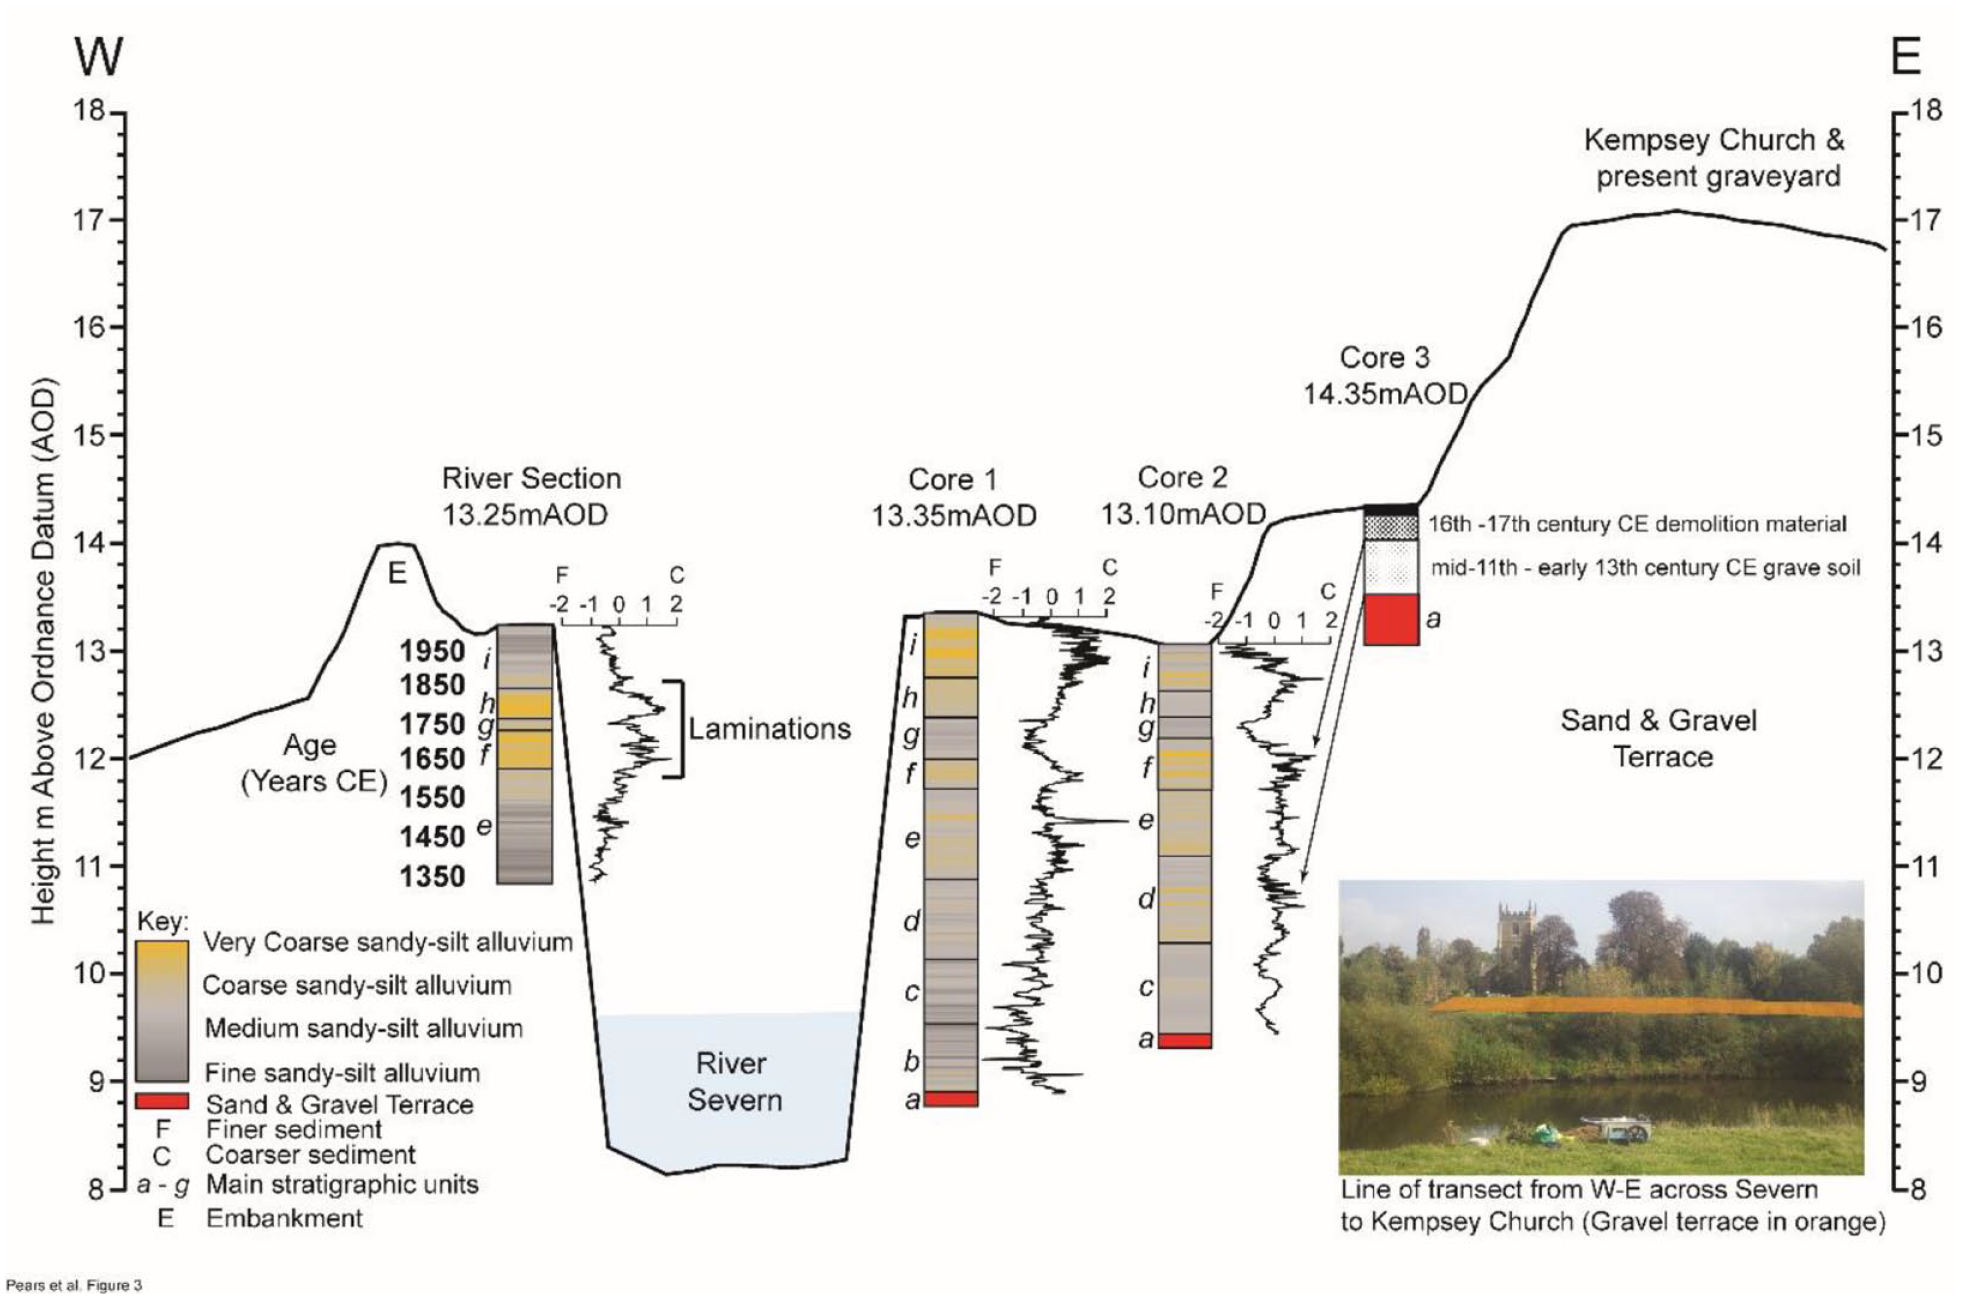
River Severn floodplain stratigraphy at Kempsey alongside sampling locations with major sub-units (a and i), calculated dates from age depth model and position of visible laminations. All graphs demonstrate log normalized composite data sets of sediment LOI, texture, % sand, magnetic susceptibility, ITRAX XRF and pXRF. Surface topography of cross section extracted from 1 m Lidar DTM tiles SO84NE, SO84NW (Environment Agency, 2014). All photos copyright of the authors.
The sedimentary record of cores 1 and 2 and the river section are correlated revealing that the pattern of floodplain alluviation can be traced across the floodplain above a critical depth where the sedimentation patterns became uniform across the floodplain. Above the gravel terrace (unit a) the first alluvial deposits consist of fine to medium silts with a distinctive grey blue colour (unit b), and in core 1 are interspersed with at least 16 coarse sand laminations. These demonstrate frequent variability in depositional energy due to channel movement or more likely increased water velocity associated with the overbank ebb and return-flow of flood events. Sediment grainsize is seen to increase in all sampled areas (units c and d) as the depth of overbank alluviation increases and channel stability is maintained. In core 2 unit d appears particularly coarse and is not traceable in core 1 and may be a result of increased sediment erosion deriving from increased anthropogenic activity or change in land-use on the neighbouring gravel terrace, possibly as a result of the creation of the initial graveyard prior to the mid-11th century CE, as identified by a heavily bioturbated organic sandy silt with heavily degraded charcoal, ceramics and degraded bone fragments (Vaughan and Webster, 2016, 2017).
The base of unit e marks the critical depth above which the units can be unambiguously traced across the floodplain from Kempsey to the river section sampling location to the western side of the contemporary Severn channel and the gradual continuation of coarser alluvium suggests higher energy deposition from the late 14th century CE onwards. Following this is a period of heightened riverine activity and depositional energy (units f, g, h) and in the river section this is marked by the occurrence of the visible laminations (Figures 3 and 4). Unit f can be clearly traced across the sample area and in core 2 may be exacerbated by downslope sediment transfer from the gravel terrace of a coarse sandy silt with large stone inclusions, brick and post mediaeval ceramics (Vaughan and Webster, 2016, 2017; Webster, 1955) that were transferred around the same time as the demolition of the manorial complex between c. 1540 and 1695 CE.
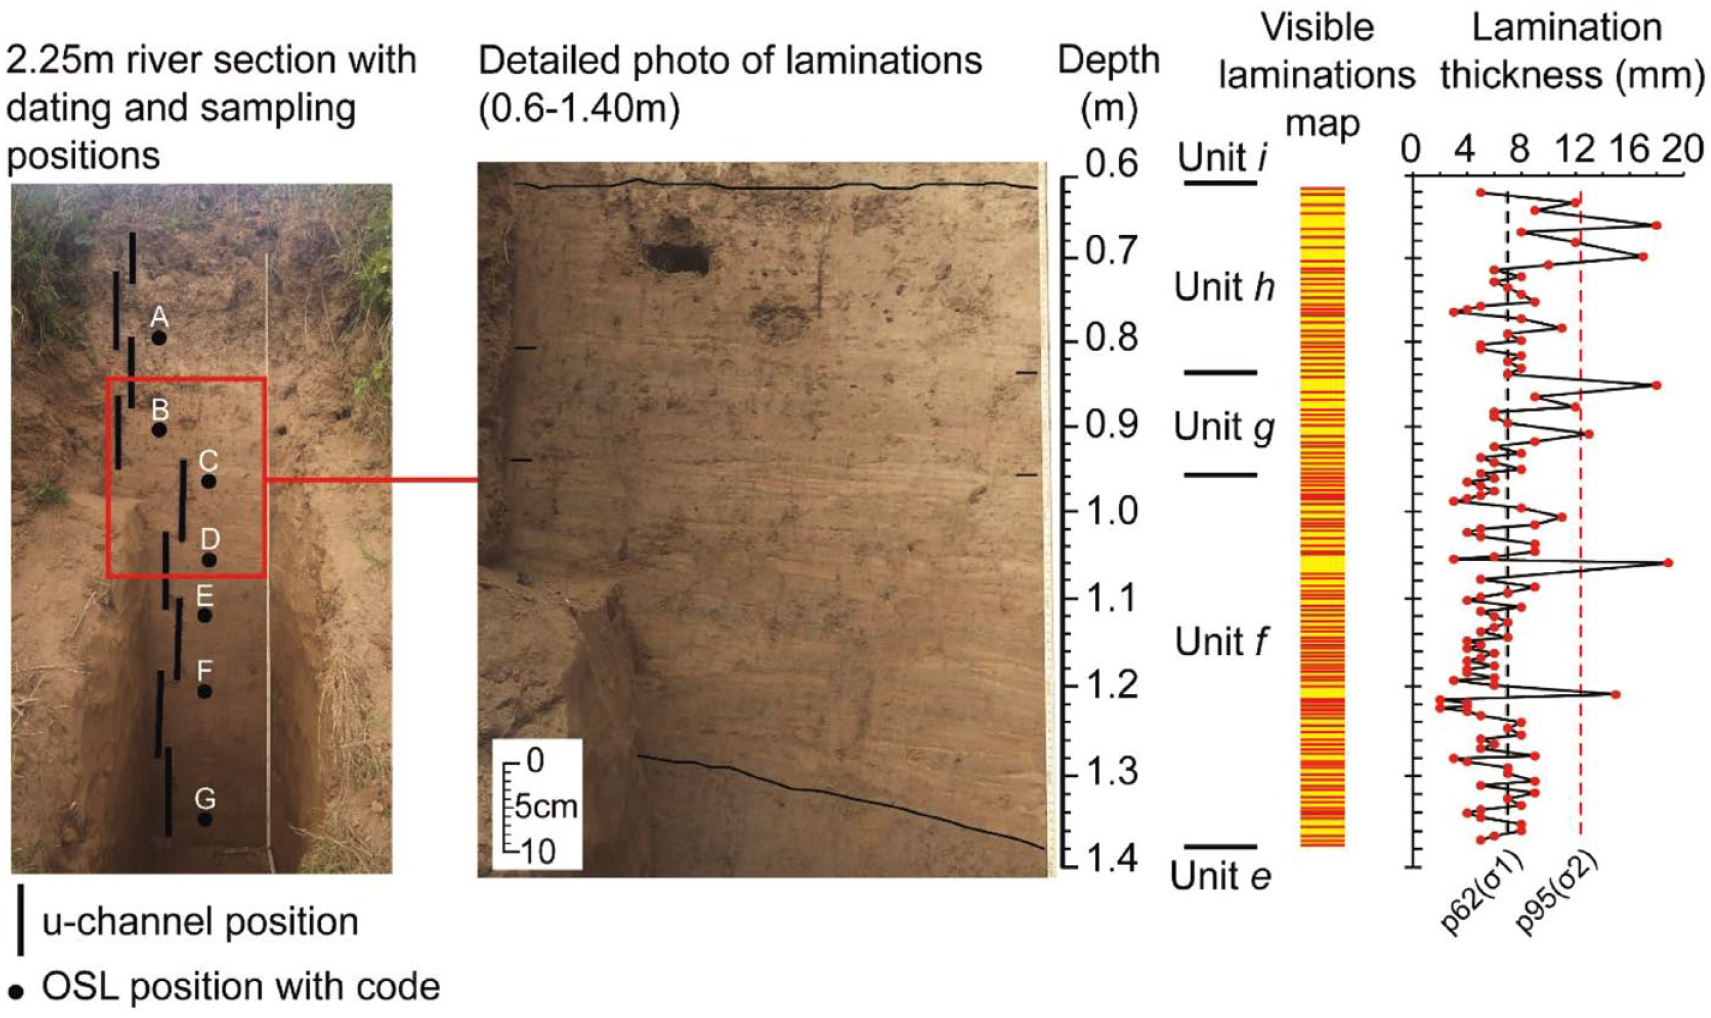
Photograph of excavated 2.25 m river section with u-channel and OSL dating sampling positions. With detailed photograph of visible laminations between 0.60 and 1.40 m alongside designated major stratigraphic units (e–i), interpreted visible laminations map and progressive lamination thickness (mm). All photos copyright of the authors.
Following a period of finer alluviation with thicker, darker, laminations (unit g) is a second phase of coarser alluvium deposition composed of thinner, more discrete laminations (unit h). These primarily occur in the area closest to the river channel and suggest a period of intensive but localized sedimentation around the channel edge/levee. At this point there appears a marked change in depositionary characteristics between the river section and cores 1 and 2 (unit i). In the former, the nature of the deposited alluvium becomes generally finer whereas on the floodplain closest to the gravel terrace and Kempsey, the sediment continues to coarsen before fining close to the surface. This juxtaposition may be as a result of the construction of the flood embankment in the early to mid-19th century CE and the forcing of flood water across the eastern part of the floodplain towards Kempsey and the gravel terrace island.
Laminations and flood history
In addition to this stratigraphy, the sedimentary analysis and OSL-derived chronostratigraphy of the uppermost 2.25 m of the river section has allowed analysis of units f, g and h which provides an exceptional record of riverine behaviour, due to the stability of the channel, through the hydrological conditions of the Little Ice Age (Figures 4–6). From 2.25 to 1.40 m (unit e) the sequence dates from c. 1380 to 1610 CE and no visible laminations were identified. The alluvial deposits at this time show little major change in texture and typically consist of medium-silts with c.20–25% sand, with an average coarse fraction (Dx90) between 100 and 130 mm, variable oxic/anoxic conditions, suggesting greater fluctuations in water table position and low heavy-metal content (Figure 5). This pattern is also echoed in the principal component analysis (PCA) of the XRF proxy sediment indicators which are dominated by finer sediment textures (Figure 6). Between c. 1610 and 1840 CE (upper part of unit e to unit i) the floods of the River Severn at Kempsey deposited coarser silts with higher sand concentrations, in frequent higher-energy flood events, resulting in the preserved laminations. Accumulation rates throughout this part of this sequence are seen to vary between 2.3 and 4.5 mm year−1 (Figure 5). This is a much higher rate than at other sites studied on the Severn, Teme, Wye and the Herefordshire Frome at c.1.3–2.3 mm year−1 (Brown et al., 2013; Pears et al., 2020a, 2020b).
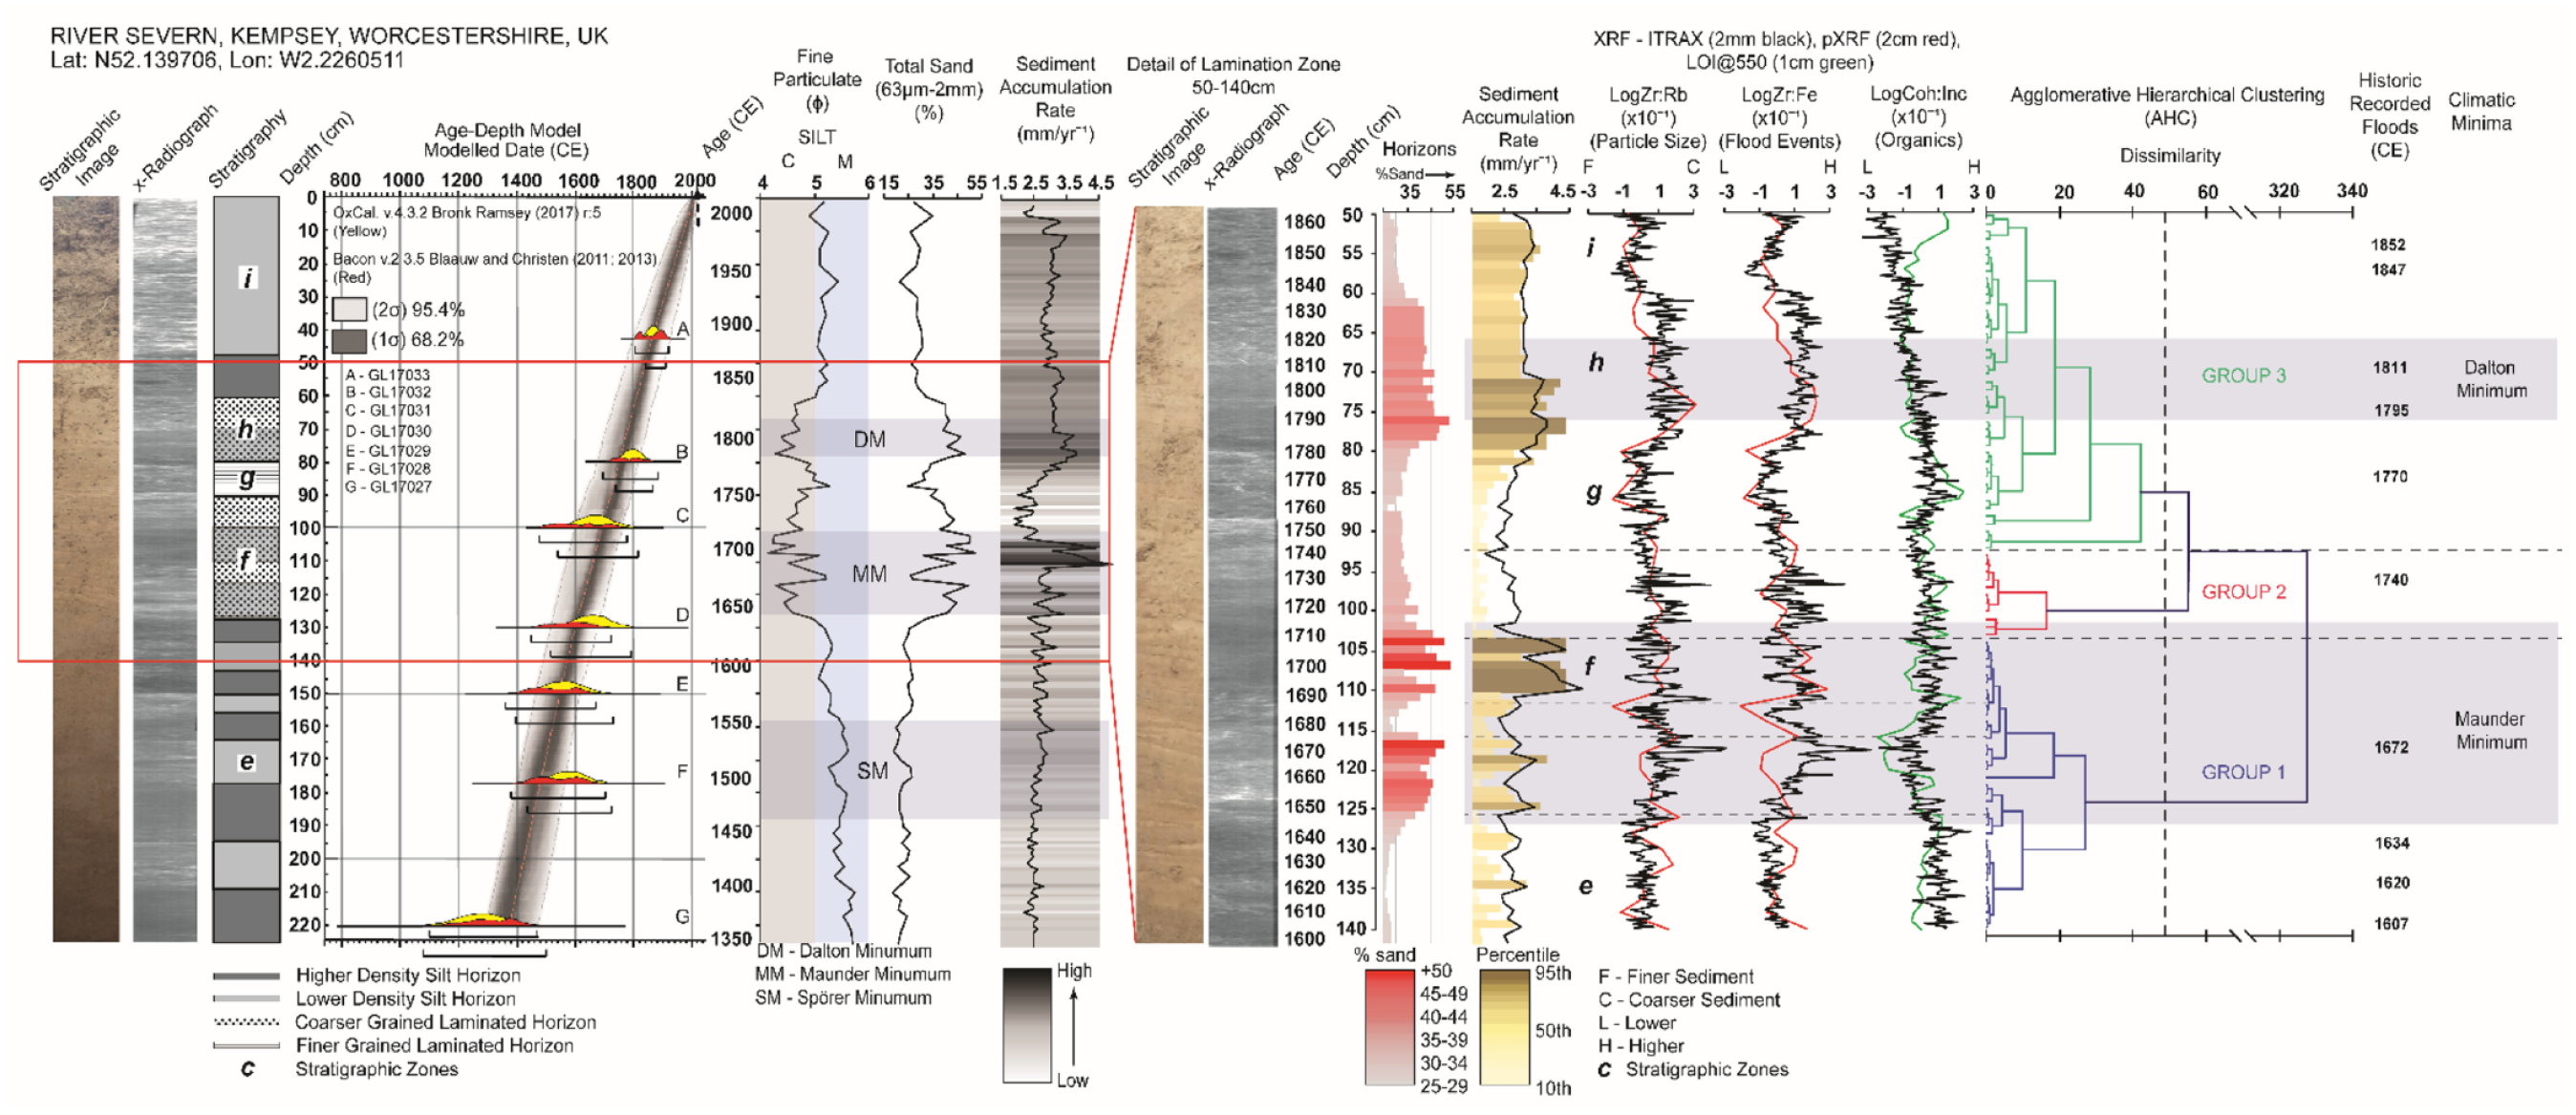
Chronostratigraphy of the 2.25 m River Severn section including stratigraphic image; x-radiograph; interpreted stratigraphy with major sub-units (e–i); calculated age-depth model using OxCal (yellow) and Bacon (red), and resultant age (CE); broad fine sedimentological texture (Wentworth, 1922); percentage total sand and calculated sediment accumulation rate. Detailed chronostratigraphy of laminated sequence shown in red outline between 0.50 and 1.40 m. Includes detailed stratigraphic image; x-radiograph; calculated age-depth; percentage sand by cm; sediment accumulation rate in mm year−1 and as percentile bars by cm; Comparison XRF using ITRAX (at 2 mm resolution) and pXRF (at 2 cm resolution) for proxy sediment texture indicators LogZr:Rb, flood events LogZr:Fe and organic content LogCoh:Inc and LOI. Sedimentological data for the laminations statistically tested using Agglomerative Hierarchical Clustering (AHC) presenting three key groups of dissimilarity coloured blue, red, green. Scientific data for laminated sequence presented alongside historic recorded floods between 1607 and 1852 CE and key Little Ice Age climatic minima Maunder (1645–1715 CE) and Dalton (1790–1820 CE).
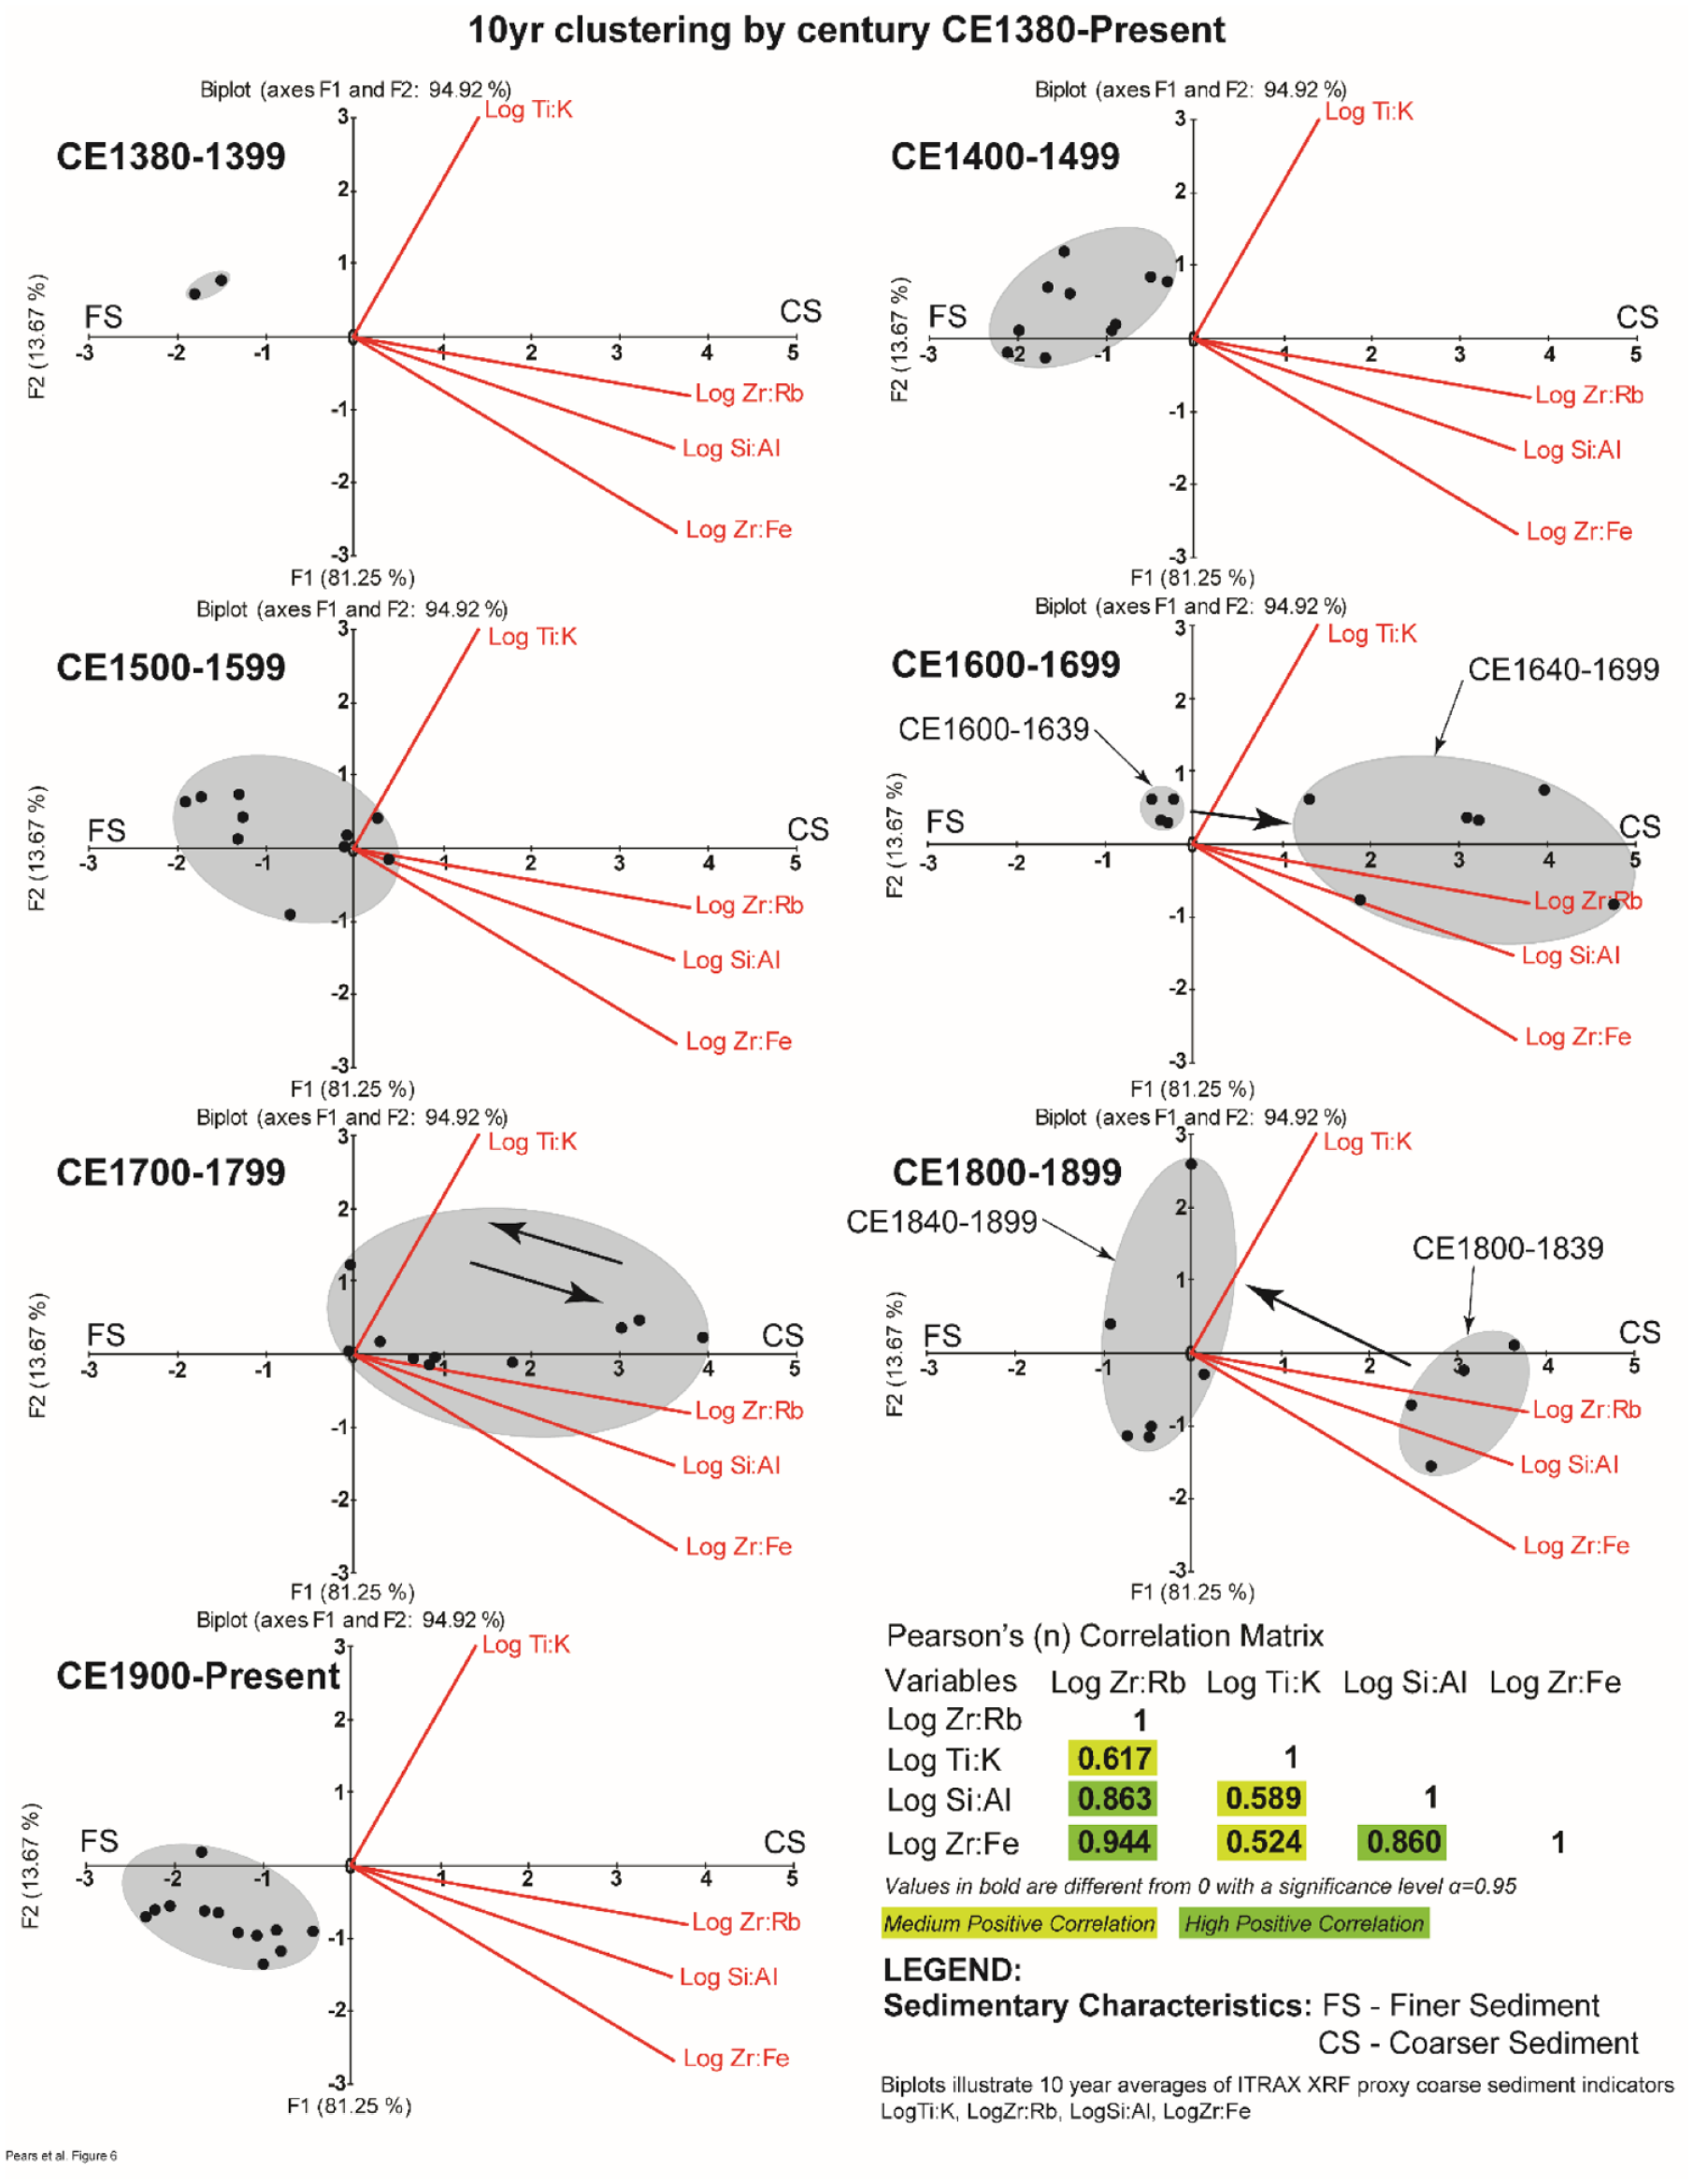
Principal Component Analysis, Variable Factor Analysis and Pearson’s correlation coefficient of sediment deposition in River Severn section at Kempsey between CE 1380 and present. Biplots illustrate 10 years averages of ITRAX XRF proxy coarse sediment indicators LogTi:K, LogZr:Rb, LogSi:Al and LogZr:Fe, with arrows denoting specific shifts in textural character within decadal timeframes, most apparent between 1640 and 1839 CE.
In the lower part of unit f, between 1.22 and 1.38 m (c. 1610–1640 CE) there is a development of silt dominated laminations of 4–7 mm thickness alongside an increasing rate of accumulation (2–3 mm year−1). Statistically, there is a clear shift between coarser and finer deposition between the early and later 17th century CE (Figure 6).
From 1.22 to 1.05 m (c. 1640–1715 CE) in the middle section of unit f the laminations increase in number but decrease in overall thickness (most < 7 mm) and are bounded by two much thicker examples above 15 mm (Figure 4). The nature of these laminations though is dominated by a greater sand fraction, in most cases well above 40%, the accumulation rate (to a maximum of 4.5 mm year−1) alongside increases in the XRF indicators (Figure 5) and a noticeable shift in the PCA can be observed from the later 17th century CE (Figure 6).
Between 1.05 and 0.85 m (c. 1715–1765 CE) in the upper section of unit f and subsequent unit g the number and thickness of visible laminations are present within three distinct phases. Firstly, decreasing in number but becoming thicker (>7 mm) between 1.05 and 0.95 m, then more numerous but thinner (<7 mm) from 0.95 to 0.92 and finally thickening once again (>9 mm) from 0.92 to 0.85 mm (Figure 4). Variations in the form of the visible laminations suggest distinct shifts in fluvial conditions, however the overall texture of these features is dominated by coarse silts with consistently lower sand content (<35%) and markedly lower accumulation rates (<2 mm year−1) than between c. 1640 and 1715 CE (Figure 5). This pattern is also demonstrated in the variability of the PCA results for the 18th century CE (Figure 6).
From 0.85 to 0.60 m (c. 1765–1840 CE), (unit h) there is another shift in increased clastic texture deposition and visible lamination pattern. Between 0.85 and 0.72 m (c. 1765–1790 CE) there is a reduction in overall visible lamination thickness (c. 4–9 mm), which increases to c.8–18 mm between 0.72 and 0.60 m (c. 1790–1840 CE) (Figure 4). This change can also be seen texturally as there is a sharp increase in both accumulation rate (to over 4 mm year−1) and sand content (40–55%) alongside an overall coarsening in the XRF proxies (Figure 5). Results shown in the PCA from the late 18th to mid- 19th centuries CE also show this distinctive shift towards coarser deposition from c. 1765 to 1839 CE and a subsequent decrease in texture from c. 1840 CE to the present day (Figure 6), which possibly occurred as a result of the construction of the river embankment which protected the western floodplain.
The highly laminated deposits of units f, g and h occur during a period of widespread climatic variation during the Little Ice Age. However, clustering of the coarsest textured laminations appear also to fall within the Maunder Minimum (1645–1715 CE), (Brázdil et al., 2005; Eddy, 1976; Luterbacher et al., 2001; Raible et al., 2007; Shindell et al., 2001) and Dalton Minimum (1790–1820 CE), (Anet et al., 2014; Wagner and Zorita, 2005), time periods associated with wetter winters across much of Europe (Anet et al., 2014; Pauling et al., 2006; Wilson et al., 2013; Figures 5 and 6). There is also a correlation between the greatest extent of coarse laminations and the dates of known historic floods (Black and Law, 2004) (Figure 5). This is particularly evident between c. 1645–1680 CE and c. 1785–1830 CE and the floods of 1672, 1740, 1770 and 1795. That said, the extensive period of coarse sediment deposition with the highest accumulation rate (ca. 3–4.5 mm year−1) between c. 1690 and 1710 CE does not equate with major recorded floods and may have been deposited during high-energy localized events. In contrast, the major recorded floods of 1847 and 1852 (Black and Law, 2004) are not associated with increases in coarse textured laminations or accumulation rate, possibly as a result of a change in localized hydrological conditions following the construction of the river embankment constricting the channel and forcing flood waters towards Kempsey causing back-flooding of the Hatfield Brook, a process which resulted in major floods within the modern village in 2000, 2007 and 2020 CE. This change was clearly identified within cores 1 and 2 (see Figure 3) as continued coarse sediment deposition in contrast to the rapid shift towards finer sediment in the riverbank section.
Climatic and anthropogenic induced drivers
The identification and analysis of the laminated clastic fluvial sediment sequence in this reach can now be compared to other sites in the Severn Catchment which have also provided evidence of the nature of fluvial conditions during the Little Ice Age. In order to compare them, sediment depositional models (created by log-normalizing analytical data relating to sediment texture) were plotted over a 20-year periodicity against the age-depth models from sites in the Middle and Upper Severn, Teme and Wye. A similar process was also conducted for six key climatic data sets relating to peat water table depths, precipitation levels, mean summer temperatures (for northwest Europe) and solar activity to identity possible climatic drivers for river behaviour (Figure 7).
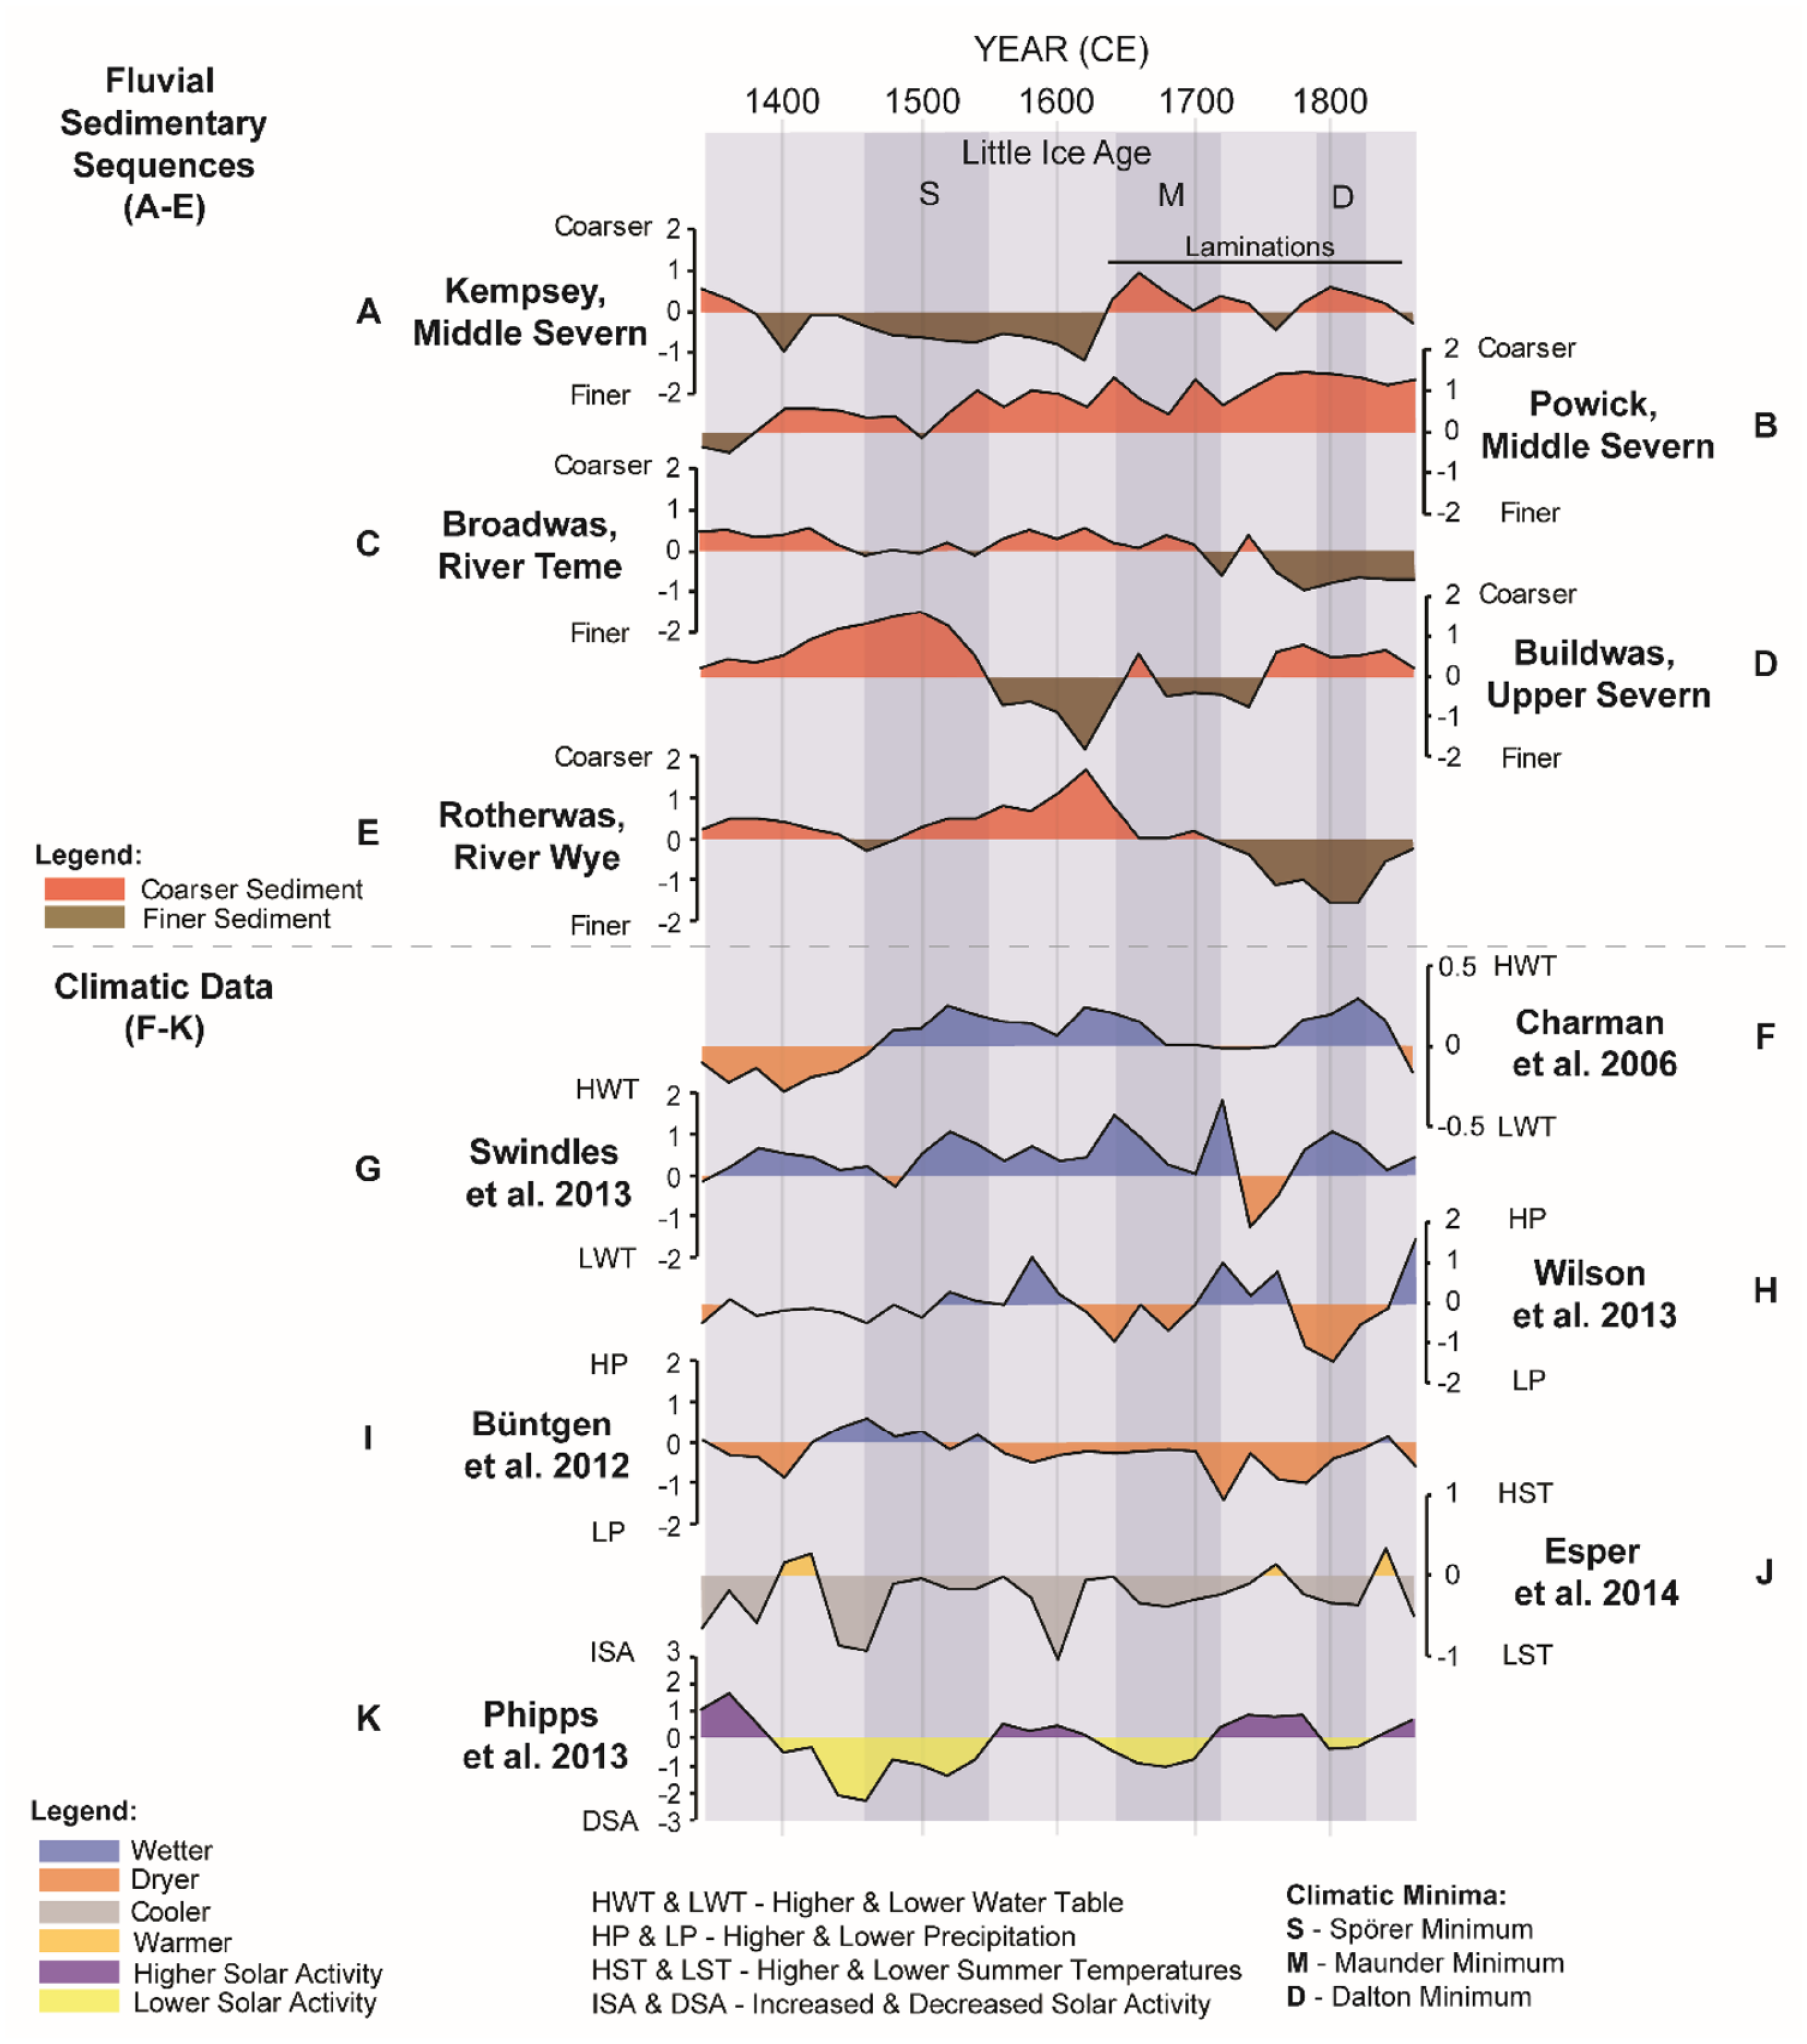
Summary fluvial sedimentary sequences from Kempsey and other sites across the Severn Catchment (a–e) alongside comparable climatic datasets from the UK and Northwest Europe between 1350 and 1850 CE (f–k), with Little Ice Age solar minima highlighted.
The visible laminations at Kempsey deposited between c. 1610 and 1840 CE occur at a time of equivalent higher energy deposition at Powick, 3.5 km upstream (Pears et al., 2020a). Here, coarser sediments appear to have been accreting since the beginning of the 16th century CE, but further increased after c. 1550 CE. At Buildwas, 58 km upstream in the Upper Severn, intensive fluvial activity began in the mediaeval period (Pears et al., 2020b) and further increased between the 14th to mid-16th centuries CE and again after c. 1750 CE. An extended period of coarser sediment deposition between c. 1600 and 1900 CE has also been identified at another site in the Upper Severn at Roundabout 112 km upstream (Jones et al., 2012). Additionally, sediment sequences in the Rivers Teme and Wye also show coarser deposition during the Little Ice Age period specifically between the 14th and 18th centuries CE, with finer deposition occurring in the last 2–300 years and this has led to back-water flooding in small tributaries such as the Hatfield Brook.
When these records are compared to climatic models we see likely environmental drivers for variations in flood magnitude and frequency (Figure 7). The increased large flood activity at Kempsey and other sites in the Severn appears to be largely contemporaneous with a prolonged phase of raised groundwater depths in upland peat environments which originally commenced around c. 400 CE (Charman et al., 2006; Swindles et al., 2013). Raised water-tables in upland landscapes may have been driven by wetter conditions with increased precipitation. Reconstructed Spring and Summer rainfall levels derived from tree ring data from Midland England suggest that from c. 1500 CE onwards conditions were more variable than during the latter stages of the mediaeval period (Wilson et al., 2013). Three clear phases of wetter conditions between c. 1580 and 1600 CE; c. 1720 and 1760 CE and c. 1840 and 1860 CE occur at times of clear changes in depositional characteristics in the river systems. Similarly, extended phases with lower floods were also present between c. 1280 and 1320 CE; c. 1600 and 1700 CE and c. 1780 and 1820 CE possibly equating to conditions between climatic minima, also conceivably driven by increased solar activity (Phipps et al., 2013). Precipitation and summer temperature records across Northern Europe (Buntgen et al., 2011; Esper et al., 2014) suggest less variability, between c. 1350 and 1450 CE with largely drier, colder conditions throughout. The period between c. 1450 and 1570 CE though indicates wetter conditions and has been associated with increased flooding (Brázdil et al., 1999). Analysis of other palaeoclimatic proxies for this period has demonstrated more variability with increased rainfall between c. 1590 and 1610 CE; c. 1705 and 1715 CE and c. 1800 and 1815 CE (Starkel, 2000, 2001). The identification of significant flood events during these ‘wetter’ phases in Poland (Czerwiński, 1991), Italy (Pavese et al., 1992), France (Arnaud-Fassetta, 2003; Arnaud et al., 2005; Pastre et al., 2001) and Spain (Benito et al., 1996, 2003; Thorndycraft and Benito, 2006), demonstrate more variable fluvial conditions through the Little Ice Age and, to some extent, a degree of uniformity between increased fluvial activity in mainland Europe and in Britain (Rumsby and Macklin, 1996).
Alongside climatological drivers, changes in depositional regimes in the Severn at Kempsey may also have occurred as a result of soil erosion (Brown, 1997) and increased suspended sediment concentrations in flood flows including fine sand and coarse silt liberated from soil aggregates (Brown, 2009). This can be caused by anthropogenic activity including extensive deforestation and cultivation, leading to accelerated soil erosion from lowlands well-connected to the floodplains (Bork, 1989; Klimek et al., 2006; Starkel, 1994; Zolitschka et al., 2003). This has been demonstrated in a number of lowland British river systems (Brown, 2009; Brown et al., 1994, 2001; Parker et al., 2008; Passmore and Macklin, 1994). Palynological records from the Severn and neighbouring catchments demonstrate general landscape openness from the Bronze Age onwards, with significant accelerations in woodland clearance and management in the Iron Age, Romano-British and mediaeval periods (Barber and Twigger, 1987; Beales, 1980; Greig, 1999; Greig and Colledge, 2005; Pittam, 2006; Shotton, 1978). The additional, progressive intensification of cultivation across large areas of riverine margins during these latter phases exacerbated soil erosion and sediment transfer into the river systems (Brown, 1987a, 1987b, 1988, 1990; Brown et al., 2011, 2013; Brown and Barber, 1985).
Continued intensive agricultural practice and floodplain land-use in the post-mediaeval and modern periods across the Upper-Middle Severn catchment has also been suggested for the dramatically increased accumulation rates after c. 1550 CE at Roundabout (Jones et al., 2010). The county of Shropshire underwent a significant reduction in tree cover from the mid-17th century CE, although this created more extensive areas of wood pasture for grazing rather than conversion to arable land (Bowen, 2016) and for the period between c. 1600 and 1840 CE there remained a dominance of pastoralism, particularly cattle rearing, sheep-keeping and dairying (Thirsk, 1987) in the upper Severn catchment giving greater weight to the dominance of climatological drivers on flood activity.
In contrast to this, land-use in the clay vales and lowlands of the Middle Severn catchment at the same time saw the universal practice of mixed arable and stock rearing (Thirsk, 1987). Despite a population increase in the order of 220% between 1600 and 1801 CE (Wrigley, 2009) there appears to have been little expansion of arable land, implying intensification of cultivation. In Worcestershire 42.7% of its land area was under cultivation in 1836 CE, a figure similarly to the 42.5% calculated for the late 13th century CE (Broadberry et al., 2015). Rather than an increase in arable land, increased intensity and arable practices such as reduction in covered-fallow periods, may have had led to increased sediment supply exacerbated by climatic conditions. The development of spring-sown barley cultivation, already in place by c. 1660 CE, would have left a larger acreage of winter ploughed fallow exposed to precipitation, with greater implications for increased run-off, soil erosion and sediment transport rates.
The combination of climatic conditions during the Little Ice Age, the increased frequency and intensification of cultivation practice in the Middle Severn, and the effect of human modifications to river channels in the form of locks and weirs upstream at Stourport, Holt, Bevere and Worcester after 1843–44 CE (Cook and MacLeod, 2016) as well as the flood embankments appear to have acted as drivers for conditions which led to the development and preservation of the laminated fluvial alluviation at Kempsey as a result of the far higher accumulation rates than other comparable deepened overbank sequences across other parts of the Severn catchment.
Analysis of archaeological and historical data reveals changing fortunes and settlement focus of the adjacent village of Kempsey. These records reveal the importance and expansion of Kempsey at the end of the eighth and ninth centuries CE with the founding of a minster church (Bassett, 1989; Finberg, 1972), a second church with burials (McGurk, 1995; Vaughan and Webster, 2016, 2017) and an episcopal manor (Bond, 1988; Sims-Williams, 1990) all within the confines of the small gravel terrace promontory at the floodplain edge. By the late 11th century CE the economic success of the village waned as the Domesday survey demonstrates a devaluation (£16–£8) of the village, alongside an increase in the ‘number of tax paying hides in waste’ (Morris, 1982). A ‘hide’ is a measure of land (originally enough to feed one family) and ‘waste’ is lands no longer cultivated so this suggesting partial depopulation. This change would have been driven largely by broader social change, but may have been in part due to changing environmental conditions around the gravel terrace promontory. At the same time the original church is moved away from the terrace edge to a higher, more central position in the 11th to 12th centuries CE with considerable expansion in the 13th century CE (Brooks and Pevsner, 2007) alongside settlement reorganization to the north west away from the Severn and Hatfield Brook confluence. Such retraction of occupation appears to continue into the late post mediaeval period with the identification of the remains of demolished manorial buildings and the remainder of occupation on the terrace between c. 1540 and 1695 CE (Vaughan and Webster, 2016, 2017), which may have in part been due to an increased flood-risk and more regular cut off of the land surrounding the manor.
Conclusions
The identification and analysis of unusually well-preserved clastic alluvial laminations in a deep alluvial river-side sequence has provided a high-resolution history of fluvial processes from the late 14th century CE to present. Overbank alluviation can be traced across the floodplain from the Early Bronze Age onwards due to channel stabilization along with sedimentation in the local tributary (Hatfield Brook) contemporaneously with other alluvial sequences in the Severn catchment (Brown et al., 2013; Jones et al., 2012; Pears et al., 2020a, 2020b).
From c. 1380 to 1550 CE overbank alluviation occurred steadily and was characterized by infrequent flood events depositing finer sediment during a period of lower accumulation rate. Deposition at this time appears to have not been greatly influenced by climatic conditions of the Spörer Minimum, although the pre 1380 CE sedimentary record from the floodplain suggests repeated, semi-regular floods gradually increasing in magnitude. After c. 1550 CE the magnitude of flooding increased, during the climatic instability of the Maunder and Dalton Minima. We show that this is also recorded by other alluvial sedimentary sequences in the Severn catchment, and corresponds with the period of largest floods record, but also with the intensification of arable cultivation in the Middle Severn catchment. By c. 1610 CE, with the start of the visible sub-centimetre laminations, the accumulation rate regularly exceeded 3 mm year−1, and between c. 1690 and 1710 CE was 3 and 4.5 mm year-1. Following a reduction in flood magnitude, intensity and accumulation rate (2–2.5 mm year−1) c. 1715–1750 CE, fluvial activity increased once again between c. 1790 and 1840 CE resulting in coarser alluviation at 3–3.5 mm year−1 before finally becoming finer, probably as a result of embankment construction which forced translocation of all flood waters onto the eastern floodplain and caused increased back-up flooding in the Hatfield Brook.
The sedimentological evidence suggests that climatic drivers, especially during the Maunder and Dalton Minima, had a significant effect upon the depositional record of the River Severn. The dramatic variation in climatic conditions would have increased channel flow, sediment load and flood magnitude and periodicity. In addition, the intensification of arable cultivation after c. 1600 CE on the soft Mercia Mudstones, New Red Sandstones and gravel terraces would have exacerbated soil erosion and increased sediment supply to the fluvial system.
Finally, the history of changing fluvial conditions may have affected the nature and extent of occupation on the terrace island upon which Kempsey village is situated. The founding of the eighth century CE ecclesiastical and ‘high status’ manorial settlement close to the Severn may have occurred during a period of low fluvial activity. Additionally, the presence of lower riverbanks at this time in this reach would have allowed flooding across the extensive floodplain and not onto the lower terrace itself. From the mediaeval period onwards, however, although continuing alluviation led to an increase in bank height larger magnitude floods and raised ground water levels started to encroach on the location of the mid-11th to early 13th century CE graveyard, and may have in part been a catalyst for its contraction in the 14th–15th centuries CE. More compelling, the period of coarsest sediment deposition and largest magnitude recorded floods between c. 1640 and 1840 CE is contemporary with the abandonment and demolition of the ‘high status’ manorial complex and the expansion of the village to the north, away from the original historic centre of settlement and potential effects of increased flooding.
Supplemental Material
sj-docx-1-hol-10.1177_09596836231197740 – Supplemental material for Rapid laminated clastic alluviation associated with increased Little Ice Age flooding co-driven by climate variability and historic land-use in the middle Severn catchment, UK
Supplemental material, sj-docx-1-hol-10.1177_09596836231197740 for Rapid laminated clastic alluviation associated with increased Little Ice Age flooding co-driven by climate variability and historic land-use in the middle Severn catchment, UK by Ben Pears, Antony G Brown, Phillip S Toms, Jamie Wood, Benjamin T Pennington and Richard Jones in The Holocene
Footnotes
Acknowledgements
The authors must thank the landowners and Peter Hughes, of the Madresfied Estate, Reverend Phillipa Sargent of St Mary’s Church, Kempsey, and Henry Morris, Chair of the Churchlands Trust. Thanks also to Tom Vaughan, Senior Project Officer at Worcestershire Archaeology, for archaeological and stratigraphical material. We also thank the Environment Agency for Lidar data.
Contributions
Ben Pears (BP) is the corresponding author. Author contributions: RJ and AGB designed research and provided funding acquisition; BP, JW and BTP conducted fieldwork; PT and JW conducted OSL chronology; BP conducted all laboratory, statistical and data analysis and created all graphics; BP, RJ, AGB, PT and BTP conducted review and editing; and BP, AGB, PT and RJ wrote the paper.
Funding
The author(s) disclosed receipt of the following financial support for the research, authorship and/or publication of this article: The research was undertaken as part of the Leverhulme Trust-funded ‘Flood and Flow’ project (RPG-2016-004).
Supplemental material
Supplemental material for this article is available online.
References
Supplementary Material
Please find the following supplemental material available below.
For Open Access articles published under a Creative Commons License, all supplemental material carries the same license as the article it is associated with.
For non-Open Access articles published, all supplemental material carries a non-exclusive license, and permission requests for re-use of supplemental material or any part of supplemental material shall be sent directly to the copyright owner as specified in the copyright notice associated with the article.