
Abstract
This study presents a cross-disciplinary revision of the Little Ice Age (LIA) advance of Nigardsbreen glacier, an outlet from Jostedalsbreen ice cap in western Norway. The associated glacier foreland is characterised by a well-preserved moraine series succeeding the 1748 CE LIA culmination, and a robust age control of individual moraines exists from abundant historical written and pictorial information as well as extensive lichenometric studies. The retreat dynamics of Nigardsbreen ever since the LIA maximum extent was attained is considered well-known. The timing of initiation of the LIA advance and dynamics of the glacier growth prior to reaching its maximum extent, however, is less understood as any moraines predating 1748 CE have been subsequently overridden. Potential archives available for exploring the glacier advance are therefore mostly confined to historical data such as for example, tax records, paintings, and church books, which has resulted in a present-day consensus of the LIA onset of Nigardsbreen c. 1710 CE. However, we show that a lack of adequate critical analysis on the accuracy of published historical data has allowed erroneous ages of glacier terminus positions to manifest in literature, resulting in for example, overestimated glacial advance rates. Here, we combine a novel data set of local tax load directly reflecting glacial impact on farming productivity with a cross-disciplinary assessment of published historical data, including rejection of several data points of former glacier extents. As a result, we present a revised glacier length curve for the LIA advance of Nigardsbreen towards its maximum extent.
Keywords
Introduction
Nigardsbreen glacier (‘breen’ = glacier; hereafter Nigardsbreen) is one of the many (c. 30 named) outlet glaciers originating from Jostedalsbreen, the largest ice cap in mainland Europe (Figure 1). The glacier foreland of Nigardsbreen is widely acknowledged and a well-studied field site by glacial geomorphologists, glaciologists, Quaternary geologists as well as botanists and ecologists due to the well-preserved marginal moraine series deposited during the deglaciation following the Little Ice Age (LIA) culminating 1748 CE (for an extensive overview of literature, see Nussbaumer et al., 2011), and the ongoing vegetational succession that can be studied in the foreland (e.g. Fægri, 1934; Rydgren et al., 2014). Ages obtained through multiple approaches such as lichenometric studies (Andersen and Sollid, 1971; Bickerton and Matthews, 1992, 1993; Erikstad and Sollid, 1986); investigations of historical anthropological archives such as church records, drawings, paintings, written accounts, prints, photographs and tax records (Grove, 1988, 2004; Grove and Battagel, 1983; Nussbaumer et al., 2011; Rekstad, 1900); as well as radiocarbon ages from soils buried below the till deposited during the LIA maximum (Matthews et al., 1986) and one radiocarbon age from in situ pine remains (Pinus sylvestris) that were overrun and killed by the advancing glacier between 1668 and 1682 CE (1 sigma range of the radiocarbon date; Nesje et al., 2008) have so far composed the basis for the robust, high-resolution age control on past glacier extent (Figures 2 and 3). The retreat rate and glacial dynamics since the LIA maximum is therefore remarkably well investigated and age constrained for Nigardsbreen. However, despite the numerous studies on Nigardsbreen and its associated foreland, few data points are found in literature from the glacier advance taking place before 1748 CE.
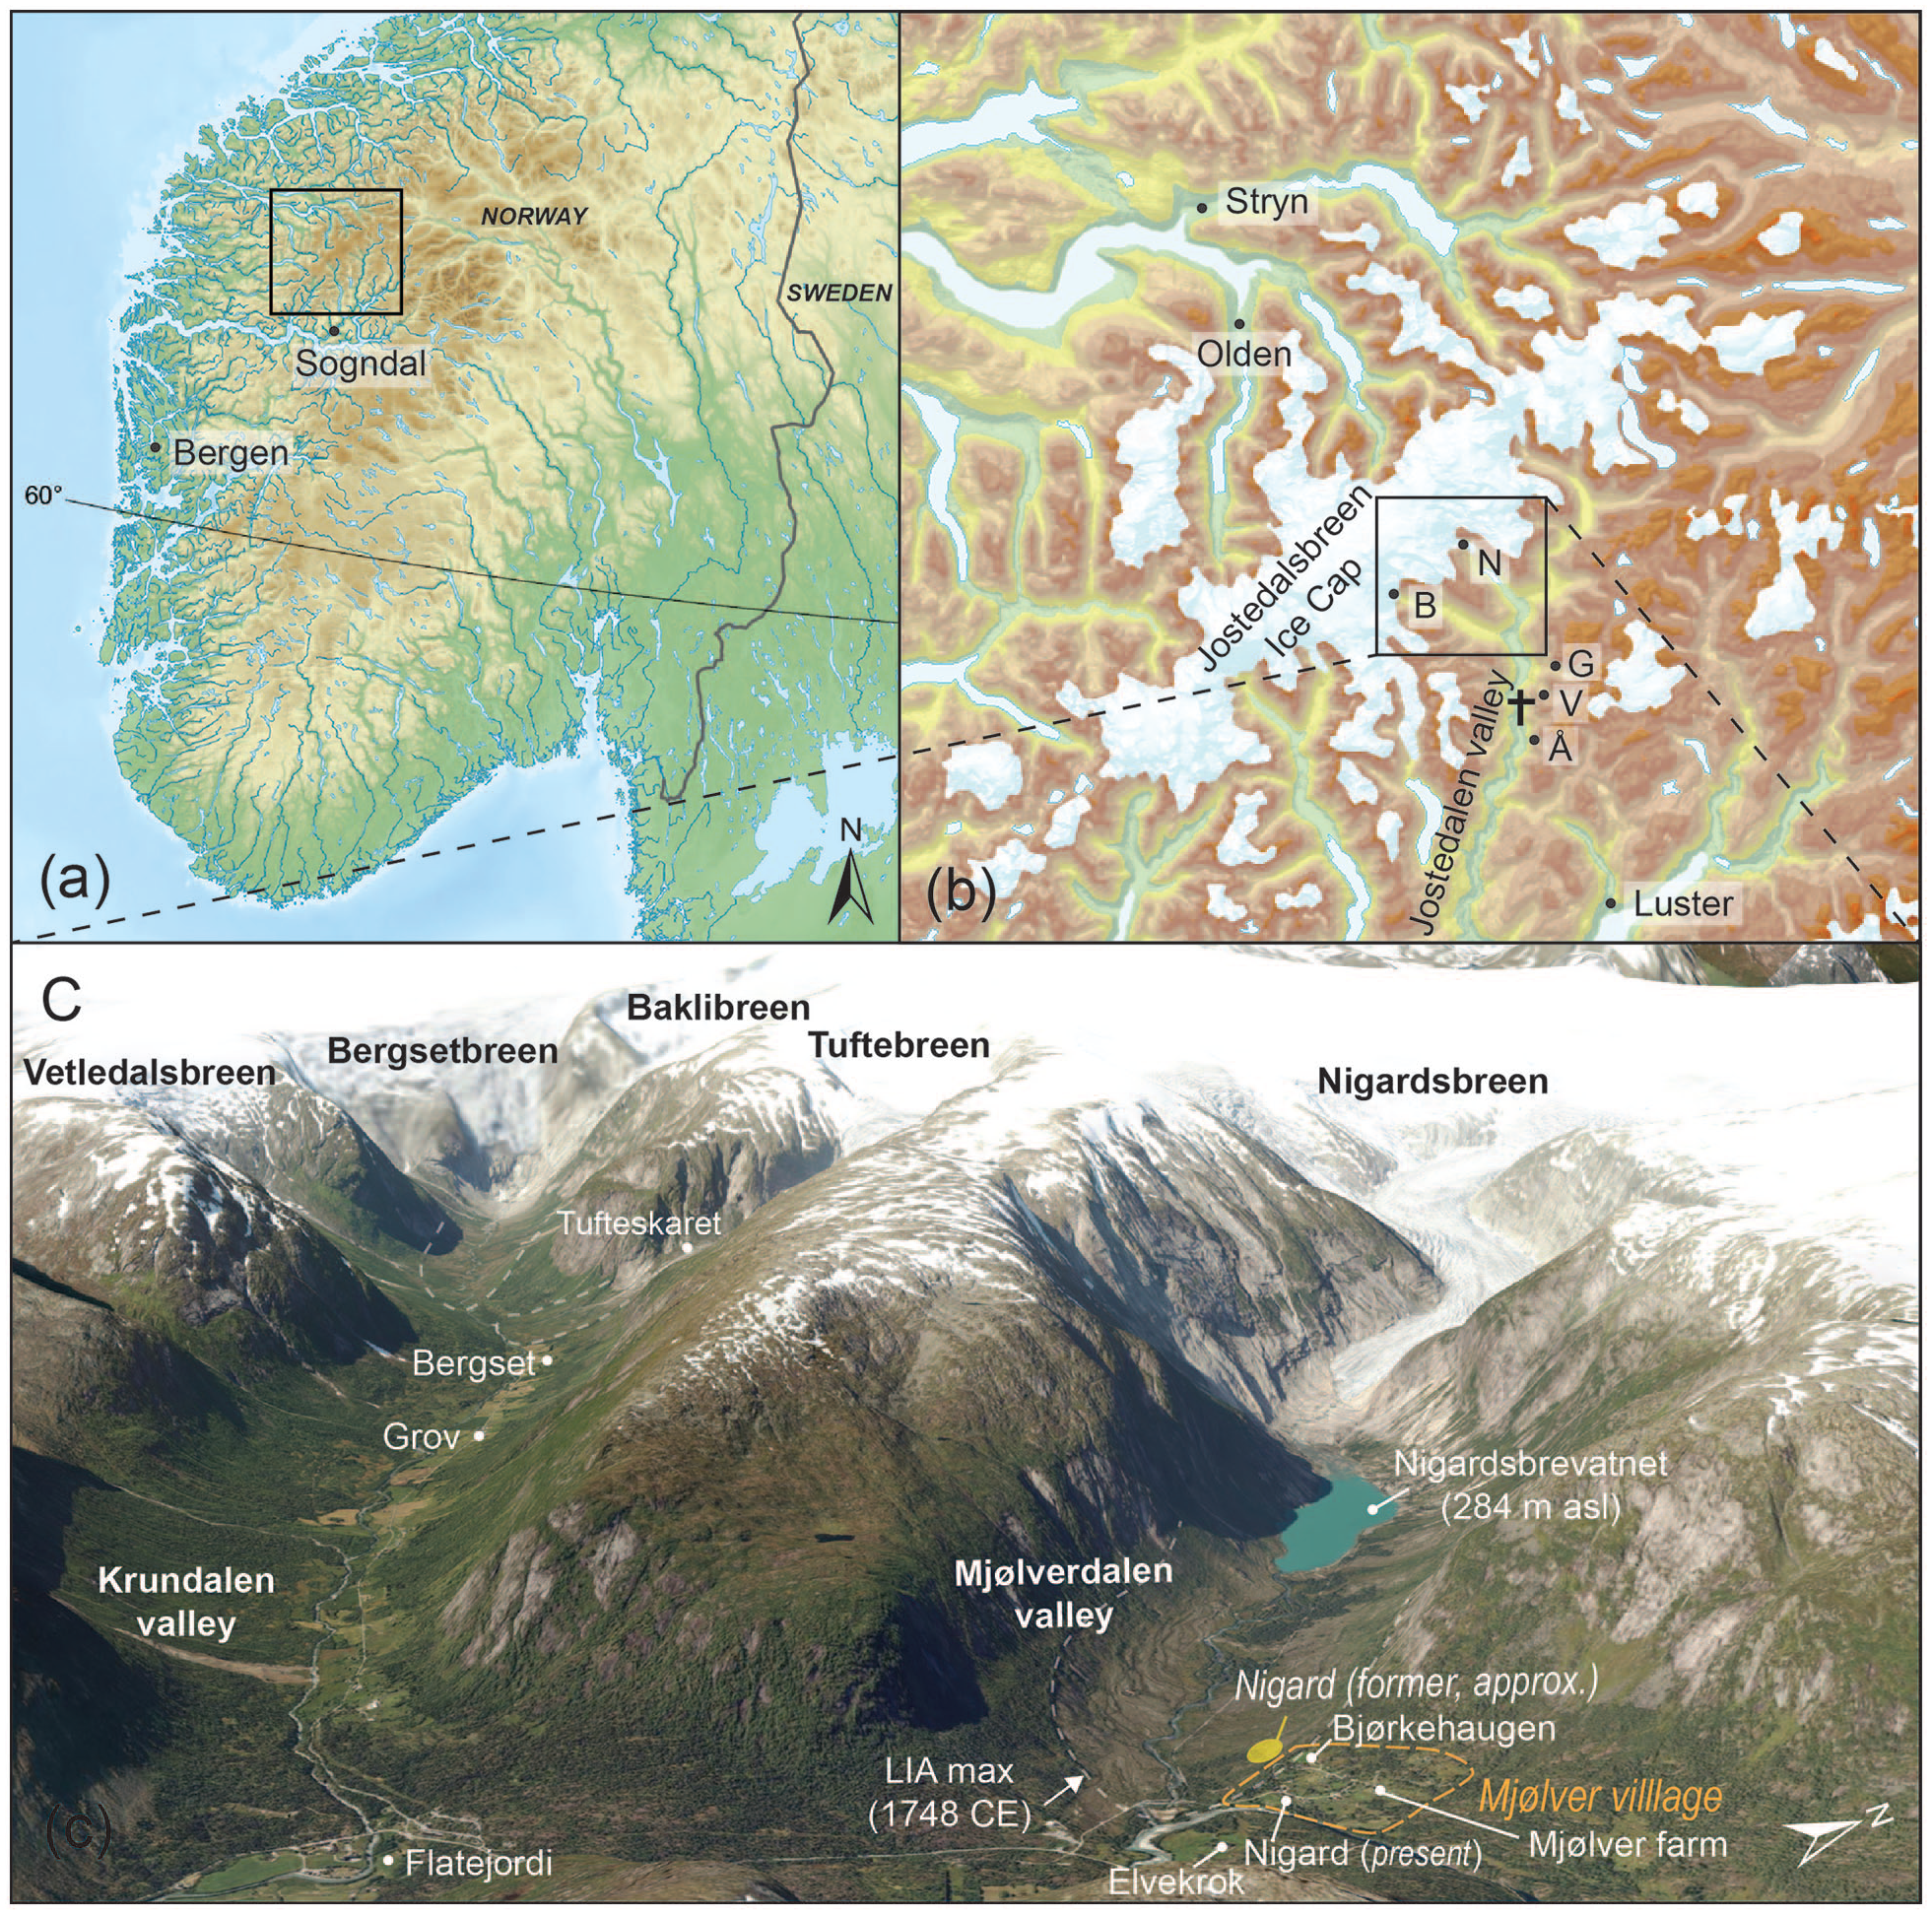
(a) Map of southern Norway and location of Jostedalsbreen ice cap; (b) Overview of the Jostedalsbreen region. N = Nigardsbreen; B = Bergsetbreen; G = Geisdalen; V = Vanndalen; Å = Åsen. A black cross marks the location of Jostedal Church and Parsonage; (c) Aerial oblique orthophoto of the two valleys Krundalen and Mjølverdalen and their respective glacier outlets, with selected place names mentioned in the text. The LIA max. extent of Nigardsbreen, Tuftebreen, and Bergsetbreen are illustrated with grey dotted lines. The LIA max. end moraine of Nigardsbreen (indicated with a white arrow) lies at c. 250 m asl. Aerial orthophoto dated 26 August 2017 adapted from www.norgeibilder.no/Norwegian Mapping Authority (Kartverket).
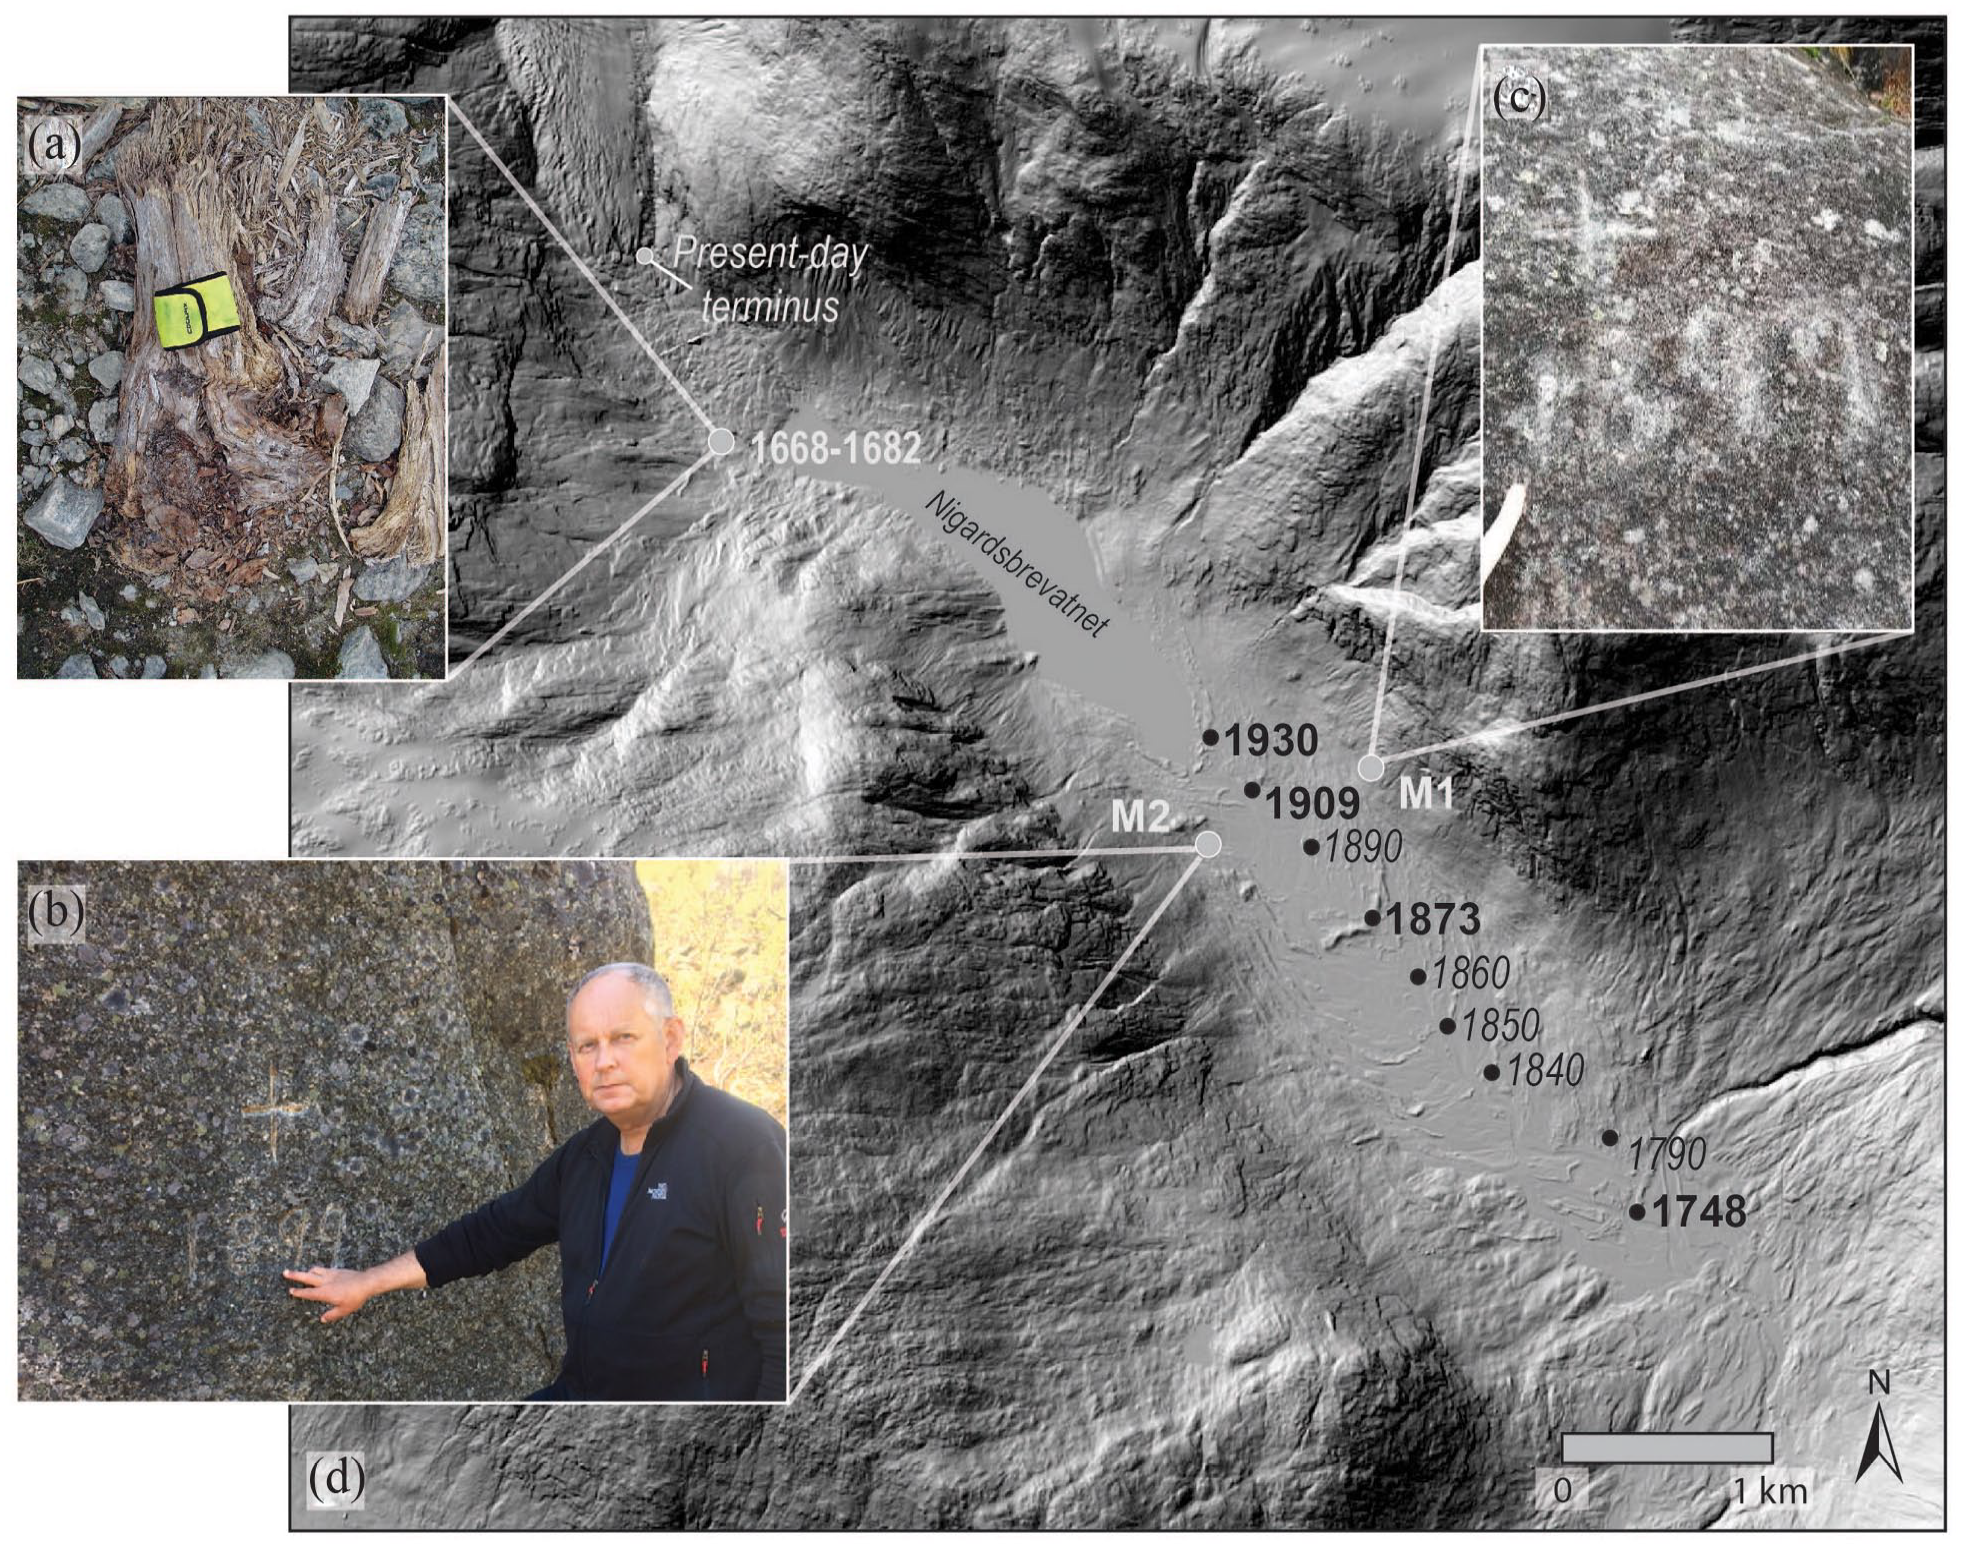
(a) In situ pine stump overrun by the advancing Nigardsbreen glacier c. 1675 CE (Nesje et al., 2008) (note: location shown in (d) is approximate from finder as coordinates were not noted during the discovery). Photo: Frank O. Smedegård. (b) A. Nesje pointing to the reference mark ‘M2’. Note that the position of the reference point was located 113 m from the contemporaneous glacier front. Photo: Svein O. Dahl. (c) Reference mark ‘M1’. Photo: Marthe Gjerde. (d) Digital elevation model of Nigardsbreen foreland (DEM data: the Norwegian Mapping Authority) highlighting prominent terminal moraines and associated ages. The four moraine ages typed in bold (1748; 1873; 1909 and 1930 CE) are historically verified, whereas the ages in narrow italics are lichenometrically dated (Andersen and Sollid, 1971) and shown here for illustrative purposes only.
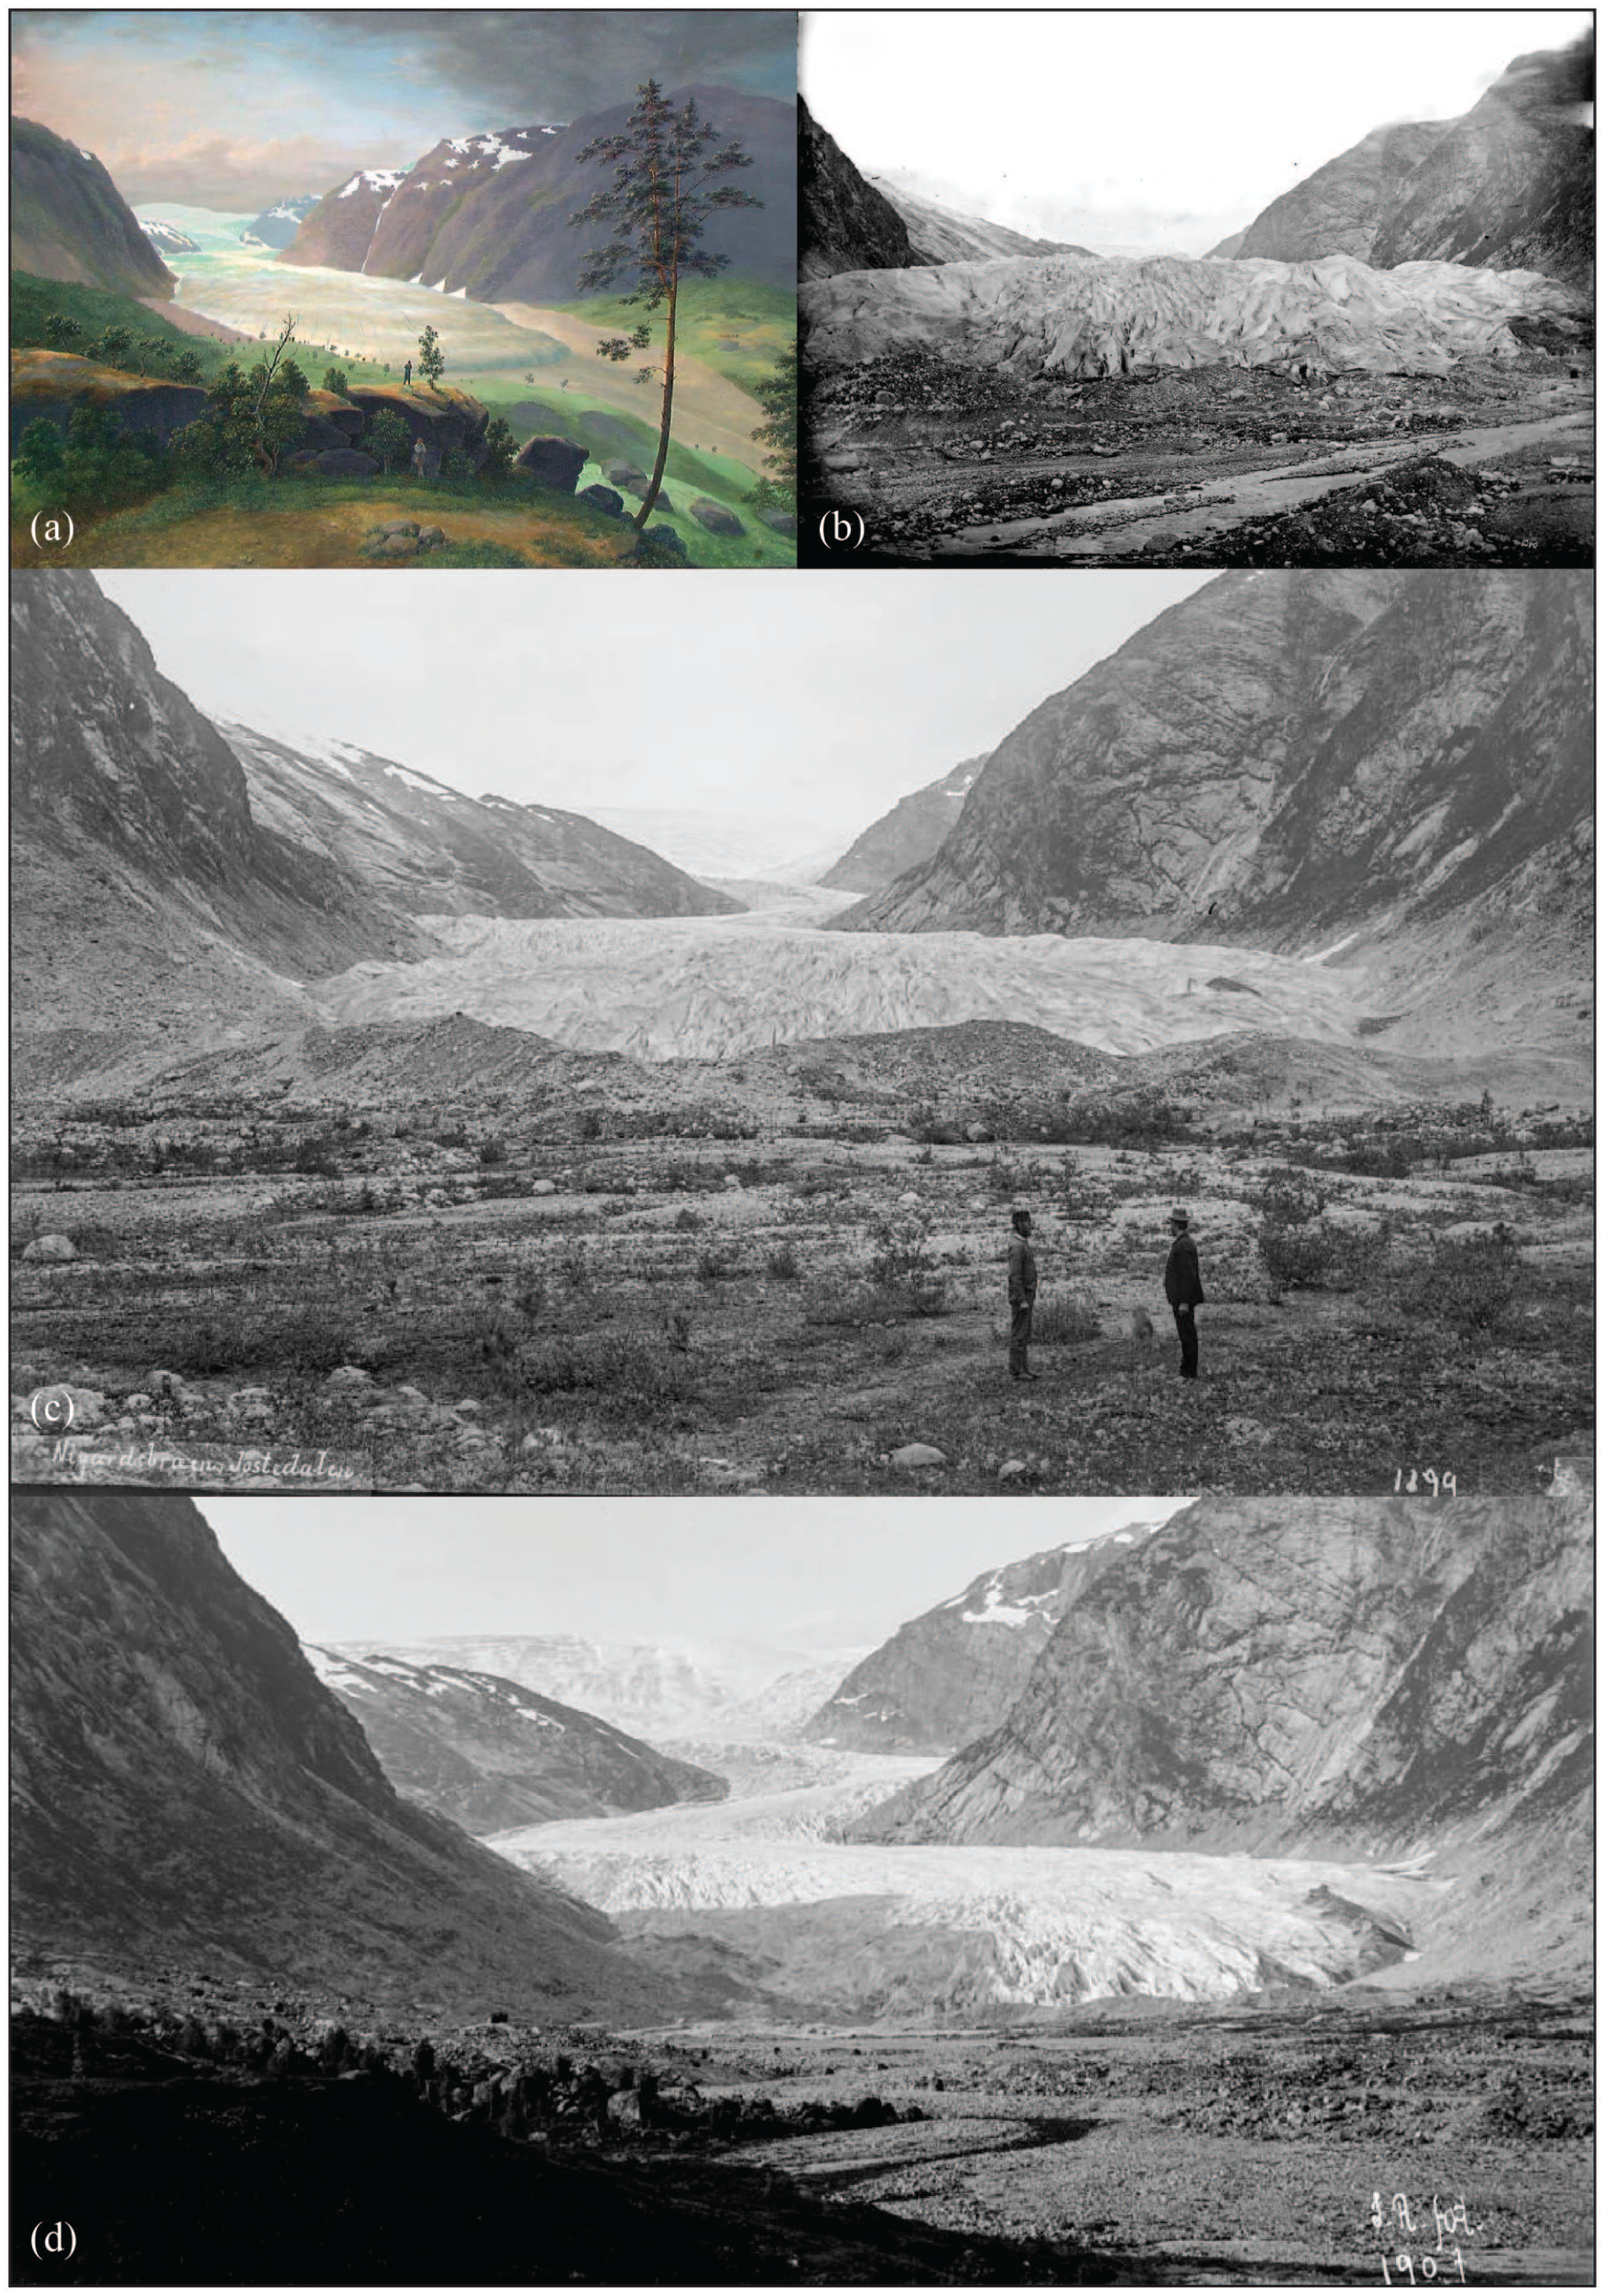
Contemporary portraits of Nigardsbreen. (a) Drawing by Johannes Flintoe dated 1822 (sketch)/1834 (‘Nigardsbreen’; The National Museum Oslo, Inventory no.: NG.M.04327); (b) Photo dated 1874 by Knud Knudsen. Note the 1873 CE moraine ‘in the making’. This terminal moraine formed after an advance that was initiated around 1868 (Rekstad, 1902). (c) Photo from 1899 by John B. Rekstad. (d) Photo from 1907 by John B. Rekstad. Photos (b–d) available online at The University Library of Bergen’s special collections.
Current scientific consensus assigns an ‘initiation date’ of the LIA advance of Nigardsbreen around 1700–1710 CE, with the glacier extent at a minimum c. 1700 CE, as proposed first by Rekstad (1900). Rekstad, in turn, erroneously cited the written depictions of contemporary vicar in Jostedalen between 1725 and 1731 CE, Hans Wiingaard (Wiingaard in: Strøm, 1762), and is referred to in later publications (e.g. Østrem et al., 1976). Furthermore, ensuing Rekstad (1900), 1710 CE has served as the initiation date of a rapid LIA advance of Nigardsbreen (e.g. Østrem et al., 1976).
After 1710 CE, Nigardsbreen advanced to the point that it started destroying farmlands down-valley c. 1735 CE (Nesje et al., 2008; Nussbaumer et al., 2011; Østrem et al., 1976). As the glacier reportedly advanced 2800 m between 1710-1735 CE (Østrem et al., 1976), this gives a rapid mean annual advance rate of ~110 m for this period in time (Nesje and Dahl, 2003; Nesje et al., 2008). The ice expanded further, engulfing even more cultivated land en route, and eventually destroyed the farm Nigard c. 1743 CE (Foss, 1750), after which the glacier was subsequently named. Worth noting, is that the Nigard farm referred to in Foss (1750) is not the same as in present-day Mjølver village (Figure 1c) as the resettlement of the farm took place beyond the LIA maximum moraine, likely as a precautionary measure. The exact location of the former Nigard farm is not possible to determine based on present-day knowledge, but we indicate a best-guess estimate (yellow ellipsis) in Figure 1c.
Because of the amount of grazing- and arable land lost to the advancing ice, local farmers appealed to the King for tax reductions. The King, in turn, sent officials to Jostedalen 20–23 August 1742 (Bohr, 1820; Hoel, 2013) to gain a first-hand impression of the local conditions. The inspections resulted in an emergency aid coordinated by the regional governor in Bergen (Figure 1), and 200 barrels of cereal grains and some cash were sent in spring 1743 for distribution among the villagers, the vicar, and the sexton in the valley (Hoel, 2013). The reports from these officials visiting in 1742 have hitherto formed the basis for much of the knowledge we have on the Nigardsbreen LIA advance (Bohr, 1820; Document, 1742; Hoel, 2013; Østrem et al., 1976). An additional important time marker, however, is the exact quantification of the Little Ice Age advance culminating in the year 1748 CE as provided by the detailed written depictions of concurrent vicar Matthias Foss (Foss, 1750).
Adding to the comprehensive number of studies already existing on Nigardsbreen during the LIA, our study aims to contribute by applying a novel dataset of local tax lists providing new insight on the local initiation dynamics and timing of the LIA advance of Nigardsbreen. Furthermore, a thorough revision and assessment of previously applied historical data and the source credibility is performed. Our cross-disciplinary approach results in a new and revised glacier curve for the most documented and frequently cited Norwegian valley outlet glacier.
Study area
Nigardsbreen (61°42ʹN, 7°08ʹE) covers an area of 41.7 km2 (Andreassen, 2022) and flows south-east from central parts of Jostedalsbreen towards the valley bottom of Mjølverdalen (‘dalen’ = valley) (Figure 1). Accounting for c. 10% of the total area of Jostedalsbreen, Nigardsbreen extends from 1954 m asl down to 381 m asl (Andreassen, 2022). Mass-balance measurements have been performed since 1962 CE, and front position investigations have almost continuously been measured by (mainly) the Norwegian Water Resources and Energy Directorate (NVE) since 1899 CE (data freely available at: http://glacier.nve.no/glacier/viewer/ci/en/). Since the LIA maximum 1748 CE the glacier front has retreated ~5 km, with more than 2 km of this distance covered by Lake Nigardsbrevatnet (‘vatnet’ = lake; hereafter Nigardsbrevatnet) (Figure 1). Nigardsbreen experienced a relatively rapid retreat ever since 1748 CE, with small climatic perturbations reflected in glacier growth and front position advance during the late 1920s as well as a significant advance from 1989 to 2003 CE, after which there has been a continuous retreat.
Climate data from the meteorological station Mjølversgrendi (305 m asl) at approximately 5 km from the present terminus of Nigardsbreen (station no. SN55430, Bjørkehaugen, Figure 1c), show that the mean annual temperature in Mjølverdalen is about 3.8°C and mean annual precipitation centres ~1380 mm (data: Norsk-Klimaservicesenter, 2023). The bedrock consists of Neoproterozoic quartz monzonite in the western part of the valley, whereas the eastern part consists of Paleoproterozoic granitic orthogneisses (Lutro and Tveten, 1996). The massive, hard bedrock results in an absence of potential debris sources (large colluvium deposits etc.), facilitating the evolution of typical glacially shaped valleys that are common around the Jostedalsbreen region (Winkler, 2021), as exemplified by both Mjølverdalen and adjacent Krundalen (Figure 1).
Methods
Multiple historical sources referring to Nigardsbreen and the LIA advance/retreat have been explored in former studies. The best known is a document dated 1750 CE, in which the concurrent vicar in Jostedalen, Matthias Foss, wrote the chronicle ‘Justedalens kortelige Beskrivelse’ (a descriptive text of the Jostedalen valley, the glacier and its inhabitants) (Foss, 1750). The most comprehensive document from the on-the-spot investigations in Jostedalen, dated August 1742 (Document, 1742), is referred to in detail from the primary source by Gottfried Bohr (Bohr, 1820). These investigations were initiated as a direct consequence of the damage caused by the advancing outlets of Jostedalsbreen on bordering farmlands (Grove, 1988). Also referred to in previous studies is a witness statement from a local court hearing in 1684 (Document, 1684) with remarks on the advancing glaciers and their impact on farmlands first mentioned in Laberg (1944). Furthermore, another witness from 1735, Guttorm Johannesson, is previously referred to from a court inquiry on the levels of taxation of the Mjølver farm (note that Mjølver is both the name of an individual farm as well as a label for the entire village, cf. orange dotted outline in Figure 1c; and will be denoted accordingly in the text); which was first mentioned and published in Eide (1955). Also widely cited is a description by the contemporaneous vicar Hans Wiingaard, likely written in the 1750s and published in 1762 (Strøm, 1762). These five historical sources dated 1684 (Document, 1684); 1735 (Eide, 1955); 1742 (Bohr, 1820); 1750 (Foss, 1750); and the 1750s CE (Strøm, 1762) compose the main historical sources and basis for every later written document on the Nigardsbreen advance as they all present definite information on glacier advance(s) in Jostedalen (for an overview, see tables 6–8 in Nussbaumer et al., 2011).
In this study, three categories of historical documents are utilised:
(1) Contemporary depictions of the growth and position of the glacier terminus. Of particular importance is the document from the inspections in August 1742 (Bohr, 1820), describing in detail the position of the glacier front and the havoc originating from the advancing Nigardsbreen as well as the glaciers in neighbouring Krundalen valley. Included here are all documents presented in Nussbaumer et al. (2011), as well as a previously unexplored document from 1723 CE (Document, 1723).
(2) Contemporary notes on climatic conditions (e.g. temperature, precipitation, avalanches and crop failure), where glaciers are not directly referred to, but the notes shed light on ambient LIA climate in Jostedalen.
(3) Tax lists on the annual produce of local farms and the resulting taxation levels. These lists provide insight on contemporaneous changes in productivity of the farms directly affected by the cold conditions emanating from the approaching ice.
The two latter document types (2 and 3) have not been applied in previous studies, and thus present a novel approach for obtaining an age constraint on the initiation and dynamics of the LIA advance of Nigardsbreen.
Results
Historical data
(A) c. 1596–1670 CE: Poor living conditions
The oldest settlement in Jostedalen likely dates to 600–1000 CE when population growth and settlement expansion followed the start of the Viking Era. Areas marginally prone for cultivation and crop growth were settled at this time. The medieval society of Jostedalen disappeared at one point after the Black Death in 1349 CE, and the valley held no permanent settlement until the second half of the 1500s. Contemporary population growth and increased need of agricultural land led to a re-population of many formerly abandoned villages. In addition, tax deductions from the royal Head of State stimulated this process furthermore (Espe et al., 2002; Hoel, 2013; Øyane, 1994).
The oldest documentation of permanent settlement in Jostedalen after the Dark Ages is a tax list dated to c. 1596 CE (Johannessen, 2000: 161–162), revealing the tax load for the 25 farmers. As there were too few, and too poor, farmers to sustain the vicar, the bishop and the seignory of Bergen initiated support from other churches in the county to aid grain for the vicar in Jostedalen from the early 1600s. Several documents from this arrangement shed light on the ambient climatic conditions in Jostedalen. The vicar tax list from c. 1596 notes grain damage induced by frost (Johannessen, 2000). Deteriorating harvests are described in electoral rolls from 1616–17 and the two consecutive years (Tax, 1615–1618). Electoral rolls for 1620–21, 1626–27 and 1627–28 mention that most of the then 23 farmers in Jostedalen were poor without mentioning the cause (Tax, 1620). Increased tax claims throughout the 1620s and introduction of a new national tax in 1628–1629 resulted in tax payment issues, and 12 out of 25 farmers paid less tax than imposed that year (Tax, 1629a). In 1630, five of the farmers were unable to pay any taxes, but poverty and impoverishment were the only causes mentioned (Tax, 1629b). Two letters from 1636 on the hardship of the vicar in Jostedalen state that the entire village was embossed by hunger and poverty but does not explain why (Document, 1636a, 1636b). Assessing the information from written sources between c. 1596–1636 that touch mostly upon hunger, poverty, and impoverishment, there are examples of climatic conditions being referred to, but the glaciers are not directly commented on.
From 1655 and the 1660s, there are several documents concerning the vicar’s living conditions that further give insight into contemporary climate. In a complaint dated 1655 CE, the farmers in Jostedalen advocate for their vicar (Document, 1655), and this is the first known document referring to large amounts of winter precipitation. Between 1664–67 there are three written complaints by parish priest Tøger Jenssen (Document, 1664a, 1664b, 1667). In the first document, he complains of crops freezing, and in the second document dated the same year, he adds that the prolonged snow cover and cold weather causes hunger and poverty. The letter from 1667 is mostly expressed in a similar matter. Common for all three documents is that they point to frost as the main problem for crops. Long winters are also noted, and in the 1650s and 60s the documents start mentioning large amounts of snowfall. The glaciers, however, are not referred to. If the glaciers at this time had started creating difficulties for agriculture, it would likely have been mentioned as these letters and documents are otherwise quite straightforward when it comes to complaining about difficult conditions for farming. Later, in the 1740s (see below), the advancing glaciers were an efficient argument regarding tax levels.
(B) c. 1680–1740: Documented avalanches and advancing glaciers
Until 1680 CE, frost is acknowledged as the main problem, with snow as an additional issue. Since the 1680s, however, several documents shed light on the consequences of the deteriorating climate. A new church building was completed in 1660 CE, but only 20 years later the church was damaged by the first historically documented avalanche in Jostedalen (Document, 1681; Øvregard et al., 2010). The church records date back to 1631 CE, so it is unlikely that something similar had happened the previous 50 years. At the same time, the glaciers in Krundalen advanced to such a degree that farmers in Grov and Bergset (Figure 1) were affected, an issue the proprietor Birgitte Munthe had brought up on behalf of Jostedalen and Luster at the local court in November 1684 (Document, 1684). There she stated that one farmer, Knut Grov, had lost his highland pastures to the glacier. Likewise, the mountain farm area in Bergsetdalen valley was ruined, probably by both Vetledalsbreen in the southern part and by Bergsetbreen in the central part of the valley (Figure 1). This document is well-known from LIA literature (Eide, 1955; Grove, 2004; Grove and Battagel, 1983; Laberg, 1944), and is acknowledged as the earliest reliable evidence of direct damage of productive agricultural area (likely damaging grazing- and hayfields) in Scandinavia (Grove, 2004). After the arraignment at the local court, the Grov and Bergset farmers were designated summer pastures in the more distant valleys Geisdalen and Vanndalen on the eastern side of Jostedalen (Figure 1).
Formerly overlooked in the abovementioned document from 1684, are notes from the proprietor’s son, Ludvig Munthe, on flood damage at both Sperla (south of the parsonage) and Flatejordi (at the mouth of Krundalen; Figure 1), a natural hazard which could indicate large amounts of snow available for melting. Munthe did not, however, mention that the farms belonging to the Munthe family in the Mjølver village were inflicted damage by Nigardsbreen. This does not mean that farms in Mjølver village were not affected negatively by Nigardsbreen, but it would have been reasonable to discuss during the ongoing court hearing on three other farms affected by natural hazards. The next time the Munthe family made a statement on natural hazards impacting farms in Jostedalen, in 1742 CE, they mentioned both floods in Ormberg (further south of the parsonage) and Elvekrok as well as rock falls in Åsen (Figure 1) and glacier-induced damage at the villages of Bergset and Mjølver.
In 1742, the two farmers Ole Grov and Ole Bjørk (64 and c. 70 years old, respectively) stated in an inquiry that in their youth the terminus of Tuftebreen (Figure 1) could only be seen high up in the narrowest neck of Tufteskaret (the scar where it is enclosed today), and thereafter continuously advanced (e.g. Laberg, 1944). Based on their age, it might be deduced that their memory stretches back to roughly 1680–90 CE (Document, 1742). The advance of Tuftebreen from the scar towards the valley bottom of Bergsetdalen therefore started sometime after the 1680s, yet, earlier than 1742 as the ageing farmers could recall this as a memory from their younger years. An acceleration had occurred as an advance of 190 m (100 fathoms) during the last decade was reported by farmer Rasmus Kronen (Document, 1742).
During the inspections at Bergset in 1742, it was noted an avalanche that was the second to pass in ‘18 or 20 years’ time that had demolished all farm buildings in its way (Document, 1742). Therefore, a first avalanche must likely have occurred during the first part of the 1720s as yet another event confirming large amounts of snowfall at this time. In the oldest church records in Jostedalen from 1733–51, the vicar noted a lack of church attendance on several occations due to weather conditions. Large amounts of snow are specifically mentioned in this matter during January and March 1737, January, February and March 1743, December 1744, December 1748 and February 1749 (Document, 1733–1751). The large snowfall during winter 1743 is also mentioned in the vicar Matthias Foss’ desperate letter to the diocesan clerk in Bergen, describing scarcity of food, starvation, and avalanches threatening the clergy house (Document, 1743b). Notably, several winters between 1733 and 1751 CE are poorly documented in the church records due to an occasional absence of vicars and substitutes, and notes on bad weather were only reported when conditions were so bad that the parish did not attend religious services. As such, there is from a large degree of confidence understated reports regarding extreme conditions during several winters for this period.
(C) 1611–1838: Tax lists
Tax records have previously been applied in studies on the LIA advancement of Norwegian glaciers (e.g. Grove and Battagel, 1983). Their investigations of tax records from neighbouring regions and the small towns of Stryn and Olden (Figure 1) probed mainly two records; the cadastres of 1667 and 1723 CE, and further analysed the reduction in numbers of cattle in individual parishes. The reduction was notably larger in the villages situated close to Jostedalsbreen than the more distal areas. In Olden, the amount of cattle was reduced by as much as 39% (Grove and Battagel, 1983) owing to the worsened living conditions.
The same methodology may be applied for investigations on individual farms within an area, and in the analyses of Jostedalen in this study we extend the source database to several tax registers over a longer period. Rather than cattle numbers, the specific tax rate is applied, converted to smørskyld. Smørskyld translates to land lease fee converted to butter (‘smør’ = butter). In valleys where dairy cattle were important the tenants paid their land lease fee in butter they produced as a taxable value (‘laupar smør’). One (1) ‘laup’ of butter was equal to about 18 kg (Grove and Battagel, 1983).
From the early 1600s, Jostedalen accounted as its own tax district. Tax lists were of two main categories. The first category was lists of tax rates, that is, what the farmers were required to pay (cadastres). The other category, and by far the most common, are accounting lists of what they actually paid. The oldest tax list from Jostedalen is the vicar’s tax list from c. 1596 CE (Johannessen, 2000), and there is further a cadastre from 1600 and a tax list from 1603. From 1611 CE there are yearly lists, and often several types of lists from each year. In general, the tax load increased over time, especially during periods of war when the state experienced increased financial needs. Surely, there could be several reasons why farmers were not able to pay taxes in one or several years; there could have been poor harvests or other natural perils, as well as health issues, alcohol/substance abuse, or family and social conditions leading to inability to pay taxes. The causes given are rarely others than the farmers being poor. As aggregate data, the tax lists still yield relevant and relative information. Though it was the most affected area by the advancing Nigardsbreen in the 1700s, the Mjølver village (encompassing farms Nigard, Bjørkehaugen and Mjølver; Figure 1), was ranked as one of the best farming areas in Jostedalen in the early 1600s – sustaining 3–4 farming families and taxpaying farmers. Mjølverdalen likely constituted an important resource area for the farms in the village of Mjølver, available for both grazing, collecting fodder, mountain farming, etc. It is therefore likely that the emerging of Nigardsbreen and the resulting destruction of this potential resource area would economically impact Mjølver village a long time before the glacier itself ploughed into cultivated land and farmhouses.
The tax lists explored here allow for a comparison of the time-transgressive trend in relative tax load between the farms in Mjølver village compared with the total tax load of all other farms in the northern part of Jostedalen as components of the entire valley tax load (Table 1 and Figure 4). The northern part of Jostedalen is here defined as the farms north of the church and parsonage (Figure 1c), including the tributary Krundalen valley, which is where the local community was probably most affected by the advancing glaciers. Establishing intervals between where tax rate adjustments were made, that is, where a change in tax load is detected, our selection of tax lists shows that all but one exception (Tax, 1627–1628) has chosen cadastres to notify tax rates, and not what was actually paid. Hence, it must be stressed that the tax lists roughly indicate the production capacity of the farms and do not include how much was actually produced or the income of individual farmers. Also, a long period of time could pass since the production capacity changed until the tax rates were adjusted up or down. The source material is nevertheless adequate for assessing the major trends (Figure 4), which reveals a large decrease in relative tax load from the Mjølver village component (dark grey bars) until 1742 CE; contrary to the relatively constant trend found for other farms in northern Jostedalen over the same period (light grey bars).
Tax records 1611–1838 CE.
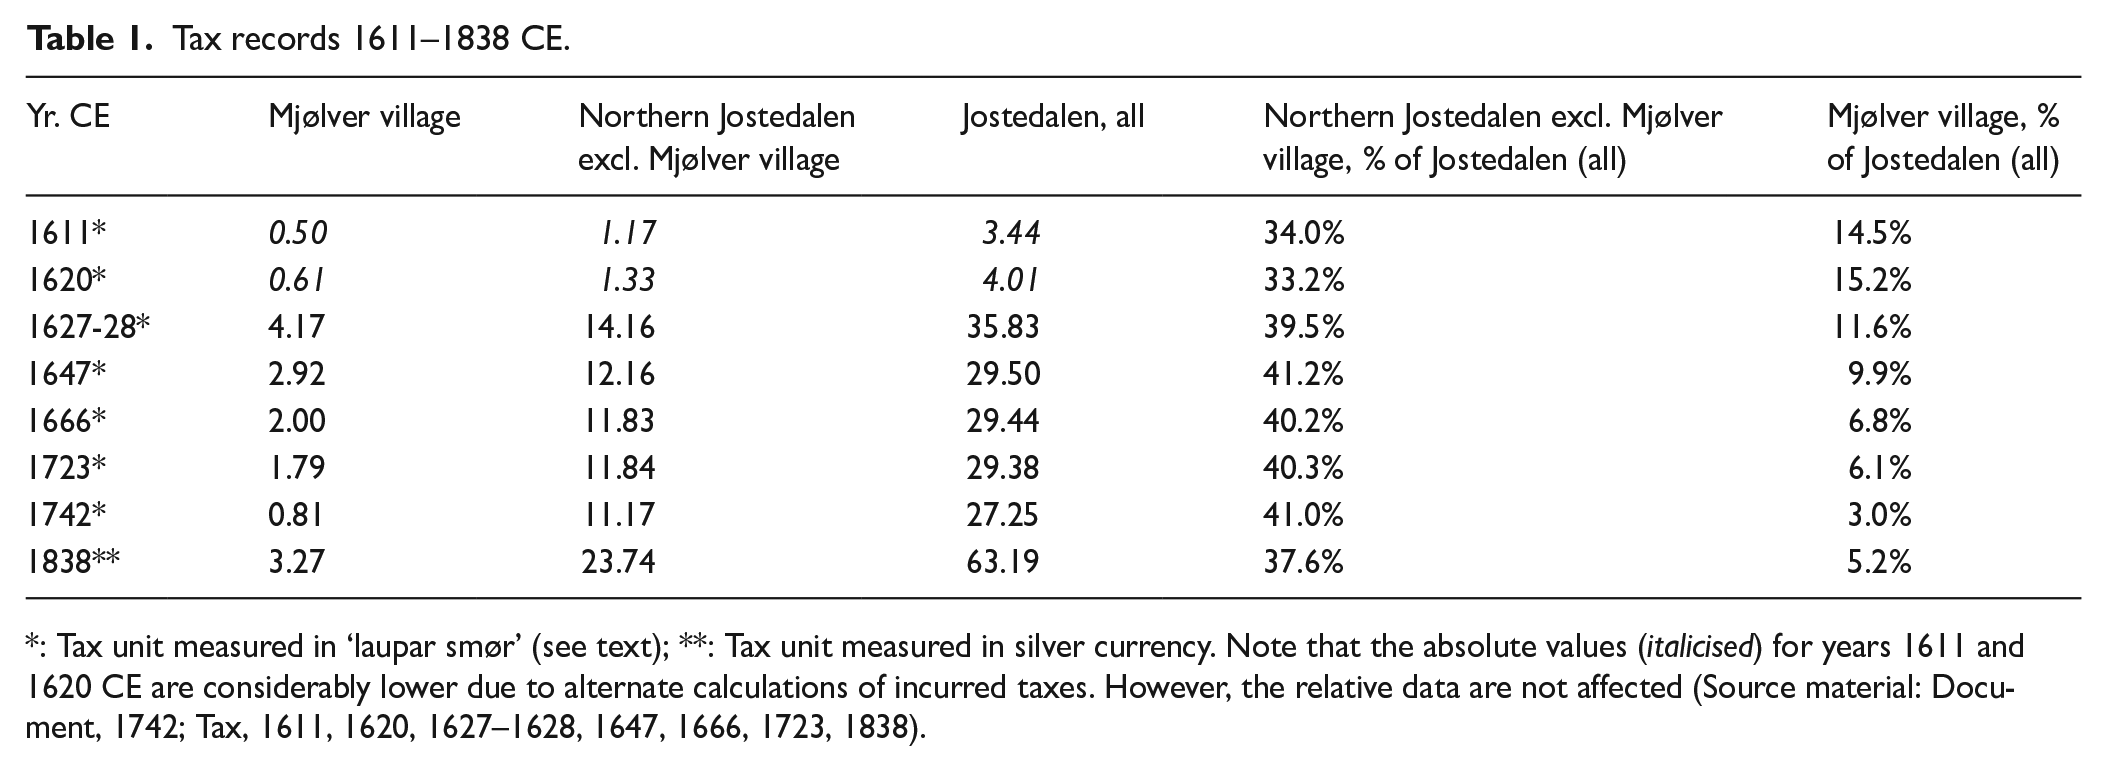
: Tax unit measured in ‘laupar smør’ (see text); **: Tax unit measured in silver currency. Note that the absolute values (italicised) for years 1611 and 1620 CE are considerably lower due to alternate calculations of incurred taxes. However, the relative data are not affected (Source material: Document, 1742; Tax, 1611, 1620, 1627–1628, 1647, 1666, 1723, 1838).
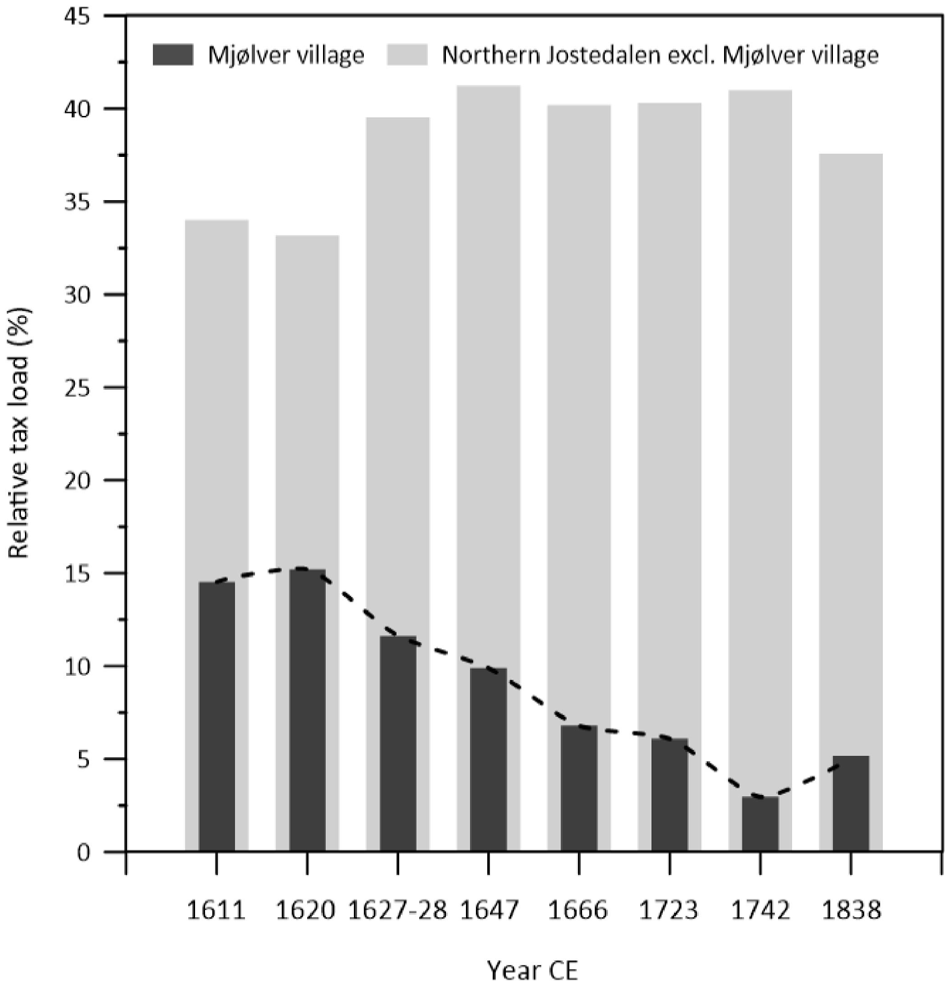
The relative tax load of two regions as percentage of the total tax load of the entire Jostedalen valley. Note the non-linear timeline of the x-axis (cf. text).
The northern part of Jostedalen excluding Mjølver village held a relatively constant part of the total tax load of Jostedalen at about 40% from the 1620s until the 1800s. The Mjølver village component on the other hand, decreased from constituting c. 15% of the tax income from Jostedalen in the early 1600s down to c. 6% in the cadastres of 1666 and 1723 (Table 1). The sharp decline in 1742 (Figure 4) is a result of the heavily impaired tax that particular year.
The absolute tax load numbers calculated to amounts of produced butter show that a relatively large drop in the Mjølver village component from 4.17 ‘laupar’ butter to 0.81 ‘laupar’ in 1742 CE did not originate from an increase in other parts of Jostedalen. On the contrary, the total tax load of Jostedalen as a whole remained stable around 30 ‘laupar’ (c. 540 kg) butter between 1647–1723 CE. Mjølver village, however, shows a continuous decrease from 1627–28 to 1742. This decline in tax load indicates that the production capacity of the farms in Mjølver village underwent considerable deterioration throughout much of the 1600s, not only during the few years before Nigardsbreen reached its maximum extent in the 1740s. Based on the tax lists examined above we infer that the climatic conditions must have led to far more negative consequences in Mjølver village than the rest of Jostedalen before any reports of glaciers causing havoc. It is hard to explain by any other factor than an initiation of a glacier advance of Nigardsbreen, disputing the rejection of any glacier advance prior to the 1700s by Rekstad (1900), who also analysed farm productivity. Worth noting, is that Rekstad based his assumptions on farm productivity numbers for the entire Jostedalen valley rather than the highly local tax load variations presented here (Table 1).
(D) c. 1700–1740s: Advance towards LIA maximum
Based mainly on the notes of the vicar in Jostedalen between 1725–1731 CE, Hans Wiingaard, current consensus affirms an initiation of the LIA advance of Nigardsbreen to c. 1710 CE (Grove, 2004; Hoel and Werenskiold, 1962; Nussbaumer et al., 2011; Rekstad, 1900, 1902; Østrem et al., 1976). Wiingard was still the owner of Jostedal Church from 1726 to 1751, so he held a connection to the village 20 years following his departure (Document, 1833). He wrote a description of the glacier advance which was included in a publication by Strøm (1762). Date of origin of Wiingards written description is unknown, though it must have preceeded his death in 1758 and likely after 1750. Wiingard writes that the glacier periodically varies in extent, and that at a given point, the glacier would advance in the enclosing valley in a 30–60 year period before subsequently retreating over a longer period. In areas where the glacier has retreated, Wiingaard notes that it leaves lands barren where grasses supposedly will never grow again, which was the case in Krundalen. Also affected by the glacier advances was Mjølverdalen, where the glacier over a period of 30 years advanced to the point that a farm, Nigard, was demolished and became abandoned. Wiingaard writes (in Dano-Norwegian): The glacier’s “. . .Beskaffenhed er meget foranderlig; thi undertiden gaaer den frem i de Dale, den grændser til, i 30 til 60 Aar, undertiden trækker den sig tilbage igien en Tid lang.” Where the glacier retreats, “efterlader den steriles areas, hvor siden aldrig voxer Græs”. “i en anden Dal, kaldet Mielvedal, hvor den i en Tid af 30 Aar har gaaet saa vidt frem, at den har borttaget Grunden, som tilhørede en Gaard, kaldet Nyegaard, hvorfor og samme Gaard for nogle Aar siden er bleven øde.” (Strøm, 1762).
The particular phrase on the 30-year duration of glacier advance at Nigardsbreen is the keystone upon which the inititation of the Nigardsbreen 1710 CE advance is built upon, and was first established by Rekstad (1900). It presumes both that Wiingaard wrote his description around 1740 CE, as well as a very literal interpretation of ‘30 years’ as a time estimate. However, since Wiingaard has included both the destruction of the Nigard farm (occurring c. 1742–1743), as well as assessing a retreat of the glaciers in Krundalen but not of Nigardsbreen (reaching its maximum in 1748 CE), this corroborates the theory that the description was not written down until at least 1750 CE. The statement ‘30 years’ must also be acknowledged as a very rough and imprecise note of information, much like the saying ‘the memory of a man’, and be placed in context with the common contemporary idea that glaciers were regularly paced with a 30–60 years advance cycle before retreat. Thus, there is no clear evidence that 1710 CE is in fact the ‘LIA minimum’ of Nigardsbreen or an ‘initiation date’ of the LIA at Nigardsbreen. Nor can any geographical information on the location of the terminus be accurately derived. On the other hand, it may be deduced from Wiingaard that the glaciers did not continuously advance towards their maximum extent, but rather experienced short-term still-stands, or even phases of retreat, before reaching the LIA maximum extent.
Wiingaard further refers to a tale amongst farmers in Jostedalen that at one point there were 14 ‘røgstuer’ (i.e. a type of traditional farm house with no chimneys for ventilation) in Mjølverdalen. He attests this from a note on traces of a formerly existing road upvalley stretching towards the glacier that had indubitably been used by farmers in the past. The advance of Nigardsbreen must therefore have been occurring for such a long time that hearsay on the havoc and destructions of the farms in front of Nigardsbreen became well-established.
Still, several sources are unequivocally clear on the dramatic and rapid advance taking place during the last decades before the LIA maximum. The oldest source commenting on destruction of agricultural productive lands by Nigardsbreen dates back to 1723 CE, where it states that the Nigard farm (i.e. the former Nigard farm; Figure 1) was for all practical purposes destroyed (Document, 1723). Further, taxes were deducted by 12 marks due to direct glacier impact and resulting crop failures already in 1723 CE. This information is thus far not known from scientific literature, but from the cadastre protocols on the tax deduction (Dano-Norwegian): “Denne gaard ligger under Sneebreen eller Jisfieldet, som er u-foranderlig alle aaringer, udj henseende till dend Ruin, som dend Skade gaarden derved tilføyes, Eftersom samme Jisfield aarligen forøges frem Voxer og fremskyder sig alt dybere og dybere ofver gaardens tilliggende marcher, og kand formedelst kulden udaf samme Jisfield, ingen sæd voxe, huorfore dend aftoeges — 12 mark.” (Document, 1723).
The next known document noting on a glacier advance is from a court witness in November 1735 (Eide, 1955; Nussbaumer et al., 2011). During the 12 years that had passed since 1723 CE, the Nigard farm, belonging to Guttorm Johannesson, was inflicted ‘unspeakable’ damage by the infamous glacier. The glacier had expanded to such a degree that it had overrun and engulfed most of the cultivated fields, as well as blocking corn growth (Eide, 1955; Grove, 1988). Farmer Johannesson was unable to pay land lease fee and was effectively forced to beg for food and seeds. On future prospects it was stated that if the glacier would continue its growth at the same rate as the past few years, it would only be ‘a stone’s throw’ away from the farm houses, and the farm would be eraticated in a few years time. A stone’s throw is a very rough estimate of extent, but assuming there is a certain overstatement here, it might be deduced that the glacier must have been 50–100 m in distance of the farm houses.
The most comprehensive presentation of the Nigardsbreen advance is presented in court descriptions following the inspections of 21–23 August 1742 (Document, 1742). This is also the most widely acknowledged and cited source, as mentioned by both Foss (1750) and by Smith (1817). Gottfried Bohr became the first to read and cite the court records in 1819 (Bohr, 1820). According to the records the glacier was situated 20 alen (old unit of length) from the empty or abandoned farm houses that had been left 4 years earlier. Thus, Nigard was vacated in 1738 CE, or 3 years after Guttorm Johannessons testimony in court on the poor conditions in autumn 1735 CE (Eide, 1955). One ‘alen’ equals 62.8 cm in 1742 CE, and therefore the glacier was situated only 12–13 m from the buildings. The level of detail is probably correct in this case, as they used measuring tape during the inspections (Document, 1742). Further, from both recollections of the men present at the inspection in addition to observed conditions at the site the records suggest that cultivated fields and grazing lands were engulfed by the advancing ice over ‘a quarter mile’. One mile equalled 18,000 alen, that is, 11.3 km. Hence, a quarter mile would equal 2825 m; roughly the distance from the glacier front to the present-day parking area which is centred next to lake Nigardsbrevatnet. This constitutes the primary argument stating that Nigardsbreen advanced more than 2800 m since c. 1710 CE in previous studies (e.g. Østrem et al., 1976). A quarter mile must be interpreted as a rough estimate on distance with large margins of error in a valley yet engulfed with glacier ice, and the exact date of ‘1710’ is, as indicated earlier, even more uncertain and mainly based on hearsay. Thus, there is no argument to designate the terminus of Nigardsbreen anywhere between the pine remains (c. 1668–1682 CE) (Figure 2) and 1735 CE, or to differentiate time periods between the age of the pine remains and the year 1735 CE with respect to difference in rates of glacier advancement.
Synthesising front variations of Nigardsbreen since 1710 CE, Østrem et al. (1976) argue that the glacier did not advance between 1735 and 1742 CE. However, this is likely as a result of citing Foss (1750), whom in turn misinformed on the distance between the glacier terminus and the Nigard farm houses in 1742. His statements are not in compliance with the documents dated 1735 and 1742 CE as the glacier was declared a ‘stone’s throw away’ from the farm houses in 1735 CE (Eide, 1955). Here, a stone’s throw is stipulated roughly to 50–100 m, whereas the distance was only 12–13 m in 1742 CE (Document, 1742), and, finally, in 1743, the houses were destroyed by the ice advance (Foss, 1750).
Foss took part, at least as a host for the visiting officials residing at the parsonage (Figure 1) during the inspections in August 1742. He, however, did not have access to the court records from the inspection while writing his publication as the information deviates too much from these records and is too imprecise. Foss claimed that the houses in Nigard in August 1742 were 100 alen from the glacier terminus, but the correct numbers from the inspections are 20 alen. He further stated that between August 1742 until August 1743 the glacier had advanced 100 alen destroying farm houses and wreaking havoc by effectively bulldozing its way through the courtyard, and the farmer himself had to abandon the farm in haste. Foss writes (in Dano-Norwegian): “. . . til aarsdagen derefter Aaret 1743 hafde Iisbræen ey allene skut sig frem de 100de Alne i Længden, foruden umaadelig i breeden, men end og borttaget Huusene, omkastet dem, veltet dem for sig med een umaadelig mængde af jord, gruus og store steene fra afgrunden og knuset dem ganske i smaa stykker, som endnu er tilsiune, og manden som besad jorden maatte med hast forlade gaard og grund. . .” (Foss, 1750).
That the farmer at Nigard had to abandon the farm hastily, however, is not in compliance with court records. During the on-the-spot investigations it was informed that the farmer had already moved out in 1738 CE, and that the farm houses were at that time, 1742, uninhabitated (Document, 1742). When Foss writes that the glacier advanced 100 alen (i.e. c. 63 m) between August 1742 to August 1743, this is also imprecise. The only credible information is the depiction of the glacier entering the courtyard of Nigard in 1742-1743, as there was only 12–13 m remaining between the farm houses and the glacier terminus in August 1742 (Document, 1742). According to Foss, Nigardsbreen was drawing closer to the farm of Bjørkehaugen (Figure 1) and had already laid the fields of the farm barren between 1742–43 so that only the houses remained, but were for all intents and purposes ‘inhabitable’ (Foss, 1750). The preceeding year, on the contrary, the court records (Document, 1742) state that a tenant farmer, Knut Mattisson, recided in Bjørkehaugen. Mattisson may, however, have moved in the consecutive year, or Foss may have remembered incorrectly.
More insight on the relative impact of the glacier on everyday life is found in a complaint dated 28 December 1742 (Document, 1743a; Hoel, 2013), in which nine farmers from the northern part of Jostedalen were pleading for tax excemption until harvests improved. Here, they stated that the glacier had advanced across the valley floors to such a degree that particularly the latter 6 years became extremely windy and cold as a direct consequence of the increasing glacier vicinity. Most of the agricultural lands in Jostedalen were supposedly affected, and harvests were poor (Document, 1743a). The exact age constraint of 6 years denoted here likely reflects that the crop failure, as a direct consequence of glacier advance, was likely most pronounced during the last 6 years that had passed since 1736 CE. It does not imply that the glacier advanced at a particularly rapid rate during this time. The four specific years and the source material assessed above dated 1723, 1735, 1742 and 1743 CE, reveal that over this 20-year period there most likely was a continuous glacier advance taking place and not a still-stand (cf., Foss, 1750; Østrem et al., 1976).
(E) 1748: LIA maximum and the following deglaciation
The most important piece of information derived from vicar Foss is that the glacier retreated since 1748 CE (Foss, 1750). This has been, and remains, the main documentation of Nigardsbreen reaching its LIA maximum extent in 1748 CE.
Leopold von Buch visited Jostedalen in 1806 CE and Christen Smith visited in 1812. However, their accounts add nothing of importance on the position of the terminus of Nigardsbreen at the time (Smith, 1817; von Buch, 1812). Gottfried Bohr, however, notes that 14 July 1818 the terminus of Nigardsbreen was located at a distance of 1726 ft (i.e. 545 m; Table 2), measured as a straight line from the centre of the ‘mighty’ end moraine in front of Elvekrok (Figure 1) representing the 1748 CE extent of the glacier (Bohr, 1820). The retreat between 1748 and 1818 was thus 545 m.
Frontal changes and cumulative frontal changes (m) of Nigardsbreen.
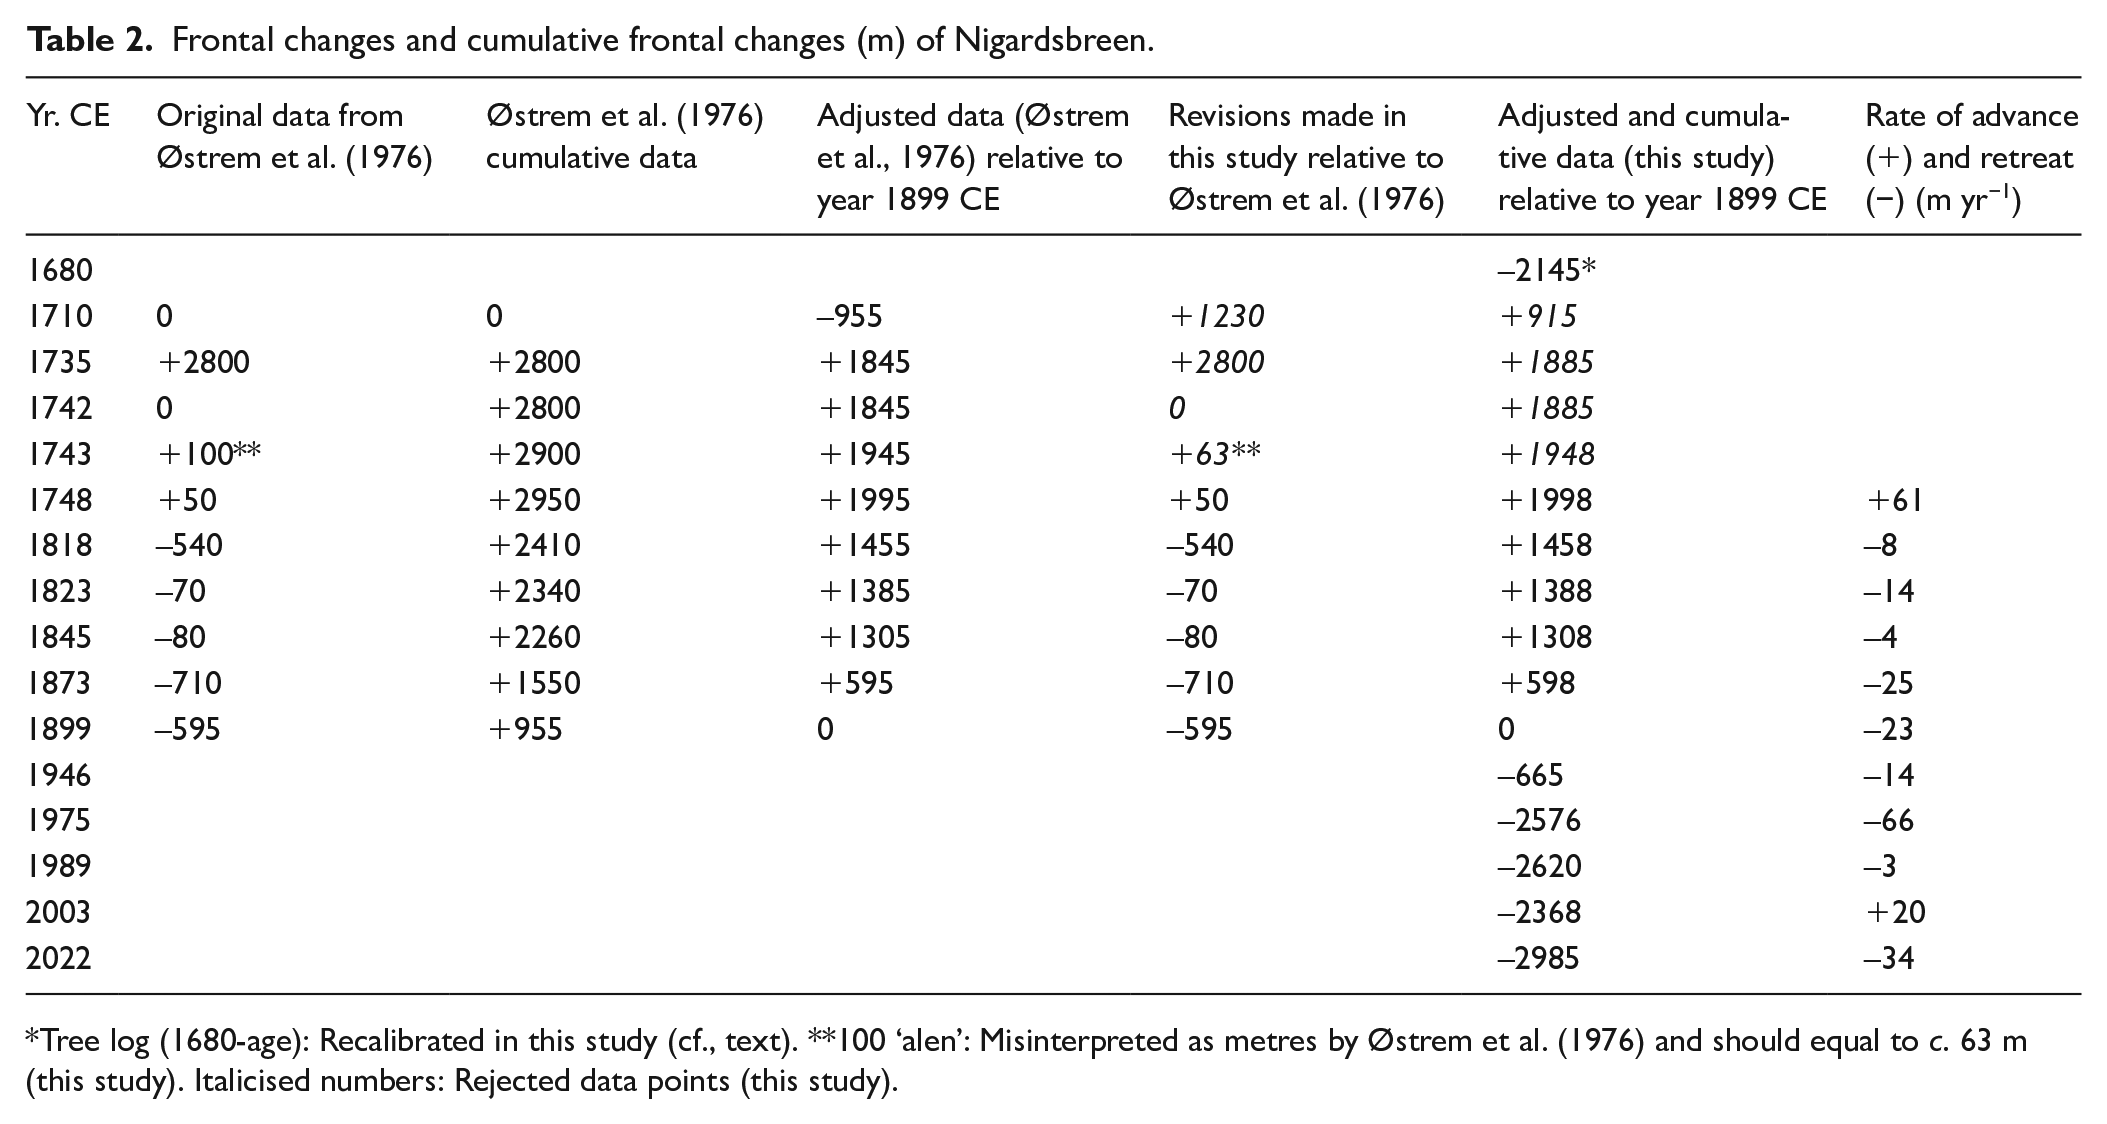
Tree log (1680-age): Recalibrated in this study (cf., text). **100 ‘alen’: Misinterpreted as metres by Østrem et al. (1976) and should equal to c. 63 m (this study). Italicised numbers: Rejected data points (this study).
Annual glacier length change measurements from 1899 CE
The Norwegian geologist John B. Rekstad initiated front position measurements of several outlet glaciers in southern and northern Norway beginning in 1899 CE, including Nigardsbreen as one of the locations (Rekstad, 1902). Rekstad applied permanent marks on bedrock or large boulders on respective sides of the glaciated valleys and from these marks he measured the distance to the glacier front annually in given directions (Rekstad, 1902). In front of Nigardsbreen, reference mark ‘M1’ (Figure 2) was carved directly on bedrock as a cross with the year of observation; 1899; at a distance of 344 m from the contemporaneous glacier front, whereas reference mark ‘M2’ (Figure 2) was carved on a large block of granite as a cross and the year; 1899; at a distance of 113 m from the contemporaneous glacier front (Rekstad, 1902). Frontal length change measurements of Nigardsbreen were thereafter performed by Rekstad in 1903 (Rekstad, 1904) and 1907 (Rekstad, 1907) (Figure 3). This pioneering work was the initiation of the long-lived front-position measurements that exist for many Norwegian glaciers today and is presently continued and monitored by the Norwegian Water Resources and Energy Directorate (NVE). For Nigardsbreen, an almost complete series of annual frontal measurements is presently available (Kjøllmoen et al., 2021), with the exception of the years 1964–1972 CE as the survey line became immeasurable due to the glacier retreating across the lake. The retreat in this period is photogrammetrically determined (Østrem et al., 1976).
A revised glacier length curve for the LIA advance (and retreat) of Nigardsbreen
Resulting from the preceding critical evaluation of source credibility, a revised data set of frontal length changes of Nigardsbreen is listed in Table 2 and presented in Figure 5, including systematic annual frontal measurements after 1899 (data: NVE; http://glacier.nve.no/glacier/viewer/ci/en/). The data are revised in relation to Østrem et al. (1976); the first study to present an overview of glacier length changes since 1710 CE that has served as a keystone for succeeding studies. We adjust all cumulative data relative to 1899 CE, that is, the initiation of glacier length measurements as established by Rekstad (1902) and the start-date of the ongoing data series continued by NVE. Frontal length changes for the years 1710, 1735, 1742 and 1743 CE are, from our critical review above, omitted and therefore our novel dataset discards these points (Table 2).
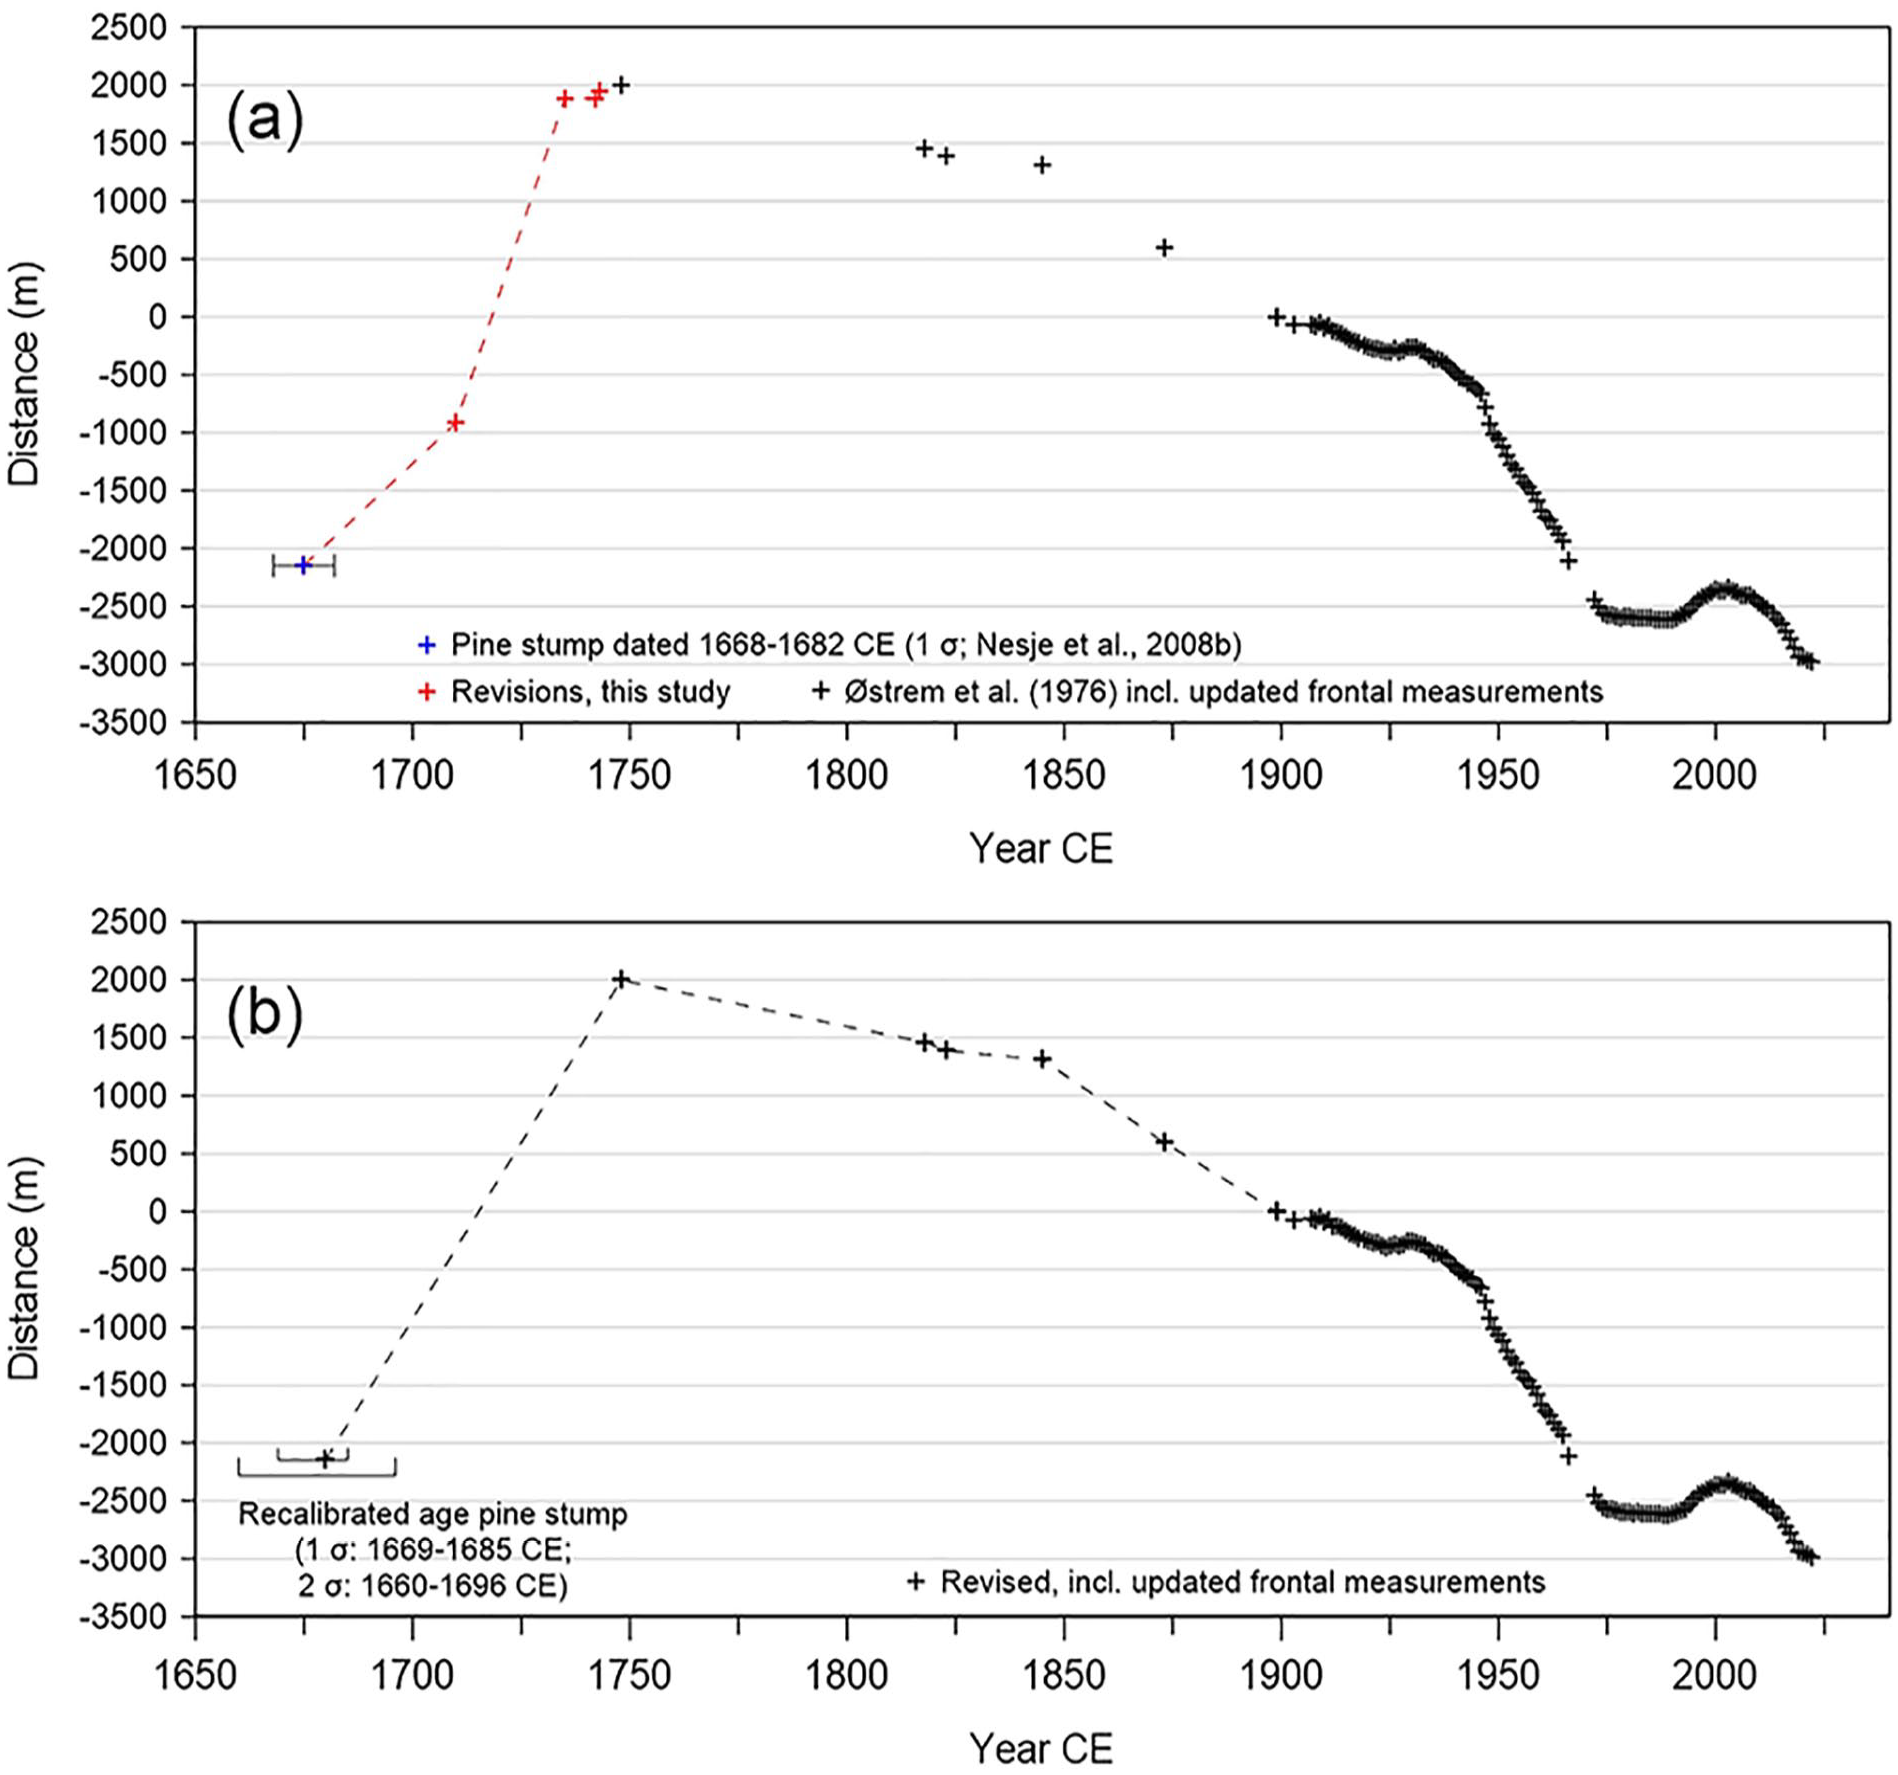
(a) The old glacier curve based on Østrem et al. (1976), including initiation of frontal measurements in 1899 CE by Rekstad (1902) and later updates from NVE as well as the pine stump age centred 1675 from Nesje et al. (2008); (b) A revised cumulative glacier curve for Nigardsbreen extending back to c. 1680 CE. Rejected ages (this study) are omitted from the curve, and the age range for the pine stump is recalibrated.
Recalibration of the pine stump discovered in 2005 (Figure 2; Nesje et al., 2008), using CALIB REV8.2 (Stuiver et al., 2021) and applying the newest radiocarbon calibration curve IntCal20 (Reimer et al., 2020), yields a centred calibrated age of c. 1680 CE (2 sigma: 1660–1696 CE). This adjusts the centred age of 1675 CE from Nesje et al. (2008) minutely, nevertheless, we include this recalibrated age in our revision (Table 2). This age likely reflects when the pine became overridden by the advancing Nigardsbreen, furthermore, the approximate geographical location of the coeval glacier terminus is also located (Figure 2) and the pine stump is therefore considered an important pre-LIA maximum data point.
Discussion
The retreat of Nigardsbreen since attaining the LIA maximum extent in 1748 CE is well-documented. Conversely, only one fixed age affiliated with the glacier advance is recognised, from an in situ pine stump discovered in 2005 near the contemporaneous glacier front. This age represents the kill age of the tree by the overrunning glacier c. 1680 CE and is assessed as the only precise time marker for the glacier terminus anywhere before reaching the LIA maximum end moraine that formed 1748 CE.
Little Ice Age and glacier climate
Although widely recognised as a colder period (e.g. Mann et al., 1999, 2009), there is no scientific consensus of an accurate ‘onset’ or ‘end’ date of the LIA, though, both timing and cause have been discussed over decades (e.g. Bradley and Jones, 1993; Mann et al., 2009; Matthews and Briffa, 2005; Nesje et al., 2008). Several components in the climate system were affected by the markedly cooler temperatures stretching over centuries. Sea ice grew extensive around Iceland from the 1200s and remained present until the 1900s (Massé et al., 2008; Miller et al., 2012), and the river Thames in London (as one of many) frequently froze between the 13 and 1800s (Fagan, 2000). The colder climate during the LIA is presumably most dramatically exemplified by the advancing valley glaciers in Norway and in the Alps during the 15–1700s (Grove, 2004; Nussbaumer and Zumbühl, 2012), where the direct consequences of the advancing ice generated large effects on the peripheral agricultural communities (e.g. Grove and Battagel, 1983; Hoel, 2013).
Glacier size changes result from the balance between the mass gain and the mass loss over time. Glacier mass balance in southern Norway is shown to be governed mainly by the balance between winter precipitation and summer temperatures, though, their relative importance varies over time (Steiner et al., 2008; Trachsel and Nesje, 2015). The maritime Nigardsbreen is mostly influenced by winter and/or spring precipitation compared to the more continental glaciers in southern Norway where summer temperatures exert a stronger control (Andreassen et al., 2005; Trachsel and Nesje, 2015). For the ‘1710–1748’ advance, a prevailing positive North Atlantic Oscillation (NAO) mode resulting in milder winters associated with increased (snow) precipitation, in conjunction with low summer temperatures, is suggested as the main cause of the relatively rapid advance of Nigardsbreen (e.g. Nesje and Dahl, 2003; Nesje et al., 2008; Steiner et al., 2008).
A recent study by Carrivick et al. (2022) stipulates that Nigardsbreen decreased 15% in glacierized area and lost c. 14% of its volume since the LIA max. and 2006 CE. Moreover, the equilibrium-line altitude (ELA) rose 208 m in altitude over the same time period (Carrivick et al., 2022). Summer temperature reconstructions from pine tree rings in Sogndal (Figure 1) further indicate that mean July temperatures were approximately 1°C lower in the region between 1671 and 1700 CE, as compared with the period 1962–2007 CE (Svarva et al., 2018). Interestingly, acknowledging the lower ambient regional summer temperatures, an increase of c. 30% in winter precipitation (snow) is still required for Nigardsbreen to attain its maximum extent with an associated ELA depression of 208 m (compared with the period of annual mass balance measurements on Nigardsbreen 1962–2020 CE; NVE).
1710 CE: The onset of the LIA advance of Nigardsbreen?
Grove and Battagel (1983) were the first to systematically explore tax records over a larger region to compare the impact of the advancing LIA glaciers on glacio-proximal villages. Our novel dataset reflecting highly local tax loads (Figure 4, Table 1) reveals that crop failure and other forms of hardship occurred earlier than previously assumed; indeed, the data show a clear deteriorating trend of the tax paying ability of farming families residing in Mjølver and Bergset villages already during the 1600s (Document, 1684; Laberg, 1944). From our assessment, a single sentence from vicar Wiingaard on the ‘30-year duration’ of a glacier advance at Nigardsbreen (Strøm, 1762) is shown to be the genesis for all subsequent studies pointing to a ‘1710-initiation’ of an advancing Nigardsbreen. Hence, 1710 CE is established as the LIA minimum with refutal of any glacier advance occurring in the 1600s (as proposed first by Rekstad, 1900). From our analysis, on the contrary, there is no clear evidence that 1710 CE is in fact a ‘LIA minimum’ extent of Nigardsbreen, nor can it be designated as the ‘initiation date’ of the LIA at Nigardsbreen as it is strictly founded on indirect references. Moreover, there exists no evidence for an exact geographical location of the glacier terminus around 1710 CE other than approximations and ‘hearsay’ originating from said vicar Wiingaard in Strøm (1762) via succeeding publications, and we therefore argue to dismiss this so-called ‘1710-point’ from future studies. Omitting this date further impacts the rate of glacier advance for this particular period, as other studies including the ‘1710-position’ yield an exceptional rapid advance rate of 112 m/yr between 1710 and 1735 CE (e.g. Nesje and Dahl, 2003). In our proposed revision of the glacier length curve for Nigardsbreen (Figure 5), the exclusion of the 1710 point removes a kink in the curve that has resulted in an erroneously rapid advance rate between 1710 and 1735 CE.
As previously noted, we can not accurately determine the geographical location of the former Nigard farm that was abandoned at some time between 1742–43 CE (Document, 1742; Foss, 1750), however, in Figure 1 we present our best-guess estimate of where the farm most likely was located based on local knowledge. Consequently, we can not with a certain degree of confidence conclude on the position of the glacier terminus at any point between the site of the pine stump (Nesje et al., 2008) (Figure 2) and the outermost end moraine as the four historical data sources stating anything on the glacier terminus for this time period (Document, 1742; Eide, 1955; Foss, 1750; Tax, 1723) do not reveal any exact geographical location of these points other than their relative distance (e.g. 12–13 m) from the former Nigard farm. Therefore, we propose to also reject these data points from future studies. However, a relative change in glacier front position is revealed for the respective 4 years 1723, 1735, 1742 and 1743 CE and may be used where applicable. Additionally, over this 20-year period we can surely assess that there likely was a continuous glacier advance, refuting the numbers ‘passed on’ in literature (e.g. Østrem et al., 1976) stating no advance (0 m) between 1735 and 1742 CE (Table 2).
Revised rates of advance and present-day retreat rates of Nigardsbreen
Between 1680 and 1748 CE Nigardsbreen advanced a total of 4143 m. On average, we find that Nigardsbreen advanced 61 m/yr during that period (Table 2); a significantly lower rate than the 112 m/yr for the 25-year period between 1710 and 1735 CE presented in other studies (e.g. Nesje and Dahl, 2003; Nesje et al., 2008). Between 1748 and 1899 CE the glacier retreated 1998 m in total, averaging 13 m/yr; demonstrating a relatively slow retreat from its maximum position until the start date of annual measurements. Prior to 1946, the retreat continued at approximately the same rate (14 m/yr), however, increasing rapidly to 66 m/yr retreat until 1975 CE (Table 2 and Figure 5). The swift retreat resulted mainly from calving processes, as the glacial lake Nigardsbrevatnet was unearthed 1937–1967 CE. Since 1968 the terminus has remained on land. The latest advance of Nigardsbreen took place between 1989 and 2003 CE with an advance of on average 20 m/yr (Table 2 and Figure 5), or about one-third of the rate of advance during the LIA advance 1680–1748 CE. Several outlets of Jostedalsbreen ice cap advanced during the same time period, and this c. 20-year advance is attributed to an increase in winter precipitation in the region due to a prevailing positive NAO situation (Nesje and Matthews, 2012), rather than lower summer temperatures, as was probably the case during the LIA max. interval (Nesje et al., 2008). Interestingly, applying the advance rates of 50–60 m/yr. found in the 1990s for western outlet Briksdalsbreen (Nesje and Matthews, 2012), occurring within a similar temperature regime like present-day rather than LIA max. temperatures, implies that if the winter precipitation at c. 160% of the normal detected for this timespan (Nesje and Matthews, 2012) would have continued until today Briksdalsbreen (and Nigardsbreen?) could have reached the LIA maximum extent once again. This assessment may further add to subsequent discussions on the relative importance of summer temperatures and winter precipitation for Nigardsbreen.
Since 2004, every year (including 2022 CE) demonstrates a retreat of the Nigardsbreen terminus, averaging around 34 m/yr for this period (Table 2). Between the LIA max. position attained in 1748 CE until present-day terminus position (2022), Nigardsbreen retreated a total of 4983 m, that is, a retreat of near 5 km in 274 years. On average, Nigardsbreen retreated 18 m annually ever since attaining its LIA maximum extent until present-day; despite including the advance taking place in the 1990s.
Conclusions
A revised and adjusted Little Ice Age advance (and retreat) glacier curve for Nigardsbreen glacier is constructed, based on critical cross-disciplinary analysis and evaluation of previously published historical data as well as application of a novel dataset. Contrary to former studies that have erroneously manifested 1710 CE as an exact initiation date for the LIA glacier advance of Nigardsbreen, our interdisciplinary assessment effectively rejects this data point and demonstrates that glacier growth had a marked impact on the population earlier than previously concluded. In fact, farm productivity dropped as early as in the 1620s for the immediate farms in Mjølver village. We further suggest that the LIA advance of Nigardsbreen manifested as follows:
- 1660–1696 CE: Advance of Nigardsbreen killing the pine tree at the 2005 CE glacier terminus position.
- 1723 CE: Farmland belonging to Nigard farm damaged by the advancing glacier.
- 1735 CE: The glacier is ‘a stone’s throw’ from Nigard farm, as stated by a witness.
- 1738 CE: Nigard farm is abandoned.
- 1742 CE: Nigardsbreen only 12–13 m from Nigard farm.
- 1743 CE: Farmhouses at Nigard demolished by the ice advance.
- 1748 CE: Maximum LIA extent of Nigardsbreen attained.
From our critical review on the validity of historical sources employed in former studies, we recommend that the following front position ages are rejected from future studies: 1710 CE, 1735 CE, 1742 CE, 1743 CE. As relative data, however, we assess that the data points are still applicable. It is suggested that future research apply the numbers presented in our revised dataset on glacier length changes of Nigardsbreen and discard the use of older estimates.
Footnotes
Acknowledgements
We thank Svein Olaf Dahl and one anonymous reviewer and the editor John A. Matthews for valuable comments that served to significantly improve the manuscript. A. Nesje and Svein O. Dahl discovered the location of reference mark M1; Jostein Aasen discovered the location of M2. The authors acknowledge Research Council of Norway grant no. 302458 to the JOSTICE project.
Funding
The author(s) received no financial support for the research, authorship, and/or publication of this article.
Data availability statement
All data generated or analysed during this study are included in this published article.