
Abstract
Glaciers and ice caps in Norway are presently undergoing mass loss, areal reduction, and frontal retreat, mainly a result of increased summer ablation due to rising summer temperatures over Scandinavia, especially after 2000 CE. In this paper, the glacier mass-balance response of 10 Norwegian glaciers with continuous mass balance observations (>10 years) to climate projections from 1971–2000 to 2071–2100 have been estimated. Projected changes in mean summer temperature and mean winter precipitation from 1971–2000 to 2071–2100, applying the RCP8.5 emission scenario for five different regions in Norway; ‘Sogn og Fjordane’ and ‘Hordaland’, now Vestland County in western Norway, ‘Oppland’, now part of Innlandet County in eastern Norway, and Nordland County and Finnmark County, both in Northern Norway), range between +3.5°C and +5.0°C, and between +5% and +25%, respectively. These climate projections have been converted (by linear regression with overlapping observational mass-balance data) into specific surface glacier mass balance [winter balance (Bw), summer balance (Bs), and annual balance (Ba) for 10 glaciers in Norway with mass-balance series [Ålfotbreen, Nigardsbreen (part of Jostedalsbreen), Austdalsbreen (part of Jostedalsbreen), Rembesdalskåka (part of Hardangerjøkulen), Blomstølskardsbreen (part of Søre Folgefonna), Storbrean, Hellstugubrean, Gråsubrean, Engabreen (part of Vestre Svartisen, Langfjordjøkelen (data: http://glacier.nve.no/glacier/viewer/ci/no/) yielding a total, cumulative surface glacier mass loss from 2000 to 2100 CE in the range of -85.2 ± 4 to -197.3 ± 10 m water equivalents. The estimated changes in equilibrium-line altitudes (ELAs), in the range of 230 ± 10 to 630 ± 30 m, indicate that the mean ELA may reach the upper part of 7 of the 10 glaciers included in this study [Ålfotbreen, Austdalsbreen, Rembesdalskåka, Blomstølskardsbreen, Gråsubrean, Engabreen and Langfjordjøkelen] by the end of the 21st century. The projected glacier mass loss and ELA rise, and thus changes in glacier length, area and volume, will most likely have profound consequences for future glacier hydrology (runoff), hydropower production, wildlife, ecosystems, glacier hazards, and tourism.
Keywords
Introduction
Mountain glaciers around the world are in general losing mass (volume) and experiencing areal reduction and frontal retreat (e.g. Roe et al., 2017; Rounce et al., 2023; Zemp et al., 2015), thus affecting local and regional hydrology, water management, run-off, irrigation, hydropower production, ecosystems, environmental issues, geohazard risk, tourism, and contributing to global sea-level change (IPCC, 2019; Lemke et al., 2007; Rounce et al., 2023). The causes-and-effects of glacial systems are complex, however, overall trends indicate significant mass loss and frontal retreat of glaciers worldwide in the coming decades. Studies of glaciers using satellite images with high spatio-temporal resolution (Hugonnet et al., 2021) demonstrate an accelerating glacier mass loss so far during the 21st century. A mean annual mass loss of 267 ± 16 gigatons was estimated in the period 2000–2019 (21% ± 3% of observed sea-level rise). Their analyses reveal contrasting geographical patterns, including accelerating mass loss at glaciers in NW America, decelerating mass loss in the North Atlantic region, and termination of a period of mass increase on Karakoram glaciers. Recent scenarios indicate that mountain glaciers may lose 26 ± 6–41 ± 11% (relative to 2015) with global temperature scenarios of +1.5°C and +4°C, respectively, by the end of the 21st century (Rounce et al., 2023), whereas high-altitude glaciers in the Alps are supposed to lose ~90% of their mass within 2100 (Zekollari et al., 2019).
In Norway, approximately 94% of the electricity comes from hydropower and about 15% of the water runoff comes from watercourses with glaciers in the catchment area. Most of the runoff, up to 80%, occurs in the summer and in dry and warm summers, glacier melting maintains a high discharge. Finally, glaciers are a fascinating element of the Norwegian landscape, and many tourists visit Norway to experience and explore the glaciers. However, several glacier-related hazards, mainly avalanches and calving from glacier fronts, have occurred during the last decades.
Historical information from, for example Jostedalsbreen and Folgefonna, shows a significant glacier retreat from the Little Ice Age glacier maximum until present (Nussbaumer et al., 2011). A recent study from Jostedalsbreen (Figure 1) shows that the largest outlet glaciers from the ice cap have lost >110 km2 (~19%) of their area during the mid-18th Little Ice Age maximum and 14 km3 (18%) of their volume since the Little Ice Age maximum up to the present (Carrivick et al., 2022).
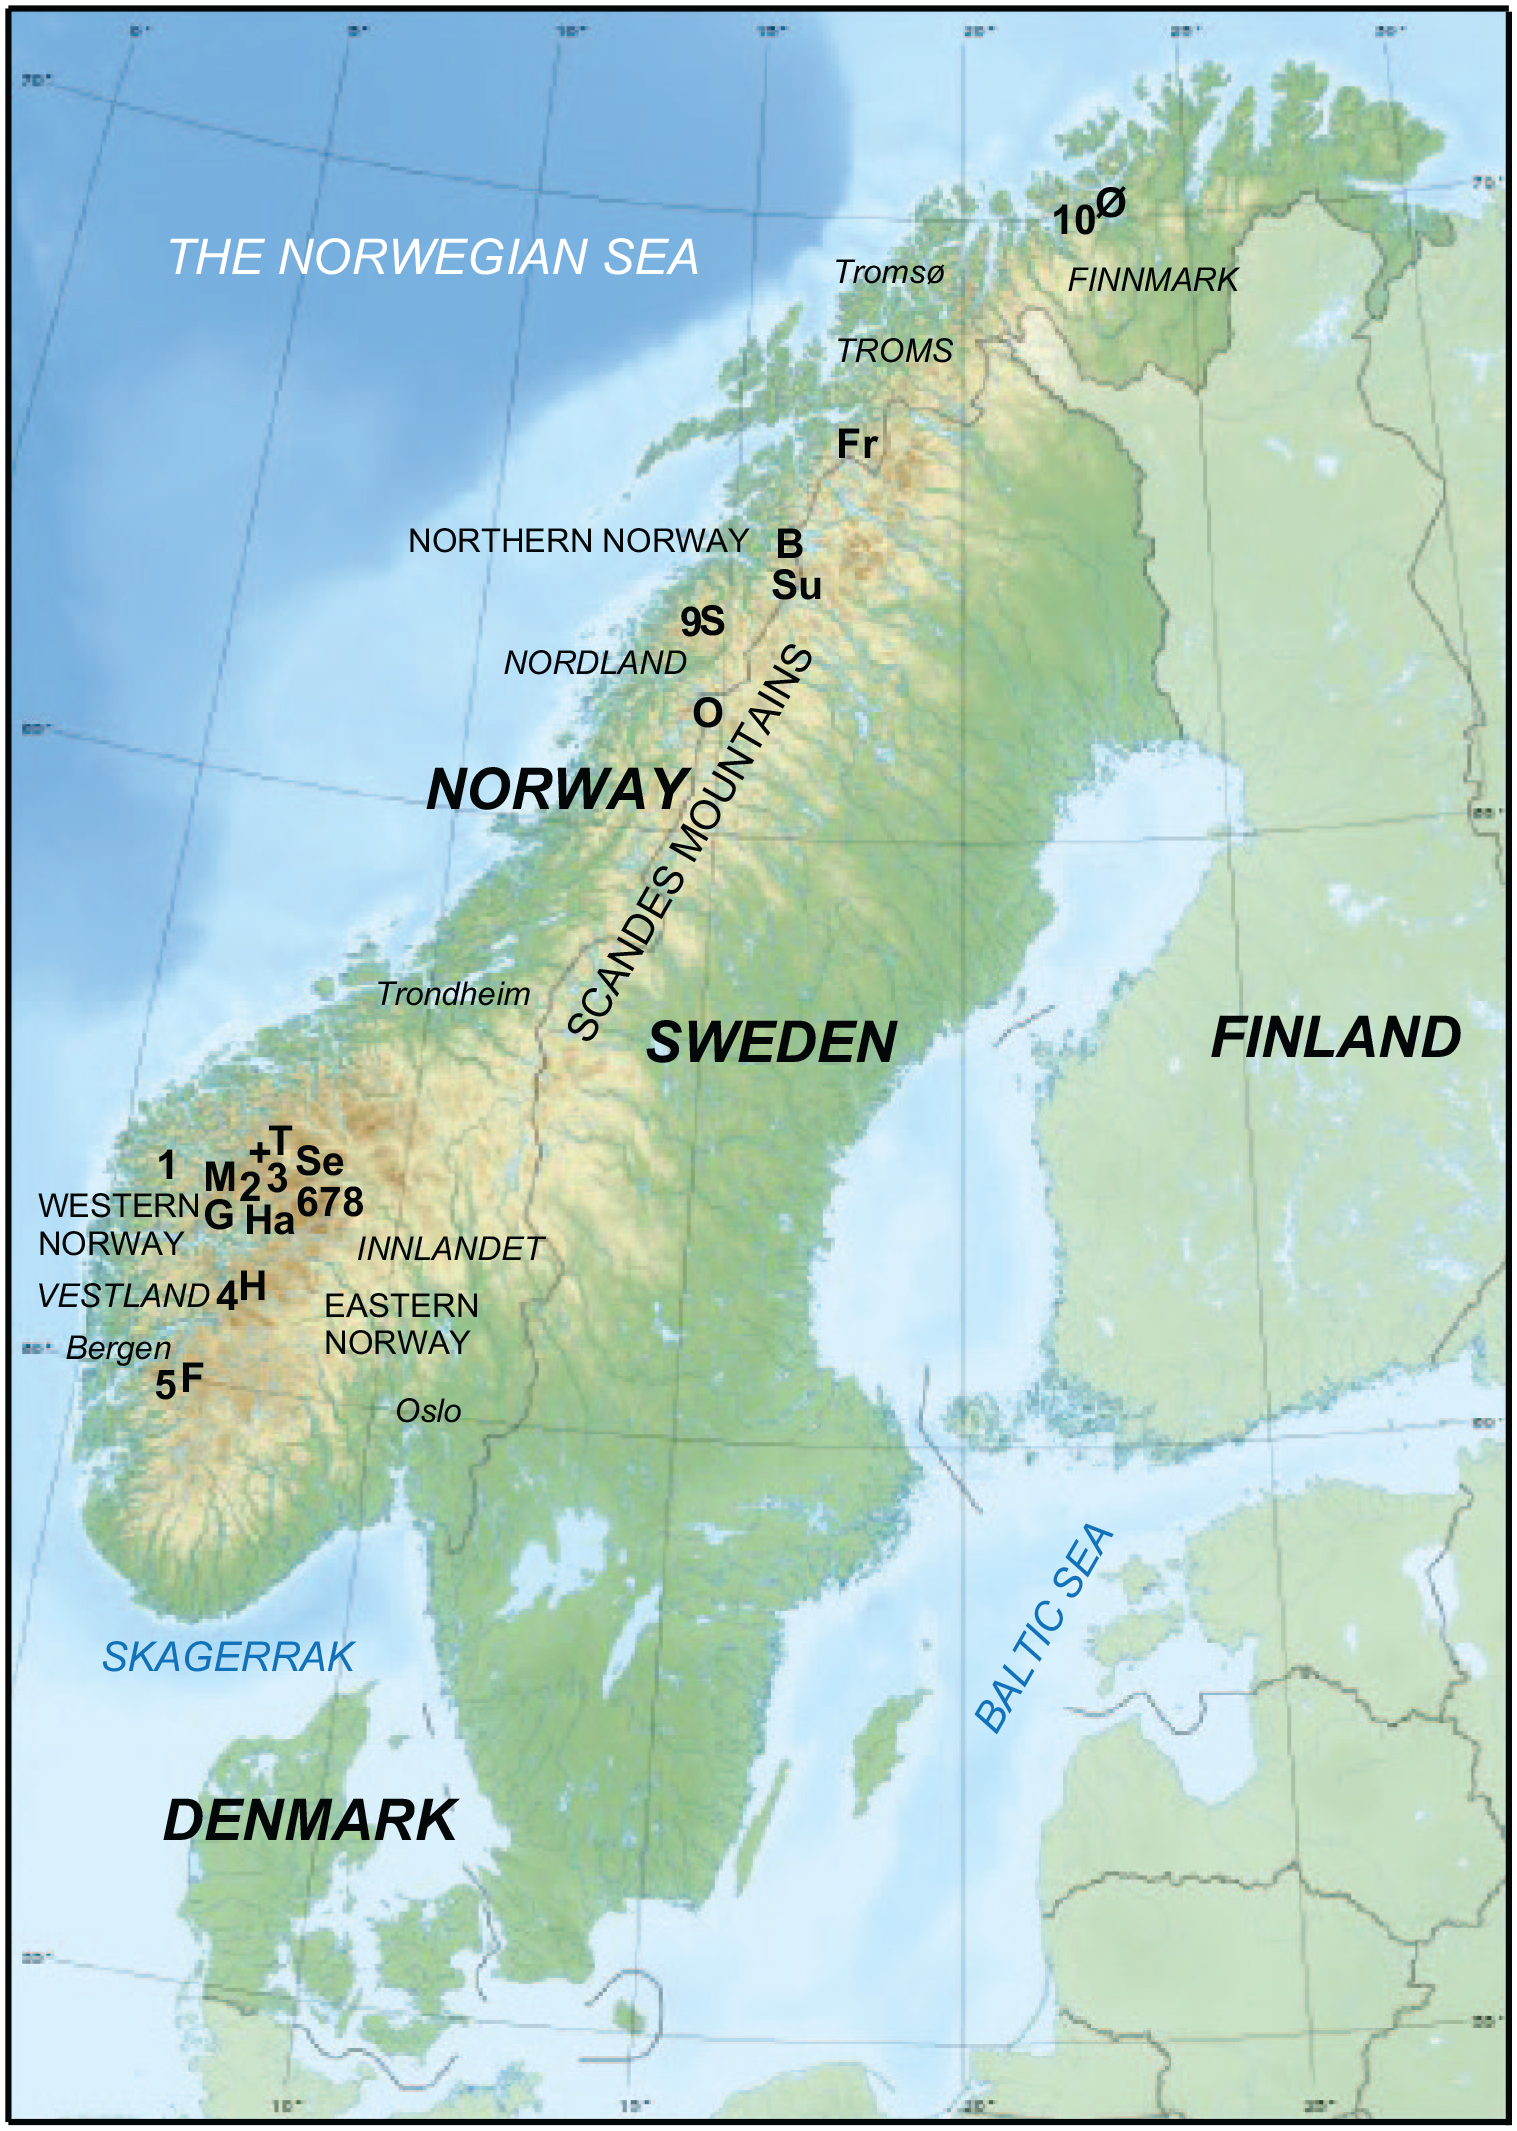
Location map of the glaciers included in this study: 1-Ålfotbreen, 2-Nigardsbreen, 3-Austdalsbreen, 4-Rembesdalskåka, 5-Blomstølskardsbreen, 6-Storbrean, 7-Hellstugubrean, 8-Gråsubrean, 9-Engabreen, 10-Langfjordjøkelen. J-Jostedalsbreen, S-Svartisen, F-Folgefonna, H-Hardangerjøkulen, M-Myklebustbreen, O-Okstindbreen, Ø-Øksfjordjøkelen, Ha-Harbardsbreen, Fr-Frostisen, G-Grovabreen, T-Tystigbreen. Data: http://glacier.nve.no/glacier/viewer/ci/no/.
The aims of this paper have been to apply gridded data of total monthly precipitation for the accumulation season (1 October-30 April) and gridded mean monthly data for the ablation season (1 May–30 September) temperature for western, eastern and northern Norway (data: met.no) and compare these data with measured specific surface winter balance (Bw) and summer balance (Bs), respectively, on 10 Norwegian glaciers, eight in southern Norway and two in northern Norway (data: http://glacier.nve.no/glacier/viewer/ci/no/). These data have been used to estimate the future mass-balance development of the study glaciers to projected changes of summer temperature and winter precipitation from 1971 to 2000 to 2071 to 2100 CE. Finally, the inferred changes in the specific annual mass balance (Ba) have been used to estimate changes in equilibrium-line altitude (ELA) for the given regional climate scenarios.
The status of the Norwegian mountain glaciers
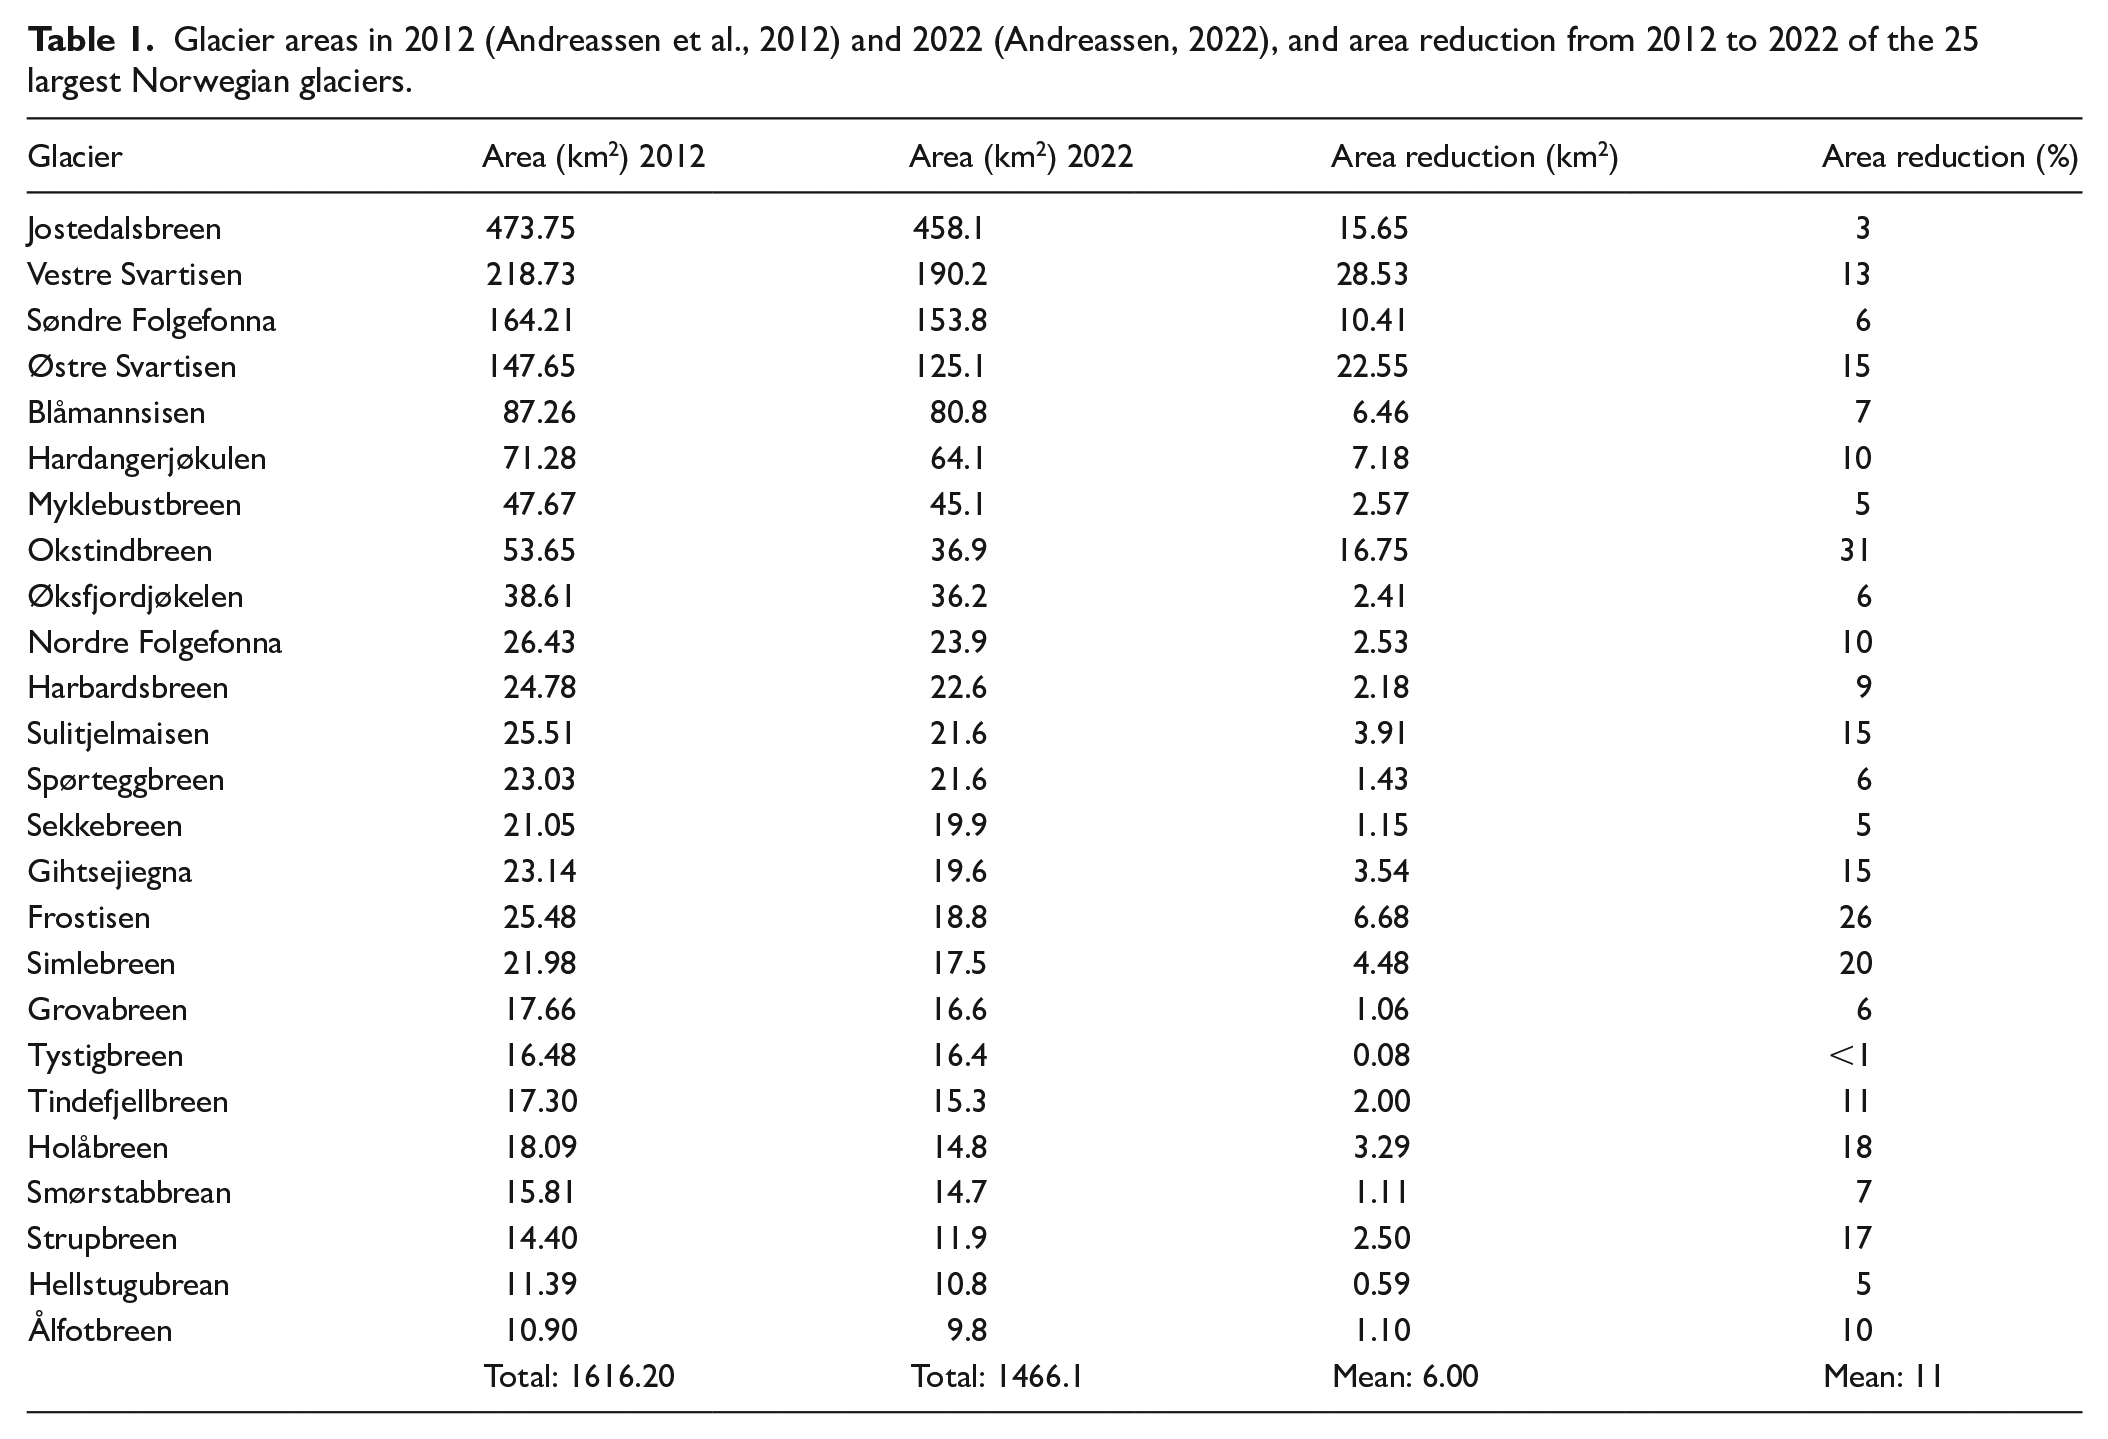
On mainland Norway (Figure 1), there are at present (mapping period 2018–2019) 5260 glaciers >0.01 km2 that cover an area of 2320 km2 (~0.7% of the mainland area) (Andreassen, 2022; Andreassen et al., 2021, 2022; Figure 2). The 25 largest glaciers cover an area of 1466.1 km2 (Figure 3, Table 1).
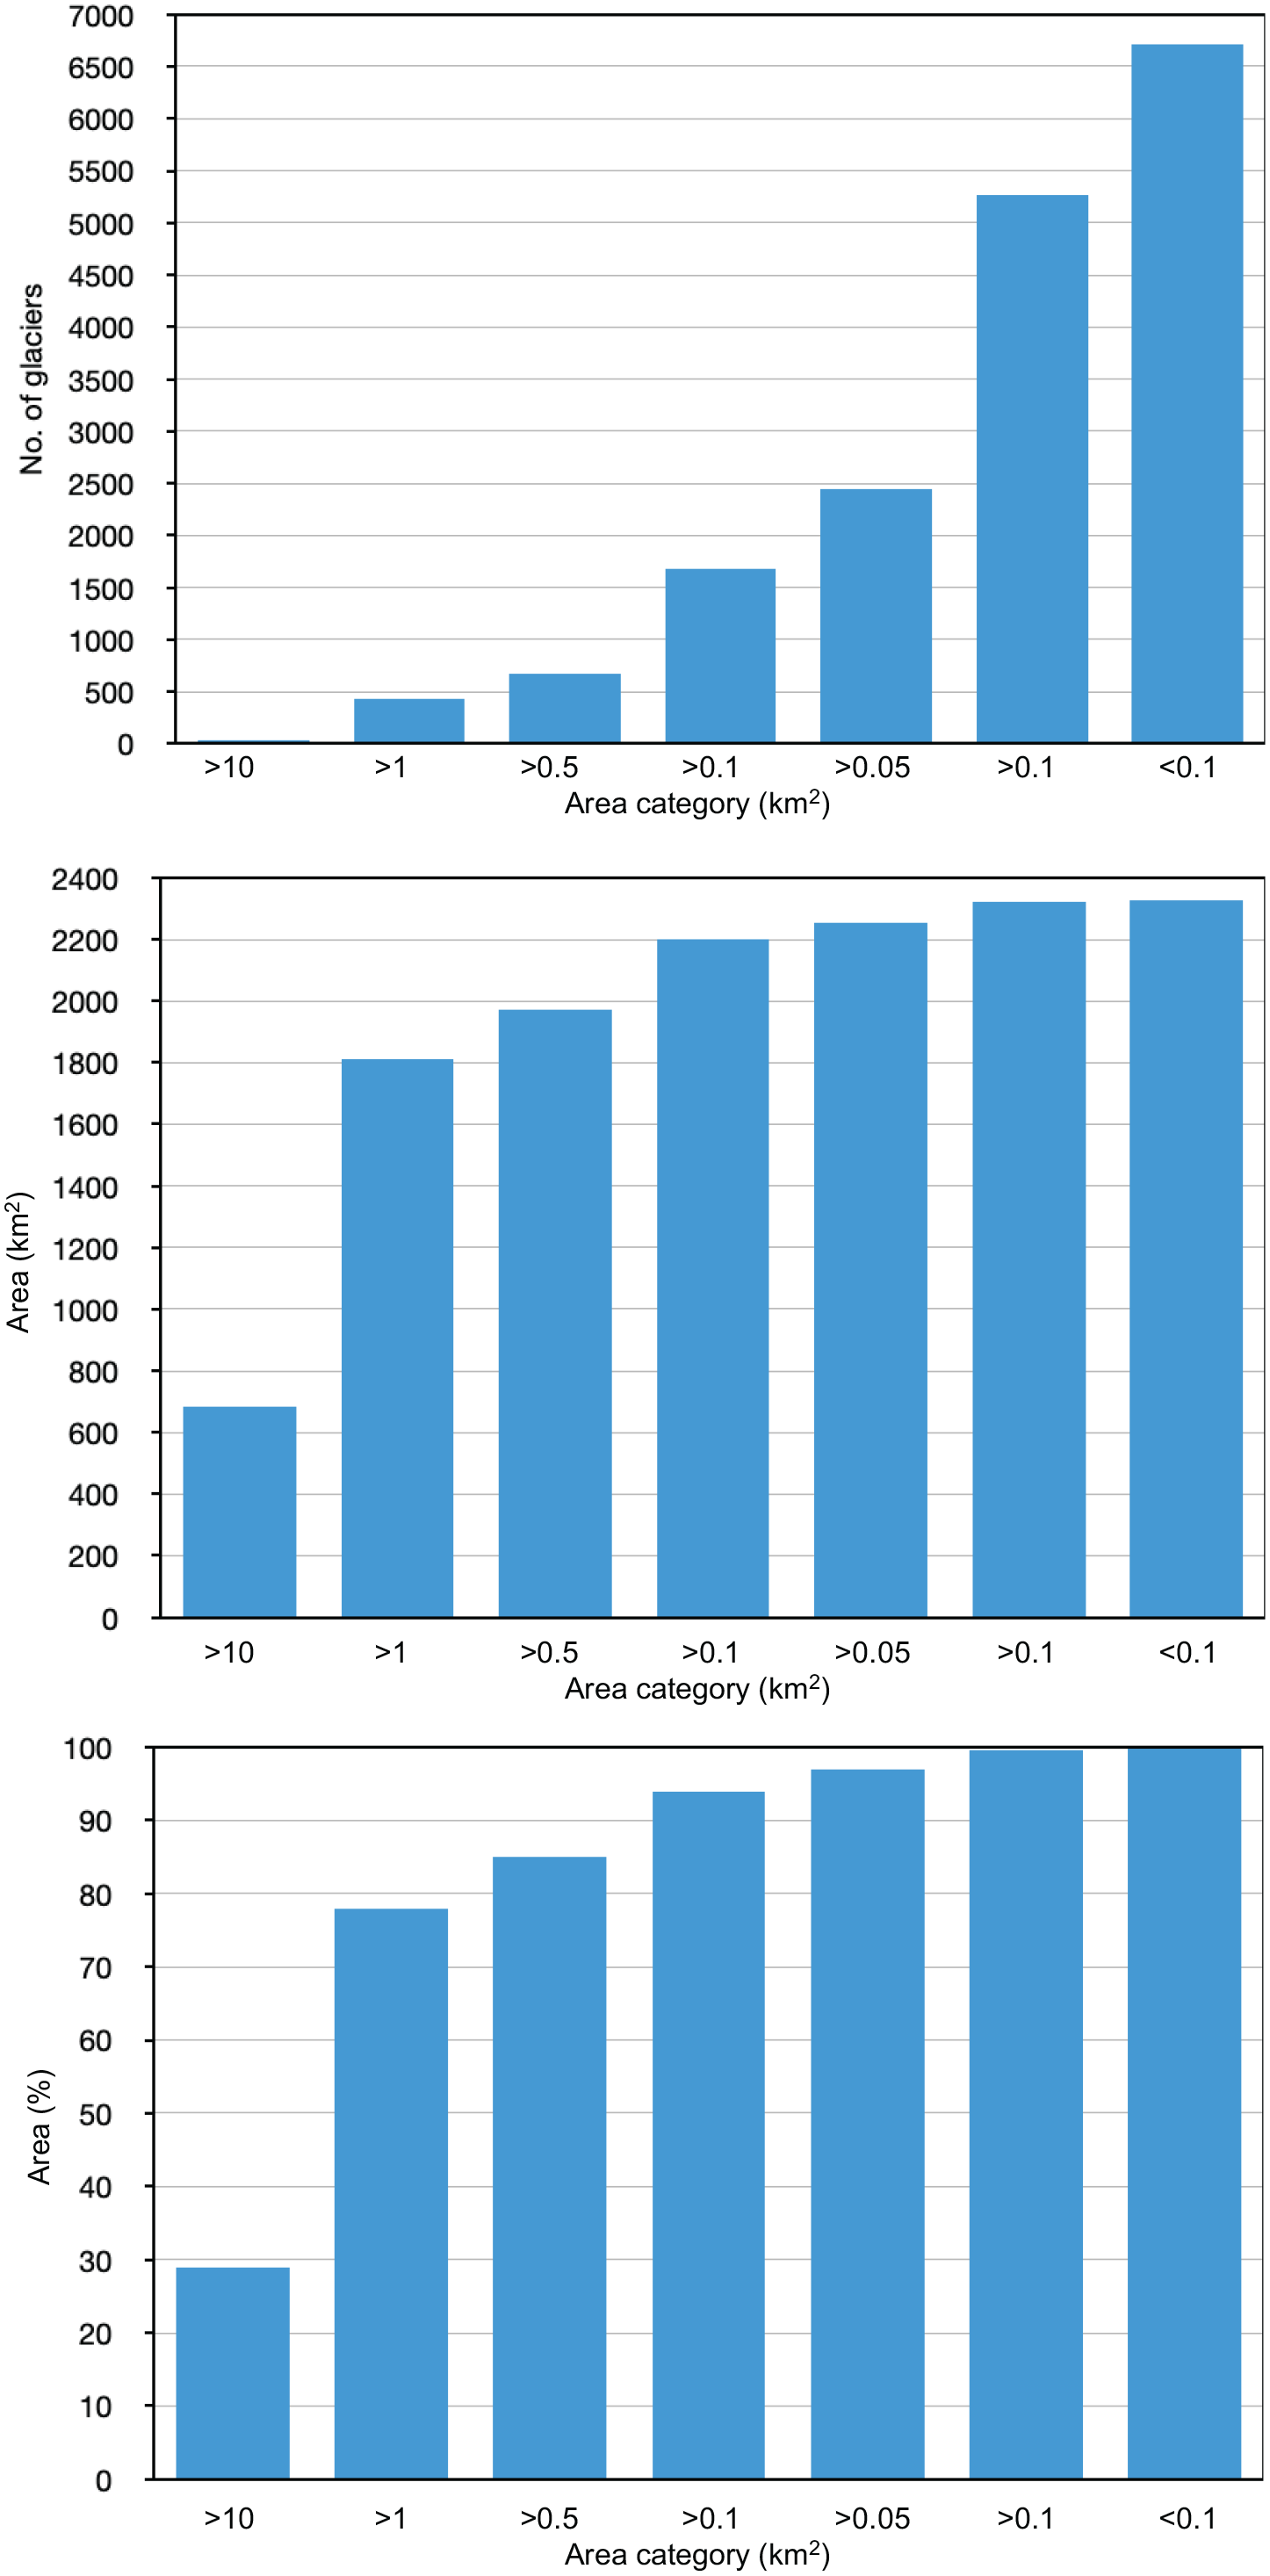
Number of glaciers in Norway and area (km2 and percent) for three different size categories from the glacier inventory published in 2022 (Andreassen, 2022).
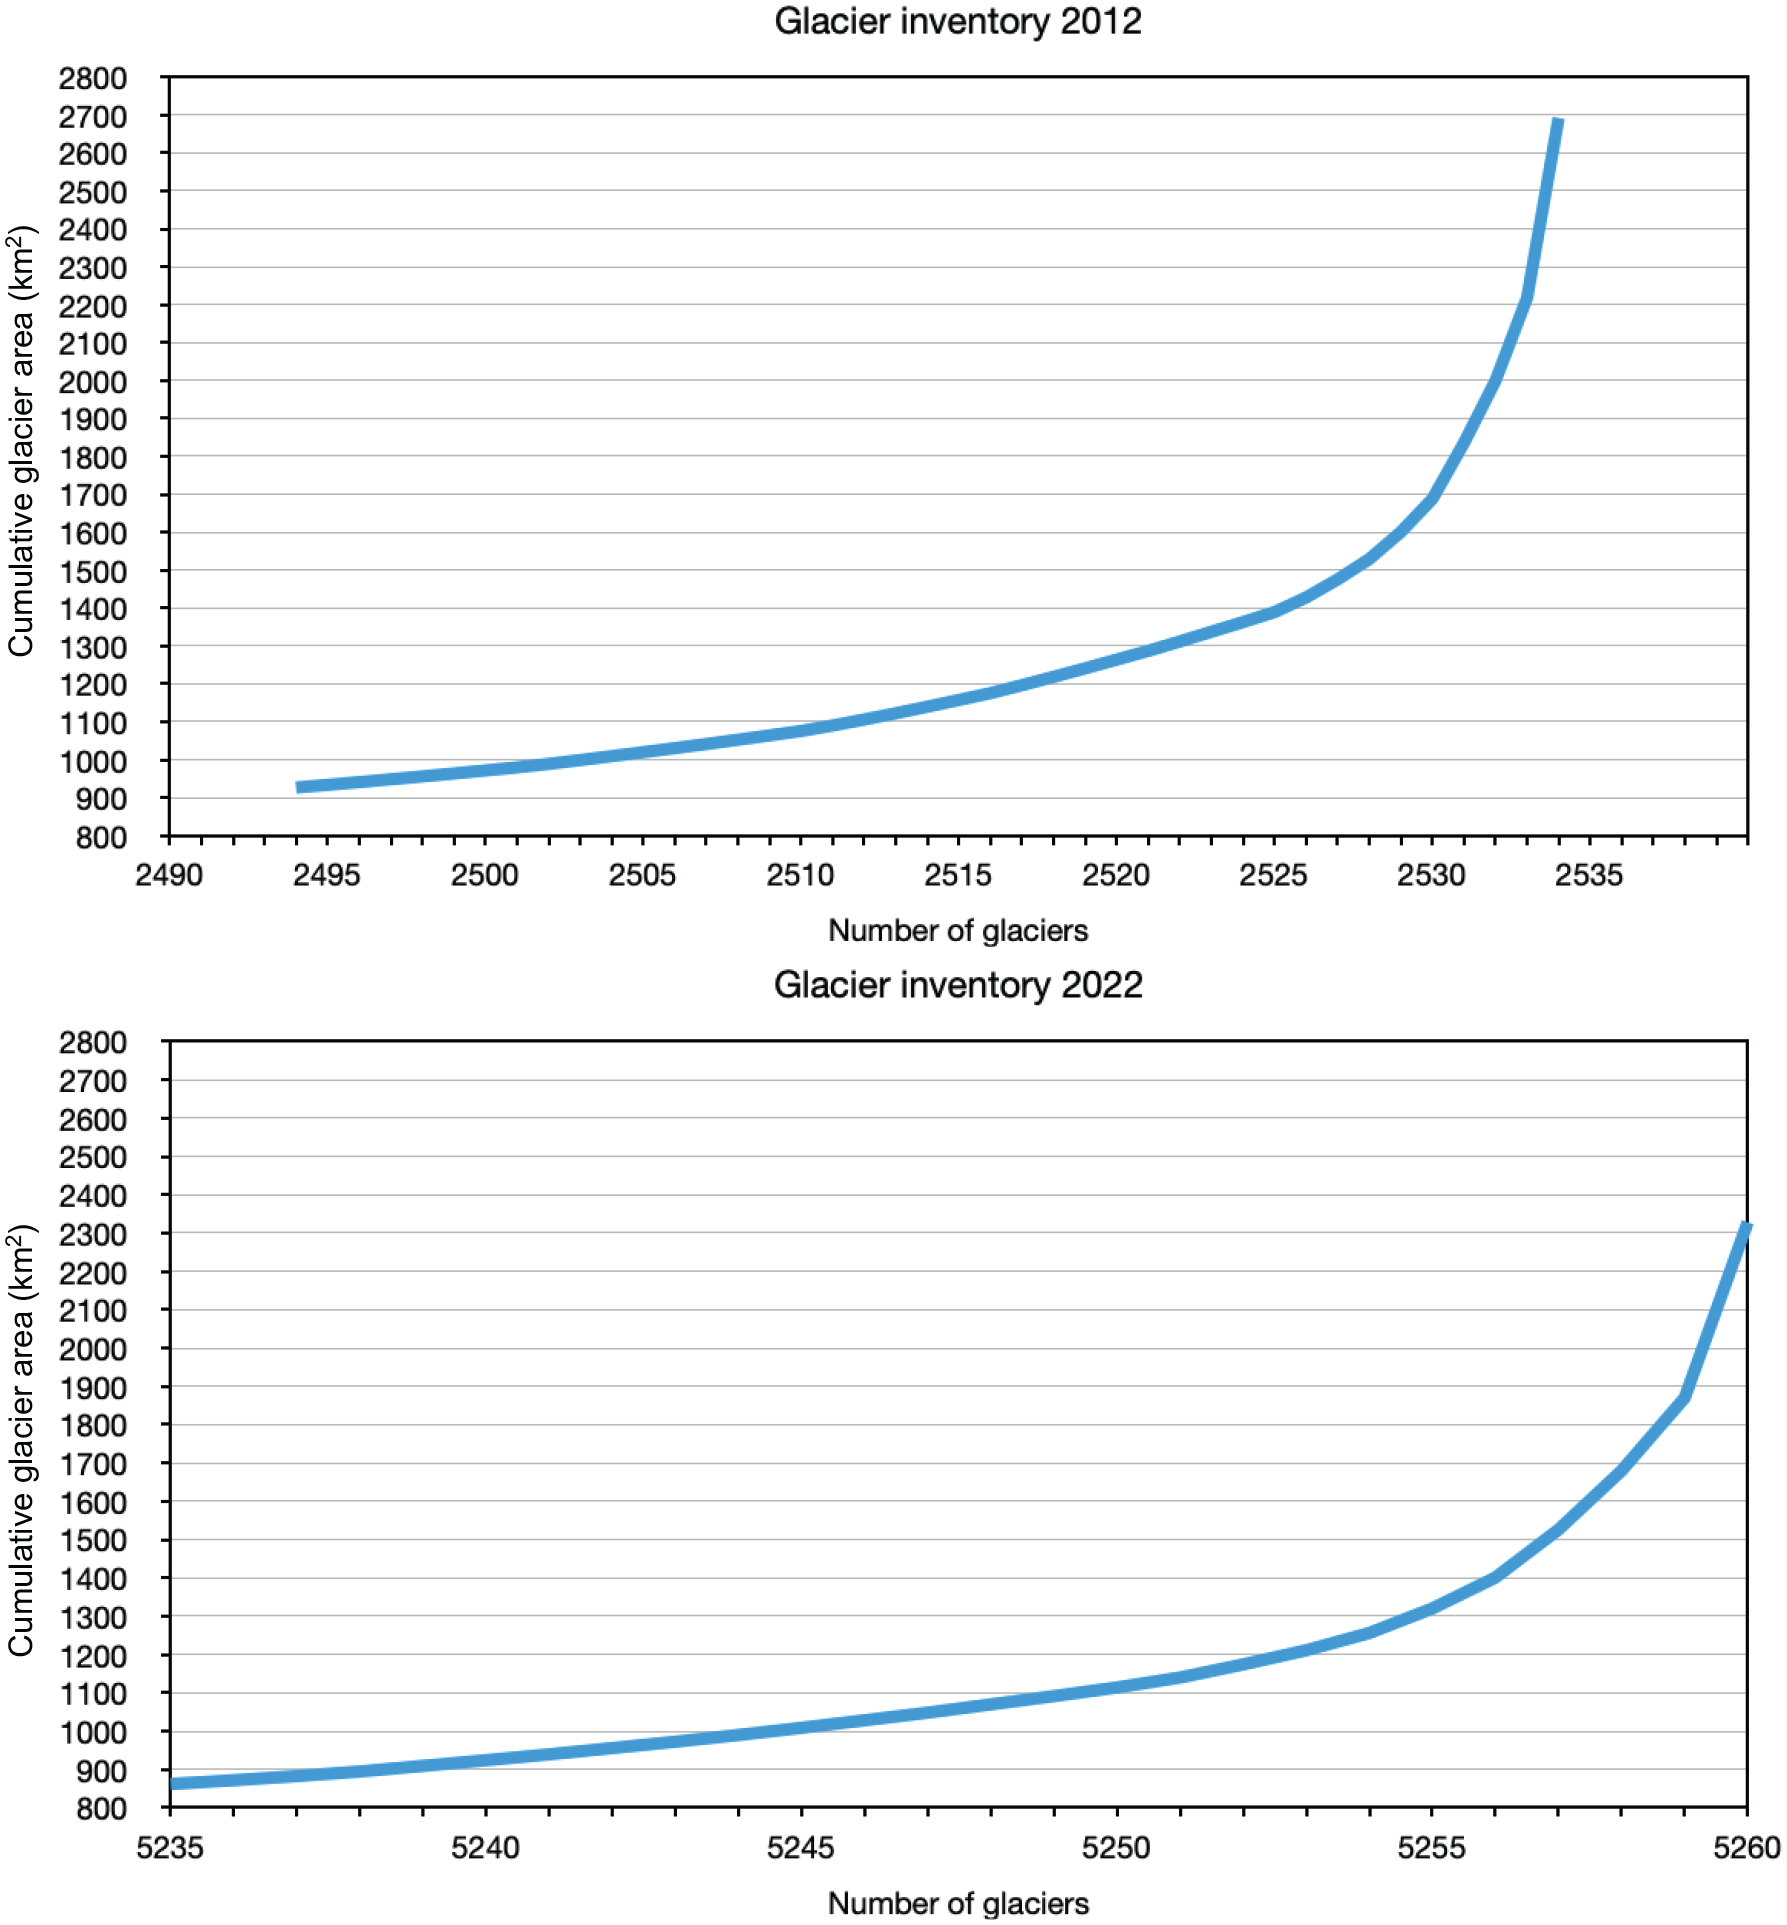
Number of glaciers in Norway plotted versus cumulative glacier area (km2) from data in the glacier inventories published in 2012 (Andreassen et al., 2012) and 2022 (Andreassen, 2022).
Glacier areas in 2012 (Andreassen et al., 2012) and 2022 (Andreassen, 2022), and area reduction from 2012 to 2022 of the 25 largest Norwegian glaciers.
The first overview of Norwegian glaciers, based on topographical maps and aerial photographs, was put together and listed by Olav Liestøl in 1962 (Liestøl, 1962). The total glacier area in Norway was then estimated at 3900 km2, and 1750 glaciers altogether. In 1969 and 1973, NVE published glacier atlases over southern Norway and northern Scandinavia, respectively (Østrem and Ziegler, 1969; Østrem et al., 1973). In 1988, another atlas over glaciers in southern Norway was published by NVE (Østrem et al., 1988), based on topographical maps and aerial photographs. The total glacier area in Norway was estimated at 2609 km2 (1627 glaciers and 2113 glacier units). In 2012, NVE published a glacier inventory of Norway (Andreassen et al., 2012), and a total glacier area of 2692 km2 was estimated (3143 glaciers and approximately 400 minor ice patches with a total area of 24 km2). Subsequent to the previous inventory of Norwegian glaciers (mapping period 1999–2006) (Andreassen et al., 2012), the glacier-covered area has been reduced by 14–15% and 20 small glaciers (area 0.015–0.51 km2) mapped in the previous inventory in 2012 have melted completely, all of these located in northern Norway, and about 350 ice-dammed/ice-marginal lakes have been formed since the previous glacier inventory published in 2012 (Andreassen, 2022; Figure 4).
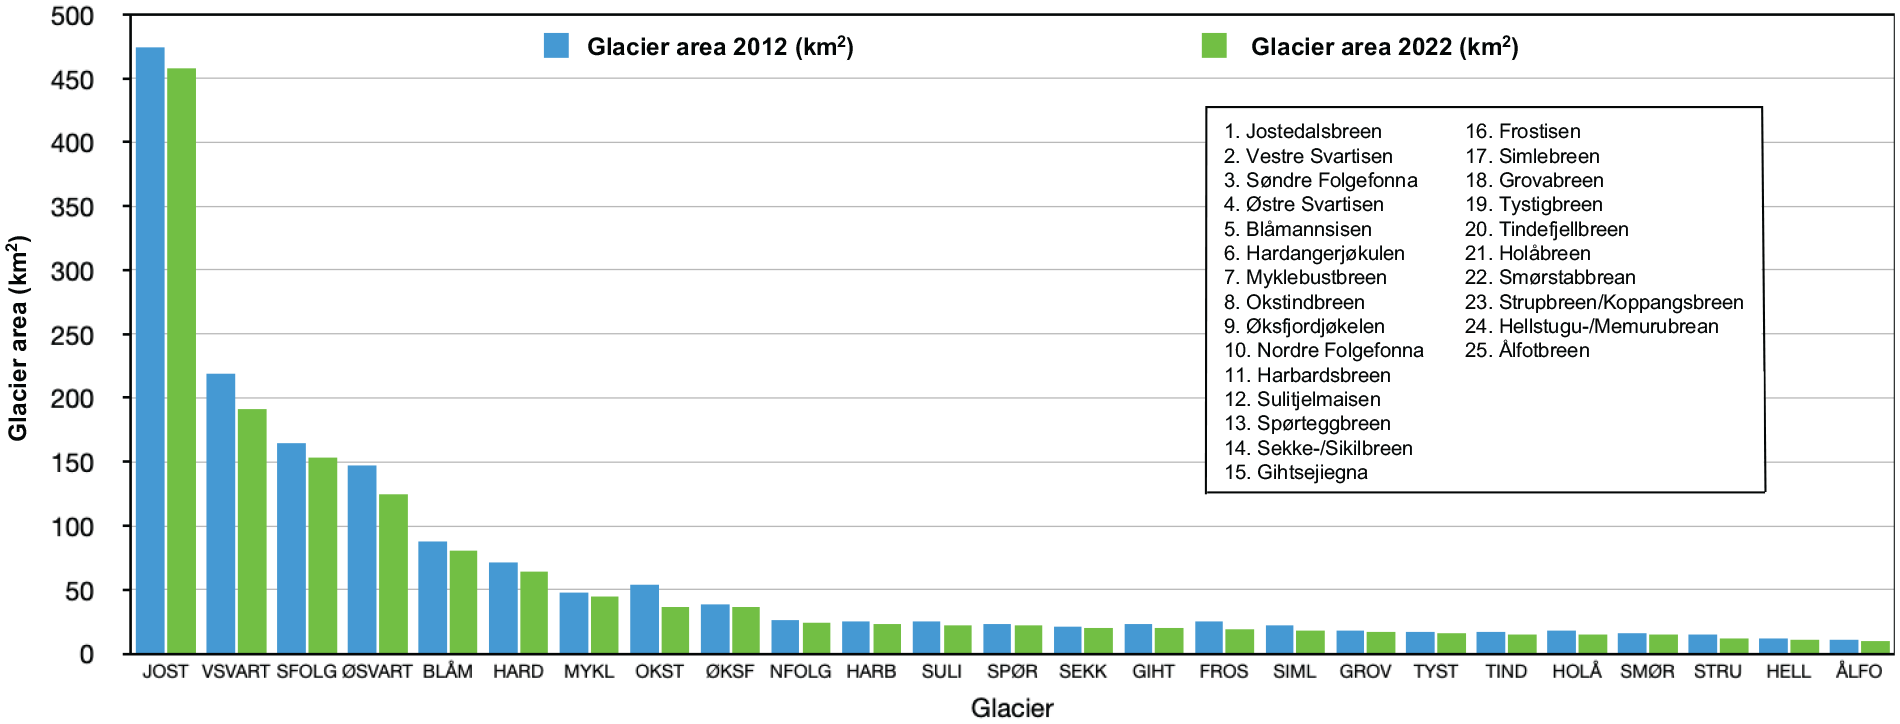
The glacier area reduction of the 25 largest glaciers in Norway from data in the glacier inventories published in 2012 (Andreassen et al., 2012) and 2022 (Andreassen, 2022).
After a period of positive mass balance and glacier expansion in the 1990s, particularly in western Norway, the Norwegian glaciers started a trend of annual mass loss and glacier front/length recession from c. 2000 CE (Figures 5 and 6). Around 1900 CE, regular annual glacier-front/length measurements started in Norway, and about 70 glaciers have been measured over the years. On mainland Norway, regular mass balance measurements started at Storbreen (now named Storbrean) in Jotunheimen in 1949, whereas regular, annual measurements on other Norwegian glaciers were initiated in the early 1960s, and altogether 43 glaciers have been measured, of which 10 for more than 30 years (http://glacier.nve.no/glacier/viewer/ci/no/). An overview of changes on Norwegian mainland glaciers since the 1960s have been presented by Andreassen, 2022; Andreassen et al., 2005, 2008, 2020, and references therein). Over the ~50-year period of mass balance measurements, the total mean surface elevation change has been estimated to -15.5 m, yielding a mean geodetic, annual mass balance of −0.27 ± 0.05 m water equivalents (m w. eq.). At present, the Norwegian glaciers are significantly thinner and less extensive than they were when the regular glacier monitoring started in the early 20th century. The Norwegian Water Resources and Energy Directorate (NVE) is responsible for conducting glacier measurements, in addition to storage and reporting these data (see http://glacier.nve.no/glacier/for data and NVE reports). In addition to areal extent, glacier thickness and ice volume are important variables in glacier monitoring and for providing reliable estimates of the future development of the Norwegian glaciers. Andreassen et al. (2015) calculated a total glacier volume of 134 ± 23 km3 for 870 km2 (32% of the total area of the Norwegian glaciers). They used the dataset for area-volume scaling and estimated a total volume of all Norwegian glaciers to 257–300 km3. Laumann and Nesje (2017) used a 2D glacier model on four Norwegian ice caps to estimate volume-area relationships for ice caps compared to volume-area relationships for valley glaciers.
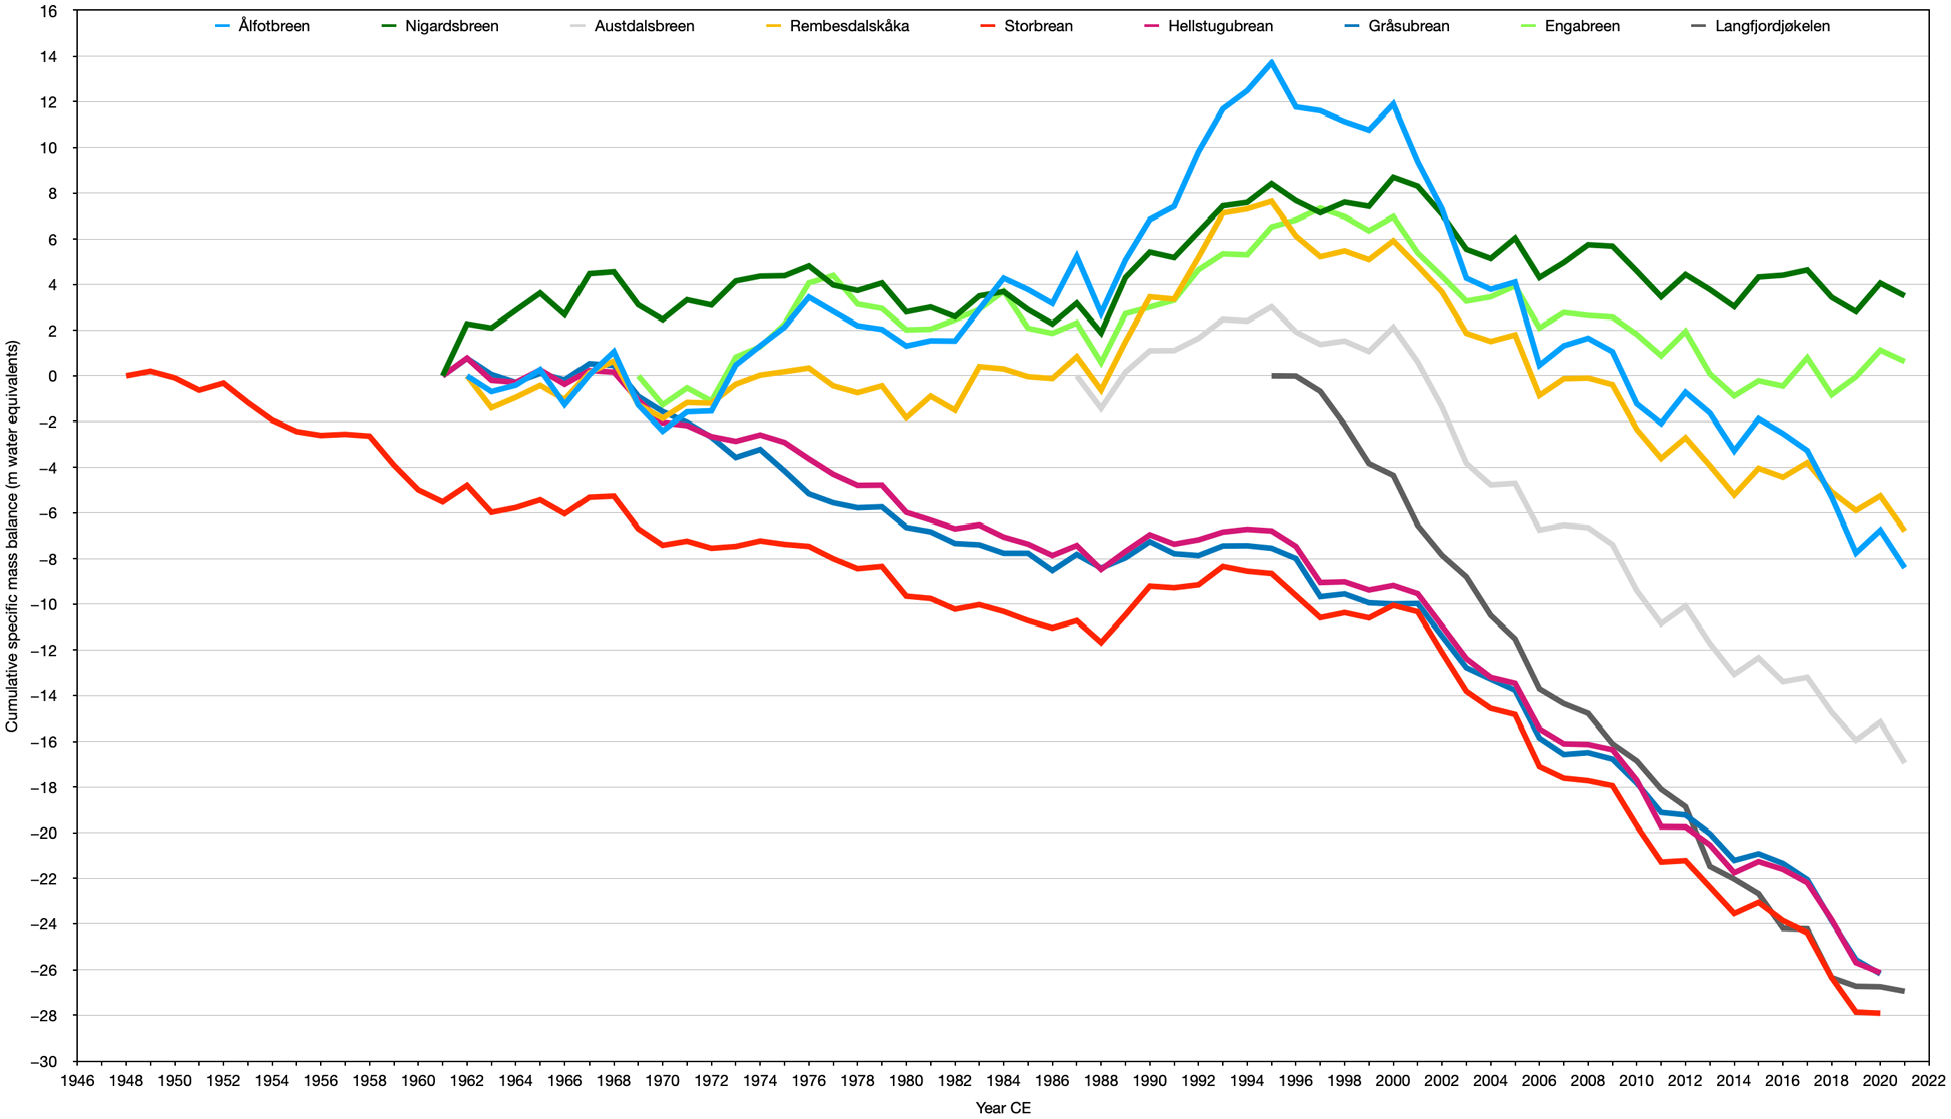
Cumulative specific surface annual mass balance of the 10 glaciers in thus study (data: http://glacier.nve.no/glacier/viewer/ci/no/).
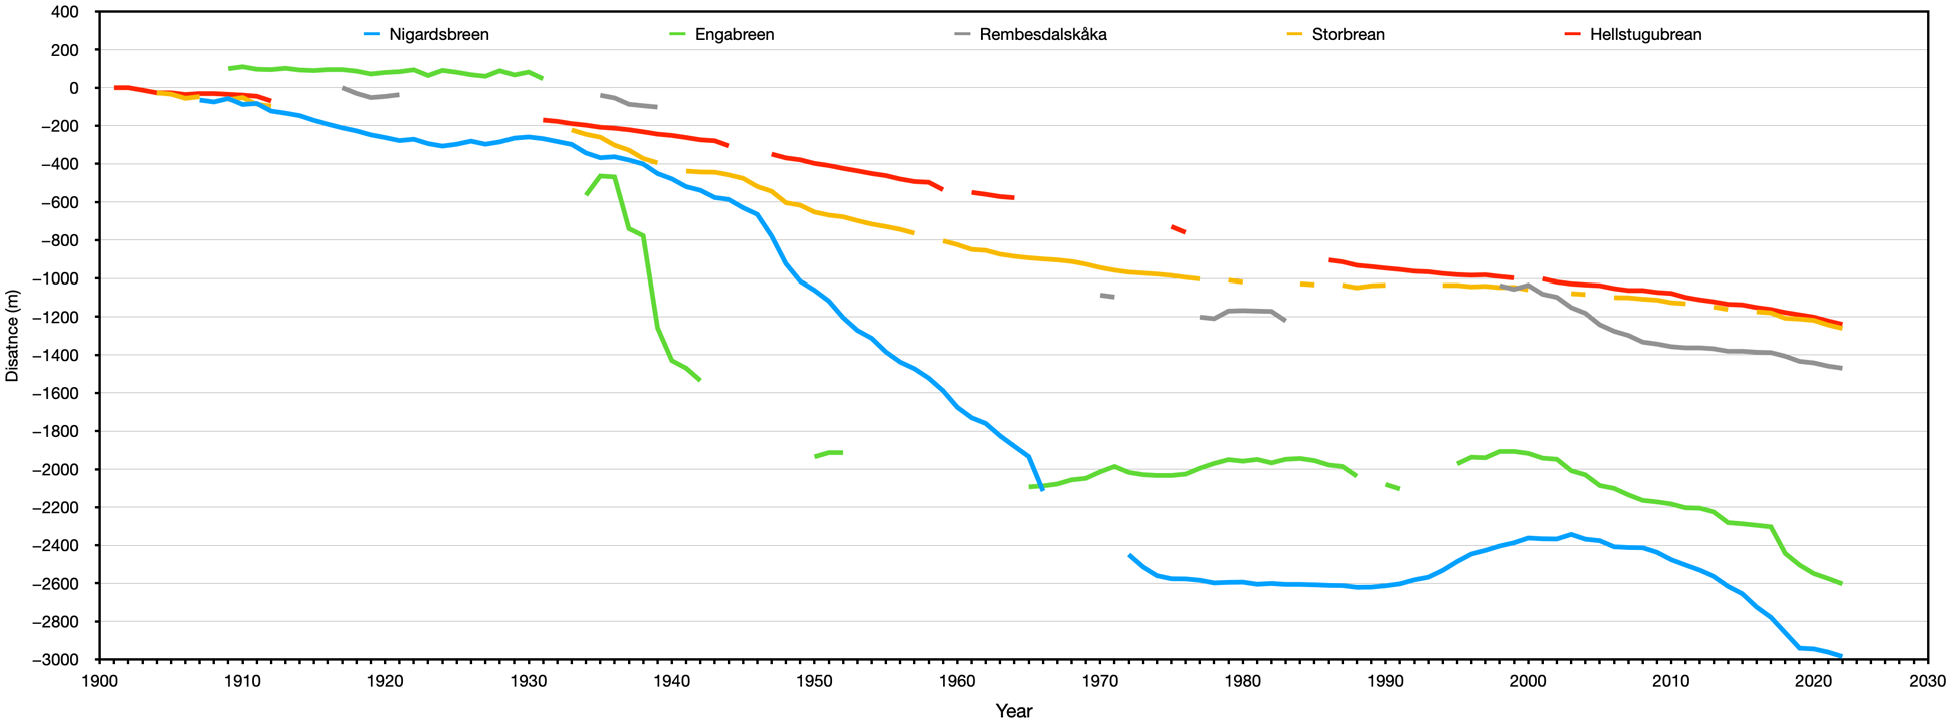
Cumulative glacier length records (in metres) of Nigardsbreen, Rembesdalskåka, Storbrean, and Engabreen from the early 20th century. The vertical red lines mark the start-up year for glacier-front measurements. Data: http://glacier.nve.no/glacier/viewer/ci/no/.
Glacier mass balance variations in western Scandinavia during the late 20th and early 21st centuries have been associated with the interannual and decadal variations in the North Atlantic Oscillation (NAO) during the winter (accumulation) season (e.g. Nesje et al., 1995, 2000; Reichert et al., 2001; , Six et al., 2001; Andreassen et al., 2012; Chinn et al., 2005; Nesje, 2009; Nesje and Matthews, 2012; Stokes et al., 2018; Winkler et al., 2009; Winsvold et al., 2014). Winters with positive NAO index provide above normal amounts of snow on the glaciers (winter accumulation/balance). If the following mean summer temperature is below normal, this commonly yields positive annual mass balance on the maritime glaciers in western Norway. Negative NAO index winters followed by warm summers, in contrast, have the opposite effect on the surface annual glacier mass balance. A regression analysis between the specific annual balance (Ba) and the specific winter balance (Bw)/summer balance (Bs) on 10 Norwegian glaciers shows that the Ba on the maritime glaciers is mostly associated with the Bw (winter balance/accumulation associated with NAO winter index), whereas the surface specific annual mass balance on the continental glaciers is mostly controlled by the Bs (summer balance/ablation; Figure 7).
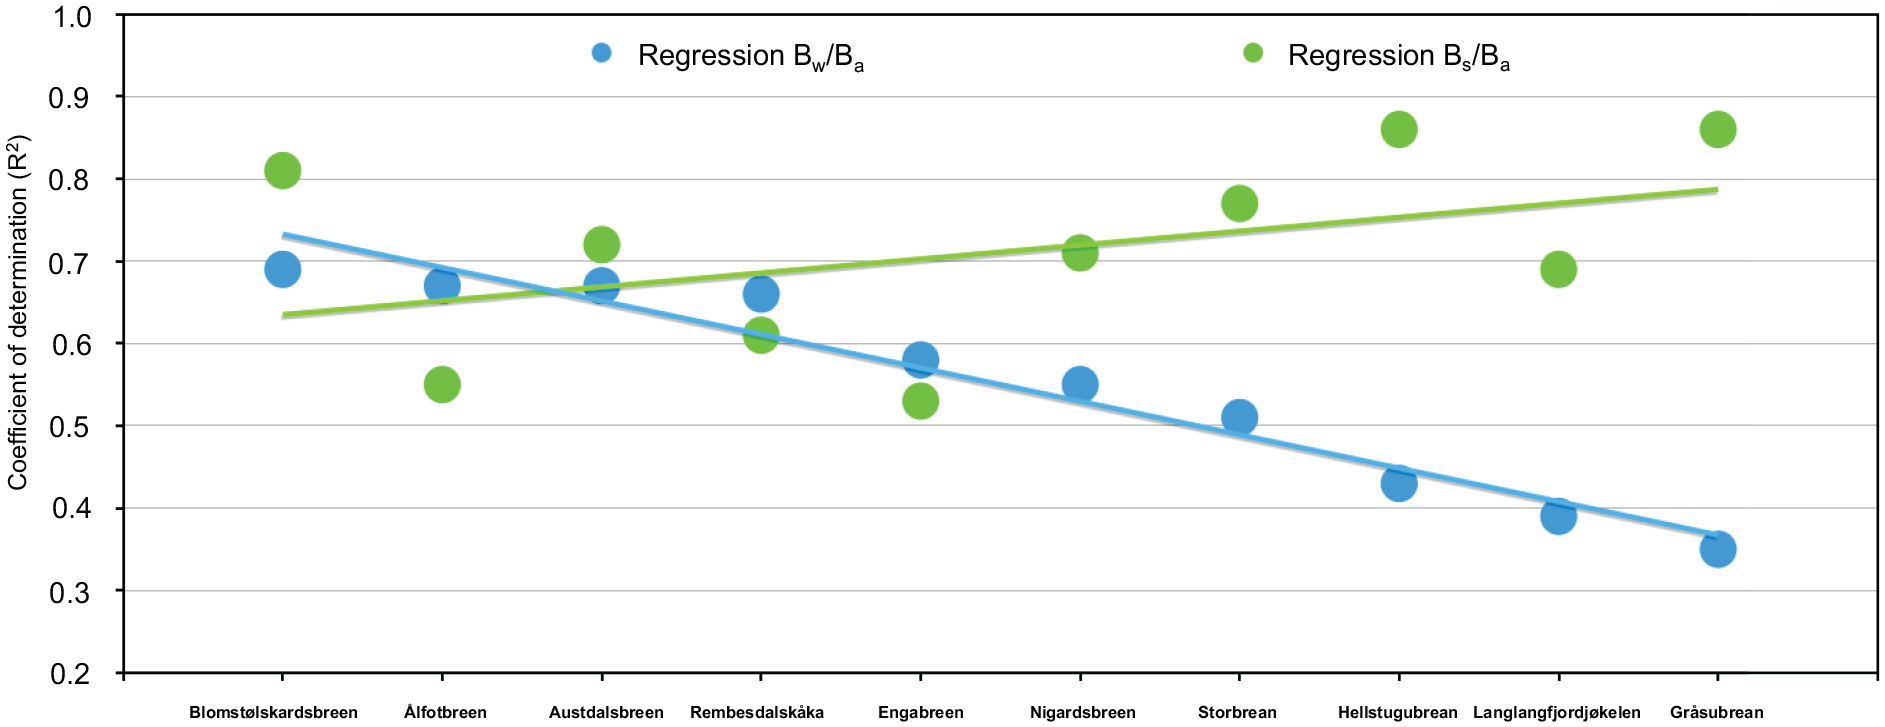
Correlation (coefficient of determination – R2) between winter balance (Bw) and annual balance (Ba), and between summer balance (Bs) and annual balance (Ba) on the glaciers used in this study (glacier mass balance data: http://glacier.nve.no/glacier/viewer/ci/no/).
Methodology
From climate indices to glacier mass balance
Linear regression was applied to correlate records of gridded precipitation data for the accumulation season 1 October-30 April (7 months) [percent deviation from the 1991 to 2020 normal (normal = 100%)] and gridded mean temperature data (oC deviation from the 1991 to 2020 normal) for the ablation season 1 May-30 September (5 months) (met.no) for the regions [Western Norway (‘Vestlandet’), Eastern Norway (‘Østlandet’) and Northern Norway (‘Nord-Norge’) with mass-balance records of 10 glaciers (Western Norway: Ålfotbreen, Nigardsbreen (Jostedalsbreen), Austdalsbreen (Jostedalsbreen), Rembesdalskåka (Hardangerjøkulen), Blomstølskardsbreen (Søndre Folgefonna), Eastern Norway: Storbrean, Hellestugubrean, Gråsubrean, Northern Norway: Engabreen (Vestre Svartisen), Langfjordjøkelen) (http://glacier.nve.no/glacier/; Kjøllmoen et al., 2021) (Figure 1, Table 2).
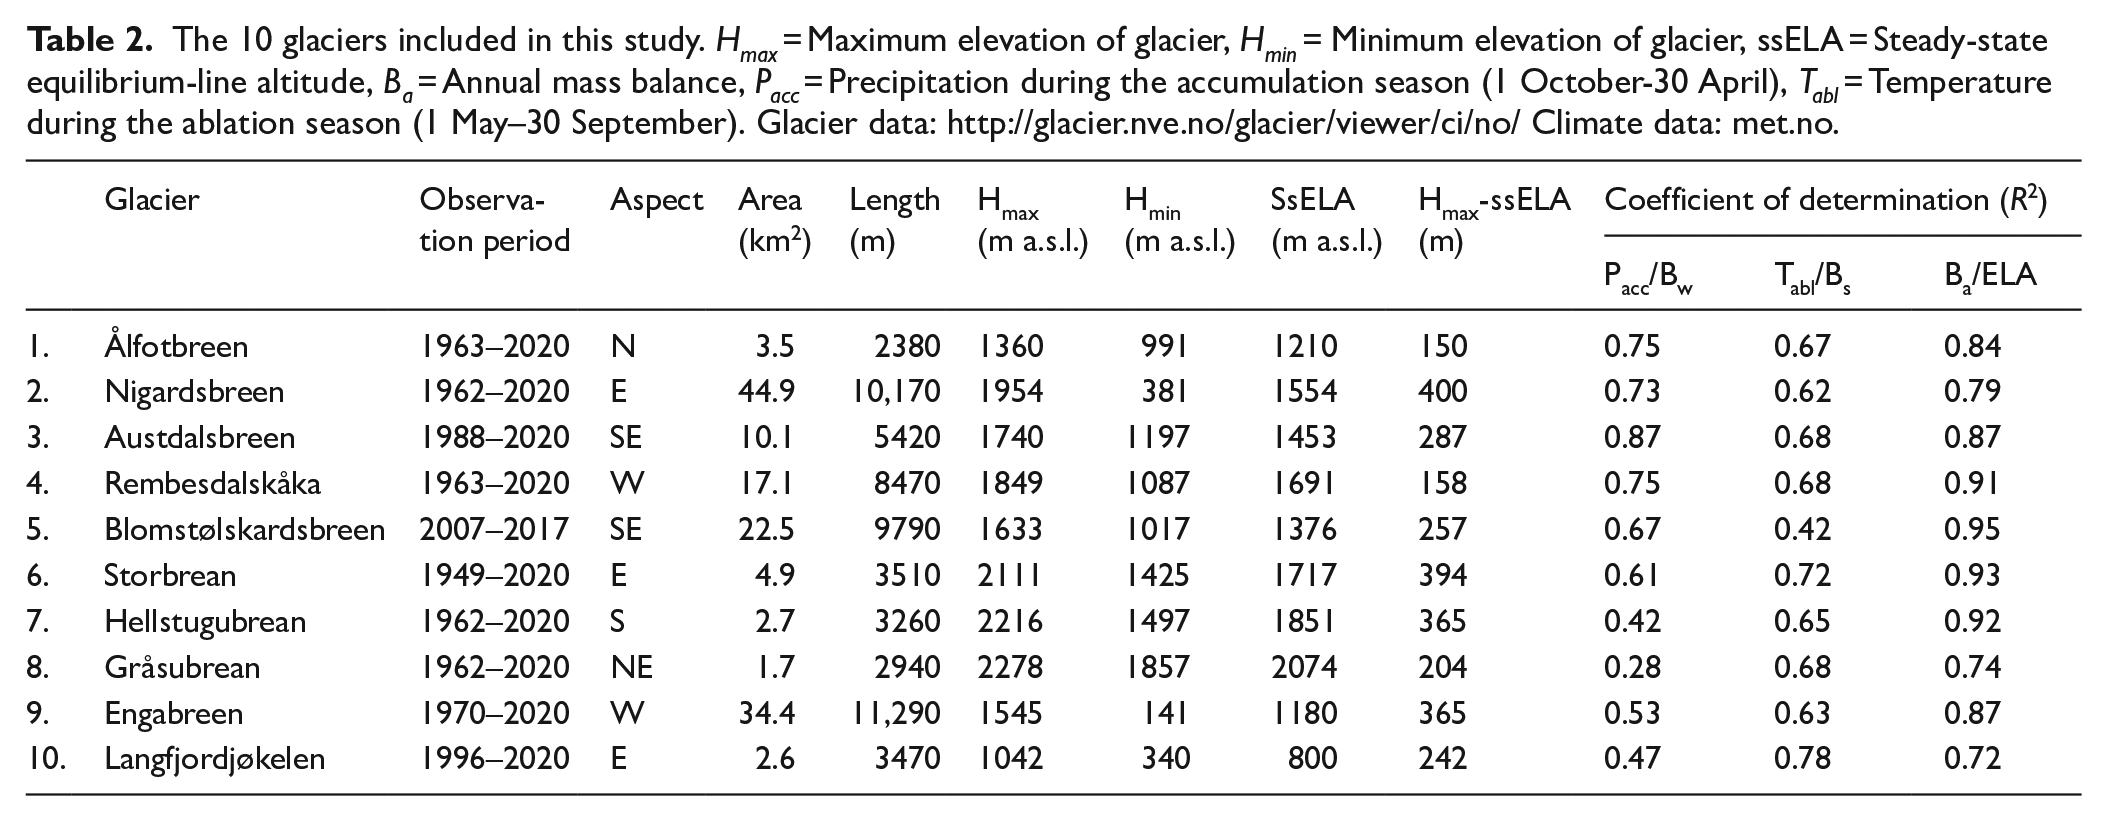
The 10 glaciers included in this study. Hmax = Maximum elevation of glacier, Hmin = Minimum elevation of glacier, ssELA = Steady-state equilibrium-line altitude, Ba = Annual mass balance, Pacc = Precipitation during the accumulation season (1 October-30 April), Tabl = Temperature during the ablation season (1 May–30 September). Glacier data: http://glacier.nve.no/glacier/viewer/ci/no/ Climate data: met.no.
To study the possible future effects of changes in winter precipitation and summer temperature in the different regions in Norway on the specific surface glacier mass balance and equilibrium-line altitude (ELA) changes on the glaciers included in this study, future scenarios for winter precipitation and summer temperature from 1971 to 2000 to 2071 to 2100; Climate Profiles from the Norwegian Climate Service Centre (‘Klimaprofiler’: Sogn og Fjordane, Hordaland, Oppland, Nordland, and Finnmark) were converted to specific winter balance (Bw), summer balance (Bs), and annual balance (Ba).
Estimation of future development of the study glaciers
To estimate the future development of the 10 study glaciers (Table 2), modern climate and surface mass-balance relationships were established. Table 2 shows correlations (R2) between gridded mean regional meteorological data of precipitation (in percent deviation from the 1991 to 2020 normal) during the accumulation season (1 October–30 April) (Pacc) (data: met.no) and observed specific winter balance (Bw) on the individual glaciers (data: http://glacier.nve.no/glacier/viewer/ci/no/); correlations (R2) between mean gridded temperature during the ablation season (1 May–30 September) (Tabl) (data: met.no) and observed specific summer balance (Bs) on the individual glaciers (data: http://glacier.nve.no/glacier/viewer/ci/no/), and finally correlation (R2) between the specific annual mass balance (Ba) and the equilibrium-line altitudes (ELAs) (data: http://glacier.nve.no/glacier/viewer/ci/no/) on the 10 individual glaciers.
Below are correlations (R2) based on linear regression and formulas describing the relationship between average gridded regional meteorological data of accumulation-season (1 October–30 September) precipitation (in percent deviation from the 1991 to 2020 normal) (Pacc) (data: met.no) and observed specific winter balance (Bw) on the 10 individual glaciers (data: http://glacier.nve.no/glacier/viewer/ci/no/), correlations between mean gridded ablation-season (1 May-30 September) temperatures (Tabl) (data: met.no) and observed specific summer balance (Bs) on the individual glaciers (data: http://glacier.nve.no/glacier/viewer/ci/no/), and finally correlations between the specific annual balance (Ba) and the equilibrium-line altitude (ELA) on the individual glaciers (data: http://glacier.nve.no/glacier/viewer/ci/no/).
Ålfotbreen
Pacc ‘Vestlandet’/Bw: y (Bw) =0.0354× + 0.2555 (R2 = 0.75)
Tabl ‘Vestlandet’/Bs: y (Bs) =−0.9071× − 4.0277 (R2 = 0.67)
Ba/ELA: y (ELA) = 132.84× + 1210.5 (R2 = 0.84)
Nigardsbreen (Jostedalsbreen)
Pacc ‘Vestlandet’/Bw: y (Bw) =0.0185x + 0.4767 (R2 = 0.73)
Tabl ‘Vestlandet’/Bs: y (Bs) =−0.676x − 2.394 (R2 = 0.62)
Ba/ELA: y (ELA) = -163.5x + 1553.7 (R2 = 0.79)
Austdalsbreen (Jostedalsbreen)
Pacc ‘Vestlandet’/Bw: y (Bw) = 0.0238x − 0.2492 (R2 = 0.87)
Tabl ‘Vestlandet’/Bs: y (Bs) =−0.7039x − 2.6529 (R2 = 0.68)
Ba/ELA: y (ELA) =−148.48x + 1452.9 (R2 = 0.87)
Rembesdalskåka (Hardangerjøkulen)
Pacc ‘Vestlandet’/Bw: y (Bw) =0.025x − 0.2979 (R2 = 0.75)
Tabl ‘Vestlandet’/Bs: y (Bs) = −0.7013x − 2.3965 (R2 = 0.68)
Ba/ELA: y (ELA) = -109.97x + 1690.6 (R2 = 0.91)
Blomstølskardsbreen (Søndre Folgefonna)
Pacc ‘Vestlandet’/Bw: y (Bw) = 0.0202x + 0.6432 (R2 = 0.67)
Tabl ‘Vestlandet’/Bs: y (Bs) = −0.651x − 2.7096 (R2 = 0.42)
Ba/ELA: y (ELA) = −136.85x +1375.8 (R2 = 0.95)
Storbrean
Pacc ‘Vestlandet’/Bw: y (Bw) =0.0119x +0.3146 (R2 = 0.61)
Tabl ‘Østlandet’/Bw: y (Bs) =−0.5578x − 2.0286 (R2 = 0.72)
Ba/ELA: y (ELA) =-174.92x + 1716,8 (R2 = 0.93)
Hellstugubrean
Pacc ‘Vestlandet’/Bw: y (Bw) = 0.0073x +0.4045 (R2 = 0.42)
Tabl ‘Østlandet’/Bs: y (Bs) = −0.5331x − 1.7199 (R2 = 0.65)
Ba/ELA: y (ELA) =−194.21x + 1850.5 (R2 = 0.92)
Gråsubrean
Pacc ‘Østlandet’/Bw: y (Bw) =0.0063× + 0.1242 (R2 = 0.28)
Tacc ‘Østlandet’/Bs: y (Bs) =−0.535×− 1.361 (R2 = 0.68)
Ba/ELA: y (ELA) =-196.31×+2073.6 (R2 = 0.74)
Engabreen (Vestre Svartisen)
Pacc ‘Nord-Norge’/Bw: y (Bw) =0.0297×+0.1708 (R2 = 0.53)
Tabl ‘Nord-Norge’/Bs: y (Bs) =−0.6552×− 2.8229 (R2 = 0.63)
Ba/ELA: y (ELA) =-154.74×+1180 (R2 = 0.87)
Langfjordjøkelen
Pacc ‘Nord-Norge’/Bw: y (Bw) =0.0177×+0.2663 (R2 = 0.47)
Tabl ‘Nord-Norge’/Bs: y (Bs) =−0.782×− 2.9528 (R2 = 0.78)
Ba/ELA: y (ELA) =-164.29×+799.58 (R2 = 0.72)
Climate index
Nesje (2005) and Nesje and Matthews (2012) used records (standardised/normalised values) of mean winter (Dec.–Feb.)/accumulation-season (Oct.-Apr.) precipitation (Pw/Pacc) and mean summer (Jun.–Aug.)/ablation season (May–Sep.) temperature (Ts/Tabl) from representative meteorological stations to provide indices of Pw/Pacc and Ts/Tabl and their combined effect (indicators of the annual surface mass balance). Therefore, the climate index (sum of Pw/Pacc and Ts/Tabl indices) indicates periods favourable for positive/negative annual mass balance and thus indicates periods that are favourable for positive and negative surface glacier mass balance, and subsequent glacier advance or retreat, respectively. The same approach has been applied in this paper to test how well the gridded, regional (‘Vestlandet’, ‘Østlandet’, ‘Nord-Norge’) data of Pacc and Tabl correlate with the measured specific winter and summer mass balance, respectively, of the 10 glaciers included in this study. The regional precipitation data for the accumulation season (percent deviation from the 1991 to 2020 normal = 100%) (Pacc) and mean temperatures for the ablation season (Tabl) for for Western Norway (‘Vestlandet’), Eastern Norway (‘Østlandet’) and Northern Norway (‘Nord-Norge’) (data: met.no) for the period 1961–2020 were converted into climate indices by standardising/normalising the regional meteorological data, giving periods favourable for positive and negative glacier mass, respectively) in the three regions. The standardisation/normalisation procedure included to (1) subtract the annual mean values (Xann) of Pacc and Tabl from the mean value (Xmean) for the period 1960–2020 (overlapping with the glacier mass balance data), and (2) divide by the standard deviations (STD) of both data sets [(Xmean − Xann)/STD]. The climate index is the sum of the standardised/normalised annual values of Pacc and Tabl. For further details regarding the procedure, see Nesje (2005) and Nesje and Matthews (2012).
Results
Simulation of glacier development in the 21st century
To estimate the future development of the
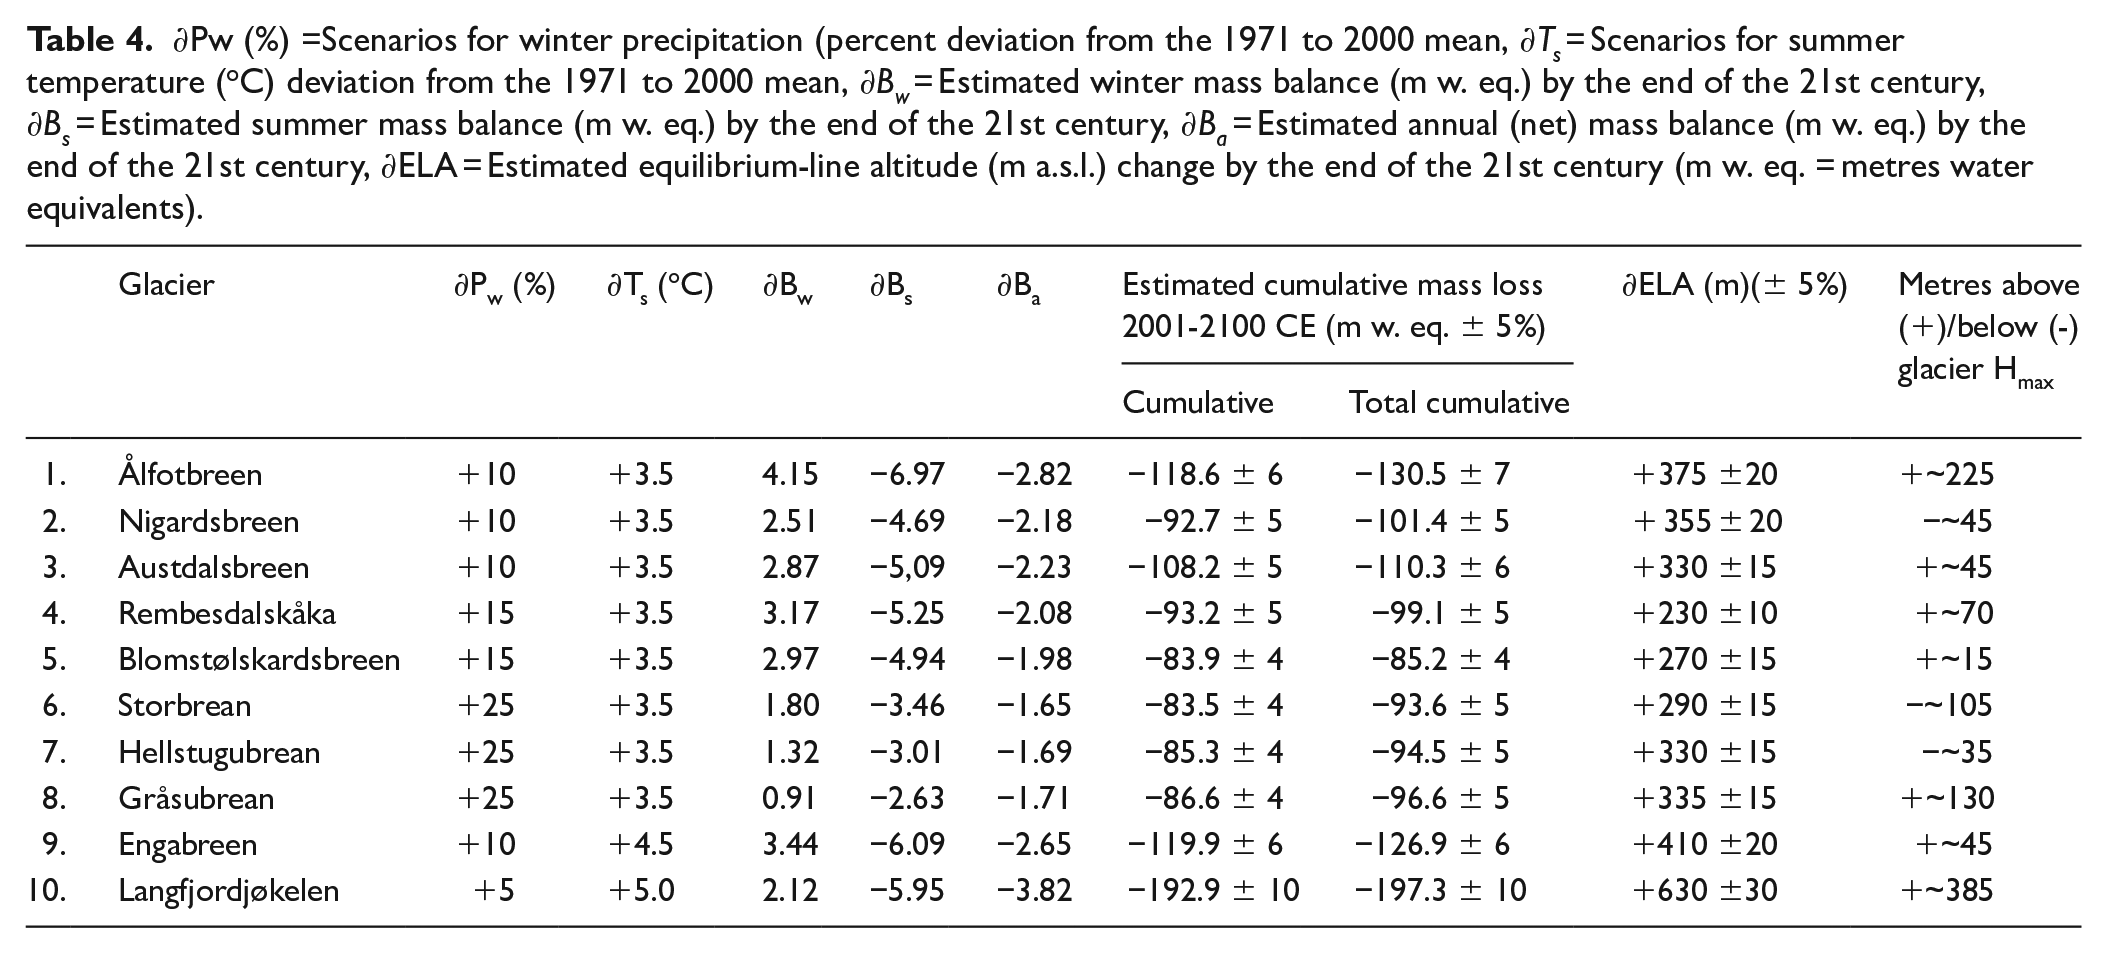
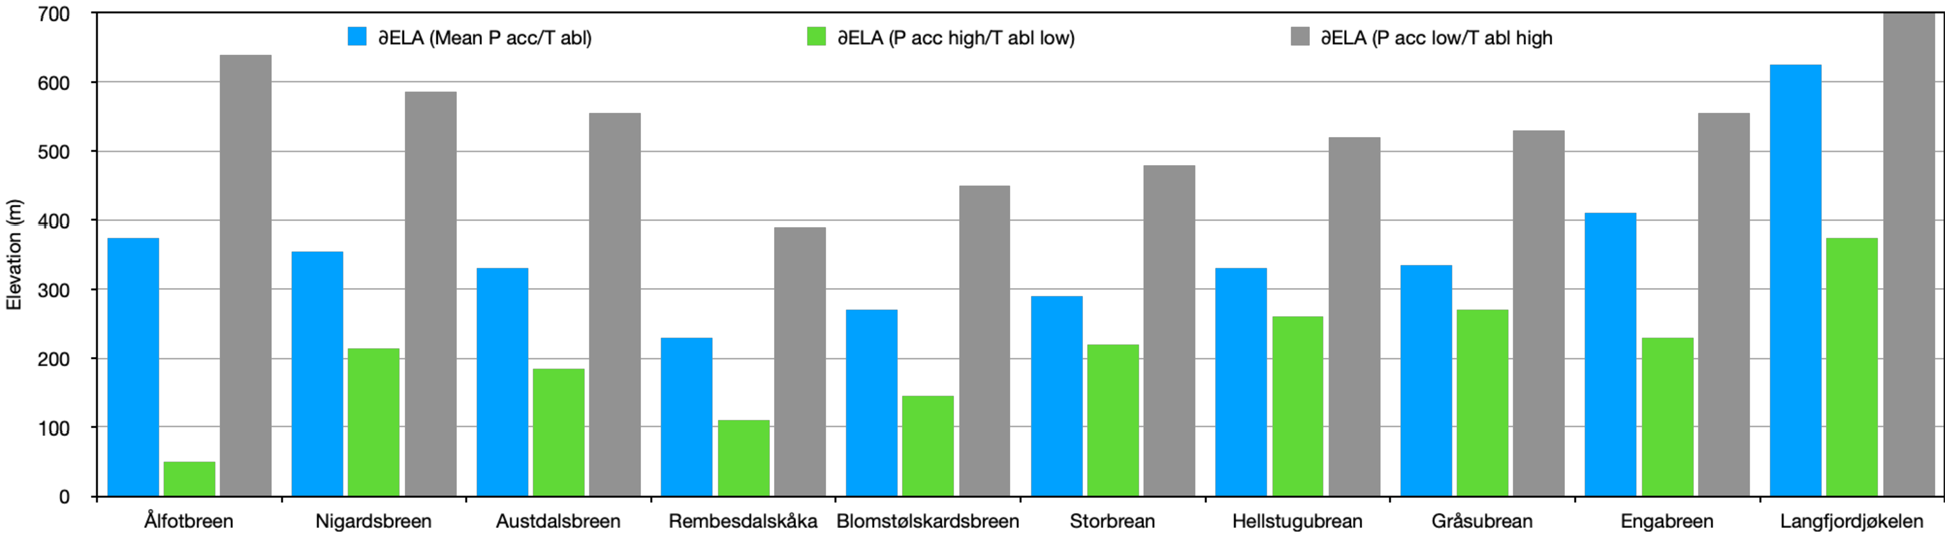
∂Pw (%) =Scenarios for winter precipitation (percent deviation from the 1971 to 2000 mean, ∂Ts = Scenarios for summer temperature (oC) deviation from the 1971 to 2000 mean, ∂Bw = Estimated winter mass balance (m w. eq.) by the end of the 21st century, ∂Bs = Estimated summer mass balance (m w. eq.) by the end of the 21st century, ∂Ba = Estimated annual (net) mass balance (m w. eq.) by the end of the 21st century, ∂ELA = Estimated equilibrium-line altitude (m a.s.l.) change by the end of the 21st century (m w. eq. = metres water equivalents).
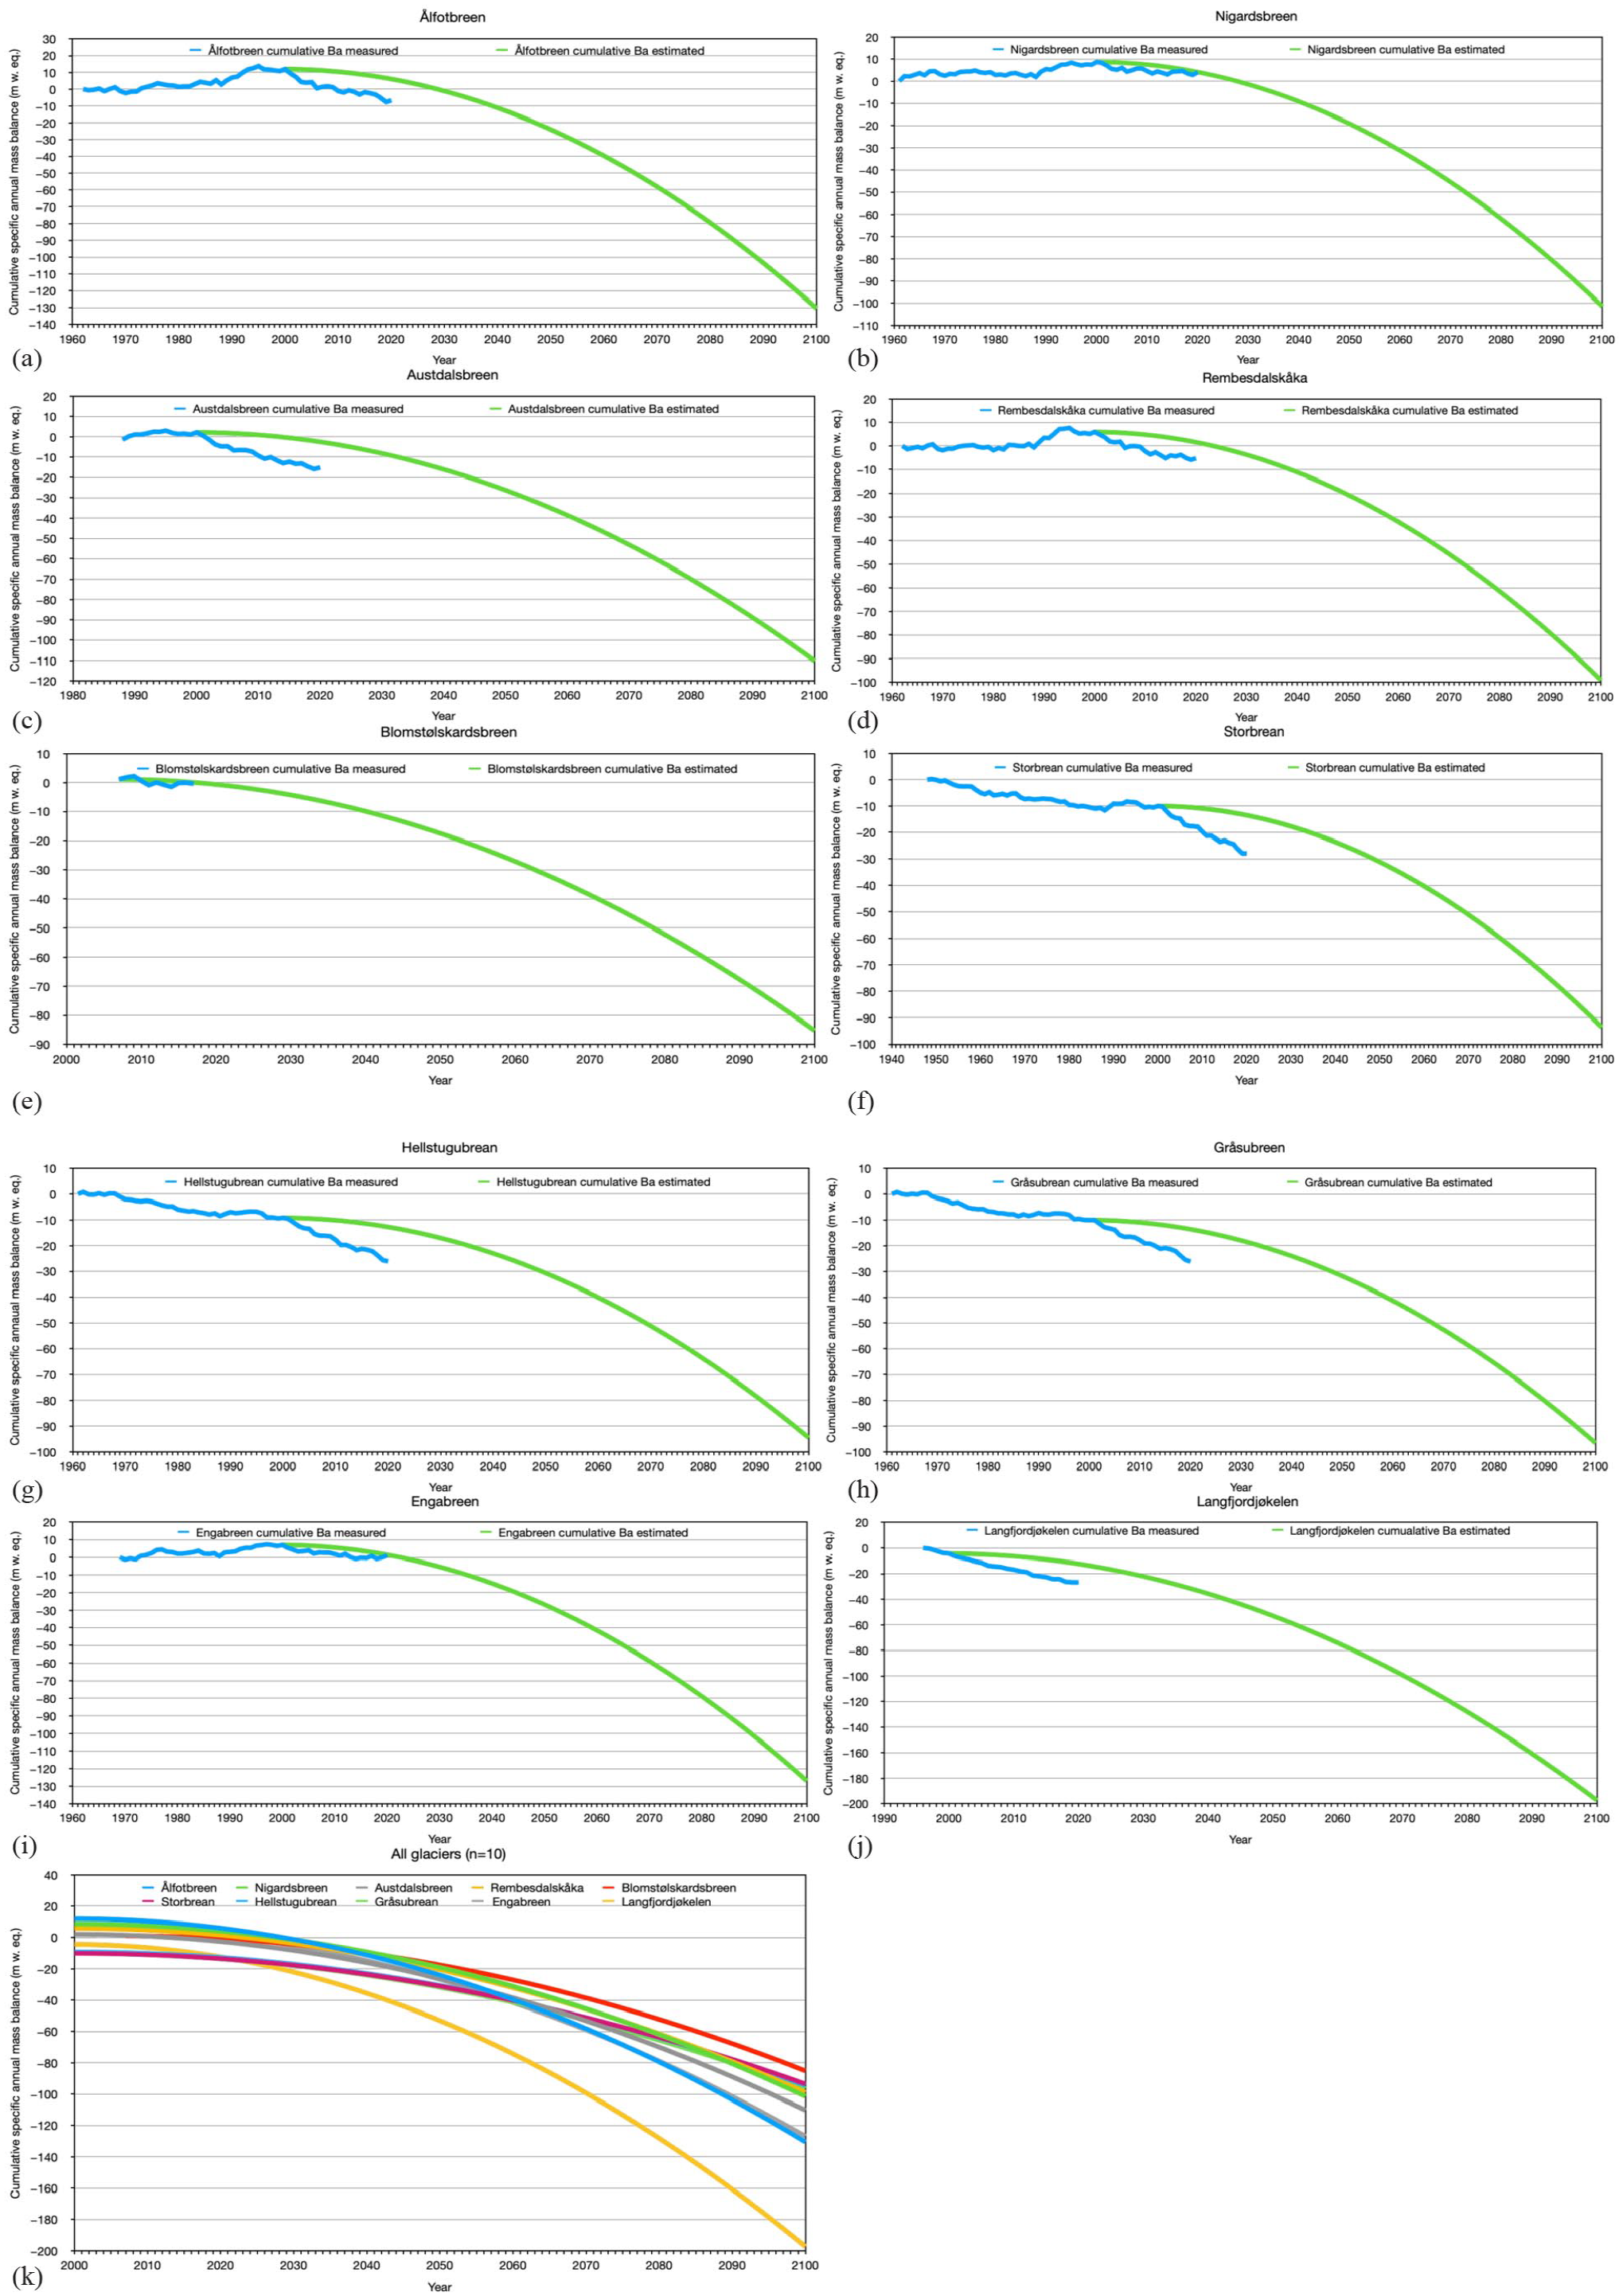
Cumulative observed (for observation periods, see Table 2, glacier data: http://glacier.nve.no/glacier/viewer/ci/no/) and trend lines displaying cumulative simulated (2000–2100 CE) annual mass balance (m w. eq.) for the 10 glaciers included in this study. a) Ålfotbreen. b) Nigardsbreen. c) Austdalsbreen. d) Rembesdalskåka. e) Blomstølskardsbreen. f) Storbrean. g) Heillstugubrean. h) Gråsubrean. i) Engabreen. j) Langfjorjøkelen. k) All glaciers.
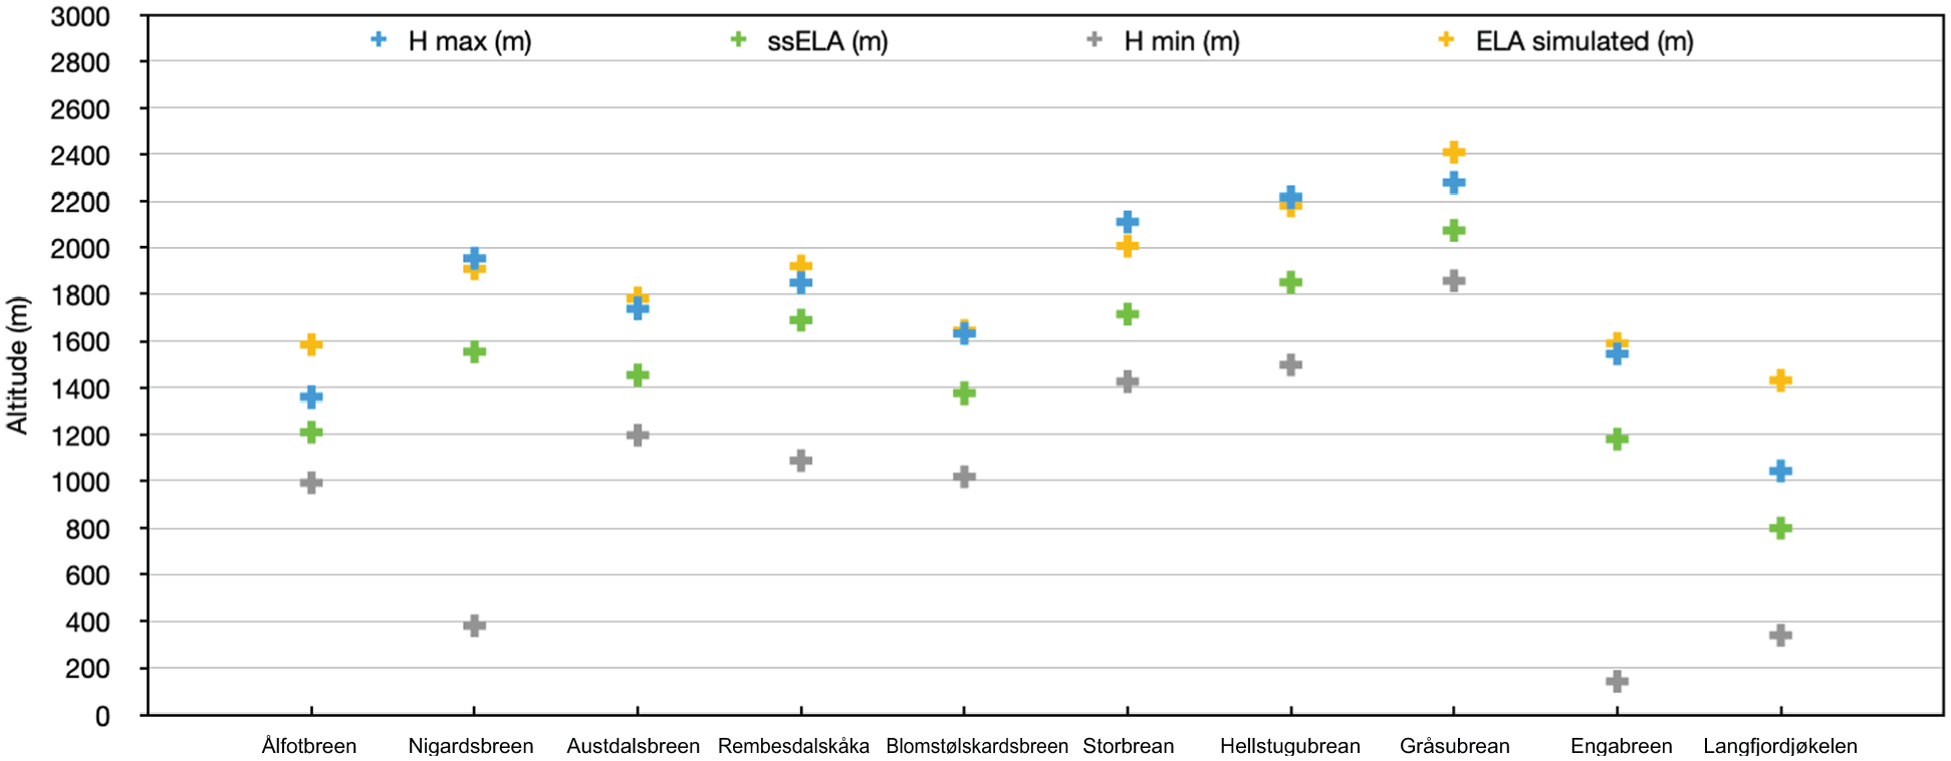
Maximum glacier elevation (H max), steady-state equilibrium-line altitude (ssELA), minimum glacier elevation (H min) and simulated equilibrium-line altitude (ELA) with the mean climate scenarios (for details, see text) for the 10 glaciers included in this study (glacier data: http://glacier.nve.no/glacier/viewer/ci/no/).
The future development of
The future development of
To estimate the future development of
To estimate the future development of
To assess the future development of
Concerning the development of the
To estimate the future development of
The future development of
To estimate the future development of the
Climate index
To test how well the gridded regional data of Pacc and Tabl correlate with the measured mass balance of the 10 glaciers included in this study, the specific winter balance (Bw) on the study glaciers (annual glacier mass balance data: http://glacier.nve.no/glacier/viewer/ci/no) was correlated (linear regression) with the gridded, standardised/normalised mean Pacc from the respective regions, whereas the specific summer mass balance (Bs) on the study glaciers was correlated with the gridded, standardised/normalised mean Tabl in the respective regions (meteorological data: met.no, mass-balance data: nve.no/bre). The annual glacier mass balance (Ba) was then correlated with the climate index (sum of the standardised/normalised Pacc and Tabl for the three regions). In Figure 12, the climate index from ‘Vestlandet’ (Western Norway) is plotted together with the annual mass balance of Nigardsbreen. The climate index data show highest correlation with the annual mass balance on Nigardsbreen (R2 = 0.74) and Storbrean in western Jotunheimen (R2 = 0.72) and lower correlation with the mass balance on Gråsubrean in eastern Norway and Engabreen in Northern Norway (R2 = 0.59 and 0.62), respectively.
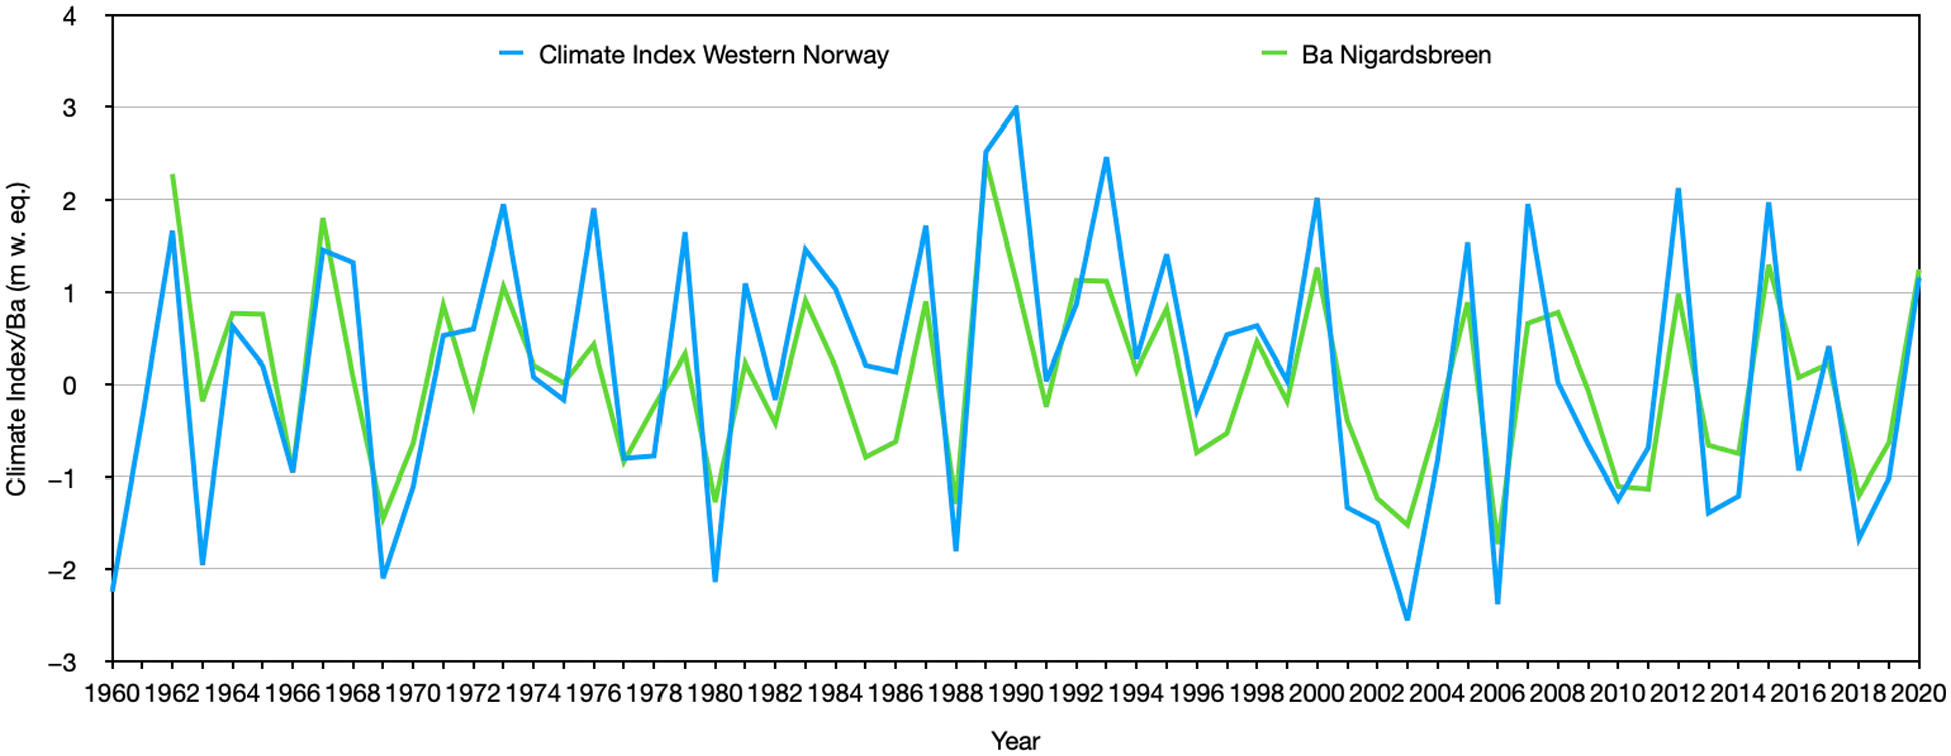
The climate index for ‘Vestlandet’ (Western Norway) 1962–2020 CE plotted together with the annual mass balance of Nigardsbreen (R2 = 0.74). Climate data: met.no. Mass balance data: http://glacier.nve.no/glacier/viewer/ci/no/.
Discussion
Observations and model simulations have demonstrated that glaciers are sensitive to short-term (annual to decadal) weather fluctuations and more long-term (centennial to millennial) climate changes (e.g. Oerlemans, 2001), particularly winter precipitation/accumulation (as snow and wind redistribution of snow) and summer temperature (causing ablation). Glacier ablation is a rather complex process, the amount of ablation mainly depending on the total energy available for melt (e.g. Oerlemans, 2001), the energy balance at the glacier surface being the result of shortwave (incoming) and longwave (outgoing) radiation, and turbulent heat fluxes (sensible and latent heat). Turbulent heat fluxes have the largest effect for ablation on the maritime glaciers in western Norway, whereas solar radiation has the largest effect on inland, continental glaciers in central southern Norway (Andreassen et al., 2008).
The length, area, and volume reduction and frontal retreat of mountain glaciers and ice caps observed globally, including Scandinavia and in particular Norway, especially subsequent to 2000 CE, have been interpreted to be linked to the global, regional, and local temperature increase (e.g. Lemke et al., 2007). During the past 20 years, about 270 billion tons of ice have melted, contributing to about half of the average, annual sea-level rise of ~3.5 mm. The future development of Norwegian glaciers does not only depend on future changes in summer temperatures and winter precipitation, the fraction of precipitation falling as snow or rain on the glaciers, and the length of the ablation season, but also on large-scale atmospheric circulation (e.g. Andreassen and Oerlemans, 2009).
The overlapping period of the observed, cumulative annual mass balance curves and the trend lines displaying the estimated future changes in the annual mass balance (Figure 9a–j) shows that the observed mass loss is greater than the estimated changes on Ålfotbreen, Austdalsbreen, Rembesdalskåka, Storbrean, Hellstugubrean, Gråsubrean, and Langfjordjøkelen. This indicates that the future mass loss may be underestimated, and that the glacier demise may occur earlier than indicated in these simulations. The simulation of future mass balance development of Rembesdalskåka is coherent with modelling results by Giesen and Oerlemans (2010) and Åkesson et al. (2017), Andreassen and Oerlemans (2009) modelled the sensitivity of long-term summer and winter balances of Storbrean. For the years 1924/1925–1948/1949, their analyses indicated a cumulative mass loss of c. 30 m water equivalents mainly a result of the combined effect of negative summer mass balances and lower winter mass balances than the average for the period 1949–2006. A ± 1°C change in air temperature would result in a change in the specific mass balance of ±0.55 m w. eq., and a ± 10% increase in precipitation would cause a change of ±0.20 m w. eq. Finally, their model simulation for a 2°C warming, the ablation season at Storbrean would be extended by approximately 30 days. The observed mass loss on the remaining glaciers (Nigardsbreen, Blomstølskardsbreen, and Engabreen), has followed the estimated trend lines in the period 2000–2020 CE.
Glaciers that have small elevation intervals between the top of the glacier (Hmax) and the steady-state ELA (ssELA) are more sensitive to a rise in the ELAs than glaciers that have larger elevation ranges. In addition, changes in the glacier geometry, volume, and thickness will also influence on future glacier changes. The climate scenarios/projections for Norway towards the end of the 21st century (the Norwegian Climate Service Centre) indicate not only a rise in summer temperatures, but also during the shoulder seasons spring and autumn. The simulated increase in winter precipitation (accumulation season), has been estimated to have a significantly less impact on the surface glacier mass balance than the rise in the ablation-season temperatures (Giesen and Oerlemans, 2010; Nesje et al., 2008). If more ice-marginal lakes are formed when the glacier termini retract, ice dynamics, such as higher glacier velocities and frontal calving, may accelerate the glacier length, area and volume reduction. Of the 10 glaciers included in this study, only Austdalsbreen is presently calving into a lake.
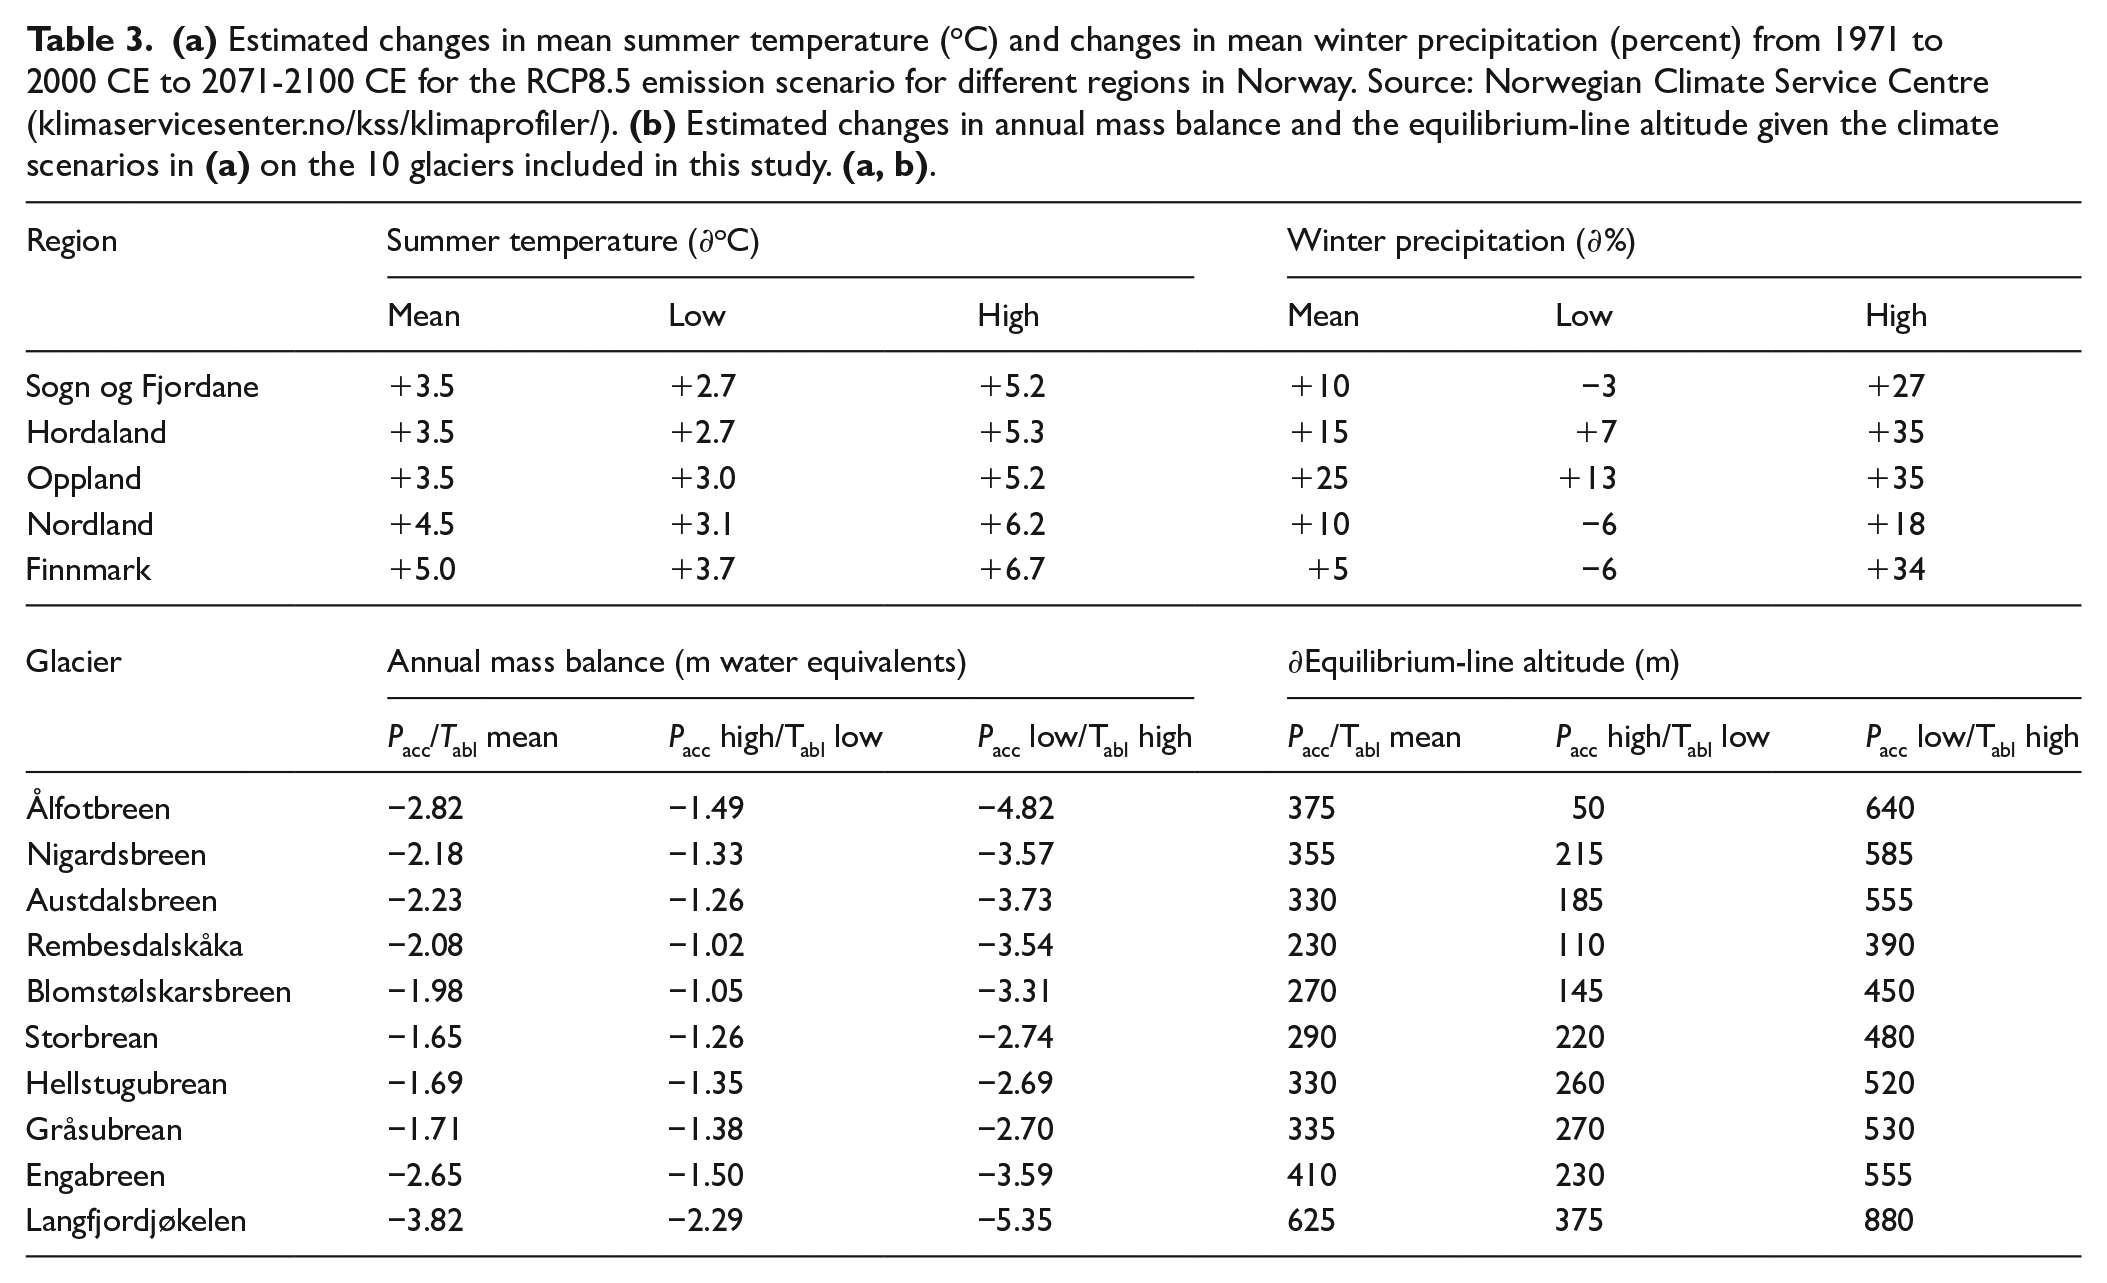
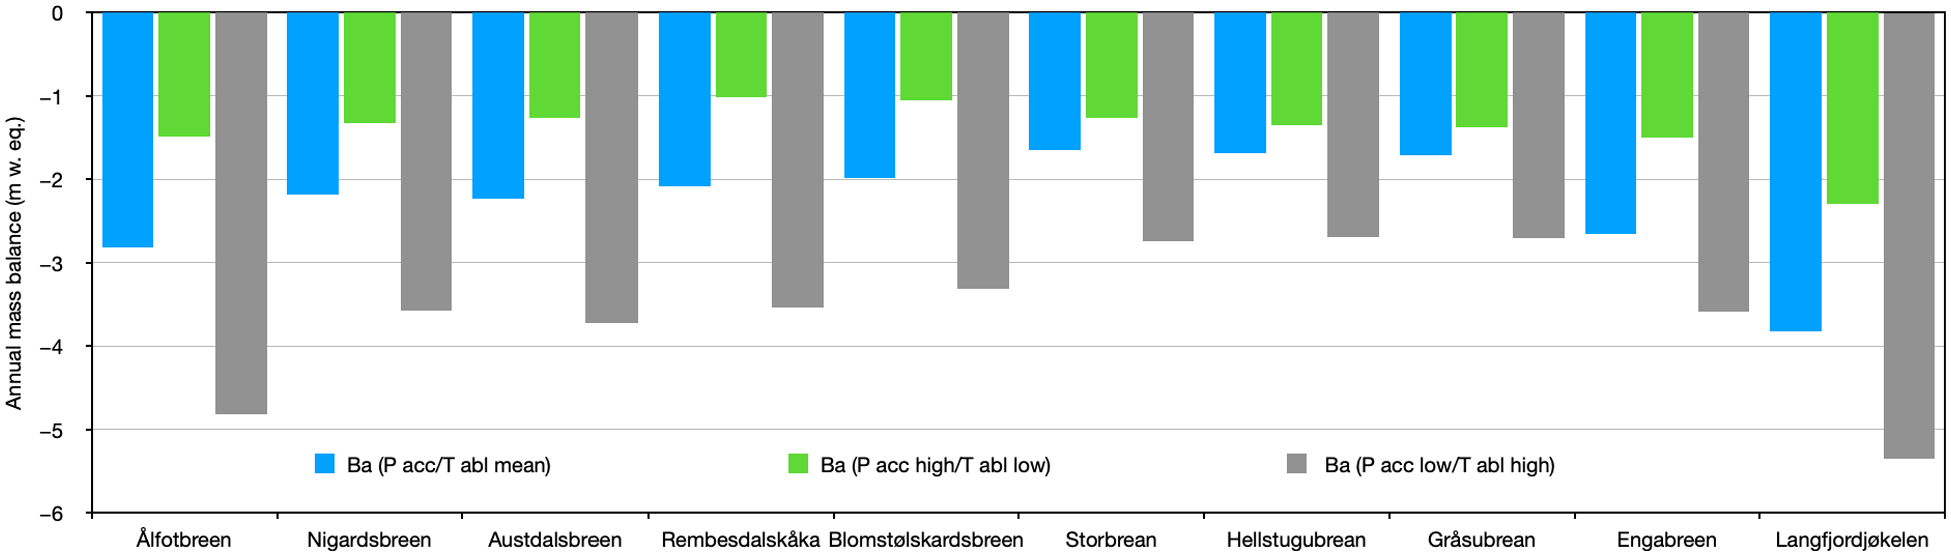
The scenarios for changes in winter precipitation (∂Pw, in percent) and summer temperature (∂Ts, in °C) (mean, high and low estimates) between 1971 and 2000 and 2071 and 2100 CE from the Norwegian Climate Service Centre (‘Klimaprofiler’) (Table 3) yield significantly different estimates for changes in specific winter (Bw), summer (Bs), annual mass balance (Ba), and equilibrium-line altitudes (ELAs) for the different climate scenarios (see Table 3b, Figures 10 and 11). Such large differences between mean, high, and low climate estimates make it challenging to provide precise estimates of future mass balance and equilibrium-line altitude changes on Norwegian glaciers.
Studies of Holocene glacier variations in Norway, synthesised by Nesje et al. (2008) and Nesje (2009) show that almost all glaciers in Norway were melted away during the Holocene thermal maximum ~7600-6000 cal. yr BP, when the mean summer temperatures have been estimated from biological proxies to have been 1.5°C–2.0°C higher than the 1961–1990 normal. With the given climate scenarios for the late 21st century, this is likely to occur again within the coming century. From the observed glacier length and area reduction in Norway over the last decades, this may occur from about 2070 CE and onwards.
The projected mass loss, ELA rise, and accompanied reductions in glacier size and volume may have significant consequences for the hydrology in glacier meltwater streams and glacier-fed lakes, hydropower production in glacier catchments, wildlife, aquatic and terrestrial ecosystems, glacier-related hazards [glacier avalanches/calving from glacier fronts and glacier outburst floods (jökulhlaups)], and tourism.
Conclusion
Estimated changes in mean winter precipitation and mean summer temperature from 1971 to 2000 to 2071 to 2100 for the RCP8.5 emission scenario for for five regions with 10 glaciers with mass balance series in Norway (Norwegian Climate Service Centre) used in this study range between +3.5°C and +5.0°C, and between +5% and +25%, respectively.
These climate scenarios indicate a total cumulative surface glacier mass loss in the range of -85.2 ± 4 (Blomstølskardsbreen) to -197.3 ± 10 m water equivalents (Langfjordjøkelen) between 2000 and 2100 CE.
Estimated changes in the glacier ELAs with the given climate scenarios for the different regions, suggest that 7 of the 10 glaciers included in this study [Ålfotbreen, Austdalsbreen (part of Jostedalsbreen), Rembesdalskåka (part of Hardangerjøkulen), Blomstølskardsbreen (part of Søndre Folgefonna), Gråsubrean, Engabreen, and Langfjordjøkelen] may be strongly contracted or totally melted by the end of the 21st century.
The anticipated glacier demise will most likely have significant consequences for glacier hydrology, hydropower production in glacier catchments, wildlife, ecosystems, glacier-related hazards, and tourism.
Footnotes
Acknowledgements
I thank John A. Matthews who suggested several improvements of an early version of the manuscript. I also want to express my gratitude to Jostein Mamen at the Meteorological Institute in Oslo who provided regional, gridded precipitation and temperature data for Norway. Finally, I thank two anonymous reviewers for constructive comments and suggestions of how to improve the paper.
Correction (July 2023):
Article updated online to correct Figures 6 and 7. The figures have been re-positioned to correspond correctly with their captions.
Funding
The author received no financial support for the research, authorship, and/or publication of this article.