
Abstract
An isolated sugar maple (Acer saccharum Marsh.) stand is located in the boreal forest of Abitibi, about 75 km beyond its present northern range limit. When did this relatively thermophilous tree species establish after ice retreat? Were its populations more abundant than now sometimes in the past? If so, when and how did they expand then retracted? How did the species persist in boreal forest over time? What could have been the role of fire on this stand? To answer those questions, we reconstructed the postglacial fire and vegetation history from three lacustrine sediment sequences distributed along a c. 180 km latitudinal transect from southern boreal forests to the northern portion of deciduous forests. From north to south, those are lakes Labelle, Chasseur and Fur. We explored a procedure based on pollen accumulation rates in order to detect the probable presence of sugar maple within the lakes’ watershed. The procedure successfully indicates a sugar maple establishment c. 7800–5100 cal. BP at Fur, 5500–4400 cal. BP at Chasseur and c. 4000–2700 cal. BP at Labelle, in the north. At Fur, the subsequent sugar maple expansion happened 1 to 2 thousand years after establishment, during colder and moister climatic conditions favoring Pinus strobus L. replacement by Betula spp. c. 6000–5000 cal. BP. Sugar maple establishment, persistence or expansion is apparently not linked to a change in fire activity at Fur and Chasseur, but at Labelle, the species was more abundant during periods of shorter fire return intervals from 2000 to 500 years ago. Our study suggests that northern (Chasseur and Labelle) sugar maple establishment and possible expansion was probably more controlled by a complex interaction of inhibition and facilitation dynamics than by climate alone, a process reliant on the dominant vegetation’s composition and structure.
Keywords
Introduction
During the Holocene, the landscape of western Quebec underwent major changes with the recession of the Laurentide Ice sheet between 12,000 and 9000 cal. BP, the final draining of the large proglacial lake Agassiz-Ojibway around 8200 cal. BP (Dyke et al., 2003; Veillette, 1996) and the variations in climate conditions (Bajolle et al., 2018, 2019; Fréchette et al., 2018; Viau and Gajewski, 2009). Associated with these large-scale changes, other variations occurring at much smaller scales such as soil formation (Moore, 1978), natural disturbances (Bergeron et al., 2004, 2014; Blarquez and Aleman, 2016; Carcaillet et al., 2001), and interspecific interactions (Cavard et al., 2011; Collin et al., 2017a, 2017b, 2018) developed throughout the Holocene. All those factors contributed to the establishment, expansion or contraction processes that shaped the various species geographical range and eventually led for many to the emergence of marginal populations (Sexton et al., 2009).
The central part of a species’ geographical range usually shows higher abundance and dominance, which tend to decrease along latitudinal, longitudinal or altitudinal gradients (Brown et al., 1996). At the margin of those gradients, populations are more fragmented, isolated and potentially located further than the normal dispersal capacity of the species (Brown et al., 1996; Gaston, 2003). These isolated populations, or marginal populations, may result from (i) a successful recent establishment through long-distance dispersal, or (ii) the retraction from a formerly larger range (Gaston, 2003). In both scenarios, the very existence of marginal populations is proof that abiotic conditions such as climate and soils were conducive to the population’s establishment and survival, but also indicative that biotic variables like interspecific competition and natural disturbances or lack of time prevented the species to form larger populations.
Throughout the Holocene, several tree species such as white pine (Pinus strobus L.) and yellow birch (Betula alleghaniensis Britton), both considered as thermophilous in the phytogeographical context of north western Québec, apparently formed northern and possibly larger populations during a warmer period of the Middle Holocene (8200–4200 cal. BP) known as the Holocene Thermal Maximum (HTM, c. 8000–5000 cal. BP) according to Larochelle et al. (2018) and Terasmae and Anderson (1970). Decreasing temperature and an increase in fire regime during Late-Holocene would have caused a fragmentation of the northern populations, leading to the formation of marginal, relictual populations inherited from the HTM (Larochelle et al., 2018). This increase in fire regime may also have played a role on the geographical range retraction of balsam fir (Abies balsamea (L.) Mill.) and the formation of northern marginal populations (Jules et al., 2018). In the case of serotinous conifer species which need frequent fires to regenerate, a shift to less frequent fires since the Mid-Holocene has been linked to jack pine (Pinus banksiana Lamb.) geographic range retraction and the formation of disjunct populations (Payette et al., 2017). Hence, past climate change and its direct effect on natural disturbances such as fire, appears to be one of the main drivers of the expansion and contraction dynamics leading to the formation of marginal or even disjunct populations. Those relics populations, however, only survived because of advantageous sites conditions on landscape features such as well-oriented hillsides and depressions with appropriate surficial deposits. For example, white pine northern marginal populations would have found refugia on hillsides protected from severe fire event (Larochelle et al., 2018) while balsam fir marginal populations would have escaped from fire by their location near depressions and poorly drained areas (Jules et al., 2018). Conversely, jack pine stands would have found refugia on the drier and fire-prone environment of sandy terraces where fires are frequent enough to sustain its survival (Payette et al., 2017).
Marginal population formation and survival are also driven by biotic conditions and interactions such as facilitation and inhibition (Brooker et al., 2008; Pugnaire and Callaway, 2007). To establish in a new environment, a tree species has to overcome the inhibition barrier put in place by the resident’s species (Solarik et al., 2020). This mechanism, also called the priority effect (Solarik et al., 2020), is a bottom-up mechanism where the resident species modifies one or several environmental conditions for its benefit, while inhibiting potential competitors. For example, a greenhouse experiment found that mature American beech (Fagus grandifolia Ehrh.) leaf leachate strongly reduces sugar maple (Acer saccharum Marsh.) seedlings fitness (Hane et al., 2003), hence suppressing its establishment or regeneration. Other species also modify the fire regime, like white pine which promotes frequent surface fires, lethal for the competitive seedlings but not for mature white pine trees (Brown, 2009; Engelmark et al., 2000). Coniferous trees also negatively affect the soil available nutrients through a thick acidic litter, which excludes the high-demanding nutrients species such as sugar maple (Collin et al., 2018; Major and Nosko, 2011).
In parallel, facilitation or positive interactions also take place and can effectively (i) enhance the survival, growth and fitness of one species (Brooker et al., 2008; Pugnaire and Callaway, 2007), and (ii) expand one species’ realized niche by creating locations where exclusion agents are absent or minimized (Bulleri et al., 2016). For example, studies found that aspen (Populus tremuloides Michaux) is strongly facilitating balsam fir establishment and growth in boreal (Nagati et al., 2019) and subalpine (Calder and St. Clair, 2012) ecosystems by affecting the water and light input and by supplying shared mycorrhizal communities. Facilitation processes are not exclusive to native species but can also take place between indigenous and exotic or invasive species (Lucero et al., 2019; Reinhart et al., 2006). In this last case scenario, facilitation can directly be linked to the geographical range expansion of the exotic or invasive species. Hence, throughout the Holocene, facilitation processes probably played a significant role in shaping the actual geographical range of many species, and more specifically at the range’s margin where positive interactions can make the difference between survival and extinction.
As for the temperate species previously described, sugar maple geographical range is also characterized by several marginal populations beyond its northern limit. These marginal populations are located at the southern limit of the boreal mixedwood forest in the Balsam fir – white birch bioclimatic domain. Although sugar maple is dominant in the northern temperate forest, this species is poorly adapted to survive the boreal mixedwood forest conditions. First, sugar maple is reliant on high nutrient availability, particularly Ca and Mg, which are less available under coniferous than deciduous stands (Collin et al., 2018). Second, sugar maple is not well adapted to severe fire, more frequent in the boreal mixedwood (Bergeron et al., 2014) than in the temperate forest (Frelich and Lorimer, 1991). It has, however, been observed that sugar maple can withstand fire and regenerate afterward (Nolet et al., 2008; Pilon and Payette, 2015; Talon et al., 2005) by producing stump sprouts and consequently, rapidly dominate post-fire stands again. However, those studies provide no information regarding the severity of the fires.
About sugar maple range dynamics in the Abitibi region, paleoecological studies point out two hypotheses to explain the presence of a marginal population. On the one hand, the palynological analysis conducted by Richard (1980) at lakes Clo and Yelle (Figure 1) south of Lake Abitibi, indicates a faint possibility of a very minor presence of sugar maples in the region since c. 8000 cal. BP. Besides, such was most probably the case at Couchepaganiche just south of Lake Saint-Jean, c. 350 km further east, where an isolated sugar maple stand is located at a similar latitude (Fréchette et al., 2018, 2023; Gagnon et al., 1987). On the other hand, Pilon and Payette (2015) conclude, based on pedoanthracological evidence, that the marginal sugar maple stand they studied may be present locally only some 160–220 years ago. It is thus undeciphered if sugar maple marginal populations in the Abitibi region are a relic of a larger geographical range during the Holocene, or result from a recent expansion. In both cases, the initial conditions leading to sugar maple establishment and growth in a landscape characterized by more fire-prone coniferous ecosystems with low nutrient availability remain unclear.
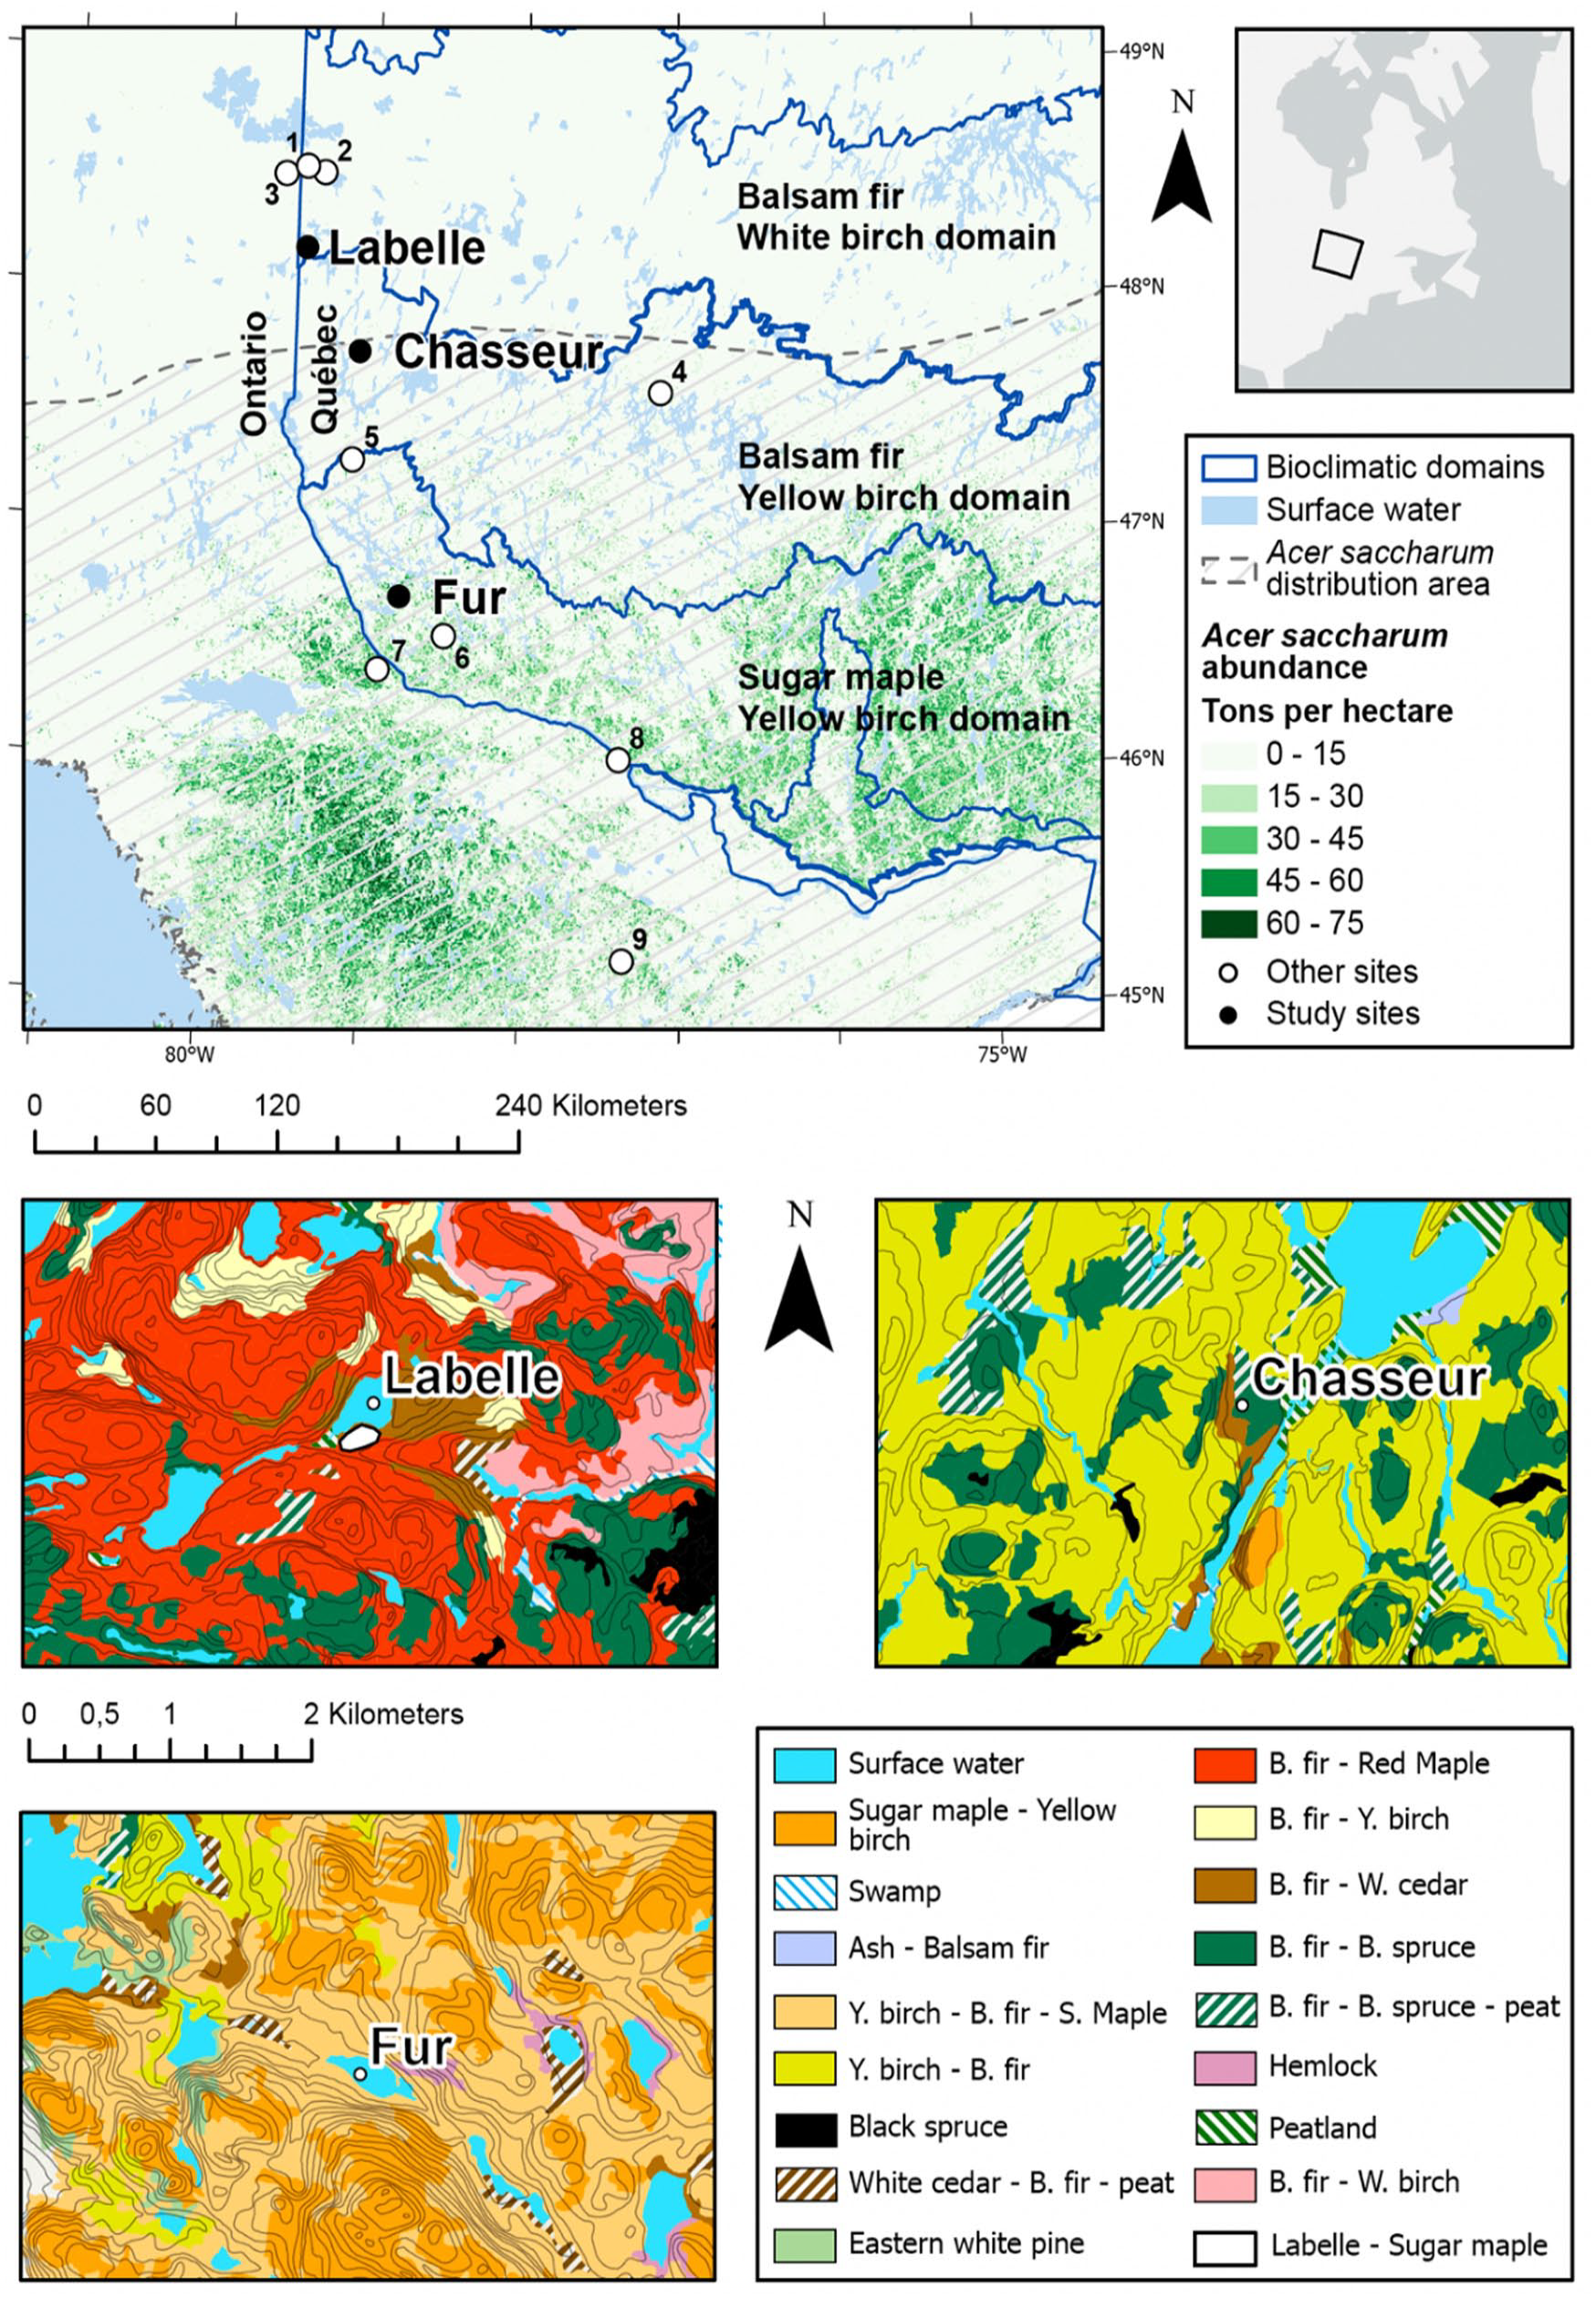
Location of the study sites along the Acer saccharum dominance gradient (top row) and maps of forest types around the sites (bottom). Acer saccharum abundance (Beaudoin et al., 2014) and distribution area (Little, 1971). Other lacustrine sites (white dots) referred to in the text are Francis (1), CLO (2), Yelle (3), CGC27 (4), Louis (5), CGC41 (6), Bastien (7), Perch (8) and Graham (9)) and also LILI located in the southern part of the Black spruce – feather moss bioclimatic domain north of lake Abitibi, just outside the mapped area.
Based on the current knowledge on sugar maple ecology, we hypothesize that the species northern establishment was only possible under (i) a fire regime with less frequent fire, (ii) a warmer climate during the HTM, (iii) a soil rich in nutrient, and (iv) a forest landscape dominated by deciduous species rather than coniferous stands. To test those hypotheses, we analyzed the Holocene pollen and charcoal sedimentary records of three lakes located within, at the edge and outside the current sugar maple range, covering a c. 200 km latitudinal gradient. More specifically, this study aims to (i) identify the palynological signature of the sugar maple marginal population establishment and expansion, (ii) assess the influence of the fire regime and climate on its establishment or expansion, and (iii) examine which species are associated with sugar maple presence or absence and discuss their potential role regarding ecological facilitation and inhibition.
Study area, materials and methods
The study area is located in the Abitibi-Témiscamingue administrative region of western Québec near the border with Ontario (Figure 1). It belongs to the Témiscamingue watershed that drains through the Ottawa River, south of the continental divide. From south to north, it displays an important vegetation gradient represented by the Sugar maple – yellow birch bioclimatic domain, then the Balsam fir – yellow birch domain and finally, the Balsam fir – white birch domain. The gradient is chiefly characterized by an increase in conifers and boreal broadleaf tree species. However, sugar maple stands are observed outside the species continuous distribution, particularly in the Balsam fir – yellow birch domain where sugar maple stands develop on mesic sites of many glacial till-covered hilltops (Saucier et al., 2009) and on protected lakeside areas. Such stands also occupy the southern margin of the Balsam fir – white birch domain where they are scarce and much more isolated.
We selected three lakes along a north-south transect outside and within the sugar maple northern distribution range (Figure 1). Those sites are located near (1) a marginal sugar maple – yellow birch stand at Lake Labelle (LBL), (2) a range-limit stand at Lake Chasseur (CHA), and within (3) widespread stands of the sugar maple bioclimatic domain at Lake Fur (FUR). Site location and environmental local and regional characteristics are presented on Table 1. The sugar maple stand located near Lake Labelle is one of the most northerly isolated large stands known for western Québec; but sugar maple individuals are found in the surrounding forests which are dominated by balsam fir and red maple (Figure 1) along with white birch (Betula papyrifera Marshall). CHA site is located at the northern limit of the accepted continuous range of sugar maple (Godman et al., 1990; Little, 1971), within an area dominated by yellow birch and balsam fir in varying proportions (Figure 1). A pedoanthracological study site about 800 m south of CHA provides insights on local vegetation and fire history within a sugar maple stand in the vicinity (Pilon and Payette, 2015). Finally, FUR is located in the Sugar maple-yellow birch forest where sugar maple is widespread over the landscape (Figure 1) (Saucier et al., 2009).
Site location and environmental characteristics.
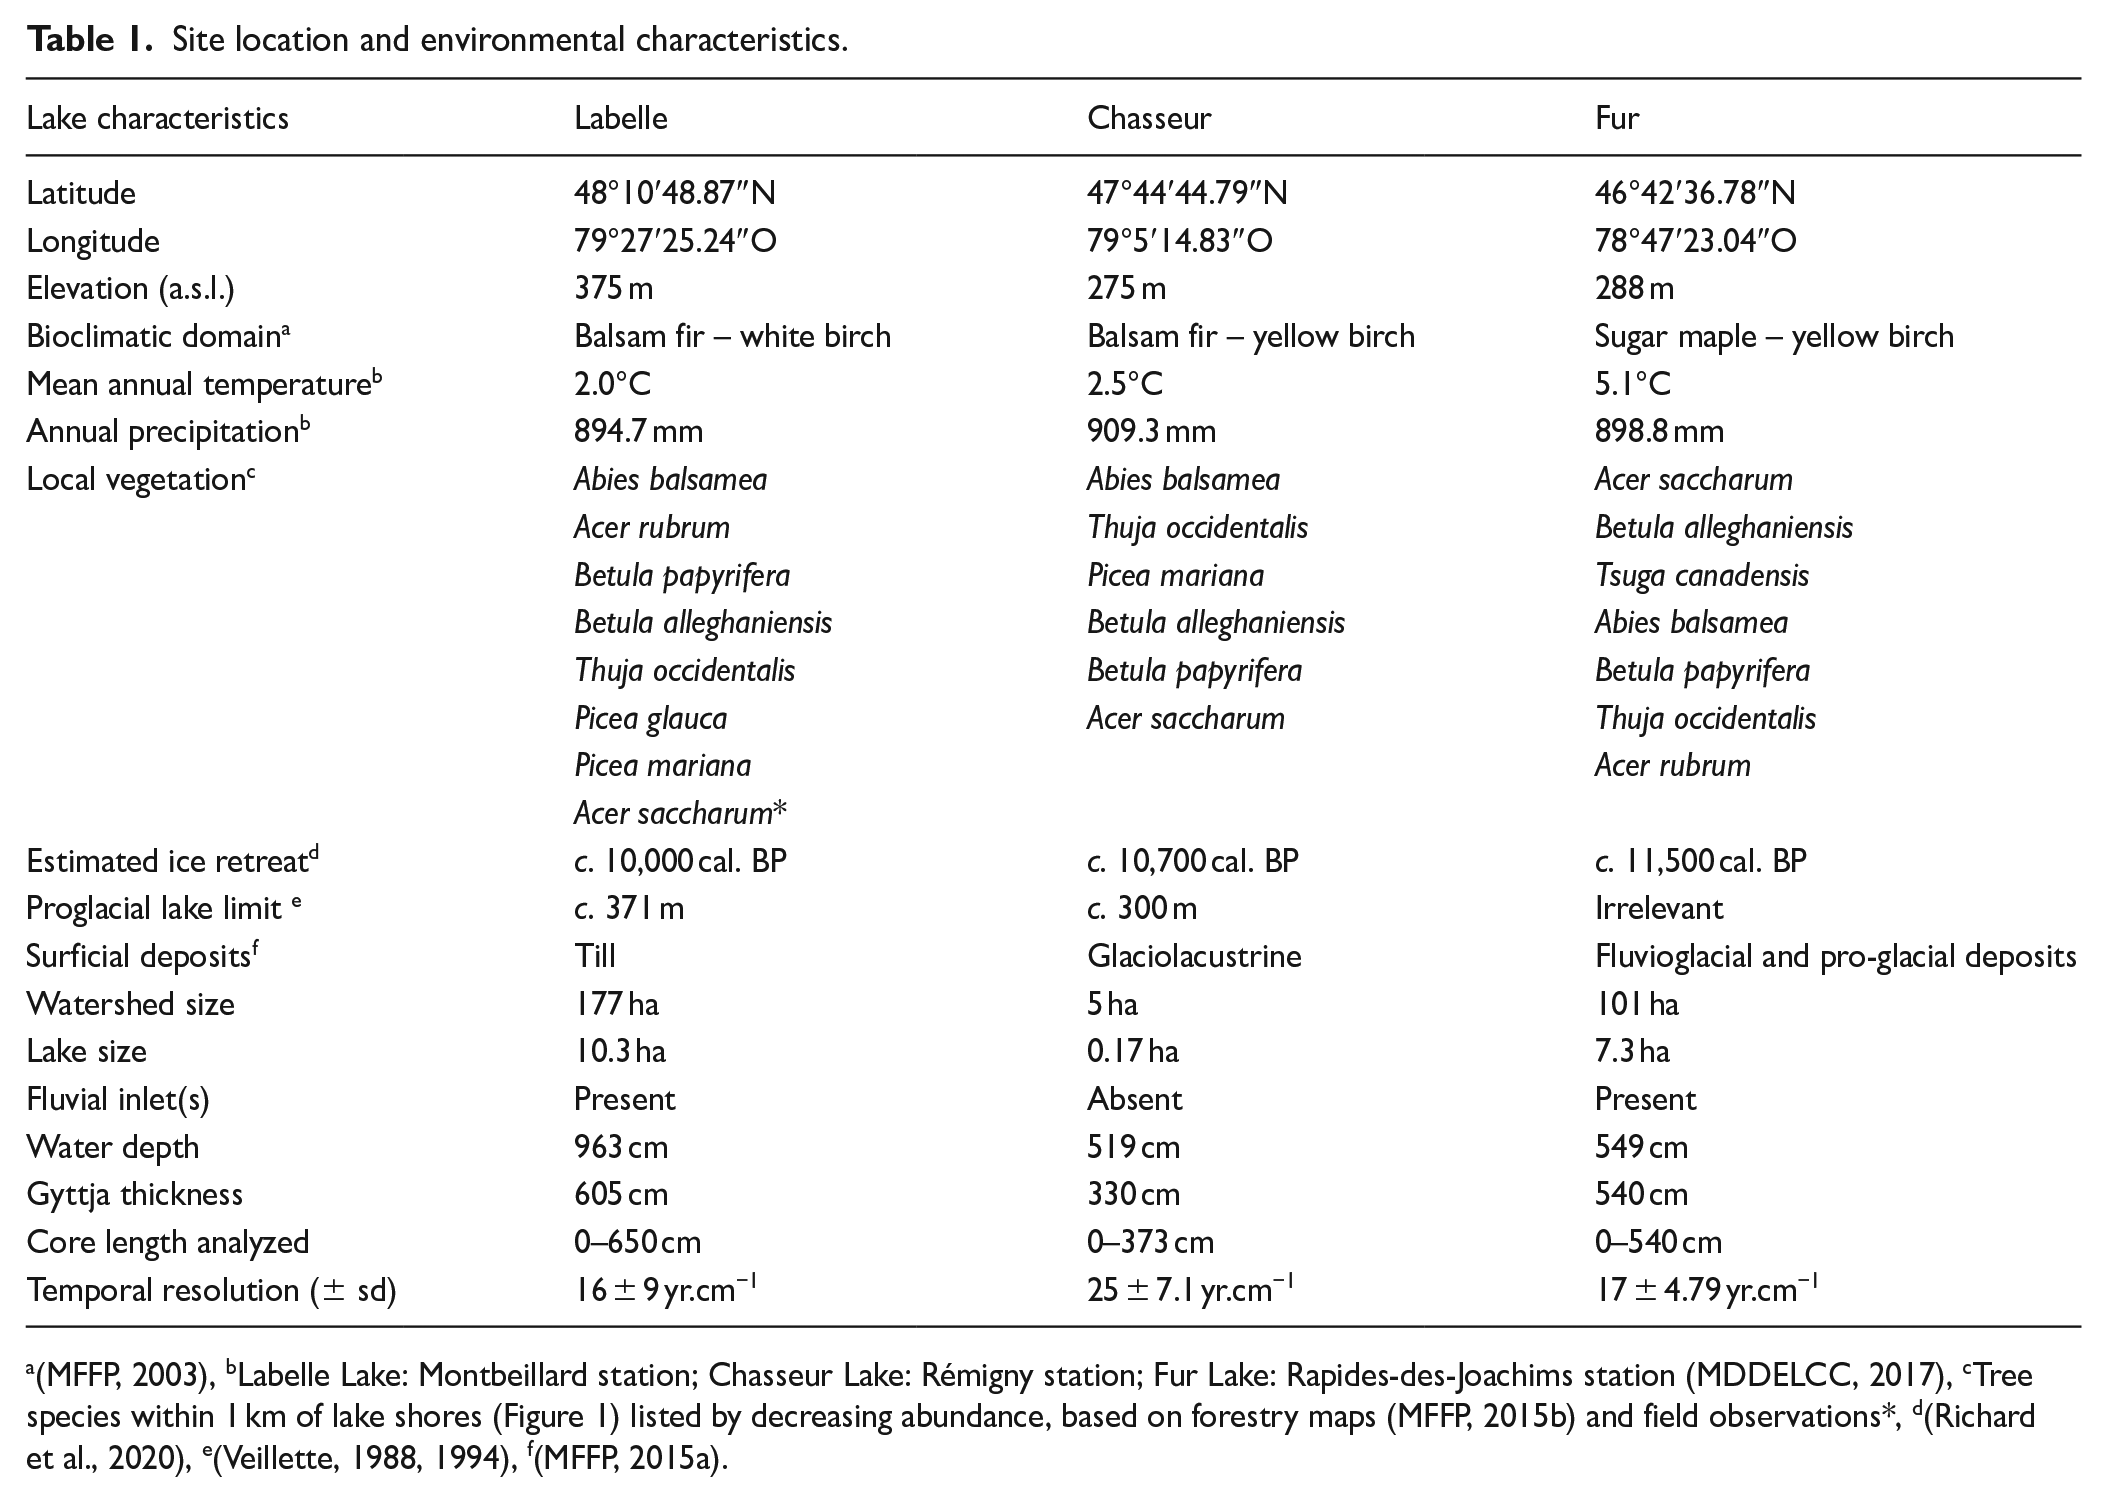
(MFFP, 2003), bLabelle Lake: Montbeillard station; Chasseur Lake: Rémigny station; Fur Lake: Rapides-des-Joachims station (MDDELCC, 2017), cTree species within 1 km of lake shores (Figure 1) listed by decreasing abundance, based on forestry maps (MFFP, 2015b) and field observations*, d(Richard et al., 2020), e(Veillette, 1988, 1994), f(MFFP, 2015a).
Along our transect, the regional Laurentide ice-sheet retreat began c. 11,500 cal. BP at FUR, 10,700 cal. BP at CHA and around 10,000 cal. BP at LBL (Dalton et al., 2020). Immediately after ice retreat, the lowlands of the region were successively flooded by proglacial lakes Barlow (south, in Témiscamingue) and Agassiz-Ojibway (later in Abitibi) up to altitudes of 250–360 m respectively (Godbout et al., 2020; Veillette, 1988, 1994); The initial proglacial lake Barlow stage first drained to the south via the Ottawa River valley. Afterward, proglacial lake Ojibway finally found its way to Hudson Strait and the Atlantic Ocean c. 8200 cal. yr BP (Brouard et al., 2021). Those lakes deposited the so-called Little Clay Belt (Barlow, in Témiscamingue) and Large Clay Belt (Agassiz-Ojibway in Abitibi), respectively, over the lowlands of the region. Only the surroundings of Lake FUR totally escaped flooding (Table 1).
Based on several other studies of lake sediments within and around the study area (Figure 1), pollen-based reconstructions indicate that tundra was absent as an initial stage of the postglacial vegetational sequence in Abitibi (Fréchette et al., 2018; Richard et al., 2020). Afforestation took place quickly and aspen, jack pine and paper birch formed the core of open mixed forests between c. 10,400 and 8750 cal. yr BP. This was succeeded by fir-dominated, relatively open woodlands in which aspen still played an important role until about 7500 cal. yr. BP. Afterward, widespread closed-crown forests resembling those of the modern Balsam fir – white birch bioclimatic domain are reconstructed up to the present. Between c. 6500 and 5000 cal. yr. BP, eastern white cedar (Thuja occidentalis L.) was very abundant on mesic sites, outside its preferred modern lakeshore location in the area, accompanied by some white pine. Between about 9000 and 4500 cal yr. BP, pollen-based millennial climate reconstructions point to summer temperatures 1.5°C to 0.5°C warmer than modern average, annual precipitations 150–50 mm lower than modern average and to 7% to 2% more summer sunny sky conditions over Abitibi (Fréchette et al., 2018: 78). During Mid- and Late-Holocene, summer and winter temperatures both decreased while annual precipitations increased markedly at the millennial scale, reaching c. 100 mm over the modern values. Summer sunshine was then similar to present.
Fieldwork and sediment sampling
LBL sediments were retrieved in October 2015 while those of CHA and FUR were recovered in May 2016. The water depth was measured by a Lowrance X-4 sonar and coring was carried out at the deepest water depth from a floating platform solidly anchored (Blarquez and Aleman, 2020). Each site comprised two complete sedimentary sequences. A Kajak-Brinkhurst corer (KB) was used to get the top watery sediments (0 –50 cm). The KB cores were extracted on-site at a resolution of 1 cm, and the samples were placed in sealed and annotated bags. For the deeper sediments a Livingstone corer with 1 m-long tubes was used. The drives were repeated until reaching the gyttja/silty clay sediment transition. For Lake Fur, this transition was apparently absent but for all lakes, the tubes were pushed down until strong refusal to further penetration. Once extracted from the corer, the sediments were wrapped in plastic film, aluminum foil and protected in PVC tubes. In the laboratory, all cores were subsampled at an interval of 1 cm.
Loss-on-Ignition
Every centimeter of each core was processed to measure the organic content of the sediments through loss-on-ignition (LOI), following the Chambers et al. (2011) protocol, for a total of 1563 samples. The procedure was as follows: (1) drying 1cm3 of a weighted fresh subsample during 12 h at 105°C to remove and estimate the water content by mass difference and (2) heating the dried sample a first time at 550°C for 4 h, hence burning and establishing the organic matter lost similarly. Finally, heating a second time at 1000°C for 1 h in order to burn and estimate the carbonates and remaining inorganic content. Results for organic content are expressed as % dry weight.
Chronology and age-depth modeling
Five AMS 14C measurements were done for LBL sediments and 6 for both FUR and CHA for a total of 17 14C age determinations. Measurements were performed on trees shrubs macroremains for CHA site and on total organic carbon extracted from dried 5 cm-thick slices of bulk gyttja for the other two sites (Supplemental Table S.1, available online). The IntCal20 curve was used to calibrate the resulting radiocarbon dates (Reimer et al., 2020). Measurements of 210Pb activity (Flynn, 1968) were done to infer a chronology for the surficial KB sediments, 8 samples for LBL, 3 for CHA, and 5 from FUR. Constant rate of supply model (CRS) (Appleby and Oldfield, 1983) was used to determine the age of the surface samples. Finally, age depth modeling was done using the R package clam 2.2 (Blaauw, 2010). To construct the age-depth model, an age was randomly chosen according to the probability density of each date (14C and 210Po). The most parsimonious model for each lake was chosen, the one that maximizes the regularity of sediment accumulation while minimizing distance at each date. A cubic spline function was used for LBL, while a smooth spline function was applied to CHA (smoothing parameter (spar): 0.7) and FUR (spar: 0.64). This procedure was repeated 1000 times in order to assess a median age-depth model curve and generate the 95% confidence intervals.
Pollen analysis
Pollen grains and spores were extracted from 1cm3 of fresh sediment at a regular sampling interval of 8 cm at LBL, 6 cm at FUR and 4 cm at CHA, thus corresponding to about 125 years between samples according to the age-depth models. A total of 272 samples were processed, 83 for LBL, 94 for CHA and 95 for FUR. Following the Faegri et al. (1964) protocol, the samples undergone various acidic-basic treatments accompanied by sieving at 150 and 15 microns meshes. To calculate the pollen concentration (PC), a capsule of Lycopodium spores of known concentration (20,848 spores ± 1546, batch number: 1031) was added to the samples at the beginning of the procedure (Stabell and Henningsmoen, 1981; Stockmarr, 1971). Pollen accumulation rates (PAR, pollen influx) were then calculated using the age-depth model of each sedimentary sequences, for both the total pollen content and individual pollen taxa. Countings were performed under microscope at a routine 400x magnification, x1000 being used for details and identification were done by comparison with reference collections and manuals (McAndrews et al., 1973; Richard, 1970).
At least 250 pollen grains of terrestrial taxa were routinely identified and counted per sample (levels), the total representing the pollen sum over which percentages were calculated. In order to get more precise results for Acer saccharum, extra counting of the grains of this species alone was performed along with tallying the additional Lycopodium spores. This proportional procedure allowed an increase of the minimum pollen sum to 750 grains for the calculation of this species pollen percentage representation. It was applied to all samples of LBL and CHA sediments because of their marginal and range-limit position relative to sugar maple distribution area (Figure 1). This taxon-based counting technique enabled us to produce more reliable pollen curves for the reconstruction of sugar maple history for the two northern sites. It increased the chance to pick the pollen grains of this very underrepresented taxa compared to its abundance in the surroundings. The procedure has been successfully applied to tamarack (eastern larch, Larix laricina (Du Roi) K. Koch), a tree species extremely underrepresented by its pollen (Richard, 1981).
A grand total of 53 pollen and spore taxa have been identified in our analyses. Simplified pollen percentage diagrams relative to time have been produced for each site. From left to right, they display a depth scale, the sediment type, and an age scale; then come the pollen percentage curves of 19 of the various trees, shrubs and herbs most frequently identified, followed by a curve of the unknown pollen types which is an illustration of the quality of the analyses. Curves for other trees, other shrubs and other herbs then follow, each adding up all identified taxa not shown in their respective category. The out of total category depicts the proportion, relative to the Pollen sum, of the identified spores and pollen grains not included in the Pollen sum which is based on terrestrial taxa alone for the calculation of percentages (next column). Results for pollen concentration (PC), pollen accumulation rate (PAR) and the organic content of the sediments (OC) are displayed at the far right of the diagrams, followed by the pollen zones for each sequence. We used a simple visual zonation based on the pollen percentage curves of pines (Pinus strobus and Pinus banksiana) and birch species (Betula spp.).
A challenge of this study is the use of pollen data to establish the presence/absence of sugar maple close to the lakes or within their watershed in absence of macroremains of any kind for this species in lake sediments. Despite sugar maple low pollen production and dispersal capacity (Jackson, 1991; Richard, 1976), long-distance dispersal is always a possibility and vegetation reconstructions should be made cautiously. To guide our interpretation of sugar maple presence/absence in the surroundings of the sites, two threshold values were used. One is the 0.5% pollen threshold value (Davis and Jacobson, 1985; Davis et al., 2021) for the probable presence of the species within the watersheds, which is generally accepted as a rule of thumb. We developed another threshold value which is the site-specific median pollen accumulation rate (PAR) for each sedimentary sequence calculated over the last 200 years or so (Supplemental Table S.2, available online). For this purpose, Acer saccharum pollen and Lycopodium spores have been tallied at every centimeter of the last 200 years for each site. The time interval of 200 years corresponds approximately to the present age of sugar maple stands around each lake. Those two thresholds were then applied throughout the Holocene to estimate the local absence, presence, and change in abundance of the species and to define the time range of the species establishment and eventual expansion.
We also estimated the proportion of conifer and broadleaf taxa by a simple pollen ratio of Conifers to Broadleaves (C:B ratio). Conifer pollen includes Picea mariana, Picea glauca, Pinus undifferentiated, Pinus strobus, Pinus banksiana, Abies balsamea, Thuja occidentalis/Juniperus communis, Larix laricina and Tsuga canadensis (FUR only) while broadleaves palynotaxa comprises Betula spp., Populus tremuloides, Acer saccharum, Acer rubrum, Quercus (FUR only), Fagus grandifolia (FUR only). Tsuga canadensis, Quercus and Fagus grandifolia were excluded from LBL and CHA pollen sums because they probably never reached those northern sites during the Holocene. This ratio is admittedly much affected by over-represented taxa such as Pinus spp. and Betula spp., a feature that should be kept in mind for the interpretation of the data.
Charcoal analysis and fire event reconstructions
At a centimeter resolution for the three postglacial sequences, 1 cm³ of sediment was immersed in 8% sodium hypochlorite solution for approximately 12 h for deflocculation and bleaching. The samples were then sieved at 150 μm mesh in order to extract only macro-charcoals. The analysis of charcoal particles was then performed using a stereo-microscope equipped with a camera and assisted by an image analysis software for precise charcoal area measurements (WinSEEDLE, 2015).
CharAnalysis software (Higuera, 2009) was then used to reconstruct the fire events history through the following three consecutive steps: pretreatment, smoothing, and peak analysis. The first step calculates the Charcoal Accumulation Rate or CHAR (#charcoal or surface of charcoal.cm−2.year−1) at a median time step by multiplying the charcoal concentration by the sediment accumulation rate. The second step smooths the CHAR data and subtracts the low frequency signal or CHARbackground, to only keep the high frequency signal or CHARpeak. Data smoothing was performed using a LOWESS function (Locally Weighted Scatterplot Smoothing or Polynomial Regression with local weighting) with an 800 year time range to maximize the signal-to-noise ratio (Kelly et al., 2011). The application of a gaussian mixture model within the CHARpeak enabled separating 1) the CHARnoise, representing the variability of charcoal accumulation because of sampling, sediment focussing and other taphonomic processes from 2) the CHARfire, representing the charcoal peaks from local and sub-regional fires, generally within 30 km (Hennebelle et al., 2020). Considering the temporal resolution (11–25 years.cm−1), a fire peak identified by CharAnalysis could also correspond to two distinct fire events.
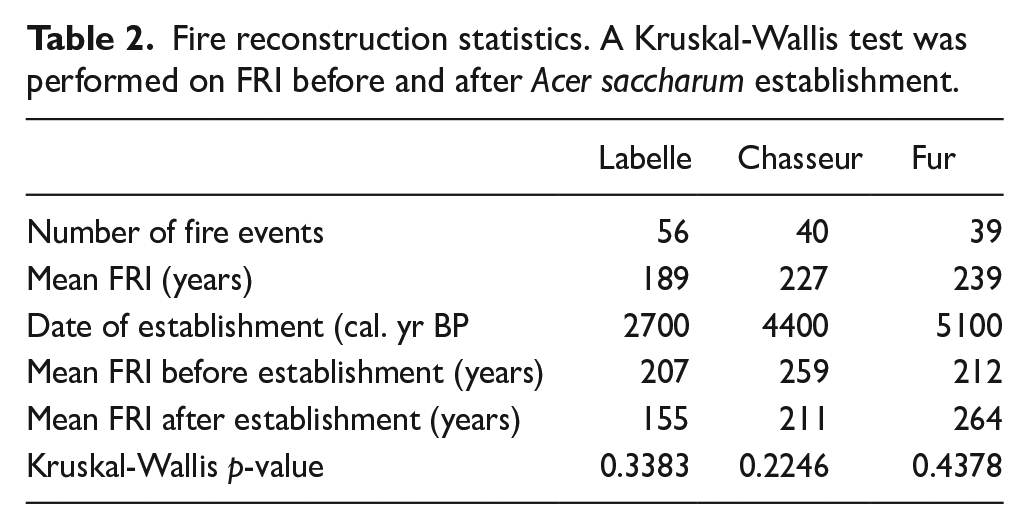
Based on fire events detected, the fire return interval (FRI) or the duration (years) between fire occurrence at a specific location was calculated for each site using CharAnalysis software (Higuera, 2009). The lower the FRI, the more fire-prone and fire-adapted the ecosystem should be. Non-parametric Kruskal-Wallis tests (Kruskal and Wallis, 1952) were used to determine if the FRI before and after sugar maple establishment were significantly different for each site (Table 2). This test determines whether or not significant differences exist between the medians of two groups when the condition of normality is not met. This test was computed using the package stats part of the R environment (R Core Team, 2022).
Fire reconstruction statistics. A Kruskal-Wallis test was performed on FRI before and after Acer saccharum establishment.
Results and interpretations
Sedimentation and chronology
The sediments of Lake Labelle (LBL; altitude 375 m) are composed of silty-clay mud between 650 and 610 cm, overlain by gyttja from 610 to 0 cm (Figures 2 and 3). A relatively sharp transition between these two types of sediment is observed between 620 and 610 cm with a decreasing inorganic fraction (silt and clay) upwards as evidenced by the strongly increasing organic content shown at the right of the pollen diagram (Figure 3). The inorganic fraction shows a slight reaction to HCl, indicative of carbonates that may affect radiocarbon dating. The average accumulation rate is 0.082 ± 0.044 cm.yr−1, thus giving an average temporal resolution of 16 ± 9.5 yr.cm−1 (Table 1). Located at an elevation of 375 m, LBL probably escaped flooding by proglacial lake Ojibway waters which altitudinal limit was about 371 m in the area (Veillette, 1994). The basal date of 10,065 cal. BP at 625–630 cm (Supplemental Table S.1, available online) corresponds to the estimated ice retreat and the beginning of the clay-gyttja transition. It is also congruent with proglacial lake Ojibway regression from this altitude in the area, also dated around this period by Richard (1980) at Lake Yelle and by Veillette (1994) for the study region. Consequently, the basal date is probably not much affected by putative old carbon.
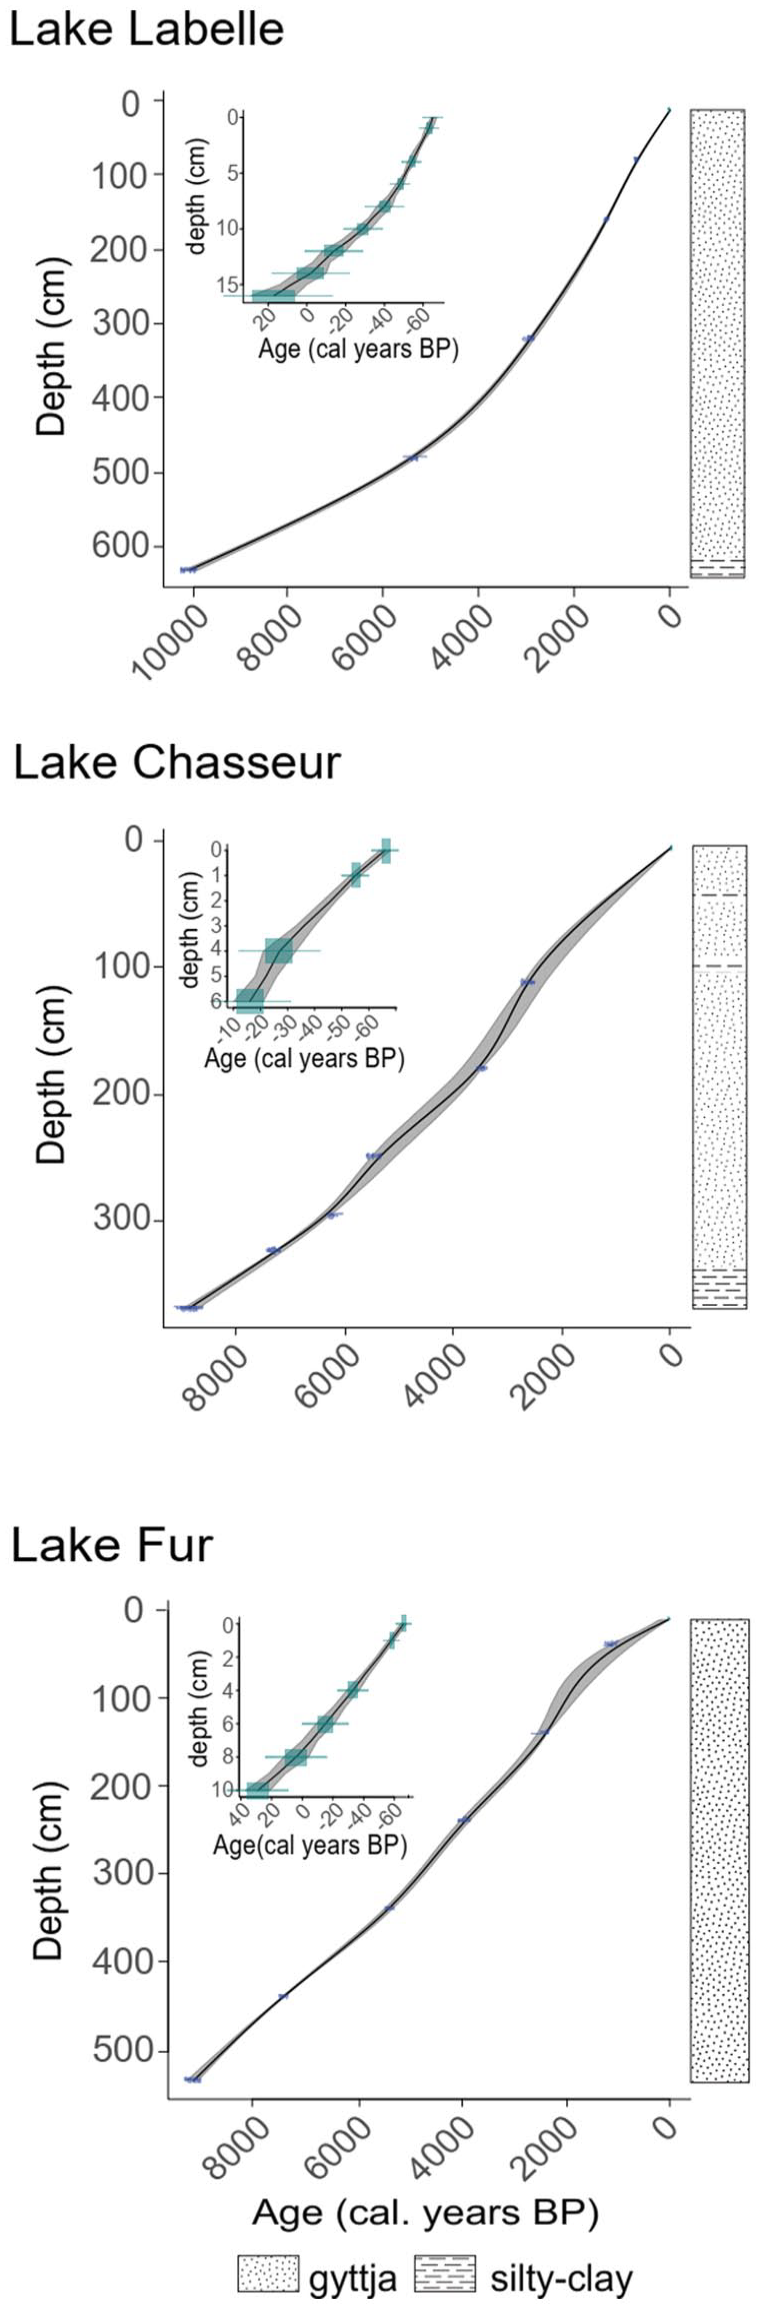
Age-depth model (0 BP = 1950 AD) of (a) Labelle, (b) Chasseur and (c) Fur. The solid line is a smoothed function depicting the best age-depth model, within the 95% confidence envelope. The inserts represent 210Pb dates and age-depth curves within the 95% confidence envelopes. 210Pb and 14C dates are given in Supplemental Table S.1, available online.
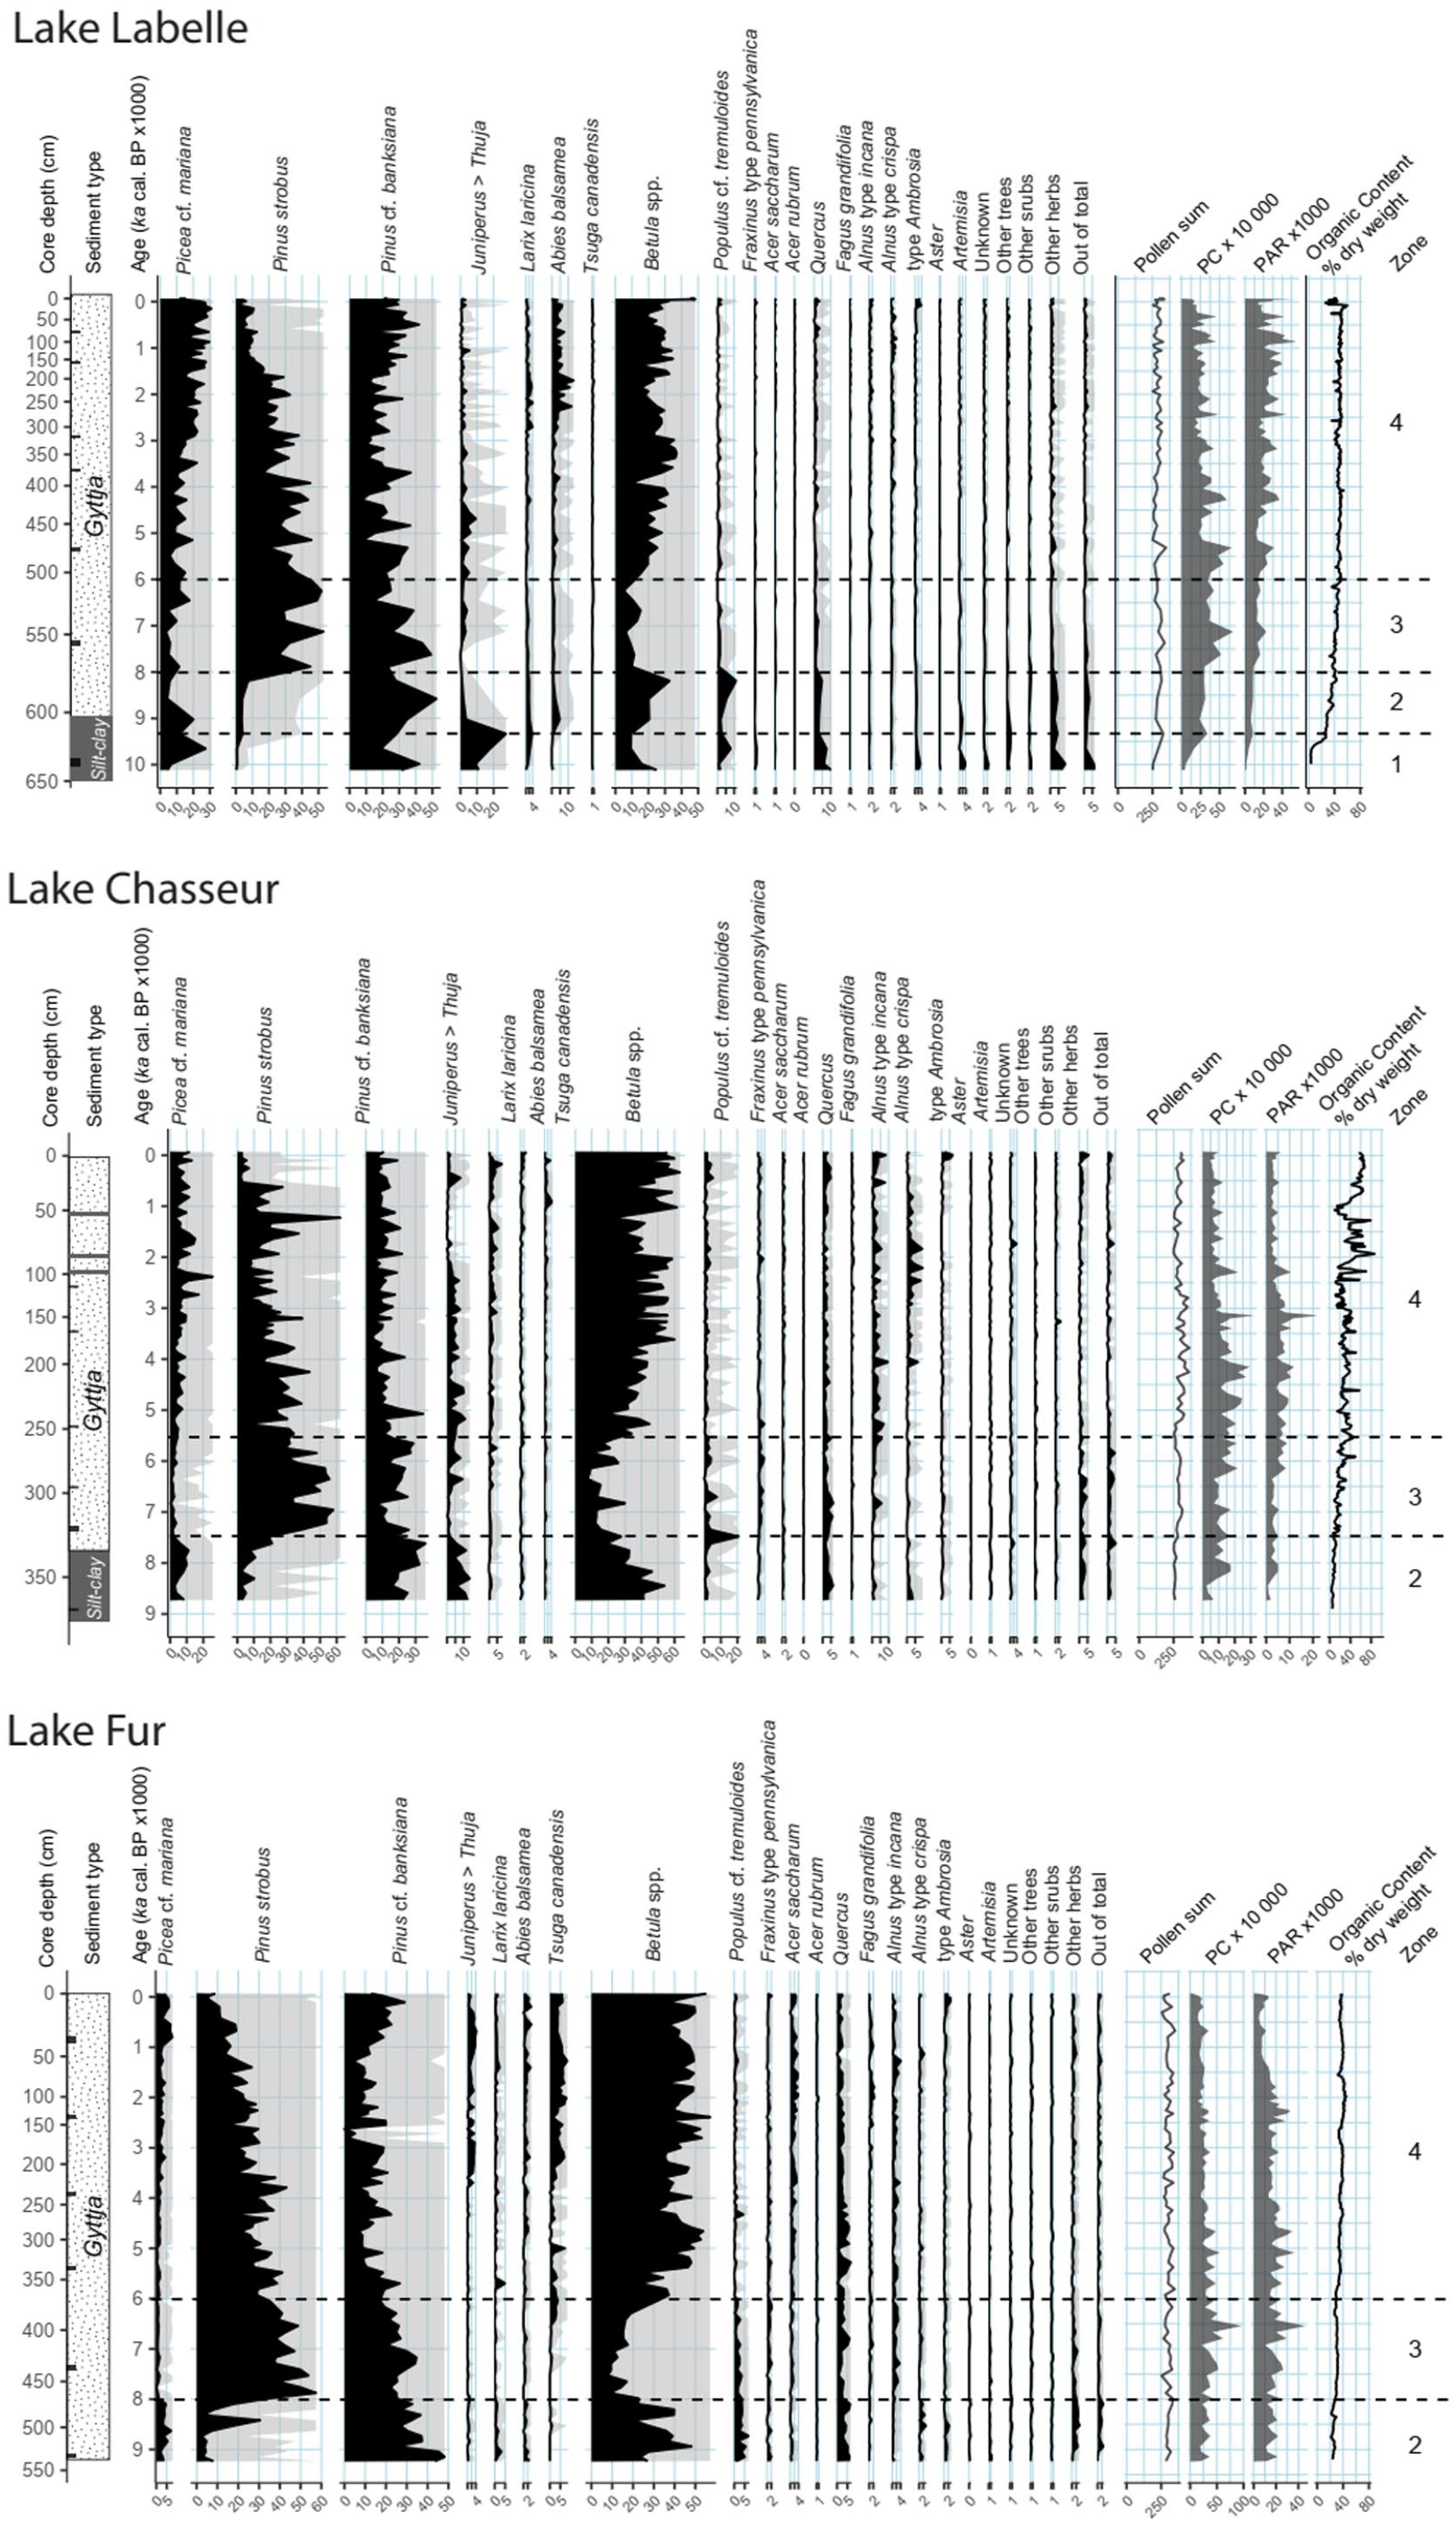
Simplified pollen percentage diagrams for the three sites. All pollen curves are drawn at the same scale. Gray areas are exaggerated x10. PAR: pollen accumulation rate (n grains.cm–2.yr–1); PC: pollen concentration (n grains.cm–3).
Silty-clay mud is identified from 373 to 330 cm in Lake Chasseur (CHA; altitude 275 m) sediments, overlain by gyttja to the top of the core (Figure 3). The organic content increases accordingly albeit very slightly at the beginning, which probably indicates a very slow development of a vegetational cover acting against surficial erosion of the surroundings. Besides, silty-clay layers are identified in the upper part of the core, at 99, 78, and 55 cm, along with several organic macroremains. This could be indicative of erosional episodes perhaps linked with fire events. The average accumulation rate is 0.043 ± 0.012 cm.yr −1 and the mean temporal resolution is 25 ± 7.1 yr.cm−1. The basal date of c. 8900 cal. BP at 369–370 cm corresponds to the end of the silt-clay gyttja transition. This is some 1800 years after regional ice retreat (Table 1) but the delay may well represent the proglacial lake retreat from this altitude (Veillette, 1988, 1994), combined with the possible presence of stagnant ice in the basin. As for Labelle, there is a very slight reaction of HCl in the basal sediments but the possible effect of carbonates on the radiocarbon age is deemed negligible. The silty-clay gyttja transition probably represents an increase in the lake productivity and a slowdown of soil erosion around the lake, but such process has been very slow as evidenced by the pace of increasing organic content (Figure 3).
Lake FUR (altitude 288 m) sediments are entirely composed of gyttja from 540 to 0 cm, without initial silty-clay transition (Figure 3). The organic content of the sediments is important throughout, albeit increasing regularly toward the top. The average accumulation rate is 0.061 ± 0.015 cm.yr−1, for an average temporal resolution of 17 ± 4.79 yr.cm−1 (Table 1). The basal date at 530–535 cm gives an age of 9116 cal. BP (Supplemental Table S.1, available online). Hence, the early postglacial history of the site is not recorded in the retrieved sedimentary sequence, probably due to the presence of very stiff layers below, impenetrable with our coring device.
Vegetational history since deglaciation
The vegetation around the three lakes is reconstructed from the pollen percentage diagrams (%, Figure 3) along with the so-called influx diagrams that show the pollen accumulation rate (PAR, expressed as the amount of pollen grains.cm−2.yr−1) of selected pollen taxa (Figure 4). Percentages are mutually dependent while accumulation rates depict the pollen representation of the various taxa independently of each other. PAR thus reflects more closely changes in populations size for the taxon that produced the pollen, provided due consideration is given to the dangers involved and the related caveats (Giesecke and Fontana, 2008). PAR is strongly dependent on PC (pollen concentration; Figure 3) which precision may vary widely from level to level; consequently, only sustained increases, maxima, or decreases are considered, along with the effect produced by changes in sediment accumulation rate (Figure 2). Interpretations are presented for every pollen zone of the diagrams. The specificity of each site is identified and commented, as well as their connection (or lack of correspondence) with the postglacial vegetational sequences already described for the studied area (see above). The specific case of the postglacial history of Acer saccharum will be discussed afterward.
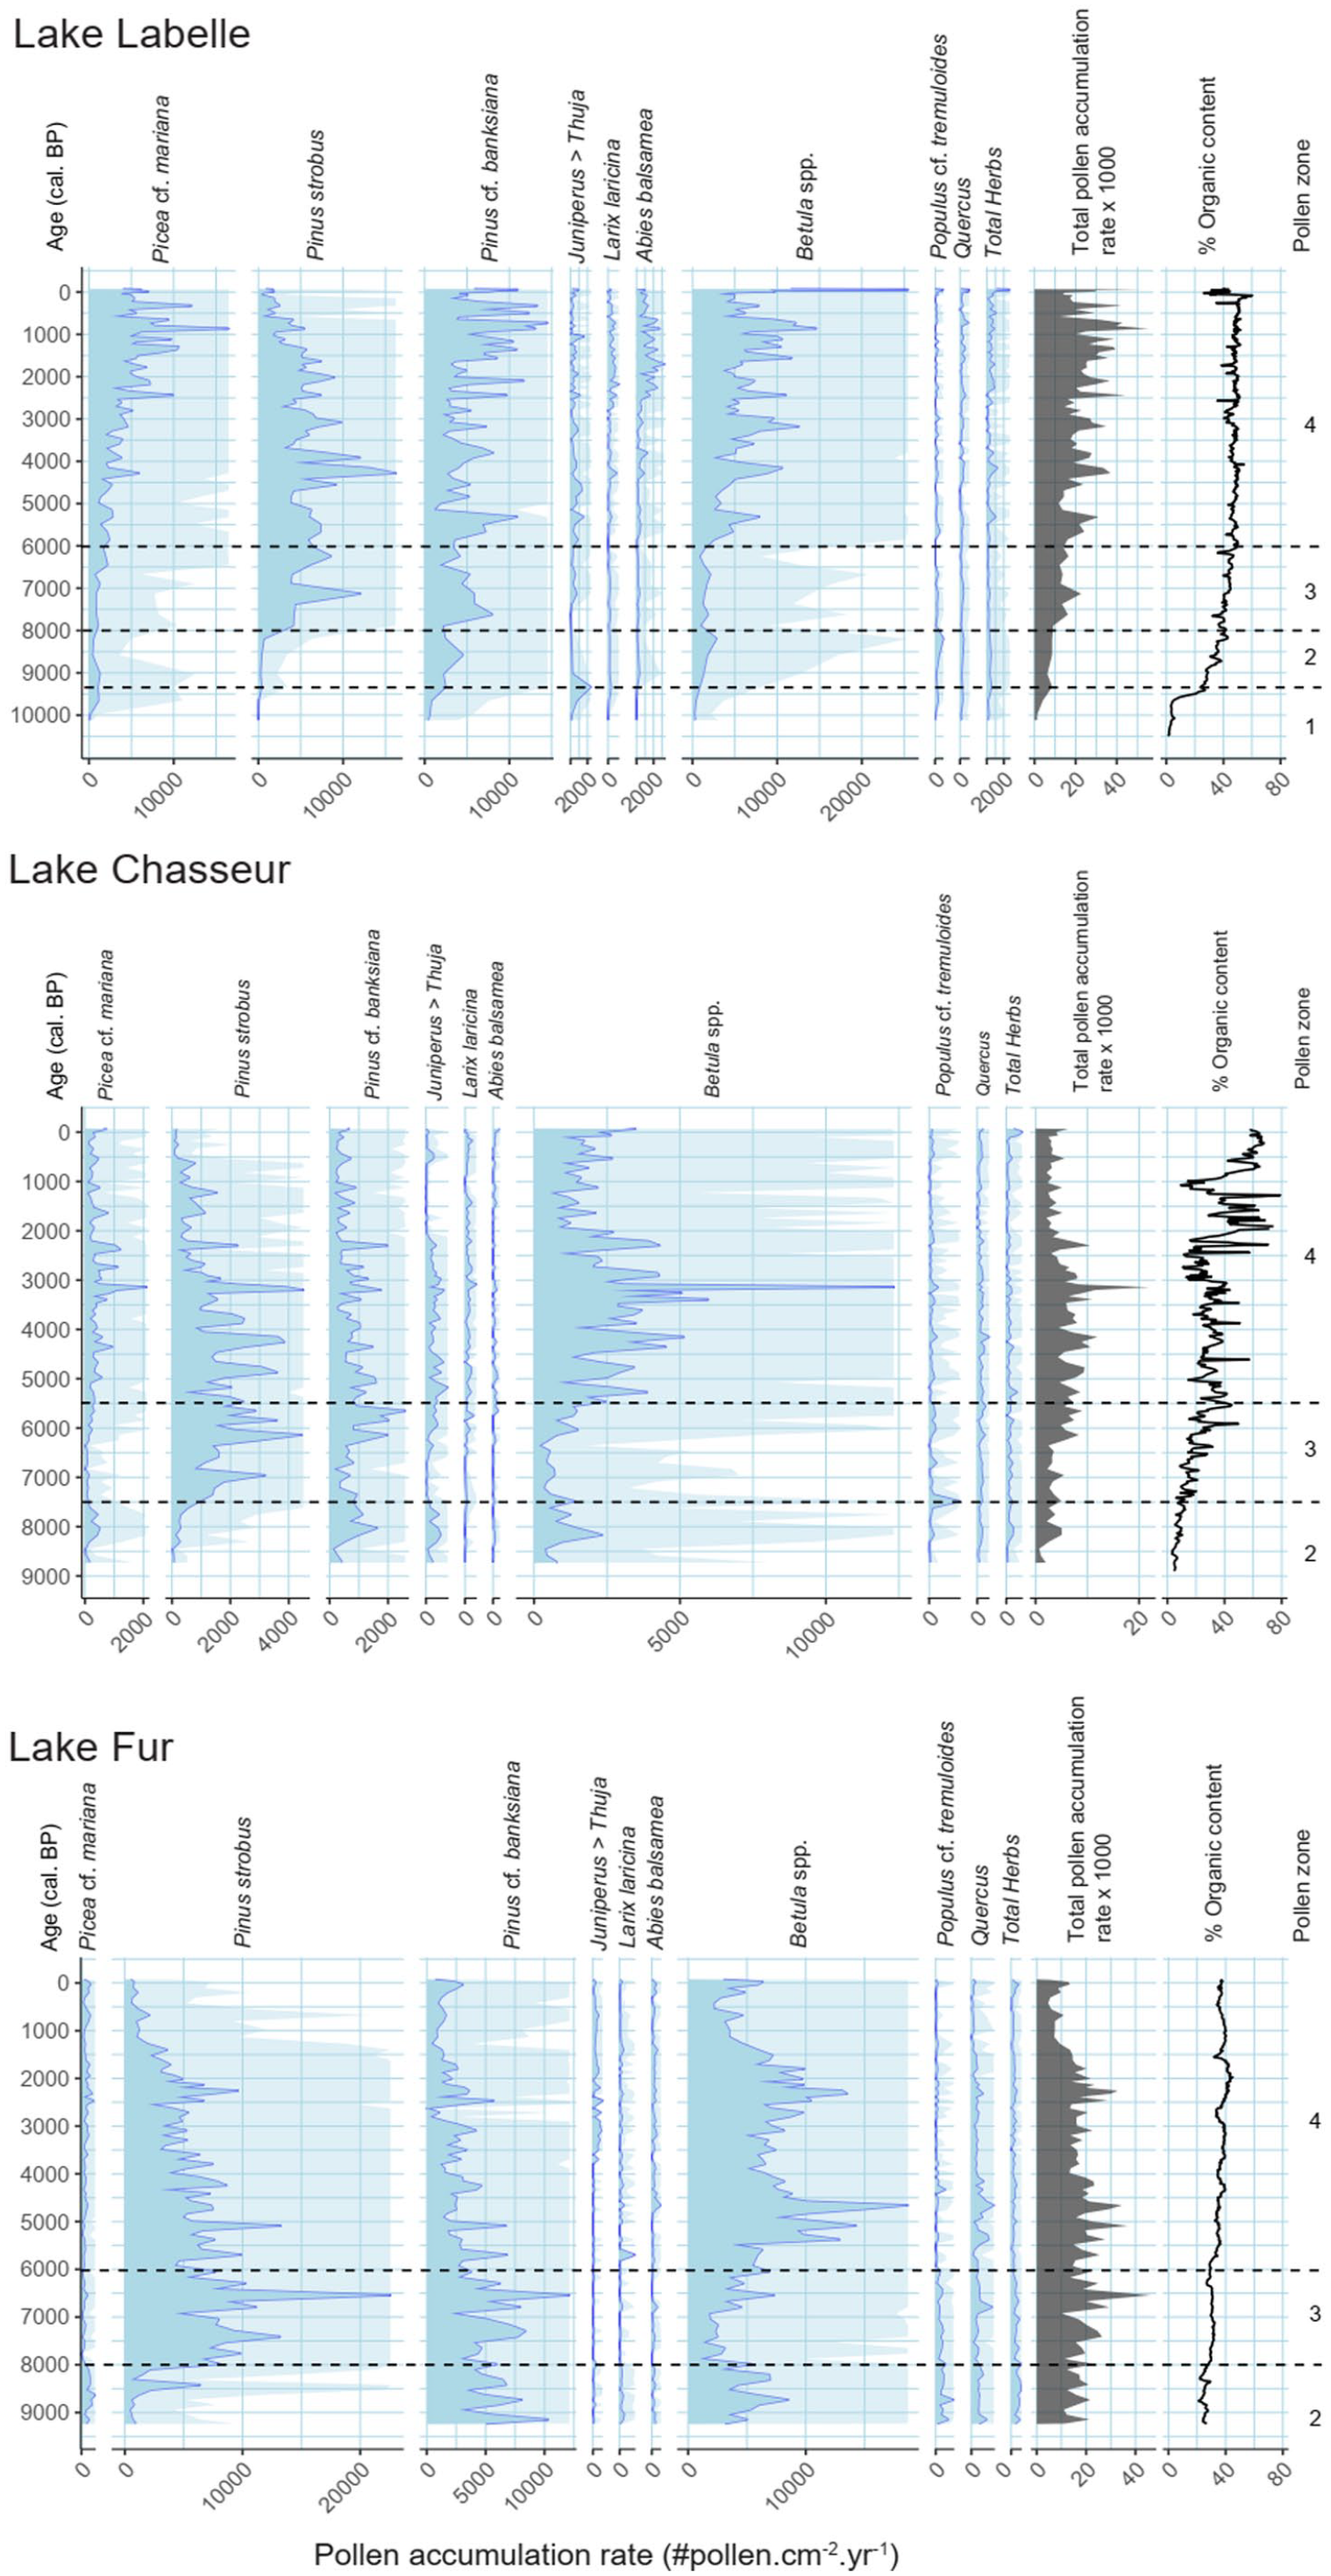
Pollen influx curves of selected taxa for the three sites. Lighter blue areas are exaggerated x10. Curves of the total pollen accumulation rate (PAR) and the organic content (OC) are copied from Figure 3 and displayed again to support comments in the text. Pollen zonation, based on changes in percentages, is also taken from Figure 3. Note the various scales for the PAR.
When interpreting the palynological results, either % or PAR curves (Figures 3 and 4), one must consider the size of the lakes and their catchment, and the presence or absence of fluvial inlets that act as conveyor belts to enhance the airborne pollen inputs to the basins during the shedding season (Figure 1, Table 1). In this regard, Lake Chasseur (CHA) clearly stands out with its tiny 5 ha watershed and 0.17 ha surface without fluvial inputs. Compared with the two other sites. Its pollen-source area is thus comparatively very small and that of Lake Labelle (LBL) is the largest owing to its 177 ha catchment and 10.3 ha surface. The size of a lake controls the amount of pollen that falls on water, and the morphometry of the lake handles the way sediment (and pollen) is focussed down and incorporated to the bottom of the water column (Giesecke and Fontana, 2008; Lehman, 1975). The portion of the lake bottom where sediment effectively accumulates may increase with time and consequently, similar inputs to a constant surface above may be progressively diluted on a larger bottom surface during seasonal pollen deposition and during the redeposition processes. Those are active near the shores during seasonal temperature overturns of the water column. In addition, during dry periods, lake water level may change, consequently decreasing the size of the lake surface and possibly stopping the fluvial inputs of eventual inlets that drain the watersheds.
Finally, the present-day composition of the vegetation around each site also provides clues for the interpretation of the pollen values in terms of actual vegetation around, at least for the surficial and recent assemblages (Table 1). Our sites belong to three different bioclimatic vegetation domains (Figure 1) typified by the potential final forest association occupying the mesic sites during successions. The nature and distribution of the geological surficial deposits around the lakes consequently control the location and abundance of mesic sites within the domains and thus, the abundance of the key species that typify the domains. At the regional scale, such mesic sites are less abundant and more dispersed around LBL and CHA than around FUR, owing to the geomorphological history. Badly drained or excessively drained deposits are more abundant regionally around LBL and CHA, even if locally, at the catchments’ scale, the physiography may be different. This is especially important for balsam fir at LBL and CHA, and for sugar maple at FUR, since those key species of the vegetation domains are strongly underrepresented by their pollen compared to their abundance in the field. Tracing their postglacial history and the origin of the corresponding vegetation domains from the pollen curves of Abies balsamea and Acer saccharum is admittedly difficult task.
Pollen zone 1 (10,000 to 9300 cal. yr BP)
This pollen zone is only present in the Lake Labelle (LBL) sedimentary sequence. Pollen assemblages expressed as percentages (Figure 3) are successively dominated by Pinus cf. banksiana (42%) and Betula spp. (25%), replaced first by Picea cf. mariana (8%) and then by the Juniperus/Thuja type (30%), probably juniper at the time. Populus pollen peaks (8%) in the middle part of the zone. Quercus, Ambrosia and Artemisia pollen types (4% each) and other herbs (7%) are relatively well expressed at the onset. Pollen accumulation rates (Figure 4) are, however, very low albeit increasing within the zone, which is indicative of an initially very scant vegetation cover and possible absence of trees within the lake’s watershed, except perhaps a few black spruces and jack pines. LBL basin occupied a tiny island in proglacial lake Ojibway at the time, and tree pollen results mostly from long-distance transport. As an airborne particle, pollen can travel a variable distance depending on their shape, weight and stickiness (Hevly, 1981; Jackson, 1990). Most pollen admittedly falls within a few hundred metres from their sources (Sugita, 1994), but several studies have shown that pollen dispersal capacity could reach over a 1000 km (Rousseau et al., 2003; Zhao et al., 2019). However, at the onset of postglacial sequences the thermophilous tree pollen taxa are over-represented by their percentages because of a low pollen production from the local vegetation. Therefore, we conclude that the early thermophilous taxa pollen percentages recorded during this period should be considered as the product of long-distance dispersal. Stronger evidence based on macro-remains or DNA is needed to attest the local presence of such thermophilous taxa that early during the Holocene.
Pollen zone 1 consequently represents a transition from a very open herbaceous and shrubby vegetation (juniper?) giving way to a progressively afforested landscape. This is corroborated by the sediment type and % organic content that reflect a decrease of surficial erosion during the process. The initial plant cover around LBL certainly experienced harsh conditions during pollen zone 1 but there is no indication of a bona fide tundra, in absence of definitely arctic or alpine pollen taxa (Richard, 1977) or of macrofossil remains of such taxa. Pollen percentage diagrams alone are consequently misleading in translating the early postglacial vegetational cover. Striking examples are offered by the Picea cf. mariana and Pinus cf. banksiana percentage curves where the representation of black spruce and jack pine in zone 1 is misleadingly equal or greater than at any other times during the Holocene (Figure 3). Pollen accumulation rates are more closely related to past population abundance (for herbs) or absence (for trees) in the field during pollen zone 1.
Pollen zone 2 (9300 to 8000–7500 cal. yr BP)
This pollen zone represents different states of the afforestation stage around the lakes, as evidenced by the decreasing proportion (%) of herb pollen within the zone and from north to south (LBL to FUR) (Figure 3). It is characterized by high Pinus cf. banksiana and Betula spp. pollen percentages corroborated by sustained accumulation rates, thus translating the effective presence of jack pine and paper birch within the lakes’ watershed. Betula spp. pollen taxa are however strongly over-represented by their % values compared to their actual proportion in the surrounding landscapes. Percent thresholds for the probable presence of jack pine, birches, and black spruce are respectively set at 3%, 10%, and 2% (Davis et al., 2021). Consequently, given its under-represented status, Picea cf. mariana percentages and PAR values indicate an abundance of black spruce in the field during pollen zone 2, especially at CHA and FUR. Pollen zone 2 probably corresponds to a black spruce dominated forest, with jack pine as a codominant, and white birch as a secondary component at FUR, in the south. Aspen was, however, important during pollen zone 2, especially at LBL and FUR, based on the % values of Populus cf. tremuloides (Figure 3). Balsam fir (Abies balsamea), and other palynologically underrepresented species, could have been an additional key player at the onset of zone 2 at LBL. The other tree taxa are too poorly represented, either by % or PAR, to have taken a significant part in the vegetation cover but most of them were present in small populations. The long-distance transported pollen grains of Quercus are a striking component of pollen zone 2 at all sites, as they were in zone 1 at LBL. They will be swamped by pollen produced regionally, within the catchments, during the following forest stages (pollen zones 3 and 4), especially at LBL. However, some oaks may have been present locally during pollen zone 2 times, like in Témiscamingue during an equivalent period (Richard and Larouche, 1989). Again, at LBL in the north, pollen percentage curves during pollen zone 2 are somewhat misleading in translating the abundance of Pinus cf. banksiana and Betula spp. within the surrounding vegetational cover because the elevated values (Figure 3) are not supported by pollen accumulation rates (Figure 4). Such is not the case at Chasseur and Fur where the trends of the elevated PAR values more closely parallel the mutual pollen representation (%) of the corresponding populations within the catchments. At all sites, afforestation is strongly underway since 9300–9000 cal. BP and the high total pollen influx at CHA and FUR suggests a closed boreal forest dominated by Picea mariana, Pinus banksiana, Betula spp. and Populus. Overall, the afforestation phase ended c. 8000–7500 cal. BP with a sharp increase of Pinus strobus at every site.
Pollen zone 3 (8000–7500 to 7500–5500 cal. yr BP)
The swift increase in Pinus strobus pollen percentage is the key feature defining the onset of pollen zone 3 (Figure 3), and it is corroborated by a similar increase in the pollen accumulation rates (Figure 4). The increase is almost synchronous around 8000 cal. BP at every site, as at several others in the greater region (Fréchette et al., 2018; Liu, 1990; Richard, 1980). Such synchronism over a vast area may indicate that white pine was regionally present prior to 8000 cal. BP, and that one or more factors rapidly triggered its expansion over the landscapes. Possibly the sharp increase in temperature during the growing season at the onset of the HTM (Holocene Thermal Maximum, c. 8000– 5000 cal. BP). This feature is supported by the detailed chironomid-based reconstructions of summer temperatures from a remote site in the central boreal forest located c. 400 km to the northeast (Bajolle, 2019; Bajolle et al., 2018). For its part, the upper boundary of pollen zone 3 is set at an important increase in pollen percentages of Betula spp. that corresponds to a decrease in the % values for Pinus strobus, a feature expected for those two over-represented major pollen taxa relative to each other. Pinus cf. banksiana pollen percentages are at their maximum and decrease upwards within the zone at LBL and FUR. At CHA, jack pine pollen percentages are weaker and but increase within the zone according to the PAR (Figure 4). The manifest lowering of Betula spp. percentages is also mitigated a bit by consideration of PAR values at LBL and CHA, but is clearly confirmed at FUR, the southern site where the density of the forest cover was firmly established during the previous sequential stage (zone 2). Based on both % and PAR values, black spruce abundance strongly decreased during pollen zone 3 at FUR and CHA, but maintained or increased its populations around LBL. Aspen also declines in abundance at both LBL and FUR while maintaining sparse populations around CHA according to both % and PAR values of Populus cf. tremuloides. Oaks were still present at FUR and CHA, probably as a minor component of the forest cover, but it declined somewhat at LBL where the pollen percentages can be considered as long-distance transported to this northern site and swamped by the pollen of an increasingly denser forest around. Overall, pollen zone 3 is interpreted as a coniferous forest dominated by white and jack pines with some black spruce, admitting negligible amounts of balsam fir and broadleaf species including birches. Considering the expected postglacial vegetational sequence of forest development (Richard et al., 2020), balsam fir dominated forests succeeding spruce forests are clearly missing at all sites.
Pollen zone 4 (7000–5500 to 0 cal. yr BP)
The onset of this zone corresponds by definition to the important visually-established increase of Betula spp. pollen percentages at the three sites (Figure 3). The PAR values (Figure 4) help to better define the very beginning of this percentage-based increase which is consequently set at c. 6000 cal. BP at LBL and CHA, and at c. 7000 cal. BP at FUR, the southernmost site. Although changes in the proportion of many tree species varied during pollen zone 4, birches were at all sites a major component of the forests surrounding the lakes, either white birch in the north (LBL) and/or yellow birch at CHA and at FUR, in the south. From c. 6000 to 5500 cal. BP on, white pine was clearly declining at all sites, albeit irregularly. Around FUR, the Pinus strobus relatively regular decline is somewhat reversed c. 2250 cal. BP according to the PAR values, and the decline accelerates afterward until present-day. This corresponds to an increase in the percentage representation of jack pine and black spruce at this site. A similar behavior is experienced at LBL where black spruce is clearly increasingly important around the lake. This is not so clearly registered at CHA where only the recent white pine accelerated decline is evidenced. According to the PAR values, Betula spp. experienced important changes in the size of its populations within zone 4, especially at FUR where a shift from white to yellow birch may be involved (Figure 4). For LBL, no such bimodal development of the populations is perceived; nor at CHA but this site registers a very different, much smaller pollen-source area. Besides, despite both CHA and LBL being located in a Balsam fir domain (Figure 1), Abies balsamea pollen is faintly represented in the pollen diagrams (Figures 3 and 4). As a matter of fact, balsam fir is better represented at FUR than at CHA within pollen zone 4, FUR being located in the Sugar maple – yellow birch bioclimatic domain. Only since around 2700 years ago at LBL, does balsam fir display percentage values typical of the bioclimatic domains it typifies (Fréchette et al., 2018, 2021).
Finally, given the very strong pollen underrepresentation of both balsam fir and sugar maple and their probable location on more (FUR) or less (LBL, CHA) abundant mesic sites in the landscapes, the vegetation of pollen zone 4 can be described as belonging to the Balsam fir – white birch bioclimatic domain with increased local abundance of black spruce at Labelle, to a Balsam fir – yellow birch domain at Chasseur, and to a Sugar maple – yellow birch domain at Fur, but with the comments and caveats mentioned. Other tree species than those previously mentioned were present around the sites, among which red maple everywhere, and speckled alder (Alnus incana (Du Roi) R.T. Clausen), tamarack, ash and eastern white cedar on hydric but also on mesic locations. The latter was more abundant than at present between 6000 and 3000 cal. BP around CHA and LBL. Among thermophilous tree species, it is only around FUR that hemlock (Tsuga canadensis (L.) Carrière) is somewhat present, and during Late-Holocene only according to pollen percentages (Figure 3). American beech is also very rare at FUR, and admittedly absent around the other two sites.
Detection of Acer saccharum local presence
Observation of the pollen percentage curves of a given taxon in terms of the size of the corresponding populations is traditionally interpreted as follows (Faegri et al., 1964): (1) absence of pollen is indicative of a probable absence regionally, being admitted that an absence can never be proven; (2) very faint and discontinuous percentages along a series of samples is interpreted as an apparently regional presence and (3), similar but continuous values indicate a local or regional presence of the taxon; (4) a definite increase in pollen percentages indicates the spread of the populations around the sites and (5), further sustained increases or decreases translate changes in the populations’ size. Similar rules may be applied to the interpretation of the PAR values of a given taxon. As demonstrated above for black spruce, jack pine, white pine and tree-size birches, changes in population size deduced from pollen percentages (%) may or may not be corroborated by the pollen accumulation rates (PAR), both in relative abundance and/or timing over the sequence of samples. Due to the scale of the pollen diagrams, % or PAR curves of Acer saccharum for Lake Labelle (Figures 3 and 4) are of little help for our purpose of tracing back the origin of the isolated sugar maple stand located nearby (Figure 1).
By increasing the scale of the percentages for the Acer saccharum pollen curve for two sites, one gets a better grasp on the changes through time (Figure 5). As expected, percentages are greater at FUR, albeit irregular, but the 0.5% threshold is surpassed early in the time series. The trend at this site is one of increasing relative abundance since 9000 cal. BP, which corresponds to the spread of sugar maple in southern Québec (Blarquez and Aleman, 2016). The pollen percentage threshold value of 0.5 (Davis et al., 2021) is quite regularly registered since c. 7700 cal BP at FUR and is even previously surpassed c. 9000 cal. BP. Percent values are much lower and discontinuous at CHA and even more at LBL (Figure 5). The boosted pollen sum (PS) from a minimum of 250 (PS250) to a minimum of 750 (PS750) grains of terrestrial taxa for Acer saccharum at CHA and LBL, better assesses the relative changes in sugar maple mutual (Figure 3) and individual (Figure 4) pollen representation through time for those two sites. The PS750 % values are somewhat more continuous then PS250 values at both sites, especially at LBL between 10,000 and 7000 cal. BP where they are regularly close to the threshold (Figure 5). Moreover, a lowering of the values is clearly recorded between c. 7000 and 4500 cal. BP at both sites on the PS750 curves. This feature happens during the long transitional time lapse between maximum % and PAR values of Pinus strobus, to that of Betula spp. (Figures 3 and 4). The usual threshold of 0.5% for the probable presence of sugar maple nearby lakes CHA and LBL after drainage of Glacial Lake Agassiz-Ojibway is seldom exceeded throughout the sedimentary sequences. Admittedly, the 0.5% threshold seems inappropriate to closely follow sugar maple establishment and subsequent eventual expansion over time.
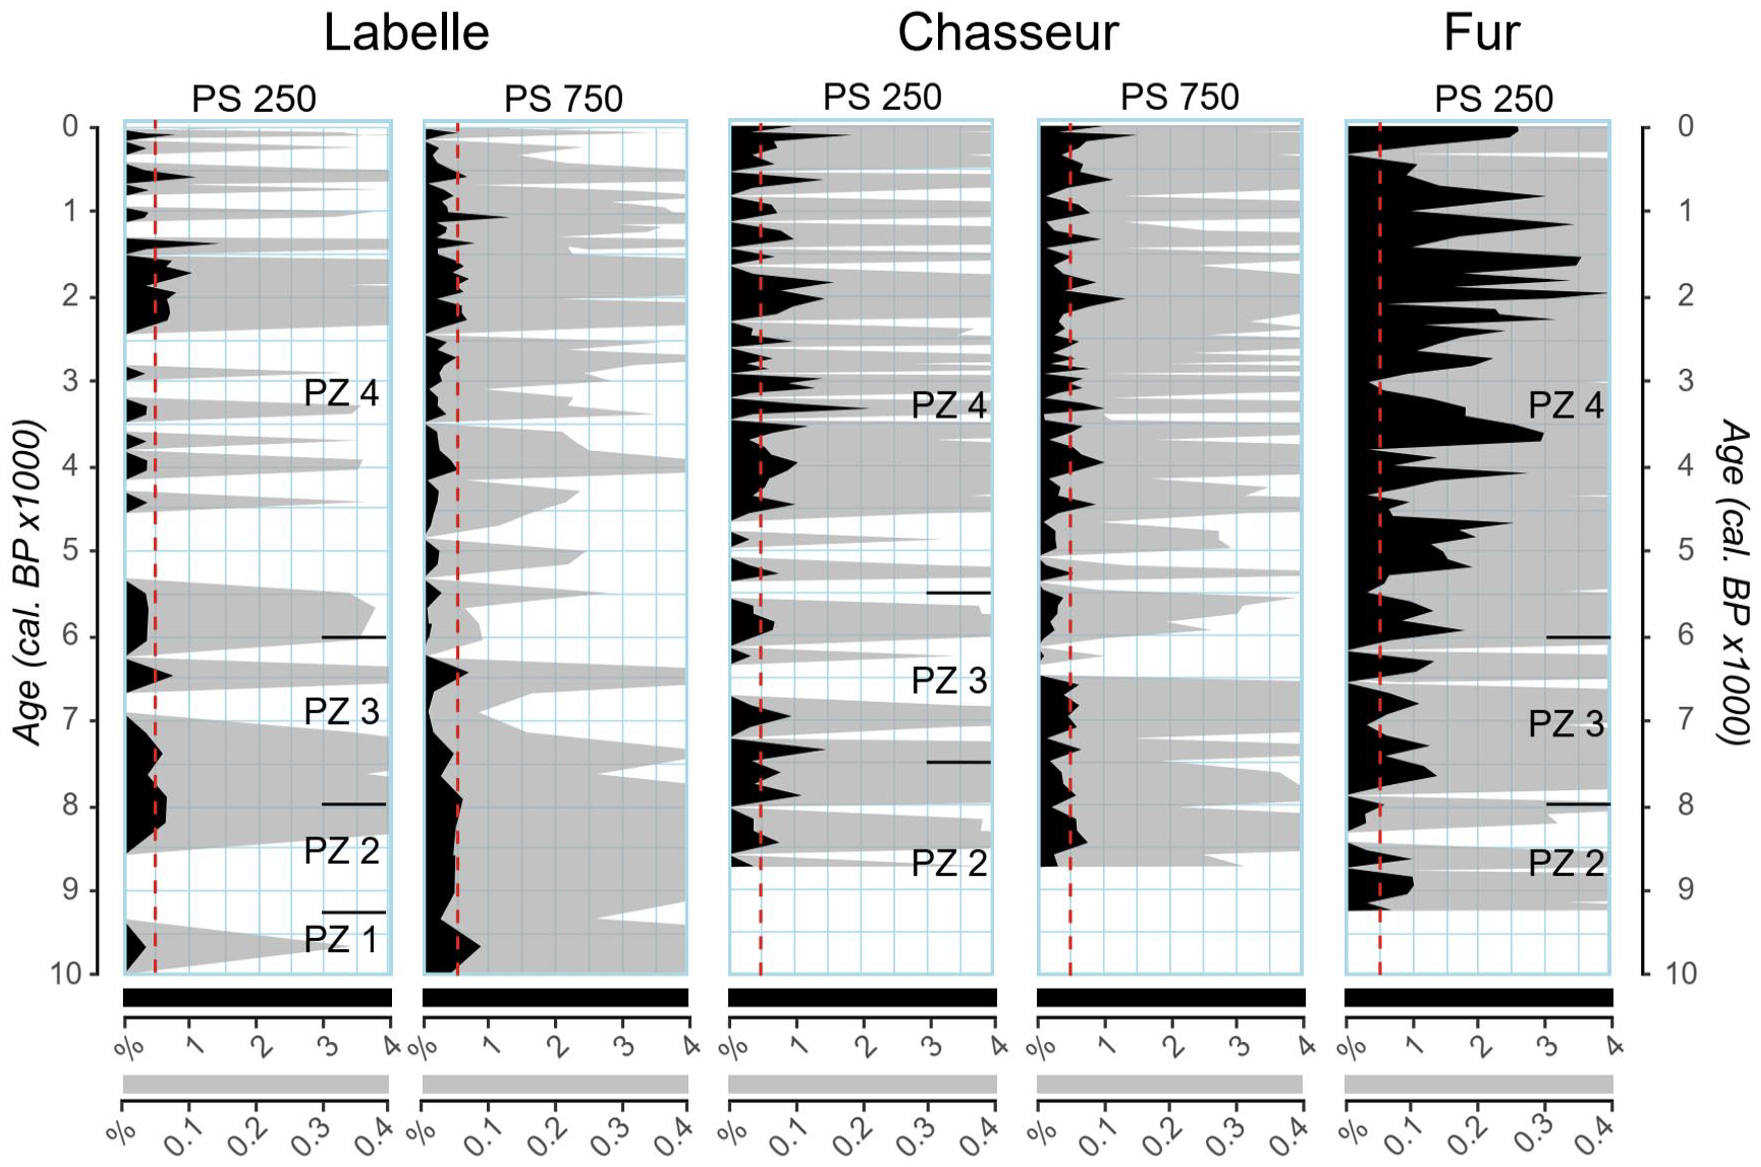
Acer saccharum pollen percentages according to the size of the minimum pollen sum (PS) at Labelle and Chasseur. Horizontal lines at the right of the PS250 columns delimit the various pollen zones (PZ) of the diagrams (Figure 3). Dashed red lines are the 0.5% pollen threshold value for Acer saccharum (Davis and Jacobson, 1985; Davis et al., 2021).
Consequently, we explored the information provided by the pollen accumulation rates of Acer saccharum and derived a local threshold value applicable to each lake for the last 200 years (Figure 6). The Acer saccharum PAR thresholds (AS_PARTHRESH) were set at the median values of 49.5, 27.0, and 241.5 pollen grains.cm−2.yr−1 for LBL, CHA and FUR respectively, based on centimetric analyses for the last 200 years (Supplemental Table S.2, available online). PAR values parallel closely the pollen concentration (PC) values but the shape of the curves is somewhat modified by the 210Pb-derived age model for the surficial sediments (Figure 2). The individual AS_PARTHRESH differs widely from lake to lake because of their individual size and corresponding pollen-source area, and the unique related deposition and redeposition processes, as mentioned above. Being surrounded by sugar maple dominated stands (Figure 1), FUR has the highest threshold. The age model depicts an increasing PAR curve during the last two centuries, the recent decline being most probably due to logging in the pollen-source area. Sugar maple is much rarer around CHA, despite an isolated stand located c. 1 km south of the lake (Figure 1). This site displays the lowest AS_PARTHRESH due to its small size and related properties. It also shows a bimodal trend, with sustained decrease to minimum values centered on 1925 A.D., followed by an increase. Sedimentary charcoal has been found around the minimum, and fire may have affected sugar maple populations in the vicinity of CHA. The AS_PARTHRESH at LBL is twice than at CHA because of a larger pollen-source area due to the larger size of the lake, despite sugar maple being very sparse around, except for the maple stand we want to investigate the Holocene history.
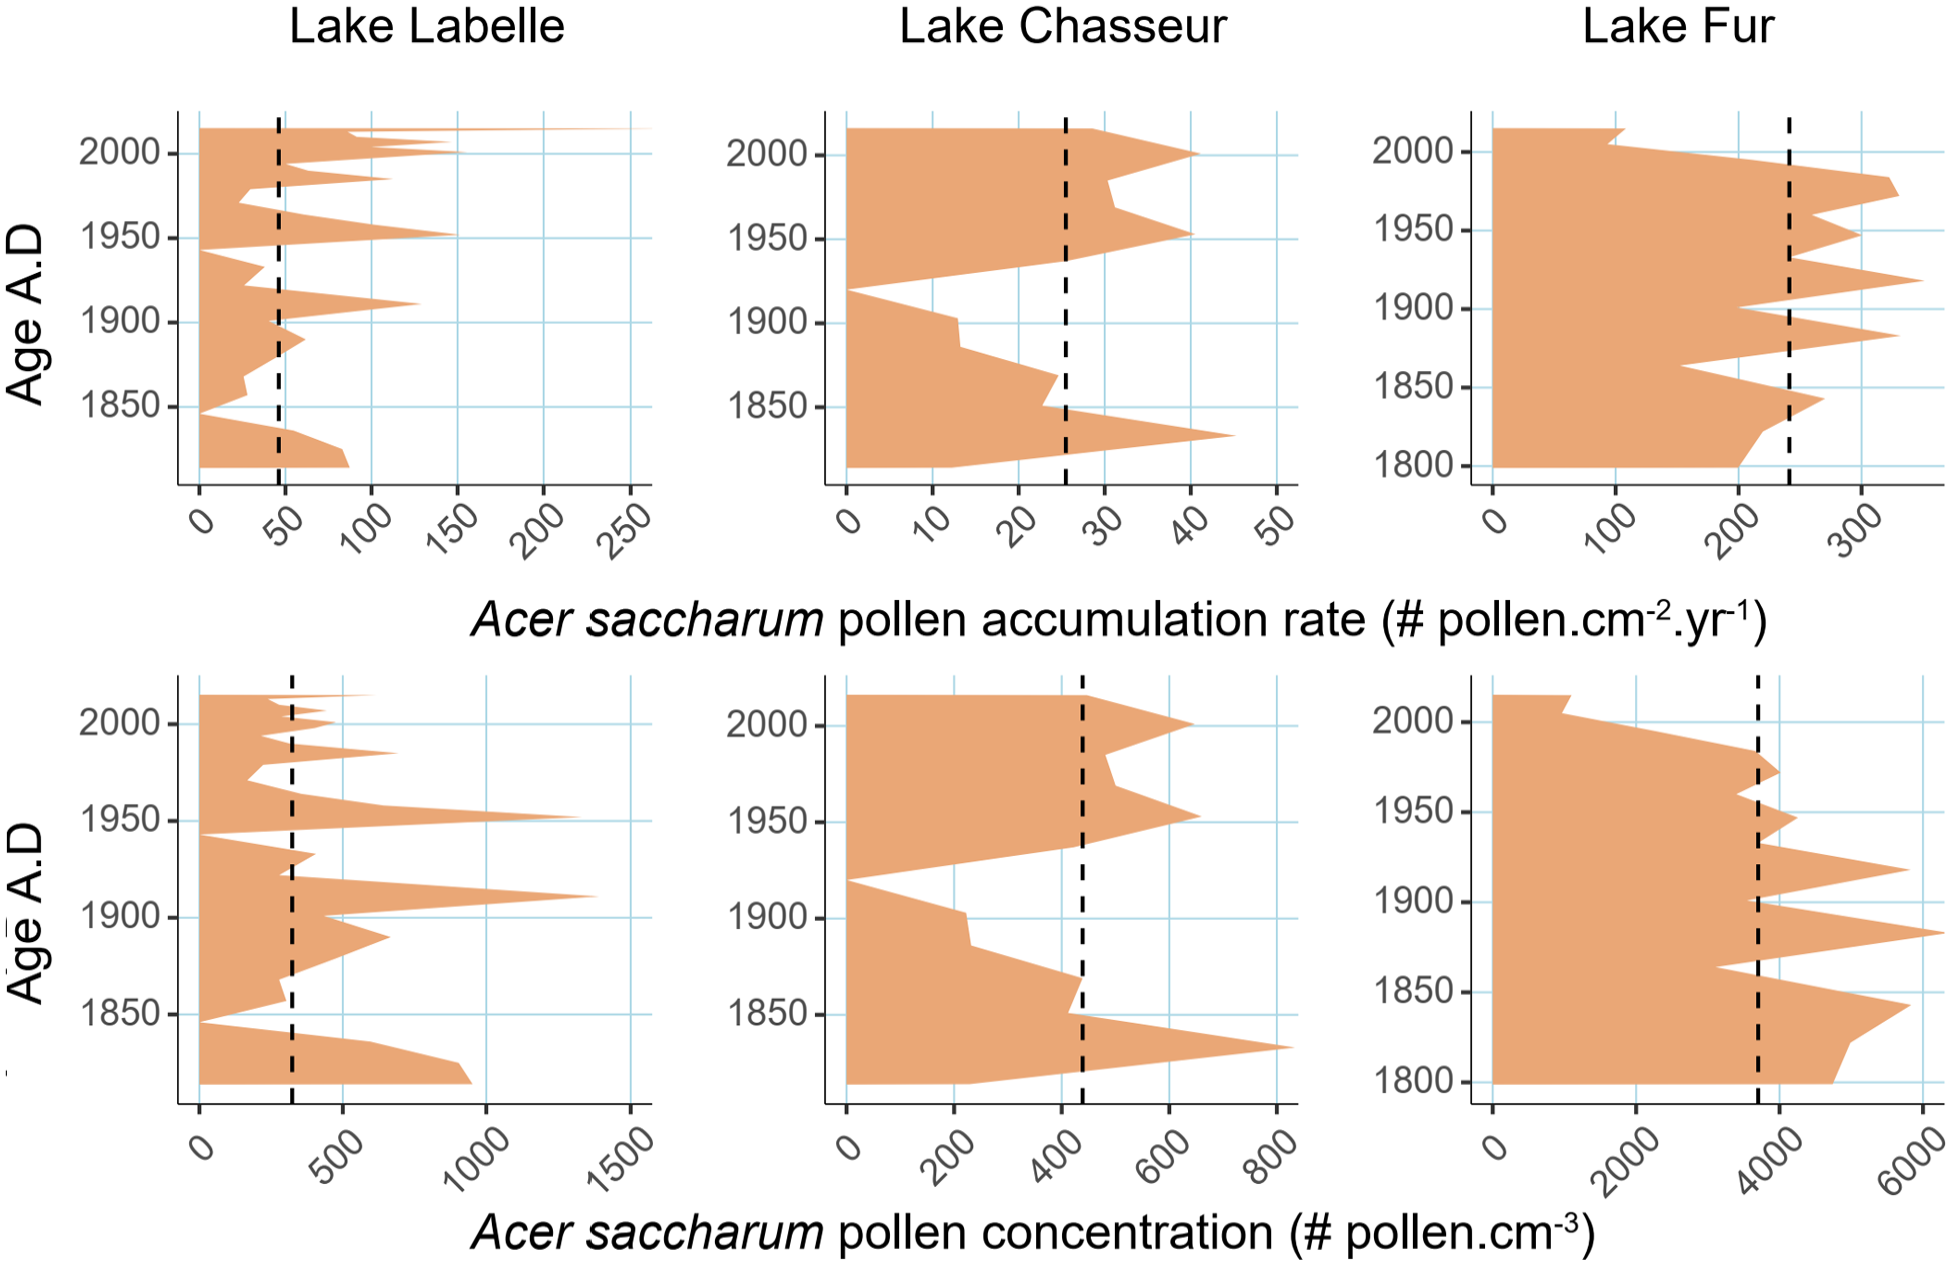
Acer saccharum pollen accumulation rate (top row) and pollen concentration (bottom row) for the last 200 years at each site. The vertical dashed lines are the median values for the last 200 years.
The left side of Figure 8 pertains to the application of the local AS_PARTHRESH values to their corresponding site during the entire period of time represented by the lakes’ sediments. The figure also displays the pollen percentages and concentration curves and associated thresholds. Comparison between accumulation rate and concentration curves highlights the effect of the age models (Figure 2), the case of Lake Labelle being the most evident during Early Holocene times. One can also compare the trends of % and PAR curves and both threshold values during the last 9000 years and beyond for LBL. The AS_PARTHRESH at FUR is approached or slightly surpassed since 7800–5100 cal. BP (Figure 8c). This is not entirely satisfactory since FUR belongs to the Sugar maple– yellow birch bioclimatic domain and maple stands are widespread around the lake today. Lake Fur recent PAR threshold is apparently set too high for its application to the entire Holocene. Because sugar maple abundance was historically favored by the postcolonial harvesting of the much-prized white pines timber (Danneyrolles et al., 2016), its populations should have been smaller during pre-industrial times. For this site, the 0.5% threshold for a probable presence of sugar maple nearby seems more reliable than the PAR threshold but it can be noted that the long-term trend of both curves is similar.
Keeping this in mind, an establishment date around 7800 cal. BP around FUR consequently seems acceptable, and 5100 cal. BP would represent the expansion of sugar maple in the area, with a further expansion between 3000 and 1500 cal BP (Figure 8c). At CHA (Figure 8b), the AS_PARTHRESH values are regularly approached only between 5500 and 4400 cal. BP, and regional establishment may be set at 5500 without further detectable expansion. This conclusion is not unexpected given the characters of this small lake ant its location within the Balsam fir – yellow birch bioclimatic domain. At LBL (Figure 8a), in the Balsam fir – white birch bioclimatic domain, the AS_PARTHRESH value is crossed only once at 4000 cal. BP and more continuously after 2700 cal. BP, with a recent decline in the last few centuries. The interpretation of those values points to a large establishment time range c. 5500–2700 cal. BP, with a higher probability of local establishment from 4000 to 2700 cal. BP. A local presence c. 5500– 4000 cal. BP could be possible but is difficult to assess without doubt. Furthermore, a local presence of sugar maple after 4000 cal. BP is more consistent with other palynological studies in the region (Richard, 1980) and is supported by Acer sp. macrocharcoals found in the mineral soils around LBL since 3500 cal. BP (Julia Cigana, personal communication). Consequently, sugar maple establishment around Lake Labelle may be set around c. 4100 cal. BP and its expansion, c. 2400 cal. BP. Finally, at all sites before around 5000 cal. BP, pollen focussing to the center of the lakes may be responsible for the elevated values of either % or PAR values, as mentioned at the onset of the section on vegetational history.
We conclude that determining local PAR thresholds for the detection of Acer saccharum establishment and further expansion is worthwhile despite problems, provided appropriate interpretations of the data. Our procedure contributed successfully to the identification of a Late-Holocene establishment of sugar maple around Lake Labelle, and of an even more recent expansion of the populations. The isolated, disjunct sugar maple stand located in the boreal forest of Abitibi besides Lake Labelle is admittedly the main contributor of Acer saccharum pollen at that site. The hypothesis of this stand being a relict from a larger and denser geographic range is thus rejected and a recent expansion, sustained over the Late-Holocene, appears as the successfully tested hypothesis.
Fire reconstructions
No striking similarities emerge from the charcoal accumulation rate (CHAR) of the three sites throughout the Holocene (Figure 7). While the CHAR generally decreases over time at FUR, LBL shows an opposite trend, with an increase c. 4000 cal. BP comparable to that found by other studies in the boreal forest (Carcaillet et al., 2001) followed by a decrease c. 2000 cal. BP to present-day. CHAR signal at CHA is characterized by a low background (red line), suggesting low charcoal regional input (Clark and Patterson, 1997). Here, a lower regional input can be explained by CHA site particularities: small lake size and catchment area and consequently reduced charcoal-source area, as for pollen inputs.
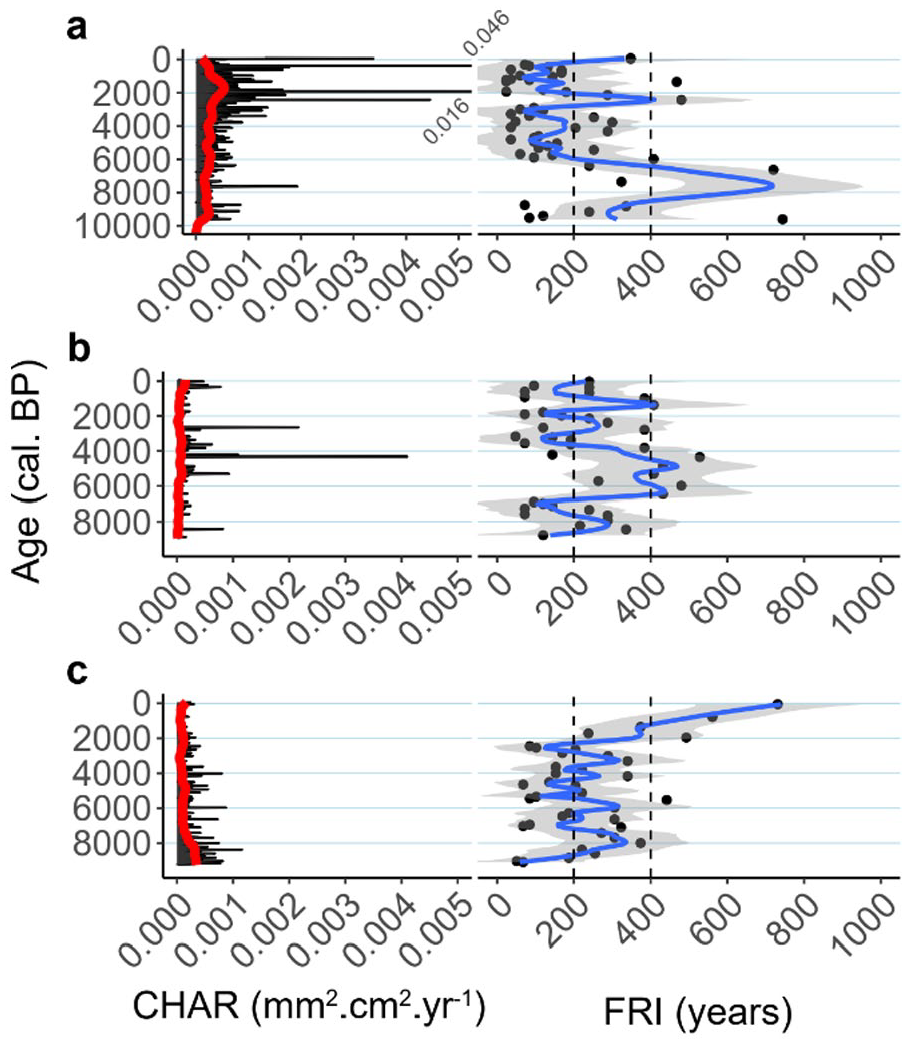
Charcoal accumulation rate (CHAR) and fire return interval (FRI) at Labelle (a), Chasseur (b) and Fur (c). CHAR background (red line). Dots represent single fire events and the blue line is a smoothed function (span = 0.2) of the (FRI) within the its gray envelope of the 95% confidence interval.
Similarly, the fire return interval (FRI) shows no common pattern for the three sites throughout the Holocene (Figure 7), and the FRI is not significantly different before and after Acer saccharum establishment (Table 2). The mean FRI at LBL and CHA, respectively 189 and 227 years (Table 2) are higher than the regional fire cycle estimated at 90 years for the boreal mixedwood forest (Bergeron et al., 2004). However, we observe that at LBL the FRI individual values (black dots) drop almost continuously below 100 years since 5000 cal. BP. During this period, a FRI over 250 years shows up only three times, first around 4300–3700 cal. BP and then, around 2400–2100 cal. BP and 1300 cal. BP (Figure 7). At FUR, the average FRI is comparable to a fire frequency of 188–314 years found by regional dendrochronological studies (Grenier et al., 2005). The last two millennia experienced an increase in the FRI reaching a maximum of 800 years at FUR.
Interestingly, boreal taxa such as Picea mariana, Abies balsamea, and Pinus banksiana increased at LBL during the Late-Holocene (Figures 3 and 4). Such a borealization process characterizes a large part of the study region (Carcaillet et al., 2001; Fréchette et al., 2018; Hennebelle et al., 2018) and is usually linked to an increase in fire occurrence since the beginning of the Neoglacial period (c. 4000 cal. BP). This should be an impediment to Acer saccharum increase but we saw that it was not the case around LBL, especially during the last half of the Neoglacial (Figure 8). Concomitantly to the sugar maple increase, balsam fir also displays a sharp increase c. 2700 cal. BP. The continuous abundance of the latter is corroborated by its PAR values (Figure 4) and suggests either low fire severity or the presence of a fire refugia, since balsam fir is a late successional species uncommon in fire-prone landscape (Ali et al., 2008; Bergeron et al., 2004; Jules et al., 2018).
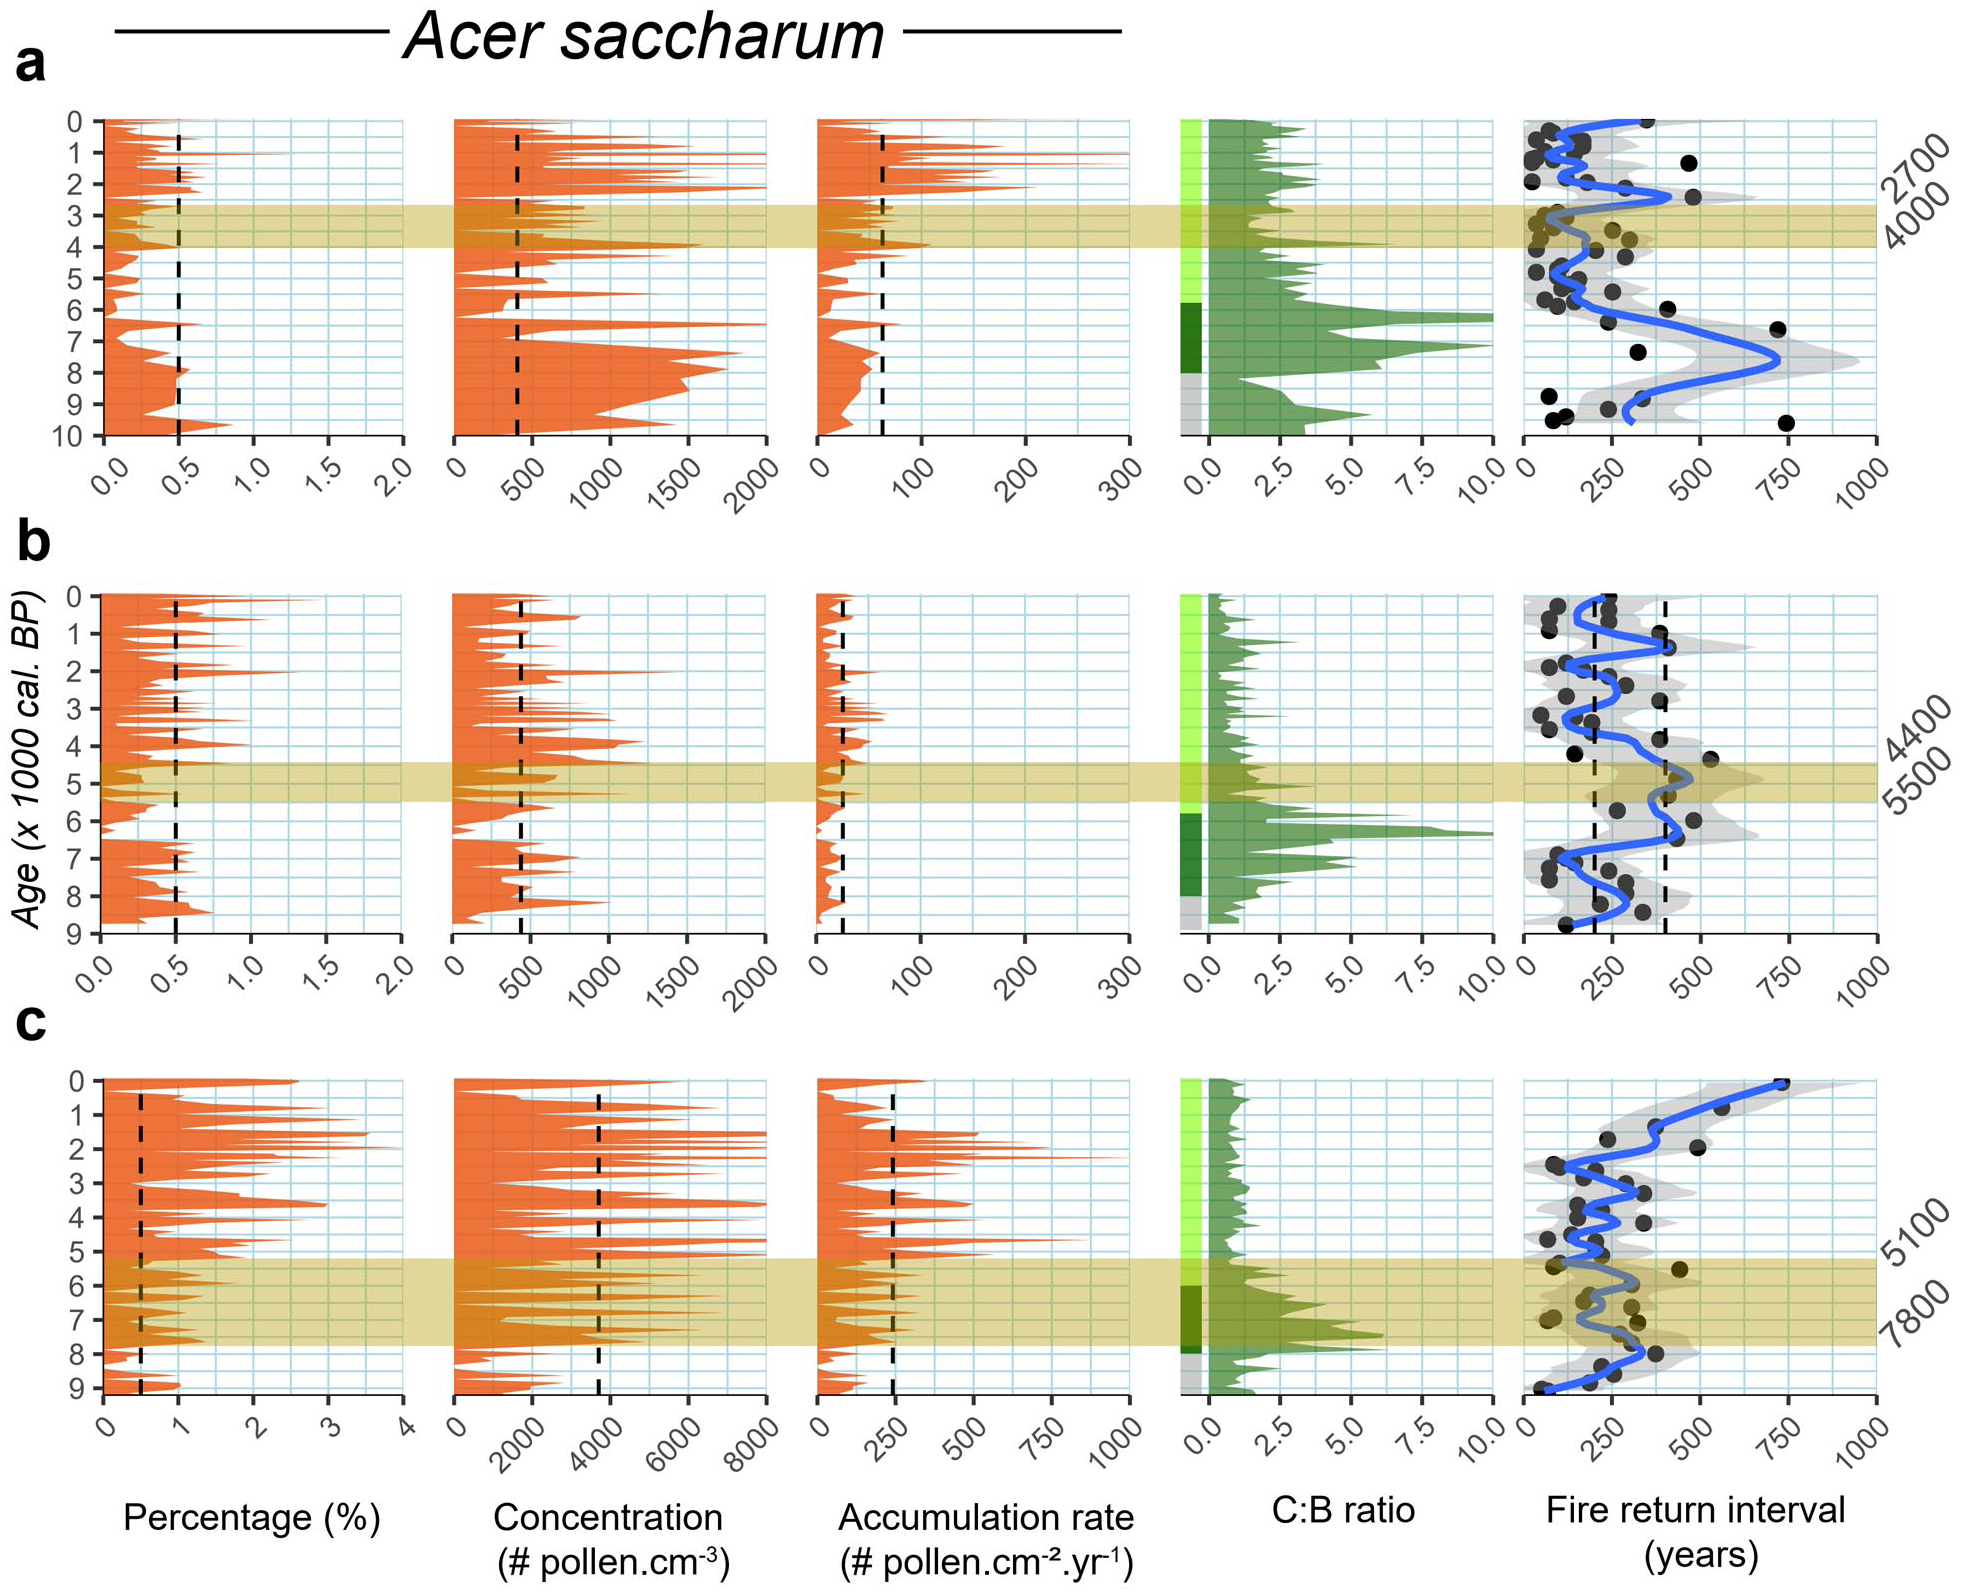
Comparison between Sugar maple holocene pollen data and local thresholds of presence/expansion for Labelle (a), Chasseur (b), and Fur (c) with indicators of dominant vegetation and with fire conditions. C:B corresponds to the Conifer:Broadleaves ratio along with main vegetation changes; Grey = afforestation, dark green = Pinus dominated forest, light green = mixedwood forest. The shaded horizontal band corresponds to the Sugar maple time range for local establishment identified to the right. Note changes in scales for Acer saccharum data.
Discussion
The pedoanthracological study conducted by Pilon and Payette (2015) at Rémigny site located a mere 800 m from Lake Chasseur (CHA) found macrocharcoal proof of Acer saccharum local presence c. 720 cal. BP. However, the authors found no older Acer saccharum macrocharcoal in support of earlier presence of the species, and only one Acer sp. macrocharcoal was found, dated at 150 years. They conclude, that the Acer saccharum present population colonized or regenerated after the last fire, 160–220 years ago. Similarly, a genetic study conducted on a nearby Acer saccharum stand, c. 7 km away from CHA interpreted the local haplotype difference of sugar maple from nearby populations as a result of a recent establishment, potentially during the last millennia (Graignic et al., 2018). To the contrary, our results point toward a much older local establishment possibly c. 5500 - 4400 cal. BP. The rarity of Acer saccharum macrocharcoals found by Pilon and Payette (2015) over the last several thousand years could result from a combination of taphonomic processes and range limit populations dynamics. First, sugar maple is a very bad producer of charcoal due to low flammability functional traits that is, thick bark (Thomas and Bennett, 2014), high canopy with low fuel vertical continuity, high water content in tissues, etc. (Drever et al., 2006). Second, Pilon and Payette (2015) report many charcoal pieces between 1000 cal. BP to present-day, but the number falls rather tremendously before 1000 cal. BP, suggesting that the mineral soil charcoal preservation is relatively poor, at least at this site. This drop in charcoal abundance could also be caused by a drop in the fire activity, but our lacustrine charcoal records (Figure 7) do not demonstrate any decreasing trend before 1000 cal. BP. Finally, the absence of Acer saccharum soil macrocharcoal could also reflect the range-limit dynamics, where many events of extinction and recruitment can happen within a restricted region. Therefore, the actual Acer saccharum population sampled by Pilon and Payette (2015), could result from a recent establishment at the site level, but the absence of macrocharcoal older than 720 cal. BP is not sufficient by itself to prove the local absence of the species in the neighborhood of Lake Chasseur.
The climate hypothesis
Except at FUR, LBL, CHA results show no definite evidence of Acer saccharum establishment nor expansion during the warmer portion of the Holocene c. 8000– 6000 cal. BP, a period known as the Holocene thermal maximum (HTM). Establishment and expansion at LBL and CHA rather occurred during the ensuing so-called, ill-defined Neoglacial cooler period c. 5000–0 cal. BP. As mentioned earlier, those findings refute the hypothesis concerning an HTM expansion and support the conclusions of Lafleur et al. (2010) and Graignic et al. (2014) that temperature is not the main factor controlling Acer saccharum northern range expansion.
The upper four rows of Figure 9 displays climatic information pertaining to the area under study. The solar radiation controls the energy incident on earth surface and it varies with seasons. The seasonal contrast was maximum c. 11,000 cal. BP and decreased to a minimum c. 6000 cal BP and then increased again to the present-day. Around 11,000 cal. BP incoming solar radiation was highest during summers and lowest during winters with a declining contrast to 6000 cal. BP, and the reverse occurred afterward to the present-day. Annual precipitation was about 175 mm less than the modern c. 900 mm value (Table 1) around 8000 cal. BP in the study area. when both summer and winter temperatures were respectively 2°C and 1.3°C higher (Figure 9). Percent summer sunshine was also 6% greater than at present around 8000 cal. BP and declined steadily afterward. Annual precipitation generally increased during the same interval until the last few millennia while temperature decreased, albeit more steadily during summers. This regional climatic reconstruction depicts changes at a millennial scale (Fréchette et al., 2018) and consequently, changes at smaller time scales are smoothed. Nevertheless, the broad climatic conditions under which the vegetation developed in the study area since 8000 cal. BP is adequately summarized and, by extrapolation, those of the previous two millennia. Changes in Lake Francis water level, a small lake located c. 40 km north of Lake Labelle, south of lake Abitibi (Figure 1), reacted to lower precipitation and/or higher evaporative balance 6800–5000 cal. BP and responded thereafter to moister conditions up to present days, except for a short period around 2000 cal. BP (Figure 9). Hence, Acer saccharum northern expansion was probably limited by the precipitation regime prior to 5000 cal. BP. As proposed by Payette et al. (2021), « relatively small changes in climate and fire frequency can shift (the) coexistence from mostly (white) pine to mostly (sugar) maple ». Such replacement of coniferous (C) to broadleaf (B) species during the Holocene has been picked up by the C:B pollen ratio for our three sites (Figure 8), A climate shift from hot/dry to cold/moist conditions would have led to an increase of mesic conditions for deciduous species, thus benefiting to Acer saccharum expansion. The process is summarized on the seventh row of Figure 9.
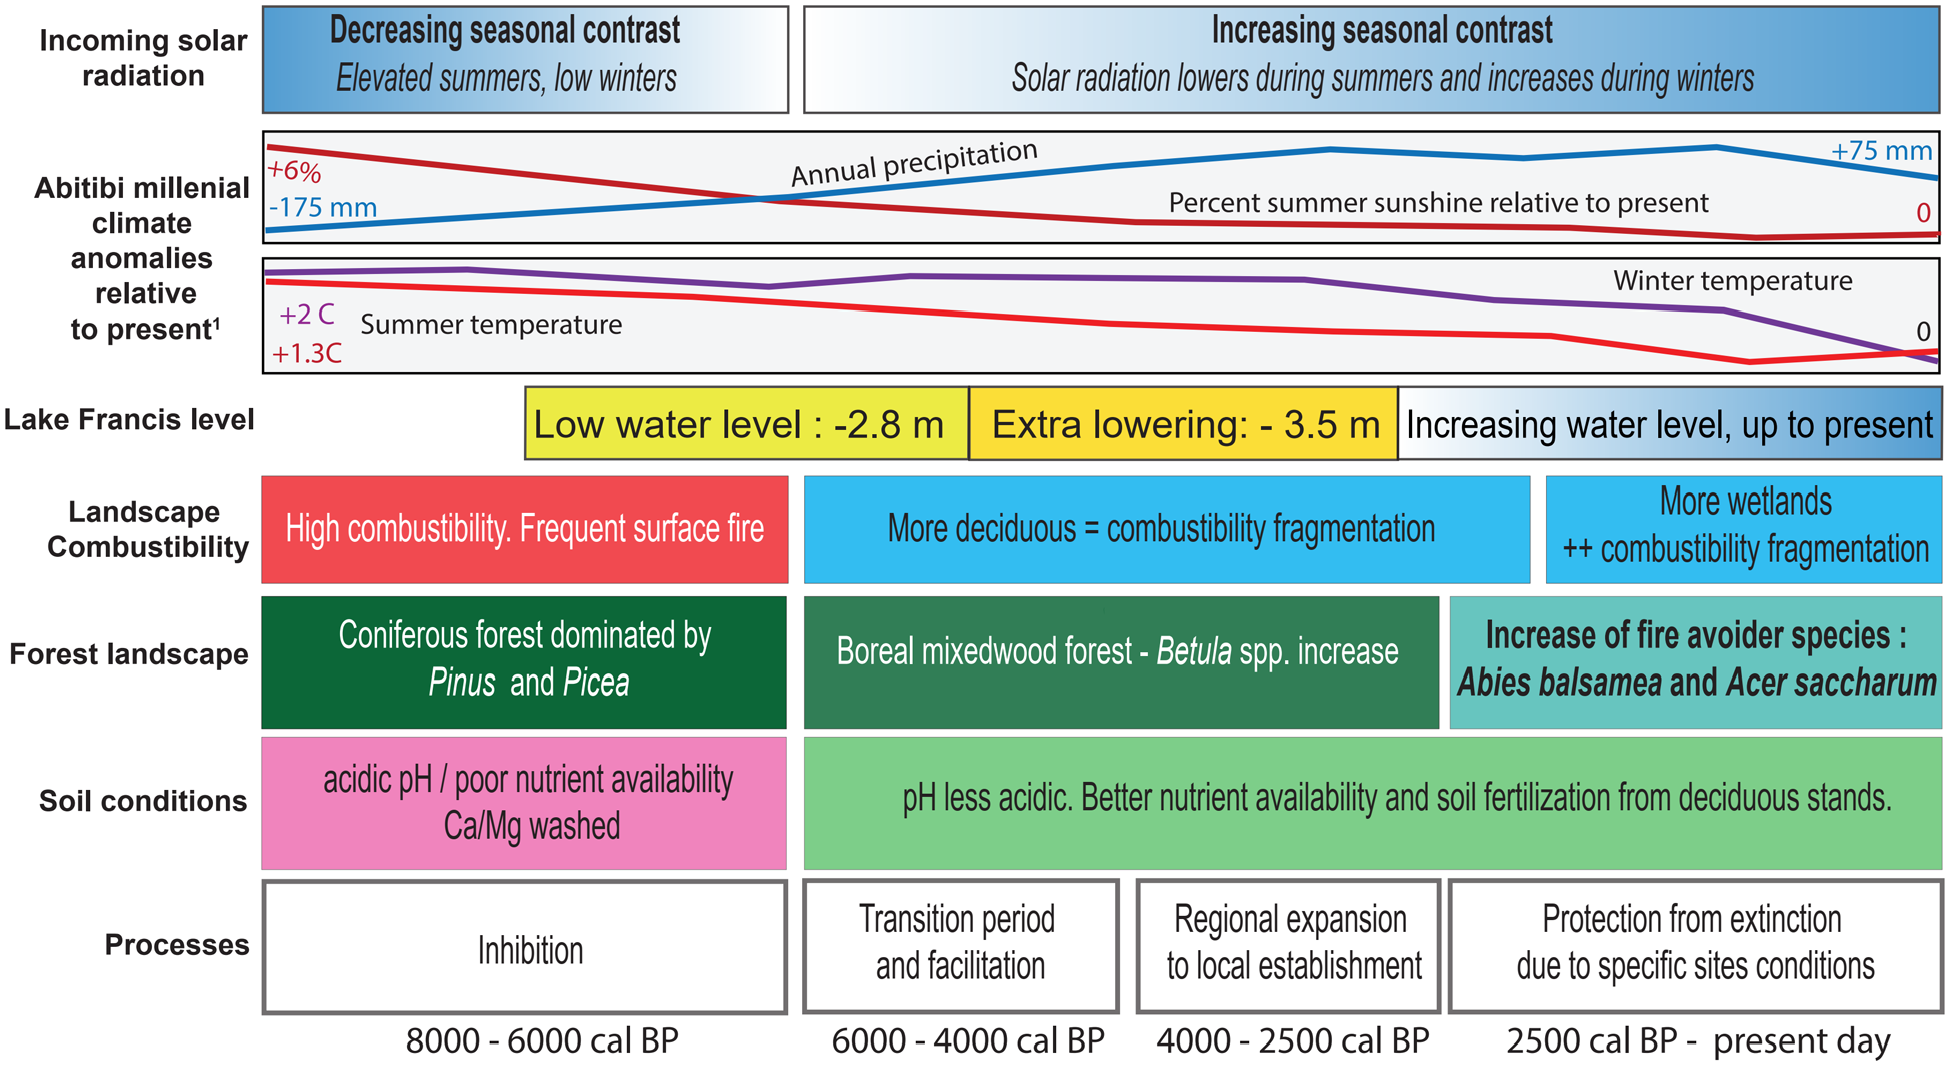
Climate forcing and conditions conducive to the proposed processes affecting the north-western Québec (Abitibi region) establishment of Acer saccharum throughout the Holocene.1 Fréchette et al. (2018). Lake Francis water level (P.J.H Richard, unpublished). Red and blue panels indicate highly flammable fuel (conifers) and slightly flammable fuel (deciduous), respectively. Note the varying time scale for the duration of the three periods identified from 8000 to 0 cal. BP.
The fire hypothesis
Our results show that there is no statistical relationship between a higher FRI and Acer saccharum establishment or survival. In fact, Acer saccharum presence at LBL corresponds to shorter FRI (Figures 7 and 8), Other ecological studies (Nolet et al., 2008; Pilon and Payette, 2015; Richard, 1995; Talon et al., 2005) already noted the capacity of Acer saccharum to regenerate after fire. Admittedly, Acer saccharum post-fire regeneration requires the presence of survival trees after a fire and their capacity to produce stump sprouts. In both cases, Acer saccharum regenerative success will depend on the fire severity and size, both controlled by climate, and landscape fuel connectivity, combustibility and flammability. Around 6000 cal. BP, the replacement of Pinus strobus by Betula spp. changed the fire regime. Studies found that Pinus strobus is favored by surface fires that eliminate the competitive shade-tolerant species and guarantee the species regeneration (Brown, 2009; Hébert et al., 2019). Therefore, we hypothesized that white pine dominance prior 6000 cal. BP promoted frequent surface fires, which may not have been successfully identified by our charcoal analysis (Figure 7). Its widespread replacement by white or yellow birches, probably caused by decreasing summer temperature and a change in fire regime (Larochelle et al., 2018), effectively fragmented the landscape with regard to combustibility and flammability. This would promote smaller fires, hence increasing survival of sugar maple trees. Surprisingly, the higher fire frequency recorded at LBL during Acer saccharum presence (Figure 7) did not have the expected negative impact on its survival, possibly because sugar maple benefited from the fragmented fire landscape created by widespread white birch groves.
These interpretations are as good as our capacity to reconstruct the actual local fire history using charcoal from lake sediments. These charcoals may reflect a more regional dynamic. Recent studies showed that charcoal dispersion could be larger than expected (>30 km in some cases) and charcoal accumulation in lake sediment is not directly linked to proximity of fires (Hennebelle et al., 2020; Oris et al., 2014). Many conditions connected to the watershed and weather conditions during a fire event can affect the CHAR and reduce our ability to reconstruct the local fire history from lacustrine sediments. Specific site characteristics such as lakes, wetlands and slopes should also be considered. They act as natural firebreaks, promoting the formation of fire refugia. In Western Québec, Ouarmim et al. (2014) found that fire refugia, principally in wetlands, could avoid wildfires for several centuries to millennia. A close look upon LBL site conditions (Supplemental Figure S.1, available online) shows a very fragmented fire landscape with many wetlands, lakes and steep slopes (MFFP, 2020), all potentially promoting fire refugia and fire avoiding species. As a result, we can clearly observe that the last fire which occurred near LBL in 1925 (MFFP, 2021) was stopped by the downslope surrounding the lake thus protecting the local Acer saccharum population. Besides the large, isolated sugar maple – yellow birch forest stand near Lake Labelle, several small populations of sugar maple are scattered across the landscape around LBL, mainly on hillside’s steep slopes (Cigana et al., personal communication). Those scattered populations coupled to the possible presence of fire refugia probably played a critical role into Acer saccharum local persistence. Those processes are summarized on the fifth and sixth rows of Figure 9.
The role of species interactions: inhibition and facilitation
For LBL and CHA, Acer saccharum pollen accumulation rate increases after a decrease in the pollen-based Conifer:Broadleaves ratio (C:B) (Figure 8, beige horizontal bar). At LBL, local establishment of sugar maple somewhere between 4000 and 2700 cal. BP corresponds to a C:B smaller than 2.5 that occurs almost 2000 years after a sharp decrease. It is about the same at sites 1, 2, and 3 north of Lake Labelle in the Balsam fir – white birch bioclimatic domain (Figure 1, Fréchette et al., 2018). At CHA, the establishment dates back 5500–4400 cal. BP and corresponds to a C:B of c. 1.25 occurring after a mere 500 years or so, similarly to what happened at other sites in the Balsam fir – yellow birch bioclimatic domain (sites 4 and 5, Figure 1). This contrasts with FUR, the southern site located in the Sugar maple – yellow birch bioclimatic domain (Figure 1). There, the Acer saccharum establishment occurred much earlier (7800–5100 cal. BP) and contrary to LBL and CHA, it happened during a maximum of the C:B ratio due in part to jack pine (Pinus. cf. banksiana) but essentially to abundant white pine (P. strobus) (Figures 3 and 4). At FUR, sugar maple was locally present during elevated (4–6) C:B ratio values but dominance status was only reached after 5100 cal. BP with C:B <1. It is essentially the same C:B context for sites 6, 7, 8, and 9 located in the same bioclimatic domain (Figure 1). Our latitudinal transect thus shows that the further an Acer saccharum population is from the main, continuous range area (Figure 1), the more it is affected by coniferous trees. This observation matches the central-marginal population dynamics theory where marginal populations are expected to be more sensitive to environmental changes (Guo, 2014). Interestingly, even if at CHA the C:B ratio drops below 1.25 (Figure 8), sugar maple never reached a dominant status comparable to that at FUR. This means that other biotic or abiotic variables impede the species from forming larger populations around this site located in the Balsam fir – yellow birch bioclimatic domain. Considering the timing between the C:B ratio and the Acer saccharum pollen accumulation rate, it appears that a Conifers versus Broadleaves abundance could have played a key role on the Acer saccharum northern establishment and expansion and southern dominance, through complex processes of inhibition and facilitation.
Based on the vegetation reconstructions, we argue that the coniferous litter falling over soils (mainly from genus Pinus) was the major driver of the soil physiology and chemistry until 6000–5500 cal. BP (Figures 3, 4, and 9). Soils under coniferous stands are acidic, a condition that favors nutrient leaching, and they display a thick litter described by many as a physical barrier against Acer saccharum seedlings germination (Collin et al., 2017a; Graignic et al., 2014; Major and Nosko, 2011; Solarik et al., 2016). On the other contrary, broadleaf species, and particularly Betula spp. for that matter, increase soil pH and concentration of nutrients like N, Ca, K, and Mg (Miles and Young, 1980; Polyakova and Billor, 2007; Sanborn, 2001). Because sugar maple is highly sensitive to adequate nutrient availability (Collin et al., 2017a), increase in Betula spp. abundance c. 6000–5500 cal. BP would have been a transition period giving time for the soil conditions to be more favorable to Acer saccharum needs. Other deciduous species could have had facilitation effect, such as aspen which has been reported to fertilize the soils in boreal and subalpine ecosystem (Cavard et al., 2011; Nagati et al., 2019). Red maple is also a potential facilitator for the establishment of sugar maple due to the shared mycorrhizal communities between the two species. As demonstrated by Carteron et al. (2020), the absence of arbuscular mycorrhizae is strongly reducing Acer saccharum performance. Although, those two species (Populus tremuloides and Acer rubrum) were probably present before and during Acer saccharum establishment, they are also largely underrepresented in pollen diagrams making it difficult to assess any facilitation mechanisms on a long time scales.
The above considerations pertain to sugar maple small populations and isolated stands in the vicinity of Lake Labelle (LBL) and Lake Chasseur (CHA) (Figure 1) but they fall short to explain the results for Lake Fur. In the Sugar maple – yellow birch bioclimatic domain, the mature stands on the much more widespread mesic sites often comprise a large proportion of Pinus strobus, especially in western Québec (Brown, 1981; Saucier et al., 2009) and adjacent Ontario. Veteran white pines overtop the canopy of the mature sugar maple and yellow birch trees, and pine crowns almost touch each other even if the individual boles are largely separated on the ground. Standing by a white pine and looking around in the forest, one can barely see the next pine tree, if at all (Jean-Louis Brown, personal communication). Those are the structural characters of old-growth forests and they are very rare nowadays. The soil litter is largely composed of sugar maple and yellow birch leaves and there are no signs of a negative impact from the sparse white pine litterfall on soil physiology and chemistry. Obviously, a negative effect of coniferous litters on sugar maple development does not apply in those cases. Moreover, the above-described effect of coniferous litters on sugar maple establishment and nutrition are active at the stand scale and unfortunately, pollen analysis of lacustrine sediments only provides a remote-sensing of the surrounding vegetation in the past, within pollen-source areas of various sizes. Consequently, the inhibition/facilitation hypothesis appears as a generalization at the scale of landscapes. Nevertheless, given the lack of evidence for climatic or forest fire effects on the establishment or expansion of Acer saccharum around our sites, the hypothesis appears worth considering. Stronger evidence based on stand-scale local studies are needed to test this hypothesis, either from pollen analysis of soil humus or peat accumulated in forest hollows, or through identification of coniferous and broadleaf species of dated charcoals in the mineral soils.
Figure 9 summarizes all the elements of this discussion that pertain to the establishment of the isolated, northern outlier of sugar maple stand nearby Lake Labelle and Lake Chasseur (Figure 1). Basically, under the solar forcing and the climate conditions, the northern establishment of Acer saccharum at LBL was controlled by two factors: moisture conditions and an increase in broadleaf species over conifers. From 8000 to 6000 cal. BP, inhibition processes, that is, frequent and large surface fire and poor nutrient availability, driven by Pinus genus was dominant. From 6000 to 5000 cal. BP, the increase in Betula spp. countered those inhibition processes by (i) fragmenting the landscape combustibility and reducing fire sizes, and by (ii) increasing soil pH and nutrient concentrations. Therefore, we hypothesize that Pinus strobus played a critical role in delaying Acer saccharum expansion in the past, especially during the HTM when the growing conditions for temperate species were supposedly better. These conclusions support recent ecological studies showing that the soil biotic and abiotic factors will be a major impediment to the temperate species expansion in response to climate change (Carteron et al., 2020; Collin et al., 2017b; Solarik et al., 2016). From 2700 cal. BP, Acer saccharum and Abies balsamea increases were synchronous with the rise of Lake Francis water level. More precipitation in the region would result in more wetlands and mesic habitats formation, increasing the survival of fire avoiding species.
Conclusion
This paleoecological study of three lacustrine cores along a latitudinal gradient demonstrates that Acer saccharum northward establishment, expansion, contraction and persistence are not linked to direct effects of temperature but rather to an inhibition/facilitation dynamic driven by an increase in Betula spp., enhanced by a precipitation regime that promoted the improvement of mesic sites. Unlike Pinus strobus and contrary to expectations, Acer saccharum pollen representation experienced no increase during the HTM but instead increased c. 5000 cal. BP, about 1000 years after the expansion of Betula spp. (likely Betula papyrifera around Lake Labelle). We deduce that abundant and widespread Pinus strobus first excluded Acer saccharum during the HTM by producing a thick litter, acidifying the soils, hence reducing nutrient availability for sugar maple seeds. The subsequent increase of Betula spp. c. 6000–4000 cal. BP then played two key roles: (i) fertilization of the soil and (ii) fragmentation of the landscape against fire, thus leading to increased probability of sugar maple survival. This second effect would have further been enhanced c. 2900 cal. BP by an increase in precipitation, leading to more wetlands and mesic sites. Altogether, the ecological succession of Betula spp. during 1000 years and the increase in precipitation allowed a northern establishment of Acer saccharum c. 5500– 4400 cal. BP at CHA and c. 4000–2700 cal. BP at LBL. Afterward, Acer saccharum survivorship shows no relationship with the fire return interval and may only be explained by a landscape promoting beneficial microclimate on hilltops or other natural firebreaks, creating potential small-scale fire refugia. This study concludes that inhibition and facilitation dynamics probably played a crucial role in Acer saccharum northern expansion. More studies on the Holocene dynamics of Acer saccharum marginal populations are needed to test our conclusions and possibly develop a model that would give insights on how Acer saccharum northern populations may respond to ongoing climate changes. The potential benefits of our approach using local pollen accumulation rate threshold values to trace Acer saccharum local presence and absence should be further examined and applied to other marginal population in order to improve interpretations. Regarding the ongoing climate change, warmer and wetter climate could benefit Acer saccharum northern expansion where the proportion of broadleaf trees is already high and preferably on locations protected from fire. Sites occupied today by Picea mariana and Pinus banksiana pure stands could eventually be colonized by Acer saccharum only after several generations of broadleaf species development according to our results. The process of sugar maple northern migration would hence be delayed by several centuries.
Supplemental Material
sj-docx-1-hol-10.1177_09596836231183065 – Supplemental material for Postglacial establishment and expansion of marginal populations of sugar maple in western Québec, Canada: Palynological detection and interactions with fire, climate and successional processes
Supplemental material, sj-docx-1-hol-10.1177_09596836231183065 for Postglacial establishment and expansion of marginal populations of sugar maple in western Québec, Canada: Palynological detection and interactions with fire, climate and successional processes by Jordan Paillard, Pierre JH Richard, Olivier Blarquez, Pierre Grondin and Yves Bergeron in The Holocene
Supplemental Material
sj-docx-2-hol-10.1177_09596836231183065 – Supplemental material for Postglacial establishment and expansion of marginal populations of sugar maple in western Québec, Canada: Palynological detection and interactions with fire, climate and successional processes
Supplemental material, sj-docx-2-hol-10.1177_09596836231183065 for Postglacial establishment and expansion of marginal populations of sugar maple in western Québec, Canada: Palynological detection and interactions with fire, climate and successional processes by Jordan Paillard, Pierre JH Richard, Olivier Blarquez, Pierre Grondin and Yves Bergeron in The Holocene
Footnotes
Acknowledgements
We thank Raynald Julien, Andy Hennebelle, Evrard Kouadio and Léa Peter for their help during fieldwork and laboratory tasks. We are also very thankful to the two anonymous reviewers whose comments and recommendations have greatly improved the manuscript, and to Dr. Fabienne Marret, editor, who efficiently handled the review process for The Holocene.
Authors’ contributions
Paillard, Blarquez and Bergeron designed the project. Fieldwork was led by Blarquez and done by Paillard, Grondin and students. Sediment, pollen and charcoal sampling and analyses, preparation of samples for radiocarbon dating and data handling were done by Paillard and Blarquez. Richard tardily joined the team for the interpretation of the pollen data. Grondin and Bergeron provided the field and financial support for the project. Paillard and Richard wrote the final draft of the paper with the help of the other authors.
Funding
The author(s) disclosed receipt of the following financial support for the research, authorship, and/or publication of this article: This research was supported by the Natural Sciences and Engineering Research Council of Canada (NSERC) through a Research Chair Grant (IRCPJ222673-13 to Bergeron), and by a team Grant (2019-PR-253071 to Bergeron and Blarquez) from Fonds de recherche du Québec Nature et Technologies (FRQNT). JP was supported by a FRQNT scholarship in association with Ryam gestion forestière as an industrial partner.
Supplemental material
Supplemental material for this article is available online.
References
Supplementary Material
Please find the following supplemental material available below.
For Open Access articles published under a Creative Commons License, all supplemental material carries the same license as the article it is associated with.
For non-Open Access articles published, all supplemental material carries a non-exclusive license, and permission requests for re-use of supplemental material or any part of supplemental material shall be sent directly to the copyright owner as specified in the copyright notice associated with the article.