
Abstract
Peatlands are receiving increasing attention in palaeoenvironmental research and represent very useful terrestrial archives for reconstructing vegetation, climate and human history. Previous palaeoenvironmental studies in the Fotsch Valley, Stubai Alps, Austria, focused on geoarchaeological investigations on the Ullafelsen representing a very important prehistorical encampment site used by Mesolithic hunter-gatherers (10.9–9.5 cal. kyr BP). In order to contribute to a better understanding of the landscape evolution of the Fotsch Valley, we here studied the close-by subalpine ‘Potsdamer Hütte Mire’ by applying radiocarbon dating as well as elemental, biomarker, compound-specific stable isotope, palynological and macrofossil analyses on bulk peat samples. The calculated age-depth model using R Bacon indicates the beginning of peat formation during the Early Holocene and shows a strongly reduced peat accumulation rate (PAR) from 170 to 121 cm depth (8.5–2.1 cal. kyr BP) and/or a striking hiatus. Results of leaf wax-derived n-alkane biomarkers as well as macrofossils and palynological indicators reflect the local presence of coniferous trees and the synchronous expansion of deciduous trees during the Early Holocene. The above-mentioned strongly reduced PAR and/or hiatus coincides with the Neolithic, the Bronze and the Iron Age, and goes hand in hand with strong changes in vegetation and an increase of micro-charcoal and black carbon. Despite age uncertainties, these changes can be explained with strongly increasing human and livestock activities in form of deforestation, domestic fires and the beginning of Alpine pastoralism. The latter is confirmed by the finding of pasture and cultural indicator pollen (Cerealia-type, Rumex, Plantago lanceolata, Poaceae) occurring since the Middle to Late Bronze Age. The oxygen isotope composition of sugar biomarkers (δ18Osugars) likely reflects the dry versus humid climatic variability associated with the Holocene climatic optimum during the Mesolithic, the Roman Age, the Late Antique Little Ice Age, the Middle Ages and the Little Ice Age.
Keywords
Introduction
Since the discovery of the copper age ice mummy ‘Ötzi’ in the year 1991, archaeological as well as geoarchaeological research in the Alps strongly increased, comprising the investigation of soil profiles as well as peatlands as terrestrial archives (Breitenlechner et al., 2014; Geitner et al., 2014; Knierzinger et al., 2020; Reitmaier et al., 2013; Schäfer, 2011a). In case of the Fotsch Valley, the discovery of the Mesolithic site Ullafelsen in the year 1994 was the starting point of abundant archaeological research (Schäfer, 2011a, 2011b). Thousands of archaeological artefacts and several fireplaces dated to 10.9–9.5 cal. kyr BP were excavated on the Ullafelsen and can be attributed to the Mesolithic living floor used by the hunter-gatherers (Geitner et al., 2011; Schäfer et al., 2016a; Zech et al., 2021). The corresponding ‘Mesolithic project Ullafelsen’ brought together different scientific disciplines such as geology, petrography, geomorphology, sedimentology, soil science and palaeoecology (Geitner and Schäfer, 2010; Schäfer, 2011b).
More recently, studies in the Fotsch Valley additionally applied biomarker techniques. Respective results of n-alkane, black carbon and faecal biomarker analyses as well as radiocarbon dating provided further insights regarding pedogenesis, vegetation history and human impact on the Ullafelsen. In this context, the existence of a formerly proposed buried (fossil) topsoil dating to the Late Glacial could not be confirmed (Zech et al., 2021) and there is no evidence for an increased input of human faeces (Lerch et al., 2022). It moreover turned out that the soil profiles on the Ullafelsen itself are of limited value when aiming at reconstructing the landscape evolution and human impact in the Fotsch Valley at higher temporal resolution. This limitation may be overcome by studying peat archives such as the close-by ‘Potsdamer Hütte Mire’ at 1970 m above sea level (a.s.l.).
In general, ombrotrophic peatlands (peat bogs) as well as minerotrophic fens (groundwater/spring fens) have high potential for reconstructing past vegetation, palaeoclimate as well as prehistoric human impact on the landscape, and are therefore commonly used in palaeoenvironmental research (Breitenlechner et al., 2014; Knierzinger et al., 2020; Nott et al., 2000; Scherer et al., 2021; von Scheffer et al., 2019). These archives with their peat deposits accumulating under anaerobically conditions are water saturated and thus characterized by a high organic matter conservation (Naafs et al., 2019). For instance, Knierzinger et al. (2020) and Scherer et al. (2021) investigated peatland archives in the Styrian Enns Valley (Austria) and in the northwestern Alpine foreland (Germany), respectively, and found evidence for significant human impact during the Middle and Late Bronze Age. For Saglias in the Lower Engadine (Switzerland), Dietre et al. (2017) reported on human as well as livestock impact causing deforestation already during the Copper Age (~4.9 cal. kyr BP).
As described for example by Kalis et al. (2003), Nicolussi et al. (2005) and Pini et al. (2017), high-mountain vegetation changes during the Holocene were observed for many Alpine regions and can be also associated with anthropogenic lowering of the subalpine timberline by deforestation and increasing human impact by Alpine pastoralism. From a methodological point of view, stable oxygen isotope (δ18O) records from mire archives can provide valuable palaeoclimatic insights (e.g. Túri et al., 2021).
Here we present a multiproxy approach applied to the Potsdamer Hütte Mire in order to contribute to a better understanding of the Holocene landscape evolution and human history of the Fotsch Valley. More specifically, we addressed the following research questions and aims: (i) When did the mire start to develop and does radiocarbon dating of macrofossils and bulk peat samples allow establishing a robust chronostratigraphy for the entire peat sequence? (ii) Reconstruction of past vegetation changes for the Potsdamer Hütte Mire using n-alkane biomarkers, pollen and macrofossils. (iii) Reconstruction of human impact using n-alkane biomarkers, black carbon and palynological indicators. (iv) Reconstruction of climatic changes using compound-specific stable hydrogen and oxygen isotope analyses of n-alkane and sugar biomarkers (δ2Hn-alkanes and δ18Osugars, respectively).
Research site, material and methods
The subalpine ‘Potsdamer Hütte Mire’ in the Fotsch Valley, Stubai Alps, Austria
The Fotsch Valley in the Stubai Alps, Austria (Figure 1) represents a tributary valley of the Sellrain Valley and is located around 20 km southwest of the Tyrolean capital Innsbruck. Being under the influence of the European west wind zone, the Fotsch Valley is characterized by a temperate climate with an annual mean temperature at ~2000 m a.s.l. of −3°C in January and 10°C in July. The annual mean precipitation is around 1500– 2000 mm (Schäfer, 2011a; Schlosser, 2011).
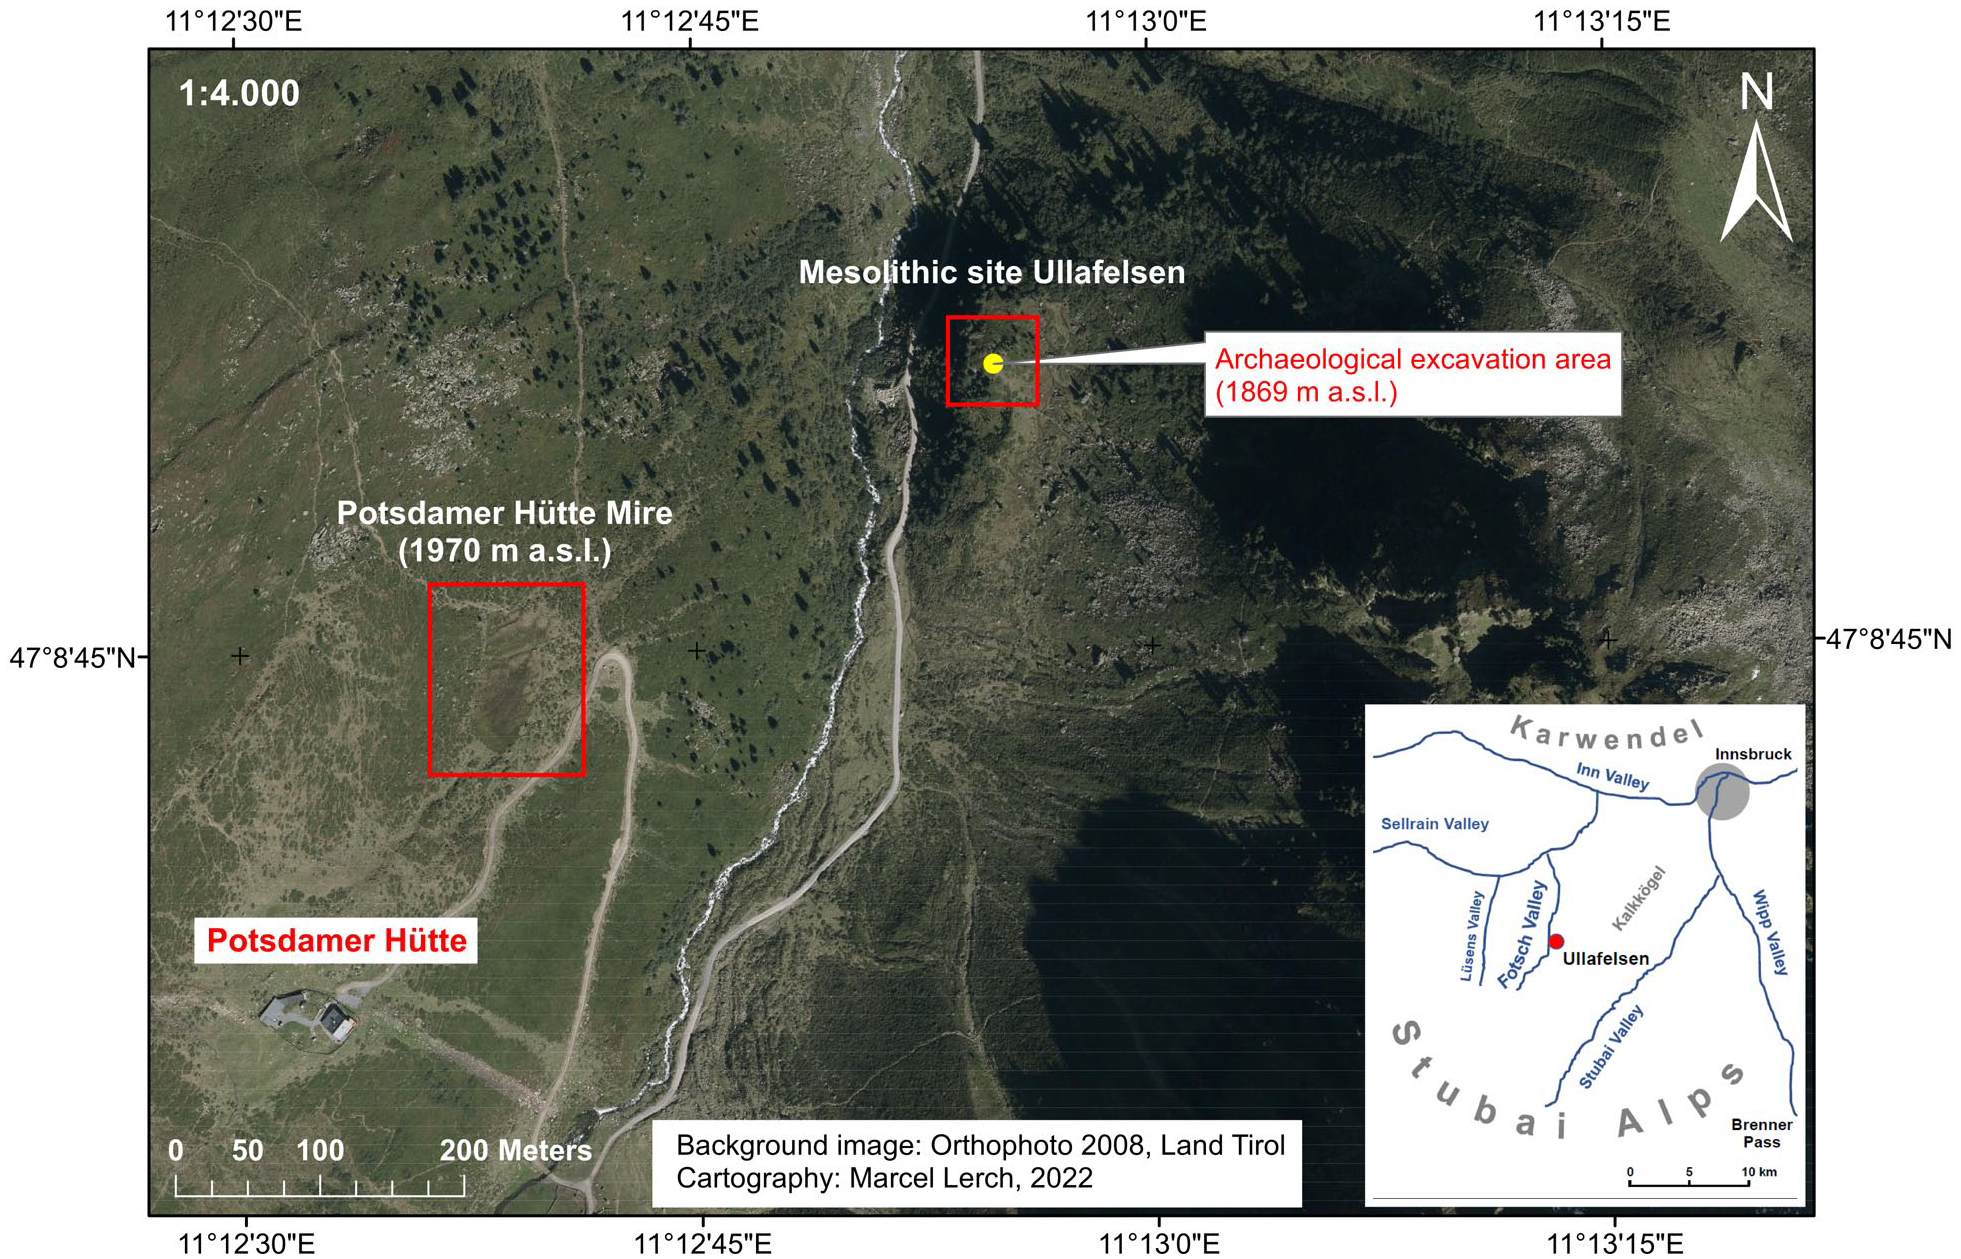
Orthophoto of the central part of the County of Tyrol (Austria) and map (bottom right) illustrating the location of the subalpine FPM (1970 m a.s.l.) in the Fotsch Valley, next to Innsbruck, Stubai Alps, Austria. The Mesolithic site Ullafelsen (1869 m a.s.l.) with its archaeological excavation area is located around 400 m northeast down the valley. Background image: Orthophoto 2008 of the County of Tyrol (Austria). Cartography: Marcel Lerch, 2022.
At an altitude of 1869 m a.s.l., the Ullafelsen represents a famous prehistorical encampment site (Figure 1) where Mesolithic hunter-gatherers lived in the summer periods in the Preboreal and Boreal (Schäfer, 2011a). Four hundred meter valley-up, the ‘Potsdamer Hütte Mire’ (abbreviated ‘FPM’ after
From a geological point of view, the Fotsch Valley belongs to the ‘Ötztal-Stubai-Crystalline-Complex’. Metamorphic rocks such as mica slates, gneisses (paragneisses, orthogneisses) and amphibolites are predominant (Nittel, 2011; Schäfer, 2011b). The geological bedrock at the mire site is ground moraine material consisting of coarse sediments including clay and silty material (Nittel, 2011). The mire is fed by precipitation as well as slope water (Nittel, 2011; Schlosser, 2011). The Fotsch Valley is drained by the Fotsch Creek that rises in the glacier area of the ‘Fotscher Ferner’. Numerous smaller springs and creeks contribute to the Fotsch Creek (Nittel, 2011).
The FPM can be characterized as a spring and precipitation fed hanging mire (Caricetum fuscae subalpinum) and is embedded in the subalpine vegetation zone above the today’s timberline (Figure 2) with its pastoral grassland communities (Nardetum strictum subalpinum). The typical local vegetation surrounding the mire comprises few tree individuals of Arolla pine (Pinus cembra), European larch (Larix decidua) as well as juniper (Juniperus communis). Additionally, Alpine dwarf shrubs like mountain cranberry (Vaccinium vitis-idaea), common blueberry (Vaccinium myrtillus), Alpine rose (Rhododendron ferrugineum) and common heather (Calluna vulgaris) do occur. Due to the wet and peaty conditions, typical marsh herbs such as bog bilberry (Vaccinium uliginosum), common tormentil (Potentilla erecta), large bittercress (Cardamine amara), marsh willowherb (Epilobium palustre) star saxifrage (Saxifraga stellaris) and marsh violet (Viola palustris) grow in a patchy manner on the mire. Moreover, there grows dense cotton-grass (Eriophorum vaginatum), deergrass (Trichophorum caespitosum), stiff clubmoss (Lycopodium annotinum) as well as several sedges (Carex echinata, C. fusca, C. rostrata), brown mosses (Amblystegiaceae) and peat moss species (Sphagnum cuspidatum, S. rubellum). In general, however, the mire is relatively poor in plant species today (Feistmantl, 2018; Kemmer, 1993, 2011).
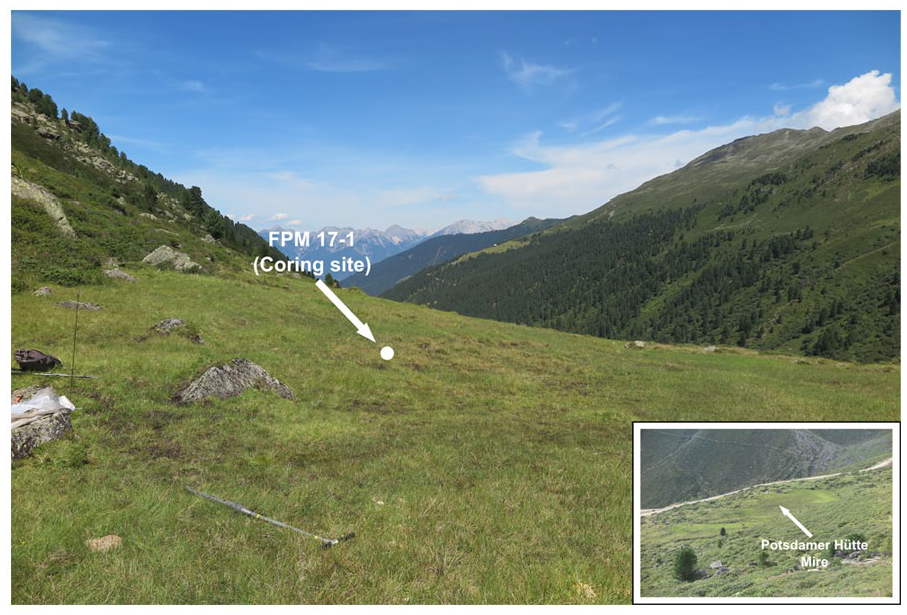
Photo of the coring site of core ‘FPM 17-1’.
Mire core ‘FPM 17-1’
In July 2017, after a preceding exploration of the mire thickness on the basis of several transects, we collected the core ‘FPM 17-1’ from a single hole of FPM using a spade and a Russian peat corer (1970 m a.s.l.; GPS coordinates: 47°08′41.9″N, 11°12′36.9″E) (Figure 2). The core sequence ‘FPM 17-1’ has a total length of 212 cm and comprises the six sections A to F (Figure 3), which are allocated to the following core depths: 0–20 cm (A), 20–50 cm (B), 50–100 cm (C), 100–150 cm (D), 150–200 cm (E) and 200–212 cm (F). Within these sections, we observed different humification degrees by colour and structure identification of the peat material (Figure 3). Section A was collected using a spade due to the heavy root penetration of the extant peat and modern vegetation. From 124 to 20 cm depth, the accumulated sedge material (Cyperaceae) including phases of brown mosses and peat mosses (Sphagnum) is slightly humified and rich in macrofossils as well as macroscopical charcoal at 84 cm depth. Fine rooted material with mosses predominates from 130 to 124 cm depth. Strong humification is present below 130 cm depth. From 194.5 cm depth to the core basis at 212 cm depth, high amounts of sand and silt (including mica) were present. Wood macrofossils were found especially in section C at around 84 cm depth and in the entire section E.
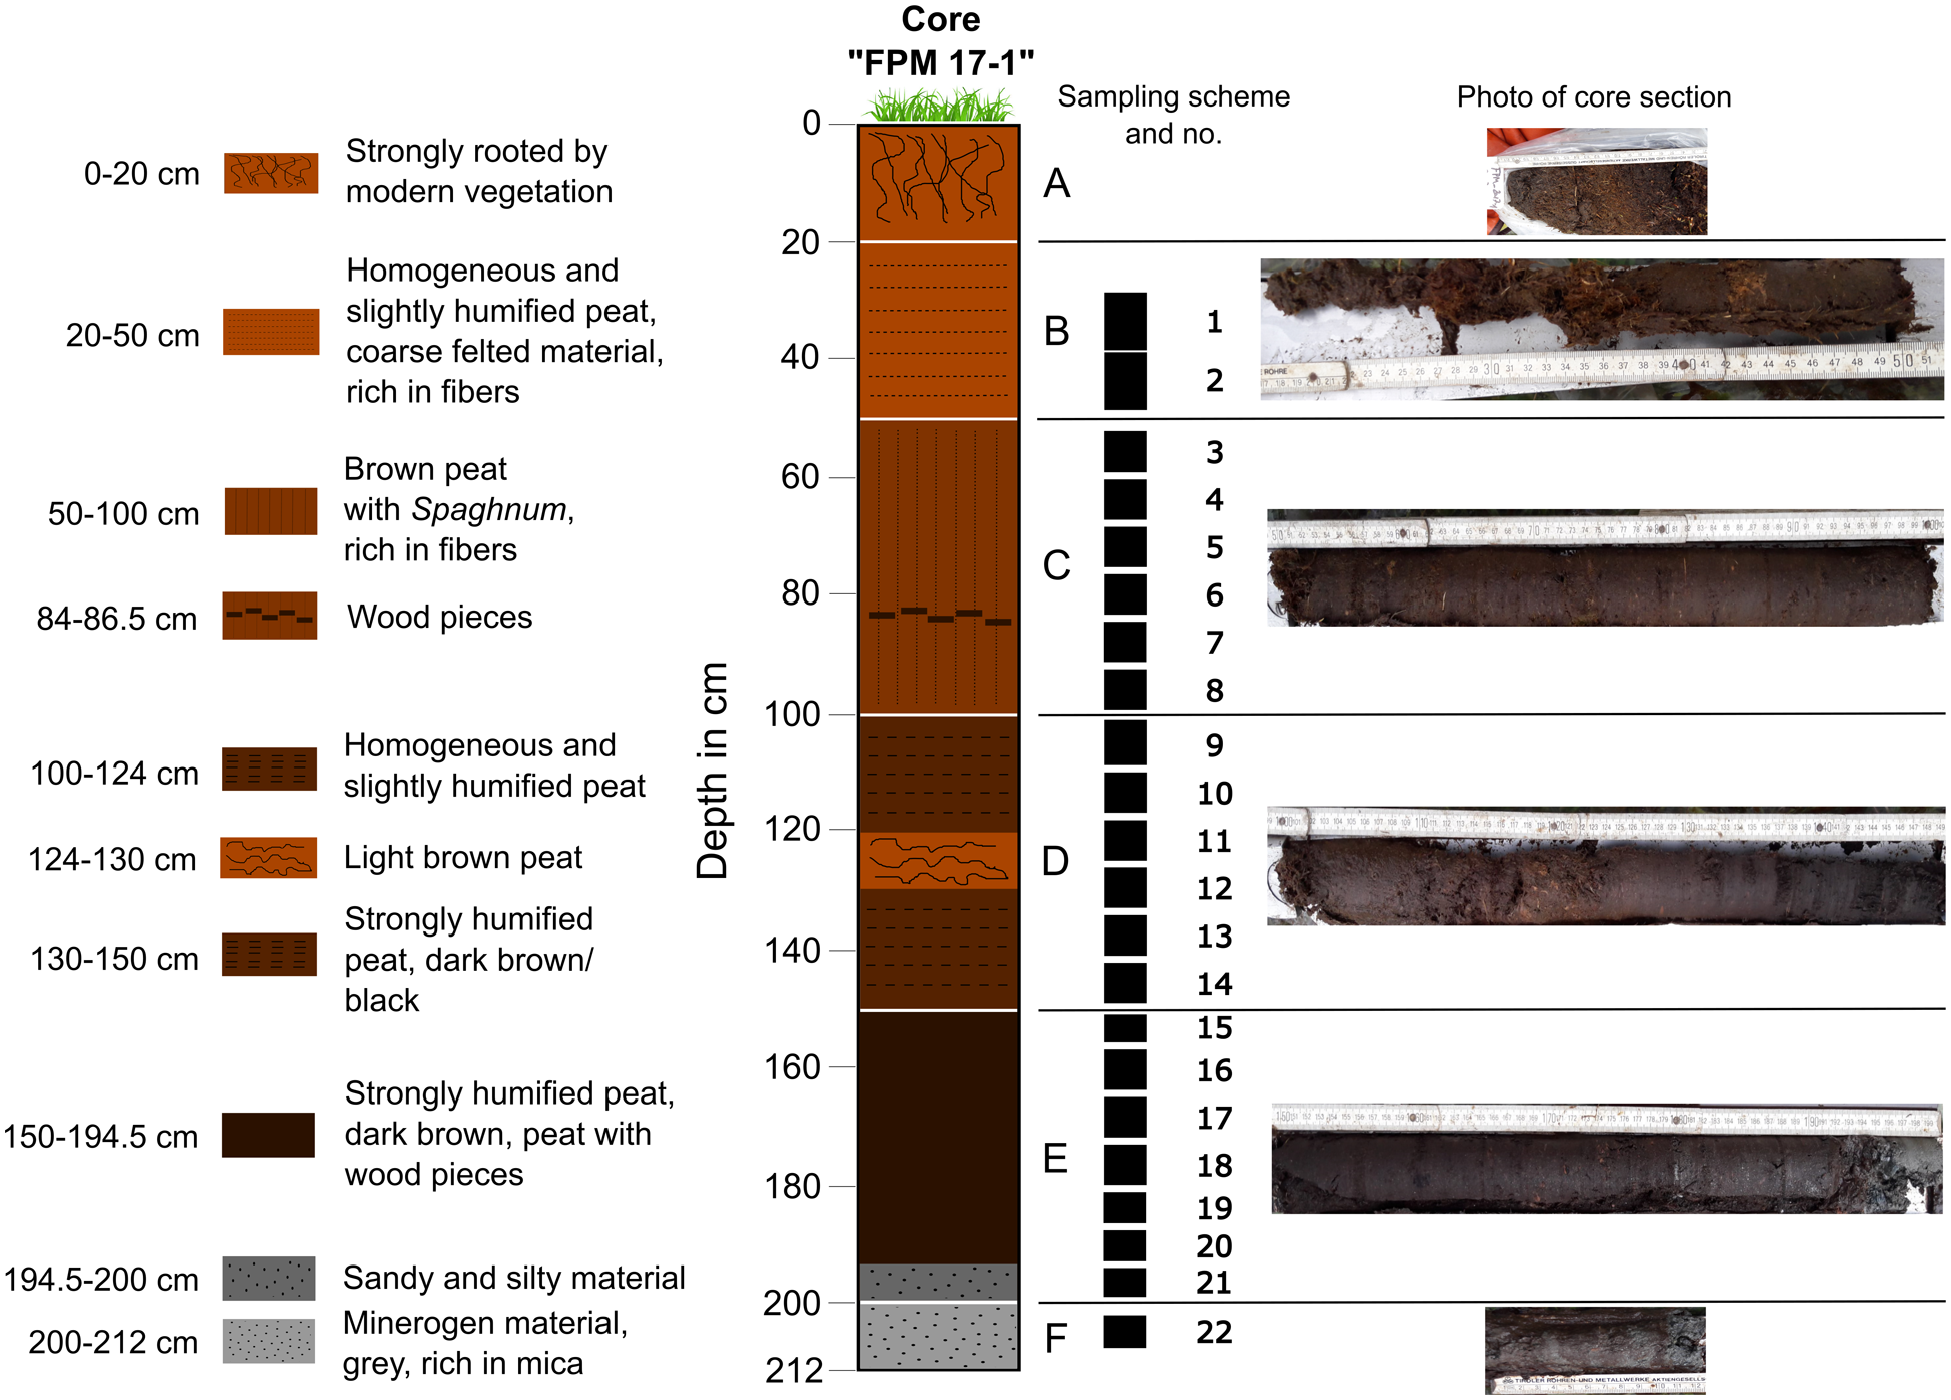
Schematic description of core ‘FPM 17-1’. Information about core sections related to depth and structure is provided on the left; sampling scheme (n = 22) and numbers as well as photos of each core section are provided on the right.
We collected 22 bulk peat samples from core ‘FPM 17-1’ by continuous sampling for biogeochemical analyses. Sampling intervals range from 6 to 10 cm (Figure 3, Table S1). Moreover, we chose 11 macrofossil as well as five bulk peat samples for radiocarbon dating (Table 1). Palynological analyses were performed on 33 samples (1 cm3 each) and macrofossil analyses were done on 14 samples (with volumes of 5–17 cm3).
Radiocarbon (14C) dating on macrofossil and bulk peat samples from the FPM (core ‘FPM 17-1’).
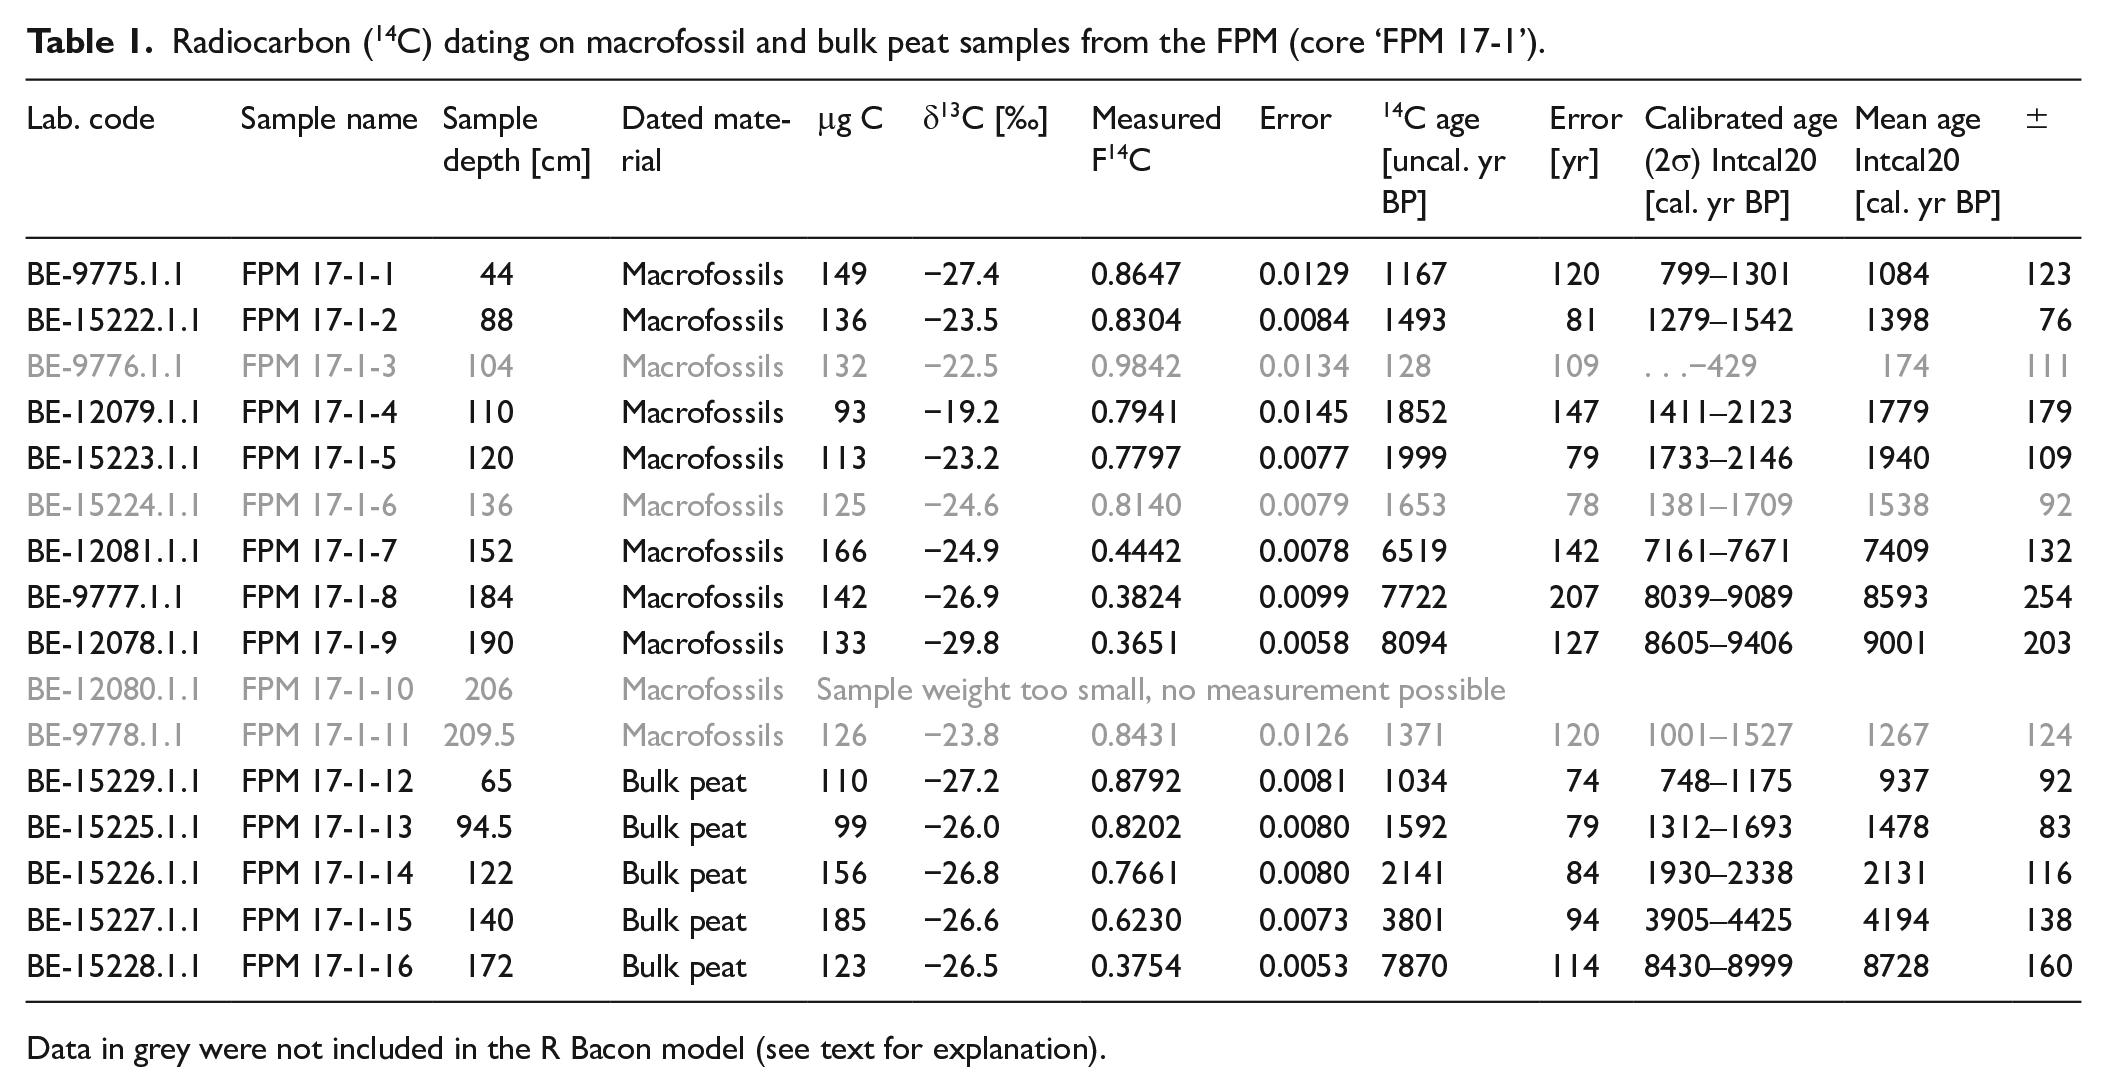
Data in grey were not included in the R Bacon model (see text for explanation).
Radiocarbon dating and R Bacon age-depth model
The analyses were performed at the Laboratory for the Analysis of Radiocarbon with accelerator mass spectrometry (LARA AMS) of the University of Bern, Switzerland (Szidat et al., 2014).14C dating was carried out on the Mini Carbon Dating System (MICADAS) AMS coupled online to an elemental analyser (Ruff et al., 2010; Wacker et al., 2010). F14C depicts the activity ratio of a sample normalized to the modern reference material Oxalic Acid II. A correction was done for cross-contamination and constant contamination according to the contamination drift model of Salazar et al. (2015). All 14C ages were calibrated with the IntCal20 calibration curve (Reimer et al., 2020) using OxCal (Bronk Ramsey, 2009) (Table 1).
Based on our 14C ages, we calculated an age-depth model using R (CRAN 2017) package Bacon (Version 2.5). Applying the IntCal20 calibration curve (Reimer et al., 2020), Bacon calibrates the 14C ages simultaneously according to the stratigraphic principle (Blaauw et al., 2007). Peat accumulation rates (PAR) were calculated in mm a−1 for the mire core ‘FPM 17-1’ using a gamma autoregressive semi-parametric model with several subdivisions along the peat sediment that can be set up as a prior to the model.
Biogeochemical analyses
Biogeochemical analyses were carried out for determining the contents of total carbon (TC) and total nitrogen (TN), n-alkane biomarkers, black carbon (BC) as well as compound-specific stable oxygen (δ18Osugars) and stable hydrogen (δ2Hn-alkanes) isotopes of plant-derived biomarkers. Detailed information about the biogeochemical analyses are provided in Supplemental Doc. S1. The 22 bulk peat samples from core ‘FPM 17-1’ were air dried, sieved (⩽2 mm) and finely ground before analyses took place.
TC and TN contents were measured using an EuroVector EA 3000 elemental analyser (Hekatech, Wegberg, Germany) coupled via a Conflow III Interface to a Delta V Advantage isotope ratio mass spectrometer (IRMS; both from Thermo Fisher Scientific, Bremen, Germany). Calibration of the results was conducted using standard materials with known total carbon and total nitrogen contents (IAEA N2, IAEA CH6, IAEA NO3, IAEA CH7, IAEA 305A, USGS 41). Please note that the bedrock in the catchment of our study area was reported to be carbonate-poor/free (Nittel, 2011). We performed Scheibler analyses (Allison, 1960) on several samples, which yielded no or extremely low inorganic carbon contents. Therefore, we suggest that our measured TC contents reflect the contents of total organic carbon (TOC).
n-Alkane biomarker analyses were performed after Lerch et al. (2018). Identification and quantification of n-alkanes was performed using a GC-2010 series gas chromatograph coupled with a flame ionization detector (GC-FID, Shimadzu, Kyoto, Japan). An external n-alkane standard (n-alkane mix: nC8-nC40; Supelco 49452-U) was run at different concentrations (25, 50 and 100 μg mL−1) together with the sample batch.
For compound-specific stable hydrogen isotope analyses (δ2Hn-alkanes), n-alkane containing samples were purified using AgNO3-coated silica gel (Supelco, 60–200 mesh) and zeolite (Geokleen Ltd.) with dichloromethane (Hepp et al., 2021). δ2Hn-alkanes of the dominant odd carbon chain lengths nC21 to nC33 was measured in triplicates using a Trace GC 2000 gas chromatograph (GC; Thermo Fisher Scientific, Bremen, Germany) coupled to a Delta V Advantage isotope ratio mass spectrometer (IRMS, Thermo Fisher Scientific, Bremen, Germany). A standard n-alkane mixture (nC27, nC29, nC33) with a known stable hydrogen isotope composition was run together with each sample batch. During the GC-IRMS measurements, the H3+ factor stayed constant.
Hemicellulose-derived sugar biomarkers were analysed following the method described by Zech and Glaser (2009). A four-fifths aliquot of the hydrolysed, filtered and purified samples was used for compound-specific stable oxygen isotope (δ18Osugars) analyses. δ18Osugar measurements were performed in triplicate using a Trace GC 2000 gas chromatograph (GC) coupled to a Delta V Advantage isotope ratio mass spectrometer (IRMS) via an 18O-pyrolysis reactor (GC IsoLink) and a ConFlow IV interface (Thermo Fisher Scientific, Bremen, Germany). Co-derivatized sugar standards containing arabinose, fucose and xylose with known stable oxygen isotope compositions were measured at different concentrations (20, 50, 100 and 200 µg mL−1) after six sample triplicates.
According to Glaser et al. (1998) and Brodowski et al. (2005), black carbon (BC) analyses were carried out using benzene polycarboxylic acids (BPCA). BPCA are useful molecular fire markers applied in palaeoenvironmental and geoarchaeological research (Zech et al., 2021). Detection and quantification of BPCAs was performed using a GC-2010 series gas chromatograph coupled with a flame ionization detector (GC-FID, Shimadzu) and equipped with a 30 m × 0.25 mm SPB-5 column (Supelco). Co-derivatized external standard mixtures at different concentrations (10, 25, 50, 100, 250 and 500 µg mL−1) were measured together with the derivatized samples.
Palynological analyses
Following Moore et al. (1991) and Haas et al. (2013), all sediment samples were first sieved through a 250 μm mesh sieve, and the remaining fraction (<250 μm) was subsequently sieved through a 7 μm mesh sieve to remove silt and small organic fragments. The chemical treatment of the fraction 7–250 μm consisted of HCl (10%, cold) to remove carbonates, followed by an acetolysis treatment (for 2-minutes, following Seiwald (1980) and hydrofluoric acid (HF, 10%, hot) to remove silt/clay. The resulting palynological samples were stored in glycerine and stained with fuchsine. All microfossils were determined (at least 500 pollen were counted per sample) and quantified using a phase contrast microscope (Olympus BX50) at 400-fold magnification and were identified according to the reference collection of the Institute of Botany, University of Innsbruck in addition to determination literature (Beug, 2004; Dietre et al., 2014; Faegri and Iversen, 1989; Moore et al., 1991). Pollen of trees, shrubs and herbs from upland plants were included into the 100%-sum, cryptogams spores, fungal remains, algae, Neorhabdocoela worm oocytes, micro-charcoal particles and faunal remains were quantified against the defined 100%-sum. Data evaluation was carried out using Tilia software and its cluster function ‘CONISS’ (Grimm, 1987). We used the pollen of Cerealia-type, Rumex, Plantago lanceolata and Poaceae as main Alpine pasture and cultural indicators for estimating the past human and livestock impact in the Fotsch Valley.
A Principal Component Analysis (PCA) and correlation analyses based on Spearman’s rho were performed to summarize the redundant information contained in the palynological taxa and to detect possible relation between palynological taxa, respectively. PCA-analysis were performed using the software package CANOCO 5.0 (Ter Braak and Šmilauer, 2012).
Macrofossil analyses
Macrofossil analyses were performed on 14 sediment samples from core ‘FPM 17-1’, each of 1 cm sediment thickness (Feistmantl, 2018). Sediment samples were wet-sieved using sieves of 1000, 500, 250 and 125 µm mesh size. Macrofossils from plant and animal (>500 µm) were extracted, determined and documented under a stereo microscope (Olympus SZ60 with photo camera) with a magnification up to 63x, and by using the reference collection of the Institute of Botany, University of Innsbruck. Data evaluation were performed using Tilia software (Grimm, 1987). Data interpretation focused on macrofossils of Alnus, Betula and Pinus cembra and was compared with our biomarker results.
Biogeochemical data analysis and interpretation approach
Usually, C/N ratios calculated from the TC and TN contents can serve as a proxy for peat humification according to for example, Malmer and Holm (1984) or reflect vegetation changes (e.g. Mathijssen et al., 2019). In our case study, we will argue that human-induced BC input is likely a major factor for high C/N ratios. The total n-alkane content (TAC) was calculated from the sum of nC19 to nC33 and is given in microgram per gram (μg g−1) dry weight. For estimating the n-alkane degradation, the OEP (odd-over-even-predominance) ratio [1] can be calculated (Zech et al., 2010, 2012). As described in Bliedtner et al. (2018a, 2018b), decreasing ratios indicate an enhanced n-alkane degradation.
[1] OEP = (nC27+nC29+nC31+nC33)/(nC26+nC28+nC30+nC32) (as reported in Zech et al. (2012)).
The average chain length (ACL) ratio [2] can be used to reconstruct vegetation changes and was calculated after Schäfer et al. (2016b). This proxy provides information about leaf wax-derived n-alkanes produced by deciduous trees and shrubs versus grasses and herbs. Deciduous trees and shrubs show dominant carbon chain lengths of nC27 and nC29, while grasses and herbs are characterized by dominant carbon chain lengths of nC31 and nC33 (Lerch et al., 2018).
[2] ACL = (27*nC27+29*nC29+31*nC31+33*nC33)/(nC27+nC29+nC31+nC33) (as reported in Schäfer et al. (2016b)).
First n-alkane results of modern plants from our study site show that nC27 is the dominant carbon chain length in deciduous trees (Alnus and Betula), while nC31 predominates in Alpine dwarf shrubs, grasses and juniper (Zech et al., 2021). It has to be considered that coniferous trees contain too low or negligible contents of n-alkanes except for juniper with high occurrence of nC31 and nC33 (Zech et al., 2013, 2021). We propose the following n-alkane ratio [3] to reconstruct respective vegetation changes for the FPM.
[3] n-alkane ratio = nC31/ (nC27+nC31) (as reported in Zech et al. (2021)).
Possible values of this n-alkane ratio range from 0 to 1. Ratios ⩽0.5 indicate a dominant vegetation composition of deciduous trees and ratios >0.5 suggest a predominance of Alpine dwarf shrubs, grasses and juniper.
Furthermore, we calculated the Paq ratio [4] to estimate the deciduous tree input of Betula. Originally, this ratio was developed and suggested as proxy for submerged and aquatic macrophytes relative to that of emerged and terrestrial plants (Ficken et al., 2000). Some moss species (e.g. Sphagnum) are reported to produce high relative abundances of the mid-chain n-alkanes nC23 and nC25 (Nichols et al., 2006; Nott et al., 2000; Schellekens and Buurman, 2011). However, there is increasing evidence that also Betula produces high amounts of nC23 and nC25 (Hepp et al., 2019 and references therein).
[4] Paq = (nC23+nC25)/(nC23+nC25+nC29+nC31) (as reported in Ficken et al. (2000)).
For reconstructing past fire events at the FPM, we used the total contents of black carbon given in gram per kilogram (g CBC kg−1 sample) dry weight. The respective calculation comprises a conversion factor of 2.27. Please note that the actual amount of BC is difficult to assess and according to for example, Brodowski et al. (2005), this factor provides only a conservative minimum estimate of the true BC contents in soils. Additionally, we calculated the B5CA/B6CA ratio (five over six carboxylic groups). This ratio is reported to provide information about burning temperatures. B5CA/B6CA ratios ⩽0.8 are suggested to indicate domestic fires, whereas ratios >0.8 are characteristic for forest ground or grass fires (Lehndorff et al., 2015; Wolf et al., 2013).
Last but not least, we would like to mention that our results of biomarker and compound-specific stable isotope analyses from 206 to 190 cm depth (9.1 to 8.8 cal. kyr BP) are almost all close or below detection limit. While providing the respective results in Supplemental Table S3, we therefore excluded those data points from the Figures 6 and 8 as well as from our data evaluation.
Results and discussion
Chronostratigraphy, peat accumulation rate (PAR), TOC content and C/N ratio
Radiocarbon (14C) ages of macrofossil and bulk peat samples range from 1.1 ±0.1 to 9.0 ±0.2 cal. kyr BP and 0.9 ±0.1 to 8.7 ±0.2 cal. kyr BP, respectively (Table 1, Figure 4). The dating of macrofossils at 209.5 cm (1.3 ± 0.1 cal. kyr BP), 136 cm (1.5 ± 0.1 cal. kyr BP) and 104 cm depth (0.2 ± 0.1 cal. kyr BP) yield stratigraphically inconsistent 14C ages. This might be tentatively explained with subterranean lateral water runoff from adjacent hill slopes or by the input of younger organic matter by trampling of grazing livestock such as cattle (as also known today and reported in Kemmer (1993)). Therefore, we decided to exclude these three 14C ages from our R Bacon model (Figure 4). The sample weight of macrofossils at 206 cm depth was too small and thus no 14C measurement was possible. Please note that the relatively large standard deviations for our macrofossil and bulk peat 14C ages of up to 0.2 kyr (Table 1) can be explained with the small amounts of carbon (93–185 µg C) as well as with the gas measurements used by MICADAS. The macrofossil 14C age of 9.0 ± 0.2 cal. kyr BP at 190 cm depth (Table 1, Figure 4) indicates the onset of mire formation for the FPM during the Early Holocene, possibly as a result of the wet climatic period CE-2 according to Haas et al. (1998).
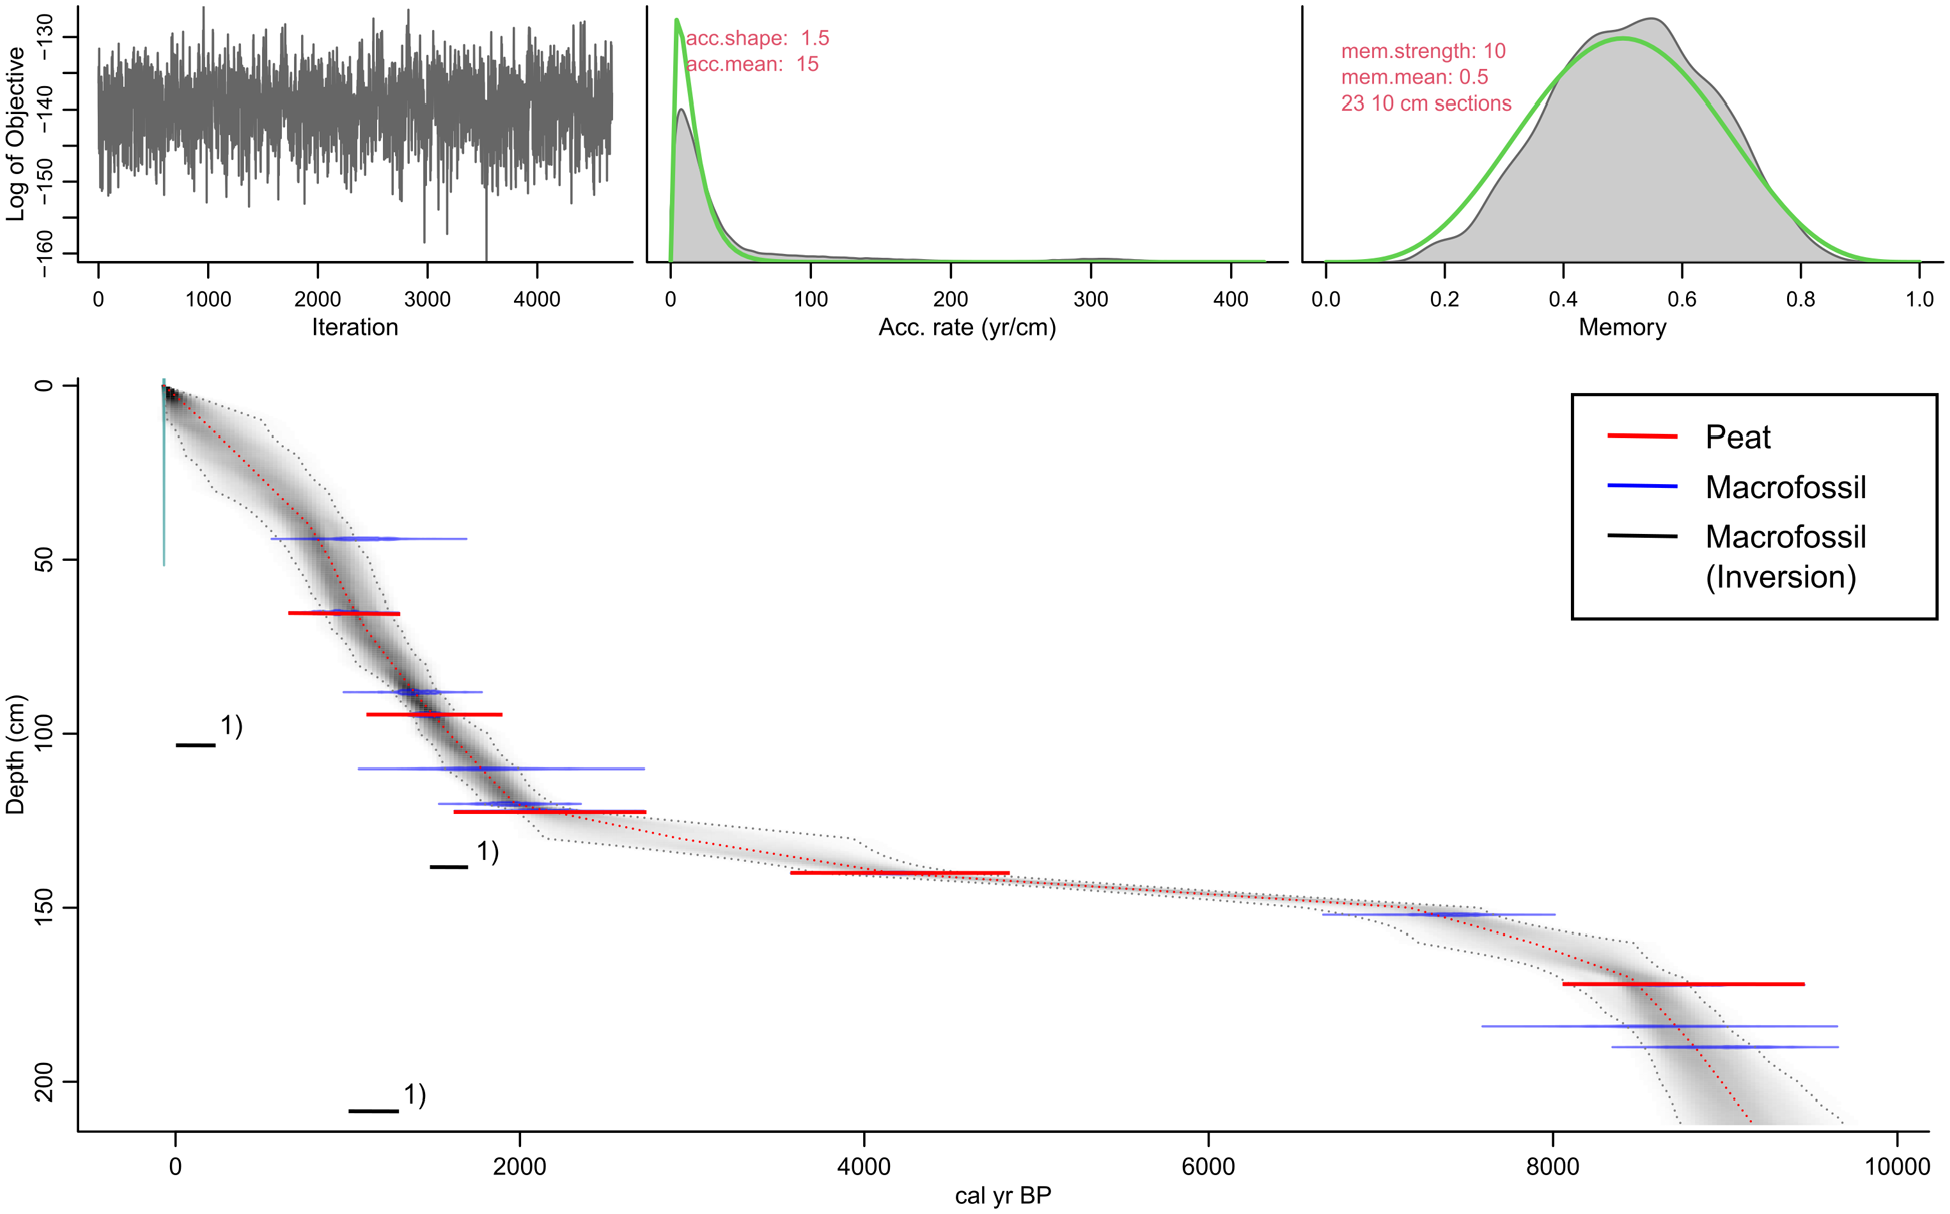
Age-depth model of core ‘FPM 17-1’, calculated using the R package in Bacon. The model is based on seven macrofossil (blue) and five bulk peat (red) radiocarbon (14C) ages. The calculated error bars of the 14C ages are visualized overestimated due to a graphical error in the R package Bacon version that we used. 1) Note that three 14C ages obtained for macrofossils (black) were not included in the R Bacon model (see discussion main text for explanation).
Modelled mean 14C ages according to R Bacon range from −0.067 cal. kyr BP (0 cm depth; BP = AD 1950) to 9.2 cal. kyr BP (212 cm depth) (Table S2, Figure 4).
The PAR values ranges from 0.03 to 1.1 mm a−1 (Figure 5, Table S2). Minimum PAR values (0.03 mm a−1) occur from 150 to 141 cm depth (7.2 to 4.5 cal. kyr BP), while maximum PAR values (1.0–1.1 mm a−1) are characteristic from 60 to 51 cm depth (1.0 to 0.9 cal. kyr BP). Our R Bacon age-depth model shows strongly reduced PAR values from 170 to 121 cm depth (8.5 to 2.1 cal. kyr BP) (Figures 4 and 5). Two possible reasons can be discussed. First, slightly hanging, spring-fed mires of the Caricetum fuscum-type are known to often dry up in late summers (Kemmer, 1993). This holds especially true if the catchment is forested and enhanced transpiration of trees and shrubs influences the water balance. Accordingly, one may argue in our case study that the strongly reduced PAR values from 8.5 to 2.1 document that during this time interval the upper timberline (currently at about 1870 m a.s.l.) exceeded the FPM (at 1970 m a.s.l.). Second, a hiatus associated with peat extraction possibly during the Iron Age cannot be completely excluded, particularly because preliminary radiocarbon date from a mire archive in a side valley at roughly the same elevation do not show the strongly reduced PAR of the FPM. Despite age uncertainties associated with our age-depth model, arguments for a strong human impact from the Neolithic and especially the Bronze Age onwards are provided below. Anyway, given the age uncertainties, we decided to visualize the data points from 8.5 to 2.1 cal. kyr BP (170 -121 cm depth) with a dotted line in Figure 8.
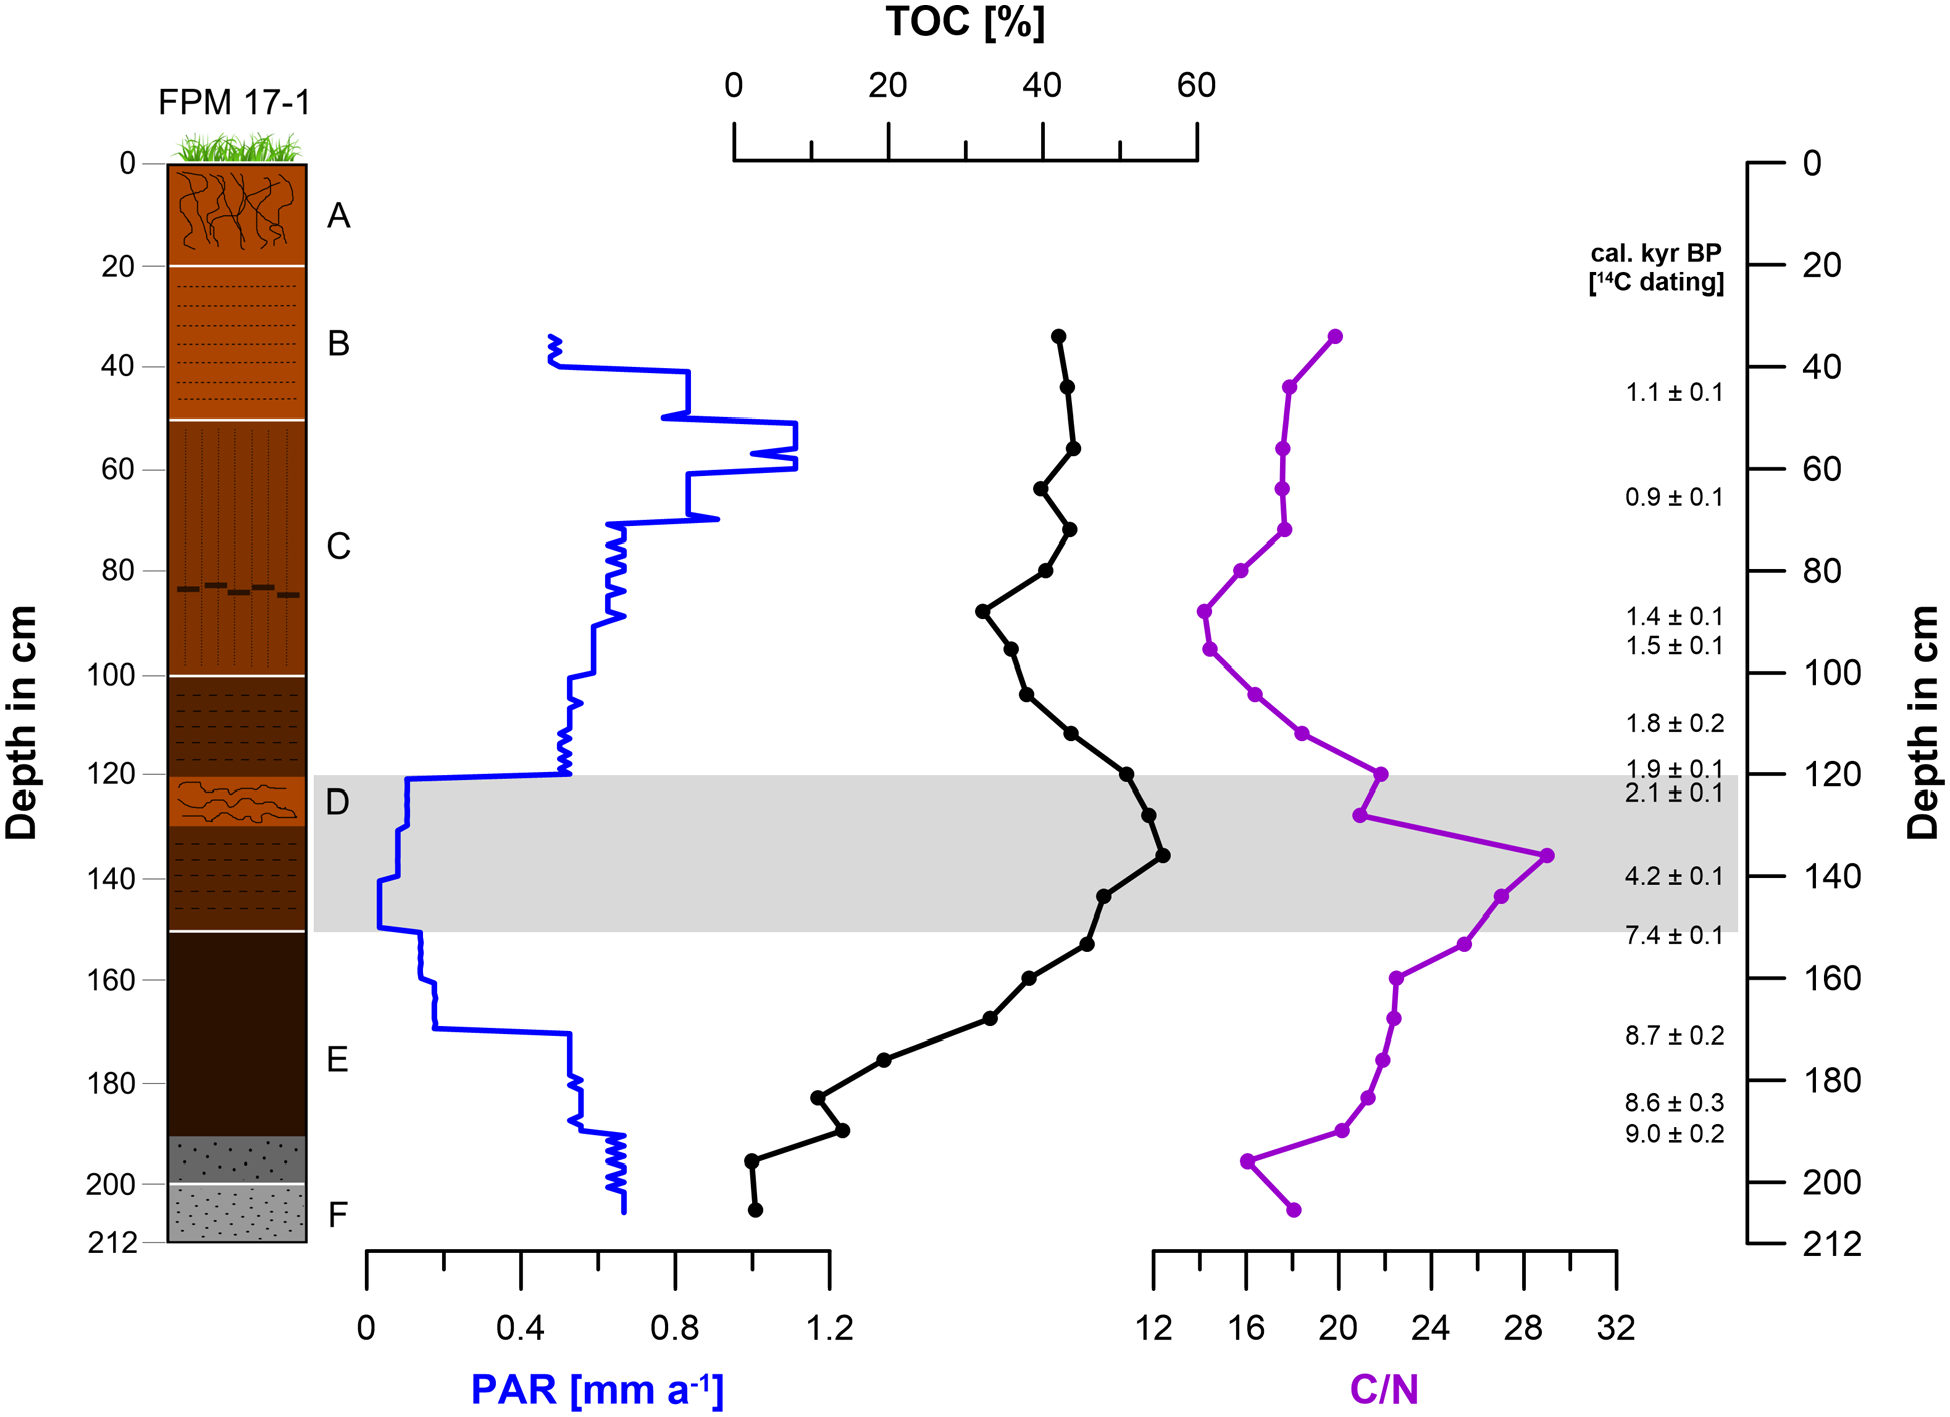
Peat accumulation rate (PAR) in mm a−1, total organic carbon (TOC) content in % and C/N ratio of core ‘FPM 17-1’. The grey bar from 150 to 121 cm depth (7.2 to 2.1 cal. kyr BP) represents strongly reduced PARs being accompanied by C/N, BC, micro-charcoal and ACL maxima.
The TOC contents range from 2.3% to 55.5% with a maximum at 136 cm depth (3.7 cal. kyr BP) and a minimum at the bottom of FPM (Figures 5 and 8, Table S3). The C/N ratios range from 14.2 to 29.0 (Figure 5, Table S3). A maximum occurs at 136 cm depth (3.7 cal. kyr BP) and coincides with the TOC maximum, whereas a minimum characterizes the core at 88 cm depth (1.4 cal. kyr BP). High C/N ratios especially between 153 and 136 cm depth (7.4 and 3.7 cal. kyr BP), but also below in section E, are surprisingly not observed for weakly degraded peat sections of FPM as one might expect (c.f. for instance Malmer and Holm, 1984), but for strongly degraded peat layers (Figures 3 and 5). This may be attributed to vegetation changes (Mathijssen et al., 2019). Additionally or alternatively, we suggest that this discrepancy can be explained in our case with human-induced BC input in chapter 3.3. Anyhow, apart from peat extraction having possibly occurred during the Iron Age, the strong peat humification of the lower part of FPM can explain the low PAR values from 170 to 121 cm depth. Please note that below 170 cm depth there is an increasing minerogenic contribution (reflected also in strongly decreasing TOC values), resulting in higher accumulation rates despite strong humification (Figures 3 and 5). Still, high PAR values in the bottommost part of our PFM might partly also reflect strong peat formation during the Early Holocene that was exceptionally warm according to Ilyashuk et al. (2011).
Vegetation reconstruction using n-alkanes, macrofossils and palynological indicators
The total n-alkane content (TAC) of ‘FPM 17-1’ ranges from 17.7 to 180.7 µg g−1 with a maximum at 128 cm depth (2.7 cal. kyr BP) (Figure 6, Table S3). The odd-over-even-predominance (OEP) ratio, ranging from 9.2 to 18.6, reveals a maximum at 128 cm depth, too. Minima occur at 153 cm (7.4 cal. kyr BP) and 34 cm depth (0.7 cal. kyr BP) (Figure 6, Table S3). The maximum of the OEP ratio can be explained with low n-alkane degradation (Figure 6) and coincides with weak peat humification (Figure 3). The average chain length (ACL) ranges from 28.7 to 30.9 (Figure 8, Table S3). Also for this proxy, a maximum occurs at 128 cm depth (2.7 cal. kyr BP). A minimum is characteristic at around 184 cm depth (8.7 cal. kyr BP). The Paq ratio ranges from 0.1 to 0.5 and shows a maximum at around 184 cm depth (8.7 cal. kyr BP) and a minimum at around 136 cm depth (3.7 cal. kyr BP) (Figure 6, Table S3). The n-alkane ratio nC31/(nC27+nC31) ranges from 0.3 to 0.9 and reveals maxima from 136 to 128 cm depth (3.7 to 2.7 cal. kyr BP). A minimum occurs from 190 to 168 cm depth (8.8 to 8.3 cal. kyr BP) (Figures 6 and 8, Table S3).
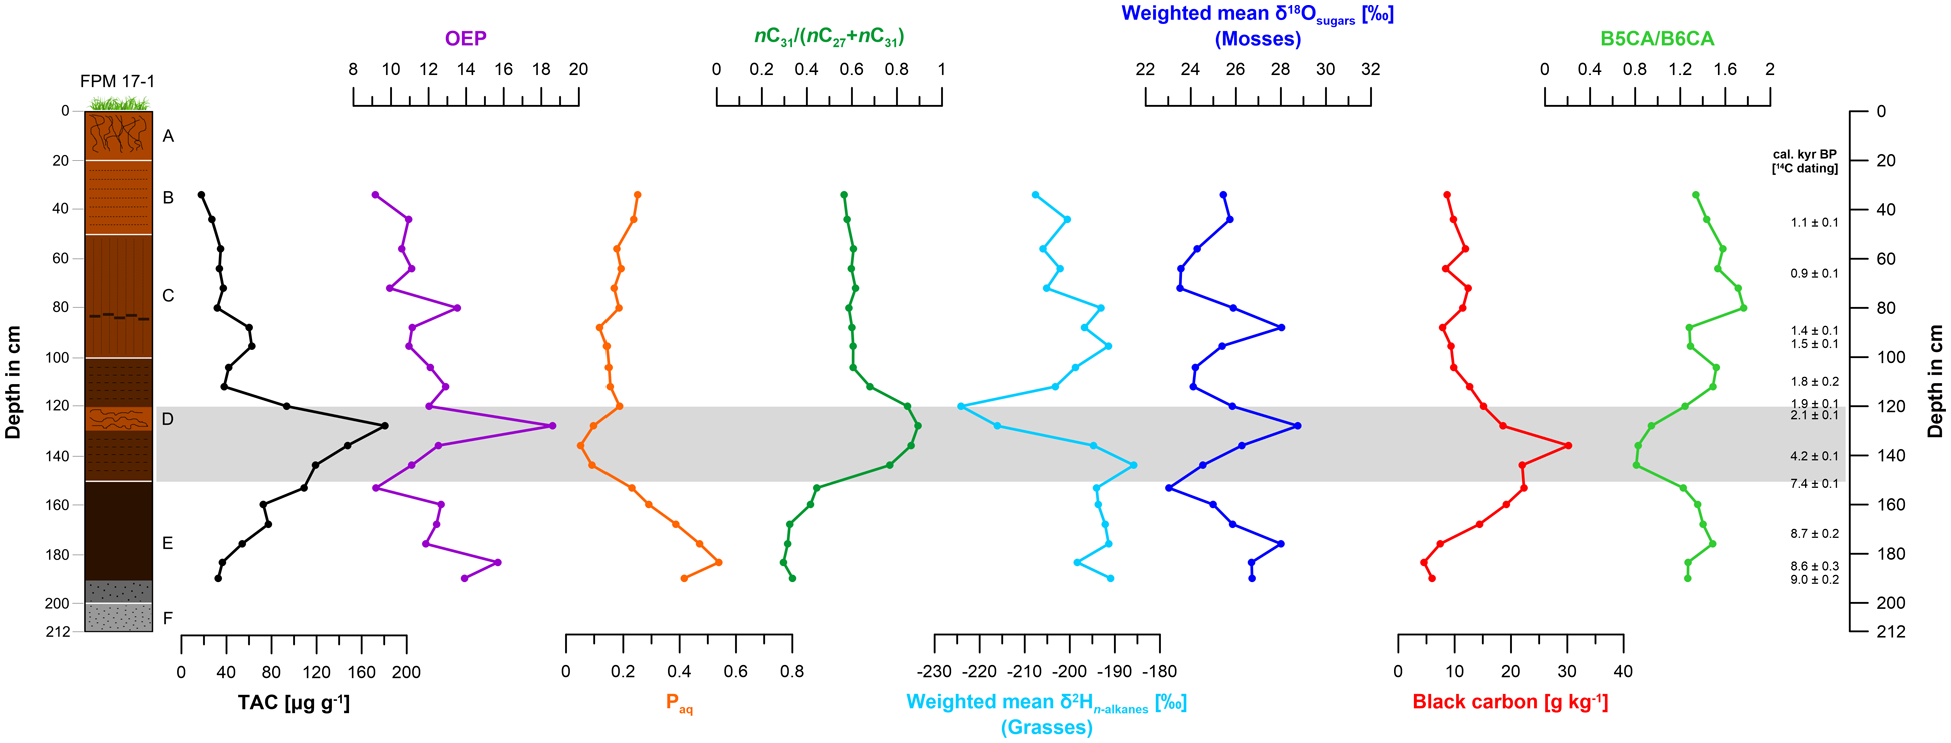
Total n-alkane content (TAC) in µg g−1, odd-over-even predominance (OEP) ratio, Paq ratio, n-alkane ratio nC31/(nC27+nC31), weighted mean δ2Hn-alkanes in ‰, weighted mean δ18Osugars in ‰, black carbon (BC) content in g kg−1 and black carbon ratio B5CA/B6CA of core ‘FPM 17-1’. The grey bar from 150 to 121 cm depth (7.2 to 2.1 cal. kyr BP) represents strongly reduced PARs being accompanied by C/N, BC, micro-charcoal and ACL maxima.
Figure 7a illustrates the palynological results of core ‘FPM 17-1’ on a linear depth scale. According to the CONISS clustering analysis, three distinctly and statistically very different local palynological assemblage zones (LPAZ) can be defined. First results show that coniferous tree pollen (Pinus cembra, Pinus mugo, Picea abies) predominate in the lower part (150 cm depth and below) of the core sequence referring to a strong coniferous tree vegetation occurrence during the Mesolithic (Figure 7a). Poaceae pollen reach a maximum between 120 and 110 cm depth corresponding to around 2.0–1.8 cal. kyr BP (Figures 7a and 8). Results of the PCA analysis with ‘supplementary variables’ for the palynological data set from core ‘FPM 17-1’ and Spearman-Rho correlation are shown in Supplemental Figure S1, Table S4. Macrofossils of Alnus, Betula and Pinus cembra predominate from 184 to 168 cm depth corresponding to around 8.7–8.3 cal. kyr BP (Figures 7b and 8).
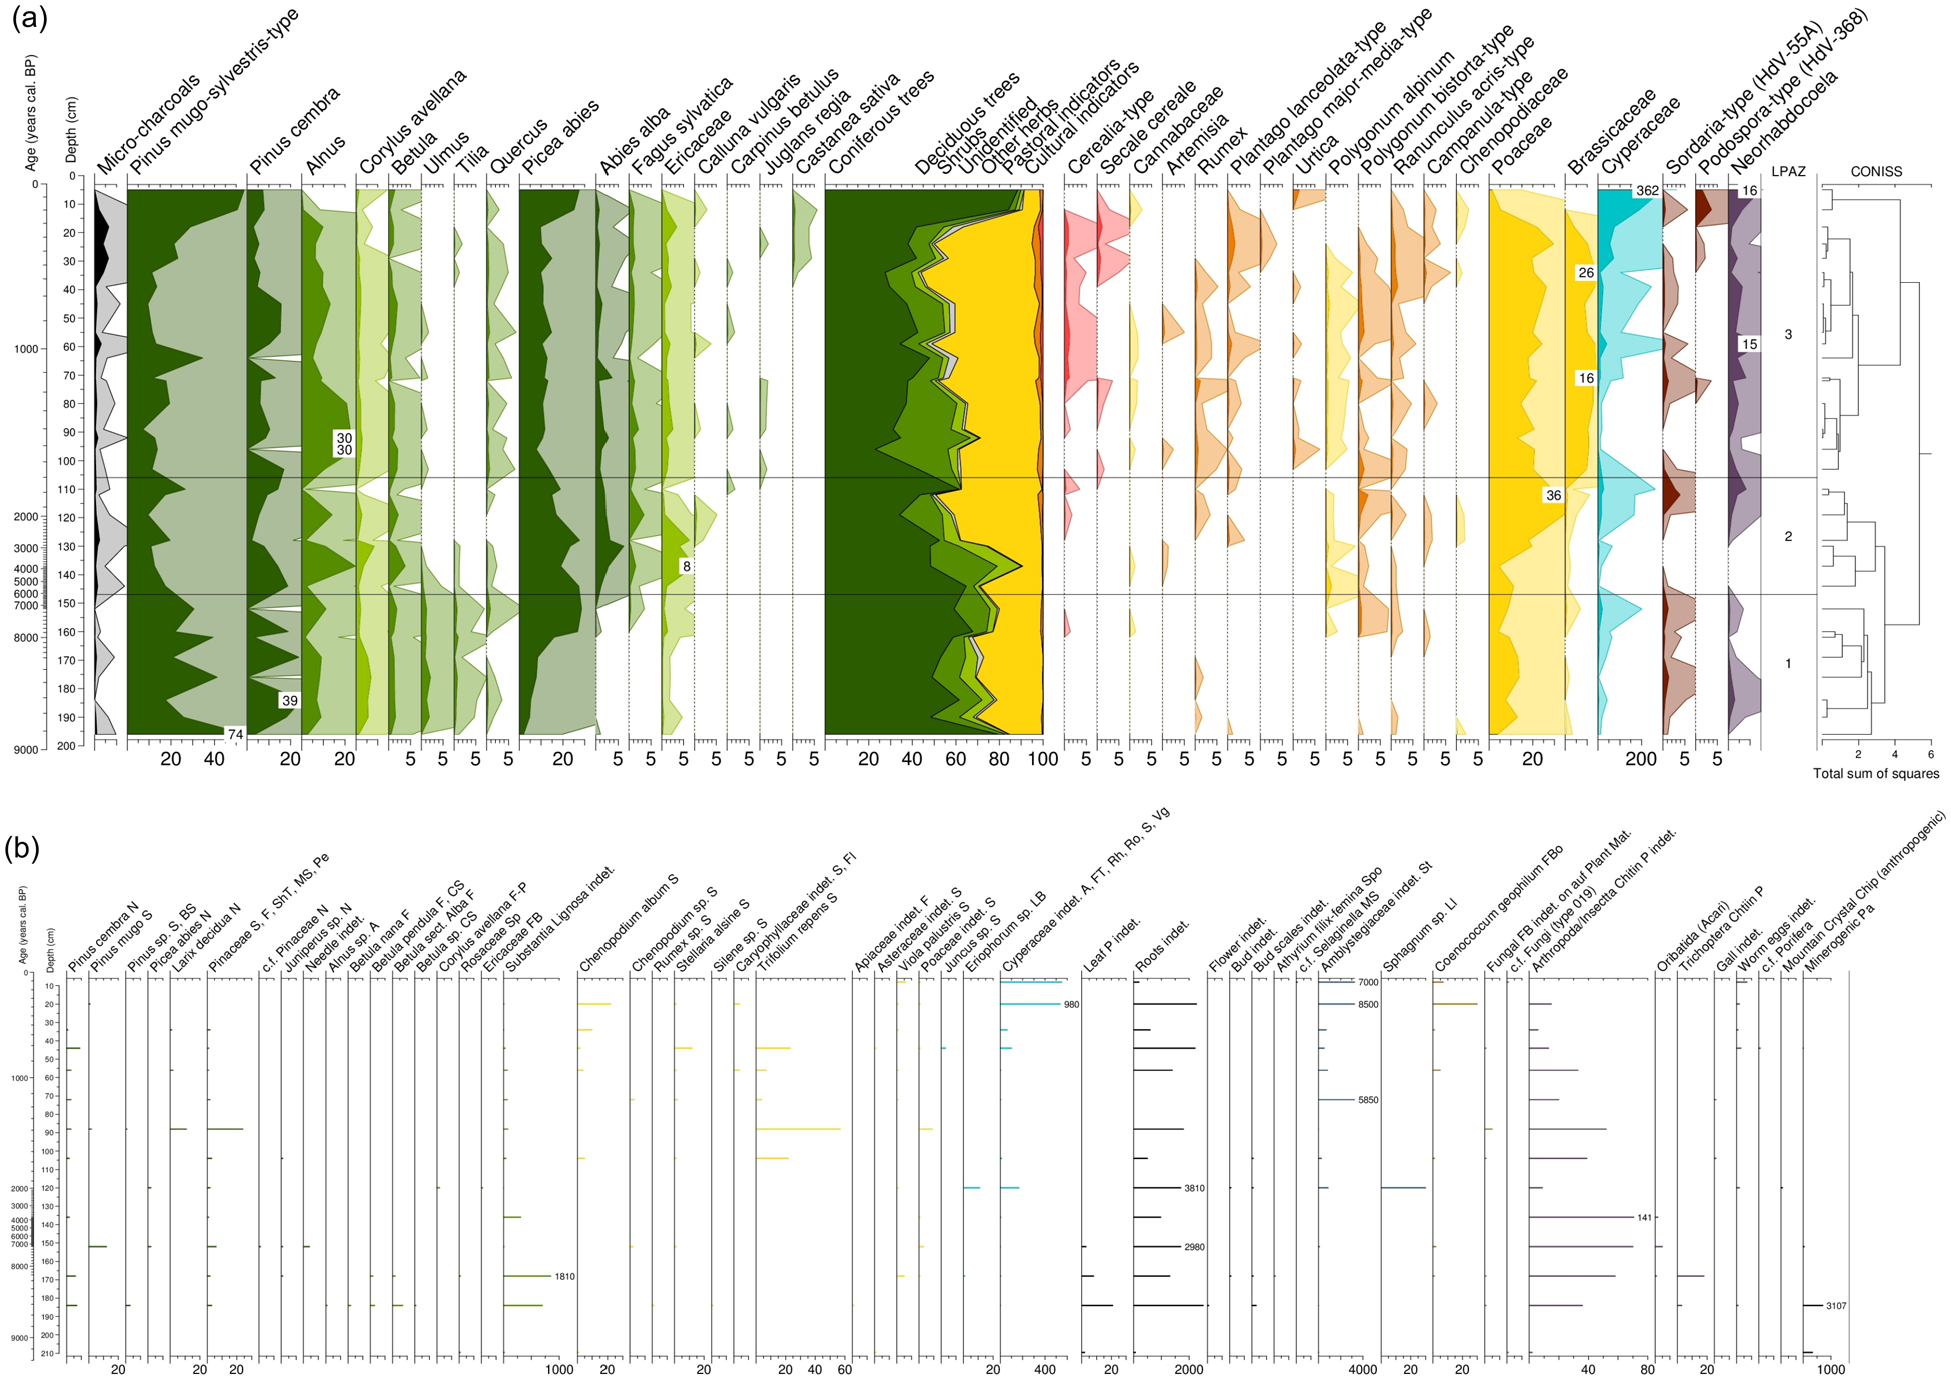
(a) Palynological record (selected taxa) for core „FPM 17-1″ as derived from 33 samples. Occurrence of pollen from upland plants are included in the 100%-sum and are plotted against a linear depth and a related age y-axis. Abbreviation: LPAZ, Local Palynological Assemblage Zones. (b) Macrofossil record (all taxa) for core ‘FPM 17-1’. Occurrence of macrofossils are given in absolute numbers per sample volume of 10 mL and are plotted against a linear depth and a related age y-axis. Abbreviations: A: Anthere; CS: Catkin Scale; F: Fruit; FB: Fruit Base; FBo: Fruit Body; Fl: Flower; FT: Fruit Tube; LB: Leaf Base; Ll: Leaflets; MS: Microsporophyll; N: Needle; p: Part; Pa: Particles; Pe: Periderm; Rh: Rhizome; Ro: Roots; S: Seed; ShT: Short Twig; Sp: Spike; Spo: Sporangium; St: Stem; Vg: Vegetative indet.
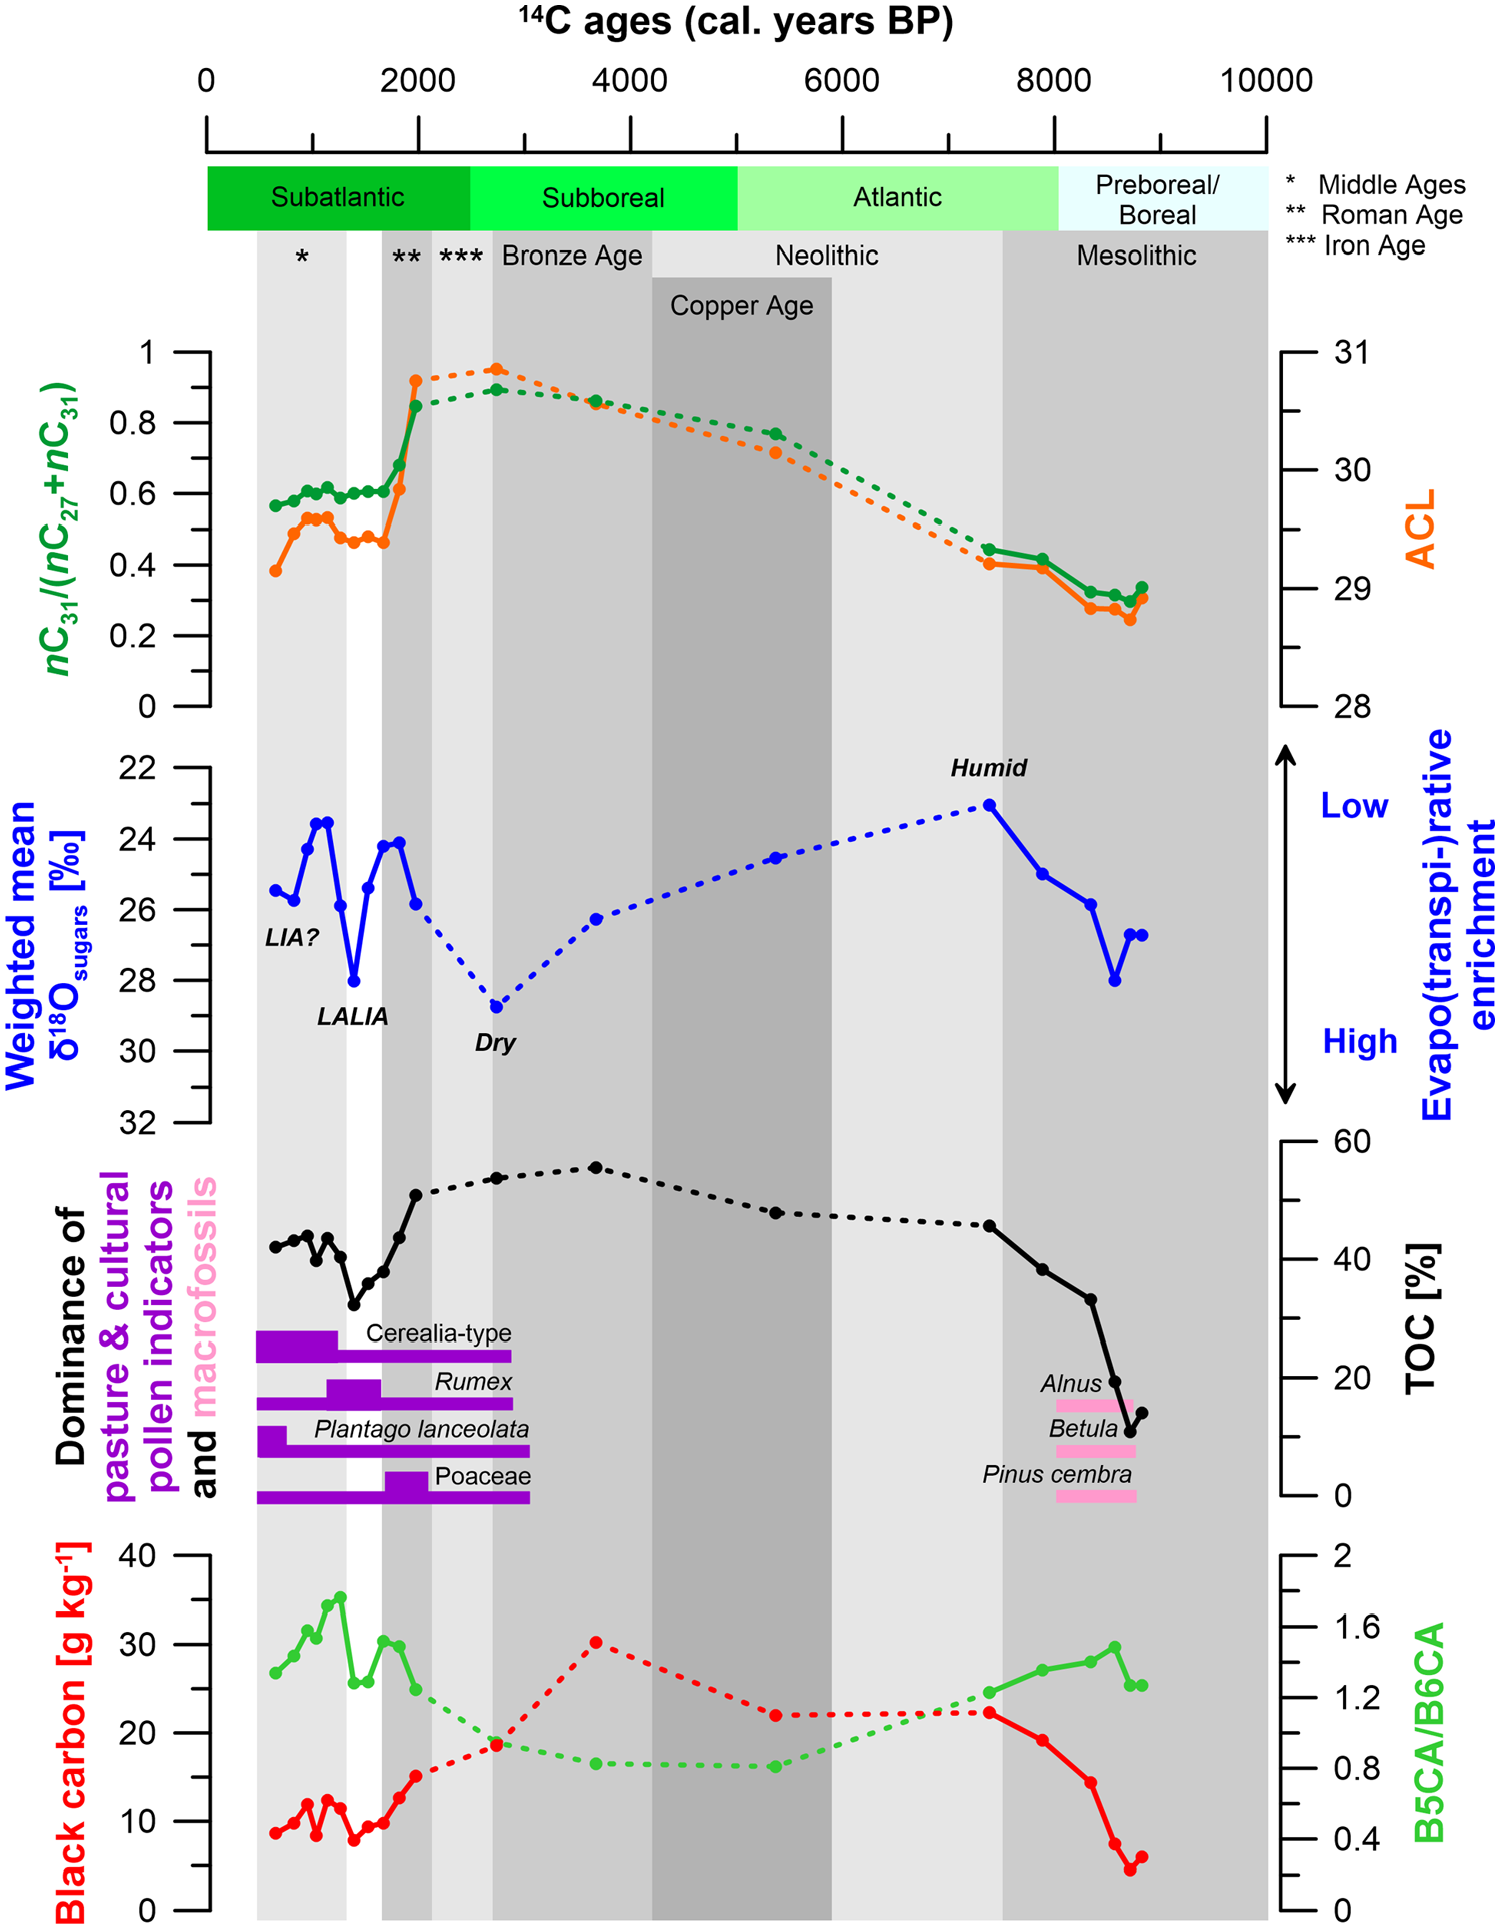
Vegetation, climate and human history since ~9 kyr BP in the Fotsch Valley, Stubai Alps, Austria, based on the n-alkane ratio nC31/(nC27+nC31), ACL, weighted mean δ18Osugars in ‰, dominance of palynologically detected pasture and cultural indicators as well as specific plant macrofossils, TOC in %, BC content in g kg−1 and ratio B5CA/B6CA of core ‘FPM 17-1’. Note that dashed lines are used for periods with strongly reduced PARs and thus large age uncertainty of our age-depth model.
Our low nC31/(nC27+nC31) ratios of around 0.3 as well as low ACL ratios of around 28.8 between 190 and 168 cm depth (8.8 and 8.3 cal. kyr BP) reflect the higher proportion of Alnus and Betula, representing nC27-producing deciduous tree vegetation during the Mesolithic (Figures 6 and 8). High Paq ratios at around 184 cm depth (8.7 cal. kyr BP) can be associated with the occurrence of Betula (being characterized by high relative abundances of nC23 and nC25), too, and are in agreement with a respective macrofossil predominance of Betula (Figures 6, 7b and 8).
Our results indicate that the vegetation cover on or around the FPM at 1970 m a.s.l. mainly consisted of coniferous and deciduous trees when mire growth started around 9 cal. kyr BP during the Mesolithic. For comparison, excavated fireplaces on the Kaseralmschrofen, which represents an archaeological site at 1755 m a.s.l. in the Fotsch Valley, yielded 14 C ages of around 9.9 cal. kyr BP (Schäfer, 2017), and the youngest 14C ages for fireplaces on the Ullafelsen at 1870 m a.s.l. yielded 14C ages of ~9.5 cal. kyr BP (Zech et al., 2021). We therefore assume that the Mesolithic hunter-gatherers have changed their encampment sites with rising timberline and relocating subalpine vegetation zone towards higher altitudes in the Fotsch Valley. The ongoing Early Holocene climate amelioration culminating in the Holocene climatic optimum, that is, warm and humid climate from 8.7 to 7.4 kyr BP (Kalis et al., 2003; Túri et al., 2021), was accompanied by a fast timberline rise in the Alps (Pini et al., 2017) and likely caused the FPM to start growing. Respective timberline shifts are also discussed for the Fotsch Valley (Schäfer, 2011b).
Strongly increasing nC31/(nC27+nC31) and ACL ratios from 153 to 128 cm depth (7.4 to 2.7 cal. kyr BP) indicate a striking vegetation change during the Neolithic and the Bronze Age (Figures 6 and 8). This general forest opening as inferred from the n-alkane biomarkers is also recorded in the palynological and macrofossil record (Figure 7a and b). The nC31/(nC27+nC31) ratio maximum of around 0.9 at 136 cm (3.7 cal. kyr BP) and 128 cm depth (2.7 cal. kyr BP) corroborates a predominance of Alpine dwarf shrubs, grasses and juniper coinciding with high occurrence of Ericaceae (> 5%) and Poaceae (>20%) pollen (Figure 7a). The TAC maximum is in agreement with this interpretation insofar as this vegetation is characterized by higher n-alkane contents than coniferous trees, mosses and herbs (Zech et al., 2021).
TACs of around 40 µg g−1, nC31/(nC27+nC31) ratios of 0.6 as well as ACL ratios of around 29.4 at 104 cm depth (1.7 cal. kyr BP) and upwards (Figures 6 and 8, Table S3) can be associated with high occurrence of mosses (c.f. Zech et al., 2021). We assume that Sphagnum and brown mosses predominate on the FPM from the Late Roman Age to the modern times.
Human impact and Alpine pastoralism as inferred from n-alkanes, black carbon and pollen
Strongly increasing nC31/(nC27+nC31) ratios (from 0.4 to 0.9) and ACL ratios (from 29.2 to 30.9) from 153 to 128 cm depth (7.4 to 2.7 cal. kyr BP) as well as increasing occurrence of Poaceae pollen from 140 to 120 cm depth (4.2 to 2.0 cal. kyr BP) show a vegetation shift from nC27-dominated deciduous tree vegetation (Alnus and Betula) to nC31-dominated grass, Alpine dwarf shrub and juniper vegetation (Figures 6, 7a and 8). This vegetation change may be partly climatically triggered (c.f. Bohleber et al., 2020; Vollweiler et al., 2006). Additionally or alternatively, these results can be associated with deforestation in the Fotsch Valley during the Neolithic and Bronze Age corresponding with human and livestock-related lowering of the timberline, palaeoecologically documented also in other valleys nearby (Staffler et al., 2011; Vorren et al., 1993).
Black carbon (BC) contents range from 4.6 to 30.2 g kg−1 (Figures 6 and 8, Table S3) and from 20.6 to 54.4 g kg−1 TOC (Table S3). BC contents given in g kg−1 reveal a maximum at 136 cm depth (3.7 cal. kyr BP) coinciding with the TOC and C/N maxima. The lowest BC contents characterize the bottom of the mire sequence below 184 cm depth (8.7 cal. kyr BP). The B5CA/B6CA ratio ranges from 0.8 to 1.8 (Figures 6 and 8, Table S3). Most strikingly, the BC maximum coincides with a B5CA/B6CA minimum from 144 to 136 cm depth (5.4 to 3.7 cal. kyr BP) with a ratio of around 0.8. Micro-charcoal particles reveal several maxima, the most pronounced ones from 150 to 120 cm depth coinciding with the BC content maximum at 136 cm depth (3.7 cal. kyr BP) (Figure 7a). We explain the TOC, BC, micro-charcoal and C/N maxima with intensive forest fire events on or around the FPM. B5CA/B6CA ratios of around 0.8 likely indicate high burning temperatures (Wolf et al., 2013) that can be associated with deforestation and domestic fires caused by human impact during the Neolithic, the Bronze Age and the Iron Age (Figures 6 and 8).
Apart from sporadic findings, pasture and cultural indicator pollen (Cerealia-type, Rumex and Plantago lanceolata, Poaceae) regularly occur from 130 cm depth upwards since around 2.9 cal. kyr BP (Figures 7a and 8) and can be used as proxies for the identification of past pasture management (c.f. Dietre et al., 2020). At around 115 cm depth (~1.9 cal. kyr BP., Roman Age), Sordaria-type spores from fungus commonly found on faeces of livestock and herbivores (Dietre et al., 2014) reveals a pronounced maximum. From this depth upwards, Brassicaceae pollen become abundant (Figure 7a), probably related to the local growth of Cardamine amara (Brassicaceae) at the mire edges, a plant which (still present today) needs eutrophic conditions given by wash in of rising nutrients due to livestock faeces deposition around the FPM. In this context, such a nutrient load by faeces deposition to the subalpine soils around the FPM may have also massively favoured pastoral plants such as white clover (Trifolium repens) and white goosefoot (Chenopodium album), both being present in high macrofossil amounts since 1.7 cal. kyr BP (Figure 7b). Cerealia-type pollen reveals a maximum from 70 to 40 cm depth (Figure 7a) coinciding with an increased agricultural productivity in the adjacent valleys during the Middle Ages (~1.1 cal. kyr BP; Figure 8) (Tinner et al., 2003).
The palynological results from the Fotsch Valley thus reflect the beginning of Alpine pastoralism and husbandry during the Middle to Late Bronze Age (~3.0 cal. kyr BP). Our findings are hence in agreement with the emergence of pasture indicator pollen for other Alpine regions (Festi et al., 2014; Scherer et al., 2021; von Scheffer et al., 2019).
Climatic variability in the holocene as inferred from compound-specific stable oxygen isotopes (δ18Osugars)
The δ2Hn-alkanes values range from −224.1 to −185.8 ‰ with a striking minimum at 120 cm depth (2.0 cal. kyr BP) (Figure 6, Table S3). We suggest that the pronounced δ2Hn-alkanes minimum at 120 cm depth (2.0 cal. kyr BP) does not reflect climate/hydrology changes but rather ‘isotopic signal damping’ of grasses according to Hepp et al. (2020) (Figure 6).
The δ18Osugars values range from +23.0 to +28.8 ‰ (Figures 6 and 8, Table S3). The curve reveals several fluctuations showing maxima at 176 cm (8.6 cal. kyr BP), 128 cm (2.7 cal. kyr BP) and 88 cm depth (1.4 cal. kyr BP). In contrast, minima occur at 153 cm (7.4 cal. kyr BP), 112 cm (1.8 cal. kyr BP) and 72 cm depth (1.1 cal. kyr BP).
Previous unpublished results of sugar analyses carried out on various modern vegetation samples from the Fotsch Valley showed very high sugar content (563.16 g kg−1 TOC) in Sphagnum mosses. However, a Sphagnum rich sample was only found for the depth of 120 cm in the peat sequence of the FPM (Figure 7b), whereas nine out of 14 peat samples analysed for macrofossils contained very high amounts of brown mosses instead (Amblystegiaceae, i.e. >100 per 10 ml of peat; Figure 7b). Therefore, we assume that the δ18Osugars signal in our bulk peat samples from ‘FPM 17-1’ is mainly derived from Sphagnum as well as brown mosses.
Regarding the interpretation of our δ18Osugars record, biosynthesized sugars of plants reflect the isotopic composition of precipitation, modified by soil and leaf water evapo(transpi-)rative enrichment and biosynthetic fractionation (Zech et al., 2014). According to the 9 kyr δ18O record of Vollweiler et al. (2006), the δ18O precipitation signal for our study area can be assumed to have changed less than 1 ‰ and did not follow the classical temperature effect (sensu more negative ‰ values indicating colder temperatures and less negative ‰ values indicating warmer temperatures, respectively). Our δ18Osugars record reveals a range of almost 6 ‰ and values that are by 5–10 ‰ more positive than it can be expected when applying a biosynthetic fractionation factor of +27 ‰ to estimated summerly δ18O values of precipitation. This suggests that our δ18Osugar record is primarily controlled by variably evapo(transpi-)rative enrichment of leaf water in the water cells of Sphagnum leaflets or phylloids (or those of brown mosses) and/or the evaporative enrichment of mire water. The enrichment of leaf water is known to depend primarily on relative air humidity (Zech et al., 2014); the enrichment of soil water depends primarily on the ratio of evaporation to precipitation. Both factors are difficult to disentangle in our case study. In order not to overinterpret our record, we therefore prefer to simply refer to high versus low evapo(transpi-)rative enrichment (Figure 8).
The low δ18O value of 23.0 ‰ at 153 cm depth (7.4 cal. kyr BP) indicate a period of low evapo(transpi-)rative enrichment, either indicating a low evaporation/precipitation ratio and/or high relative air humidity during the Late Mesolithic/Early Neolithic associated with the Holocene climatic optimum (c.f. Kalis et al., 2003) (Figure 8). Increasing δ18O values (23.0‰ to 28.8‰) from 153 to 128 cm depth (7.4 to 2.7 cal. kyr BP) point to an increasing evapo(transpi-)rative enrichment during the Neolithic and the Bronze Age and can be tentatively interpreted with drier climatic conditions (Figure 8). Drier climatic conditions might at the same time have favoured stronger peat humification and thus the very low PARs of around 0.1 mm a−1 in this part of the mire archive (Figure 5, Table S2). Low δ18O values of 24.1 ‰ and 24.2 ‰ from 112 to 104 cm depth (1.8 to 1.7 cal. kyr BP) point to low evapo(transpi-)rative enrichment during the Roman Warm Period (Figure 8). This is in agreement with more humid climatic conditions with seasonal pluvial pulses as reported by Büntgen et al. (2011) and Túri et al. (2021). Moreover, decreasing nC31/(nC27+nC31) and ACL ratios during the Roman Age can be associated with an increasing occurrence of mosses because of increasingly humid conditions on the FPM. As reported by Zech et al. (2021), the n-alkane patterns of mosses from the FPM show mean nC31/(nC27+nC31) and ACL ratios of around 0.6 and 29.4, respectively. The high δ18O value of 28.0 ‰ at 88 cm depth (1.4 cal. kyr BP) suggests a period of increased evapo(transpi-)rative 18O enrichment after the Roman Warm Period that can be associated with the Late Antique Little Ice Age (LALIA) (Figure 8). We interpret this high enrichment of δ18Osugars with dry climatic conditions during this rapid cooling that is evidenced for example also in the nearby Ziller Valley, Austria (Haas et al., 2007). According to Peregrine (2020), the LALIA is characterized by a rapid cooling having entailed widespread famine, epidemic disease and social disruption. Low δ18O values of 23.5 ‰ and 23.6 ‰ from 72 to 64 cm depth (1.1 to 1.0 cal. kyr BP) indicate low evapo(transpi-)rative enrichment and likely point to humid climatic conditions during the Middle Ages (Figure 8). According to Büntgen et al. (2010), several pluvial periods were identified using tree ring analyses and occurred mainly in the summertime during the Middle Ages. High abundances of Cerealia-type pollen during this time period (Figures 7a and 8) indicate intensive agriculture (c.f. Dietre et al., 2017, 2020). The two again more positive δ18O values at 44 cm depth (corresponding to 0.8 cal. kyr BP) and above point to higher evapo(transpi-)rative enrichment corresponding to a likely drier period after the Middle Ages (Figure 8). Within uncertainties of our age-depth model, we tentatively suggest that these two data points reflect the beginning of the Little Ice Age (LIA) known as a cool period that lasted from 0.6 to 0.15 kyr BP after Mann et al. (2009). Possibly, this cooling is also reflected in the low PAR rates of 0.5 from 34 cm to 40 cm depth (Figure 5).
Conclusions and outlook
We presented and discussed the results of a pilot study investigating the subalpine FPM (core ‘FPM 17-1’) at 1970 m a.s.l. in the Fotsch Valley, Stubai Alps, Austria. The results give insights into the Holocene landscape evolution, human impact and climate variability in the Fotsch Valley from Mesolithic to modern times.
(i) Peat accumulation started around 9.0 ± 0.2 cal. kyr BP according to 14C dating of macrofossil and bulk peat samples.
(ii) Low PAR ratios mostly coinciding with strong humification are characteristic between 170 and 121 cm depth (8.5 and 2.1 cal. kyr BP). We interpret these results to reflect seasonal dry up associated with a forested catchment favouring transpiration and/or with δ18Osugars-inferred relatively dry climatic conditions from the Neolithic to the Iron Age. Moreover, a hiatus associated with peat digging possibly during the Iron Age cannot be completely excluded.
(iii) Low nC31/(nC27+nC31) and ACL ratios as well as macrofossil occurrence in the bottom most part of the mire archive can be associated with an increase of deciduous trees (especially of Betula) corresponding to the Holocene climatic optimum during the Mesolithic. This vegetation is characterized by a dominance of the long-chain n-alkane nC27 and can at the same time explain high nC23 and nC25 abundances as reflected in high Paq ratios.
(iv) Maxima of TOC, C/N, BC and micro-charcoal from 150 to 121 cm depth (7.2 to 2.1 kyr BP) can be interpreted to reflect forest fires during the Neolithic over the Bronze to the Iron Age on or around the FPM. B5CA/B6CA ratios of around 0.8 correlate with high burning temperatures and confirm domestic fires caused by human impact.
(v) Increasing nC31/(nC27+nC31) and ACL ratios during that time period provide furthermore evidence for long-term vegetation changes towards an Alpine dwarf shrub, grass and juniper predominance. Albeit an initial climate triggering around 5.9 kyr BP cannot be excluded (c.f. Bohleber et al., 2020), these vegetation changes, too, can be explained with human impact in form of deforestation and the beginning of Alpine pastoralism (livestock grazing and husbandry) during the Neolithic and/or the Bronze Age. Typical pasture and cultural indicator pollen such as Cerealia-type, Rumex and Plantago lanceolata and Poaceae regularly occur from 130 cm depth upwards (~2.9 cal. kyr BP). Our results suggest that Sphagnum and brown mosses represent the predominant vegetation cover on the FPM from the Late Roman Age to the modern times.
(vi) Our δ18Osugars record can be likely interpreted in terms of variably evapo(transpi-)rative enrichment of leaf and soil water (c.f. Zech et al., 2014). This is primarily driven by relative air humidity and the ratio of evaporation to precipitation (in a simplified manner dry vs humid climate). Accordingly, the Late Mesolithic/Early Neolithic (~7.4 cal. kyr BP) corresponding to the Holocene climatic optimum was characterized by humid climate. Given the age uncertainties of our archive (and the potential hiatus), the Neolithic and Bronze Age were tentatively characterized by a trend towards drier climate. Despite admittedly low data point resolution, the Roman Age, the Late Antique Little Ice Age, the Middle Ages and the Little Ice Age were characterized by the succession of humid, dry, humid and dry climate, respectively.
Our biomarker, compound-specific stable isotope, macrofossil and palynological indicator results from the FPM confirm the great potential of mire archives in the Fotsch Valley and elsewhere in the Alps for palaeoenvironmental research. Future studies focussing additionally on faecal biomarkers and compound-specific stable isotope analyses at high-resolution are envisioned in order to corroborate and reconstruct in detail the palaeovegetation, -climate and human history of the Fotsch Valley.
Supplemental Material
sj-docx-1-hol-10.1177_09596836231176485 – Supplemental material for Holocene landscape evolution, palaeoclimate and human impact in the Fotsch Valley, Stubai Alps, Austria: Interrogating biomarkers, stable isotopes, macrofossils and palynological indicators from a subalpine mire archive
Supplemental material, sj-docx-1-hol-10.1177_09596836231176485 for Holocene landscape evolution, palaeoclimate and human impact in the Fotsch Valley, Stubai Alps, Austria: Interrogating biomarkers, stable isotopes, macrofossils and palynological indicators from a subalpine mire archive by Marcel Lerch, Marika Stutzriemer, Marcel Bliedtner, Tobias Bromm, Melissa Sehrt, Nina Feistmantl, Benjamin Dietre, Werner Kofler, Morena Boysen, Gary Salazar, Sönke Szidat, Clemens Geitner, Jean Nicolas Haas, Dieter Schäfer, Bruno Glaser and Michael Zech in The Holocene
Supplemental Material
sj-png-6-hol-10.1177_09596836231176485 – Supplemental material for Holocene landscape evolution, palaeoclimate and human impact in the Fotsch Valley, Stubai Alps, Austria: Interrogating biomarkers, stable isotopes, macrofossils and palynological indicators from a subalpine mire archive
Supplemental material, sj-png-6-hol-10.1177_09596836231176485 for Holocene landscape evolution, palaeoclimate and human impact in the Fotsch Valley, Stubai Alps, Austria: Interrogating biomarkers, stable isotopes, macrofossils and palynological indicators from a subalpine mire archive by Marcel Lerch, Marika Stutzriemer, Marcel Bliedtner, Tobias Bromm, Melissa Sehrt, Nina Feistmantl, Benjamin Dietre, Werner Kofler, Morena Boysen, Gary Salazar, Sönke Szidat, Clemens Geitner, Jean Nicolas Haas, Dieter Schäfer, Bruno Glaser and Michael Zech in The Holocene
Supplemental Material
sj-xlsx-2-hol-10.1177_09596836231176485 – Supplemental material for Holocene landscape evolution, palaeoclimate and human impact in the Fotsch Valley, Stubai Alps, Austria: Interrogating biomarkers, stable isotopes, macrofossils and palynological indicators from a subalpine mire archive
Supplemental material, sj-xlsx-2-hol-10.1177_09596836231176485 for Holocene landscape evolution, palaeoclimate and human impact in the Fotsch Valley, Stubai Alps, Austria: Interrogating biomarkers, stable isotopes, macrofossils and palynological indicators from a subalpine mire archive by Marcel Lerch, Marika Stutzriemer, Marcel Bliedtner, Tobias Bromm, Melissa Sehrt, Nina Feistmantl, Benjamin Dietre, Werner Kofler, Morena Boysen, Gary Salazar, Sönke Szidat, Clemens Geitner, Jean Nicolas Haas, Dieter Schäfer, Bruno Glaser and Michael Zech in The Holocene
Supplemental Material
sj-xlsx-3-hol-10.1177_09596836231176485 – Supplemental material for Holocene landscape evolution, palaeoclimate and human impact in the Fotsch Valley, Stubai Alps, Austria: Interrogating biomarkers, stable isotopes, macrofossils and palynological indicators from a subalpine mire archive
Supplemental material, sj-xlsx-3-hol-10.1177_09596836231176485 for Holocene landscape evolution, palaeoclimate and human impact in the Fotsch Valley, Stubai Alps, Austria: Interrogating biomarkers, stable isotopes, macrofossils and palynological indicators from a subalpine mire archive by Marcel Lerch, Marika Stutzriemer, Marcel Bliedtner, Tobias Bromm, Melissa Sehrt, Nina Feistmantl, Benjamin Dietre, Werner Kofler, Morena Boysen, Gary Salazar, Sönke Szidat, Clemens Geitner, Jean Nicolas Haas, Dieter Schäfer, Bruno Glaser and Michael Zech in The Holocene
Supplemental Material
sj-xlsx-4-hol-10.1177_09596836231176485 – Supplemental material for Holocene landscape evolution, palaeoclimate and human impact in the Fotsch Valley, Stubai Alps, Austria: Interrogating biomarkers, stable isotopes, macrofossils and palynological indicators from a subalpine mire archive
Supplemental material, sj-xlsx-4-hol-10.1177_09596836231176485 for Holocene landscape evolution, palaeoclimate and human impact in the Fotsch Valley, Stubai Alps, Austria: Interrogating biomarkers, stable isotopes, macrofossils and palynological indicators from a subalpine mire archive by Marcel Lerch, Marika Stutzriemer, Marcel Bliedtner, Tobias Bromm, Melissa Sehrt, Nina Feistmantl, Benjamin Dietre, Werner Kofler, Morena Boysen, Gary Salazar, Sönke Szidat, Clemens Geitner, Jean Nicolas Haas, Dieter Schäfer, Bruno Glaser and Michael Zech in The Holocene
Supplemental Material
sj-xlsx-5-hol-10.1177_09596836231176485 – Supplemental material for Holocene landscape evolution, palaeoclimate and human impact in the Fotsch Valley, Stubai Alps, Austria: Interrogating biomarkers, stable isotopes, macrofossils and palynological indicators from a subalpine mire archive
Supplemental material, sj-xlsx-5-hol-10.1177_09596836231176485 for Holocene landscape evolution, palaeoclimate and human impact in the Fotsch Valley, Stubai Alps, Austria: Interrogating biomarkers, stable isotopes, macrofossils and palynological indicators from a subalpine mire archive by Marcel Lerch, Marika Stutzriemer, Marcel Bliedtner, Tobias Bromm, Melissa Sehrt, Nina Feistmantl, Benjamin Dietre, Werner Kofler, Morena Boysen, Gary Salazar, Sönke Szidat, Clemens Geitner, Jean Nicolas Haas, Dieter Schäfer, Bruno Glaser and Michael Zech in The Holocene
Footnotes
Acknowledgements
We are very grateful to numerous students and assistant researchers who supported our field works in the Fotsch Valley as well as our extensive laboratory work, namely Sabrina Andrick, Larissa Boysen, Corinna Heinrich, Tina Maria Jahn, Martin Kaufhold, Marco Pacher and Katharina Schneider. We further thank Julia Rechenmacher and Marcel Ortner for their great support regarding age-depth-modelling as well as Fabian Vassanelli for macrofossil evaluation. Special thanks go to Oliver Kiewert and his team from the (former) Bergheim hostel in the Fotsch Valley for excellent food and accommodation during the period of fieldwork. We also thank Heike Maennicke and Marianne Zech (formerly M. Benesch) for the invaluable support regarding laboratory work at the Martin Luther University of Halle-Wittenberg. We appreciate their pleasant collaboration throughout the research at all times. Last but not least, we kindly thank two anonymous Referees for their constructive reviews that greatly helped to improve our manuscript and Prof. Dr. Frank Chambers for editorial handling.
Author contributions
The project idea was developed by MZ in cooperation with CG, DS, JNH and BG. Fieldwork was carried out by ML, MaSt, MZ, CG, JNH and DS. Laboratory work was performed by ML, MaSt, and MoB with contributions made by TB, BG and MZ. Macrofossil and palynological analyses as well as data management and statistical calculations for the palaeoecological results were carried out by MeSe, NF, BD, WK and JNH. MaB conducted radiocarbon dating with contributions made by GS and SöS. The manuscript was prepared by ML with contribution made by MZ and JNH. All co-authors contributed to the discussion of the results and read and approved the manuscript.
Data availability
Data are available in the supplement.
Funding
The author(s) disclosed receipt of the following financial support for the research, authorship, and/or publication of this article: This research has been supported by the German Research Foundation ‘Deutsche Forschungsgemeinschaft’ (grant. nos. ZE 844/12-1 and GL 327/23-1) and by institutional funds to JNH (Institute of Botany, University of Innsbruck, Austria).
Supplemental material
Supplemental material for this article is available online.
References
Supplementary Material
Please find the following supplemental material available below.
For Open Access articles published under a Creative Commons License, all supplemental material carries the same license as the article it is associated with.
For non-Open Access articles published, all supplemental material carries a non-exclusive license, and permission requests for re-use of supplemental material or any part of supplemental material shall be sent directly to the copyright owner as specified in the copyright notice associated with the article.