
Abstract
The Drentsche Aa valley system in the glacial sandy landscape of the north-eastern Netherlands, is one of the many regional drainage systems in the north-western to central European Lowlands. Following deep incision in the Weichselian, ca 7 m of eutrophic peat has accumulated in the lower to middle reaches of the valley system in the Holocene, completely filling the Weichselian incision. We reconstructed the rate of water-level rise controlling peat growth at three locations in the valley system (representing the upper, middle and lower reaches), using 14C peat dates from compaction-free sampling sites on the sloping valley margin where the peat directly overlies the sandy Pleistocene subsurface. The 14C dates enabled the construction of curves showing the water-level evolution at each location. Our results show variable rates of Holocene peat growth in the valley system in response to different drivers of hydrological change: a strong increase in annual precipitation (onset Holocene), a decrease in evapotranspiration (10,000–8000 cal. years BP) and relative sea-level rise (after ~4500 cal. years BP). Because the identified hydrological controls on peat growth are regional, they probably ruled Holocene peat growth in many peat-filled valley systems in the north-western to central European Lowlands. Currently, there is growing attention for these valley systems in the context of European nature restoration efforts and climate change adaptation and mitigation measures. The present study underscores that large-scale hydrological measures outside the valley system are needed for restoration of degraded valley peatlands.
Keywords
Introduction
The temperate humid climatic conditions prevailing during the Holocene caused large-scale peat growth in the north-western to central European Lowlands. Peatlands were especially abundant in the Netherlands, where they have been estimated to have covered about 35% of the country in Roman times (Koster and Favier, 2005). Since then their area has shrunk, due to marine erosion, fluvial and marine deposition and human exploitation. Today, 11% of the Netherlands is still covered by, largely degrading, peatlands (Koster and Favier, 2005). The extensive ombrotrophic raised bogs in the higher parts of the Netherlands have now almost completely disappeared due to drainage, followed by oxidation and excavation. In lower topographic positions minerotrophic fen peat is still abundant in the subsurface of the Netherlands. Metres-thick peat beds still exist in the coastal plain and in the Rhine-Meuse delta, where they formed under the influence of Holocene relative sea-level rise (e.g. Berendsen et al., 2007; Van de Plassche et al., 2005, 2010; Waller and Kirby, 2021). Outside this area, thick peat beds locally fill valley systems in the higher sandy Pleistocene landscapes of the Netherlands (e.g. De Gans, 1983). The factors controlling Holocene peat growth in these valley systems are not fully understood, although, because the valleys are linked to the coastal plain, relative sea-level rise is believed to have been important. For the Rhine-Meuse delta, it has been shown that relative sea-level rise influenced groundwater-level evolution, and thereby peat growth rates, far upstream in the upper delta plain (Cohen, 2005; Van Dijk et al., 1991). However, the extent of sea-level control on peat growth in smaller valley systems has not been systematically investigated so far.
Peatlands worldwide host diverse and rich ecosystems that are, however, threatened on a large scale by drainage and reclamation (Verhoeven, 2014). Nowadays, in many degraded European peatlands, including peat-filled valleys, restoration projects are carried out or planned (e.g. Trepel and Kluge, 2002; Zerbe et al., 2013). An important driver of the restoration efforts is climate change adaptation and mitigation. Peatland restoration increases water retention in catchments and contributes to lowering stream peak discharges. At the same time, strong reduction of CO2 emission can be realized through stopping the degradation of peatlands (Leifeld and Menichetti, 2018). Renewed peat growth would even result in carbon storage. Successful restoration of the peatland ecosystems demands knowledge about the factors determining peat formation in the past (e.g. Waller and Kirby, 2021). Insight into natural groundwater conditions and rates of peat growth are crucial to set realistic restoration goals.
In this study we will focus on the Drentsche Aa valley system (Figure 1), one of the larger peat-filled valley systems in the Netherlands. The aim of our study is to identify the controlling hydrological factors of Holocene peat growth in the system. We hypothesize that in the lower reaches of the system Holocene relative sea-level rise may have controlled groundwater-level rise and thereby the rate of peat growth, whereas in the upper reaches the rate of peat growth may have been determined by upstream regional hydrological factors in the catchment, such as precipitation and evapotranspiration. To investigate this hypothesis we radiocarbon-dated a series of peat samples from a range of elevations at three locations along the system, in order to reconstruct the development of local water levels and associated peat growth. Peat samples were taken from compaction-free sampling sites allowing a water-level curve to be made for each location. Interpretation and comparison of the curves is expected to shed light on temporal and spatial changes in various hydrological factors controlling peat growth.
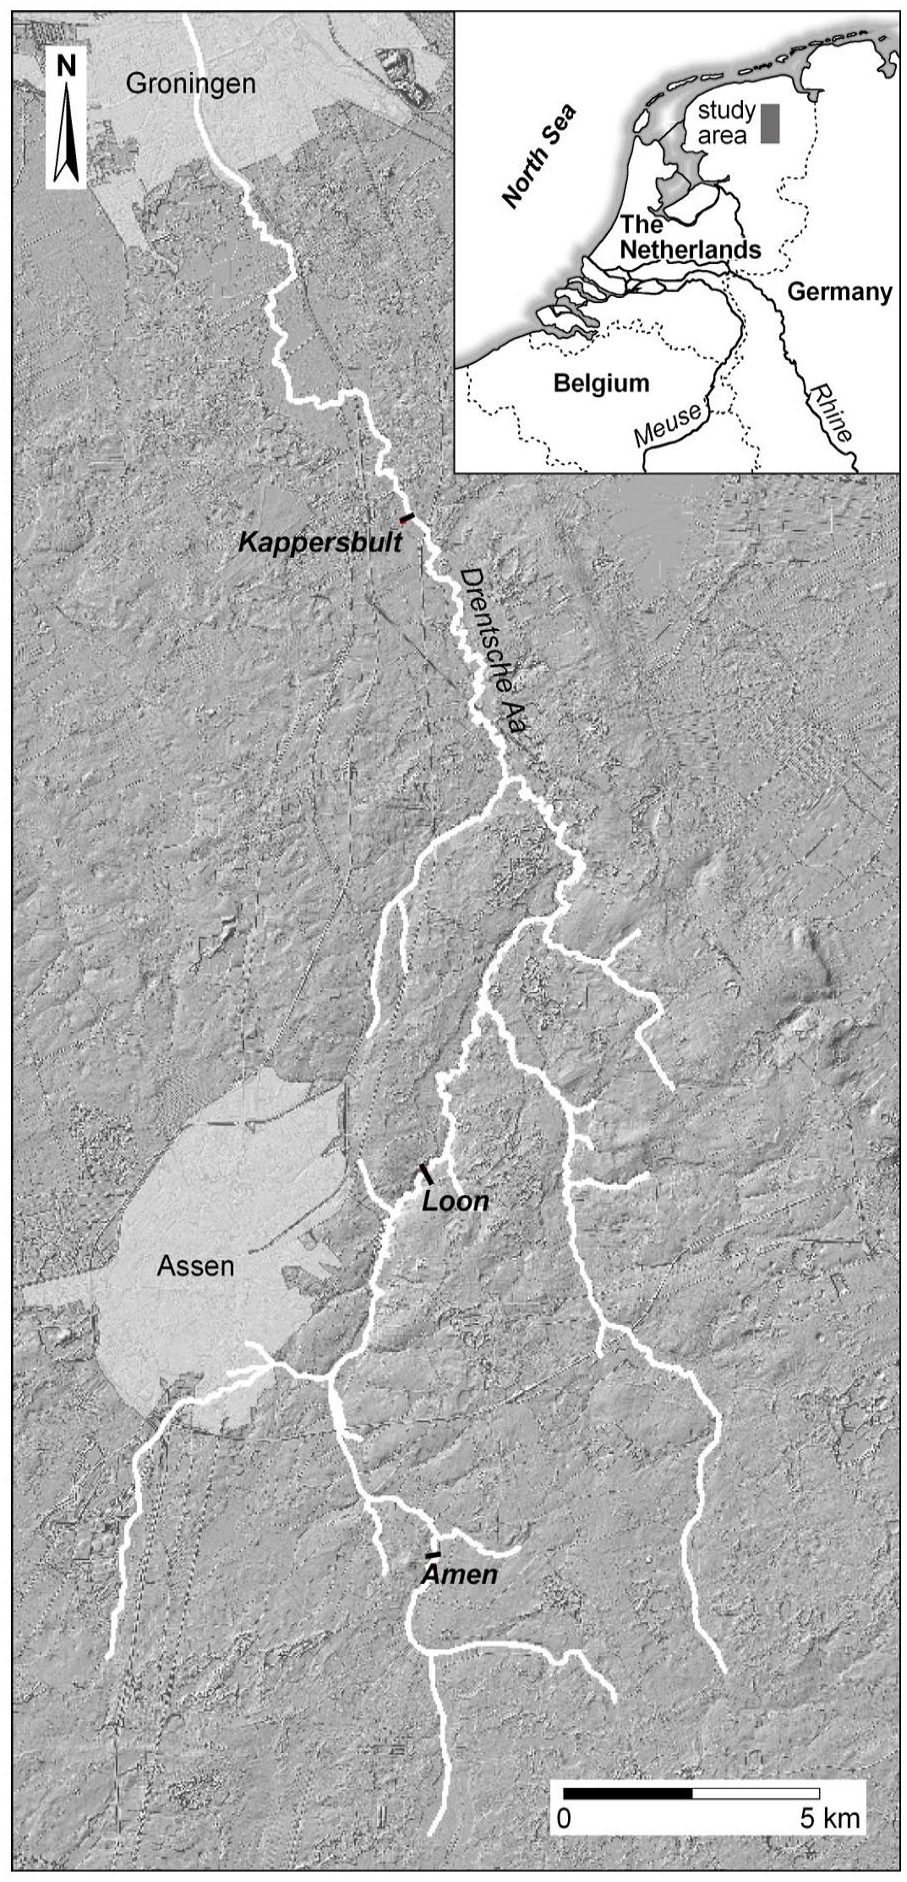
The location of the Drentsche Aa valley system in the Netherlands and the locations of the Amen, Loon and Kappersbult cross-sections. Location of the main cities of Assen and Groningen is also shown. Grey-shading in the background gives an impression of the subtle relief of the Drenthe-Frisian till plateau into which the Drentsche Aa system has incised.
Study area
The Drentsche Aa valley system (Figure 1) is located in the north-eastern Netherlands and is incised into Middle to Late Pleistocene sandy and loamy deposits, of fluvioglacial, glacial, periglacial aeolian and local fluvial origin. The loamy to sandy, and locally gravelly, glacial till in the area (Drenthe Formation; De Mulder et al., 2003) was deposited during the Saalian, and may be up to 4 m thick (De Gans, 1981) in the southern part of the study area, but is largely absent in the northern part. The till is commonly underlain by, often rather fine, sandy ice-meltwater deposits from the Elsterian (Peelo Formation; De Mulder et al., 2003). The till is commonly overlain by Weichselian periglacial aeolian sands, known as cover sands (Wierden Member, Boxtel Formation; De Mulder et al., 2003), being a few metres thick and lying at the surface in large parts of the study area. Local redistribution and mixing of cover sand with erosion products from the underlying glacial till by snow-meltwater caused formation of fluvioperiglacial deposits (Boxtel Formation). The cover sands occur in large parts of the north-western to central European lowlands, in an area known as the ‘European sand belt’ (Koster, 2005).
The Drentsche Aa system drains northward from the Pleistocene Drenthe plateau to the Holocene coastal plain of Groningen. The valley system is about 45 km long from the headwaters, lying at about 16 m above mean sea level, to the coastal plain, which is at about mean sea level. The trunk valley splits upstream into two main branches. Many minor valleys, or small dendritic valley systems, are connected to the trunk valley and the main branches. A more than 1 m thick peat-fill occurs in the trunk valley and the main branches, whereas peat-fills in the minor valleys are mostly absent or less than 1 m thick. The present surficial valley topography is subtle, with no more than a few metres difference in elevation between the valley centre and the flanking plateaus. The peat-fill (Singraven Member, Boxtel Formation; De Mulder et al., 2003) hides the Weichselian valley bottom that lies down to 7 m below the present surface in the lower valley reach. The valley system is drained by the Drentsche Aa River, a sinuous low-energy stream (mean annual discharge 1.8 m3/s) with relatively high lateral channel stability (Candel et al., 2017).
Methods
Three locations in the Drentsche Aa valley system were selected for the study, one in the lower trunk valley (Kappersbult) and two upstream along the largest branch of the system (Loon and Amen; Figure 1). The Amen location in the upper part of the system is 9 km upstream (valley distance) of the Loon location in the middle part of the system, which in turn, is 15 km upstream of the Kappersbult location in the lower part of the system. At each location, borings were carried out in a valley-wide transect to investigate the lithostratigraphy of the subsurface. The transects were 300–400 m long, with borehole spacing generally between 25 and 100 m on the valley margins, and between 10 and 25 m in the central part of the valley to yield a detailed picture of the peat valley-fill. Borings were carried out using an Edelman auger and a gouge (Oele et al., 1983).
Thirty-five borings were carried out, with maximum borehole depth in the peat valley-fill reaching 7 m, whereas borehole depth on the valley margins was limited to 2–3 m. Lithological properties from the cores were described every 10 cm using the sediment texture and organic content classification of De Bakker and Schelling (1966). In addition, botanical macro-remains (such as wood and sedge fragments) in the peaty material were described. The elevation of all borehole locations, relative to the national geodetic datum (NAP: Normaal Amsterdams Peil, which is about mean sea level) was determined by (conventional) levelling to a nearby benchmark. For each location a lithostratigraphic cross-section was obtained by plotting and stratigraphic correlation of borehole logs (Figures 2–4). For the Kappersbult cross-section, six additional borehole descriptions from other sources (Candel et al., 2017; Makaske and Maas, unpubl.; National Geological Survey, Dinoloket) were used.
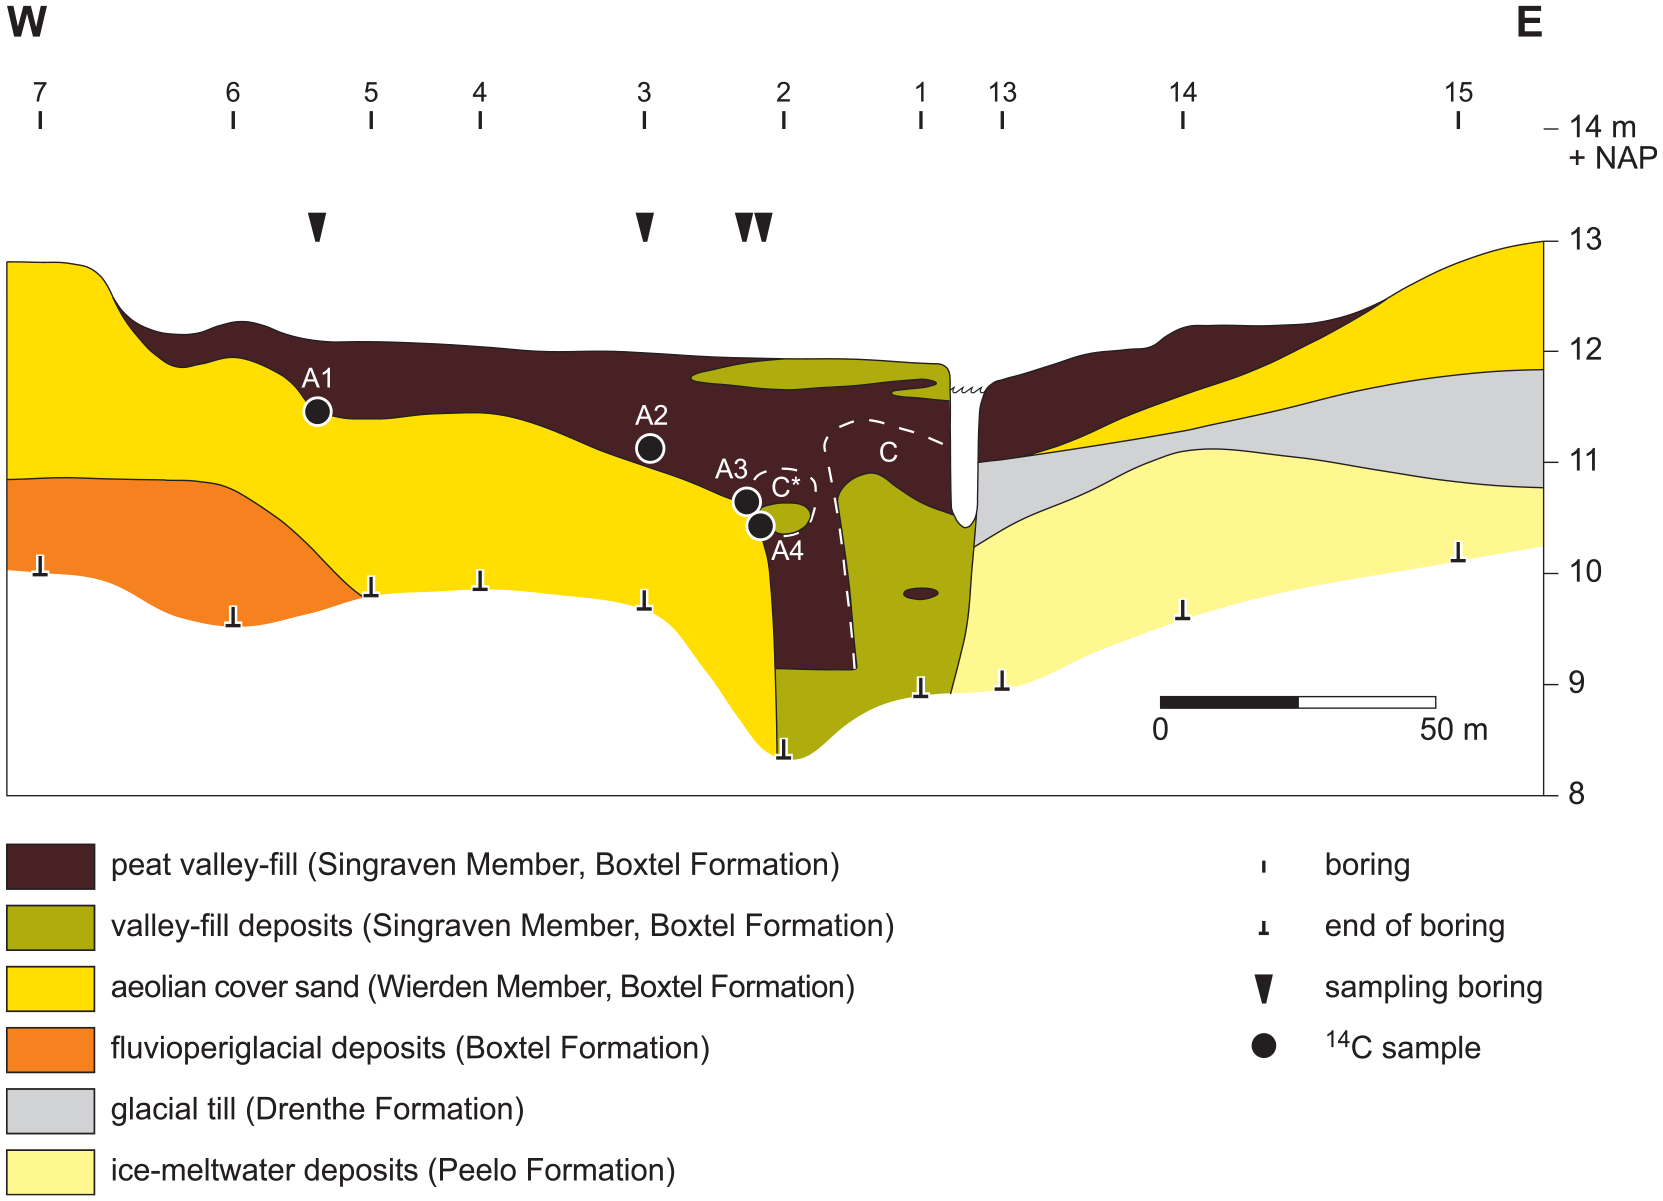
The Amen borehole cross-section. Location indicated in Figure 1. Part C of the valley-fill contains reworked organic channel deposits, often with admixed sand, described in detail by Candel et al. (2017). Part C* of the valley-fill is interpreted to contain reworked organic channel deposits based on dating results of samples A3 and A4 and reinterpretation of cross-section data from Candel et al. (2017).
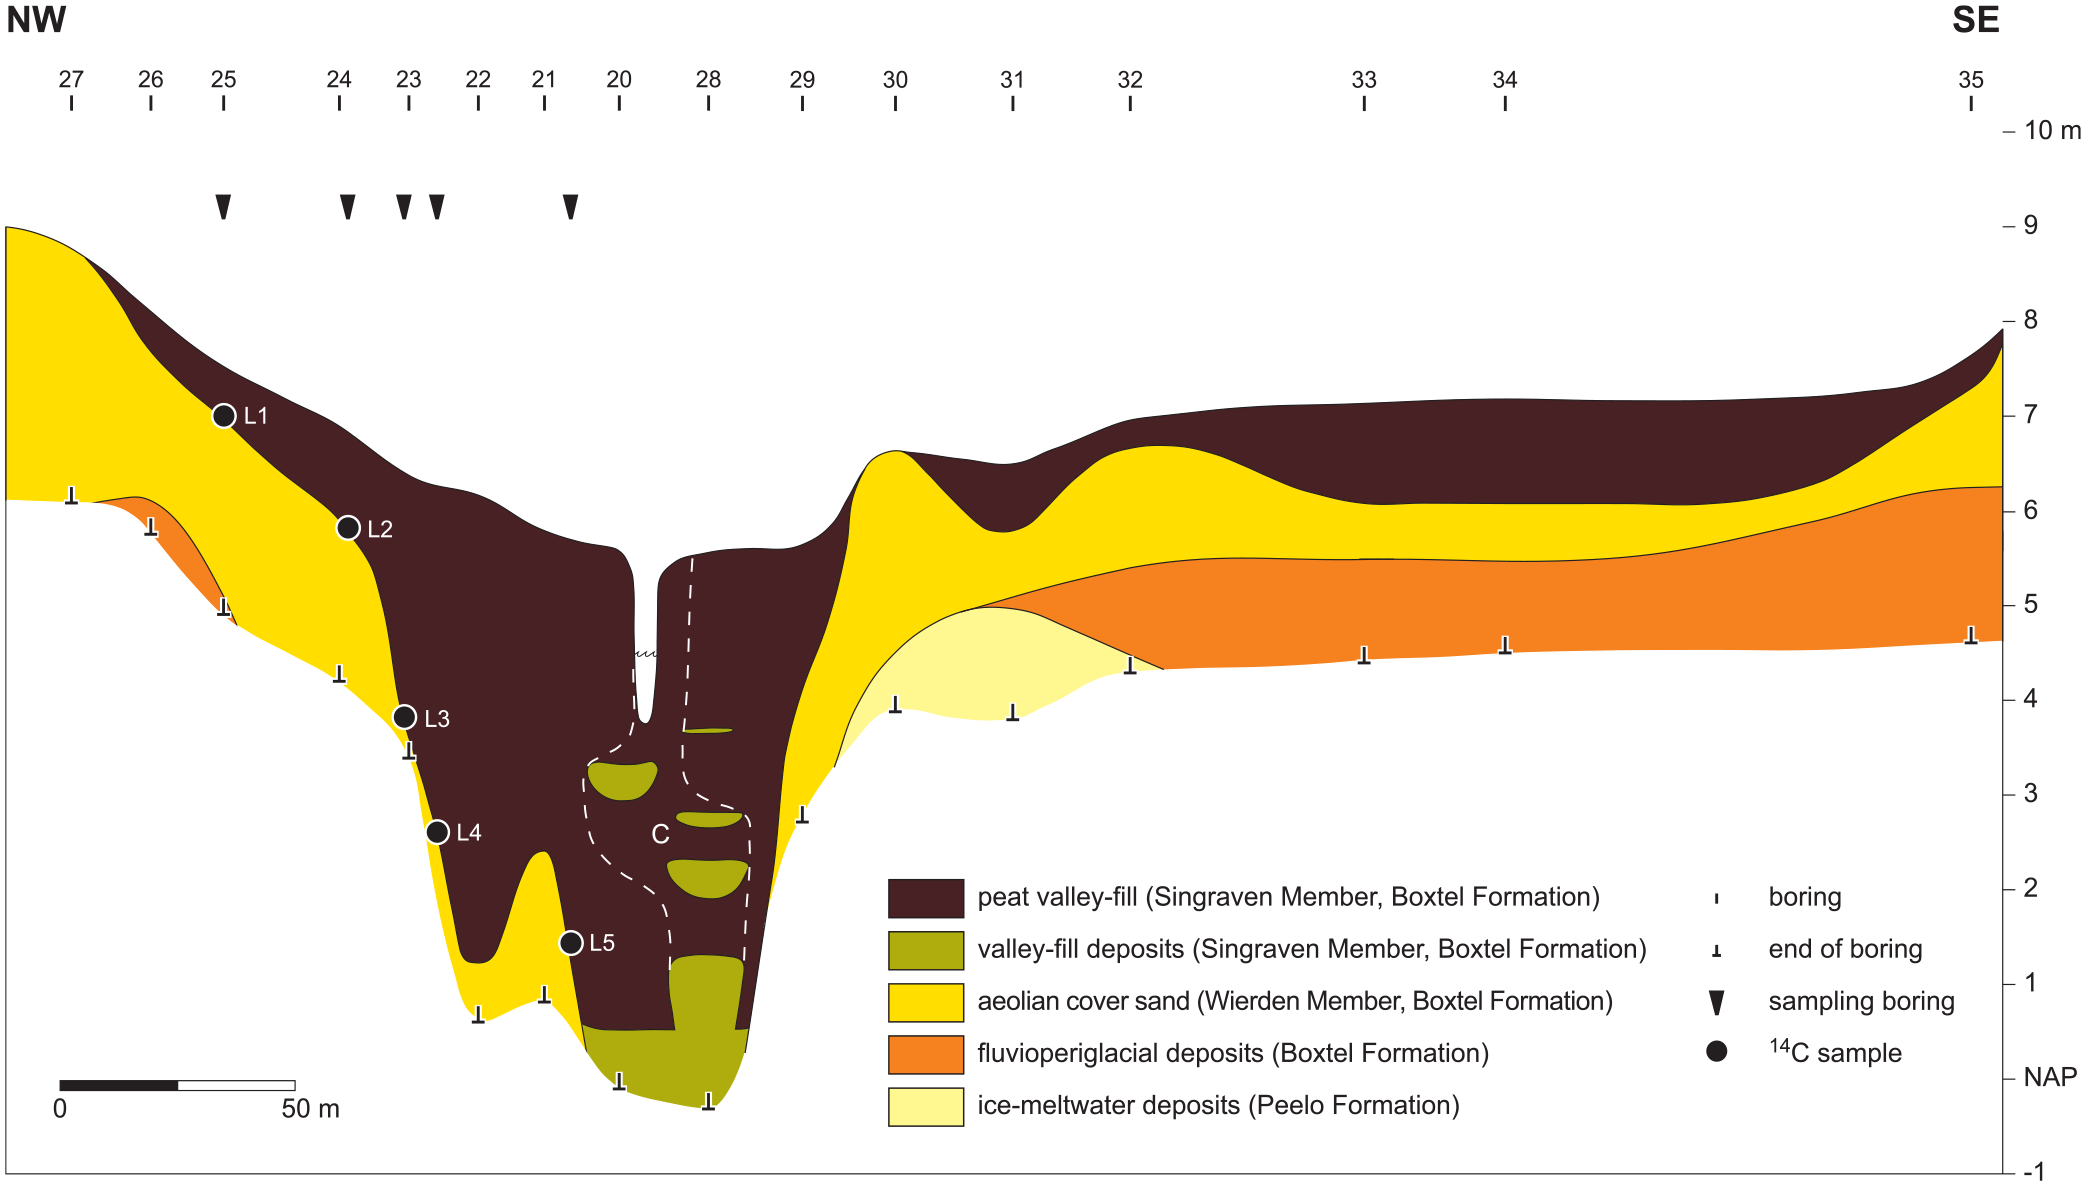
The Loon borehole cross-section. Location indicated in Figure 1. Part C of the valley-fill contains reworked organic channel deposits, often with admixed sand, described in detail by Candel et al. (2017).
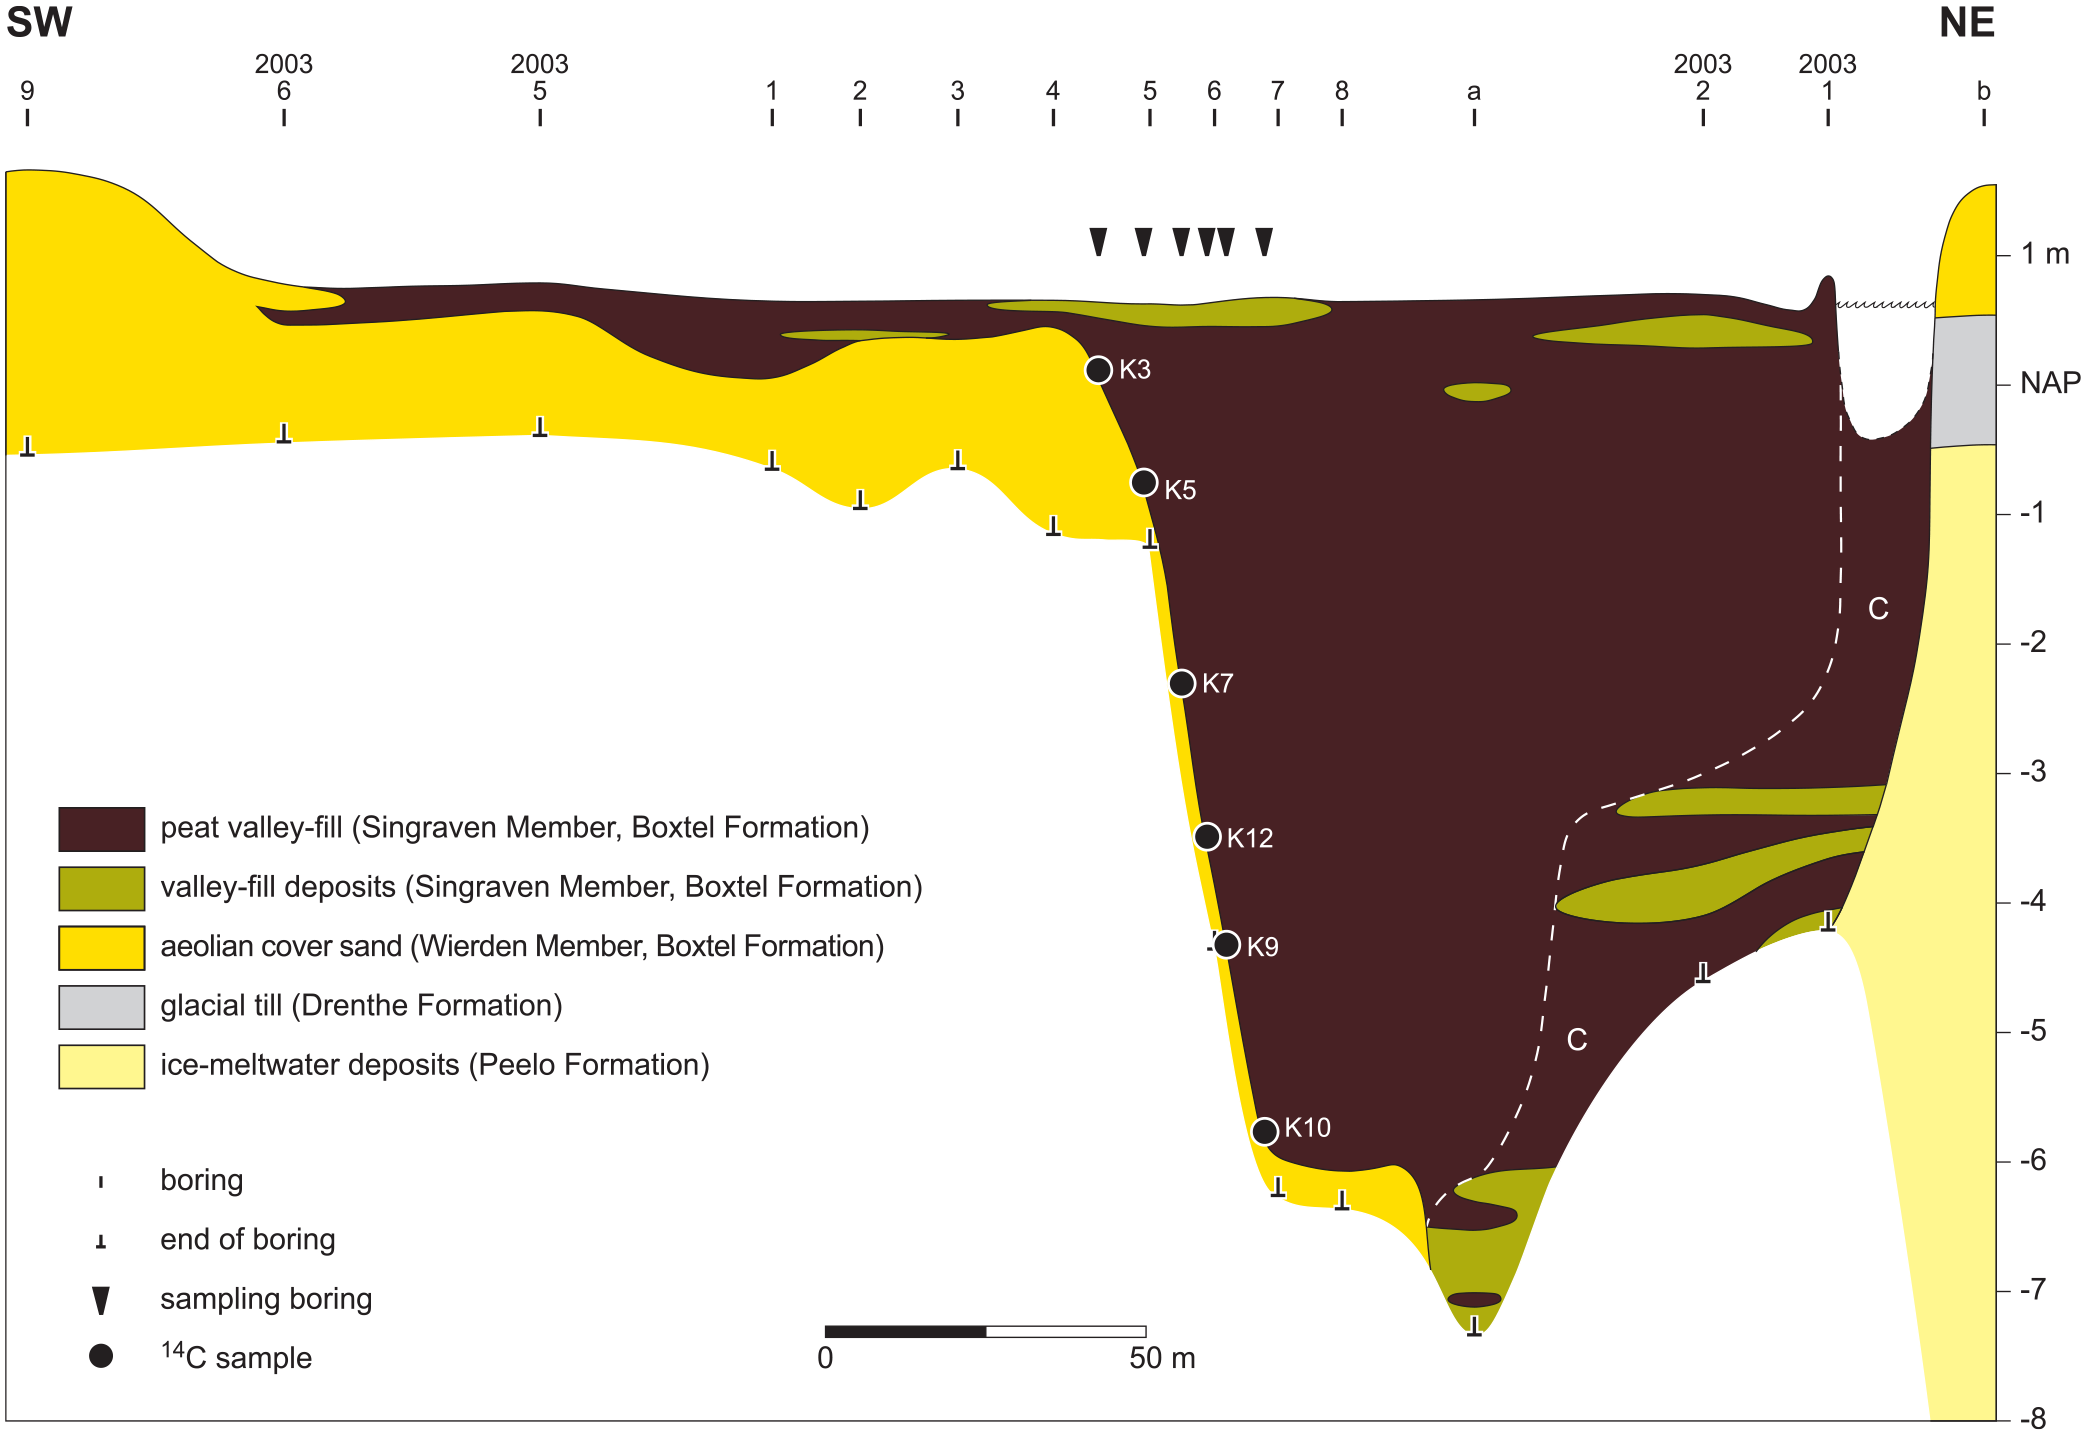
The Kappersbult borehole cross-section. Location indicated in Figure 1. Part C of the valley-fill contains reworked organic channel deposits, often with admixed sand, described in detail by Candel et al. (2017). Boreholes 2003-1, 2003-2, 2003-5 and 2003-6 are from Makaske and Maas (unpublished); borehole a is from Candel et al. (2017); borehole b is from Dinoloket (National Geological Survey; borehole B12B0163, 160 m deep, upper 9.5 m shown).
At each location a series of peat samples was collected for radiocarbon age determination. All sampling sites were located on one of the steep palaeovalley sides flanking the thick peat-fill. Samples at these sites were taken from the basal part of the peat-fill directly overlying the sandy Pleistocene subsurface. These sites were selected because they are virtually compaction-free, that is, the vertical position of the peat within the cross-section will not have changed since its formation. In each cross-section, samples were collected from a large range of elevations, to enable the elevation of peat formation against time to be plotted. Moreover, such series of samples (which should plot consecutively in sequence over time) enabled checking the chronostratigraphical consistency of the dating results.
A gouge with a diameter of 4 cm was generally used for sampling. Two samples (K3 and K5) were taken with a 6-cm-wide gouge, but at the other sites successful sampling proved to require a 4-cm-wide gouge. From each sampling site a core of a few decimetres long, including the sand-peat interface, was taken, packed and stored in a cool place for later analysis. In the laboratory the cores were cut into 1-cm-thick slices from which the edge (a few mm thick) with possible contamination was removed. The remaining material of each slice was sieved over a 180 μm screen. The volumetric sand content of each slice (<180 μm and >180 μm) was determined visually after sieving. This was done in order to determine the exact vertical position of the boundary between the Pleistocene sandy subsurface with its palaeosol, and the, often sandy, overlying peat. In general, a strong upward decrease in sand content to less than 10 or 20% was considered as the sand-peat interface. From the slices above this level materials for radiocarbon dating have been selected. In most cases suitable dating materials were found in slices 1–6 cm above the sand-peat interface. In two cases (samples A4 and K12) material for dating was selected 8–10 cm above the sand-peat interface, because the lower slices yielded insufficient suitable material.
For selecting suitable dating material we carried out an analysis of macro-remains from the slices (>180 μm fraction) near the sand-peat interface. Dating of terrestrial botanical macro-remains was preferred because other peat constituents are likely to be contaminated by the admixture of materials of multiple ages that may not represent the time of deposition (Mook and Streurman, 1983) and can cause ages that are too old or too young (Törnqvist et al., 1992). As much as possible, seeds and buds from peat-forming plants were collected from the >180 μm sieve fraction using a binocular microscope. These macro-remains yield best dating results, because they are annual products of the local vegetation. When they are intact the chance that they are reworked fragments of older peat beds from elsewhere is minimal. Unfortunately, not all selected slices yielded enough seeds for dating, and therefore a number of samples for dating were composed of somewhat less suitable materials, such as wood, bark and Phragmites stem fragments. Fifteen samples were submitted to the Leibniz Laboratory for Radiometric Dating and Stable Isotope Research (Christian-Albrechts-University of Kiel) for AMS 14C dating. In Table 1 the dating results and sample details are given. 14C ages were calibrated using OxCal 4.4 (IntCal 20 calibration curve). The resulting calendar ages are given in Table 2.
Radiocarbon age determinations carried out for this study.
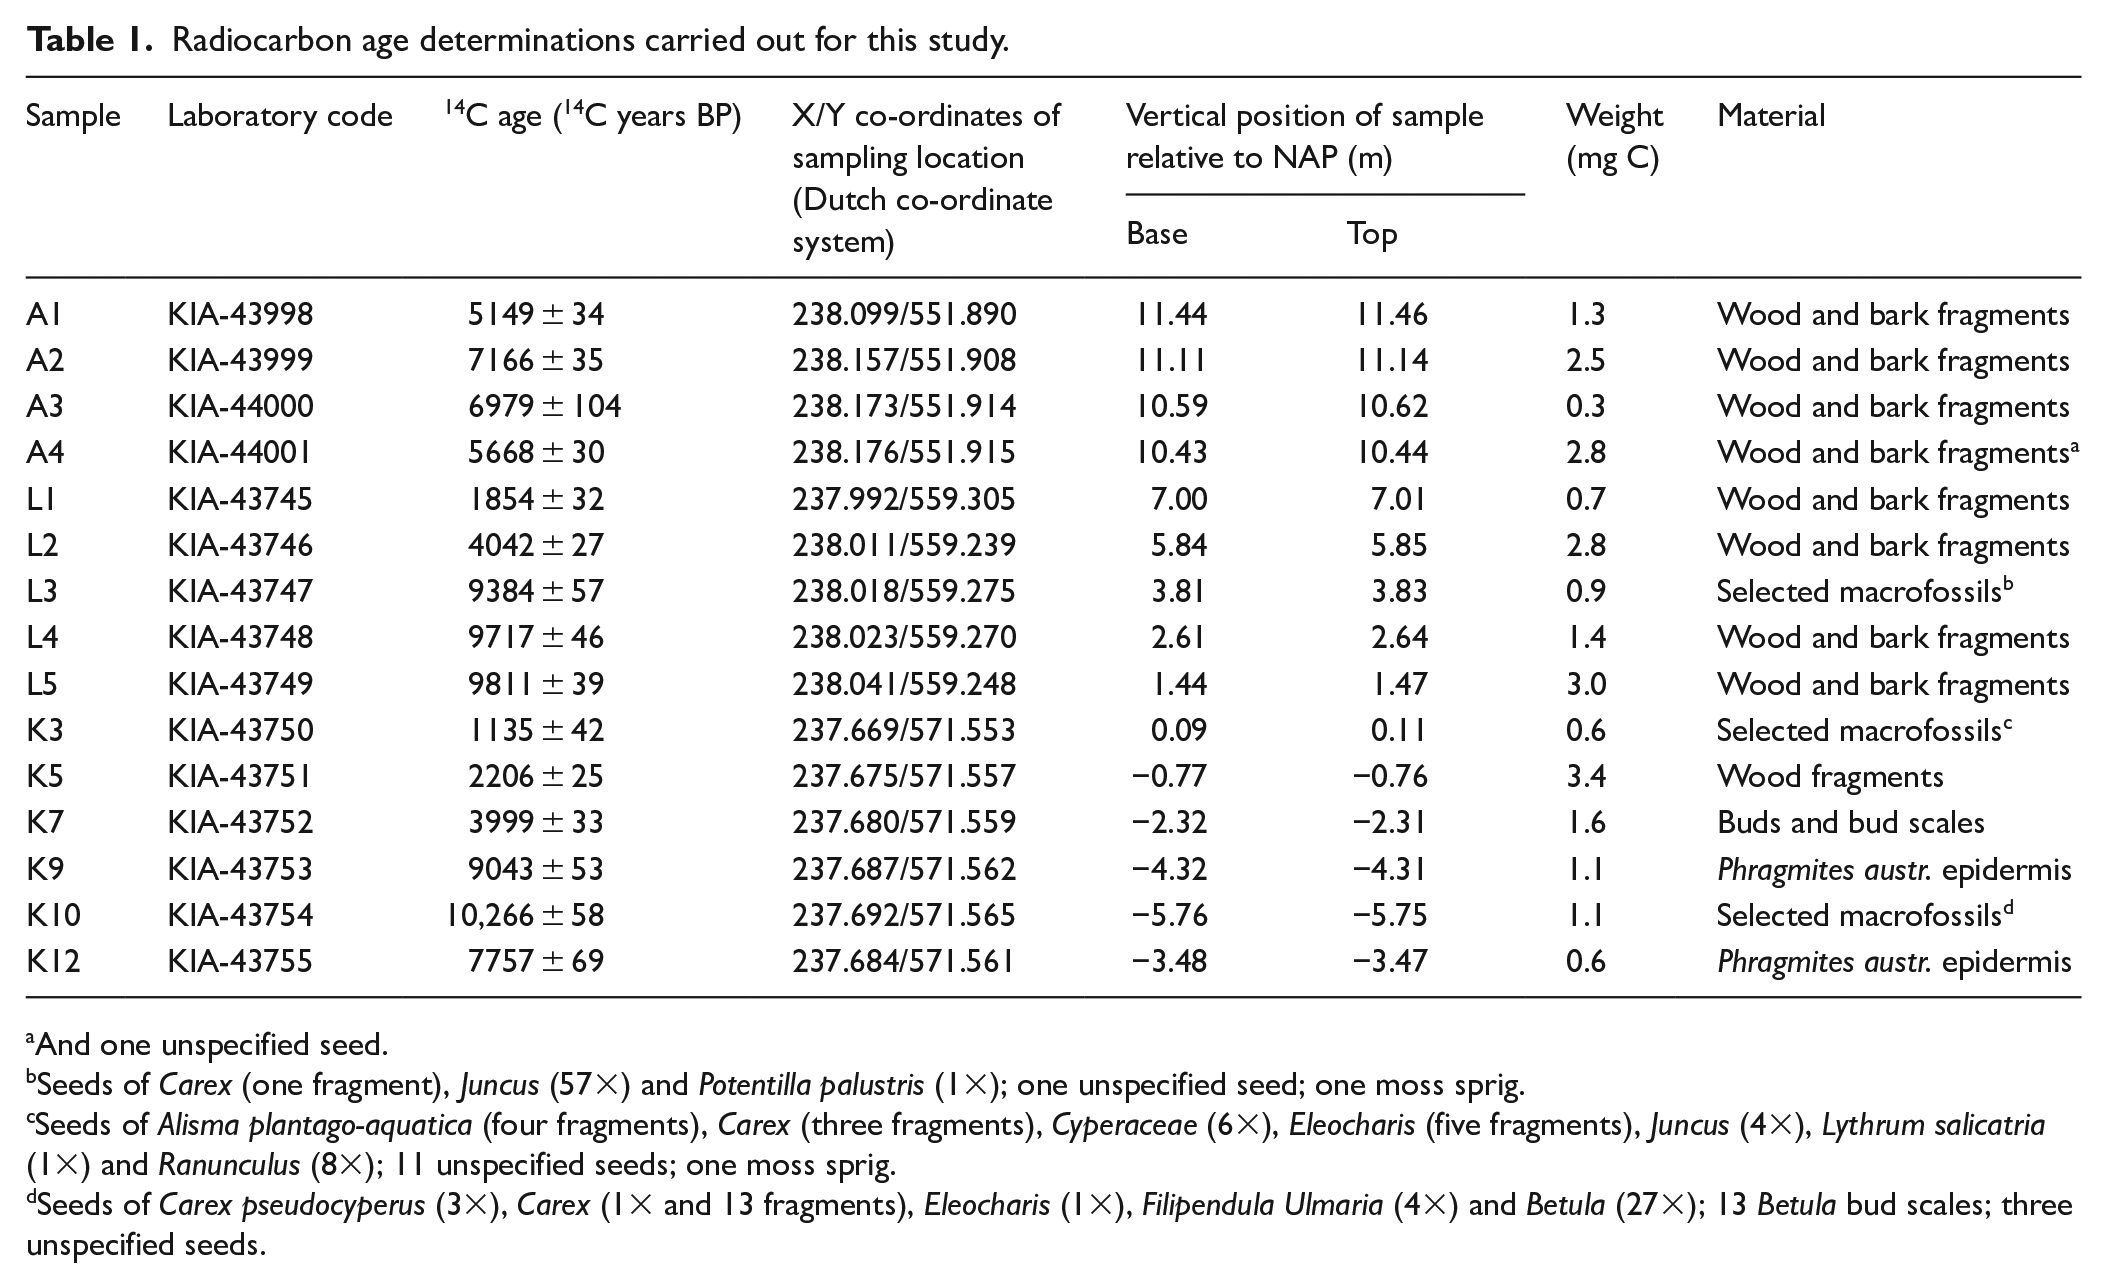
And one unspecified seed.
Seeds of Carex (one fragment), Juncus (57×) and Potentilla palustris (1×); one unspecified seed; one moss sprig.
Seeds of Alisma plantago-aquatica (four fragments), Carex (three fragments), Cyperaceae (6×), Eleocharis (five fragments), Juncus (4×), Lythrum salicatria (1×) and Ranunculus (8×); 11 unspecified seeds; one moss sprig.
Seeds of Carex pseudocyperus (3×), Carex (1× and 13 fragments), Eleocharis (1×), Filipendula Ulmaria (4×) and Betula (27×); 13 Betula bud scales; three unspecified seeds.
Calibration of radiocarbon ages. a
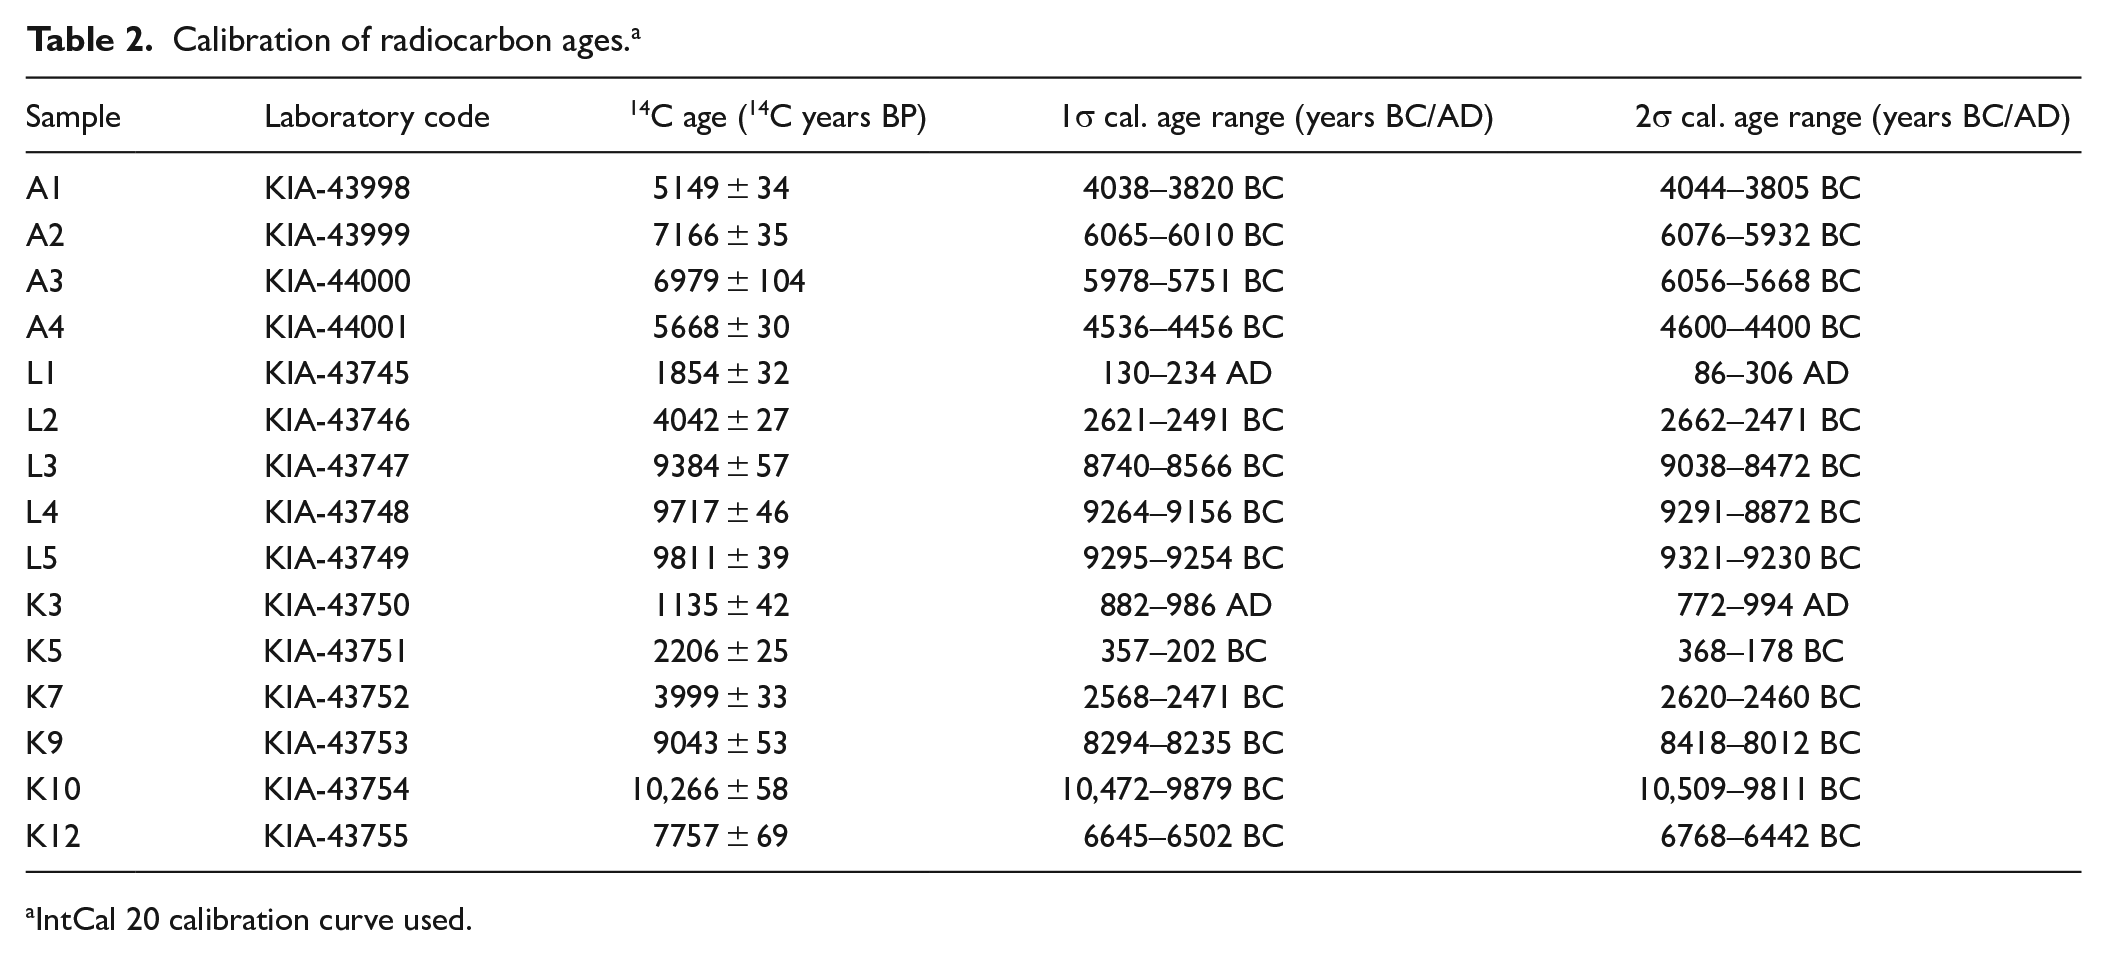
IntCal 20 calibration curve used.
The calibrated ages were plotted against sample depth in a diagram (Figure 5). In order to relate peat development to the development of the local water level, we plotted the data points as error boxes in the diagram, depicting all possible errors and uncertainties in age and depth applying the method described by Berendsen et al. (2007). The assumption underlying this approach is that eutrophic wood peat, that our samples dominantly are composed of, forms at or very near mean local water level (e.g. Van de Plassche et al., 2005). Thus, if uncertainties in age and depth are sufficiently taken into account, the former peat surface can be taken as approximately equal to the former mean water level.
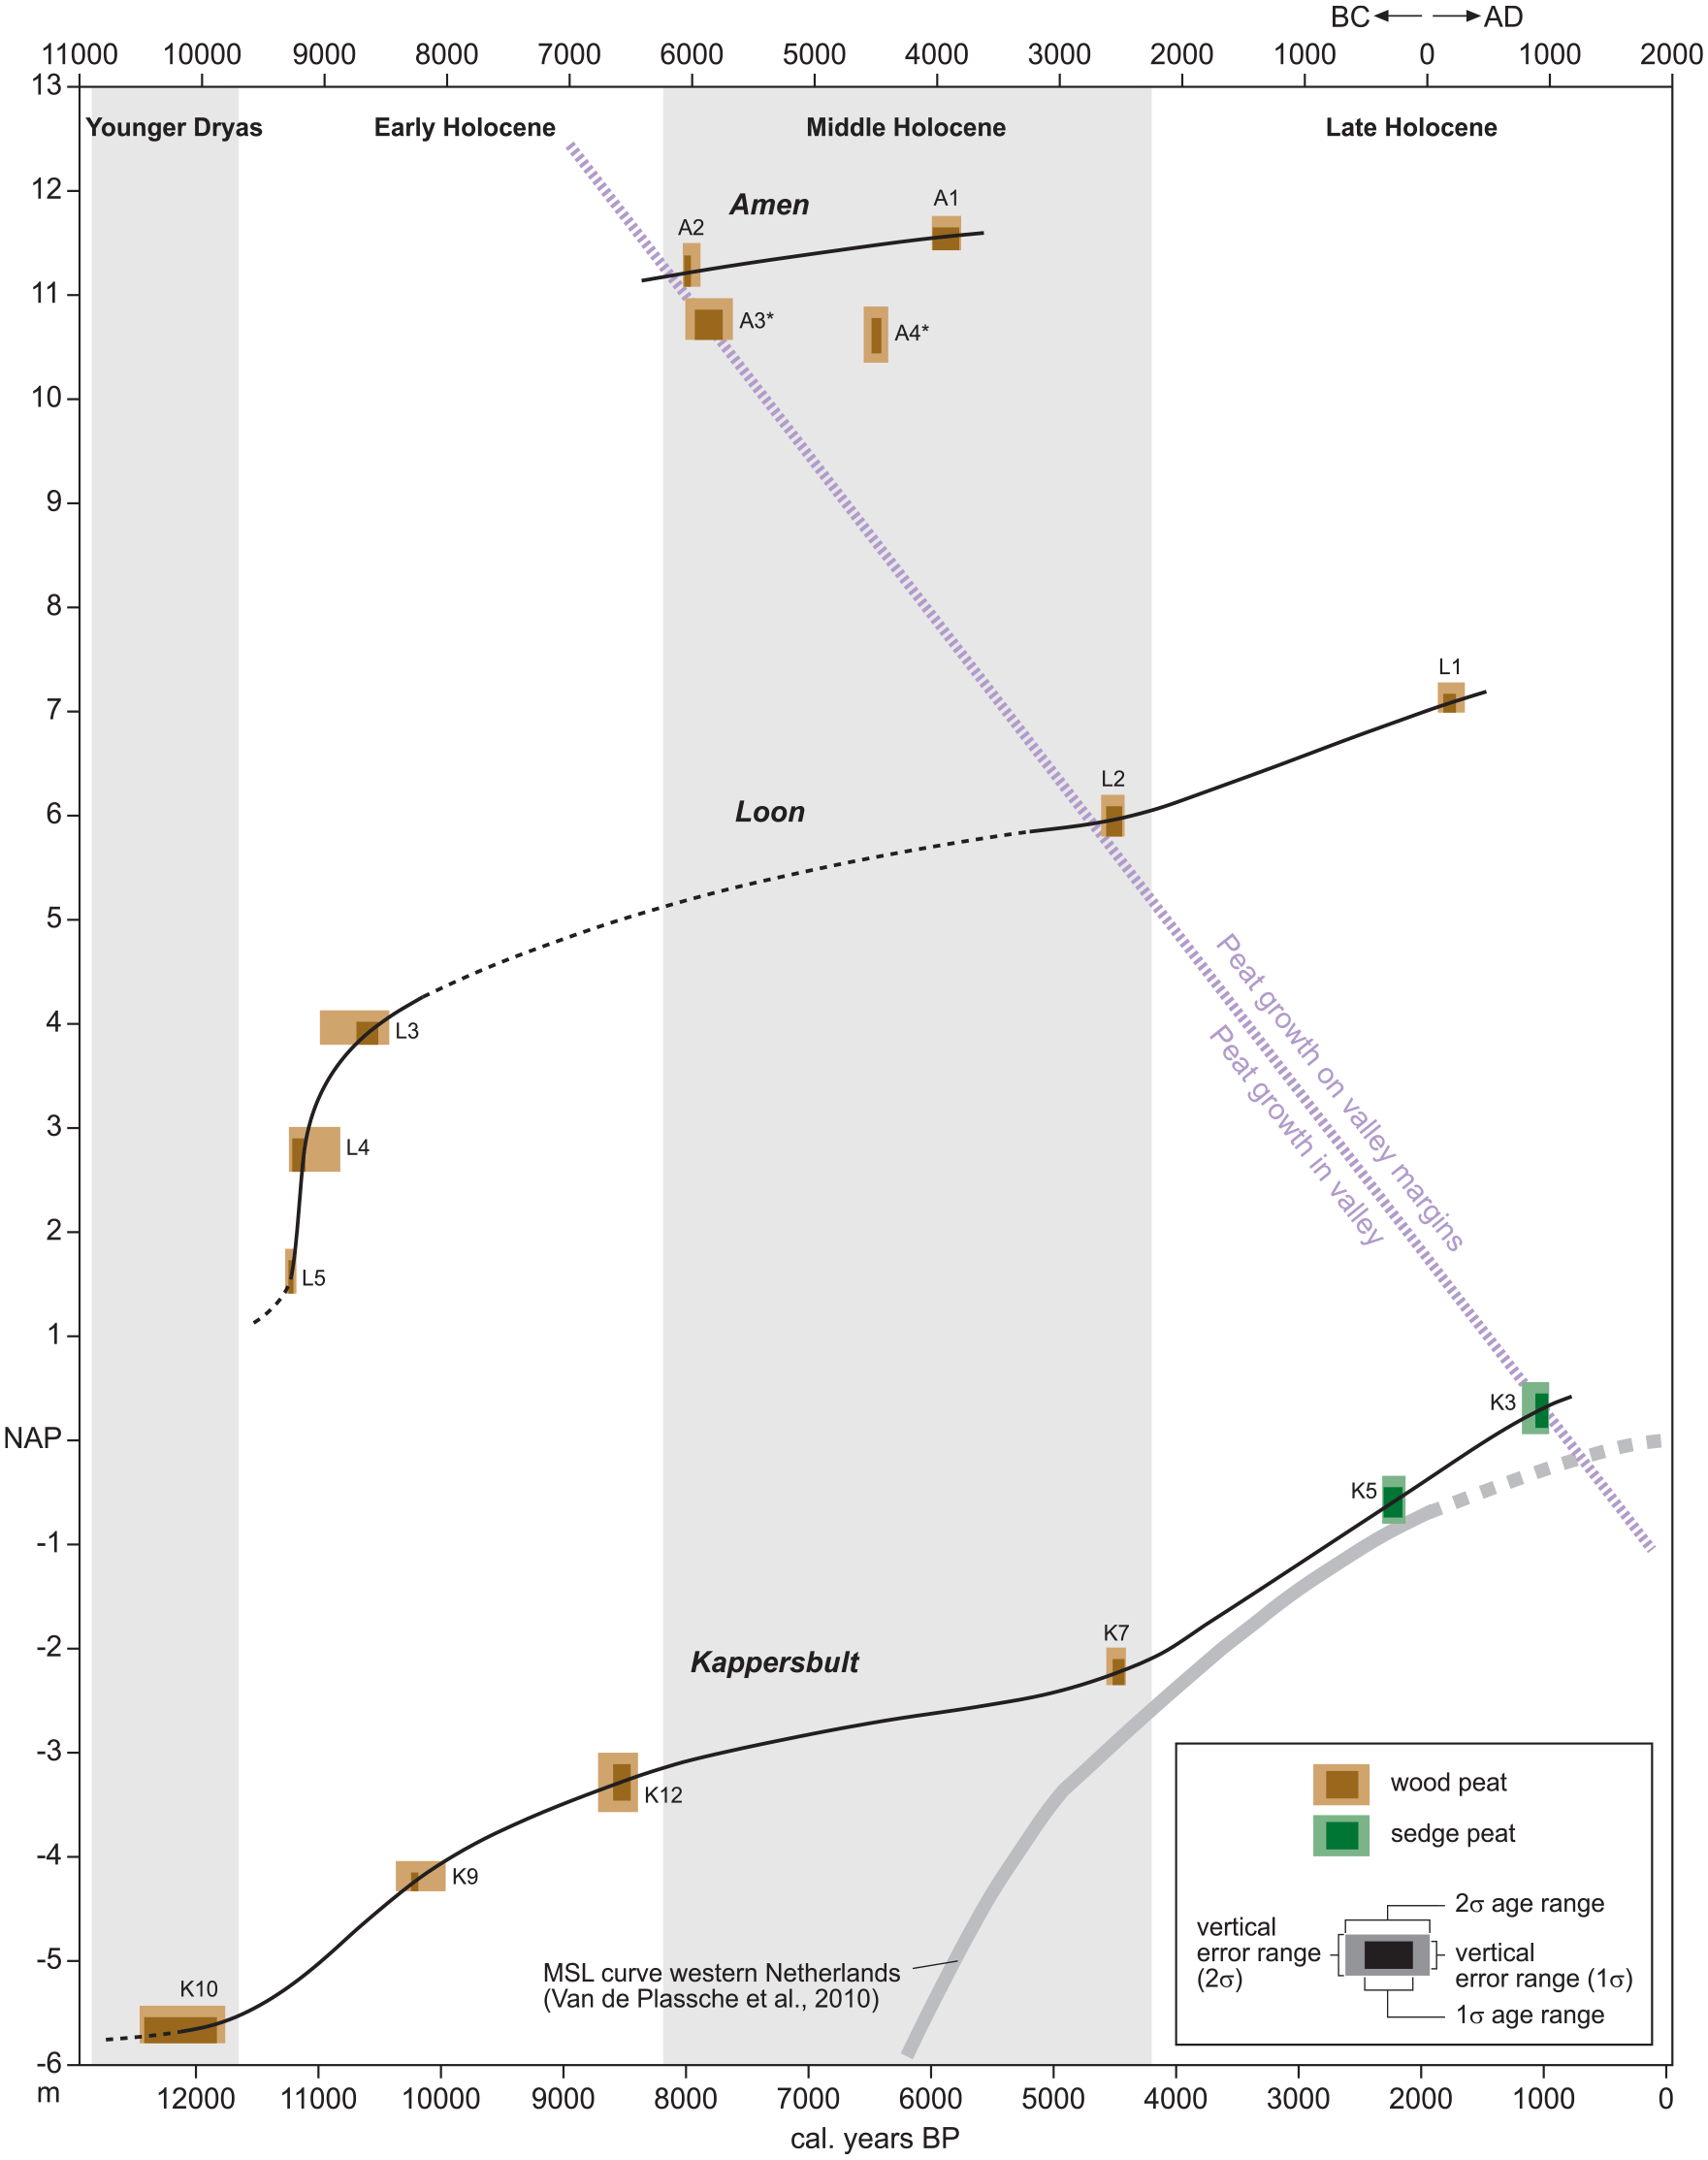
Diagram showing the time-depth data points from the Amen, Loon and Kappersbult cross-sections. The data points represent radiocarbon dated samples and are plotted as boxes of which the width and thickness represent errors and uncertainties in age and depth, respectively (see text). Based on the data points trend lines indicating the evolution of the water level and the peat surface have been drawn for each location. Dashed lines indicate poorly constrained curve segments. Data points A3 and A4 were not used for the Amen trend line (and therefore indicated by *), because the radiocarbon ages of A3 and A4 were rejected (see text). The mean sea-level curve for the western Netherlands (Van de Plassche et al., 2010) is also shown. The subdivision of the Holocene is according to Walker et al. (2019).
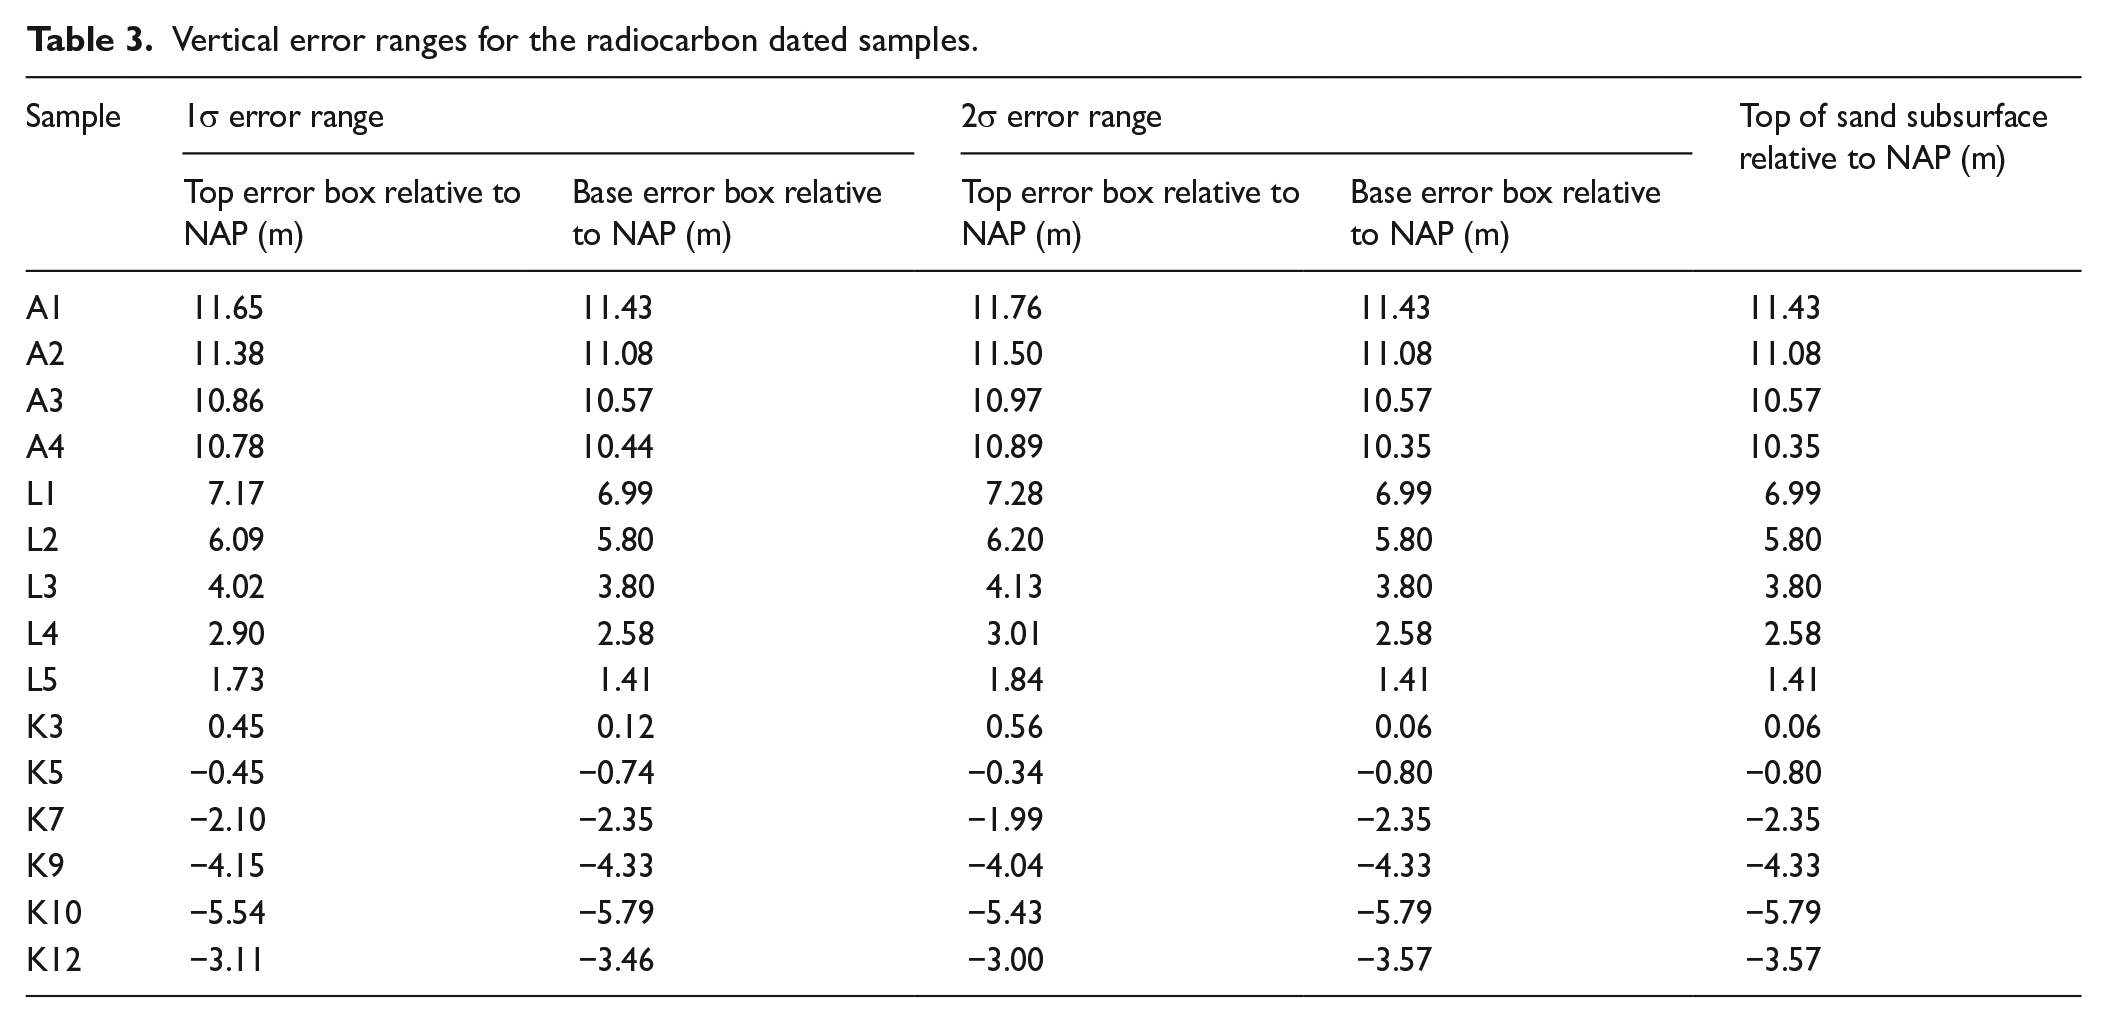
The width of the error boxes depicts the uncertainty in age, which is represented by the 1σ and 2σ age ranges of the calibrated 14C date. The thickness of the boxes includes the following five categories of errors and uncertainties. (1) Errors related to measuring the surface elevation of the borehole location relative to NAP. Because all borehole locations were levelled to benchmarks that are vertically accurate to 0.1 cm, the error in surface elevations is estimated to be ⩽1 cm. This levelling error estimate was confirmed by our closed levelling surveys (from the benchmark to the boreholes and back to the benchmark). (2) Errors related to measuring the sample depth in the core. This error is estimated at ⩽2 cm. (3) Errors related to compaction. Compaction depends mainly on overburden and the type of peat. Even though all samples were collected at or only slightly above the compaction-free Pleistocene sand surface, some compaction needs to be taken into account. Following Berendsen et al. (2007) and Van de Plassche et al. (2010), we applied a minimum correction factor of 2.5 (for the base of the dated sample) and a maximum correction factor of 3.5 (for the top of the dated sample). For instance, a 2-cm-thick sample (material from two slices), taken at 3 cm above the Pleistocene sand surface, is ‘decompacted’ to 7.5–17.5 cm above the Pleistocene surface. (4) Uncertainties related to estimating the compaction correction. Because the compaction correction factors are averages from a wider range of possible correction factors, we added an uncertainty margin for compaction of ±10 cm. (5) Uncertainties related to estimating how much the dated sample was formed above or below the local average water level. We used a vertical uncertainty of ±20 cm for wood peat, that is, we assumed that wood peat was formed within this range relative to the local average water level. For sedge peat (our samples K3 and K5) we assumed formation in an average water depth of 10 cm and additionally applied the same vertical uncertainty of ±20 cm as for wood peat. The estimates of above-mentioned error and uncertainty categories 1, 2, 4 and 5 were considered estimates of 2σ error ranges, which were used to calculate (root extracted from sum of squares) total vertical standard deviations for each sample. The compaction corrections of category 3 were not used in this calculation, because they are exclusively upward directed. Thus, the size and position of the error boxes in the age-depth graph is determined by the 1σ and 2σ ranges in age and depth, and the compaction correction, with the top of the Pleistocene sand surface taken as the lower limit of the vertical error range. In Table 3 the vertical error ranges are given for all samples.
Vertical error ranges for the radiocarbon dated samples.
For each location, water-level curves have been drawn through the error boxes (Figure 5). Based on these curves and the known valley distance between the study locations, longitudinal water-level gradient lines for various points in time have been constructed for the Drentsche Aa valley system (Figure 6).
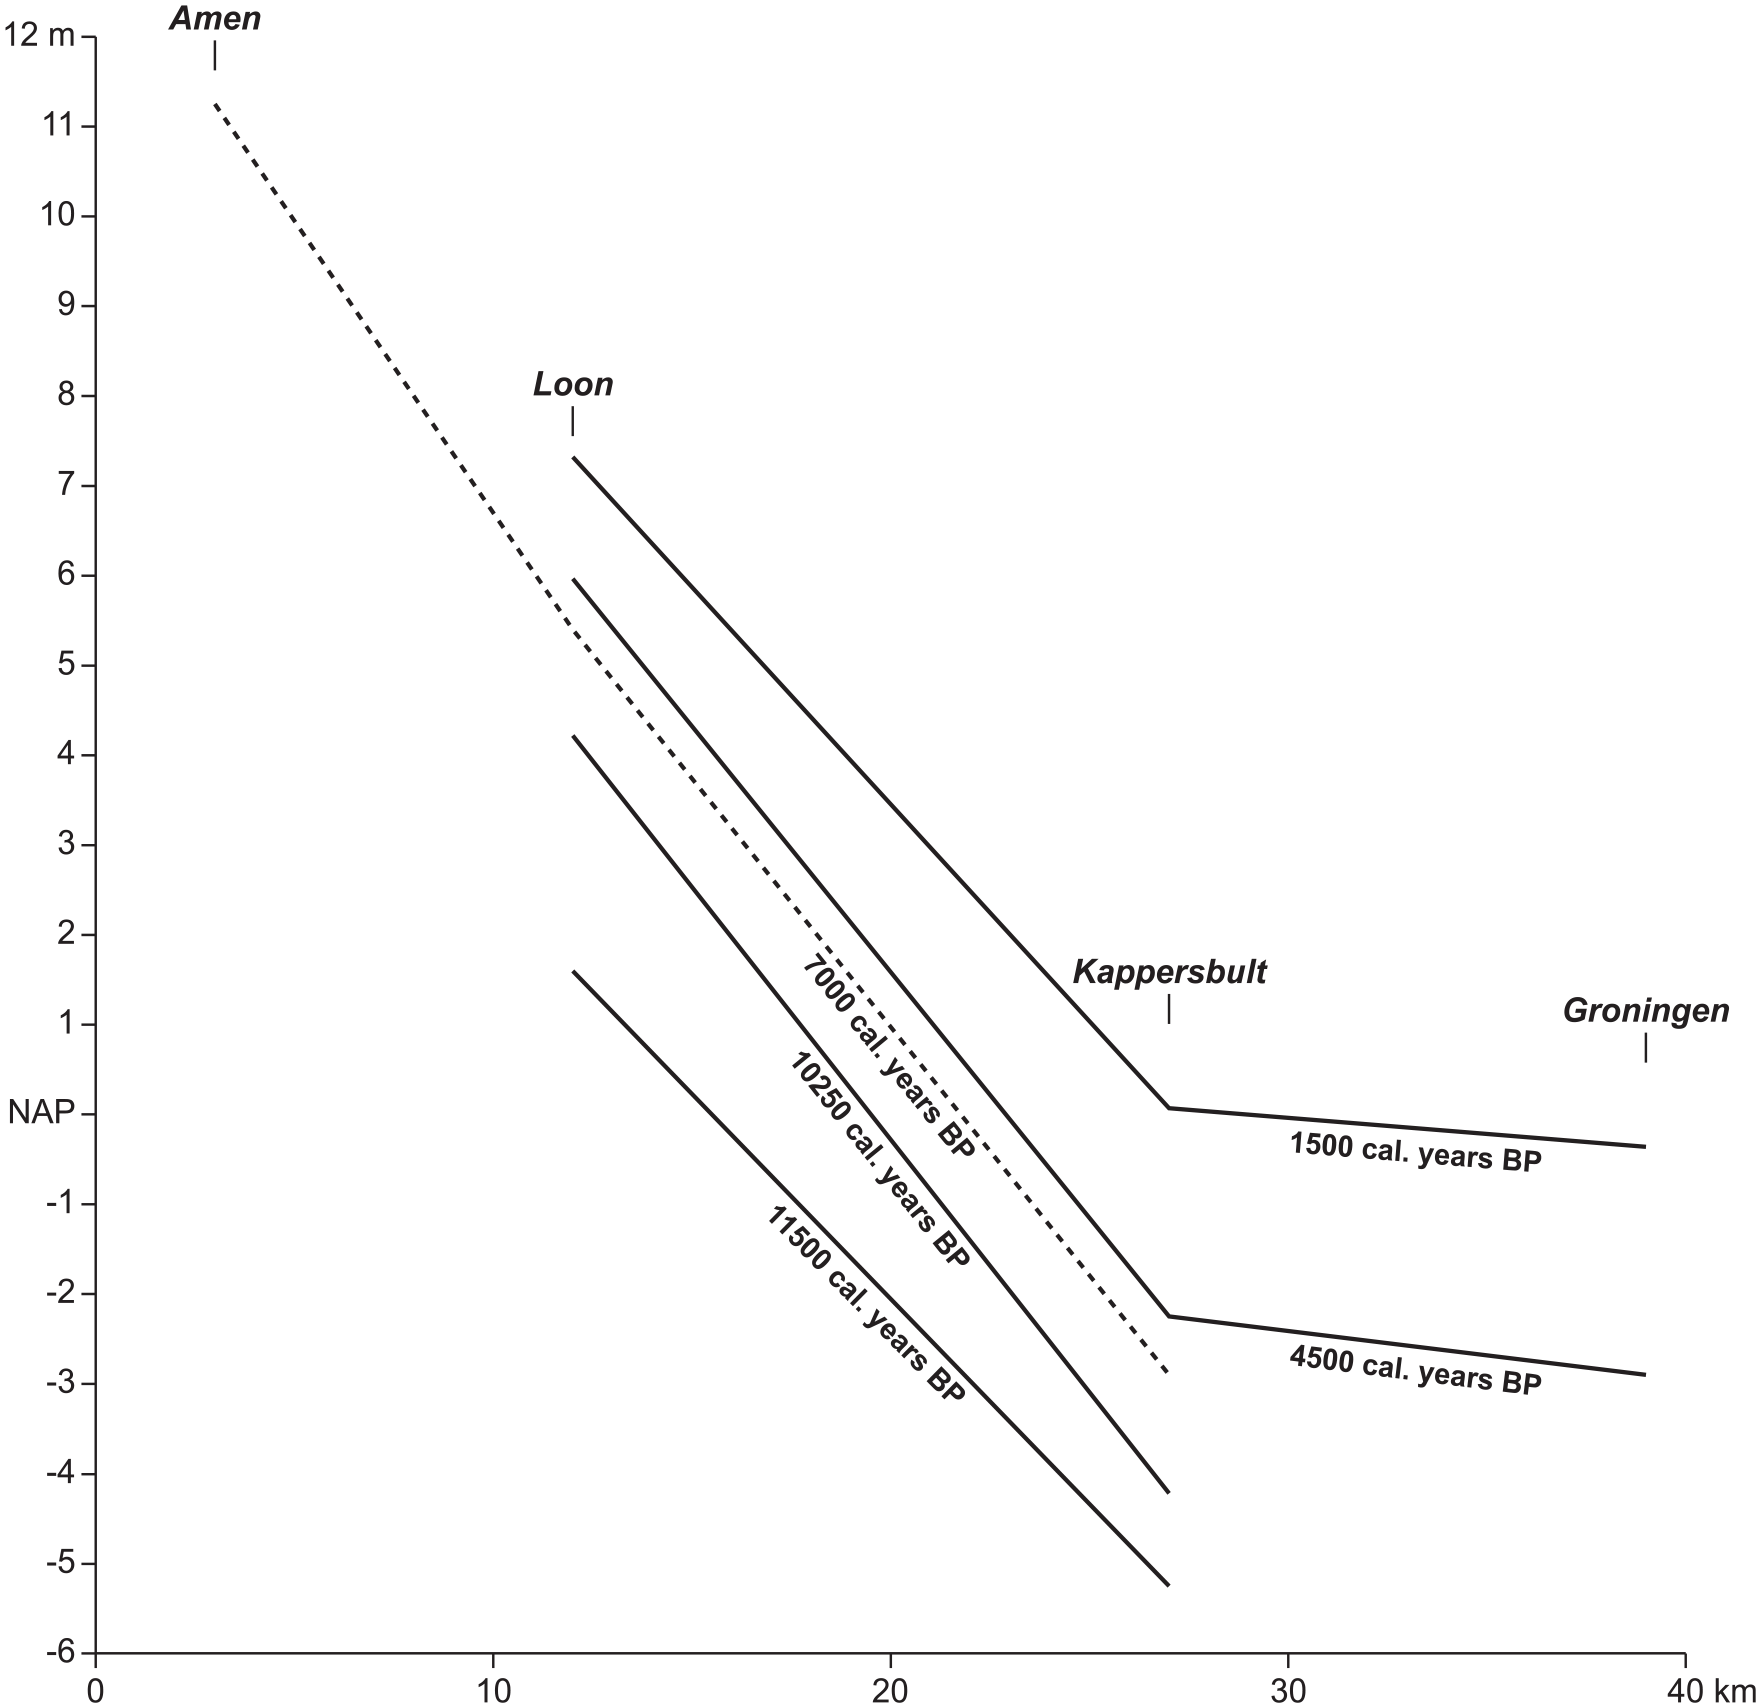
Valley gradient lines for the Drentsche Aa system between Amen and Groningen for different points of time in the Holocene. Gradient lines based on (vertical difference between) the Amen, Loon and Kapperbult curves and the mean sea-level curve in Figure 5. The 7000 cal. years BP gradient line (dashed) is less certain due to the poorly constrained Loon curve for this period. Water levels at Groningen are assumed to have been equal to mean sea level according to Van de Plassche et al. (2010).
Results
Amen cross-section
In the Amen cross-section (Figure 2) an aeolian cover sand ridge (boreholes 6 and 7) bounds the peaty Drentsche Aa valley-fill to the west. In the subsurface fluvioperiglacial deposits occur. These are strongly bedded, poorly sorted, slightly gravelly sands that contrast with the well-sorted, medium-textured overlying cover sand. On the western valley margin an up to 1 m thick peat bed covers a bedded package of loam and rather fine sand (boreholes 3–5), which is interpreted as aeolian (cover sand) deposits. The thickest part of the peat valley-fill (boreholes 1 and 2) encases sandy and loamy channel-fill bodies, whereas the valley floor underlying the peat-fill consists of strongly bedded medium sand with many reworked plant remains. The deeper subsurface of the eastern valley margin consists of very uniform fine sand (boreholes 13–15), interpreted to represent Elsterian ice-meltwater deposits. The fine sand is covered by a Saalian loamy glacial till, which is capped by fine, partly loamy, cover sand constituting the eastern valley margin. On top of the cover sand the peat valley-fill wedges out to the east.
The peat valley-fill at Amen consists dominantly of wood peat, with many Alnus remains in the upper half of the fill. In some thin intervals sedge remains were found. The upper 20–50 cm is strongly decomposed, due to artificial drainage of the meadow in the valley. Four samples for 14C dating were collected in the Amen cross-section (A1–A4; Figure 2). The selection of sampling sites was limited on the upper side by the strong decomposition of the topsoil, and on the lower side by the very steep western side of the deepest part of the palaeovalley, where the in situ peat may have been eroded by the stream. The dated samples all consisted of wood and bark remains, in absence of more suitable macro-remains, such as seeds. The samples yielded Middle Holocene ages (Table 1), which are, however, chronostratigraphically inconsistent: the deeper samples A3 and A4 both yielded younger ages than the shallower sample A2. We probably misinterpreted samples A3 and A4 as in situ peat; they are likely to have contained organic material that has been reworked by the nearby former stream. The ages of samples A3 and A4 are therefore rejected. The ages of samples A1 and A2 are chronostratigraphically consistent.
Loon cross-section
In the Loon cross-section (Figure 3), similar to the Amen cross-section, the subsurface of the north-western valley margin (boreholes 23–25) consists of relatively fine and loamy material, which is interpreted as aeolian (cover sand) deposits. A cover sand ridge bounds the valley to the northwest (borehole 27). Poorly sorted, sandy (and slightly gravelly) fluvioperiglacial deposits seem to underlie this ridge (boreholes 25 and 26). At the base of the steep north-western palaeovalley side, a loamy dune can be seen beneath the peat-fill in borehole 21. The deepest part of the palaeovalley is filled with poorly sorted fine to medium sand (boreholes 20 and 28). Similar to the Amen cross-section the peat valley-fill encases sandy and loamy channel-fill bodies. While filling the deepest part of the palaeovalley the peat also covers and wedges out on the north-western valley margin. In the subsurface of the southeast valley side very uniform fine sands occur, which are interpreted as Elsterian ice-meltwater deposits. These are overlain by low, partly loamy, cover sand dunes (boreholes 30–32). An up to 1 m thick peat bed at the surface partly covers these dunes and extends to the southeast (boreholes 31–35). It rests on fine to medium, occasionally loamy, cover sand, with traces of periglacial local fluvial reworking in the subsurface. The rising cover sand surface bounds the valley to the southeast (borehole 35).
Like at Amen, the peat valley-fill at Loon also consists dominantly of wood peat, with Alnus remains most common in the higher levels. Intervals with sedge remains seem to be slightly more abundant at Loon. Although the Loon study location is in a nature conservation area, the upper 20–50 cm of the peat is strongly decomposed due to improved drainage in the surrounding area that is in agricultural use. The lower part of the peat valley-fill (approximately the lower half) has a relatively dark colour and is slightly more decomposed than the upper part. The present concave morphology of the peat surface in the valley probably results from compaction and oxidation in response to regionally lowered groundwater levels. Especially the sloping peat bed on the north-western valley margin is presently strongly degrading. Five samples for 14C dating were collected in the Loon cross-section (L1–L5; Figure 3). The north-western valley side offered the best opportunities for collecting samples covering a large age-depth range, although sampling on the upper slope was limited by strong decomposition of the topsoil. Samples L1 and L2 consisted of woody material, including bark fragments, whereas samples L4 and L5 consisted dominantly of bark fragments. Only for sample L3 various identified seeds could be collected. The samples yielded Early to Late Holocene ages (Table 1), which are chronostratigraphically consistent.
Kappersbult cross-section
The south-western margin of the Drentsche Aa valley in the Kappersbult cross-section (Figure 4) is composed of well-sorted, and commonly loamy, fine sand, which is interpreted as cover sand. A dune (borehole 9) bounds the valley to the southwest. Between the dune and the thick peat valley-fill, a thin (⩽0.6 m thick) peat bed covers the south-western valley margin (boreholes 2003-6, 2003-5 and 1–4). Loamy cover sand was found over the full depth on the steep slope bordering the thick peat valley-fill (boreholes 5–7). At the base of the southwestern valley side a small step in the cover sand surface seems to exist (borehole 8). The 7-m-thick peat valley-fill encases multiple sandy channel-fill bodies, especially against the north-eastern valley margin (boreholes a, 2003-2 and 2003-1). The present Drentsche Aa stream is also located on the north-eastern edge of the valley. The north-eastern palaeovalley side rises steeply and is composed of thick, clayey to sandy Elsterian ice-meltwater deposits, capped by Saalian glacial till. At the surface medium-textured cover sand constitutes the right bank of the Drentsche Aa stream (borehole b).
Approximately the upper 2 m of the peat valley-fill at Kappersbult consists dominantly of sedge peat with subordinate wood remains. The deeper part consists of wood peat with many Alnus remains. The upper 30–50 cm of the peat is slightly clayey. The peat surface at Kappersbult was much wetter than at Amen and Loon, with present groundwater levels commonly at or a few decimetres beneath the surface. As a result, the upper peat bed is not strongly decomposed. Very limited peat decomposition and compaction at this location is also indicated by the nearly level surface. Dark-coloured, slightly more decomposed intervals occur in the deepest part of the peat valley-fill, roughly in the lower third. Similar to at Amen and Loon the steep south-western palaeovalley side offered the best sampling opportunities; in situ peat on the north-eastern palaeovalley side seemed to have been eroded by the present Drentsche Aa channel and precursors. Six samples for 14C dating were collected in the Kappersbult cross-section (K3, K5, K7, K9, K10 and K12; Figure 4). Samples K3, K7 and K10 consisted of selected terrestrial botanical macro-remains, including Carex, Juncus and Betula seeds. Sample K5 consisted of wood, whereas samples K9 and K12 consisted of Phragmites epidermis fragments. The samples yielded Late Weichselian to Late Holocene ages (Table 1), which are chronostratigraphically consistent.
Comparison of cross-sections and water-level curves
In the three cross-sections the Drentsche Aa valley system consists of a relatively narrow and deeply incised (peat-filled) central part with steep sides, and relatively wide, flat to gently sloping, valley margins (only on the southwest side in the Kappersbult cross-section; Figure 4) with thin peat cover. The width and depth of the deep central part of the valley increase downstream. In all cross-sections cover sand borders the valley on the west and seems to compose the steep western side of its deep central part. This suggests that cover sand was blown into, and thus narrowed, the pre-existing deeply incised valley. Westerly winds are generally considered to have dominated during cover sand deposition (Koster, 2005).
In all cross-sections sandy to loamy channel-fill bodies were found at multiple levels in the peat. Being outside the scope of this study they have not been imaged in detail, which would have required closely spaced boreholes in the central part of the valley. A study by Candel et al. (2017) focussed on these channel-fill bodies and the channel pattern evolution of the Drentsche Aa stream, partly in the three cross-sections of this study, using additional borehole data.
The curves in Figure 5 suggest significant variations in peat growth rates in time and between locations. The curves for Kappersbult and Loon, both show a relatively steep segment for the first part of the Early Holocene, and a more gentle segment for the later Early Holocene to Middle Holocene. Although both relatively high, peat growth rates at Loon and Kappersbult in the first part of the Early Holocene were different: ~3.75 and ~0.75 mm/year, respectively. Peat growth may have started somewhat earlier at Kappersbult (in the Younger Dryas) than at Loon (in the beginning of the Early Holocene), but this difference may also be attributed to the fact that the lowest sample at Kappersbult was taken closer to the base of the peat valley-fill than the lowest sample at Loon. The Middle Holocene curve segment for Amen indicates a relatively slow peat growth rate of ~0.15 mm/year, which is of the same order as the rates at Loon and Kappersbult for the same period, ~0.35 and ~0.25 mm/year, respectively, the rate at Loon being poorly constrained. The Kappersbult curve shows marked increase in peat growth rate (to ~0.80 mm/year) to have occurred by the end of the Middle Holocene. At Loon a slight increase to ~0.4 mm/year may have occurred in the same period. Based on historical accounts, peat growth is assumed to have stopped at all locations after the Middle Ages (Kuijer, 1991) because of reclamation of the valley floor for use as meadows.
The radiocarbon data can also be used to assess the time of beginning peat growth on the valley margins, outside the deeply incised part of the valley. The data indicate that in the upstream part of the valley system, at Amen, peat growth on the valley margins already started in the early Middle Holocene. At Loon peat growth on the margins begun in the late Middle Holocene, whereas at Kappersbult only in the second half of the Late Holocene peat cover on the valley margin started to form. In Figure 5 the moments of beginning peat growth on the valley margins at the three study locations can be connected by a straight line.
Figure 6 shows the development of water-surface gradient lines along the valley system through time. The valley gradient in the upper part of the system, between Amen and Loon, was ~66 cm/km during the first half of the Middle Holocene (~7000 cal. years BP). The valley gradient line at that time was probably slightly concave, with an average gradient of ~55 cm/km in the lower part of the system between Loon and Kappersbult. Some uncertainty, however, remains because of the poorly constrained Loon curve for this period. Because peat growth at Loon in the first part of the Early Holocene was much more rapid than at Kappersbult (Figure 5), valley gradients in the lower part of the system increased during that period (11,500–10,250 cal. years BP) from ~45 to ~55 cm/km. During the later Early Holocene and the major part of the Middle Holocene (10,250–4500 cal. years BP) the gradient in the lower part of the system (between Loon and Kappersbult) presumably remained more or less constant. During the late Middle Holocene and the Late Holocene (after ~4500 cal. years BP), the gradient in the lower part of the valley system gradually decreased to ~48 cm/km, because peat growth at Kappersbult was more rapid than at Loon. Very low gradients on the order of 2–5 cm/km must have been present downstream of Kappersbult in the late Middle Holocene and Late Holocene periods (supposing water levels at Groningen to have been at mean sea level). A wide back-barrier tidal basin, dominated by salt to brackish conditions, existed northwest of the city of Groningen during the late Middle and Late Holocene (Roeleveld, 1974; Vos and Knol, 2015). In this basin average water levels were virtually at mean sea level.
Discussion
Valley formation and onset of peat formation
Strong incision of streams like the Drentsche Aa is believed to have occurred in the beginning of the Middle Weichselian (De Gans, 1981; De Mulder et al., 2003), when climatic conditions changed from temperate interstadial to periglacial stadial. Erosive potential of streams was high at this transition because of a relatively low sea level and large snow-meltwater peak discharges, whereas sediment supply was limited because of a deteriorating, but still largely intact, vegetation cover (Vandenberghe, 1995). Later on in the Middle Weichselian, upon increasing sediment supply, fluvio-periglacial deposition occurred in the stream valleys. Our cross-sections suggest that, along with fluvial aggradation of the valley floor, the valleys were probably narrowed in this period by cover sand deposition on the western valley side. It may be that decreasing peak discharges and sediment supply at the start of the Late Weichselian (Bølling-Allerød interstadial) subsequently caused a period of relative stability of the valley floor. It is doubtful whether renewed incision has occurred in the Drentsche Aa system at the stadial-interstadial transition, which is documented for example for the Meuse in the southern Netherlands (Huisink, 1997; Tebbens et al., 1999), because of the limited discharges in the much smaller Drentsche Aa system. De Gans (1983) inferred a Younger Dryas incision phase of the Drentsche Aa and start of peat formation in the mid-Early Holocene (~10,000 cal. years BP; early Boreal period in De Gans (1983)) in the middle part of the valley system, which are both not confirmed in this study. The Younger Dryas age of sample K10 indicates peat formation on the valley floor instead of incision. It may be that slow peat formation started already before the Younger Dryas stadial in the preceding Bølling-Allerød interstadial. At Loon the very base of the peat valley-fill could not be dated, but ~1 m of peat below sample L5, which dates from the very beginning of the Holocene, suggests that also here peat formation started in the Late Weichselian. Also at Amen it proved impossible to obtain a suitable sample from the base of the peat valley-fill. The age of beginning peat formation here remains unclear, but, given almost 2 m of peat below sample A2, certainly cannot be excluded to be Late Weichselian.
Based on an interpretation of pollen diagrams De Gans (1983) supposed a phase of fluvial erosion at ~9000 cal. years BP (transition Boreal to Atlantic period in De Gans (1983)). Our radiocarbon data do not indicate such an event, and show decreasing rates of peat growth for the late Early Holocene. An erosion phase would also have been evident from a strongly decomposed peat level in the lower part of the peat valley-fills, which was not found in this study.
The species of which remains are dominant in the peat valley-fill (Alnus and Carex) indicate eutrophic to mesotrophic conditions of peat formation, and exclude oligotrophic conditions. Therefore, the peat is interpreted to have formed under influence of stream inundation of the valley floor and seepage of groundwater along the valley margins. Both stream water and groundwater will have been enriched with nutrients from loamy tills and fluvioglacial deposits in the catchment.
Early to Middle Holocene controls on peat formation
Figures 5 and 6 show that from the start of the Holocene until the Middle Holocene water-level rise and valley peat growth was more rapid upstream than downstream leading to steepening of the valley gradient line. This strongly suggests upstream control of valley peat growth through changes in the catchment hydrology. In this time frame we consider significant human influence on catchment hydrology very unlikely and rather interpret this pattern in Figure 6 to be a result of an interplay between climatic change and subsurface composition factors, as will be explained below.
Despite the uncertainties, the curves for Loon and Kappersbult unambiguously indicate strong Early Holocene water-level rise, which can be interpreted as a result of an increase of annual precipitation in western Europe at the onset of the Holocene (e.g. Dansgaard et al., 1989; Magny et al., 2001). The second part of the Younger Dryas in the Netherlands is interpreted to have been relatively dry (Isarin et al., 1998), resulting in aeolian activity (Vandenberghe et al., 2013) and low groundwater levels (Bohnke et al., 1993). Nevertheless, the bottom of the Drentsche Aa valley at Kappersbult apparently was wet enough for peat formation during this period, as testified by the age of sample K10. The macro-remains in this sample suggest a local Betula-Carex vegetation. The stronger Early Holocene water-level rise at Loon, relative to Kappersbult, may result from differences in subsurface composition. In the southern part of the catchment directly upstream of Loon large areas with poorly permeable glacial tills occur (e.g. at Amen; Figure 2), leading to relatively direct response of valley water levels to increased precipitation. In the northern part of the catchment, between Loon and Kappersbult, these glacial tills are largely absent leading to more infiltration and groundwater storage, weakening valley water-level rise. We cannot exclude, however, the possibility that between Loon and Kappersbult drainage in the valley was hampered in this period (e.g. because of local valley narrowing by Late-Weichselian aeolian deposits), which could also account for more rapid valley peat formation upstream.
The Kappersbult curve indicates a (gradually) decreasing rate of water-level rise in the later Early Holocene and the first part of the Middle Holocene. For the latter period, relatively slow water-level rise is confirmed by the Amen curve. After the strong increase at the beginning of the Early Holocene, the annual precipitation did not increase further during the later Early Holocene and the first part of the Middle Holocene, but remained relatively stable with fluctuations (Magny et al., 2001). The water-level rise in the Drentsche Aa valley during these periods can be interpreted as a result of changes in regional vegetation composition affecting the evapotranspiration. After dominance of pine forests in the beginning of the Early Holocene, a succession to deciduous forests took place during the Early Holocene. Because the evapotranspiration of a pine forest (700 mm/year) is much greater than of a deciduous forest (400 mm/year), the regional moisture balance changed dramatically (Stouthamer et al., 2015: 235–237; Zagwijn, 1986: 10), which explains the continuous, relatively slow, rise of water levels in the Drentsche Aa valley during the later Early Holocene and early Middle Holocene. The influence of the regional vegetation on the groundwater dynamics could also explain that the Early Holocene peat in the deepest part of the valley-fills at Kappersbult and Loon is more strongly decomposed than the younger overlying peat. This could indicate relatively strong seasonal groundwater-level variations because of high summer evapotranspiration of the Early Holocene pine forests. Fresh peat with abundant Alnus wood remains dominates the Middle Holocene levels of the valley-fill.
Middle to Late Holocene controls on peat formation
Figures 5 and 6 show that from the Middle Holocene until the middle Late Holocene (4500–1500 cal. years BP) valley peat growth was more rapid downstream than upstream leading to a more gentle valley gradient line. This strongly suggests downstream control of valley peat growth. An important factor in downstream control of near-coastal river systems, such as the Drentsche Aa, is Holocene relative sea-level rise. However, also possible human influences need to be considered for this more recent period.
Prehistoric habitation in the Drentsche Aa catchment was restricted to the higher ground-moraine ridges, the remainder of the landscape being too wet for settlement and agriculture (e.g. Van Beek et al., 2019). As a result, population densities were probably rather low, and were estimated to have been between 2.5 and 5 persons/km2 for the late Iron Age and middle Roman Period (Van Beek et al., 2019: 1218). Around the settlements agricultural fields existed, but in large areas peat formation dominated the relatively flat landscape. Our valley cross-sections (Figures 2–4) show no signs of increased sediment influx into the valley floodplain related to prehistoric or historic human activities leading to increased soil erosion, that is, there is no systematic increase in clastic content in the upper levels of the peat valley fill. This is probably because of the limited extent and scattered nature of the agricultural fields and low terrain slopes in the landscape. In some places prehistoric wooden trackways may have existed in the valleys (Van Beek et al., 2019: 1218), but it is unlikely that these would have significantly influenced the hydrology of the system. All in all, human influence on the hydrology of the system before reclamation of the valley peatlands in about the 16th century AD (Kuijer, 1991: 23) was probably very limited, and cannot explain the downstream control of valley peat growth on a timescale of millennia as suggested by the valley gradient lines in Figure 6.
The Kappersbult curve shows an increase in the rate of water-level rise at ~4500 cal. years BP (around box K7; Figure 5). Boxes K5 and K3 indicate water-level rise of ~0.80 mm/year during the Late Holocene. The trend in water-level rise at Kappersbult after ~4500 cal. years BP crudely follows the trend of the mean sea-level curve for the western Netherlands (Van de Plassche et al., 2010), albeit at a 0.3–0.7 m higher level (Figure 5), which suggests influence of relative sea-level rise on water-level evolution in the lower part of the valley system, but also influence of other factors such as the river-gradient effect and variable tidal effects (e.g. related to the floodbasin effect), which could account for the high position of the Kappersbult curve relative to the mean sea-level curve.
The validity of the sea-level curve for the western Netherlands for the coastal area of the northern Netherlands has been questioned because of possible differential land-level movements (Kiden et al., 2002; Vink et al., 2007). If the northern Netherlands has lowered relative to the western Netherlands (because of Holocene glacio-isostatic compensation), the sea-level curve for the northern Netherlands should run below the curve for the western Netherlands. However, Meijles et al. (2018) reconstructed relative mean sea-level rise for the northern Netherlands coastal plain based on 26 selected radiocarbon dates from the Wadden Sea area, and concluded that their northern Netherlands curve is statistically indistinguishable from the western Netherlands curve for the period after 6400 cal. years BP. For the period 2500–1000 cal. years BP Meijles et al. (2018: 918) suspect that their curve, running above the western Netherlands curve for that time interval, is somewhat too high because the dated freshwater peat may have formed above sea-level on the Frisian barrier islands. Awaiting more clarity about the sea-level history of the northern Netherlands, we will use the western Netherlands curve (Van de Plassche et al., 2010) for comparison.
Like at Kappersbult, also at Loon a late Middle Holocene increase in water-level rise is suggested by the curve in Figure 5, although the timing of the increase is poorly constrained and its magnitude is much smaller than at Kappersbult. We believe that water-level rise at Loon may have been affected by relative sea-level rise. Holocene relative sea-level rise is documented to have influenced groundwater-level evolution far (>100 km) upstream in the Rhine-Meuse delta (e.g. Cohen, 2005; Van Dijk et al., 1991), through hydraulic and morphological backwater effects. Upon a rise in sea level, the vertical difference between a new and old river gradient line will gradually decrease upstream until becoming insignificant. This is known as the river-gradient effect (Louwe Kooijmans, 1974; Van de Plassche, 1982). As a result, upstream water-level curves, such as the Loon curve, will be much less affected by sea-level rise than downstream water-level curves, such as the Kappersbult curve. Figure 6 shows that this longitudinal difference in response to relative sea-level rise results in a decreasing gradient in the lower part of Drentsche Aa valley system (downstream of Loon) during the Late Holocene. We consider it unlikely that relative sea-level rise has influenced water-level evolution as far upstream as Amen. Although shallow peat oxidation and compaction has significantly lowered the valley-fill surface at Amen, we found no indications of former peat formation, that is, peat remains in the topsoil on the valley sides, higher than 1 m above the sampling level of A1. One metre of peat formation since ~6000 cal. years BP would mean that the slow Middle Holocene peat-growth rate of ~0.15 mm/year calculated for Amen more or less has continued until recently.
The vertical difference of 0.3–0.7 m between the Kappersbult curve and the mean sea-level curve for the western Netherlands (Van de Plassche et al., 2010) suggests a low gradient for the lower part of the Drentsche Aa valley downstream of Kappersbult. Assuming that water-levels in the coastal plain north of the city of Groningen were virtually at mean sea level, a gradient of 2–5 cm/km for the part of the valley between Kappersbult and Groningen (~12 km distance) can be calculated.
Evaluating the exact positions of boxes K3, K5 and K7, it seems that they indicate convergence of the water level at Kappersbult with mean sea level forward in time (segment K7–K5), followed by divergence (segment K5–K3). The converging segment of the curve can be interpreted as a result of the river gradient effect (Kiden et al., 2008, their fig. 8; Van de Plassche, 1982, fig. 33): the vertical difference between mean sea level and Kappersbult water level decreases forward in time just as the vertical difference between Loon water level and Kappersbult water level decreases forward in time. The diverging youngest curve segment at Kappersbult, however, seems to conflict with this interpretation. An explanation for the relatively high position of box K3 could be increased tidal influence. It is generally accepted that in a tide-influenced area peat forms at local mean high water level rather than at mean sea level (Kiden et al., 2002, 2008; Van de Plassche, 1982). A Late Holocene marine clay cover was mapped in the Drentsche Aa valley only 4 km north of Kappersbult (Stiboka, 1973). Palaeogeographic maps show this clay cover in the lower Drentsche Aa valley to be related to the Lauwerszee ingression northwest of Groningen in the Early Middle Ages (Vos and Knol, 2015; Vos et al., 2020). Widening of the tidal inlets probably led to further inland penetration of the tidal wave in the period between K5 (~300 BC) and K3 (~900 AD). The present tidal range at the coastline is 227 cm (Rijkswaterstaat, 2013) and before damming of the Reitdiep tidal channel in 1877 some tidal motion existed as far inland as the city of Groningen (Stiboka, 1973: 52). A few decimetres of tidal amplitude at Kappersbult, in addition to the river gradient, could easily explain the relatively high position of K3.
In order to further investigate the relation between boxes K3, K5 and K7 and former sea level we applied the HolSea protocol (Khan et al., 2019), which involves a standard procedure to transform our basal peat time-depth data into sea-level index points (SLIPs). For our data points K3, K5 and K7 we completed the steps of the HolSea protocol (Supplemental Material), guided by recent earlier work in the region (Bungenstock et al., 2021; Hijma and Cohen, 2019). This led to: (1) a new calculation of error margins and (2) a significant downward shift of the error boxes in the time-depth diagram. Because the HolSea protocol includes almost the same sources of error, the new error margins hardly differ from the ones previously calculated in this study. However, the protocol additionally takes into account the coastal tidal range and, in the situation of peat formation in a back-barrier tidal area well connected to the sea, includes a downward correction of the error boxes from mean high water level to mean sea level. This correction is based on the assumptions that peat forms at local mean high water and that the full tidal range existed in the intracoastal tidal area (no tidal damping). In Figure 7 the new Kappersbult sea-level index points (SLIP K3, SLIP K5 and SLIP K7) are plotted together with the original Kappersbult error boxes (K3, K5 and K7), our Kappersbult curve, the mean sea-level curve (Van de Plassche et al., 2010) and a 2σ error envelope around that curve calculated by Hijma and Cohen (2019) based on the original data. SLIP K7 largely plots within the error envelope and could be taken to confirm the mean sea-level curve. SLIP K5 and SLIP K3 plot ~0.7 and ~0.4 m below the mean sea-level curve, respectively. It must be noted that the post-3000 cal. years BP part of the mean sea-level curve is poorly constrained and largely based on interpolation between the well-constrained part and present sea level. Therefore the error envelope of Hijma and Cohen (2019) does not cover this part of the curve.
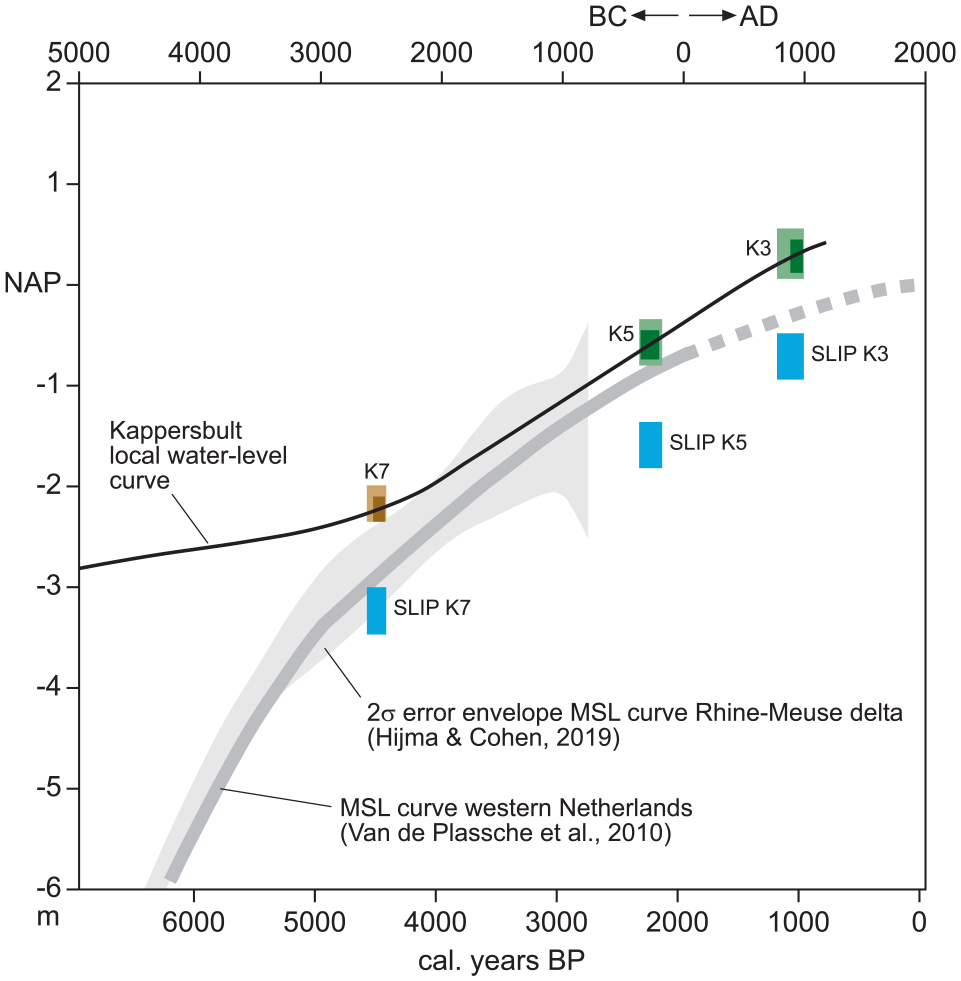
Time-depth diagram showing the Kappersbult error boxes K3, K5 and K7 (same as in Figure 5) and sea-level index points (SLIPs; in blue) derived from the Kappersbult data by applying the HolSea protocol. The mean sea-level curve of Van de Plassche et al. (2010) is shown with its 2σ error envelope calculated by Hijma and Cohen (2019). The Kappersbult curve from Figure 5 is also shown.
The low position of the Kappersbult SLIPs could indicate that the mean sea-level curve of Van de Plassche et al. (2010), to be valid for the northern Netherlands, needs a downward correction. This interpretation would imply no intracoastal tidal damping (zero floodbasin effect) since ~4500 cal. years BP. It should be noted that due to a river gradient of the Drentsche Aa, the Kappersbult SLIPs may still be positioned somewhat above local mean high water level. As such the Kappersbult data are upper limiting SLIPs. An alternative interpretation assumes some degree of intracoastal tidal damping, at least in the far back-barrier area, which would cause an upward shift of the Kappersbult SLIPs to a position very near the mean sea-level curve. The original position of the Kappersbult error boxes K3, K5 and K7 (Figures 5 and 7), when interpreted as (upper limiting) SLIPs, then would represent a scenario of initially full tidal damping (boxes K7 and K5), with gradually increasing tidal influence explaining the high position of K3 as described above. More data from the area are needed to resolve the issue of Late Holocene tidal damping in the northern Netherlands coastal plain.
Palaeowater-level curves with a sigmoidal shape (a gently rising older limb, a steeply rising middle part and a gently rising younger limb) have been published for the Rhine-Meuse delta (Cohen, 2005; Cohen et al., 2005; Hijma and Cohen, 2010; Figure 8). The gently rising older limb of these curves reflects the slow rise of floodplain groundwater-levels before strong influence of Holocene relative sea-level rise took off. In the curves for the most seaward locations in the Rhine-Meuse delta a more or less sharp knick-point exists between the lower limb and the steeply rising part that is strongly controlled by relative sea-level rise (Figure 8). In curves for more landward locations the transition between the lower and the middle part appears more gradual (Figure 8). Curves for locations far upstream have only a short and moderately steep middle part with the transition between the lower and middle part later in time (Figure 8). In all curves there is a smooth transition between the middle and upper part reflecting the gradually decreasing rate of relative sea-level rise. The pattern sketched above can be recognized in the Middle to Late Holocene parts of the Loon and Kappersbult curves. It is likely that the Amen curve, if completed for the Middle and Late Holocene periods, would not or hardly show the tripartite composition mentioned (because of very limited peat thickness above sample A1 as argued above), meaning no or very limited influence of Holocene relative sea-level rise on water-level evolution at Amen.
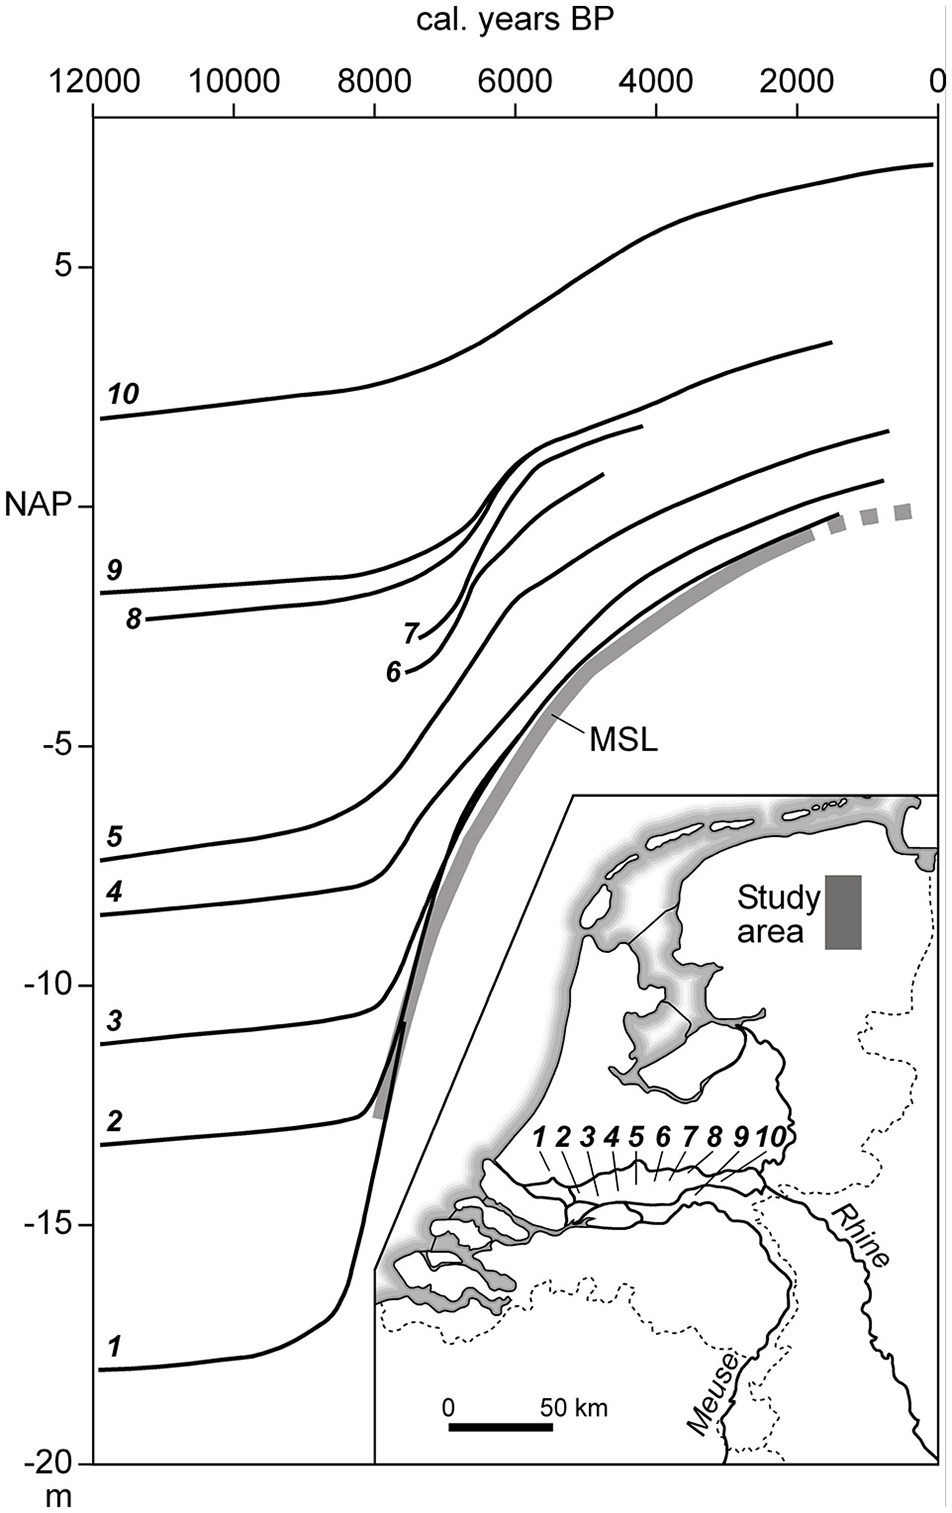
Palaeowater-level curves for various locations in the Rhine-Meuse delta (Cohen, 2005). The curves (1–10) are for different locations in a longitudinal transect, with the lowest curve for a location in the lower delta plain and the highest curve for a location in the upper delta plain (locations 1–10 indicated on map of the Netherlands, lower right; present study area also indicated). Elevation differences between the curves thus reflect the river gradient. The grey curve is the mean sea-level curve for the western Netherlands (Van de Plassche et al., 2010).
The upper limit of the influence of relative sea-level rise on water-level evolution can be estimated to lie near Loon, given the fact that the Loon curve seems only weakly affected at most. This is approximately 27 km (valley distance) from the mouth of the valley system near Groningen. For the Rhine-Meuse delta the data from Cohen (2005) show sea-level influence on local water-level evolution to have occurred much deeper inland (⩾100 km). Because the length of backwater influence is directly proportional to river depth and inversely proportional to river slope (e.g. Fernandes et al., 2016; Paola and Mohrig, 1996), it is obvious that the small and steep Drentsche Aa stream has a more limited backwater length than the large and more gentle Rhine system. Interestingly, backwater effects in the Rhine-Meuse delta seem to have started earlier (9000–7000 cal. years BP) than in the Drentsche Aa valley (5000–4000 cal. years BP). At the same time it must be admitted that the beginning of backwater effects is poorly constrained for the Drentsche Aa, and could have been in the period 6000–5000 cal. years BP, which, however, would still be later that in the Rhine-Meuse delta. The delay in backwater influence for the Drentsche Aa is probably related to the fact that smaller (shallower) and steeper systems, due to a more limited backwater length will be affected by relative sea-level rise later than large systems.
Recent peat degradation and restoration
Our data show considerable degradation of the top of the peat valley-fill at Amen and Loon. Assuming a more or less level peat surface during peat growth, which seems reasonable for eutrophic peat in a valley setting, surface lowering amounts to 2 m in the central part of the valley at Loon, and almost 1 m at Amen. Peat loss results from oxidation and compaction upon drainage of the valley floor for use as meadows and probably has been going on since initial reclamation in about the 16th century AD (Kuijer, 1991: 23). Large-scale reclamation of heather fields on the till plateaus between the various branches of the valley system in the beginning of the 20th century, led to regional lowering of groundwater levels reducing groundwater flow to the valleys. After the 1950s drainage of the valleys was further improved to optimize agricultural use (Kuijer, 1991: 38). In the course of the 20th century also groundwater extraction for drinking water in the catchment affected the hydrological situation in the Drentsche Aa valley system, although recently (since the 1990s) extraction has been reduced or stopped.
Because of all the human hydrological interventions, restoration of the dried out valley peatlands is a complex task, requiring large-scale measures. Nevertheless, restoration efforts are undertaken combining the aims of increasing biodiversity, storing water in the catchment to prevent downstream flooding and reducing CO2 emission (Bakker et al., 2015). Major problems are the quality of the inundation water in the valley, containing agricultural fertilizers, and the presently in many places still nutrient-rich topsoil due to agricultural additions in the past, which both do not optimally support many of the original peat-forming species. Trepel and Kluge (2002) presented an ecohydrological study of restoration options for a comparable degraded valley peatland, suggesting that a limnic stage upon rewetting may be needed before peat growth can start again. Zerbe et al. (2013) showed that rewetting degraded valley peatlands in a comparable setting in north-eastern Germany yielded potentially peat-forming vegetations within 10 years.
Our curves show that, if renewed peat growth can be realized, significant carbon storage needs mechanisms forcing gradual water-level rise for a long period. Water-level rise in the valley can be driven by groundwater seepage to the valley from the flanking plateaus. Nowadays, largely to facilitate agricultural use, water tables in the plateaus have been lowered to such an extent that groundwater seepage to the valleys has stopped or is strongly reduced. Restoring groundwater seepage would thus require large-scale measures in the agricultural areas outside the valley. Our curves suggest that (increased) relative sea-level rise could be another mechanism of water-level rise in the valley, at least in the lower reach of the system. At present, the Drentsche Aa debouches near Groningen into a canal with a fixed water level, regulated by pumping stations. Thus, accelerated sea-level rise, as anticipated in various IPCC scenarios (IPCC, 2021), will only facilitate peat growth in the lower valley if the water level downstream is allowed to rise, which requires different water management in the downstream coastal plain.
Conclusions
The radiocarbon data collected in this study and the presented reconstructions of water-level rise and peat growth rates in the Drentsche Aa valley system lead to the following conclusions.
Peat formation in the Drentsche Aa valley system started earlier than previously supposed. De Gans (1983) based on palynological data inferred that first peat formation on the sandy valley bottom started in the second half of the Early Holocene period in the middle part of the system. Radiocarbon data from this study show that peat formation in the lower part of the system started in, or possibly before, the Younger Dryas. For the middle part of the system the radiocarbon data suggest a pre-Holocene start of peat formation.
Rapid peat growth in the Drentsche Aa valley in the beginning of the Early Holocene is likely to have been caused by strongly increased annual precipitation leading to rapid groundwater-level rise at the onset of the Holocene. Radiocarbon data indicate continuous, relatively slow, peat growth and water-level rise in the later Early Holocene and the first part of the Middle Holocene, probably as a result of decreased evapotranspiration when pine forests where replaced by deciduous forests in a natural vegetation succession.
A significant increase of water-level rise and peat growth rates in the late Middle Holocene in the lower part of the system can be attributed to the downstream influence of Holocene relative sea-level rise, whereas water-level rise and peat growth rates in the Early Holocene and the first part of the Middle Holocene seem to have been controlled by upstream changes in catchment hydrology.
Restoration of the currently degraded valley peatlands would require large-scale hydrological measures outside the valley system.
The hydrological controls on peat formation identified in this study are linked to regional changes and preconditions (subsurface composition), which stresses the importance of understanding the regional context when interpreting local palaeowater-level records.
Supplemental Material
sj-xlsx-1-hol-10.1177_09596836231169985 – Supplemental material for Different hydrological controls causing variable rates of Holocene peat growth in a lowland valley system, north-eastern Netherlands; implications for valley peatland restoration
Supplemental material, sj-xlsx-1-hol-10.1177_09596836231169985 for Different hydrological controls causing variable rates of Holocene peat growth in a lowland valley system, north-eastern Netherlands; implications for valley peatland restoration by Bart Makaske and Gilbert J Maas in The Holocene
Footnotes
Acknowledgements
We thank Dirk van Smeerdijk for carrying out palaeobotanical analyses and Jasper Candel for sharing borehole data. The paper benefitted from the constructive comments of the journal reviewers Jason Kirby and Friederike Bungenstock.
Funding
The author(s) disclosed receipt of the following financial support for the research, authorship, and/or publication of this article: This paper resulted from research carried out for the project ‘Landschapsbiografie van de Drentsche Aa’. Radiocarbon age determinations were funded by this project.
Supplemental material
Supplemental material for this article is available online.
References
Supplementary Material
Please find the following supplemental material available below.
For Open Access articles published under a Creative Commons License, all supplemental material carries the same license as the article it is associated with.
For non-Open Access articles published, all supplemental material carries a non-exclusive license, and permission requests for re-use of supplemental material or any part of supplemental material shall be sent directly to the copyright owner as specified in the copyright notice associated with the article.