
Abstract
Fynbos and afrotemperate forest exist as alternate stable states in the Cape Floristic Region of South Africa. In parts of Table Mountain National Park, afrotemperate forest has expanded in recent decades. The aim of this project was to explore the drivers of this change and distinguish whether this expansion represents a recovery of forest after previous clearance during the 18th century or is a novel expansion of forest range that resulted from policies of fire suppression in the 20th century. To determine the relationships between forest and fynbos and its key drivers, pollen, non-pollen palynomorphs, charcoal, stable isotope ratios (δ13C) and major and trace elements were analysed from late-Holocene sediments extracted from Orange Kloof. Pollen data show that forest cover has fluctuated over the past 3690 years. At the start of the record, under drier conditions from 1670 BCE to ~170 CE, forests contracted, and dry, asteraceous fynbos dominated the landscape. Around ~170 CE there was a shift to ericaceous fynbos as water availability increased. Weak signals of Khoekhoen pastoralists may be visible in the record around 50 CE, indicated by increased spores and charcoal. A regime shift towards increased dominance of the forest occurred ~250 CE, associated with wetter climate. Clear anthropogenic signals are associated with European settlement from 1650 CE. Reinforced by human clearance of forest, fynbos expanded during the cool conditions of the late phase of Little Ice Age (~1750–1850 CE). Forest expansion in the 20th century likely reflects fire suppression and recovery from past forest clearance. Fire needs to be managed accordingly if further expansion of forest into fynbos is to be curbed.
Introduction
The Cape Floristic Region (CFR) is a biodiversity hotspot and home to several diverse vegetation types (Bergh et al., 2014). In the southwestern CFR, afro-temperate forests are embedded within the fynbos biome, which is a megadiverse heathland unique to South Africa (Mucina and Geldenhuys, 2006). Forest and fynbos occur as alternate stable states, maintained by climate-fire-vegetation and soil feedbacks (Cramer et al., 2019). Both of these vegetation types occur under a Mediterranean-type climate (strongly seasonal winter rainfall) and colonise the same nutrient poor quarzitic soils. The primary factors discriminating between forests and fynbos are fire and topography, with forests only developing in topographical and hydrologic situations where fire is limited and plant available moisture is higher (Cramer et al., 2019; Gillson et al., 2020; Lu et al., 2022; Mucina and Geldenhuys, 2006; Slingsby et al., 2020).
The dominance of each stable state may be influenced by precipitation (amount and seasonality) which would in turn affect fire regimes. Precipitation variability is linked to temperate frontal systems associated with the Southern Hemisphere westerlies (Reason et al., 2002) and the blocking of tropical easterly flow and summer rainfall systems by regional high pressure engendered by upwelling along the Atlantic coast (Tyson and Preston-Whyte, 2000). The Mediterranean climate has characterised the region throughout the Quaternary period, and perhaps as early as the late Miocene (Dupont et al., 2011; Tankard and Rogers, 1978). Over centennial to multi-millennial timescales, wetter conditions in the southwestern CFR are likely related to periods of globally cooler climates, which drive an increase in Antarctic sea-ice extent and equatorward shifts of the westerly storm tracks (Chase and Meadows, 2007; Chase et al., 2017; Perren et al., 2020; van Zinderen Bakker, 1976). For example, during cooler conditions of the late-Holocene phases like the Little Ice Age (LIA: 1250–1850 AD; 700–100 cal BP), wetter conditions are inferred for the southwestern CFR, corresponding with the northward migration of the Southern Hemisphere Westerlies (Chase and Meadows, 2007; Perren et al., 2020; Stager et al., 2012; Weldeab et al., 2013). Conversely, during the Medieval Warm Period (MWP: 900–1250 CE; 1050–700 cal BP) the westerlies are believed to have been displaced southward, resulting in decreased precipitation (Perren et al., 2020; Stager et al., 2012). Under future warming, Perren et al. (2020) postulate that the westerlies are likely to shift further poleward, leading to drier conditions in southwestern Africa. As afrotemperate forest is more drought sensitive than fynbos, it may be expected that fynbos might increase in dominance if rainfall decreases and/or seasonality of rainfall increases.
Fire is a natural and important driver of ecosystem processes in the CFR and has perhaps been so from as early as the Cretaceous period (He et al., 2016), stimulating the evolution of different lineages within the highly diverse fynbos biome (Bytebier et al., 2011; Cowling, 1987; He et al., 2016; Keeley et al., 2012). Fire season in the southwestern CFR occurs during the dry austral summer and autumn months (van Wilgen et al., 2012), and is thus modulated by (1) the amount of precipitation received during the winter rainy season, (2) the length and intensity of the summer drought season, and (3) feedbacks with vegetation. The amount of rainfall determines biomass productivity and accumulation, while seasonality affects fire likelihood and severity. Vegetation feedbacks can reinforce or buffer changes in rainfall. Fynbos is fire adapted and persists well under conditions of highly seasonal rainfall and fire return intervals of 12–15 years although intervals can vary (van Wilgen, 2009). Afrotemperate forest, however, is fire sensitive, and the forest canopy shades the understory, thus discouraging fire and helping to stabilise the forest once it has established.
Charcoal analysis from the CFR shows higher fire activity under warmer climates such as during the MWP (Gillson et al., 2020; MacPherson et al., 2019). Palynological data from the same studies indicate a remarkable stability of both forest and fynbos vegetation despite late-Holocene climate variability, mediated by shifts in seasonality (Gillson et al., 2020; MacPherson et al., 2019). Specifically, MacPherson et al. (2019) showed that in wetter periods, which might be expected to favour forest expansion at the expense of fynbos, enhanced seasonality, promoted fire and prevented forest expansion This work suggests that shifts in rainfall seasonality may be as important as overall rainfall amount in terms of defining fynbos-forest boundaries. In contrast, other research shows an increase in the area covered by afrotemperate forest is clearly evident during more humid/less seasonal episodes over, for example, the transition period from the MWP and LIA (du Plessis et al., 2020). In light of this spatio-temporal variability, more data are needed to clarify how vegetation-fire feedbacks maintain forest-fynbos alternate stable states under changing climates (Gillson et al., 2020).
The feedbacks between vegetation states and the mechanisms by which they are maintained makes the region particularly suitable for investigating ecological tipping points and the dynamics of alternate stable states (Lu et al., 2022). Today, the afrotemperate forest is expanding in some areas of the Cape Peninsula (Poulsen and Hoffman, 2015; Slingsby et al., 2020) replacing the fire-dependent vegetation of the Fynbos Biome (Slingsby et al., 2020). Repeat ground photographs document a near doubling of area covered by afrotemperate forest through the 20th century (e.g. Poulsen and Hoffman, 2015). Consideration of historic and prehistoric fire regimes and changes in forest extent will be relevant in interpreting these changes and in informing restoration plans.
The natural fire return interval in the Cape Peninsula may have been modified since the arrival of Khoekhoen pastoralists around 2000 cal BP (Sadr, 2003, 2008), as they used fire to enhance grazing for livestock (Smith, 1986). It was further and more intensively altered by European settlers who increased fire activity from the mid-17th century to improve grazing for livestock (Pooley, 2014). Historical sources suggest, that after the establishment of the victualling station of the Dutch East India Company in 1652 CE (298 cal BP) areas of afrotemperate forest diminished because of intensive logging and veld burning (Pooley, 2012, 2018). This high fire frequency was followed by a steady decrease in the incidence of fire in the last 50 years (Slingsby et al., 2020) due to urban development and a policy of fire suppression implemented to protect pine plantations and property (Luger and Moll, 1993). The recent incursion of the afrotemperate forest into the Fynbos Biome is coupled to this decline in the frequency of fire (e.g. Poulsen and Hoffman, 2015; Rebelo et al., 2006; van Wilgen et al., 2012). A limited recent re-introduction of prescribed burns has been implemented since 1968 in an attempt to rejuvenate fynbos and prevent the accumulation of moribund vegetation that can cause the spread of intense wildfires.
The interplay between environmental, biotic and anthropogenic factors makes it challenging to determine reference conditions for restoration ecology and ecosystem management. It is not clear how the recent decrease in fire has interacted with intensive land-use history over the past centuries. As a result, the modern resurgence of afrotemperate forest on the Cape Peninsula may reflect the recovery of a vegetation type that was once more widespread in the area, or an unprecedented encroachment (Campbell and Moll, 1977; McKenzie et al., 1977). An understanding of how anthropogenic changes in the fire regime over recent centuries has affected the feedback mechanisms that formerly stabilised forest and fynbos could inform restoration and fire management plans that consider forest extent prior to European settlement. Palynological analyses can be used to track shifts in the distribution of forest-fynbos ecotones and a multi-proxy approach can be used to assess the interactions between internal feedbacks mechanisms, and external factors including climate change and human management (e.g. Luger and Moll, 1993; Poulsen and Hoffman, 2015).
The study site at Orange Kloof (kloof = valley) provides an ideal setting to apply palynology to understand forest-fynbos dynamics, as it matches all necessary criteria including: (1) the presence of modern forest-fynbos alternate stable states, (2) an extensive, well-documented resurgence of afrotemperate forest (Luger and Moll, 1993; McKenzie et al., 1977; Poulsen and Hoffman, 2015) and (3) an active program of fire suppression since 1933 (Campbell and Moll, 1977; Luger and Moll, 1993).
The study analyses a sediment core to obtain high resolution pollen and non-pollen palynomorph. These proxies are complimented with charcoal data, X-ray fluorescence elemental ratios and stable carbon isotopes, together providing a multi-proxy perspective on vegetation change, fire regimes and hydrological changes as they relate to questions of forest-fynbos alternate stable states. The multiproxy study aims to identify the past extent of forest-fynbos in Orange Kloof (Table Mountain), and to investigate the environmental and social drivers affecting these vegetation types. The results are intended to serve as a basis for management recommendations within the Table Mountain National Park.
Environmental setting
Orange Kloof is a broad valley covering 2.5 km2 on the southern tip of the Table Mountain Massif of South Africa’s Cape Peninsula (Figure 1). The valley basement is formed by granite, creating very thin soils (Campbell and Moll, 1977; Luger and Moll, 1993; McKenzie et al., 1977). Deeper soils are produced by colluvial quartzitic sandstone, which is derived from the Table Mountain Plateau overlaying the granite basement of the valley (Campbell and Moll, 1977; McKenzie et al., 1977). The vegetation in Orange Kloof is a mosaic comprising Peninsula Granite Fynbos, Peninsula Sandstone Fynbos and Southern Afrotemperate Forest (McKenzie et al., 1977; Mucina and Rutherford, 2006; von Maltitz et al., 2003).
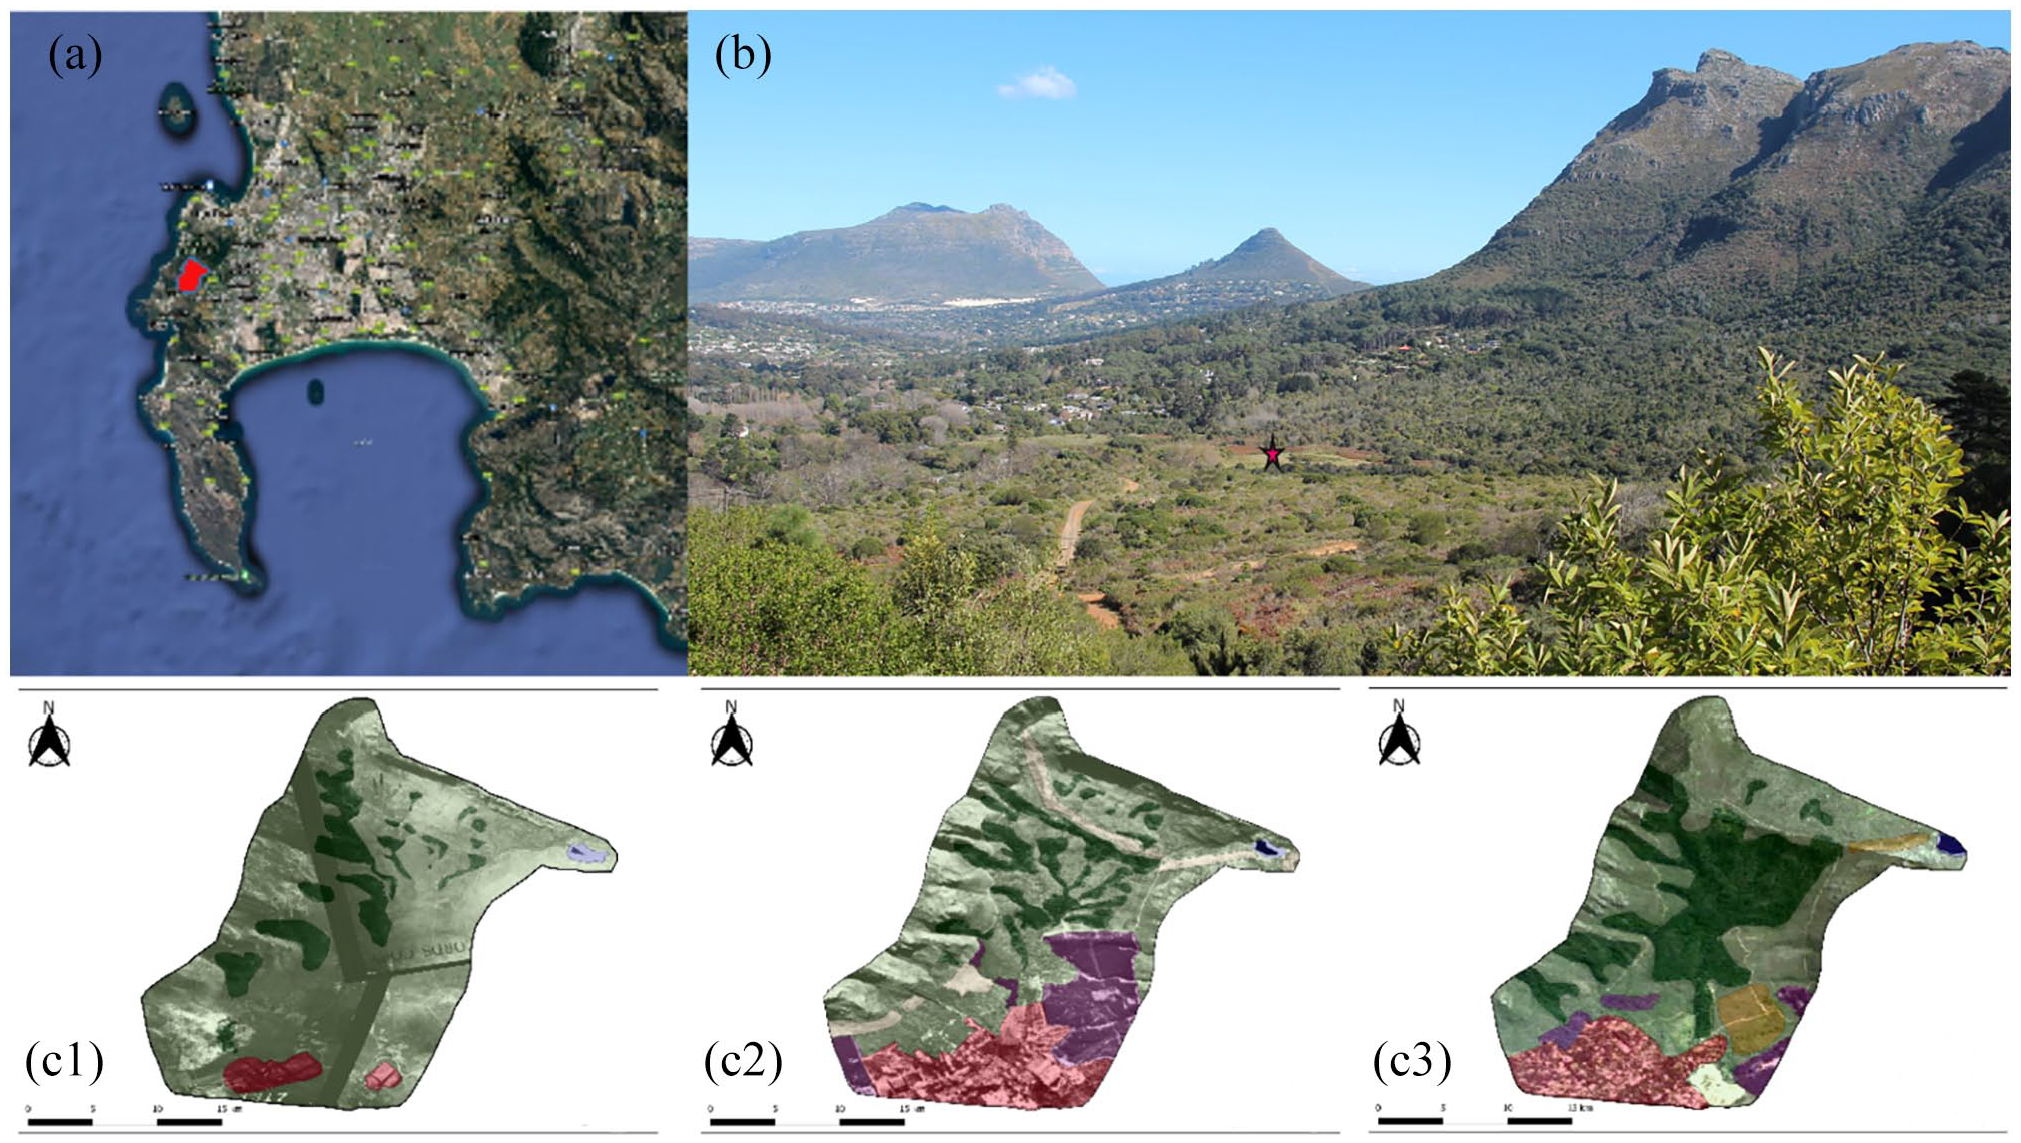
(a) Map showing location of Orange Kloof (red) on the Cape Peninsula (1: 800,000). (b) Orange Kloof with red star indicating coring site OrKl 3|D. (c). Time series of aerial photographs from the Chief Directorate of Surveys and Mapping modified via QGIS showing landscape transformation and expansion of afrotemperate forest over the last 60 years (c1–c3). Historical image 1944 (c1); 1983 (c2); 2016 (c3): dark green: afrotemperate forest; light green: Fynbos; pink: build up; yellow: fynbos post 1990; violet: Plantation and alien plants; blue: Woodhead Dam.
Fynbos vegetation is dominated by species of Ericaceae, Proteaceae and Restionaceae (McKenzie et al., 1977; Mucina and Rutherford, 2006). Fynbos species composition varies according to slope orientation and water availability. North-facing drier slopes are commonly occupied by, for example, Lobostemon glaucophyllous (Boraginaceae), Crassula nudicaulis (Crassulaceae), Phylica stipularis (Rhamanceae) and Restio gaudichaudianus (Restionaceae) as well as various Asteraceae. Southward-facing slopes in Orange Kloof have higher moisture availability and are often dominated by Erica hispidula or Cliffortia pendiculata (McKenzie et al., 1977). Disturbed areas are often colonised by Stoebe cinerea (Asteraceae; McKenzie et al., 1977).
The Southern Afrotemperate Forest is a species poor bioregion that occupies ravines, sheltered from recurring wildfires and buffered from summer drought through locally higher water availability (Campbell and Moll, 1977; McKenzie et al., 1977; Mucina and Rutherford, 2006; von Maltitz et al., 2003). Forest vegetation is characterised by the presence of trees such as Podocarpus latifolius (Podocarpaceae), Cunonia capensis (Cunoniaceae), Rapanea melanophloeos (Primulaceae), Ilex mitis, Ocotea bullata (Lauraceae) and Cassine peragua (Mucina and Rutherford, 2006; von Maltitz et al., 2003).
At the forest margins and on disturbed sites, forest precursor taxa like Cassine capensis (Celastraceae), Olea capensis (Oleaceae), Kiggelaria africana (Achariaceae), Apodytes dimidiata (Icacinaceae) and Maytenus oleoides (Celastraceae) occur. Most of these species show some degree of resilience to fire disturbance (Campbell and Moll, 1977; Giddey et al., 2022; Masson and Moll, 1987).
Materials and methods
Sampling, lithology and chronology
The Orange Kloof Core 3|D (34.00909 S 18.38928 E) was recovered from a wetland in February 2021 from the centre of the Orange Kloof valley (Figure 1) using a vibracorer.
The upper 120 cm of the 173 cm core was sampled at 2 cm resolution and in some cases at 5 mm resolution. The remaining 50 cm were subsampled in 4 cm steps. Sediment description was carried out using the Troels-Smith Classification System (Troels-Smith, 1955) and Munsell Color Company (1954)
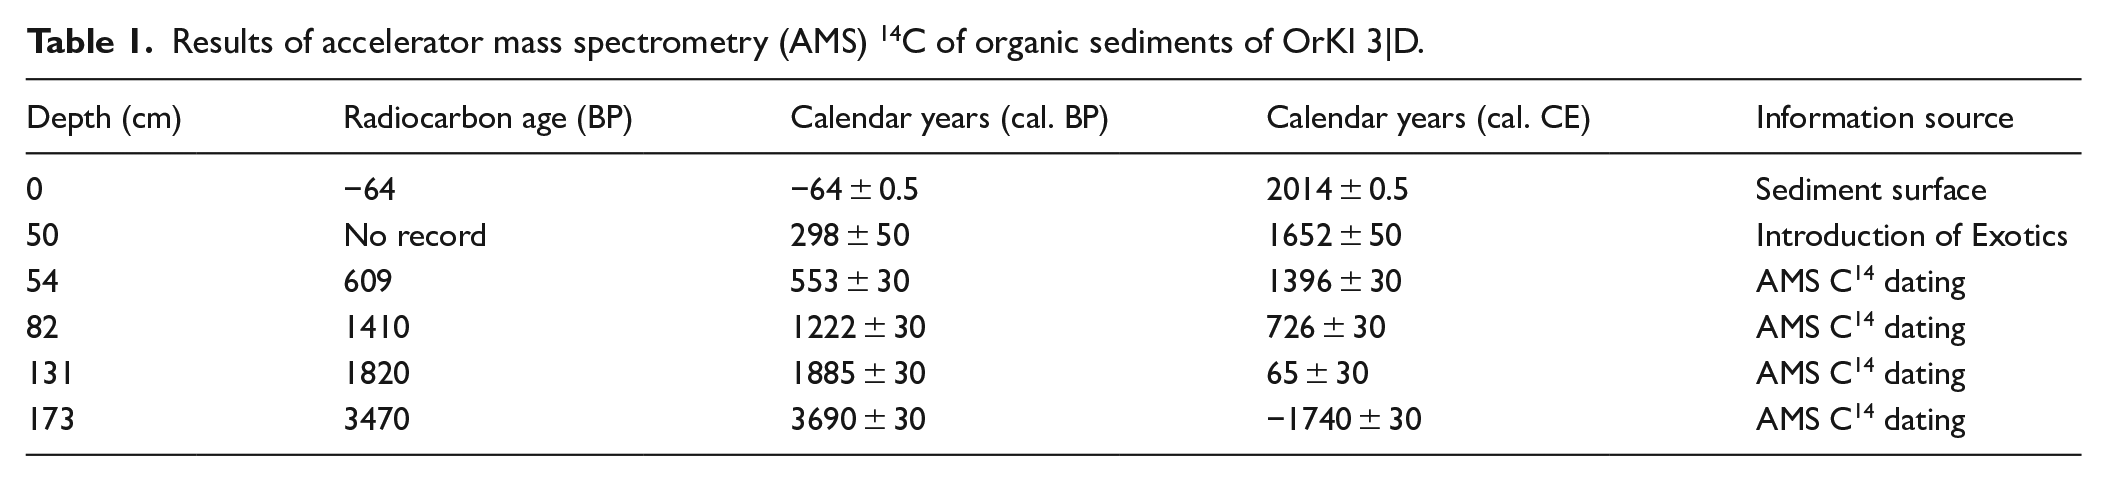
The age model of OrKl 3|D is based on AMS 14C dating of four bulk sediment samples (Table 1; Figure 2) at Beta Analytic Inc. (Miami, Florida, USA). The OrKl 3|D chronology was calculated with Bayesian statistics age modelling in R package Bacon v2.2 (Blaauw and Christen, 2011) using the SHCal20 calibration data (Hogg et al., 2020).
Results of accelerator mass spectrometry (AMS) 14C of organic sediments of OrKl 3|D.
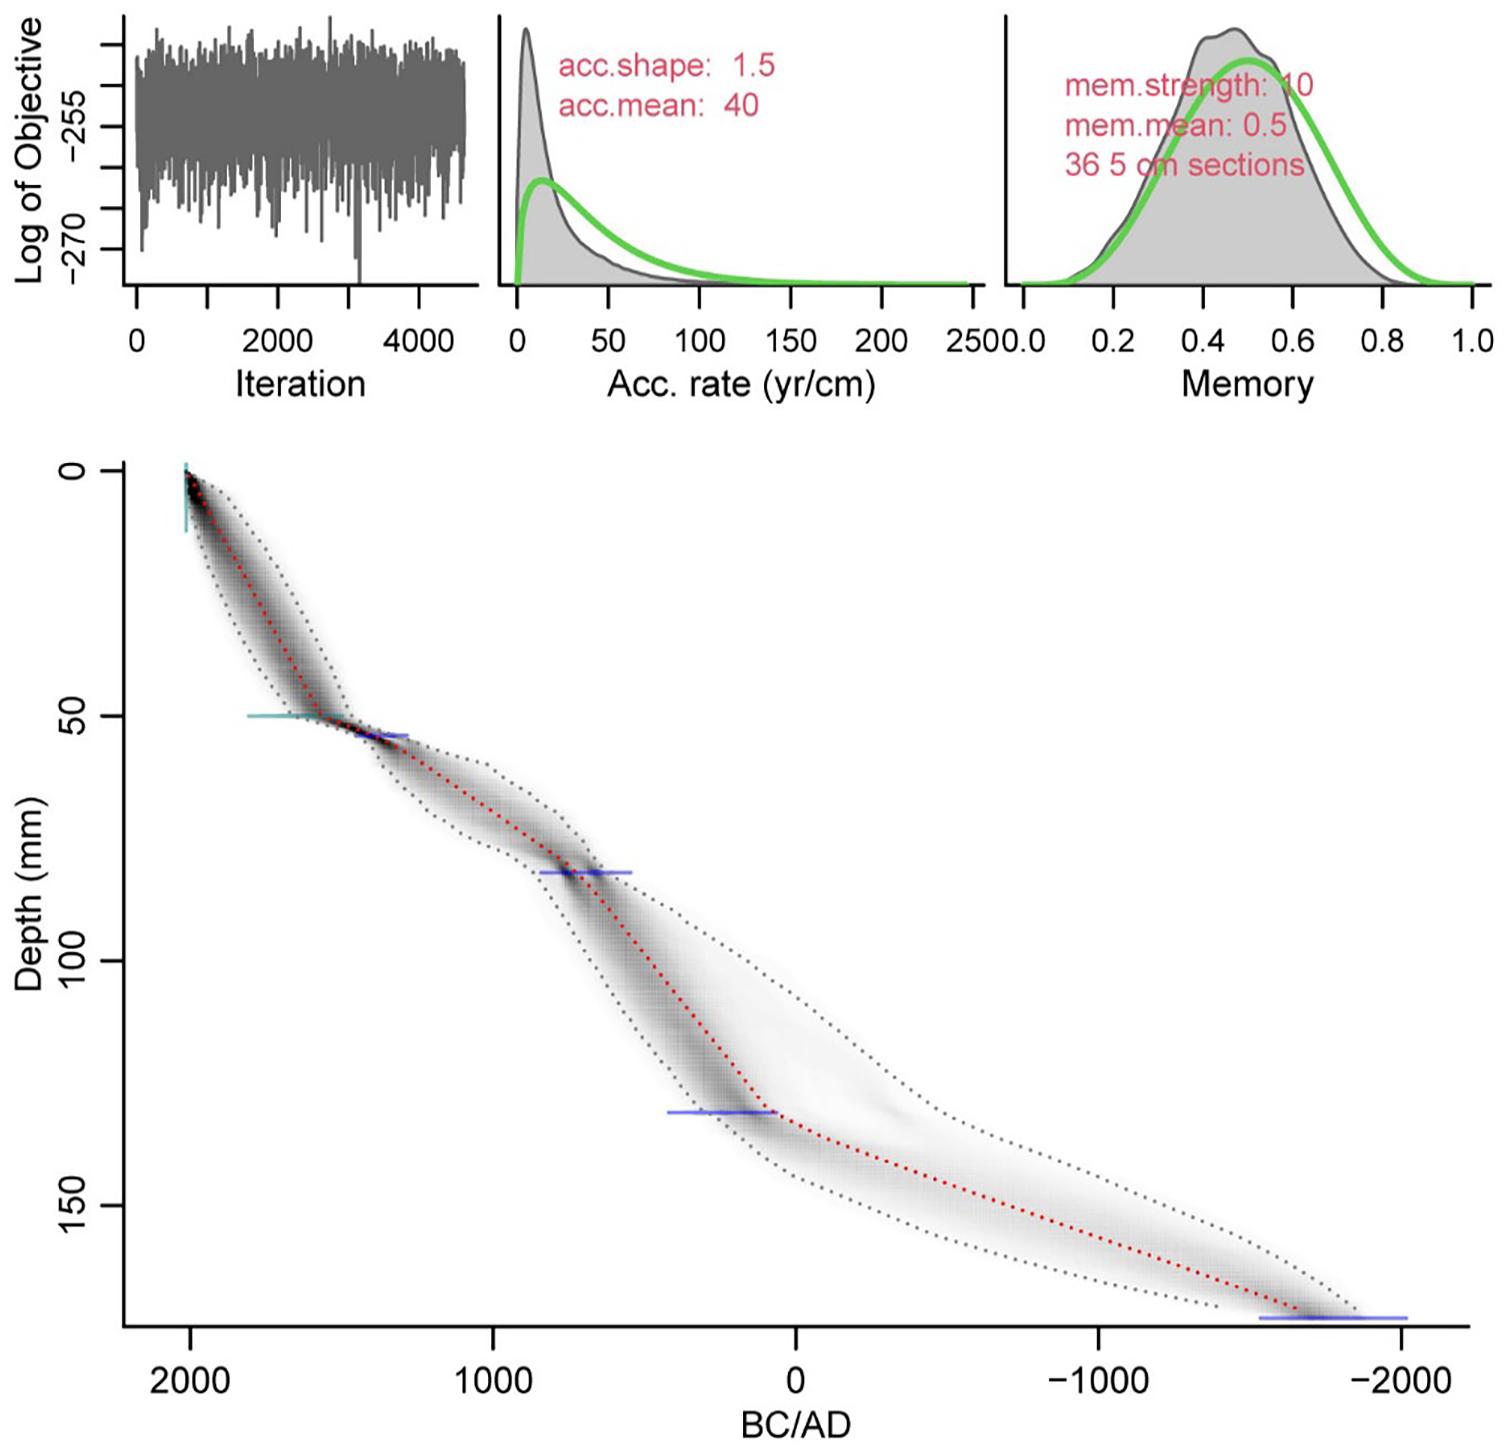
Age depth model of Orange Kloof core using Bacon package V. 2.5.3 (Blaauw and Christen, 2011) based on the SHCal20 calibration curve (Hogg et al., 2020). The weighted mean age is represented by the red line. Dotted grey lines and greyscale depict the 95% confidence interval.
Geochemical analyses
Geochemical analyses were conducted along the sediment core at 2 cm intervals, which can indicate various environmental changes. Mortared sediment samples were scanned for major and trace elements using a XEPOS XRF instrument. Each sample was measured at a N flow rate between 80 and 85 ml/min for ca. 17.5 min.
The Fe/K elemental ratios, which increase with increasing humidity (Govin et al., 2012; Simon et al., 2015), while elevated Ti values can indicate past erosion activity (Zolitschka et al., 2019).
Stable isotope ratios (δ13C), total organic carbon (C org), total organic nitrogen (N org) and C:N (by wt) were determined on a subset of samples at the Department of Archaeology of the University of Cape Town. Samples were weighed into tin cups and combusted in a Flash 2000 organic elemental analyser and the gases passed to a Delta V Plus isotope ratio mass spectrometer (IRMS) via a Conflo IV gas control unit (Thermo Scientific, Bremen, Germany). The standards have been calibrated against IAEA (International Atomic Energy Agency). Carbon is expressed in terms of its value relative to Pee-Dee Belemnite. Stable carbon isotopes show a thermal variability, which is associated with fire (Araya et al., 2017; Fernández and Cabaneiro, 2019). Organic carbon and nitrogen dynamism can be associate with biomass accumulation.
Palynomorphs
For pollen, non-pollen palynomorphs (NPPs), and macro- and microcharcoal analyses, 1 cm³ sediment per sample was processed using a modified protocol of Bennett and Willis (2001). The protocol includes dissolution of carbonates silicates and humic acids using a series of acid and alkali treatments, but without acetolysis. Lycopodium spores (Batch num. 3862) were added to the sediment for the calculation of microfossils concentrations (Stockmarr, 1971).
Samples were sieved through a sieve with mesh size of 150 µm to extract macrocharcoal from microfossils and microcharcoal. The extraction procedure was concluded by mounting samples in glycerol.
Samples were analysed using a Leica DM 750 high power light microscope at 630x magnification. The pollen grain counts of this study varied between 250 and 380 terrestrial pollen grains per level, exceeding the minimum of 250 required to guarantee robust results (e.g. MacPherson et al., 2019; Quick et al., 2011; Scott and Woodborne, 2007). Aquatic taxa were excluded from the pollen sum. The pollen reference collection of the Plant Conservation Unit of the University of Cape Town and existing literature was used for pollen identification (e.g. Schüler and Hemp, 2016; van Zinderen Bakker, 1953; van Zinderen Bakker et al., 1970; van Zinderen Bakker, 1956; van Zinderen Bakker and Coetzee, 1959). A full list of all identified palynomorphs can be found in Supplemental Table 1.
A particular focus was kept on NPPs to guarantee independent information about environmental changes and disturbance (e.g. Shumilovskikh and van Geel, 2020). The identification of various NPPs was based on different sources (e.g. Cugny et al., 2010; Gelorini et al., 2012; Shumilovskikh and van Geel, 2020; van Geel, 2001; van Geel and Aptroot, 2006). NPPs were counted together with Lycopodium spores until 250–300 encountered pollen were reached. The calculation is expressed as a percentage of the pollen sum. Coniss Cluster Analysis is based on the Bray-Curtis Dissimilarity Index using R package rioja (Juggins, 2020) and vegan (Oksanen et al., 2019). Principal Components Analysis (PCA) was performed using R packages FactoMineR (Lê et al., 2008) and factoextra (Kassambara and Mundt, 2020; Supplemental Figure 3).
Micro- and macrocharcoal
Charcoal-particles were divided into macro- (>150 µm) and microcharcoal particles (10–150 µm) to infer fire signals (Conedera et al., 2009; Power et al., 2010; Whitlock and Larsen, 2001). Microcharcoal particles were counted using the same palynological slides used to generate counts of terrestrial palynomorphs and NPPs. Black, opaque particles with sharp uneven edges, images were identified and counted as micro-charcoal particles (Whitlock and Larsen, 2001). A total of at least 250 objects was counted together with Lycopodium clavatum spores (Finsinger and Tinner, 2005; Tinner and Hu, 2003) and is expressed as the concentration of units per volume. Macrocharcoal examination was performed on residues gained during sample sieving and which were bleached using a weak 6% hydrogen peroxide solution, to facilitate the identification of macrocharcoal (Rhodes, 1998; Stevenson and Haberle, 2005) and counted using a dissecting microscope. Macrocharcoal concentration is expressed as the number of charred particles per cm3.
Results
Chronology and lithology
Results of accelerator mass spectrometry (AMS) 14C–based age model for dated organic sediments are given in Table 1. The base of the investigated core is dated to 1740 ± 30 BCE (Figure 2).
The 173 cm long sediment core consists of organic rich and clayey sediments which can be visually differentiated into four lithological units (Table 2). The basal lithological Unit I (173–116 cm, 1740 BCE–275 CE) is a gravel rich sandy layer containing mineral particles smaller than 2 mm, intermixed with clayey sand and a high amount of organic (root) material. The overlaying lithological Unit II (116–51 cm, 275–1525 CE) is characterised by alternating subunits consisting of coarser sandy facies (116–105 cm, 275−420 CE; 75–61 cm, 875−1200 CE) – and clayey rich fine-grained fractions respectively. Both subunits contain non-decomposed organic material. Lithological Unit III (37–5.5 cm, 1685–1970 CE) is an organic rich non-decomposed layer dominated by clayey sand and a slight amount of coarser sand. A strong colour shift from black to reddish black occurs from lithological Unit III to the uppermost lithological Unit IV (5.5–0 cm, 1970−2015 CE). The most recent facies consist of an organic rich herbaceous layer with a high amount of clay.
Lithology of OrKl 3|D according to Troels-Smith Classification System (Troels-Smith, 1955) and Munsell Color Company (1954).
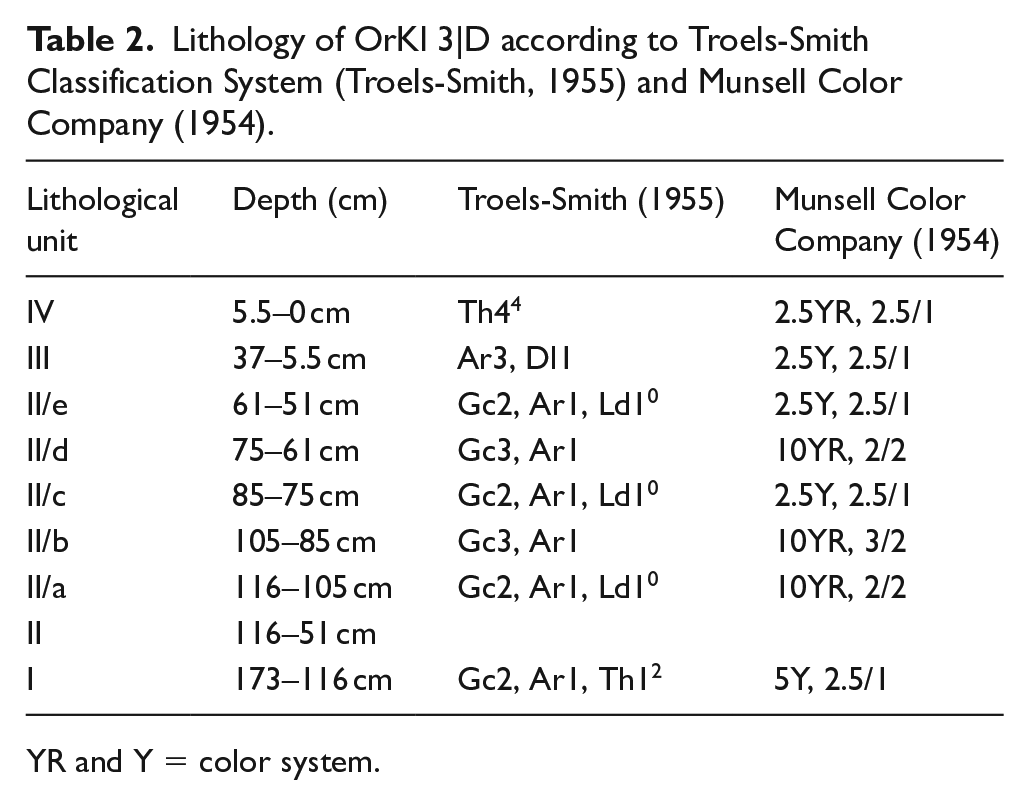
YR and Y = color system.
Palynomorphs
In total of 155 pollen and non-pollen palynomorphs were identified in the Orkl 3|D sediments (Supplement Table 2 and Figure 1). CONISS Cluster analysis divided the core into five zones (Figure 3 and Supplement Figure 1).
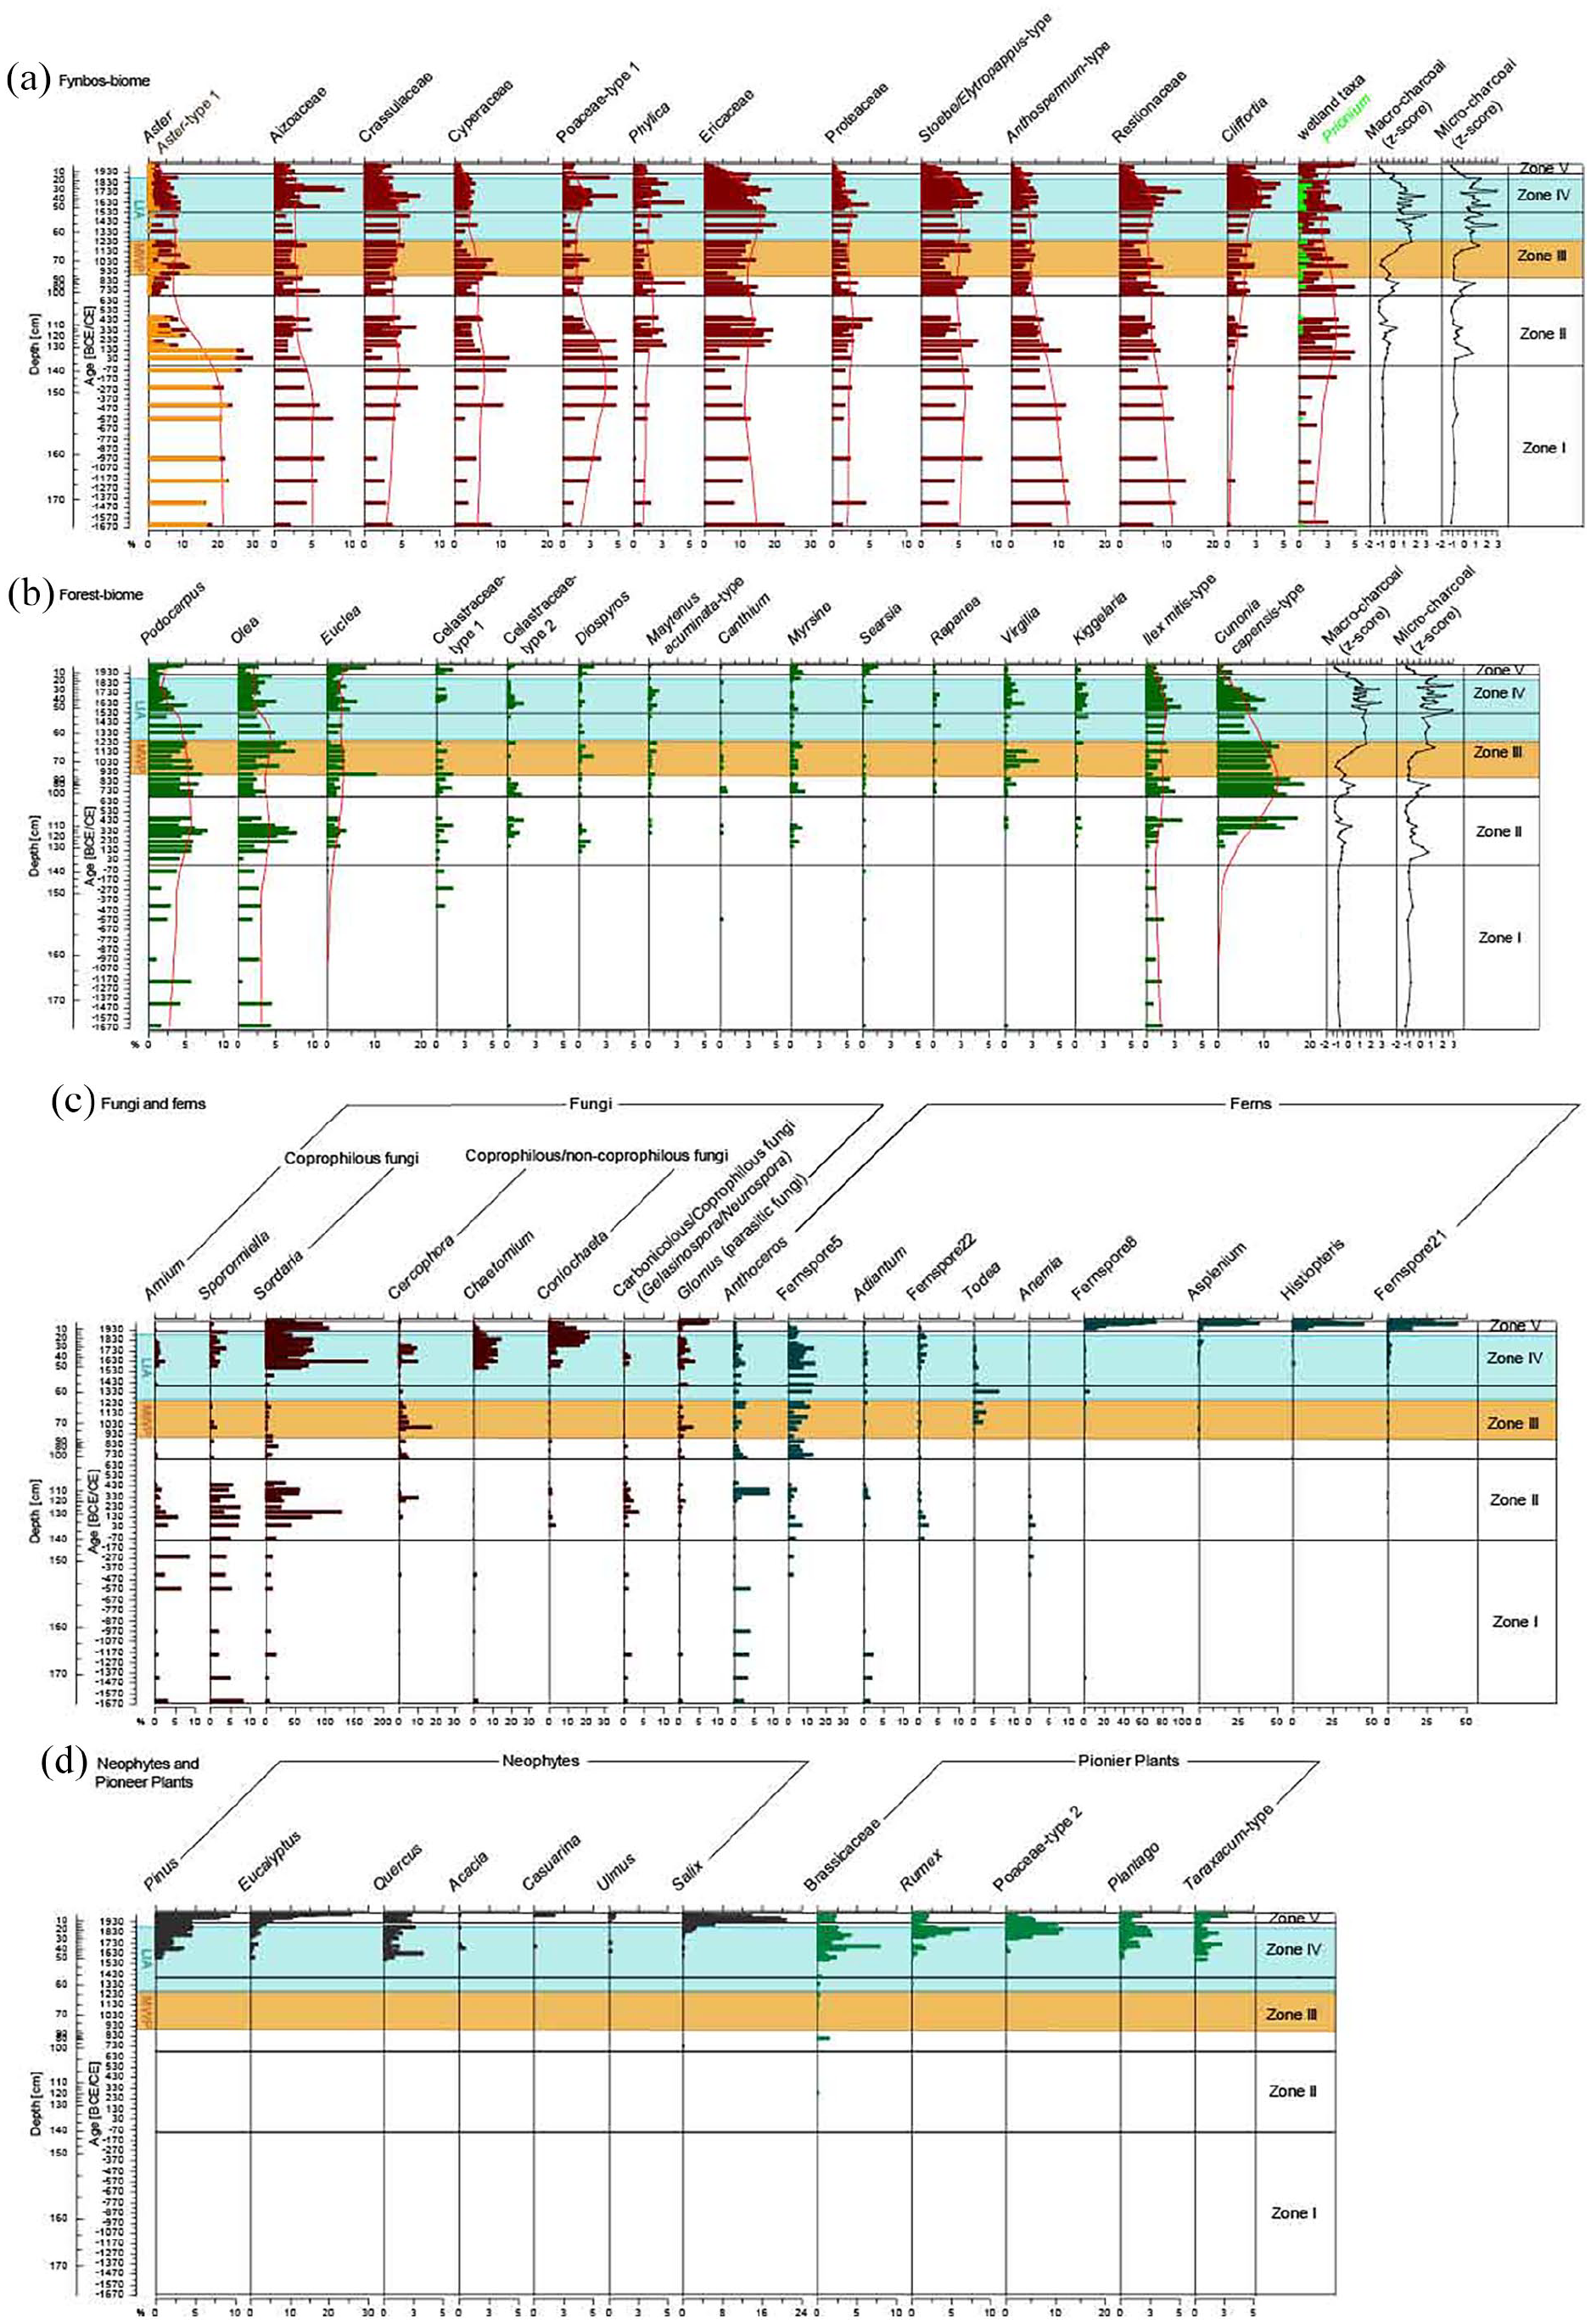
Diagrams of the most important pollen taxa and charcoal concentrations from the Orange Kloof record. Pollen zonation (Zone I-V) is based on ConissCluster Analysis using Bray-Curtis Dissimilarity Index: (a) Fynbos Biome: wetland taxa include: Berzelia, Bruniaceae, Morella, Typha, Haloragaceae. (b) Forest Biome. MWP: Medieval Warm Period (900–1300 CE); LIA: Little Ice Age (1300–1850). Pollen diagram plotted against depth and age (the complete pollen diagram with the Original Cluster Analysis is provided in the Supplement). continued Diagrams of the most important pollen taxa and charcoal concentrations from the Orange Kloof record. (c) selected non-pollen palynomorphs grouped according to Shumilovskikh and van Geel (2020) (d) Neophytes and pioneer vegetation linked to anthropogenic activity. MWP: Medieval Warm Period (900–1300 CE); LIA: Little Ice Age (1300–1850). Pollen diagram plotted against depth and age (the complete pollen diagram with the Original Cluster Analysis is provided in the Supplement).
Zone I (171–136 cm, 1660 BCE−90 BCE) is characterised by high abundances of pollen representative of fynbos vegetation (max 84.2% at 430 BCE Figure 3a). Within fynbos, pollen of Aster-type are most abundant (max: 25.2% at 980 BCE; Figure 3a), while pollen of Aizoaceae, Poaceae, Restionaceae and Anthospermum-type are also important. Relative abundances of pollen from afrotemperate forest taxa remain moderate throughout Zone I with a slight increase towards the end of Zone I. Afrotemperate forest taxa in Zone I are mainly represented by Podocarpus (max: 5.8% at 1200 BCE), Ilex mitis- type (max: 1.6% at 1430 BCE) and Olea (max: 4.7% at 1430 BCE) pollen (Figure 3b). Spores of Arnium and Sporormiella are characteristic for Zone I (Figure 3c).
The steady increase of pollen derived from afrotemperate forest taxa (14.7%–31.9%) and a contemporaneous decline in relative abundances of pollen from fynbos taxa (83.1%–62.3%) is characteristic for the beginning of Zone II (132–102 cm, 40–460 CE; Figures 3a and 4). Contributing 18.8% of all counts in Zone II, pollen of the Cunonia capensis-type is one of the most important taxa in Orange Kloof and characterises the zone (Figure 3b). Pollen of the Olea capensis-Type and Podocarpus are also abundant (Figure 3b). Pollen of Diospyros, Rapanea, Myrsine, Kiggelaria, Virgilia also appears occasionally in Zone II (Figure 3b). The abundance of pollen of Aster-type found in Zone I sharply decreases in this zone from 25.5% to 4.9% while Ericaceae pollen, which is representative of fynbos vegetation, increases (max: 19.6% at 329 CE) (Figure 3a). This is accompanied by an increase of taxa associated with more humid habitats like Morella, Berzelia and other taxa belonging to the Bruniaceae family (Figure 3a; Supplement Figure 1). Cliffortia pollen also appears with regularity for the first time.
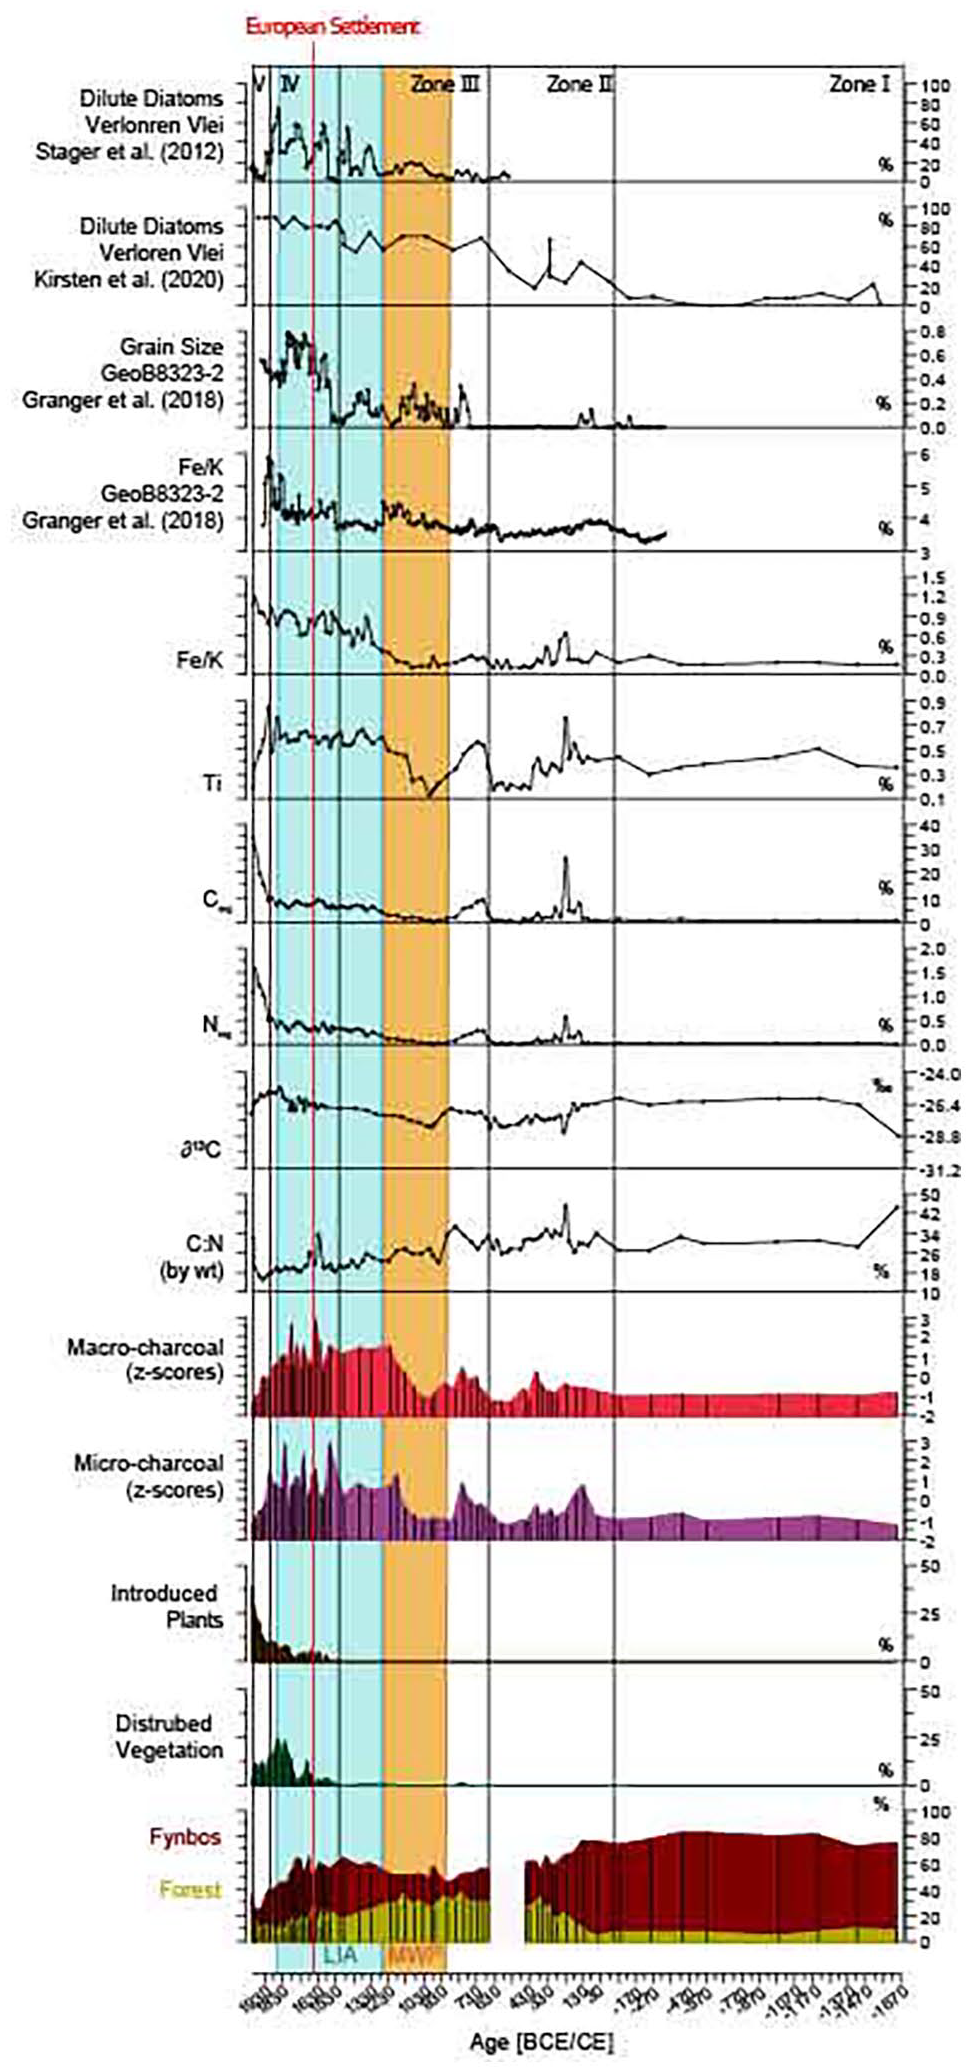
Selected environmental parameters from Orange Kloof plotted against age in CE. Red vertical line marks the onset of European Settlement in 1652., LIA (Little Ice Age 1250–1850 CE) MWP: Medieval Warm Period (900–1250 CE). Parameters include: sum of the relative percentages of Forest, Fynbos, disturbed vegetation (pioneer vegetation) and introduced plants and of Orange Kloof (compare Table1 Supplement). Macro and microcharcoal are standardised and represent fire history. Fluctuation of organic δ13C, Norg%, Corg%, C:N ratios. Fe/K ratios (GeoB8323-2; Granger et al., 2018; and this study), grain size (GeoB8323-2; Granger et al., 2018) and relative percentages of dilute diatoms from Verloren Vlei (Kirsten et al., 2020; Stager et al., 2012), as proxies for precipitation variability.
Higher values of Sordaria spores characterise the beginning and the end of Zone II (Figure 3c). Further important NPP spores in terms of abundances are Cercophora and Fernspore 5 (Figure 3c).
Zone III (84–52 cm, 690−480 CE) is marked by a steady decline of pollen indicative of afrotemperate forest taxa (e.g. Cunonia capensis-type, Podocarpus). However, pollen of Olea show an opposite trend to, for example, Cunonia capensis-type. Pollen of Myrsine, Diospyros and Virgilia are frequently encountered. Pollen associated with fynbos vegetation show a resurgence in Zone III, which is marked by an increase of Aster – type pollen (max: 5.7% at 970 CE), and Cyperaceae, whereas pollen of Ericaceae and Proteaceae decline in Zone III. Relative abundances of fungal spores of Arnuim, Sporormiella and Sordaria decrease sharply in Zone III (Figure 3c), but spores of Cercophora show a remarkable increase (max 17.8% at 990 CE). Fern spores of Anthoceros, Fernspore 5, and Oospores are characteristic throughout this zone.
The beginning of Zone IV (50–10 cm, 1570–1920 CE) is characterised by a disturbed vegetation type composed of weedy species within the genera Taraxacum-type pollen, Plantago and Rumex (Figures 3d and 4). The entire Zone IV is marked by an overall increase of anthropogenically-introduced plants visible by the steady increase of pollen derived from Pinus, Quercus and Eucalyptus (Figure 3d). Single pollen of Acacia (at 1670 CE) and Casuarina (at 1690 CE) appear for the first time. This is accompanied by an increase in the relative abundance of Taraxacum-type pollen, Rumex and Brassicaceae (Figure 3d). Pollen associated with afrotemperate forest steadily decrease, although pollen of Kiggelaria and Virgilia are most frequently encountered in this zone.
Pollen taxa typical of fynbos vegetation – like Ericaceae and Proteaceae – along with Aster pollen have lower encountered values towards the end of Zone IV. Cliffortia, however, experience an increase in relative percentages in this zone. The fungal spore of Chaetomium is abundant at the bottom of Zone IV reaching a maximum of 15.1% at 1830 CE. and is replaced by Coniochaeta spores towards the end of this zone (max: 22.6% at 1900 CE). Sordaria spores are also characteristic of Zone IV.
Zone V (8–1 cm, 1940 CE–2000 CE) is represented by a sharp increase of Pinus, Eucalyptus, Casuarina and Ulmus pollen. Single pollen grains of Carya and Cedrus also appear in this zone. This zone is especially characterised by high abundances of encountered Fern spores like Histiopteris (45.4% at 1980 CE), Asplenium (39.4% at 2000 CE) and Fernspore 8 (74.3% at 2005 CE; Figure 3c). Fungal spores of Sordaria remain high. The relative abundance of taxa associated with afrotemperate forest increases again (Figures 3b and 4). This is mainly attributed to increased values of Podocarpus pollen (4.8% at 2005 CE). Kiggelaria pollen are also frequently encountered. Relative abundances of Ilex mitis-type and Cunonia capensis-type pollen steadily decrease towards the most recently analysed sediment sample. Although taxa typical of fynbos vegetation show the lowest relative values of the entire analysed time interval at the beginning of Zone V, their values increase slightly towards the end of this zone. All identified fynbos taxa in this zone have a decreasing trend (e.g. Ericaceae: min: 1.5% at 2005 CE; Figure 3a).
Macro- and microcharcoal
Macro- and microcharcoal clearly demonstrate a marked shift from initially low charcoal concentrations in Zone I towards generally higher values, while the lowest concentrations are recorded in the most recent time interval (Zone V; Figures 3 and 4). In Zone I (171–136 cm, 1660−90 BCE) macrocharcoal concentration vary between min. 250 particles/cm3 (90 BCE/135 cm) and max. 394 particles/cm3 (1560 BCE/171 cm) and increase towards higher values in Zone II. A similar pattern is reflected in the microcharcoal signal (min. 1.2 × 10⁵ particles/cm3 at 1655 BCE/171 cm; max. 12.4 × 10⁵ particles/cm3 430 BCE/144 cm). Within Zone II, between 120 and 457 CE macro- and microcharcoal show three largely congruent peaks (Figures 3 and 4). After an interval of lower macro- and microcharcoal concentrations they exhibit a steady rise in Zone III culminating in high values at 730, 760 and 810 CE. Macrocharcoal concentration varied between 994 particles/cm3 (730 CE) and 1386 particles/cm3 (805 CE), while microcharcoal varies between min. 5.3 × 10⁵ particles/cm3 (900 CE/74 cm); max. 51.0 × 10⁵ particles/cm3(1180 CE/62 cm) From 1085 CE (66 cm) onwards micro- and macrocharcoal rise steadily (Figures 3 and 4). During the transition from Zone II and IV (~1130 to ~1905 CE) micro- and macrocharcoal concentration show a strong variability, which after ~1900 CE (Zone V) charcoal concentration declines steadily (Figures 3 and 4). Macro- and microcharcoal trends are similar throughout the core.
Sediment geochemistry
XRF scanning results document a variability in Fe/K ratios between min. 0.09 (min. value) and 1.18 (max. value). The data exhibit an upward trend over time with the highest recorded values towards the youngest time interval (Figure 4). Fe/K ratios fluctuate markedly between 220 and 430 CE with prominent peaks between 220–380 CE and 1670–2000 CE, respectively (Figure 4).
The trend in Ti percentages is similar to that of the Fe/K ratios and are high during 220 and 430 CE, and low during 970 CE (71 cm) and 1330 CE (56 cm). Ti percentages also show a similar upward trend during this time interval. Between 1300 CE and 1900 CE Ti values are generally high overall (Figure 4).
Bulk sediment δ13C values show minor fluctuations over the time interval and vary between −30.6‰ and −25.2‰. Although they exhibit a steady upward trend from 968 CE (Figure 4). Carbon and nitrogen percentages covary over time (Figure 4), with particularly high values between 220 and 430 CE and in recent decades (Figure 4). Both measured values exhibit a steady upward trend from ~900 CE onwards (Figure 4). Measured C:N (dry weight) ratios show extraordinary high values in the time interval between 220 and 430 CE. The ratios have a general decreasing trend towards 1900 CE but with two outlining peaks at 1730 CE (32 cm; 32.85) and 1760 CE (28 cm; 25.8).
Discussion
Changes in the abundance of pollen from the Orange Kloof sediment core suggest that forest and fynbos vegetation have shifted in dominance throughout the late-Holocene. The fluctuating pattern of both vegetation types, combined with evidence from macro- and microcharcoal and sediment geochemistry, suggest that vegetation-fire-climate feedbacks have caused intra- and inter-biome reorganisation. The more recent part of the record shows increased anthropogenic influence.
Changes in different vegetation types
The asteraceous fynbos phase (Zone I)
Between 1670 BCE and ~170 CE, while sediment accumulation rates are very low, and the resolution of the record is coarse, pollen data indicate a consistent dominance of an asteraceous fynbos vegetation (Figures 3 and 4). This is indicated by pollen derived from the Aster-type 1 (Figure 3) and relatively high percentages of Poaceae pollen (Rebelo et al., 2006).
The dominant forest pollen taxa are Podocarpus and Olea, which probably grew in dry scree forest habitats in elevated and fire protected areas. Forest taxa which currently grow along streambanks and on low-lying, waterlogged areas (e.g. Ilex mitis; (South African National Biodiversity Institute, 2022a) were more minor elements. The presence of some limited waterlogged areas is indicated by a single pollen count of the semi-aquatic and evergreen shrub Prionium serratum (South African National Biodiversity Institute, 2022b).
Both micro- and macro-charcoal concentrations are low at this time (Figure 3), which might suggest lower and/or more seasonal precipitation. This interpretation is strengthened by the coincidence of a low measured Fe/K ratio (Figure 4), illustrating conditions of lower local humidity associated with reduced local surface weathering during more arid climatic conditions (Govin et al., 2012; Simon et al., 2015). The close relationship between aridity, low biomass and low fire activity/charcoal production is further supported by the relatively low total organic carbon and nitrogen values, which indicates lower biomass accumulation (Figure 4). Alternatively, the generally low charcoal input rate and relative flat macrocharcoal signal in this interval could be further attributed to a more and complete combustion of asteroid fynbos vegetation during this drier period (Kraaij and van Wilgen, 2014; van Wilgen and van Hensbergen, 1992; van Wilgen et al., 1990).
Identifying local records that could provide perspective on the Orange Kloof sequence is complicated by the littoral position of many of the regional wetlands. As an example, pollen data at nearby Princess Vlei suggests drier conditions from 650 BCE to 50 CE (Neumann et al., 2011), which is coincident with the latter phase of asteraceous fynbos dominance at Orange Kloof. However, Princess Vlei is also influenced by changing sea-levels and a dynamic sediment regime, and it is unclear to what extent these factors may determine vegetation change at the site (Neumann et al., 2011). A study of diatoms from Princess Vlei (Kirsten and Meadows, 2016) could similarly be influenced by non-climatic processes, but similarities between the percentage of dilute water diatoms and forest pollen in the Orange Kloof sequence supports the suggestion that the period from 1650 BCE and ~170 CE was relatively dry.
The ericoid fynbos phase, internal reorganisation (Zone II)
The period from ~170 to 350 CE represents a transitional phase from an initially more open asteraceous fynbos vegetation towards an ericoid fynbos vegetation. Palynologically, this is expressed in the sharp decrease in Aster-type 1 pollen abundances around ~170 CE and a coeval but steady increase in Ericaceae pollen (Figure 3a). This coincided with more mesic conditions in the region between 100 BCE and 400 CE (Kirsten et al., 2020), which is also expressed at Orange Kloof by slightly increased Fe/K values (Figure 4).
Enhanced input of ericoid pollen during cooler and humid periods is reported from several other studies (e.g. du Plessis et al., 2020; MacPherson et al., 2019; Quick et al., 2016; Valsecchi et al., 2013) and accords well with eco-physiological experiments which attest to the drought-sensitive nature of many species within the Ericaceae (Leonard et al., 2021; West et al., 2012). Increased annual, and particularly summer precipitation during this short time frame (Figure 4), may also have resulted in wetland expansion, as indicated by the increased pollen input from moisture-loving Fynbos indicator taxa (e.g. Berzelia and other Bruniaceae taxa, Morella and Myriophyllum) (Figure 3a).
This transition in fynbos vegetation types (~100 CE), coincides with notable increases in micro-and macrocharcoal influx (Figures 3b and 4; compare below). This may reflect an increase in biomass (suggested also by the increase in pollen from forest taxa), and /or perhaps an increase in hot fires that may particularly affect Asteraceae mortality (Rebelo et al., 2006).
In this and subsequent phases, measured C:N ratios and δ13C values reflect trends in micro- and macrocharcoal fluctuations (Figure 4). This may be due to the observed phenomenon that soil δ13C values increase as a result of thermal isotopic shifts such as those that would be associated with wildfires (Araya et al., 2017; Fernández and Cabaneiro, 2019).
The shift to an alternative stable state: from fynbos to forest
In concert with the substantial changes in the fynbos pollen assemblage beginning at ~170 CE, a steady increase in pollen of afrotemperate forest taxa (Figures 3b and 4) is also apparent, likely as a result of increased humidity. The early phase of the biome shift might have begun with an expansion of a dry forest with increased input of Olea pollen at ~170 CE (Figure 3b). As the forest expanded, it would have shaded out shrubby understory vegetation leading to the exclusion of fire. This positive feedback would have assisted in the further establishment of fire-sensitive forest taxa (Figure 4; Lu et al., 2022). Among these, Cunonia capensis – type pollen is particularly abundant during the period from ~360 to 800 CE, indicating a humid forest community (Figure 3b). Fires probably stabilised forest-fynbos margins with some reduction in forested areas during this interval as well (Figure 4). Abundances of Cunonia capensis – type pollen and charcoal exhibit a strongly negative relationship, suggesting that fire exerted a strong control over the development of forest in Orange Kloof. In and subsequent to high charcoal influxes, such as have occurred around 380 and 760 CE, forest contraction is indicated by a decline of Podocarpus, Olea, Cunonia capensis- and Ilex mitis pollen-type. These events may, however, led to an increased input of Kiggelaria, Virgilia and Myrsine pollen, which typically occur following disturbance on the forest margin (Figure 3b; Manders and Smith, 1992).
Fire from 50 CE until 900 CE and the evidence of early human activity
The increased micro- and macrocharcoal input around 50 CE suggests an increase in biomass accumulation and fire activity which lasted until around 400 CE (Figure 4). During this time, coprophilous fungi (e.g. Arnium, Sporormiella, Sordaria: Figure 3c) also increase, suggesting increased herbivore activity in Orange Kloof. The period of relative increased fire activity and increased coprophilous spores overlaps with the earliest evidence of Khoekhoen pastoralists in the Cape Peninsula from around 2000 cal BP (Sadr, 2003, 2008). Their activities are associated with burning of the landscape to improve grazing for livestock (Figure 4; Smith, 1986). Other evidence of anthropogenic activity, such as compositional changes in the vegetation, for example, increased Poaceae (Neumann et al., 2010), is not exhibited during this interval (Figure 3; compare section LIA), suggesting that their influence on the landscape was subtle. The influence of wild herbivores (e.g. Mountain Zebra, Antelopes) cannot be excluded (compare pollen zone I and II in Figure 3c).
The decline of coprophilous fungi after 350 CE could be attributed to the migration of Khoekhoen pastoralists (Figure 3c) away from the region, or a local decline in grazing as forests became more extensive in Orange Kloof. Considering the charcoal signals and, assuming that Khoekhoen abandoned Orange Kloof, wild fires would most likely have prevented forest expansion and/ or stabilised the forest-fynbos ecotone boundaries.
The Medieval Warm Period (MWP). Crossing a tipping point (within Zone III)
As with elsewhere in the wider region (du Plessis et al., 2020; Nash et al., 2016; Nicholson et al., 2013), the MWP, does not manifest as a clearly distinct phase in the Orange Kloof pollen record. The MWP extended from c. 900 to 1250 CE but differed in timing in different regions of the world (sensu PAGES2k Consortium, 2013). Regionally, records from the Western Cape indicate significant spatial heterogeneity. At Princess Vlei, the MWP is characterised as a continuation of the humid conditions that began at ~650 CE (Kirsten and Meadows, 2016), while further north at Verloren Vlei, dilute diatom percentages from different sediment cores contrastingly indicate either relatively low (Stager et al., 2012) or high-water levels and hence precipitation (Kirsten et al., 2020).
In Orange Kloof, afrotemperate forest continued to be well-established throughout the MWP (Figures 3b and 4). Cunonia capensis- type pollen, while still abundant, declines together with Ilex mitis- type pollen, at the beginning of the MWP. Replacing these taxa in the forest pollen assemblage, Euclea and Olea become more prevalent, suggesting the development of a more drought-tolerant forest vegetation. At the same time, pollen from fynbos taxa, especially Ericaceae, declines, which would be consistent with warmer conditions and associated summer drought stress. This is supported by increases in Crassulaceae pollen as well the appearance of Ruschia and Amaranthaceae pollen, albeit in very low quantities. Fynbos vegetation was probably self-stabilised through the appearance of functionally diverse plant taxa able to occupy different niches.
Fire activity during the MWP was initially low but increased sharply at ~1100 CE (Figure 4). δ13C values are in good agreement with the charcoal data (Figure 4; Araya et al., 2017; Fernández and Cabaneiro, 2019). Low abundance of coprophilous fungi (Figure 3c) suggests limited human activity and/or fewer herbivores at this time. Therefore, it might be assumed that the fires were the product of natural ignition. Charcoal concentrations peak at ~1230 CE and are associated with the subsequent contraction of forest cover. Early in this phase of increasing fire activity, it appears that only the forest margin may have been affected as Podocarpus pollen values remain unchanged while values of Olea pollen decline (Figure 3b). Increases in Kiggelaria, Rapanea and Virgilia pollen as well as of Canthium in the Orange Kloof record (Figure 3b) suggest an increase in disturbance in the landscape as a result of fire (Scholtz, 1989). Although fire does not normally penetrate into afrotemperate forest, severe fires can burn beyond the forest margins, especially in cases where forests are already drought stressed (Figures 3b and 4; Watson and Cameron, 2001). Reduction in forest cover as a result of frequent, severe fires would have helped to maintain the dominance of fynbos vegetation in the area.
The Little Ice Age (overlaps with Zone III and IV)
The palynology of this time interval suggests a complex response of vegetation in Orange Kloof. During the Little Ice Age (LIA; 1250–1850 CE; sensu PAGES 2k, 2013) the Western Cape is thought to have experienced cooler conditions and greater moisture availability, with an equatorward shift of the westerly storm track and increased winter rainfall (e.g. Granger et al., 2018; Perren et al., 2020; Stager et al., 2012).
In the initial phase of LIA (1250–1500 CE), the relative abundances of afrotemperate forest in Orange Kloof decline rapidly, accompanied by an expansion of fynbos vegetation (Figures 3a, b and 4). Climatic conditions between 1250 and 1500 CE are variable (Granger et al., 2018; Stager et al., 2012) but locally seem to evolve towards less humid conditions (Kirsten and Meadows, 2016). Over these 250 years, micro- and macrocharcoal concentrations indicate substantial fire activity in Orange Kloof, which would most likely have triggered and/or amplified the contraction of previously forested areas as indicated by a decrease in the relative abundance of afrotemperate forest taxa in the pollen record (Figures 3b and 4). During this period, fynbos vegetation expanded as forest contracted into more sheltered, moister areas.
The period from ~1500 to 1750 CE marks the coolest period of the LIA according to the Northern Hemisphere temperature reconstruction of Moberg et al. (2005). Regionally, increased precipitation is inferred from the Verloren Vlei diatom record (Stager et al., 2012) and data from geochemical and particle size data from marine core GeoB8323-2 (Granger et al., 2018). In Orange Kloof, the decline of forest and increase in fynbos vegetation is arrested, and a variable, but broadly stable vegetation composition is established (Figure 4). Cooler conditions and perhaps attenuated summer drought may account for the resurgence of forest and fynbos taxa associated with moister environments (e.g. Cunonia, Morella, Prionium, Cliffortia).
The higher variability in the relative abundance of forest and fynbos vegetation is associated with the sudden rise of coprophilous fungi and a concomitant higher amplitude of charcoal (Figures 3c and 4), consistent with increased pastoralist activities, possibly Khoekhoen and the arrival of European settlers in the area as indicated by historical documentation (Pooley, 2014, 2018). These phases of increased disturbance (e.g. as a result of seasonal veld burning) influenced the afrotemperate forest composition, resulting in the increased appearance of disturbance indicators such as Kiggelaria, Clutia, Myrsine, Searsia, Virgilia (Figure 3b; Manders and Smith, 1992; Scholtz, 1989), which often occur along forest margins.
Increased anthropogenic disturbance (grazing and fire) may also be indicated by the development of a novel disturbed herbaceous layer comprising taxa such as Rumex, Taraxacum pollen type or Plantago (Figure 3d). This is consistent with findings of changes in the vegetation composition on the Cape Peninsula and the surrounding areas as indicated by Cordova et al. (2019).
Increasing precipitation and reduced rainfall seasonality resulted in a slight resurgence of forest and fynbos vegetation associated with mesic environments. Nonetheless, fire feedback loops were again key factors maintaining fynbos-forest alternate stable states. The results suggest that regardless of human disturbance which apparently altered the Orange Kloof landscape, the vegetation-climate feedback mechanism appear not to have been weakened during this time period.
The period from ~1750 to 1850 CE is the terminal phase of the LIA, during which time high precipitation is inferred from the Verloren Vlei diatom record (Stager et al., 2012). Historical documents provide information about the continuous demand for timber by the early settlers, which have resulted in extensive forest clearance (Pooley, 2009, 2018). This, undoubtedly, was a contributing factor to forest decline and the first signs of forest degeneration in the pollen record (Figure 3b). The continuing increase of human interference in Orange Kloof altered the composition of afrotemperate forests resulting in a much higher occurrence of pollen taxa associated with disturbance than in any previously analysed time interval (e.g. Kiggelaria, Figure 3b).
The increased input of pollen derived from Euclea and Searsia in sediment cores of Orange Kloof and Princess Vlei reflect a general signal of increased disturbance in the area surrounding Table Mountain which is possibly related to increased human burning activities (Figure 3b; Neumann et al., 2011).
The high demand for timber led to the introduction of pine trees and the establishment of pine plantations around Table Mountain (Pooley, 2018), and is likely reflected in the increase of Pinus pollen (Figure 3d; Cordova et al., 2019; Neumann et al., 2011), along with Quercus and other non-native plants brought to the Cape also occur for the first time, reflecting the impact of European settlers. In our record, these pollen types appear at around 1570 CE, approximately 100 years earlier than expected based on the known history of the region (Pooley, 2009, 2012, 2018), which could reflect an earlier introduction of exotic species, uncertainty in the age-depth model and/or sediment mixing.
The charcoal data from Orange Kloof is consistent with historical documents, which details how early settlers and Khoekhoen pastoralists practiced veld burning on a regular basis (Pooley, 2014), and may have further constrained forest cover in the wider Orange Kloof catchment. An increased frequency of burning and continued forest clearance might have initially facilitated the spread of ericoid fynbos vegetation. However, as anthropogenic pressure progressed, fynbos vegetation likely became more vulnerable which is more evident in the Princess Vlei record than in this study (Figure 4; Neumann et al., 2011).
Frequent burning may have played an important role in the decline of shrubby fynbos taxa and the increase in disturbed herbaceous vegetation including Brassicaceae and Poaceae (Figure 4; compare Neumann et al., 2011). There is evidence for this in the historical accounts of the impact of widespread frequent burning on fynbos vegetation which reduced the cover of shrubby, ericoid taxa (Marloth, 1924). The persistent human impact in Orange Kloof is further evident in the increase of fungal spores such as Chaetomium and Cercophora (Figure 3c; Goethals and Verschuren, 2020). The consistently high occurrence of Sordaria spores may correspond to an increase of domesticated animals as indicated by historical documents (Adamson and Salter, 1950; Opie, 1967).
The fire suppression policy of the 20th century and the resurgence of afrotemperate forest (Zone V)
In the late 19th century, charcoal values continue to be elevated, consistent with high biomass availability and frequent veld burning (Figure 4; Pooley, 2014; Wicht, 1945). The pollen signal indicates that human impact remained significant (Figures 3 and 4). However, from 1933 fires were suppressed in Orange Kloof (Campbell and Moll, 1977; Luger and Moll, 1993). This corresponds with a steady increase in afrotemperate pollen taxa (e.g. Podocarpus, Olea, Searsia; Figure 3b) and suggests the widespread resurgence of afrotemperate forest in Orange Kloof. This is in accordance with time series analyses of ground and aerial photographs of the study area, as well as modern vegetation surveys (Figure 1; Luger and Moll, 1993; McKenzie et al., 1977; Poulsen and Hoffman, 2015).
The forest assemblage for this period is diverse, with a high portion of taxa reflecting disturbance and/ or expansion (Figure 3b; Luger and Moll, 1993; McKenzie et al., 1977). As mentioned by Poulsen and Hoffman (2015), ecotone boundaries became less defined at this time, with the exclusion of fire resulting in an increase in thicket species, as indicated by increasing abundances of, for example, Searsia in the pollen record (Figure 3b).
In contrast to the interval between ~355 and ~800 CE, in the most recent interval, Cunonia capensis and Ilex mitis form a subordinate afrotemperate forest community (Figure 3b; Campbell and Moll, 1977; McKenzie et al., 1977). The construction of the Woodhead Dam in 1897 CE probably reduced the occurrence of waterlogged areas in the Orange Kloof and hence reduced areas covered with Cunonia capensis and Ilex mitis (Figure 3b).
In contrast with the increasing abundances of afrotemperate forest pollen, consistent with repeated photography and modern vegetation surveys, fynbos pollen decreased (Figures 1 and 4; Luger and Moll, 1993; McKenzie et al., 1977; Poulsen and Hoffman, 2015). These changes in vegetation are related to the steady decline in macro- and microcharcoal values, again consistent with forest expansion (Figures 3b and 4). Historical documents from this time report the rising concern over the intensive practice of veld burning, which threatened the Cape Floristic Region and, in particular the indigenous trees of the Cape Peninsula (Marloth, 1924; Pooley, 2014). The decline of charcoal values during this time frame may therefore indicate a close correspondence with the fire suppression policy implemented in the 1930s (Luger and Moll, 1993; Pooley, 2014).
The results suggest that recent forest encroachment in Orange Kloof is the result of both the ongoing suppression of fire and the resurgence after forest clearance in the 19th century. Disruption of fire regimes by fire suppression illustrates decoupling of the fire-vegetation feedback mechanisms which normally maintain forest and fynbos as alternate stable states.
Outlook and conservation implications
The palaeoecological data show that forest expansion in recent decades can be attributed to both recovery from past forest clearance and recent policies of fire suppression. Although forest extent has not exceeded the maximum values that are evident in the past c 4000 years, the recent expansion of forest cover in response to fire suppression suggests that more frequent, managed burning will be needed if further expansion is to be curtailed. A more nuanced interpretation that includes current conservation goals and future climate change scenarios is required when considering the conservation and restoration implications of our findings. First, the forest expansion recorded in Orange Kloof (from ~360 to 800 CE) was associated with more humid climatic conditions, whereas predictions for the region suggest drying and/or greater seasonality in the future. Based on the late-Holocene record presented here, a suitable reference period could be 1650 BCE to ~170 CE when asteracous fynbos associated with drier conditions was dominant and forest was restricted to wetter habitats in the study area. Further investigation of other Holocene warm periods could be used to strengthen this interpretation. Second, fynbos is megadiverse and unique to the CFR and therefore has higher conservation priority than afrotemperate forest which is relatively species poor.
Conclusion
Based on the high-resolution record presented in this study, forest-fynbos alternate stable states show a remarkable dynamism throughout the Late-Holocene. An internal reorganisation within fynbos as well as a regime shift have both been identified in the record. The internal reorganisation of fynbos (~170 CE), from an open asteraceous fynbos vegetation to a taller ericoid fynbos vegetation, was associated with increased moisture availability. An increase in forest cover and a regime shift to greater forest dominance at ~250 CE was also associated with wetter conditions. The vegetation-climate feedback was disrupted after the appearance of European settlers in 1652 CE, when, despite an increase in precipitation, fynbos expanded, while forest was cleared. As a result of increased disturbance and fire suppression, floristic composition changed in Orange Kloof in the 20th century. In light of recent climate change and predicted future drying of the Cape Peninsula, the analysis suggests that restoration targets should promote an open asteraceous fynbos vegetation with relatively restricted forested areas such as occurred during 1670 BCE and ~170 CE.
Supplemental Material
sj-docx-1-hol-10.1177_09596836231151823 – Supplemental material for Late-Holocene fynbos-forest dynamics in Orange Kloof, Table Mountain National Park, South Africa
Supplemental material, sj-docx-1-hol-10.1177_09596836231151823 for Late-Holocene fynbos-forest dynamics in Orange Kloof, Table Mountain National Park, South Africa by Sabine Prader, Lindsey Gillson, Brian M Chase and M Timm Hoffman in The Holocene
Footnotes
Acknowledgements
We thank South African National Parks for permission to undertake field work in Orange Kloof in 2021. We thank Ball, J., Julier, ACM., Steytler, J., Strahlendorf, JD. for field work assistance, Aikins, TK. and Groenewald, PA. for support for geochemical sample processing and Hess, S. for permission to use the HF-Laboratory at EGS. Britton, MN., Cramer, MD., Hawkins, HJ., Julier, ACM., Manzano, S., Quick, LJ., are acknowledged for their contribution to scientific discussions while Mashele, S. and Petersen, H. are thanked for assistance in QGIS and mapping of aerial photographs.
Data availability
The datasets produced through this research will be available at UCT’s Ziva Hub,
Funding
The author(s) disclosed receipt of the following financial support for the research, authorship, and/or publication of this article: This study was supported by NRF/Global Change Grand Challenge (SASSCAL) (Grant number 118589) and UCT’s Vice Chancellor’s Future Leaders Programme.
Supplemental material
Supplemental material for this article is available online.
References
Supplementary Material
Please find the following supplemental material available below.
For Open Access articles published under a Creative Commons License, all supplemental material carries the same license as the article it is associated with.
For non-Open Access articles published, all supplemental material carries a non-exclusive license, and permission requests for re-use of supplemental material or any part of supplemental material shall be sent directly to the copyright owner as specified in the copyright notice associated with the article.