
Abstract
Mineral dust concentrations are coupled to climate over glacial-interglacial cycles with increased dust deposition occurring during major cold phases over the last ~100 ka. Holocene records suggest considerable spatial and temporal variability in the magnitude, frequency and timing of dust peaks that reflects regional or local drivers of dust emissions and transport. Here, we present stratigraphical, geochemical and isotopic evidence for dust deposition from two high-resolution peat sequences 200 km apart in northern Scotland spanning the last c. 8200 years. εNd isotope data suggest the dominant minerogenic dust source switches between a low latitude (likely Saharan) and a high latitude, Icelandic source. Marked peaks in increased minerogenic dust deposition at: c. 5.4–5.1, 4.0–3.9, 2.8–2.6, 1.0 and 0.3 ka BP occur against a backdrop of low dust deposition during the mid-Holocene (c. 5.0–4.0 ka BP) and increased background levels of dust during the neoglacial period (<4.0 ka BP). These dust peaks coincide with periods of glacial advance in Iceland and heightened storminess in the North Atlantic. Isotope data for additional dust peaks at c. 1.0 and 0.7 ka BP and the last ~50 years suggest these reflect increased dust from the Sahara associated with aridity and land-use change in North Africa during the Late-Holocene, and modern anthropogenic sources. This work highlights the complexity of Holocene records of dust deposition in the North Atlantic and emphasises the role of dynamic sub-Polar glaciers and their meltwater systems as a significant dust source.
Introduction
Mineral dust concentration is coupled to climate over glacial-interglacial cycles (Lambert et al., 2008). Increased dust is associated with major cold phases (stadials) characterised by aridity, low terrestrial biomass, increased availability of fine sediments and strong winds at mid-latitudes (Muhs et al., 2013). This has allowed terrestrial, marine and cryospheric records of aeolian dust deposition to be used as proxies for both palaeoclimate and atmospheric transport pathways (Maher et al., 2010). While atmospheric dust concentrations have been lower during the Holocene than at the Last Glacial Maximum (28–19 ka BP), considerable fluctuations in the abundance and characteristics of deposited aeolian material have been recorded (e.g. Albani et al., 2015; Kylander et al., 2016; Vanneste et al., 2016). Holocene dust records are variable in terms of their spatial and temporal expression, and strongly reflect regional or local (rather than global) drivers such as glacier dynamics (Bullard, 2013), vegetation change (Egerer et al., 2017), proglacial geomorphology (Sugden et al., 2009), aeolian activity (Humphries et al., 2017) and anthropogenic impact (Hooper and Marx, 2018).
This paper focuses on Holocene records of minerogenic dust deposition in the North Atlantic. Mineral dust is an important part of Earth’s biogeochemical cycle and a vital source of micronutrients to marine and terrestrial ecosystems (Bullard et al., 2016; Hawkings et al., 2014). Windblown dust can travel thousands of kilometres but contemporary direct measurements indicate most is deposited within 1000 km of the source (Lawrence and Neff, 2009). The dominant source of dust to the North Atlantic is the Sahara (Ginoux et al., 2012) from which dust is transported west to the Americas or north towards western Europe (Muhs, 2013). Palaeoenvironmental records suggest mid-Holocene dust deposition in the low latitude North Atlantic and off the northwest coast of Africa was low, associated with the Mid-Holocene African Humid Period and greening of the Sahara; dust deposition then increased (NW Africa) or stabilised (equatorial Atlantic) during the Late-Holocene (e.g. Albani et al., 2015). Under present conditions, Saharan dust can reach the mid- to high latitude North Atlantic and has been recorded in Ireland, the UK, Iceland and mainland Scandinavia (Dall’Osto et al., 2004; Ryall et al., 2002; Varga et al., 2021).
Around the mid-latitude North Atlantic, increased aeolian activity recorded in sediment archives has been linked to Holocene cold periods in central Greenland and winter storminess in southern Scandinavia (Björckl and Clemmensen, 2004; Jackson et al., 2005; Kylander et al., 2016) associated with expansion of the polar vortex or intensified meridional airflow (O'Brien et al., 1995). Within these palaeo-environmental records, regional (100–1000 km) and local (<10 km) aeolian inputs typically dominate. Iceland is a contemporary major source of dust to the North Atlantic (Prospero et al., 2012) and recent accelerated retreat of Iceland’s ice caps and ongoing glacio-fluvial activity result in high dust emissions estimated at 4.6 (Groot Zwaaftink et al., 2016) to 40 Tg/year (Arnalds et al., 2016). At present Icelandic dust is transported throughout the mid- to high latitude North Atlantic and has been recorded in Svalbard (Moroni et al., 2018), Greenland (Drab et al., 2002) and Ireland (Ovadnevaite et al., 2009).
In this paper we detail the first terrestrial archive of Icelandic Holocene dust deposition in Scotland and examine linkages between mineral dust deposition, Icelandic glacier fluctuations and climate change/storminess in the North Atlantic. We hypothesise that the quantity and distribution of Icelandic dust emissions is likely to have fluctuated during the Holocene in parallel with (or in response to) glacial activity. Modelling and air-parcel trajectory analysis indicate clear dust transport pathways from Iceland to northern Scotland (Baddock et al., 2017; Groot Zwaaftink et al., 2016) where the climate is strongly influenced by North Atlantic storms driven by the seasonal position of the polar front jet stream. There are extensive areas of peat in northern Scotland from which continuous and sensitive indicators of dust load and dust source, alongside climate proxy data, can be extracted and analysis of these peat records is used to test our hypothesis. Icelandic tephras have also been identified in Scotland’s peat bogs and provide important chronological marker horizons (Dugmore et al., 1995).
Methods
The minerogenic aeolian dust record was isolated in two peat profiles, where fluvial sediment inputs were topographically excluded, and local accumulation solely comprised of organic matter (Figure 1). The Shebster mire (N58°33″06.6″, W003°42″39.0″, altitude 82 m) is located in northern Caithness and underlain by Middle Devonian sandstone of the Bighouse Formation (Auton et al., 2005). Kedills Mire (N60°41″12.8″, W001°02″52.8″, altitude 67 m) is a blanket mire on the island of Yell, Shetland underlain by Moine psammite (metamorphosed sandstone and siltstone).
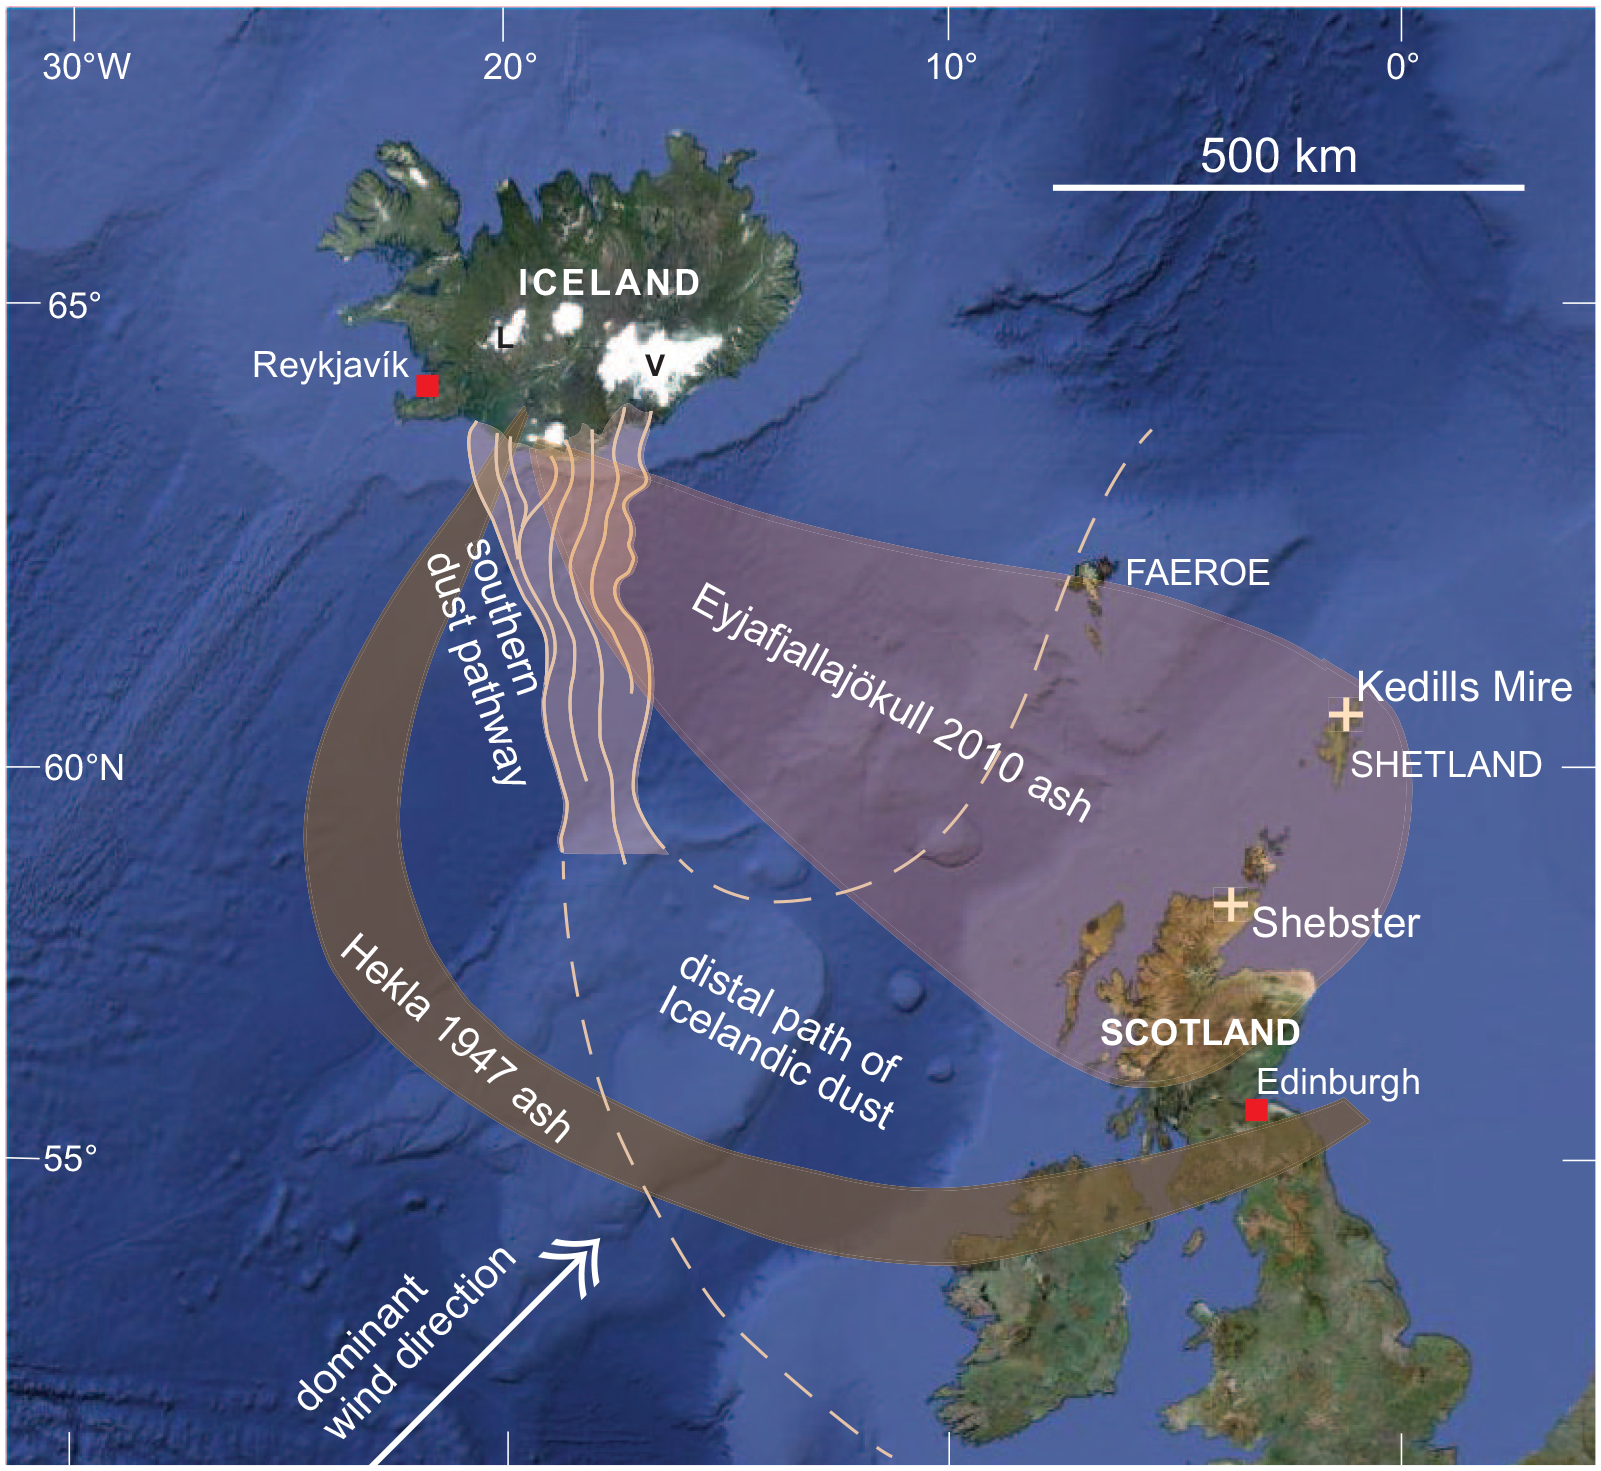
Map of NE Atlantic region showing location of field sites in northern Scotland (Shebster and Kedills Mire), major dust pathways and recent volcanic ash pathways from Iceland (Prospero et al., 2012). Base map imagery: Google Maps.
Continuous peat cores (to 6.08 m depth at Shebster and 4.26 m depth at Kedills Mire) were sampled using a 1 m, 75 mm diameter, Russian D-section corer (Jowsey, 1966) and aligned by depth from the surface datum. Cores were sealed in lay-flat tubing and stored at a constant 4°C. Contiguous 2 cm3 samples were acid digested to isolate the minerogenic material (Dugmore et al., 1992) which was analysed using an Olympus BX43 light microscope at 400× magnification.
Atmospheric dust comprises particles deflated from a surface that travel by suspension and may include mineral particles and resuspended volcanic ash as well as other natural and anthropogenic particles (Pye, 1987). Icelandic aeolian sediments are known to include both glacio-fluvial material and resuspension of material deposited following volcanic eruptions (Arnalds et al., 2016). To investigate the relationship between glacial activity and dust emissions we excluded deposits associated with direct volcanic emissions. The mineral dust residue was classified visually by its morphological characteristics and its abundance was measured using a quantitative percentage-based score (Terry and Chilinger, 1995). Particle-size analysis using a Beckman-Coulter LS280 shows 59%–100% of mineral particles (by volume) are <20 μm diameter which is consistent with long distance atmospheric transport (Stuut and Prins, 2014) although larger particles can also be transported considerable distances (Varga et al., 2021). Cryptotephra layers were identified during analysis of the mineral residue based on morphology, vesicularity and isotropism of glass shards under plane-polarised light. In Scotland cryptotephra layers are extremely thin and unlikely to be locally remobilized on a peat bog. Tephra layers were identified by the peak concentration of the glass component, geochemically identified to a specific Icelandic eruption (Dugmore et al., 1995) and used as isochrones. We can not fully separate tephra minerals from mineral dust but excluded volcanic glass from the measurements of dust abundance to ensure the peak in mineral dust layers could not be caused by tephra. This approach is likely to underestimate total dust deposition. The major element geochemical composition of each tephra sample was categorised by electron microprobe analysis using the SX100 Cameca Electron Microprobe at The University of Edinburgh (Hayward, 2012). A minimum of 10 tephra shards were analysed to provide a representative geochemical signature (Hunt and Hill, 1993). Correlation of the cryptotephra layers to previously dated volcanic eruptions was facilitated by TephraBase (Newton, 1996).
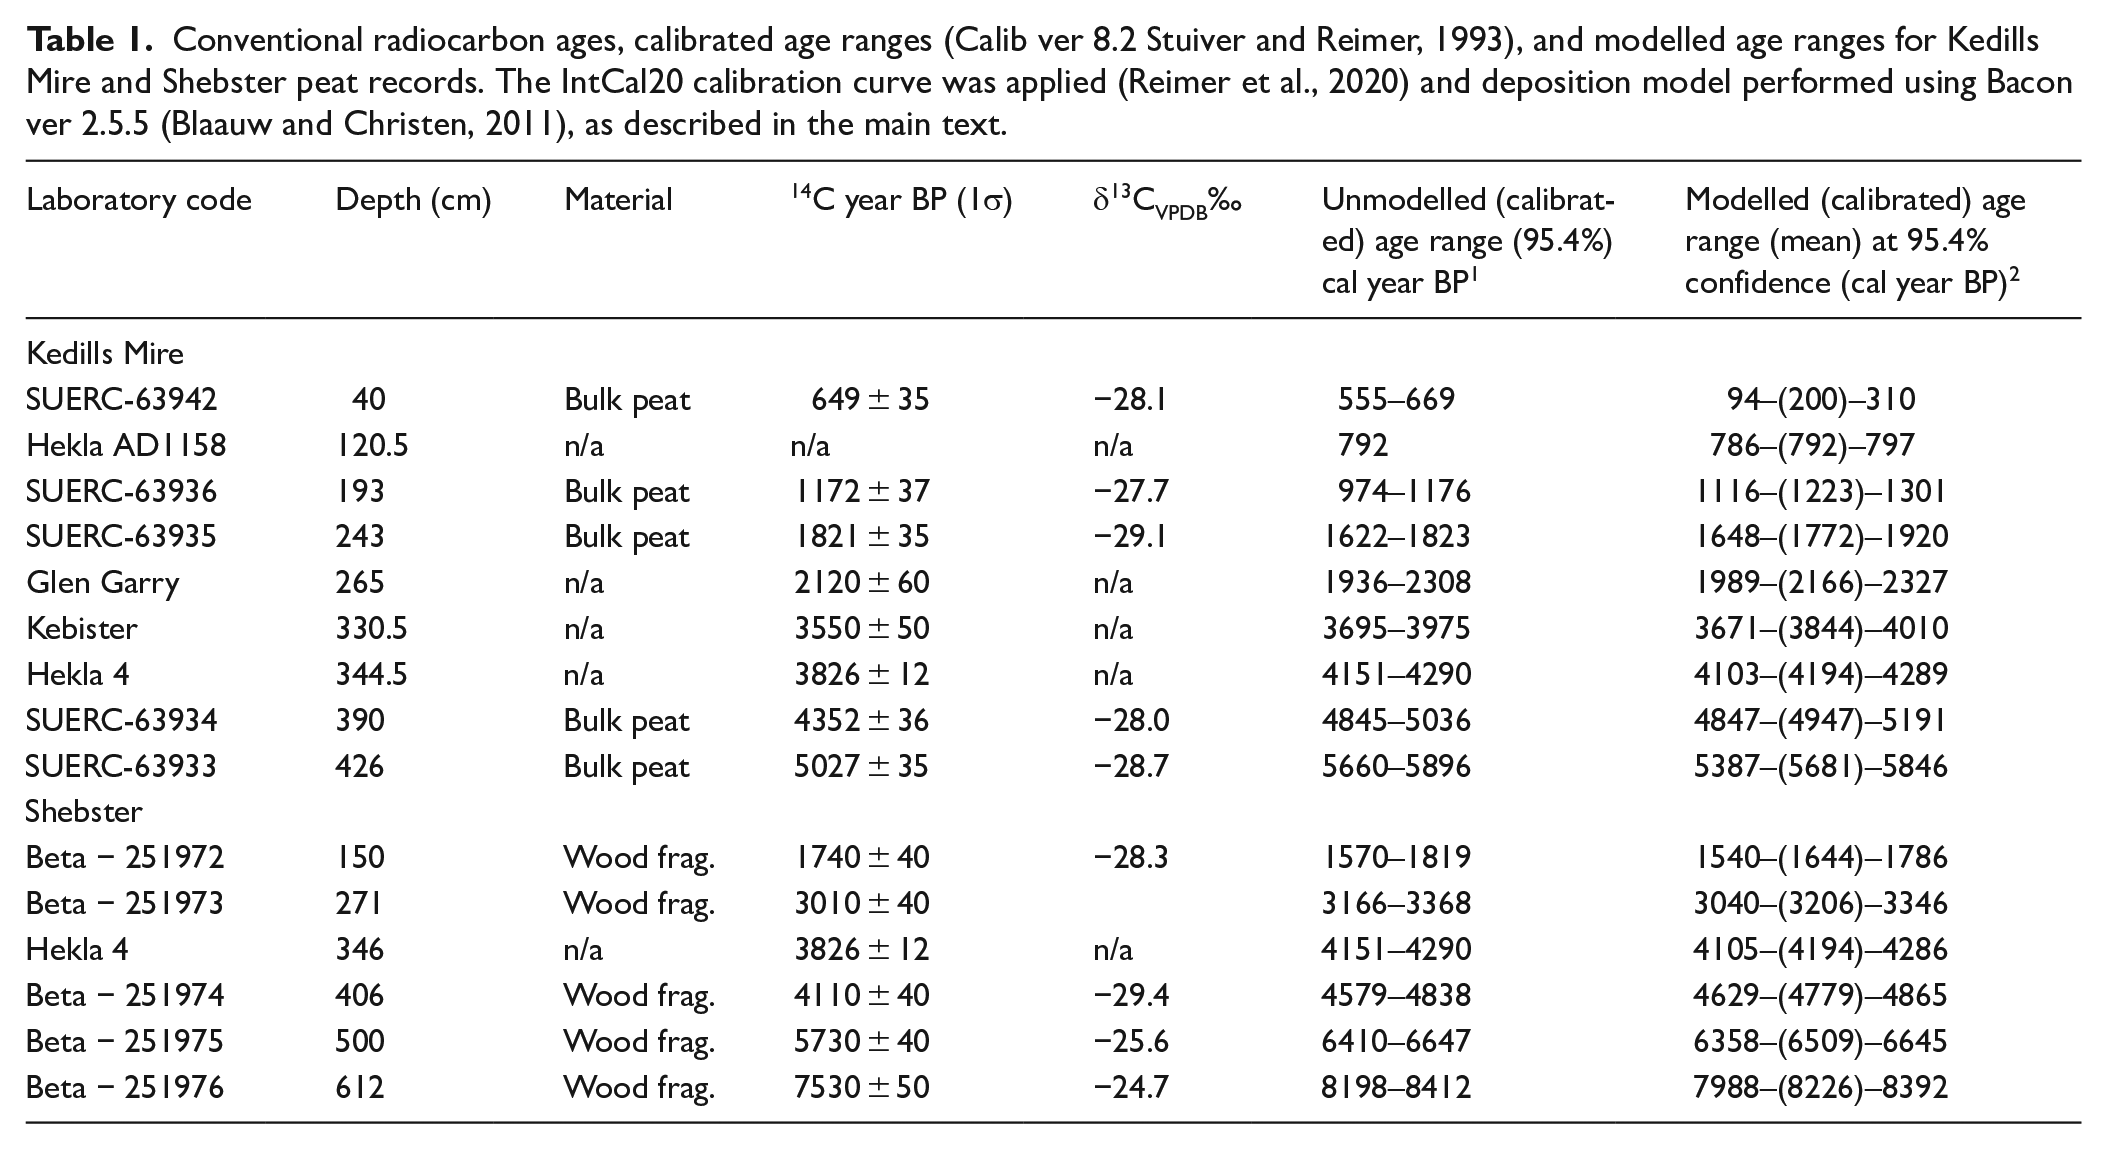
Five samples from the Shebster core were radiocarbon dated using Accelerated Mass Spectrometry (AMS) and supplemented by the identification of the Hekla 4 tephra layer. Five samples were AMS dated from the Kedills Mire core and supplemented by the Hekla 4, Kebister, Glen Garry and Hekla 1158 tephra layers. Calibrated Bayesian age-depth models are used to constrain both dust records using Bacon (Blaauw and Christen, 2011) and the IntCal20 radiocarbon calibration curve (Reimer et al., 2020) (Table 1).
Conventional radiocarbon ages, calibrated age ranges (Calib ver 8.2 Stuiver and Reimer, 1993), and modelled age ranges for Kedills Mire and Shebster peat records. The IntCal20 calibration curve was applied (Reimer et al., 2020) and deposition model performed using Bacon ver 2.5.5 (Blaauw and Christen, 2011), as described in the main text.
The Earth’s crust and mantle have distinct ranges of isotopic ratios owing to their different mineral assemblages. Iceland almost exclusively comprises young volcanic rocks and has a strong geochemical signature from the upper mantle with relatively low ⁸⁷Sr/⁸⁶Sr ratios. Scotland is geologically much older, formed predominantly of terrane fragments of continental crust with higher 87Sr/86Sr ratios (Banner, 2004). To identify the provenance of dust peaks in the cores radiogenic isotope analysis was conducted at the Geochronology and Tracers Facility (formerly part of the NERC Isotope Geosciences Laboratory), British Geological Survey, Keyworth. Strontium (87Sr/86Sr) and neodymium (εNd) isotope composition was measured using a Thermo Scientific Triton thermal ionisation mass spectrometer, and a Thermo Scientific Neptune + plasma ionisation mass spectrometer, respectively. Strontium data were obtained for both cores. However, neodymium data could only be obtained for the Kedills Mire core as concentrations were too low to be measured in the Shebster core (Supplemental Table S1. Detailed analytical methods are presented in supplementary material).
Results and discussion
We compared the radiogenic isotope data from Kedills Mire to potential dust sources in Iceland, North Africa and China, local Shetland basement rock and other dust isotope records (Figure 2). The 87Sr/86Sr and εNd isotope data plot on an unusual trend, with εNd values ranging from −6.90 to +4.87 at a high, near constant 87Sr/86Sr value of c. 0.72. This trend cannot be explained simply by mixing of dust derived from available geological sources and must involve a process leading to an increase in the radiogenic Sr component. Jung et al. (2004) and Garçon et al. (2014) discuss the effects of mineralogical sorting and grain size issues on 87Sr/86Sr ratios (finer-grained fractions have higher 87Sr/86Sr values) as well as the effect of weathering (materials subjected to higher degrees of chemical weathering have lower 87Sr/86Sr values). It is likely that the observed Sr-isotope compositions reflect transport of fine-grained material in an aeolian environment. The samples analysed, which span multiple years, are likely to reflect mixed inputs at the decadal scale but dominant regional sources can be identified associated with particular time periods (Figures 2 and 3). We interpret samples from Kedills Mire with positive εNd values as dominated by an Icelandic isotopic signature, suggesting episodic periods of higher dust load in the North Atlantic related to climate-driven environmental changes.
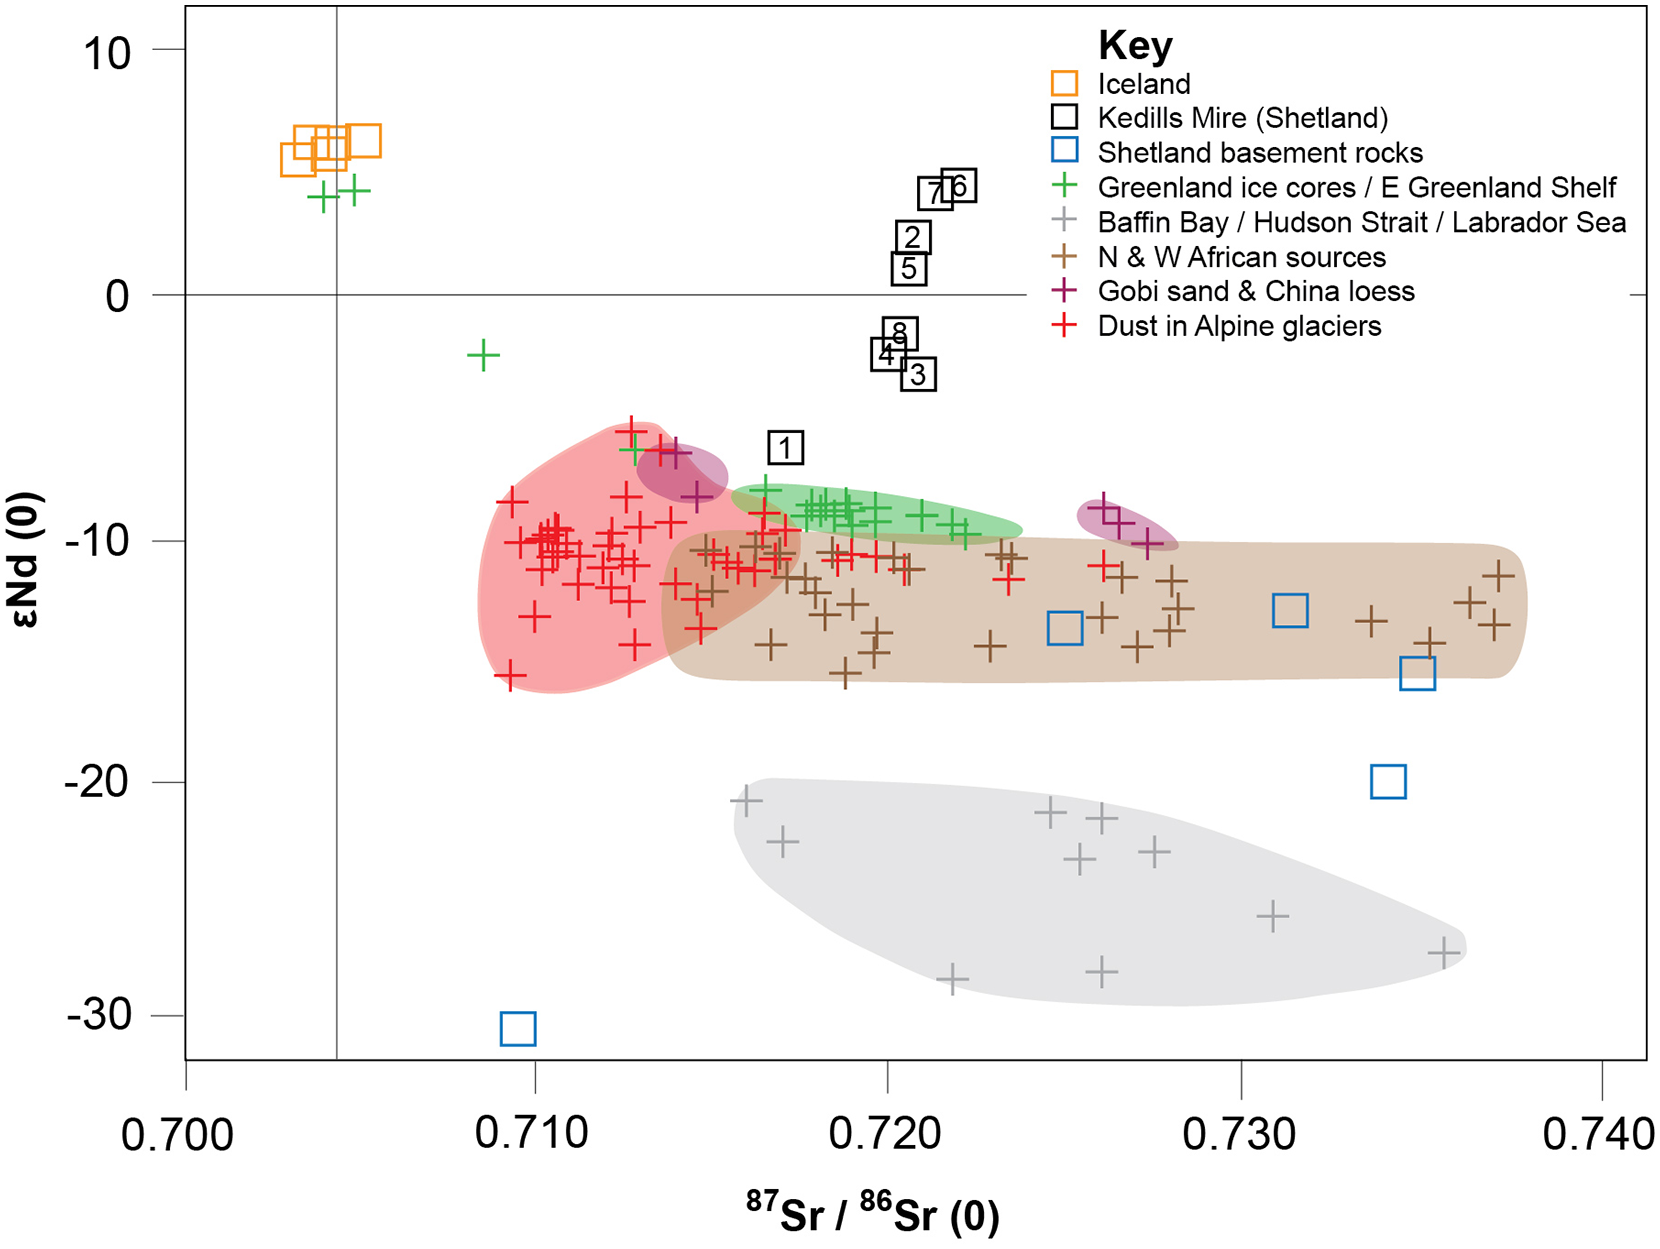
Sr and Nd isotopic data for Iceland (Farmer et al., 2003 and this study), Kedills Mires (numbered points correspond to the sampled dust peaks in Figure 3) and Shetland base rocks (Walker et al., 2016). The isotopic signatures of other regional dust sources are taken from Thevenon et al. (2012). Uncertainties on the new data are smaller than the plotted datapoints, and are as follows: 87Sr/86Sr: ±0.000043, Epsilon Nd: ±0.3 (both 2 SD).
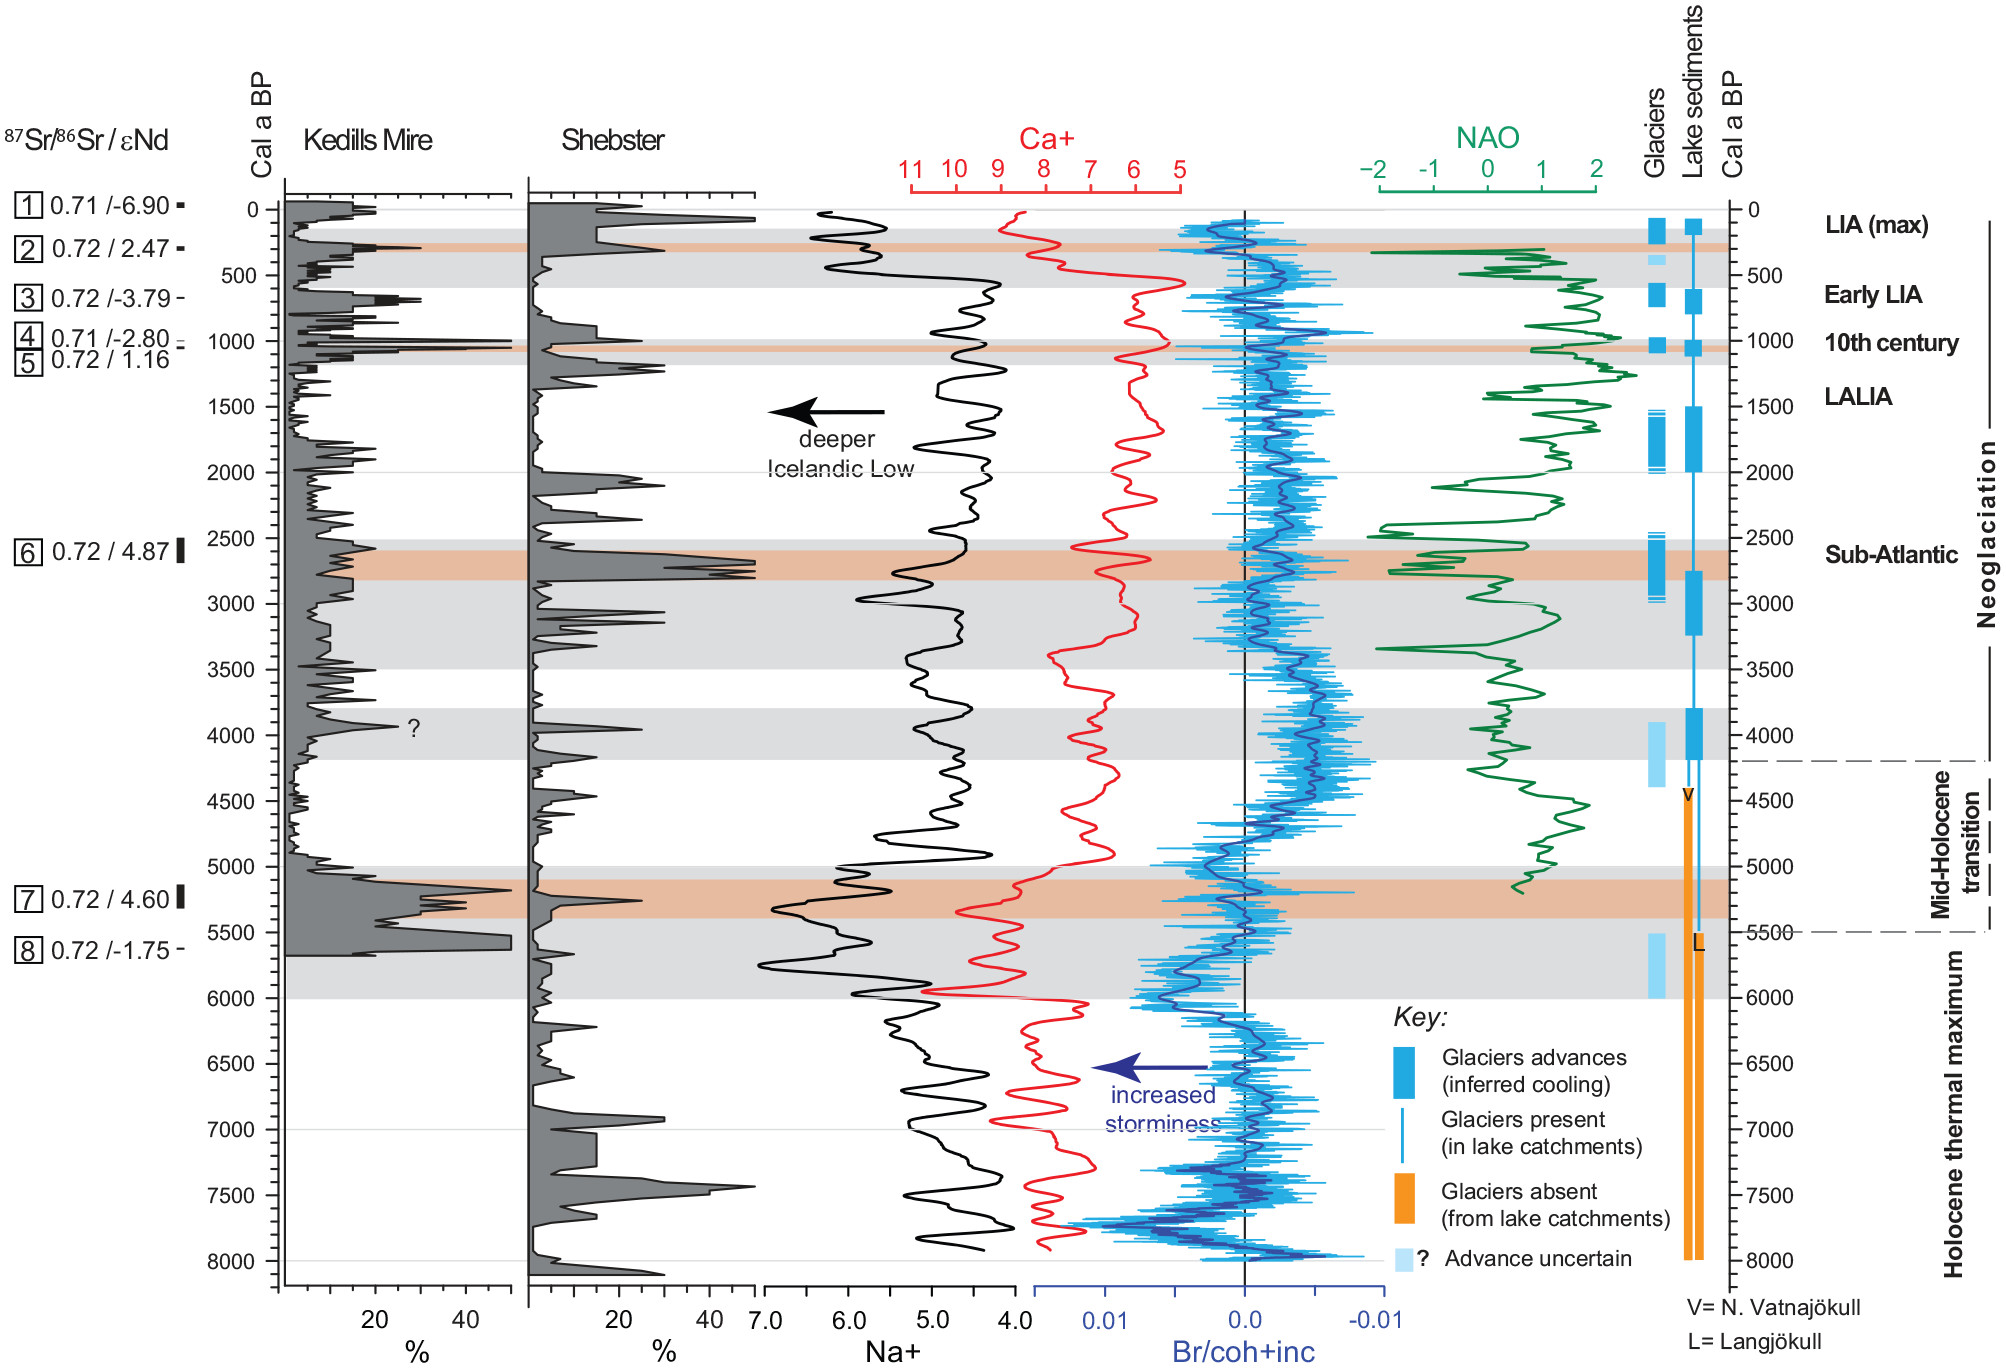
Dust abundance estimates from Kedills Mire (Shetland) and Shebster (Caithness) alongside: Na+ (sea salt) and Ca + (dust) from the GISP2 Greenland ice core. Increased levels of Na+ and Ca+ are associated with periods of more intense and expanded polar circulation and deepening of the Icelandic low (i.e. generally colder intervals) (Mayewski, 1999); Bromine record from Shebster as a proxy for storminess (Stewart et al., 2017); reconstructed 5000-year NAO index based on a lake-sediment core in SW Greenland (Olsen et al., 2012); periods of Holocene glacier advance in southern-central Iceland. Glacial records are compiled from (LIA = Little Ice Age, LALIA = Late Antique Little Ice Age): Dugmore and Sugden (2008), Gudmundsson (1997), Kirkbride and Dugmore (2001, 2006), Schomacker et al. (2012), Geirsdóttir et al. (2009), Ingólfsson Norðdahl and Schomacker (2010), Hannesdóttir et al. (2015) Lake records are compiled from Geirsdóttir et al. (2007), Larsen et al. (2011, 2012), Striberger et al. (2012). The Kedill Mire dust events that have a positive Nd signature are highlighted by brown shaded bars. Periods of rapid climate change (RCC) (Mayewski et al., 2004) are indicated by grey shaded bars.
The stratigraphic analyses of dust abundance at the two sites show distinct episodes of higher (peak) dust deposition separated by longer periods of reduced dust input (Figure 3).
The basal peak in dust at Shebster (c. 8.1 ka) coincides with the end of a period of regional rapid climate change (RCC) between c. 9.0 and 8.0 ka (Mayewski et al., 2004). However, we cannot exclude mixing from the underlying minerogenic lacustrine sediment into the lowermost basal peat layers and so this event is treated with caution. There is a period of sustained higher dust input at Shebster, between c. 7.7 and 6.9 ka. The absence of radiogenic isotopic data prevents identification of the source of this dust peak. However, this is a quiescent period during the Holocene thermal maximum, with Icelandic glaciers probably at their minimum extent, making an Icelandic source unlikely. Coinciding with the African Humid Period, this dust peak is also unlikely to originate from the Sahara, although it is broadly contemporaneous with a major dust peak in central Europe (Le Roux et al., 2012) suggesting a third, as yet unidentified regional source of dust at this time.
There is a very large and sustained period of dust deposition at Kedills Mire between c. 5.4 and 5.1 ka. The basal dust (c. 5.7–5.5 ka) may have been derived from local substrate, indicated by the negative εNd value (−1.75). However, the large dust peak at Kedills Mire between c. 5.4 and 5.1 ka yielded a positive εNd value (4.60) and coincides with an increase in Na+ (deepening of the Icelandic low) and Ca+ (increased dust flux) in the GISP2 Greenland ice core and a phase of increased North Atlantic storminess (Stewart et al., 2017). The dust peak recorded at Shebster at c. 5.2 ka is smaller in magnitude and duration and may reflect the different trajectories of dust coming from the north (Baddock et al., 2017). Icelandic glacier and lake sediment records (Figure 3) suggest this period of increased dust deposition occurred at the start of the mid-Holocene transition which ushered in the onset of Neoglaciation in Iceland and elsewhere. Mountain glaciers in central and southern Iceland grew, coalescing to form embryonic ice caps, as the regional snowline descended between c. 5.5and 5.0 ka (Geirsdóttir et al., 2009; Kirkbride and Dugmore, 2006). This accords with other regional records suggesting this time interval was a period of RCC more widely in the Northern Hemisphere (Mayewski et al., 2004). We note the likelihood that most evidence for renewed ‘neoglaciation’ has not been preserved in the Icelandic glacial landform record owing to removal or censure by subsequent erosional (glacial and fluvial) events.
During a quiescent period lasting approximately 1000 years, between c. 5.0 and 4.0 ka, low dust deposition is recorded in both peat cores and coincides with a prolonged period of positive NAO and reduced North Atlantic storminess during the second half of the mid-Holocene transition (Stewart et al., 2017). At Kedills Mire this period is ended by a brief dust peak at c. 4.0–3.9 ka followed by a sustained rise in background dust levels between c. 4.0 and 1.8 ka punctuated by numerous short dust peaks. At Shebster a significant dust peak is also recorded at c. 4.0–3.9 ka but this manifests as a brief interruption to the Mid-Holocene quiescent phase which continues to c. 3.4 ka. The c. 4.0–3.9 ka event was too short for radiogenic isotopic analysis, but it coincides with a phase of RCC, deepening Icelandic low and a wider signature of Icelandic glacier growth as neoglaciation continued. Hereafter, the dust records at Kedills Mire and, to a lesser degree, Shebster are characterised by higher background levels of dust and a greater frequency of dust peaks in both cores.
The largest sustained dust peak recorded at Shebster at c. 2.8–2.6 ka occurs during the latter part of a RCC period between c. 3.5 and 2.5 ka (Mayewski et al., 2004). There is a comcomitant increase in dust at Kedills Mire, but not of the same magnitude, and the associated εNd value is the highest (i.e. most similar to Iceland) for the whole record (4.87). Icelandic glaciers advanced significantly between c. 3.0 and 2.5 ka, some reaching their Holocene maxima (Geirsdóttir et al., 2009). This coincided with a sustained shift to a negative NAO index (Olsen et al., 2012), although the GISP2 Na+ and Ca+ curves do not record marked changes in North Atlantic atmospheric pressure systems (Mayewski, 1999).
A ~500-year quiescent period occurs in the Kedills Mire record between c. 1.8 and 1.3 ka, with minimal dust deposition at both sites coinciding with reduced North Atlantic storminess, a benign Icelandic Low (in GISP2 data) and a generally neutral NAO index. We relate this period of low dust flux to the centuries between the Roman Warm Period (c. 2.3 and 2.0 ka) and Mediaeval Climate Anomaly (1.2–0.7 ka) (Patterson et al., 2010) when Iceland’s glaciers were significantly smaller than in the proceeding millennium and atmospheric circulation was generally stable across northern Europe (Geirsdóttir et al., 2009).
Between c. 1.2 ka and present there is an increase in the frequency and magnitude of dust peaks recorded at Kedills Mire and Shebster. Dust peaks at c. 1.1 and 0.3 ka (at Kedills Mire) coincide with periods of RCC and significant glacier fluctuations in Iceland during the 10th Century and Little Ice Age (LIA). These dust peaks also have positive εNd values (i.e. more Icelandic). However, there are peaks that occur outside of the RCC periods (c. 1.0 and 0.7 ka) with negative εNd values, resulting in a marked switch from a positive to negative εNd values in less than ~100 years. We suggest that this variability reflects the high-frequency, high-amplitude, possibly high-seasonality, climatic changes experienced in the North Atlantic region during the last 1.5 ka (Hernández et al., 2020; Patterson et al., 2010). The dust record at Shebster remains high during the LIA and into the 20th century but the uppermost dust peak at Kedills Mire (mid-20th century to present day) has the most negative εNd value of the entire record which probably reflects 20th century anthropogenic environmental change and a variety of dust sources (Fagel et al., 2014).
Conclusion
Iceland is a substantial source of mineral dust to the North Atlantic which could play an important role in ocean fertilisation and enhanced marine productivity. This paper reconstructs the Holocene dust deposition records from two peat bogs in northern Scotland 200 km apart and demonstrates that the mineral dust originates from both low-latitude, probably Saharan, and high-latitude, probably Icelandic, sources. Our well-dated record indicates that during the mid-Holocene climate transition and neoglacial periods (centred c. 5.2 and 2.7 ka respectively) the dominant dust source was Iceland, with dust peaks reflecting periods of glacier expansion, driven by climate change, and borne by strong North Atlantic winds. From c. 1.1 ka onwards the frequency of dust peaks increases, with the dominant source switching from the Sahara (c. 1.0–0.6 ka) to Iceland since c. 0.3 ka in response to renewed Little Ice Age glaciation and a more vigorous Icelandic Low-pressure system. Finally, modern (mid-20th century onwards) mineral dust deposition may reflect anthropogenic activity from a range of different sources.
Supplemental Material
sj-docx-1-hol-10.1177_09596836221131697 – Supplemental material for Increased North Atlantic dust deposition linked to Holocene Icelandic glacier fluctuations
Supplemental material, sj-docx-1-hol-10.1177_09596836221131697 for Increased North Atlantic dust deposition linked to Holocene Icelandic glacier fluctuations by Helena Stewart, Tom Bradwell, Joanna Bullard, Robert D McCulloch and Ian Millar in The Holocene
Supplemental Material
sj-pdf-3-hol-10.1177_09596836221131697 – Supplemental material for Increased North Atlantic dust deposition linked to Holocene Icelandic glacier fluctuations
Supplemental material, sj-pdf-3-hol-10.1177_09596836221131697 for Increased North Atlantic dust deposition linked to Holocene Icelandic glacier fluctuations by Helena Stewart, Tom Bradwell, Joanna Bullard, Robert D McCulloch and Ian Millar in The Holocene
Supplemental Material
sj-xlsx-2-hol-10.1177_09596836221131697 – Supplemental material for Increased North Atlantic dust deposition linked to Holocene Icelandic glacier fluctuations
Supplemental material, sj-xlsx-2-hol-10.1177_09596836221131697 for Increased North Atlantic dust deposition linked to Holocene Icelandic glacier fluctuations by Helena Stewart, Tom Bradwell, Joanna Bullard, Robert D McCulloch and Ian Millar in The Holocene
Footnotes
Acknowledgements
We would like to thank Dr Andrew Finlayson, Dr Nicholas Golledge, Dr Mary McCulloch, Natasha Rolph and James Blaikie for valuable assistance in the field.
Funding
The author(s) disclosed receipt of the following financial support for the research, authorship, and/or publication of this article: HS was supported by a NERC-BUFI – University of Stirling joint studentship (NE/K501156/1). RMcC is supported by ANID R20F0002 (PATSER). The Natural Environmental Research Council Radiocarbon Facility (SUERC) provided radiocarbon support: 1879.0415 and the authors would particularly like to thank Dr Pauline Gulliver for her help in the processing of the radiocarbon samples.
Supplemental material
Supplemental material for this article is available online.
References
Supplementary Material
Please find the following supplemental material available below.
For Open Access articles published under a Creative Commons License, all supplemental material carries the same license as the article it is associated with.
For non-Open Access articles published, all supplemental material carries a non-exclusive license, and permission requests for re-use of supplemental material or any part of supplemental material shall be sent directly to the copyright owner as specified in the copyright notice associated with the article.