
Abstract
Glacier forelands provide important sites to study climate-forced ecological succession because a chronosequence is apparent along a single valley. However, most studies of invertebrate succession in forelands provide a single snapshot of community assemblage patterns. With glaciers retreating rapidly worldwide, it is important to begin re-surveying community composition and assessing changes in relation to new terrain revealed by the retreating ice. In this study, we repeat a survey of spiders and beetles along the glacier foreland of the sub-alpine glacier Austerdalsbreen in western Norway, 15 years after an initial assessment in 2004, during which time the glacier has retreated 400 m. Invertebrates were sampled in 18 sites that represent a terrain age gradient of approximately 10–250 years since glacier recession. Forty spider species and 70 beetle species were identified, constituting the richest record in Nordic glacier forelands for these two taxonomic groups. Furthermore, three distinctive stages of succession were determined using TWINSPAN and NMDS: (1) a pioneer colonizer stage; (2) an intermediate successional stage; and (3) two late colonizer stages. Additionally, a species group of omnipresent species was identified. The transition from pioneer stage to early succession was characterized by a high degree of taxonomic replacement. Compared to the findings in 2004, we found that the composition of species groups on relatively old terrain is becoming more similar, while the differences between the species groups on the younger terrain are widening. This discrepancy is discussed in relation to climate warming, which potentially facilitates faster establishment of vegetation and early successional invertebrates and may therefore increase competition stress for cold-adapted pioneer species.
Introduction
Glaciers worldwide have been receding since the neoglacial maximum advancement at the end of the Little Ice Age (Grove, 2012), leaving behind a sequence of moraine deposits of increasing terrain age with distance from the glacier front (Matthews, 1992). These so-called chronosequences are useful natural experimental sites to study the colonization patterns of plants and arthropods to develop our understanding of ecological succession and ecosystem development (Ficetola et al., 2021; Hågvar, 2012; Matthews, 1992; Walker and del Moral, 2003). With contemporary climate warming becoming more pronounced in recent decades, especially in high altitudinal and latitudinal regions, the corresponding accelerated rate of glacier recession provides exciting opportunities to study the implications for species communities in these temperature-sensitive ecosystems (Ficetola et al., 2021; Godone, 2017; Parmesan, 2006). In this study, we demonstrate this by re-surveying the foreland of a receding glacier in western Norway and investigate changes in arthropod succession over a 15-year period.
Invertebrate succession of glacier forelands tends to begin immediately after a glacier releases new terrain (Gereben-Krenn et al., 2011; Hodkinson et al., 2004). Studies from across Europe show that carnivorous species and springtails (Collembola) adapted to open ground habitats colonize new terrain first, followed by other functional groups 50–100 years later as soil and vegetation develops (Brambilla and Gobbi, 2014; Hågvar, 2010; Hågvar et al., 2020; Hågvar and Gobbi, 2022; Raso et al., 2014; Vater and Matthews, 2015). Species composition at later stages often follows a relatively predictable gradient of terrain age, distance from glacier, and vegetation succession (Hågvar, 2012). However, recent research distinguishes between two models of succession. The “replacement-model” suggests that distinct communities replace earlier groups with increasing terrain age and changing environmental conditions. Alternatively, the “addition and persistence model” predicts early colonizers persisting along the forelands beyond the youngest terrain, and new species added with terrain age, suggesting facilitation and dispersal ability as the driving biotic interaction, rather than competition (Moret et al., 2020; Vater, 2012). Replacement changes are most evident for invertebrate succession in the Alps and are common in plant succession (Erschbamer and Caccianiga, 2017; Kaufmann, 2001). However, glacier forelands of peripheral mountain ranges show evidence of pioneer species persistence (Tampucci et al., 2015), and Norwegian glaciers at higher altitudes show more evidence for the addition and persistence model (Vater and Matthews, 2015). Nevertheless, with climate warming, competition is suspected to increase, particularly during early succession stages, potentially altering colonization dynamics (Lancaster et al., 2017). As previous studies of invertebrate succession provide mostly snapshots of these processes from a single survey, studies that frequently follow succession at finer timescales are needed to provide greater insight into the impact of rapidly shrinking glaciers and can also help to test current theories of arthropod succession (Kaufmann, 2002).
In addition to revealing new terrain, the rapid retreat of glaciers is likely to reduce the influence of the ice on glacier foreland ecosystems via changes to local climatic conditions (Rosero et al., 2021). Typically, glacier forelands are cooler than their surroundings, but a reduction of ice extent may homogenize conditions and alter successional processes (Pearson et al., 2020). Kaufmann (2002) predicted increased colonization velocity of pioneer arthropods after glacier recession with warmer temperatures in the Austrian Alps compared to the long-term trend, which Fickert et al. (2017) reported for plants. While these studies did not report changes in species composition, Brambilla and Gobbi (2014) and Gobbi et al. (2006) linked a sudden community composition change in later successional stages in the Italian Alps with delayed responses of arthropods to climatic change. With such rapid changes to glaciers and local climate, repeated surveys of glacial forelands are required to follow and predict the consequences for pioneer communities, particularly if their niche is likely to shrink in future decades (Cauvy-Fraunié and Dangles, 2019). Furthermore, data are required to test predictions that glacier forelands might act as warm-stage refugia for cold-adapted species (Rosero et al., 2021; Tampucci, 2016), and that warmer conditions will lead to local extinctions of pioneer species (Cannone et al., 2008; Cauvy-Fraunié and Dangles, 2019).
This study aims to address the need for repeated surveys along chronosequence ecosystems, by resampling the foreland of the sub-alpine glacier Austerdalsbreen in western Norway. A survey was originally carried out in 2004 by Vater and Matthews (2015), showing a complex three-stage invertebrate succession. In the 15 years between that survey and our study, Austerdalsbreen has retreated by 444 m, and has revealed new pioneer habitats (NVE, 2021). Therefore, we aimed to describe the community of this new area and compare the indicative species communities with the 2004 study to assess changes at the four defined chronosequence zones. We hypothesized that:
a. the new pioneer zone would resemble that of Vater and Matthews (2015), with pioneer species colonizing the recently disturbed habitat;
b. the old pioneer zone from 2004 would exhibit signs of accelerated succession, with species from later zones colonizing, leading to an overall higher diversity; and
c. the arthropod communities of the foreland would exhibit signs of homogenization, in line with studies on plants (Cannone and Piccinelli, 2021; Rydgren et al., 2014), to the extent that species groups are less indicative of chronosequence zones than they were 15 years ago.
Methods
Study site
Austerdalsbreen (61°35′12″N; 6°59′54″E) is a south-eastern outlet glacier of Jostedalsbreen Ice Cap in western Norway, covering an area of 19.38 km² (NVE, 2021; Figure 1). The glacier receded approximately 3.5 km since the maximum neoglacial advancement in the late 18th century and exposed a foreland in a typical U-shaped glacier valley designated biogeographically to the sub-alpine birch belt (Robbins and Matthews, 2014). Altitude ranges from 312 m a.s.l at the glacier foreland boundary to 385 m a.s.l at the glacier front. The bedrock is composed of gneiss with a layer of alluvial glacier till or glaciofluvial sediments on top. During the Holocene climatic optimum, Austerdalsbreen and all Jostedalsbreen were most likely completely melted (approximately 8000–5000 BP; Nesje et al., 2008). Afterward during the Neoglaciation, the ice cap re-established with periodical fluctuations (Nesje et al., 2008). Using lichenometric measurements, Bickerton and Matthews (1993) and Winkler (2021) have dated the maximum Little Ice Age moraine to 1786 and 1760–1765, respectively. Since the Little Ice Age maximum, Austerdalsbreen has undergone overall recession with short periods of frontal stagnation or re-advancement (NVE, 2021), which is evident by a series of distinct moraine ridges in the glacier foreland. The latest glacier advance, called the Briksdalsbre Event, occurred in the 1990s as a consequence of decadal increase in winter precipitation (Nesje and Matthews, 2012). Carrivick et al. (2022) have estimated that between the Little Ice Age maximum and 2006, the area of Austerdalsbreen decreased from 30.4 km2 to 19.8 km2 (35%) while the volume of ice decreased from 4.6 km3 to 3.2 km3 (31%). Since 2006, the glacier recession and thinning have accelerated even further.
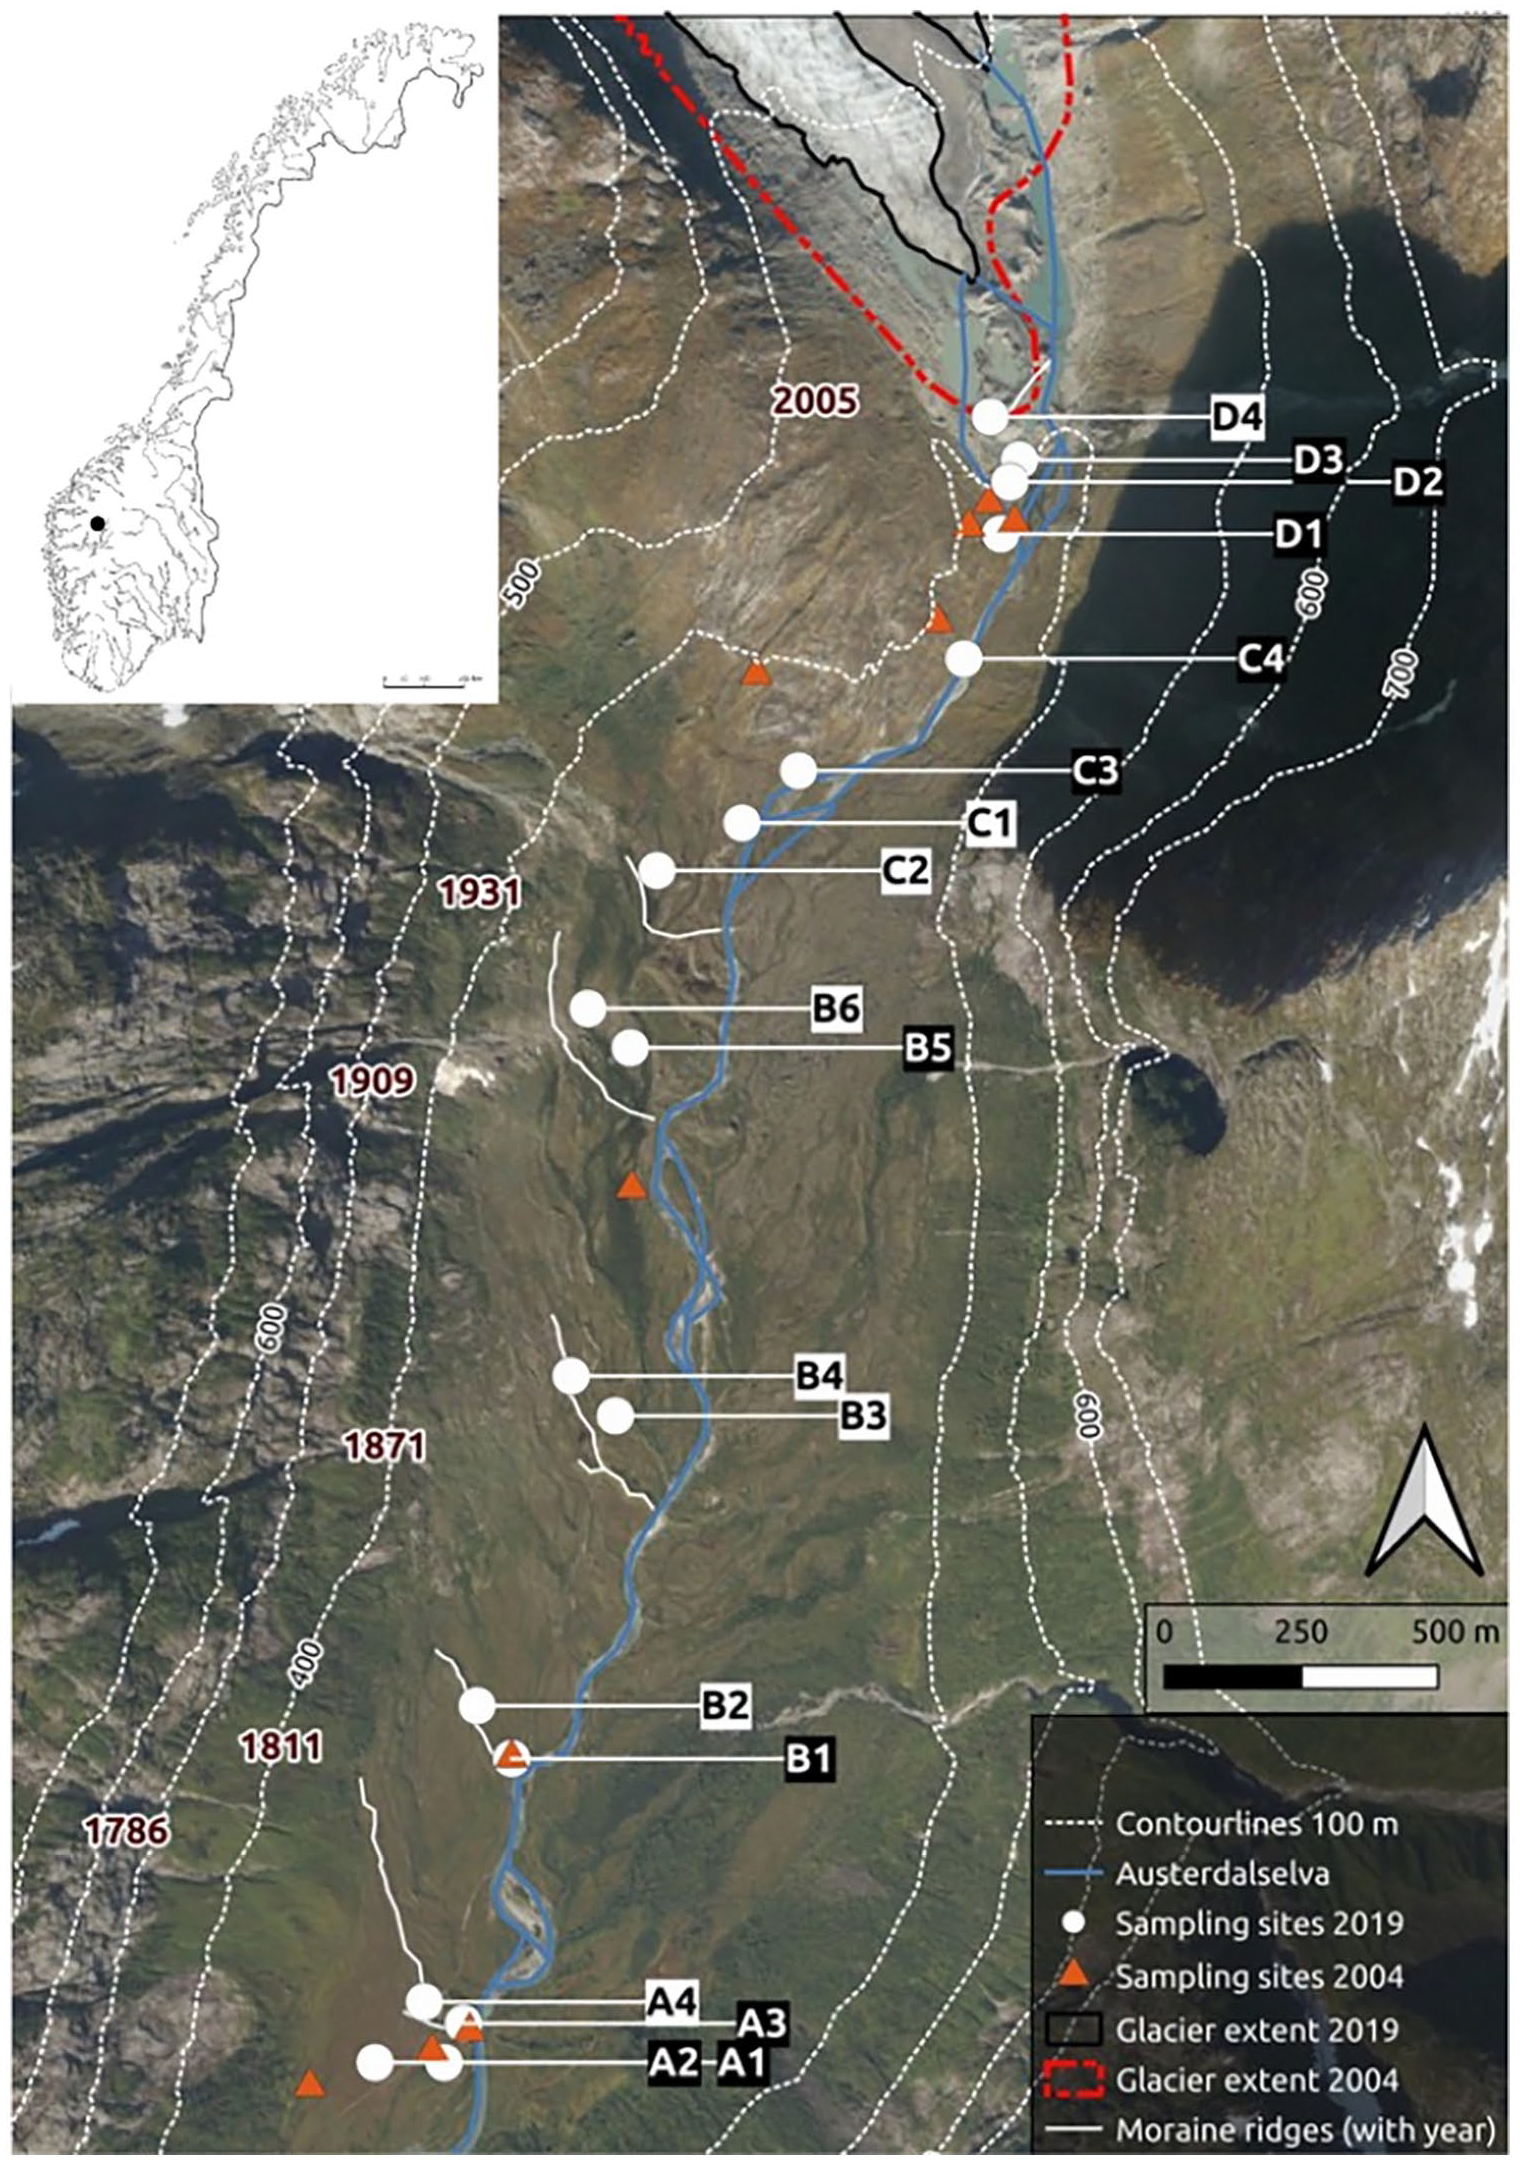
Map of the study site showing glacier positions in 2019 (solid black line) and 2004 (broken red line). Six dated moraine ridges are shown as orientation for sampling site positions (year of deposition on the left site of the figure). Sampling sites of 2019 (white dots) are labeled in relation to terrain age zone (a–d). Labels of the sampling sites used in July 2019 with black background. Approximate sampling sites of 2004 are displayed as triangles. Upper left corner: position within Norway. (Background image: © Statens kartverk, Geovekst og kommunene, “Norge i bilder”).
The climate at the study site is relatively wet and mild compared to glaciers found in alpine environments due to oceanic influence and low altitude (Winkler et al., 2009). The mean annual air temperature is 3.7°C for the normal period of 1961–1990, with a maximum monthly mean in July of 13.4°C and a minimum monthly mean in January of −4.9°C (Aune, 1993), measured in Bjørkhaug (324 m a.s.l., active between 1964 and 2004), approximately 15 km to the west of Austerdalsbreen in a neighboring valley. The mean annual precipitation amounts to 1620 mm for the same period (Førland, 1993). Monthly mean precipitation peaks in October (214 mm) with a minimum in April (60 mm), measured in Veitastrond (172 m a.s.l) approximately 10 km down-valley. The climate trend for western Norway shows a summer temperature warming of 0.05°C per decade between 1900 and 2014, and a winter precipitation increase of 1.4% per decade for the same time period (Hanssen-Bauer et al., 2017).
Study design
Eighteen sampling sites were established in four terrain age zones (A-D) similar to those used by Vater and Matthews (2015; Figure 1 and Supplemental supporting information). Zone A represents the oldest terrain (c. 250 years since glacier recession), with four sampling sites on both sides of the Little Ice Age moraine. In zone B, representing terrain age of 100–200 years, there were six sampling sites: two proximal to a moraine dated to 1811, two proximal to the 1871 moraine and two proximal to the 1909 moraine. In zone C, representing terrain age of 50–100 years, four sampling sites were installed: two proximal to the terminal moraine of 1931, and one each at the reconstructed glacier front positions of 1960 and 1970 (based on NVE, 2021). Zone D, the youngest terrain (terrain age of 0–40 years) was covered by four sampling sites: one at the reconstructed glacier front position of 1980, two around the terminal moraine of 2005 and one on an ice-cored moraine, deposited between 2010 and 2015.
Invertebrate collection
In order to collect samples of invertebrates comparable to the 2004 study, we used the same pitfall trapping method (Vater, 2012; Vater and Matthews, 2015). While pitfall traps are most often aimed at collecting ground-dwelling invertebrates, they may also trap non-epigeal species and the abundance of species caught depends on species locomotory activity as well as density (Topping and Sunderland, 1992). However, with standardized sampling designs, relative trap catches can be used for studies of differences in community composition over time and space (Duelli et al., 1999). Therefore, we follow the sampling design of the original survey to enable this comparison by sampling with three pitfall traps at each site (two sizes: Ø 9/11 cm, depth 8/11 cm), arranged in a triangle, as described in Vater (2012) as an efficient sampling design. In addition, to minimize the possibility of capturing species attracted to the decaying material in the traps, we half-filled them with propylene glycol and water (1:1) as killing and preserving agent (Sherley and Stringer, 2016; Skvarla et al., 2014). The traps were also protected against rain and scavenging animals with wooden roofs erected with wire corner supports. These roofs are also likely to have minimized the accidental trapping of flying insects. Although we did catch many non-epigeal species, we included them in our analysis to provide direct comparison to the original study.
Sampling was conducted five times through the summer of 2019 (12 June–4 October), at intervals of 4–16 days between the installation of traps and the sample recovery (Supporting information Figure S1). The large variation in the interval length was caused by disturbances in the traps in early July, after which samples were recovered in shorter intervals to reduce risk of disturbances. Due to some recovery failures, successful sampling days varied at the sampling sites. The site on the ice-cored moraine was sampled only in October due to poor accessibility. At the end of each sampling period, traps were renewed or removed, and invertebrates stored in 70% ethanol before further processing. All intact individuals, except juveniles were identified to species level using established identification keys (Bährmann and Müller, 2008; Hackston, 2019; Klausnitzer, 2011; Lompe, 2002; Lyneborg, 1977; Nentwig et al., 2020) and validated by taxonomic experts. Taxonomy of identified species is in accordance with Fauna Europaea (de Jong et al., 2014).
To take account of varying sampling effort in the sampling sites, invertebrate species counts were standardized for the number of sampling days in each site. Further, to aid comparisons with the 2004 study, we generated a subset of the assemblages to match the original survey spatially and temporally. Exact sample site matches were not possible due to the lack of GPS information from the 2004 study, but we isolated our 10 sites that match the original positions as closely as possible (Figure 1). Furthermore, the 2004 study only sampled invertebrates in July, because seven other glacier forelands were being sampled concurrently. Thus, our subset hereafter referred to as “July 2019” includes only species counts from that month and the 10 matched sites. Creating this subset provides us with two samples as comparable in time and space as possible for statistical analysis of community differences. However, it should be noted that the comparison will be flawed ecologically, as a complete inventory of species abundances across the active, snow-free season is not available for both time periods.
Vegetation and soil
Vegetation was assessed at each site by placing a 16 m2 grid around each sampling site in July 2019. Each grid was subdivided into 16 50 × 50 cm segments. Eight of the segments were randomly chosen, and in each the percentage cover of broad vegetation types was estimated using a 50 × 50 cm quadrat. We estimated cover to the nearest 5% of total vegetation cover, and the proportion of bryophytes, grasses/forbs, shrubs, and trees (height >2 m). Further, species richness of higher plants in the chosen quadrats and the presence or absence of woodland in the wider surrounding area (<10 m from the sampling site) were recorded. Additionally, soil properties of the upper 10 cm were classified into proportions of organic soil (dark colored, organic matter present), fine-grained substrate (grain size <2 mm diameter) and coarse-grained substrate (grain size >2 mm diameter).
To avoid issues with collinearity in analysis, we used the above variables to compute vegetation and soil indices. The vegetation index was computed using a Hill-Smith analysis (HSA; Hill and Smith, 1976; Thioulouse et al., 2018), combining vegetation cover, proportion of bryophytes, grasses, shrubs and trees and mean plant species richness and the categorical variable of woodland presence/absence. Site scores of the first axis were extracted as vegetation index (eigenvalue = 3.75, projected inertia = 53.58%), and ranged from −3.24 to 2.58, representing a gradient of low vegetation cover dominated by bryophytes to dense, herbaceous/shrub vegetation cover and woodland present (Supporting information Figure S2a). For the soil index, a principal component analysis (PCA; Hotelling, 1933) was performed with the recorded soil parameters: proportions of organic soil, fine-grained soil and coarse-grained soil. The first axis was extracted as soil index (eigenvalue = 1.75, projected inertia = 58.25%), with values from −3.1 to 1.63, representing a gradient from homogenous fine grained silt deposits to stratified soil of coarse- and fine-grained glacial till below a developed organic soil layer (Supporting information Figure S2b).
Data analysis
To describe the current community along the foreland, we first assessed the associations between spider and beetle species richness and environmental explanatory variables using Spearman’s rank correlations on the full community and the July 2019 subset. The three explanatory variables used in correlations were the vegetation and soil indices, and distance from the glacier front, which is a highly correlated proxy for terrain age (r = 0.996, p < 0.005). We also classified successional site and species groupings for beetles and spiders separately with two-way indicator analysis (TWINSPAN; Hill, 1979) using the full community dataset. We parameterized the TWINSPAN to match that described in Vater (2012): three divisions were used for each classification with a minimum group size for division of three. This produced a maximum of eight interpretable groups. Pseudo-cut levels were defined in five levels but adapted to reflect species abundances of the sample evenly (0; 0.51; 1.01; 2.01; 5.01). The resulting successional groups of spiders and beetles were further processed in non-metric multidimensional scaling analyses (NMDS; global model, two dimensions, max. iterations = 100, half-change scaling) using “Bray-Curtis” dissimilarities. The strength of the TWINSPAN classification was tested with an analysis of similarity (ANOSIM), where the R value (0–1) indicates the similarities between pre-defined groups (Clarke, 1993). An R statistic >0.75 is interpreted as high dissimilarity, 0.25 < R < 0.75 is interpreted as dissimilar with degrees of overlap, and R < 0.25 is interpreted as high similarity, following Steinwandter et al. (2017). The three environmental explanatory variables were fitted into the NMDS space to find gradients along the axes in the site and species distribution. From site group positions in the NMDS space successional stages were derived.
To assess changes along the four chronosequence zones over the 15 year interval, we repeated the above TWINSPAN classification for the July 2019 subset, and for the sample of 2004 (spiders and beetles together). To make the datasets more directly comparable and stabilize the analysis, species counts were square-root transformed and species with single occurrences (n = 29) were removed (van Son and Halvorsen, 2014). Additionally, the three sites of age zone D of 2004 were merged into one site due to very low species counts. To compare the species distributions for each survey, we subsequently calculated the number of species occurring in each TWINSPAN species group, at each age zone. These were then converted to proportions of species counts for each age zone. Furthermore, with the two surveys combined, a NMDS (configuration as above) was also performed with “Bray-Curtis” dissimilarities. To estimate the differences between the 2004 and 2019 surveys, we calculated and plotted centroids of all age zones, and measured the Euclidean difference in NMDS space between the 2004 and 2019 centroids. This approach was taken due to uncertainty of the exact positions of 2004 sampling sites in the field. TWINSPAN analysis was performed with the software TWINSPAN 1.2 (Hill, 2012). All other statistical analyses were conducted using R version 3.6.2 (R Core Team, 2019), and the packages ade4 (Dray and Dufour, 2007) and vegan (Oksanen et al., 2019).
Results
Invertebrate sampling
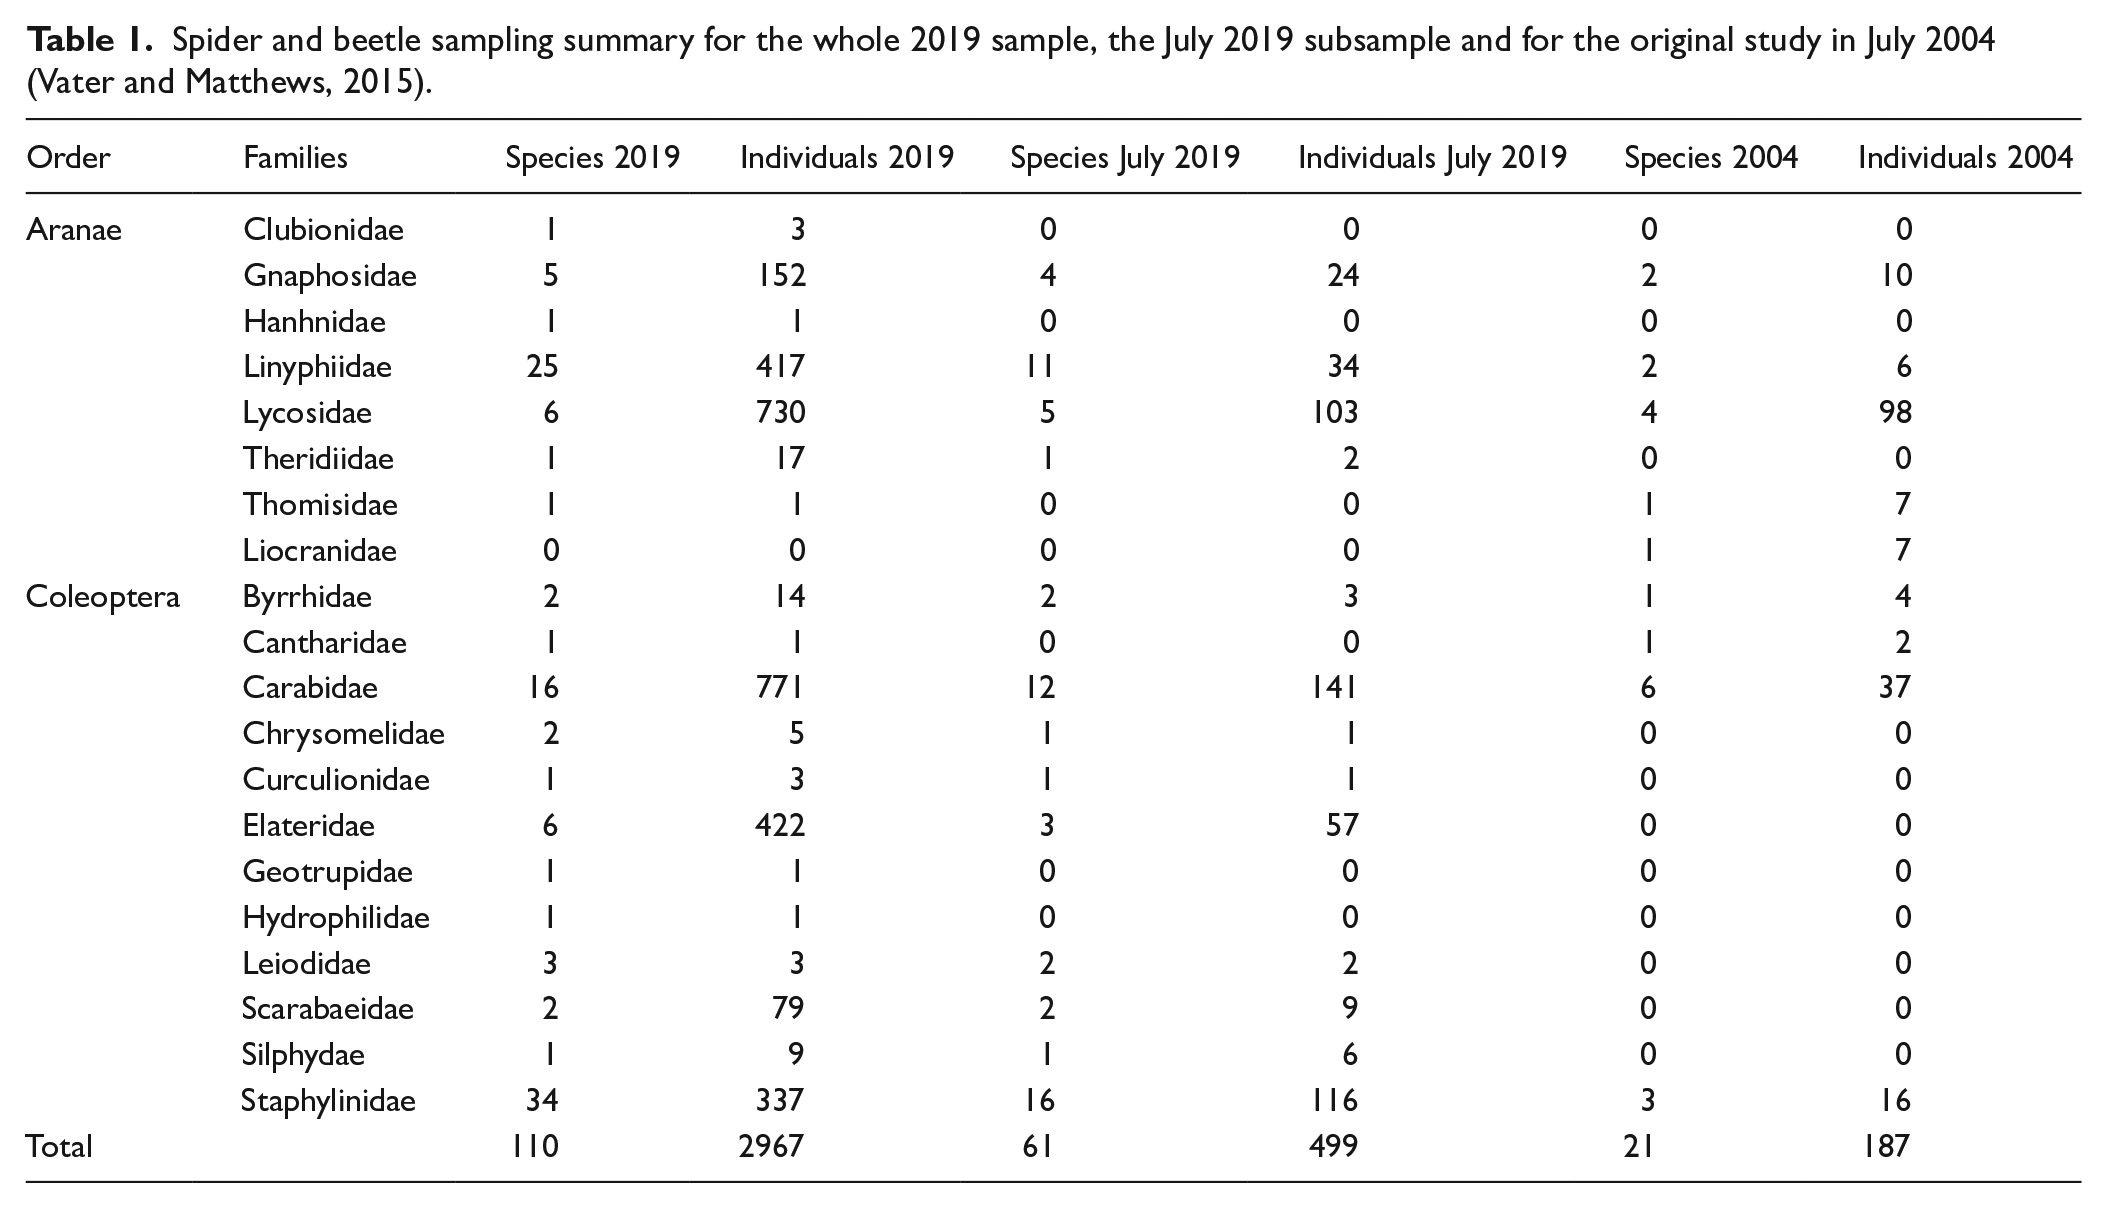
During the 2019 sampling season, 70 beetle species with 1645 individuals and 40 spider species with 1322 individuals were collected (Table 1 and Supplemental supporting information). Individuals and species numbers were generally higher in 2019 than in 2004, even when only comparing the July 2019 subsample (spider: 294 individuals of 21 species; beetles: 526 individuals of 40 species). Most individuals were recorded in the spider families Lycosidae, Linyphiidae and Gnaphosidae and the beetle families Carabidae, Elateridae and Staphylinidae. The most species rich families were the spider family Linyphiidae with 25 species, and the beetle families Staphylinidae with 34 species and Carabidae with 16 species. Species richness and abundance of the total 2019 assemblage peaked between 29 June and 13 July, although high numbers of species were recorded throughout the whole season (Supporting information).
Spider and beetle sampling summary for the whole 2019 sample, the July 2019 subsample and for the original study in July 2004 (Vater and Matthews, 2015).
Species richness along environmental gradients
We did not find linear correlations between species richness and distance from glacier. Both spider and beetle species richness increased sharply in the youngest terrain (Figure 2a and b), before leveling off, although beetle species richness showed a possible hump-shaped pattern, decreasing toward the foreland boundary. These patterns are similar for the entire sample and the July 2019 subsample, but the 2004 pattern is more difficult to discern with fewer samples. Spider species richness was strongly correlated with vegetation development (high values of vegetation index), and while there was no clear relationship between spider species richness and soil characteristics (Figure 2e), there was a tendency for a negative relationship for beetles (Figure 2f). This suggests that fine texture soils (low soil index) support higher species numbers, although there is high variation in species richness in soils with a higher proportion of coarse grains and organic matter (high soil index).
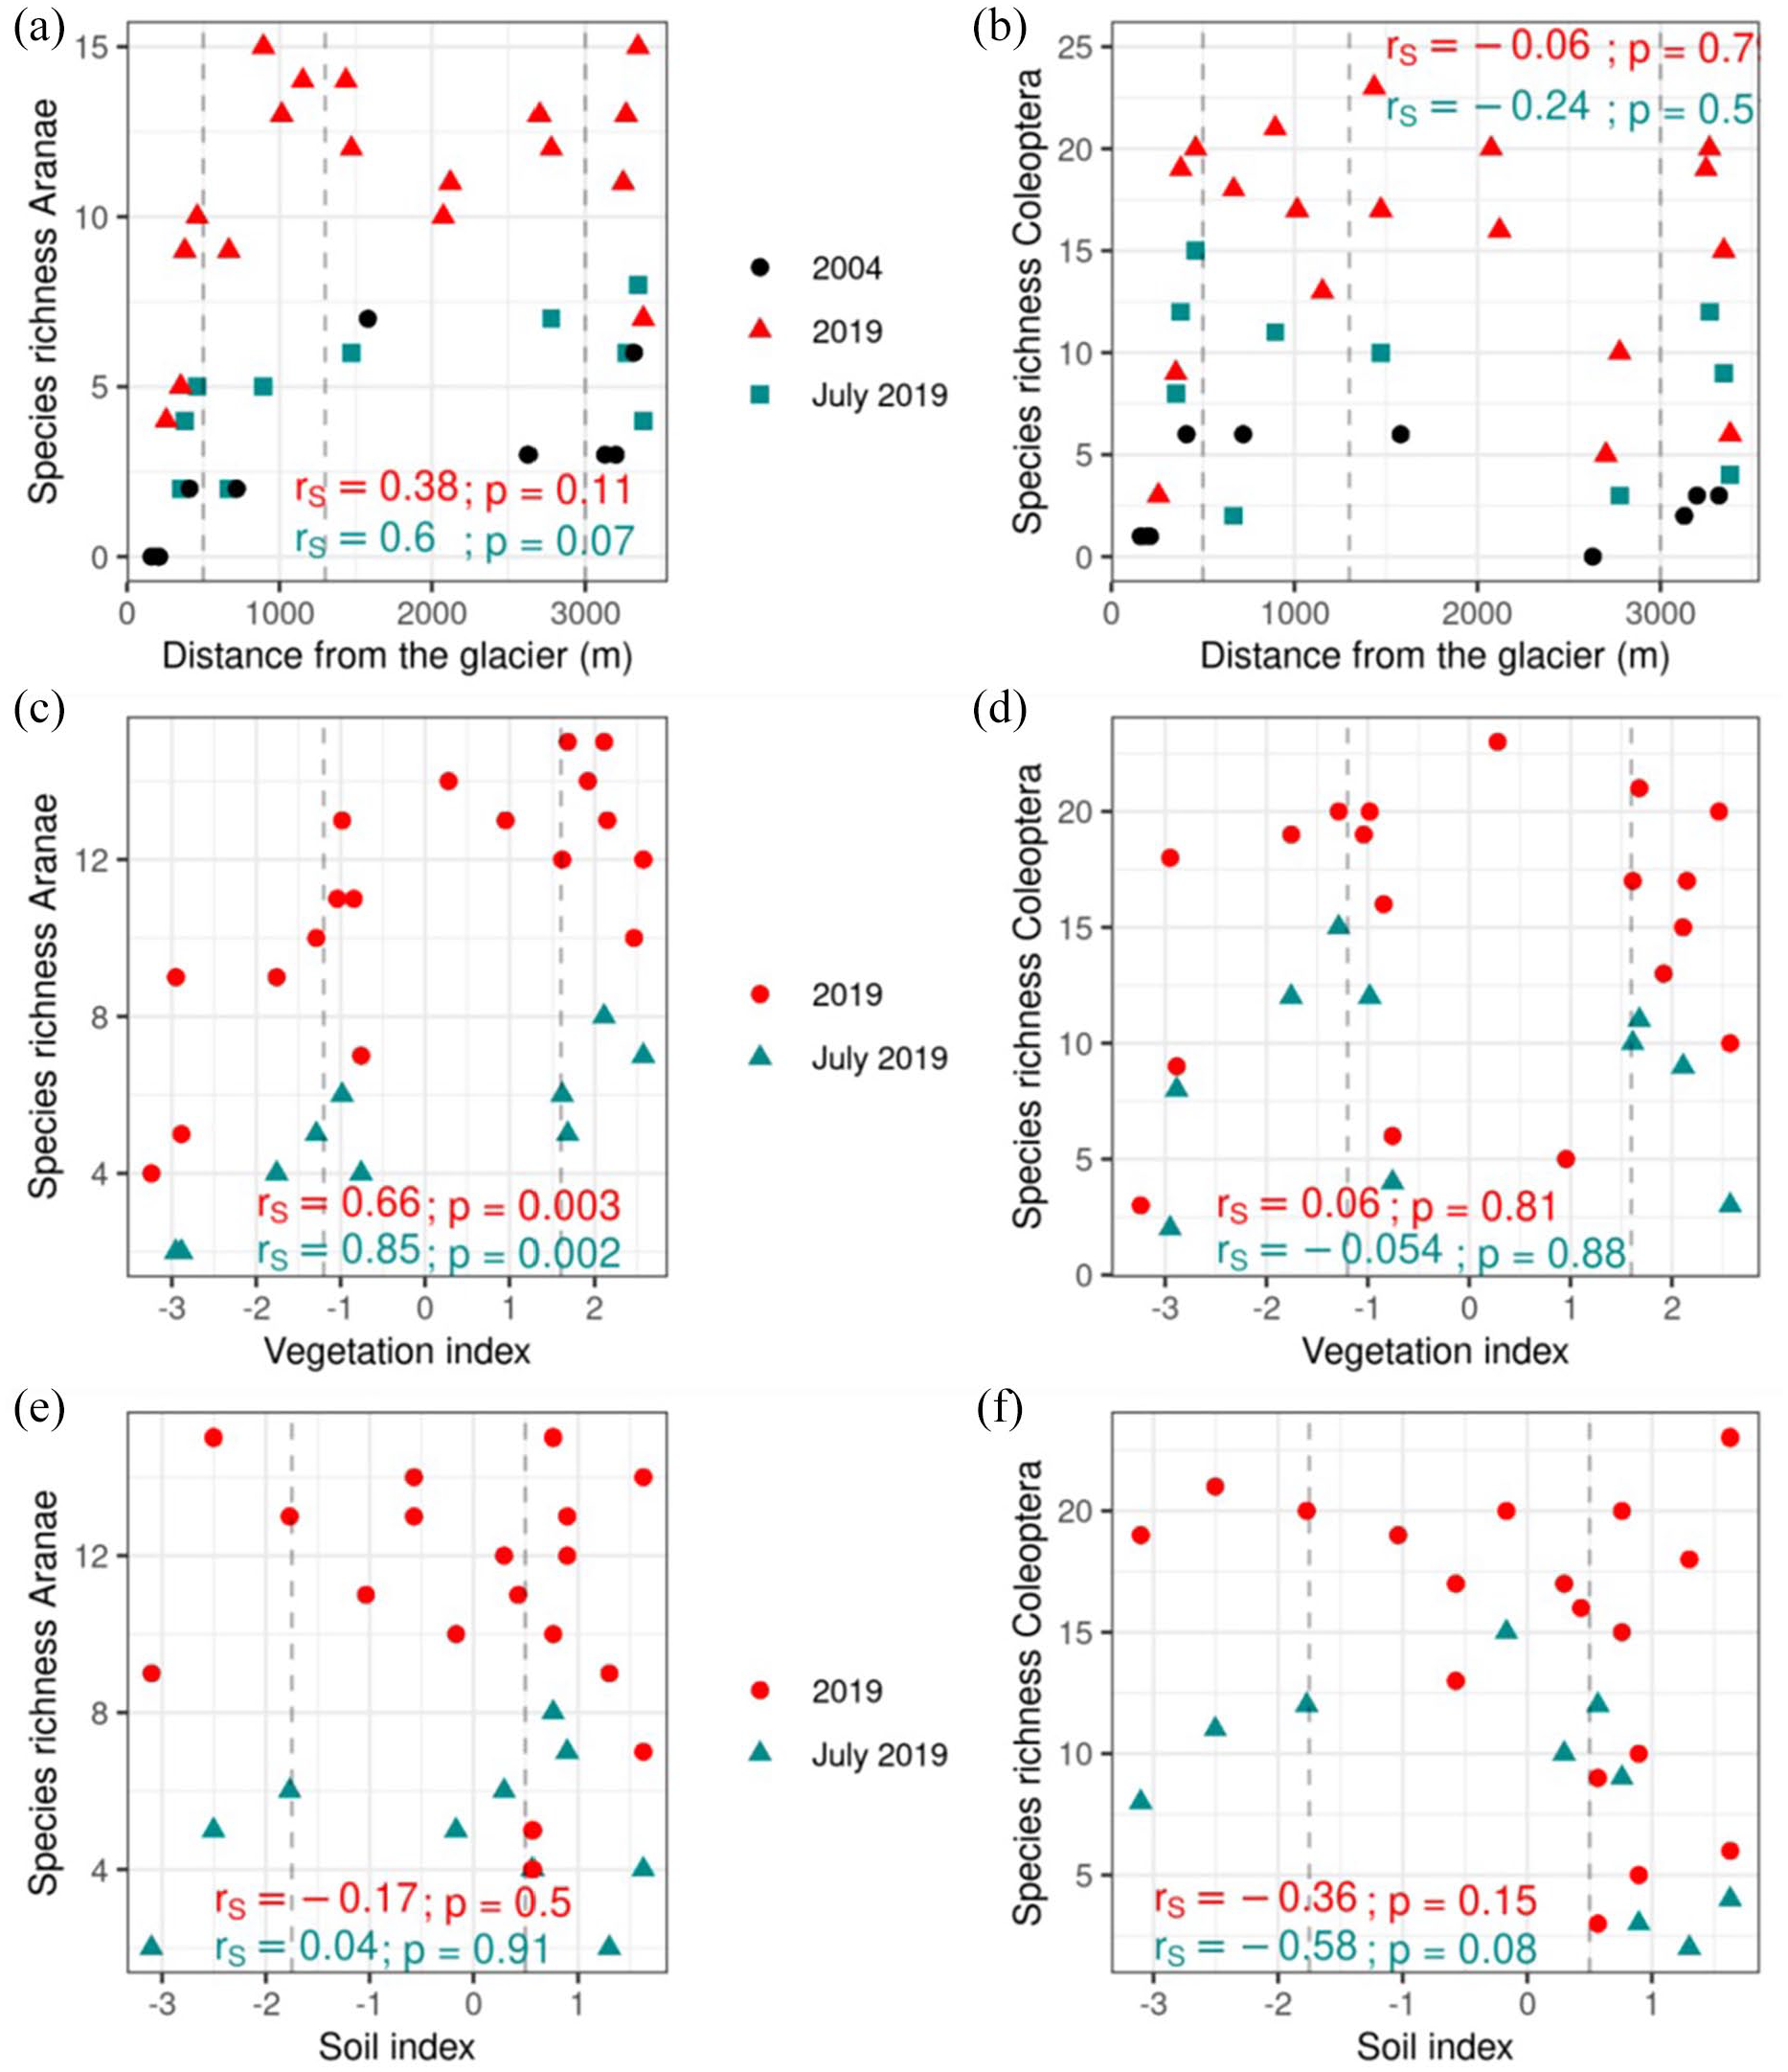
Species richness of spiders (a) and beetles (b) for 2019 (triangle), the July 2019 subset (rectangle) and 2004 (circle) against distance from the glacier. Terrain age zones are delineated by dashed vertical lines. Species richness of spiders (c) and beetles (d) for 2019 (circle) and July 2019 (triangle) against vegetation index gradient. Zones of dominant vegetation are separated by vertical dashed lines. The left field is dominated by bryophytes, the center by a mix of bryophytes and grasses/forbs and the right is dominated by grasses/forbs. Species richness of spiders (e) and beetles (f) for 2019 (circle) and July 2019 (triangle) against soil index gradient. Delineated zones represent dominance of fine-grained soil (left), mix of fine- and coarse-grained soil with little organic soil (center) and more equal mix of fine, coarse and organic soil (right).
Species groups during succession
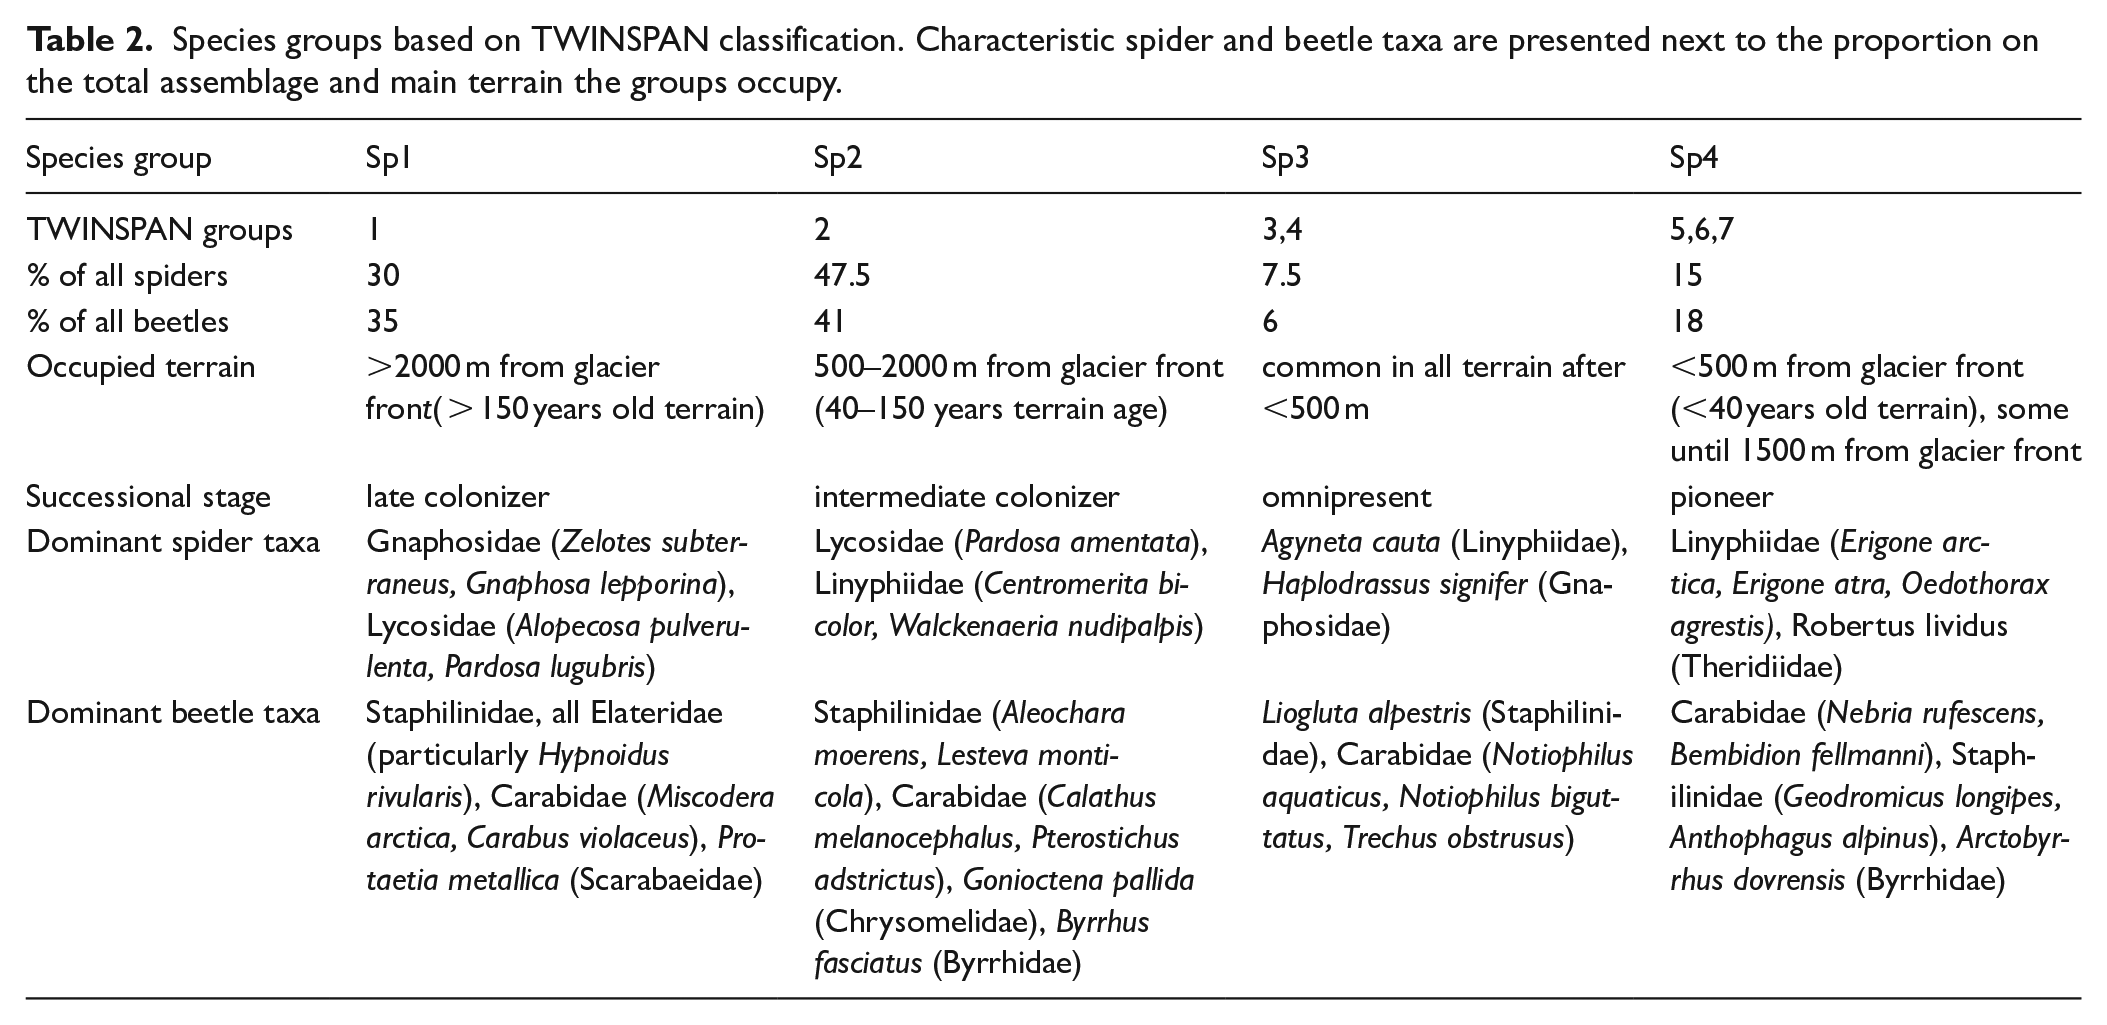
Seven species groups of both spiders and beetles were classified as occupying distinct regions in the foreland with the TWINSPAN. After inspection, these seven groups were condensed into four groups with similar characteristics, which we label Sp1 to Sp4 (Table 2). The groups that were merged contained few species with similar site preferences. The four species groups represent distinct successive assemblages found in the glacier foreland. Sp1 is a late colonizer assemblage that preferably occurs on terrain older than 150 years with approximately one-third of all beetles and spiders, and Sp2 is a larger intermediate colonizer assemblage, with few records in both old and very young terrain, but high recordings in intermediate terrain age. Sp3 is a small group representing species that are equally common in all terrain older than 40 years, and Sp4 is the pioneer colonizer group, with all species colonizing the terrain younger than 40 years (either exclusively or predominantly).
Species groups based on TWINSPAN classification. Characteristic spider and beetle taxa are presented next to the proportion on the total assemblage and main terrain the groups occupy.
The NMDS visualization of the species groups (stress: 0.09 and 0.08, respectively), support the strong link to distance from the glacier (Figure 3a and b; spiders: R² = 0.69, p = 0.001; beetles: R² = 0.59, p = 0.001), with the late colonizer (Sp1), intermediate colonizer (Sp 2) and pioneer assemblage (Sp 4) occupying distinct regions of the foreland, while the “omnipresent” group (Sp 3) is more widely distributed. The first NMDS axis was not significantly linked to vegetation or soil indices
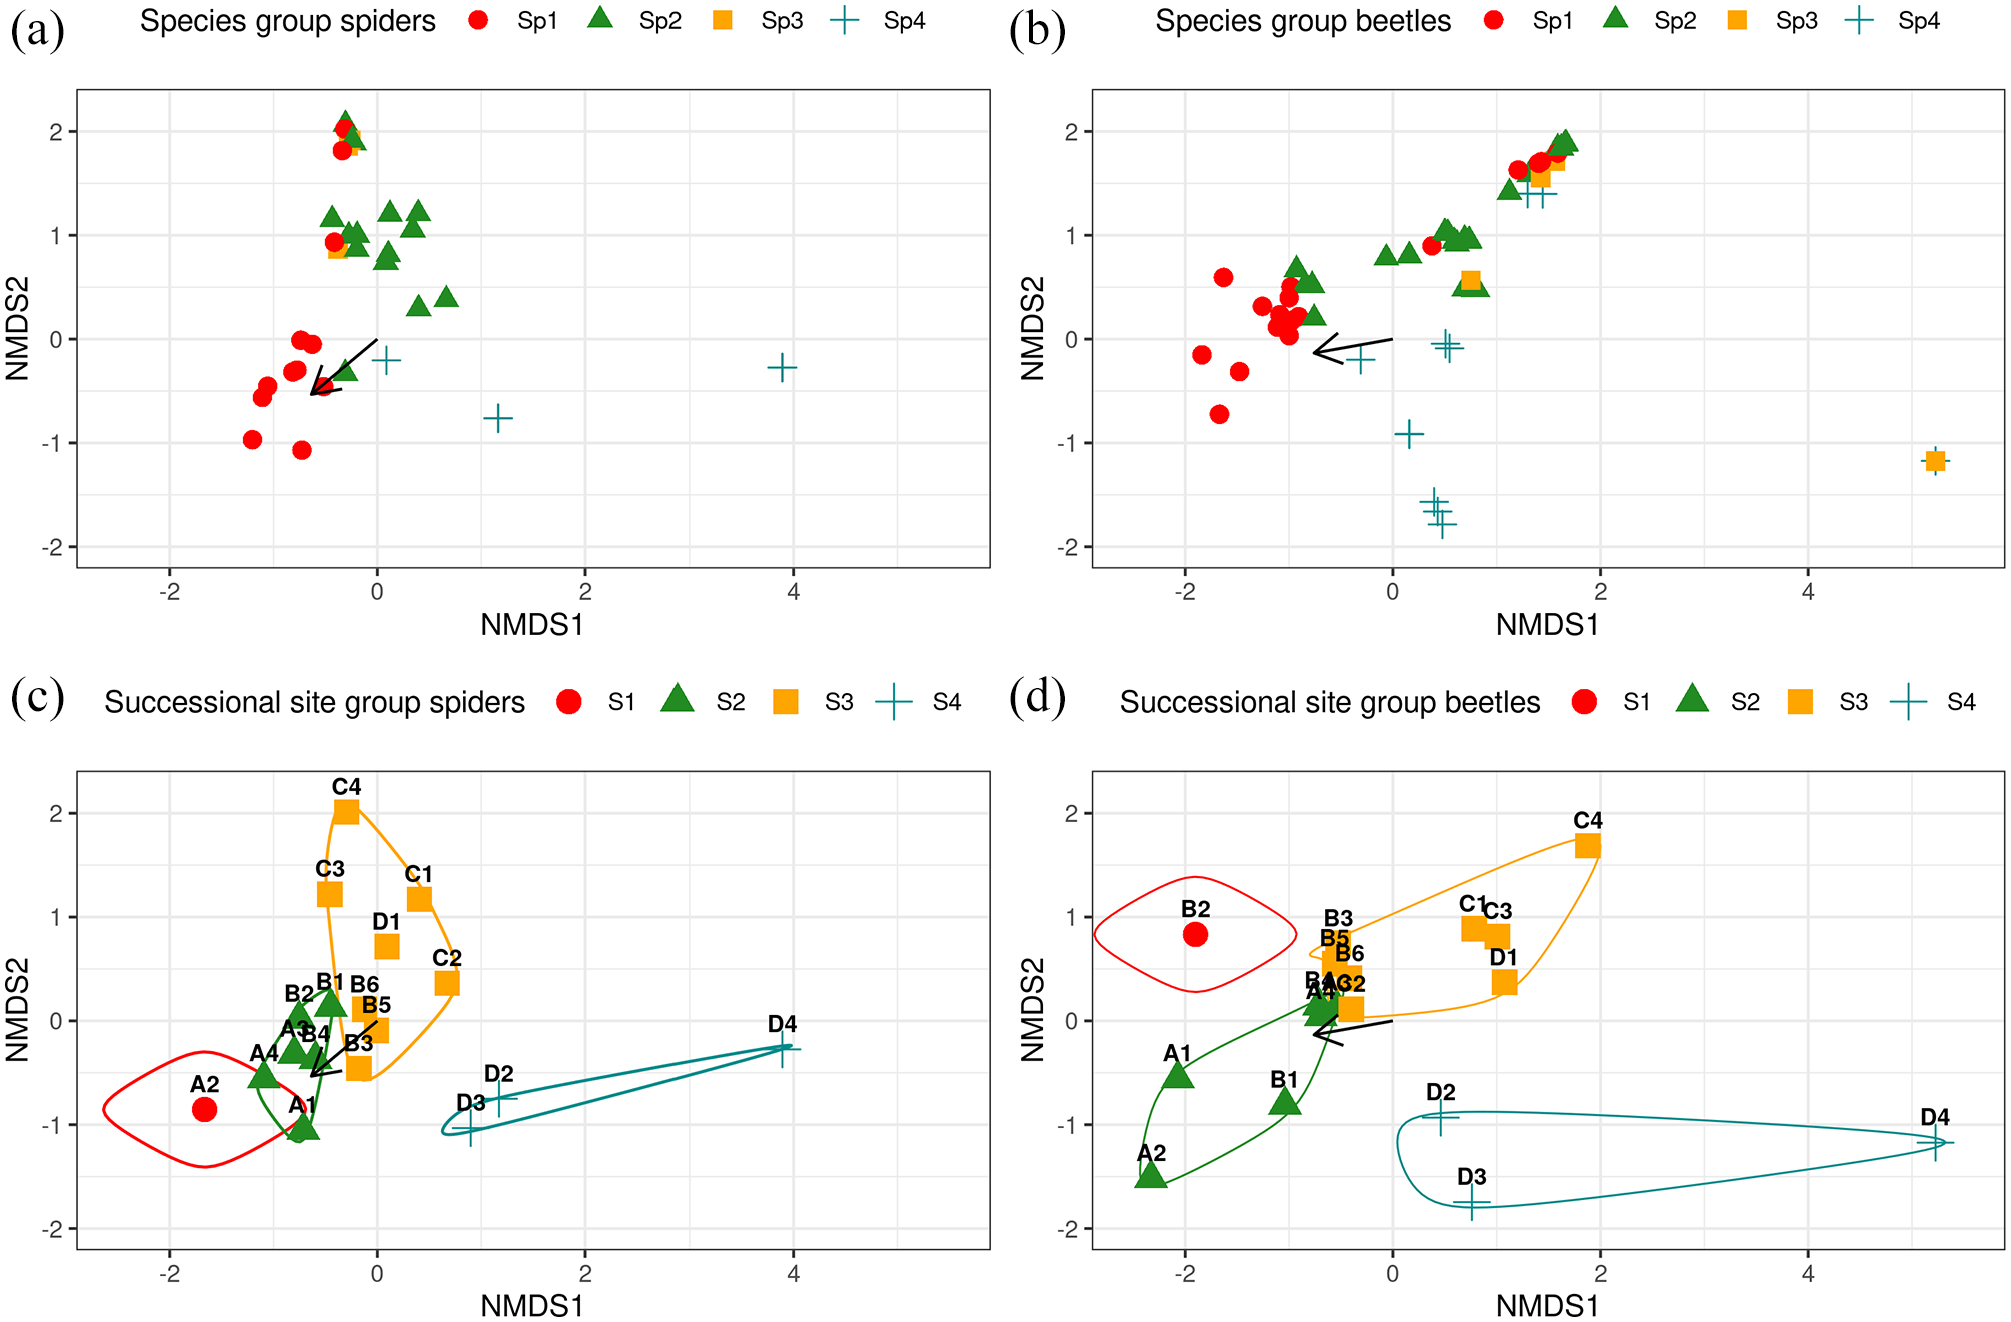
NMDS plot for spider (a) and beetle (b) species groups, and spider (c) and beetle (d) successional site groups. For both orders four species groups and four site groups were re-classified based on TWINSPAN classification. Distance from the glacier, as the strongest environmental variable, was plotted onto all NMDS spaces (black arrow).
Successional site groups
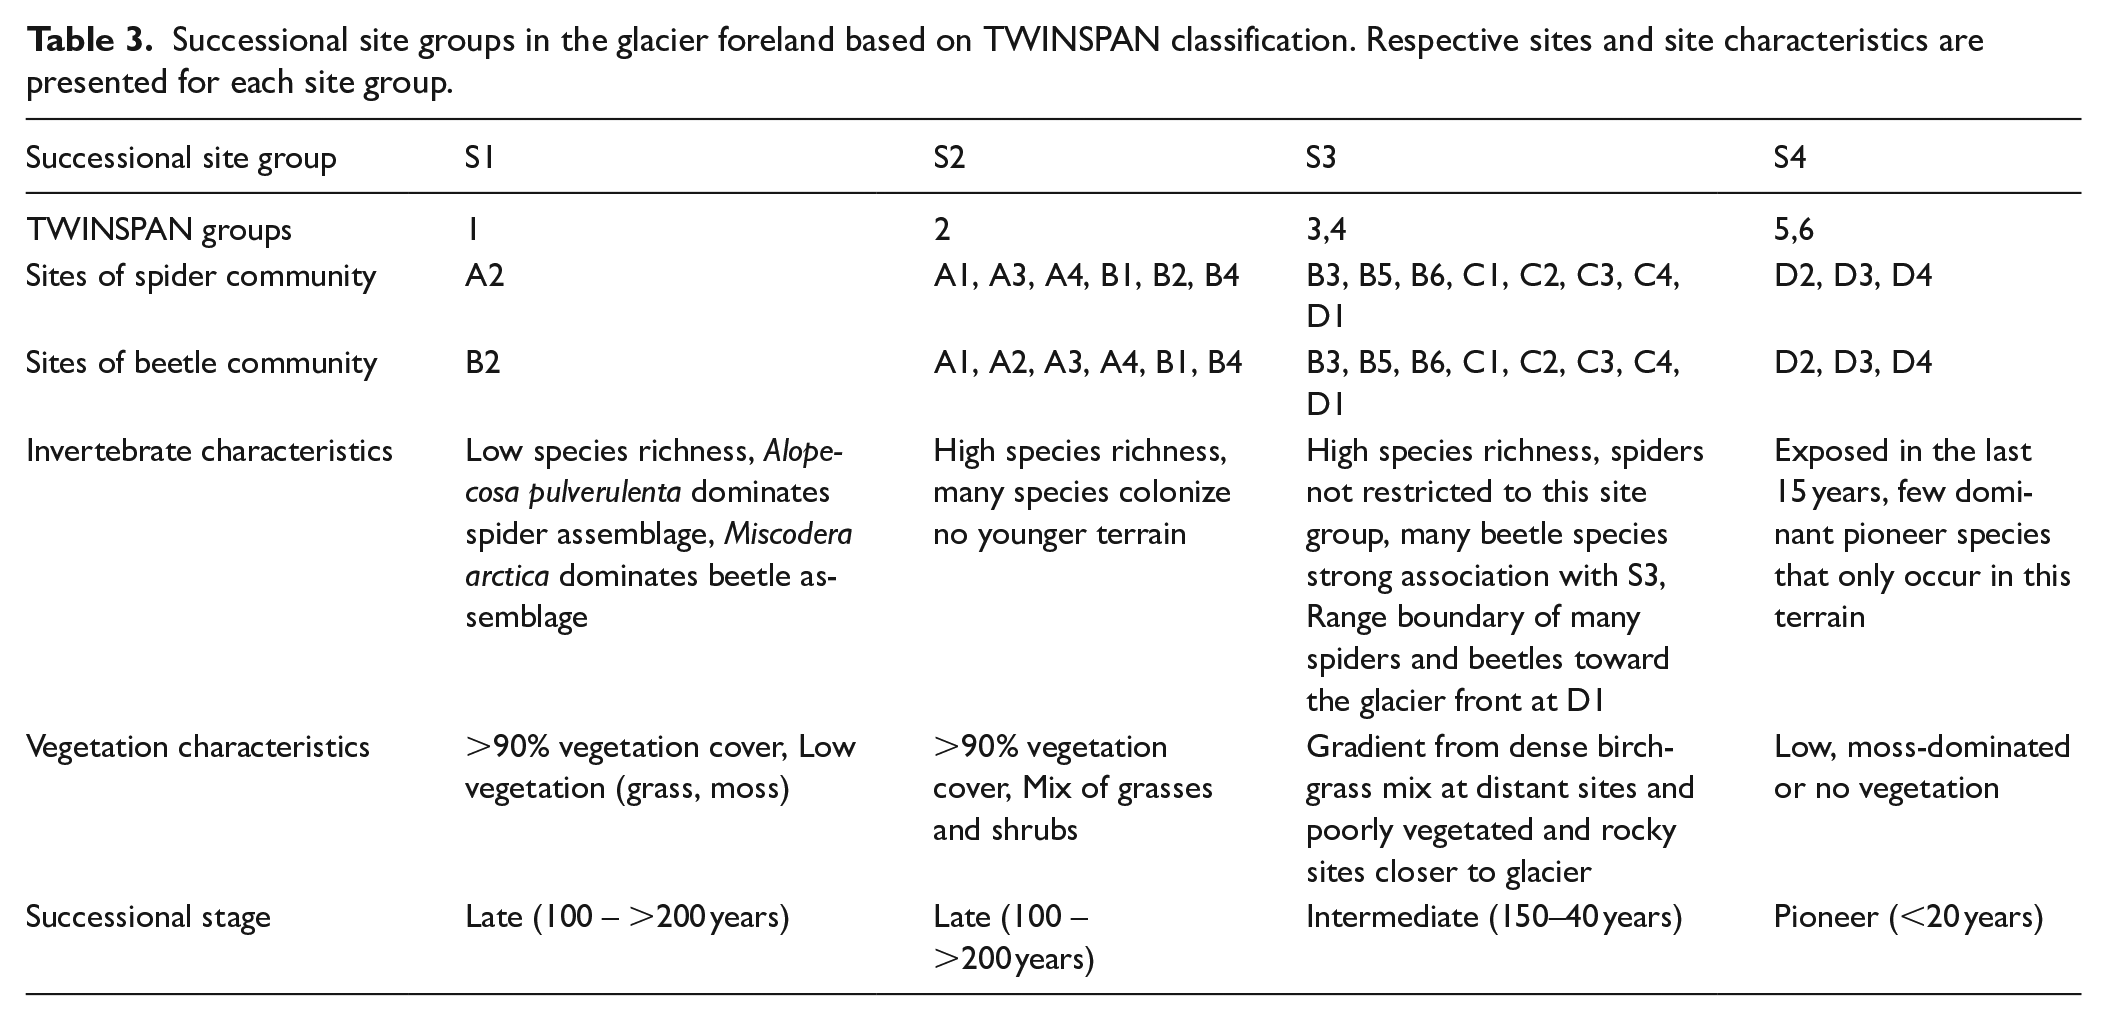
In addition to providing species groups of associated species, the TWINSPAN procedure provides successional site groups, clustering the 18 sampling sites into groups of similar species composition (Figure 3c and d). Six site groups were returned in both spider and beetle analyses, and these were manually reclassified to four successional site groups (Table 3). Dissimilarity among the spider (ANOSIM: R: 0.72, p < 0.001) and beetle successional site groups (ANOSIM: R: 0.6, p < 0.001) was high, suggesting that both communities were associated with certain regions in the foreland with little overlap between adjacent site group communities. The first successional site group (S1) is made up of sampling sites in old, open terrain and is associated with low species richness. The second site group (S2) also features sites in relatively old terrain (>100 years) and open vegetation. However, S2 is characterized by high species richness and a large proportion of species that do not occur in younger terrain. The third site group (S3) represents sites of various terrain ages (40–150 years) and a vegetation gradient from poorly vegetated to dense shrubland. These sites reflect the highest species richness in the glacier foreland. The final site group (S4) represents the unstable, young terrain (<20 years) with mostly pioneer species. Site D4 in particular was distant from other sites in both NMDS biplots, highlighting the extreme position of the site closest to the glacier on a recently deposited ice-cored moraine with very few species and no vegetation.
Successional site groups in the glacier foreland based on TWINSPAN classification. Respective sites and site characteristics are presented for each site group.
Temporal changes in the last 15 years
The TWINSPAN for the 2004 and July 2019 datasets produced species and site classifications analogous to the full dataset above. Therefore, the same four species groups were used to reclassify the groupings. Visualizing the proportion of species from each species group at the four age zones reveals some interesting shifts between the two surveys (Figure 4). Around the glacier foreland boundary (oldest terrain, zone A), the proportions of species groups remained rather stable with a relatively equal spread of late colonizer species (Sp 1), intermediate colonizer species (Sp 2) and omnipresent species (Sp 3). However, the late colonizer indicator group (Sp 1), appears to extend its range further into younger terrain in 2019 (zones B and C). Similarly, the intermediate colonizers (Sp 2) appear to have greater presence in zones B and C. Furthermore, there was a shift in the distribution of pioneer taxa (Sp 4) from large proportions in all terrain younger than 50 years in 2004 (age zones C and D), to an almost exclusive restriction at the glacier front (zone D) in 2019. Both trends suggest a restriction in the occurrence of open ground specialists (Sp 4) such as Bembidion fellmanni (Carabidae) and Erigone arctica (Linyphiidae) and colonization into younger terrain by species associated with higher vegetation cover (Sp 1), such as Hypnoidus rivularis (Elateridae), Protaetia metallica (Scarabaeidae), Zelotes subterraneus (Gnaphosidae) and Pardosa lugubris (Lycosidae). Another striking pattern is that zone D (young terrain) of 2019 appears to resemble zone C of 2004, indicating a faster encroachment of formerly late colonizing species into recently exposed terrain.
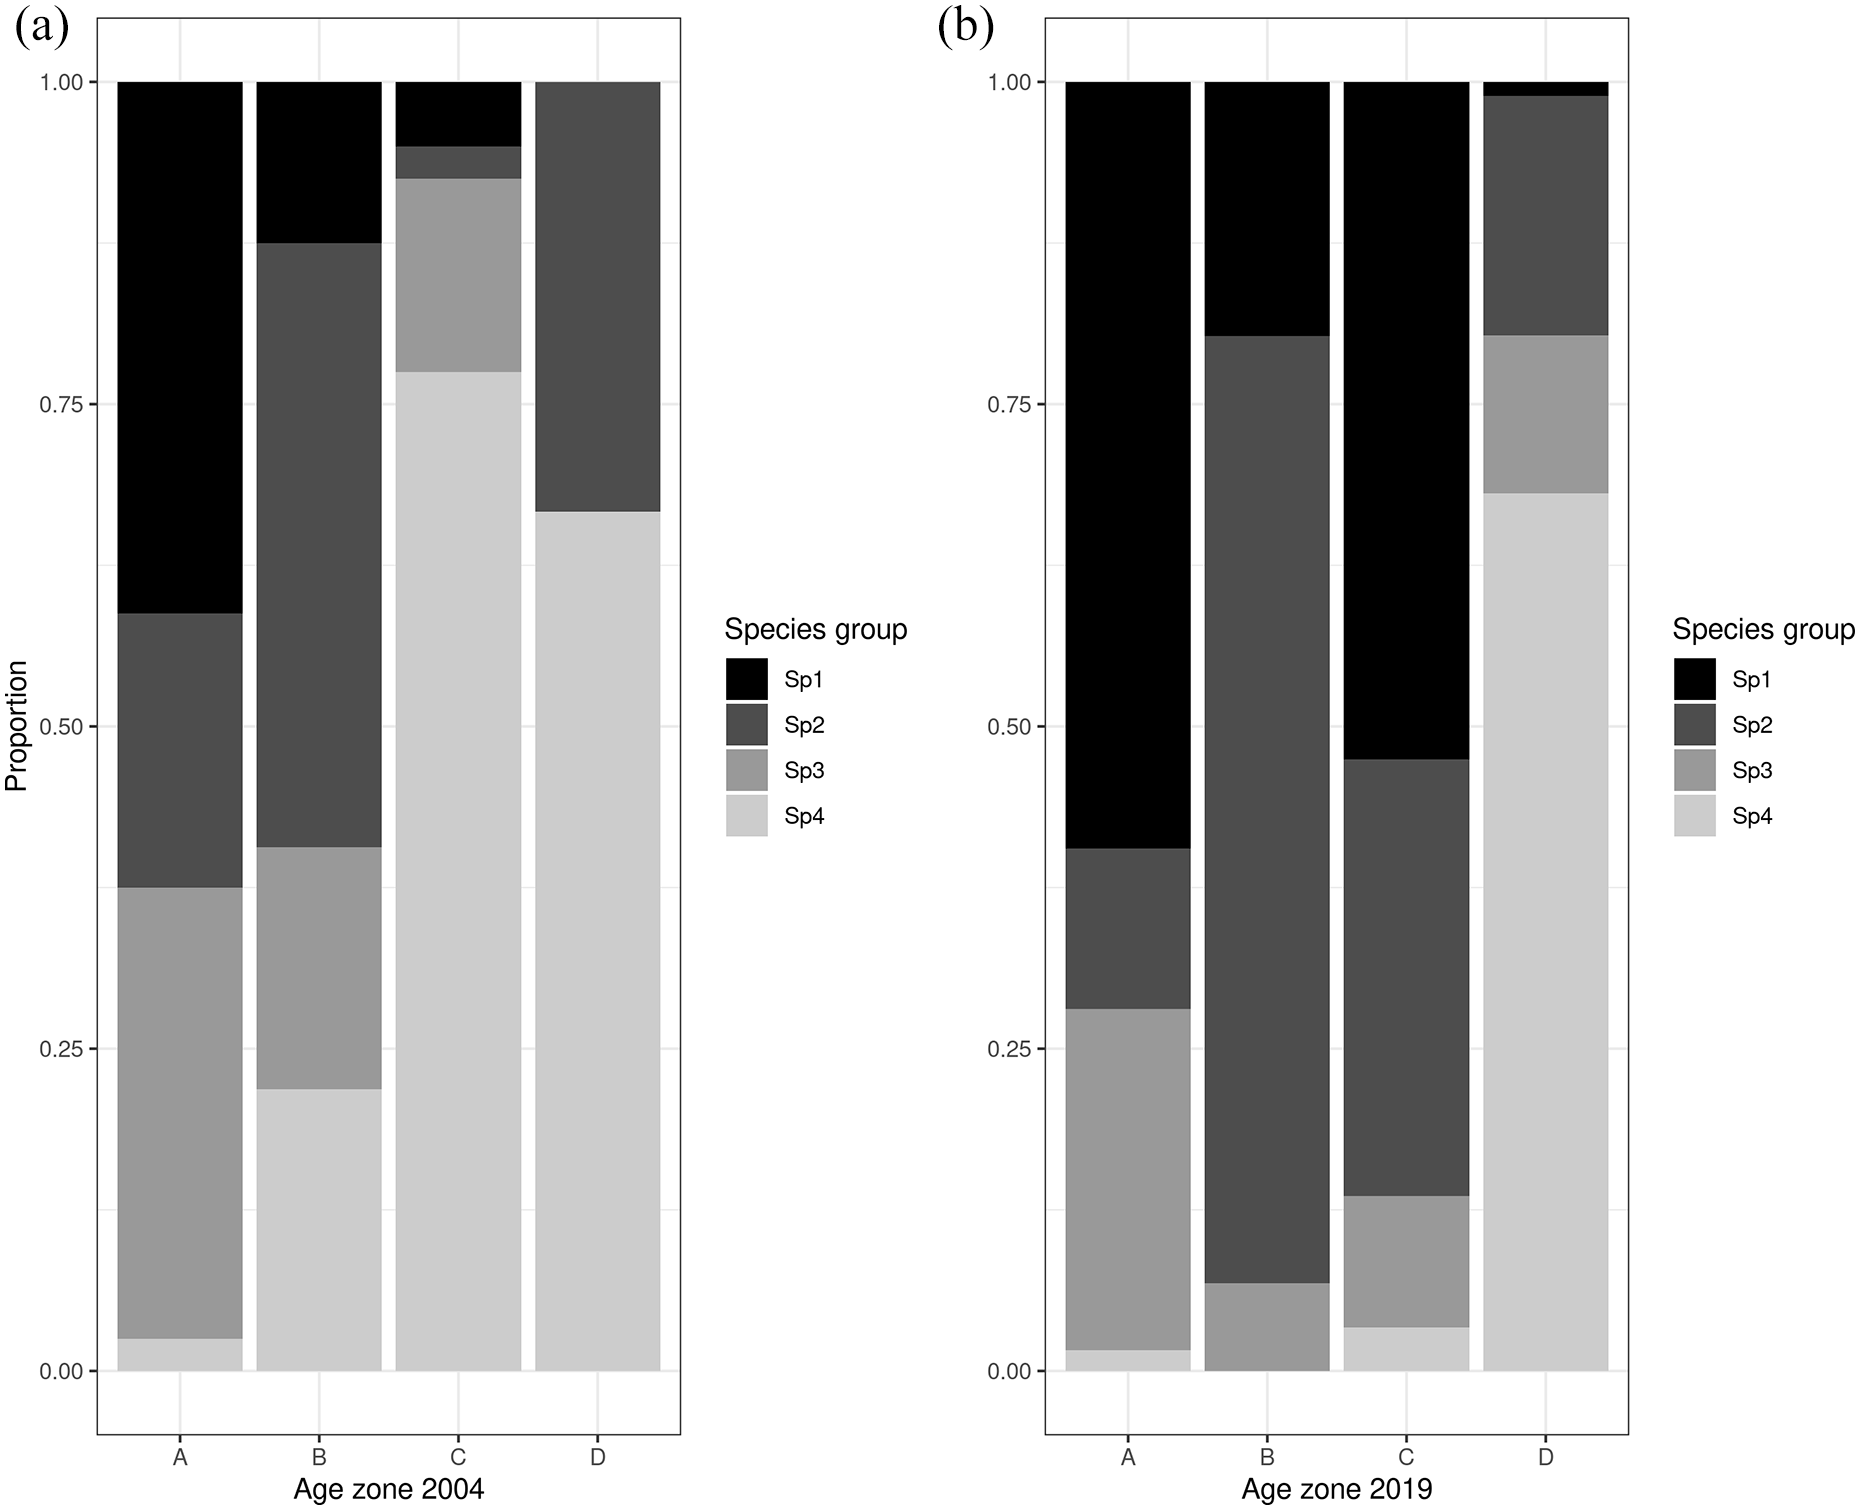
Proportion of species found for each TWINSPAN species group and age zone for (a) the 2004 dataset and (b) the July 2019 dataset. Age zone A = oldest, D = youngest. The four species groups were derived based on the TWINSPAN classification: Sp 1 = late colonizer, Sp 2 = intermediate colonizer, Sp 3 = omnipresent species, Sp 4 = pioneer species.
The changes described above are supported by the combined NMDS analysis (Figure 5, stress: 0.167) in which the first axis (R² = 0.41, p = 0.02) can be interpreted as a terrain age gradient (NMDS axis 2 is not interpretable due to the small sample size). An ANOSIM test indicated a significant dissimilarity between both sampling years (R statistic: 0.34, p = 0.004). From the positions of the 2019 and 2004 centroids on the NMDS biplot, some major changes in community composition have occurred. For the 2004 sample, the terrain age gradient is apparent from the youngest terrain (zone D) to the older terrain (zones A and B). However, the 2019 centroids of all age zones have shifted to the left along the age gradient, and zones A to C have become taxonomically similar.
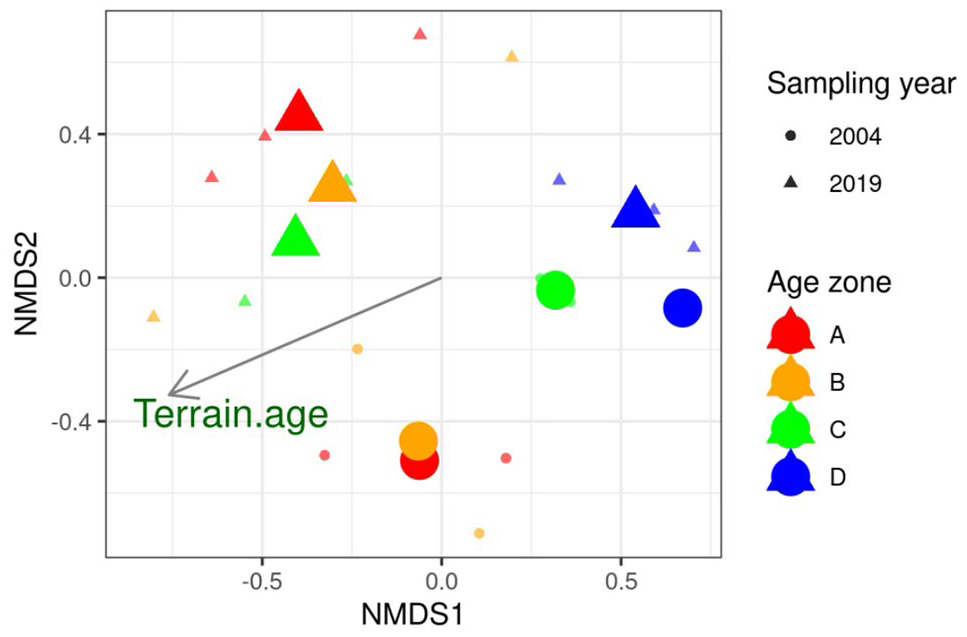
NMDS of the merged spider and beetle data of 2004 and 2019, based on Bray-Curtis-dissimilarities. The three sites of zone D in 2004 were merged into one site due to low species recordings. Species with only one counted individual were removed and the data were square-root transformed. Distance from the glacier was fitted into the NMDS space as an environmental gradient. Centroids of mean age zone position in 2004 and 2019 are shown as enlarged symbols.
Discussion
In this study, we found a surprisingly high species richness of beetles and spiders in the glacier foreland of Austerdalsbreen, compared to a survey conducted 15 years earlier, and to studies of other Nordic glacier forelands. Our 110 species in total, and 61 from July only, far exceed the 21 reported by Vater and Matthews (2015) in the same foreland and the 34 species from nearby Fåbergstølsbreen (Vater and Matthews, 2013), another outlet glacier of Jostedalsbreen Ice Cap. Much of this difference is likely to be due to our higher spatial and temporal sampling method, and a slightly higher taxonomic resolution of identification Nevertheless, our record is still relatively high compared to similarly sampled areas, under comparable low altitude conditions. Bråten et al. (2012) recorded 73 species of spiders and beetles at Hardangerjøkulen in southern Norway over 2 years including winter, and Franzén and Dieker (2014) found 55 spider and beetle species at Ålmajallojekna in northern Sweden during 2 years of August sampling.
While we took steps to make our July 2019 sample as statistically comparable as possible to the 2004 sample, we cannot rule out the possibility that differences in climatic conditions were behind our findings. For example, 2019 may have been particularly climatically favorable, and 2004 particularly adverse for invertebrates in this region, resulting in contrasting richness and abundance figures. This possibility highlights the need for more complete inter-annual sampling of such communities. However, with this first study of its kind, the observed difference allow us to hypothesize an accelerated invertebrate succession occurring with ongoing climate warming, with few cold-adapted species declining and many species from outside the foreland increasing their range into the valley with a longer activity season (Koltz et al., 2018). More frequent sampling will be required to test this hypothesis further and more robustly than we have been able to do here. In addition, as our highest catch rates and species numbers were recorded in June, a period not covered by previous studies, we suggest that future studies should cover more of the season of activity for ground-dwelling invertebrates.
In contrast to the findings by Vater and Matthews (2015), we found a strong link between spider richness and vegetation development from moss to herbaceous dominated sites. The preference of larger spiders for vegetated terrain is linked to their dependence on stabilized terrain for hunting, web building and hiding (Gobbi et al., 2006; Mrzljak and Wiegleb, 2000). Only Linyphiidae spiders were abundant in the pioneer terrain with substantially declining proportions after the emergence of herbaceous vegetation. These tiny spiders are commonly associated with bare terrain due to their “sit and wait” hunting strategy, cold-hardiness and efficient “ballooning” dispersal (Hodkinson et al., 2001), consistent with spider distribution patterns in other Nordic glacier forelands and in the Arctic (Bråten et al., 2012; Franzén and Dieker, 2014; Gillespie et al., 2020). Our lack of vegetation or soil links to beetle richness is likely due to the greater functional diversity and flexibility in habitat use of this group, and analysis with functional grouping may be required. In particular, within-species life stages may feed within and occupy different niches making them less responsive than spiders to vegetation development (Gobbi et al., 2017; Kędzior et al., 2020). Of particular note is the high abundance of herbivorous beetles such as H. rivularis (Elateridae) and P. metallica (Scarabaeideae), common at sites after the 50-year-old terrain. These species, and other members of both families are rarely described in glacier forelands (although see Friden, 1970, and Kaufmann, 2001). These species prefer moist and mild conditions and high abundances in this study may be linked to local warming trends of the past decades and subsequent higher plant resource availability (Buse et al., 2001; Kullman, 2016).
In general, our results support evidence from other glacier foreland studies in that distance from the glacier (a proxy for terrain age) is the strongest environmental gradient influencing invertebrate succession (Hågvar et al., 2020). However, in contrast to some previous studies, which report a strongly correlated gradient of terrain age and vegetation development, only spiders responded positively to increased vegetation development. Vegetation did not develop linearly with increasing terrain age, but rather had a peak in plant cover at the intermediate sites. A non-linear relationship of vegetation and terrain age was also shown by Rydgren et al. (2014) in the nearby glacier valley of Nigardsbreen. The authors explained this with the location of the glacier foreland below the tree line and changing local environmental conditions as soon as high and dense woody vegetation is present. A similar process is likely at Austerdalsbreen due to rapid birch woodland encroachment, although confirmation of this would require a more exhaustive vegetation assessment than is provided in our survey.
Invertebrate succession groups
Concerning the classification of our full dataset, our results resembled those of Vater and Matthews (2015) with a distinct pioneer assemblage, an early to mid succession stage and a late colonizer community. The pioneer assemblage encompassed the terrain released by the glacier in the past 15 years (sites D2, D3, D4), and accommodates many typical pioneer species such as the linyphid spiders E. arctica, Erigone atra and Oedothorax agrestis and the beetles Nebria rufescens, B. fellmanni (both Carabidae), Arctobyrrhus dovrensis (Byrrhidae), Geodromicus longipes and Anthophagus alpinus (both Staphylinidae; Hågvar et al., 2020; Hodkinson et al., 2001). Of those, only N. rufescens was also recorded by Vater and Matthews (2015). The early- to mid-succession stage then stretches through the intermediate terrain age zones B and C (S3 and S4). Interestingly, a high number of species associated with this stage do not appear in terrain older than 150 years. This corresponds to the findings of Vater and Matthews (2015) who found a diverse species assemblage in mid-successional zones in the Jostedalsbreen region, with a relatively large replacement change in old terrain. Indicative species of this succession stage are large beetle species such as H. rivularis (Elateridae), Pterostichus adstricus (Carabidae), P. metallica (Scarabaeidae), Pardosa amentata (Lycosidae), or Zelotes subteraneus (Gnaphosidae). Again, only few taxa are consistent with the original study, and the dominance of Pardosa sp. spiders remains. Finally, a late colonizer stage occurred in terrain older than 150 years (S1 and S2). Species group 1 is strongly associated with late succession due to the high number of species restricted to terrain older than 150 years, particularly larger species, such as the beetles Nicrophillus vespilloides (Silphidae) and Carabus violaceus (Carabidae), and the spiders Alopecosa pulverulenta (Lycosidae) and Micaria alpina (Gnaphosidae). Brambilla and Gobbi (2014) and Gobbi et al. (2006) have found a similar threshold in the Italian Alps for spiders and Carabidae after 100-year-old terrain. They interpreted their findings as a time delay of terrain stabilization in relation to glacier recession, which prevents slow colonizers from establishing in younger terrain. Friden (1970) also mentioned that woodland was relatively sparse in the glacial valleys of Jostedalsbreen 50 years ago, suggesting that this late colonizing assemblage follows a similar pattern to that of the Italian Alps: dispersal into the valley coinciding with the encroachment of birch woodland. Potentially, this late colonizing assemblage is more sensitive to disturbance, which prevents colonization of an intermediate succession zone that is affected by seasonal flood disturbances from numerous melt water streams.
Changes to invertebrate community composition
Our study is the first to revisit a glacier foreland to investigate changes in invertebrate primary succession after a considerable period. While we note that our datasets are not fully ecologically comparable, and that inter-annual variation between the two time periods has not been captured, the re-survey provides some interesting insights into species assembly of newly exposed terrain. We found substantially more species in the young terrain (Vater and Matthews, 2015 reported only two species), and some interesting species-specific differences. For example, the cold-adapted open ground specialists, such as the beetle B. fellmanni (Carabidae) and the spider Erigone longipalpes (Linyphiidae), occurred up to the oldest zone but not the youngest zone (zone D) in 2004. By contrast, in 2019, B. fellmanni and two Erigone spider species were the most abundant taxa at sites close to the glacier and were restricted to this terrain. Similarly, N. rufescens, a typical pioneer beetle (Bråten et al., 2012; Gereben-Krenn et al., 2011), had its highest abundance in the oldest terrain in 2004, but in 2019 its main distribution had shifted into the youngest terrain (zone D). This is surprising as N. rufescens is described as a good disperser that is adapted to many different environmental conditions (Gereben, 1995). Accelerated vegetation development in these habitats and reduced existence of small-scale microhabitats for early succession species could have caused these shifts (Bruno et al., 2019; Lancaster et al., 2017). This observed restriction of typical cold-adapted species to the pioneer stage could be an indication of decreased glacial influence on the local climate at late successional stages as hypothesized by Rosero et al. (2021) regarding retreating Andean glaciers. Several other, mostly opportunistic species with a wide distribution in both 2004 and 2019, have consistently expanded their range further toward the glacier than would be expected by the retreat of the ice. This suggests pioneer species may face increased competition stress as their habitat ranges contract from intermediate succession sites to the new terrain exposed by glacier retreat in the past 15 years. Continued climate warming is likely to further reduce the vegetation-free area in front of the receding glacier and facilitate faster colonization of late succession species that depend on more developed vegetation (Cannone and Piccinelli, 2021). While the size of Jostedalsbreen may be sufficient to provide refuges for cold-adapted species in newly exposed terrain in the coming decades (Moret et al., 2020; Tampucci, 2016), a recent comprehensive synthesis identified specialist cold-adapted species to be losers and more generalist species to be winners in the face of the glacier recession (Cauvy-Fraunié and Dangles, 2019). Results of our study support these proposed trends with small range pioneers losing habitat and wide range opportunists expanding their ranges. This could lead to a more pronounced role of competition than previously thought in Norwegian glacier forelands (Vater and Matthews, 2015). Consequently, we emphasize the need for more frequent monitoring of invertebrates in these systems to understand better the responses of pioneer species and later colonizers to continuing warming in the coming years (Gillespie et al., 2020).
Conclusions
We have found a considerably higher species richness of spiders and beetles in the glacier foreland compared to both the original study (110 species in 2019 vs 21 species in 2004) and other Nordic forelands. Further, our findings indicate: (1) a reduction in the extent of the pioneer community zone to the narrow strip of terrain released by the glacier in the past 15 years, and (2) a high species turnover at greater distances from the glacier front. We hypothesize that this replacement change is linked to climate warming as cold-adapted pioneer species become outcompeted more rapidly. These findings could challenge the “addition-and-persistence” model of succession proposed by Vater and Matthews (2015), as competition among invertebrates appears stronger than proposed in their model. In that study, the Austerdalsbreen foreland exhibited more evidence of replacement change than those at higher altitudes, but still suggested some persistence. However, here we show that the replacement change is more pronounced, suggesting possible shifts in the succession patterns. We cannot rule out the possibility that these are due to sampling effort or interannual differences and suggest that further research of these forelands is required.
Differences in sampling effort and annual variation in invertebrate abundances are likely to be important factors contributing to variation in the data. However, we suggest that based on range shifts of some species common to both samples, an altered or accelerated succession at Austerdalsbreen has occurred, potentially linked to milder conditions due to climate warming. Our findings support the conclusions of Rosero et al. (2021) that the influence of glaciers on local environmental conditions in glacier valleys is declining with further glacier recession. Thus, the glacier foreland environment and community composition may begin to resemble the ecosystem outside the foreland more rapidly, leaving species adapted to the glacier environment isolated in the restricted, most recently deglacierized zone surrounding the glacier front (Cauvy-Fraunié and Dangles, 2019). We suggest that future studies should more frequently re-survey invertebrates and vegetation from glacier forelands and beyond, to help disentangle annual population variations from longer term trends. However, as removal of individuals from restricted pioneer habitats may have detrimental impacts on populations, we support calls to develop standardized protocols to sample invertebrates in less destructive ways (Lencioni and Gobbi, 2021).
Supplemental Material
sj-docx-1-hol-10.1177_09596836221126032 – Supplemental material for Repeated survey along the foreland of a receding Norwegian glacier reveals shifts in succession of beetles and spiders
Supplemental material, sj-docx-1-hol-10.1177_09596836221126032 for Repeated survey along the foreland of a receding Norwegian glacier reveals shifts in succession of beetles and spiders by Christian Klopsch, Jacob C Yde, John A Matthews, Amber E Vater and Mark AK Gillespie in The Holocene
Footnotes
Acknowledgements
We thank Sindre Ligaard and Harald Løvbrekke for support in species identifications and Knut Rydgren for advice on ordination methods.
Funding
The author(s) received no financial support for the research, authorship, and/or publication of this article.
Supplemental material
Supplemental material for this article is available online.
References
Supplementary Material
Please find the following supplemental material available below.
For Open Access articles published under a Creative Commons License, all supplemental material carries the same license as the article it is associated with.
For non-Open Access articles published, all supplemental material carries a non-exclusive license, and permission requests for re-use of supplemental material or any part of supplemental material shall be sent directly to the copyright owner as specified in the copyright notice associated with the article.