
Abstract
The Nordic Seas are a key region for global ocean circulation, crucial in water mass exchange between the North Atlantic and the Arctic oceans, and deepwater formation. The advection of Atlantic Water (AW) to the Nordic Seas is decisive for the oceanography and climate of the region and beyond. Here, we present a set of sedimentary records, including two new cores from the western Nordic Seas to reconstruct the history of AW routing in the Nordic Seas over the Holocene. Our results show that the early Holocene (11.7–8 ka BP) thermal maximum, caused by an ‘overshoot’ of overturning circulation and high insolation, was limited to the eastern Nordic Seas, while the western part remained cold due to the meltwater blocking the spreading of AW. After 8 ka BP, the retreat of the freshwater lid allowed AW to reach the central Greenland Sea, where deep convection developed. After 5 ka BP, the increase in sea-ice export from the Arctic strengthened deep convection, which intensified the westward AW flow. A disruption of convectional activity around 2.7 ka BP, triggered by a minimum in solar activity, caused cooling and expansion of sea ice in the Nordic Seas and might have contributed to a global climatic deterioration. The overturning circulation in the Nordic Seas did not recover to its previous state until the present. We demonstrate that the rate of AW advection into the Nordic Seas alone is not enough to understand the oceanographic evolution of this area and its influence on regional or even global ocean and climate changes. The shifts in AW routing within the Nordic Seas and the rate of deep convection are also important.
Keywords
Introduction
The recent warming of water masses entering the Arctic Ocean through the Nordic Seas (e.g. Spielhagen et al., 2011; Walczowski and Piechura, 2007), a phenomenon described as ‘Atlantification’ (Tesi et al., 2021), is a clear indication of the rapid changes in this region. Due to the Arctic amplification effect (e.g. McKay and Kaufman, 2014; Serreze and Francis, 2006), these transformations are harbingers of changes that will affect the entire globe (e.g. Cohen et al., 2020). The northward flowing Atlantic Water (AW) carries enormous amounts of heat. It influences not only the ocean environment but also the atmosphere and the cryosphere in the region, including the Arctic sea ice and the Greenland Ice Sheet (GIS). Therefore, changes in the ocean circulation of the Nordic Seas have a tremendous impact both on the sea level and climate of the entire planet. For these reasons, their importance for our future cannot be overestimated (e.g. Boulton et al., 2014; Gildor et al., 2003; Liu et al., 2017, 2020; Rahmstorf et al., 2015; Yang et al., 2016). To understand the mechanisms that govern ocean circulation and its natural variability, studies of past ocean environments are necessary (e.g. Tesi et al., 2021). The Holocene is a crucial interval, as the configuration of continents and ice caps, sea level, atmospheric CO2 levels, etc. did not differ significantly compared to the modern day (e.g. Bova et al., 2021; Farmer et al., 2021; Vasskog et al., 2015). For this reason, the present interglacial period constitutes a robust framework allowing a direct comparison of oceanographic and climatic conditions.
The Nordic Seas are an important link to global ocean circulation. They are crucial in the exchange of water masses and, thus, warmth, salt, nutrients and sea ice between the North Atlantic and the Arctic Ocean. An even more important feature of the Nordic Seas is that they are one of the areas where open-ocean convection takes place leading to the deepwater formation (Marshall and Schott, 1999; Rudels and Quadfasel, 1991). Deep open-ocean convection is one of the drivers of global thermohaline circulation. For this reason, changes in ocean circulation within the Nordic Seas may have far-reaching consequences (e.g. Gildor et al., 2003; Liu et al., 2020; Rahmstorf et al., 2015; Srokosz and Bryden, 2015; Yang et al., 2016). The understanding of the mechanisms behind the natural oceanic variability (e.g. Hall et al., 2004; Lynch-Stieglitz et al., 2014; Tesi et al., 2021) is crucial for the predictions of future environmental changes, both in the oceans (e.g. Boulton et al., 2014; Clement et al., 2015) and in the atmosphere (e.g. Liu et al., 2017) and the Nordic Seas are a key area for such investigations.
Most of the previous reconstructions of the AW presence in the Nordic Seas focus on the intensity of AW advection through the Faeroe-Shetland Channel (e.g. Rasmussen and Thomsen, 2008, 2010) and the NAC flow along the Scandinavian, Barents Sea and Svalbard continental margins (e.g. Groot et al., 2014; Rasmussen et al., 2007, 2012, 2014; Ślubowska-Woldengen et al., 2007; Telesiński et al., 2018; Łącka et al., 2015, 2019) and/or through the Fram Strait into the Arctic Ocean (e.g. Aagaard-Sørensen et al., 2014; Spielhagen et al., 2011; Werner et al., 2015). Only a few studies concern the AW expansion towards the western Nordic Seas (Syring et al., 2020; Telesiński et al., 2014a, 2015; Zamelczyk et al., 2012; Zehnich et al., 2020) and virtually none of them tackles changes in the spatial distribution of AW over the present interglacial. Yet AW routing within the Nordic Seas appears to be an obvious next step in palaeoceanographic reconstructions of this important region. In this paper, we attempt to tackle this topic to better understand the development of oceanic circulation and its relationships with palaeoenvironmental conditions in the Nordic Seas.
To reconstruct the history of AW routing in the Nordic Seas over the Holocene, we compare a set of records from different parts of the basin depicting the intensity of AW advection (foraminiferal fauna records, subsurface water temperature (sSST) reconstructions, stable isotope records) and deepwater formation (radiocarbon ventilation age records). We present two new records covering the present interglacial – a radiocarbon ventilation age record from the Holocene section of core PS1878 in the central Greenland Sea and a foraminiferal fauna and stable isotope record of core OCE2017-GR02-GC (hereafter referred to as GR02) from a plateau on the northeastern Greenland continental slope.
Radiocarbon ventilation ages, defined as the ocean-atmosphere radiocarbon isotope disequilibrium (e.g. Soulet et al., 2016) and therefore broadly indicative of the time since the water was last in contact with the atmosphere are used to infer changes in past ocean circulation and air-sea gas exchange (Skinner and Bard, 2022). Radiocarbon measurements have been used to reconstruct past changes in ocean circulation, mostly over the last deglaciation (e.g. Robinson et al., 2005; Skinner and Shackleton, 2004; Stern and Lisiecki, 2013; Thornalley et al., 2011) including studies from the Nordic Seas (Ezat et al., 2017; Muschitiello et al., 2019; Telesiński et al., 2021; Thornalley et al., 2015). We attempt to evaluate whether the radiocarbon ventilation age reconstruction can be applied to track not only large scale (e.g. glacial-interglacial) but also minor ventilation changes (i.e. within an interglacial).
Modern oceanographic setting
The Nordic Seas form the northernmost part of the North Atlantic. They play a key role in warmth and salt transport from low to high latitudes as they constitute the main surface and the only deepwater connection between the Arctic and North Atlantic oceans (Figure 1). Relatively warm and saline (T > 3°C, S > 34.9) AW (Saloranta, 2001; Swift and Aagaard, 1981) is advected to the area by the North Atlantic Current (NAC) mainly through the Faroe-Shetland Channel but also over the Iceland-Faroe Ridge and through the Denmark Strait. AW then flows northward along the Norwegian coast. Part of it enters the Barents Sea while the rest continues northward along the shelf edge, confined to the continental slope (Saloranta and Svendsen, 2001), to eventually reach the Arctic Ocean through the eastern Fram Strait. In the western Nordic Seas, the chilled and dense Atlantic-origin Water returns southward along the East Greenland continental slope beneath a layer of cold, fresh Polar Surface Water and sea ice (Våge et al., 2018). This southward flow from the Arctic is supplied by the direct east-west recirculation of AW across the Fram Strait, referred to as the Return Atlantic Current (RAC) (Håvik et al., 2017). The East Greenland Current sends eastward branches – the Jan Mayen Current and the East Iceland Current – into the central part of the Nordic Seas (Marshall and Schott, 1999) where they meet western branches of the NAC (e.g. the RAC). The distribution of surface water masses in the Nordic Seas results in a threefold division of the basin. The eastern AW domain is separated by the Arctic Front from the central Arctic Water domain, an area of AW and Polar Water mixing. The western Polar Water domain, along the Greenland coast, is separated by the Polar Front (Orvik and Niiler, 2002; Swift, 1986).
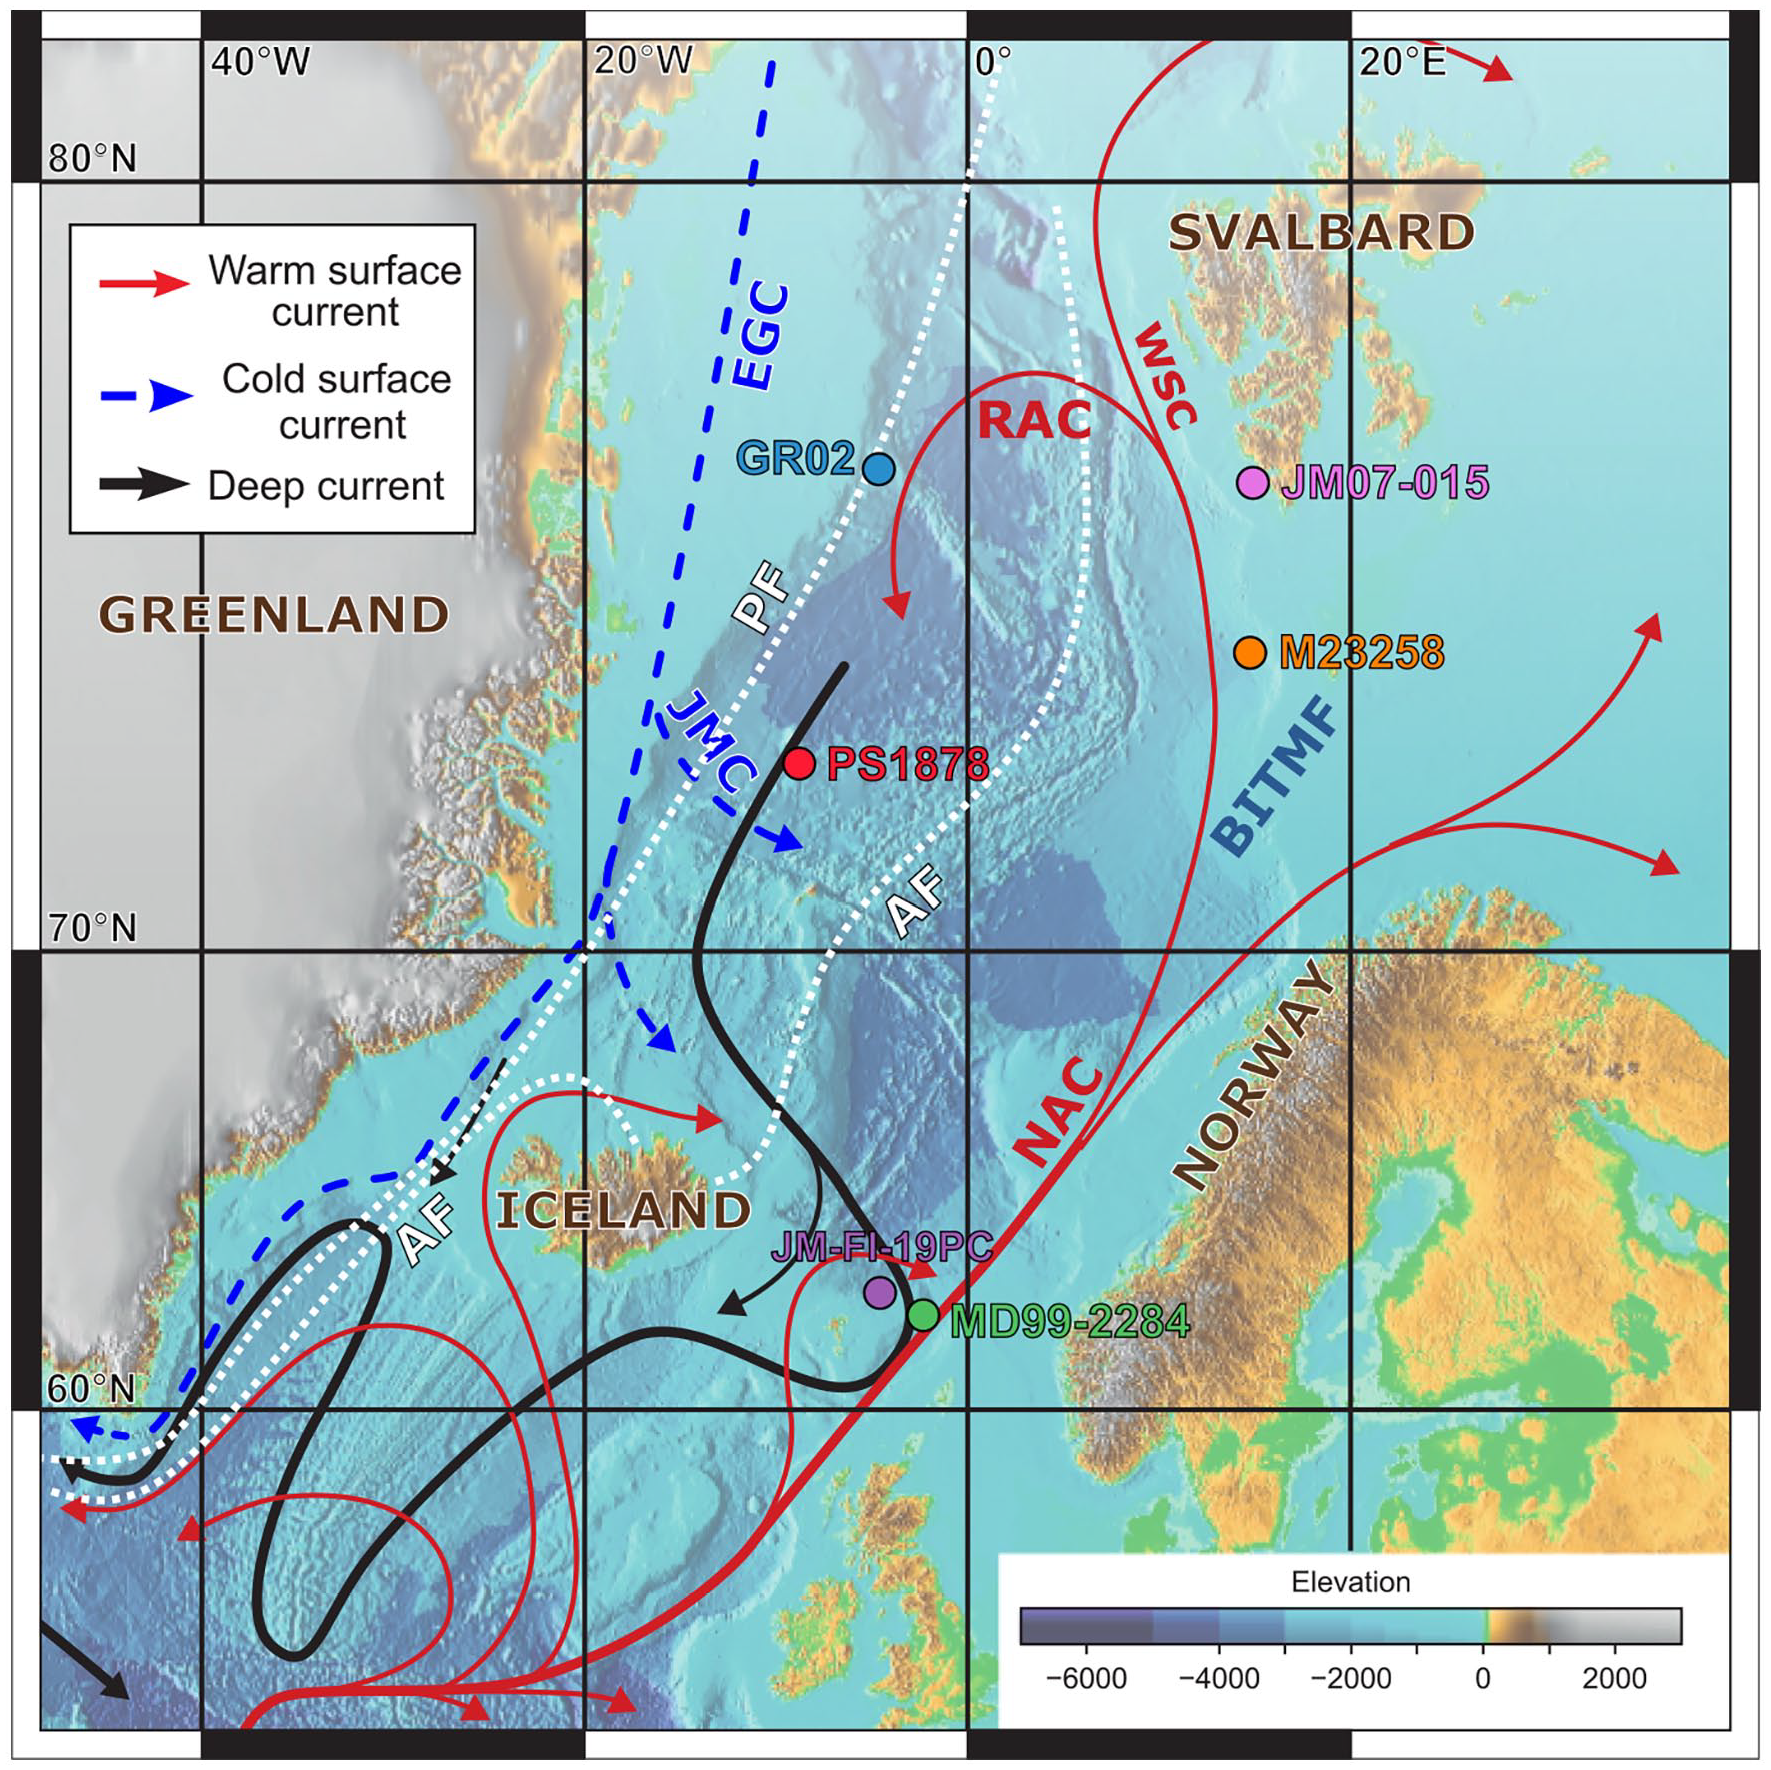
Map of major surface and deep currents in the Nordic Seas (Hansen and Østerhus, 2000). Location of studied cores PS1878 (3048 m water depth; red circle; Telesiński et al., 2014b) and GR02 (1200 m water depth; blue circle; this study) and other presented cores JM07-015 (148 m water depth; pink circle; Sternal et al., 2014), M23258 (1768 m water depth; orange circle; Sarnthein et al., 2003), JM11-FI-19PC (1179 m water depth; purple circle; Ezat et al., 2014) and MD99-2284 (1500 m water depth; green circle; Muschitiello et al., 2019). White dotted lines indicate oceanic fronts. AF: Arctic Front; BITMF: Bear Island Trough Mouth Fan; EGC: East Greenland Current; JMC: Jan Mayen Current; NAC: North Atlantic Current; PF: Polar Front; RAC: Return Atlantic Current; WSC: West Spitsbergen Current.
The Nordic Seas are one of the major areas in the world where open-ocean convection and deepwater formation takes place (e.g. Marshall and Schott, 1999; Petit et al., 2020; Rudels and Quadfasel, 1991). The western branches of the NAC and the eastern branches of the East Greenland Current create a cyclonic circulation in the Greenland Sea (known as the Greenland Sea gyre) and lead to a doming of the upper water layers. The deep convection develops mainly in winter, as the sea ice plays an important preconditioning role in the Greenland Sea, compared to other convection areas. As a consequence, convection goes down to >2000 m and weakly stratified Greenland Sea Deep Water is formed (Marshall and Schott, 1999). Subsequently, the water leaves the Nordic Seas as the Denmark Strait and Iceland-Scotland Overflow Waters (Hansen and Østerhus, 2000).
Material and methods
Sediment core PS1878 was retrieved from the central Greenland Sea (Figure 1, 73°15′N, 9°01′W, water depth 3048 m, Telesiński et al., 2014b). The chronology of the pre-Holocene part of the core is based on the alignment of the planktic δ18O record with cores JM11-FI-19PC (Ezat et al., 2014, 2017) and MD99-2284 (Bakke et al., 2009; Muschitiello et al., 2019) from the southern Norwegian Sea (Telesiński et al., 2021), while the Holocene part of the age model is based on AMS 14C dates of planktic foraminifera calibrated using Marine20 curve and the global-average reservoir age (Heaton et al., 2020). Subsurface and bottom water 14C ventilation ages of the deglaciation were reconstructed by Telesiński et al. (2021). Here we present for the first time the Holocene bottom water 14C ventilation ages by comparing the benthic radiocarbon dates of epifaunal species Cibicidoides wuellerstorfi and shallow infaunal species Oridorsalis umbonatus to contemporary atmospheric radiocarbon ages from the IntCal20 calibration curve (Reimer et al., 2020). Thereafter, we will refer to these ages as Benthic-Atmosphere (B-Atm) ventilation ages. The difference between paired benthic and planktic 14C dates was also calculated to determine the age difference between the subsurface and the bottom water, hereafter referred to as the Benthic-Planktic (B-P) age offset. The error is the sum of the benthic AMS 14C dating error and the IntCal20 error for B-Atm ventilation ages or the sum of the benthic and planktic AMS 14C dating errors for B-P age offsets. O. umbonatus is a detritus feeder that, although it lives mainly within the uppermost centimetre of the sediment, can also dwell on the sediment surface (Corliss, 1985; Rathburn and Corliss, 1994) and can thus be used to reconstruct bottom water conditions (e.g. Didié and Bauch, 2002; Telesiński et al., 2021). As the Holocene part of the PS1878 age model is based on radiocarbon dates of planktic foraminifera, we could not use them to reconstruct Planktic-Atmosphere (P-Atm) ventilation (reservoir) ages. However, it is generally agreed that at least since c. 9 ka BP the general ocean circulation and, thus, the reservoir ages were similar to today (Thornalley et al., 2015; Waelbroeck et al., 2001). Counts of planktic foraminiferal assemblages as well as planktic oxygen and carbon isotope records from core PS1878 were presented by Telesiński et al. (2014b) while absolute summer sSST (100 m water depth) and benthic oxygen and carbon isotope records were presented by Telesiński et al. (2014a).
Sediment core GR02 was retrieved from a plateau on the northeastern Greenland continental slope (Figure 1, 77°05′11″N, 5°19′53″W, 1200 m water depth) during an expedition of R/V Oceania in August 2017. Here we present the record from the uppermost 18.5 cm of the total 135 cm of core length. The core was sampled at 0.5 cm intervals. Between the surface (sample 0–0.5 cm labelled as 0.5 cm) and 10.5 cm each sample was analysed, while in the remaining part, every fourth sample (every 2 cm) was analysed to compensate for the change in sedimentation rate and to maintain a nearly constant time interval between samples. In addition, the main focus of the study was the Holocene so high temporal resolution was not important in the older interval. Samples were freeze-dried, weighed, wet-sieved through a 63 μm sieve, and subsequently split into size fractions using 100 and 500 μm sieves. Counts of planktic foraminiferal assemblages were conducted on representative splits (>300 specimens) of the 100–500 μm size fraction. The foraminiferal tests showed no significant signs of dissolution. Individual species were identified and counted. The number of planktic foraminifera per 1 g dry sediment as well as the percentage of individual species was calculated. Further in the discussion, we group the planktic foraminifera into polar (Neogloboquadrina pachyderma) and subpolar (including Neogloboquadrina incompta, Turborotalita quinqueloba and Globigerina bulloides) species groups (e.g. Schiebel and Hemleben, 2017). We are aware that such a grouping might be considered an oversimplification in terms of the ecology of individual species. For example, G. bulloides is also abundant in mid-latitudes, is associated with upwelling and its distribution might be modified by hydrologic conditions or the availability of prey (e.g. Chapman, 2010; Schiebel and Hemleben, 2017; Tolderlund and Bé, 1971). However, in palaeoceanographic studies of the Nordic Seas, these groups constitute two end-members allowing a qualitative reconstruction of oceanographic conditions (e.g. Rasmussen and Thomsen, 2008).
Stable oxygen and carbon isotope analyses were conducted on planktic species N. pachyderma and benthic species Cassidulina neoteretis. Approximately 25 pristine specimens of planktics and 10 specimens of benthics were picked from the 100-500 μm size fraction. All stable isotope analyses were performed at the Light Stable Isotope Mass Spec Laboratory, Department of Geological Sciences, University of Florida, USA using a Kiel III carbonate preparation device coupled with a Finnigan-Mat 252 isotope ratio mass spectrometer. Each batch of samples was measured with 8 NBS-19 and 2 NBS-18 standards. Standard masses were 30–50 µg. Samples and standards were loaded in individual glass Kiel vials (round bottom with socket tops) and placed in a carousel which was inserted into the Kiel oven. Phosphoric acid with a specific gravity of 1.92 (at 25°C) was used. The reaction temperature was 70°C and the reaction time was 10 min. Results are expressed in the δ notation referring to the PDB standard and are given as δ18O and δ13C with an analytical accuracy of 0.04‰ and 0.02‰, respectively, as estimated by the laboratory, based on the values yielded by the standards. Benthic δ18O values were corrected for the vital effect by 0.02‰ and benthic δ13C values by 1.5‰ (Poole, 1994). Both planktic and benthic δ18O values were corrected for global sea-level changes (Fairbanks, 1989).
The chronology of the presented section of core GR02 is based on 6 AMS 14C dates measured on planktic species N. pachyderma (Table 1). Each dated sample contained at least 1 mg of pristine specimens. All radiocarbon ages were calibrated using CALIB 14C age calibration programme (Rev 8.1.0; Stuiver and Reimer, 1993) and the Marine20 calibration curve with the global-average reservoir age (Heaton et al., 2020), and are given in thousand calendar years before AD 1950 (ka BP). The age models of cores JM07-015 (Sternal et al., 2014) and M23258 (Struve et al., 2019) used in this study are also mostly based on AMS 14C dates. We recalculated the original age models of these records using the Marine20 calibration curve (Heaton et al., 2020). Even though Heaton et al. (2020) stated that the Marine20 curve is not suitable for calibration in polar regions because of variability in sea ice extent, ocean upwelling and air-sea gas exchange, the earlier calibration curves were also based on tropical and subtropical records and their application in higher latitudes was hampered by possibly large changes in the age of the local surface ocean (Reimer et al., 2013 and references therein). As a result, several recent studies successfully applied the Marine20 curve in the Nordic Seas (e.g. El Bani Altuna et al., 2021; Farmer et al., 2021; Pados-Dibattista et al., 2022; Peral et al., 2021). As shown in Figure 2a and b, the differences yielded by calibration using Marine20 compared to Marine 13 are minor, especially taking into account the time scales discussed in this paper.
AMS 14C measurements and calibrated ages of core GR02.
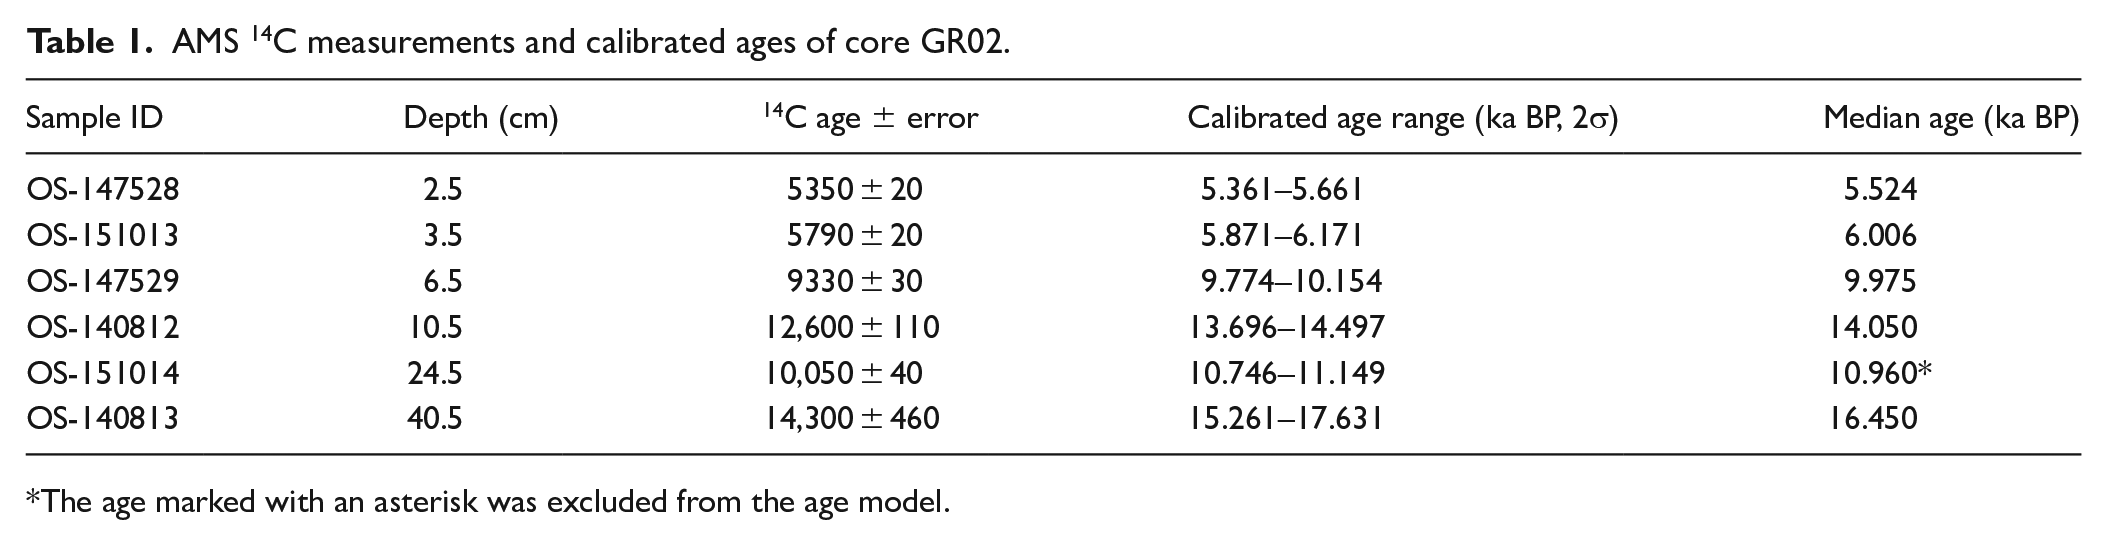
The age marked with an asterisk was excluded from the age model.
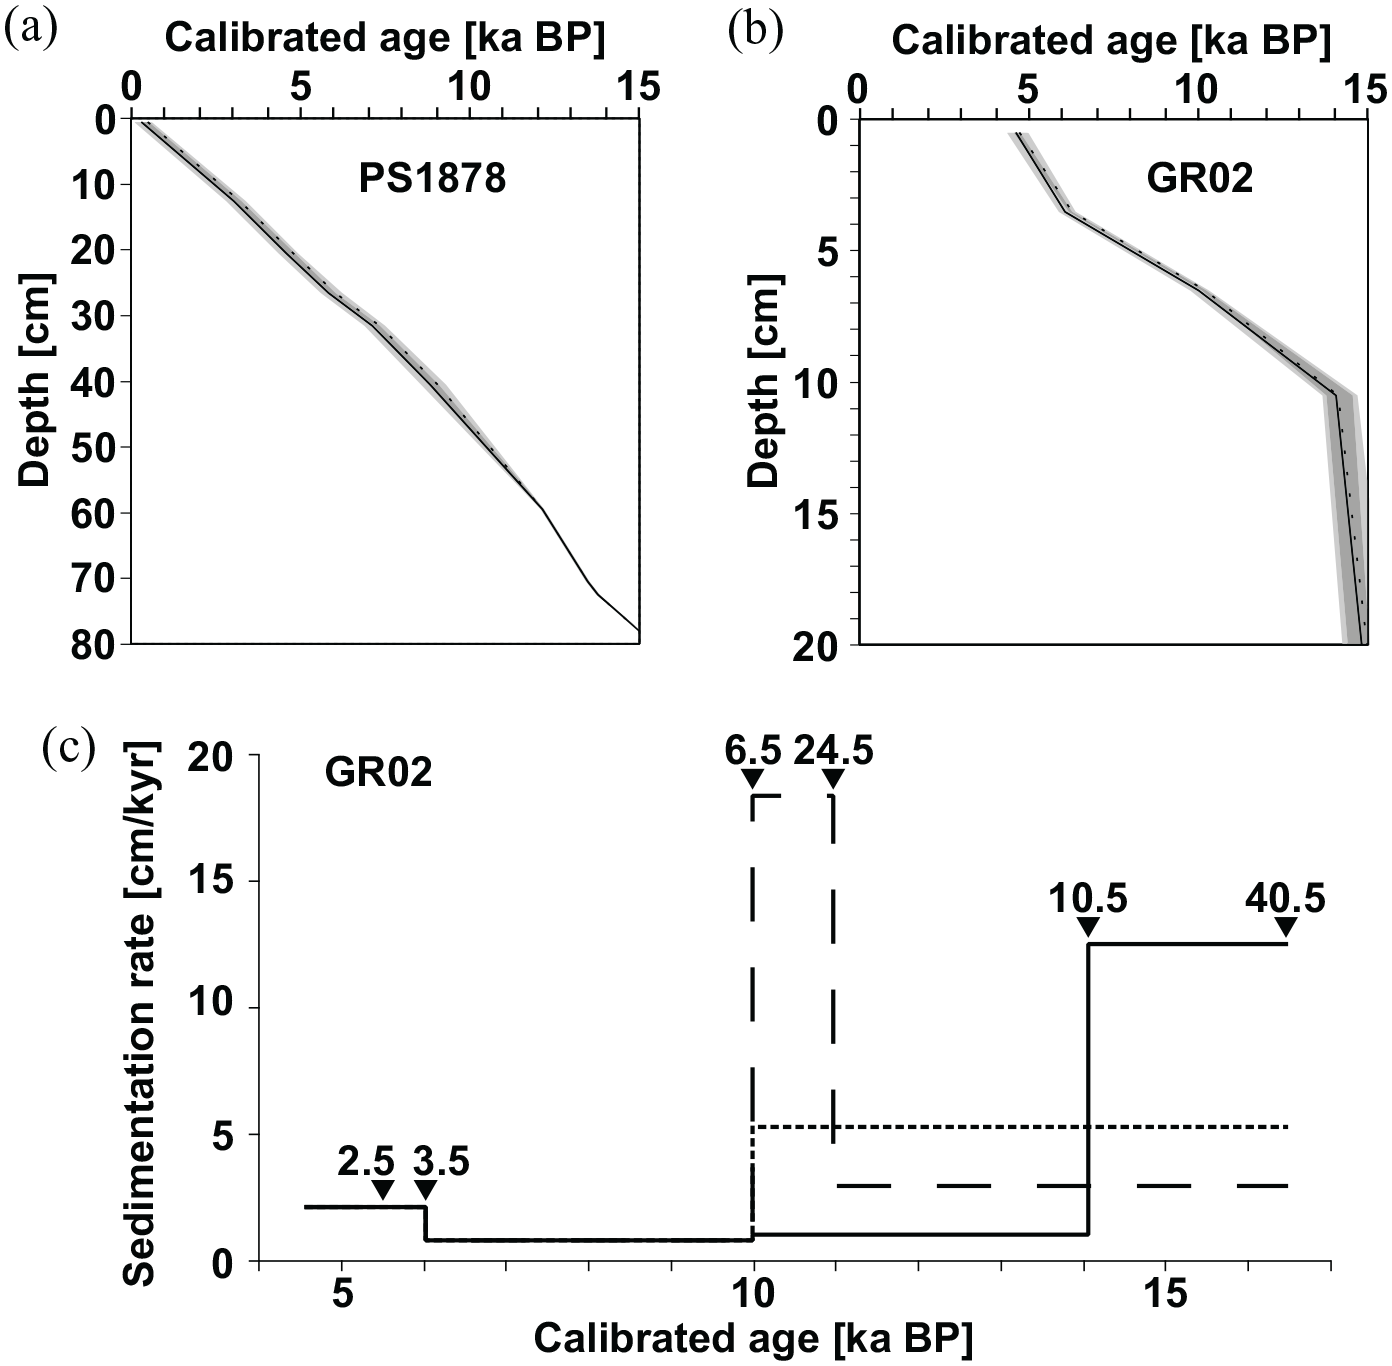
(a and b) Comparison of age models of cores PS1878 and GR02 calibrated using Marine13 (dotted lines) and Marine20 (solid lines) calibration curves with 2σ errors (grey envelopes). (c) Sedimentation rates of core GR02 when discarding the date at 24.5 cm (solid line), 10.5 cm (dashed line) or both dates (dotted line). Triangles indicate dated horizons and their depth (in cm).
Chronology of core GR02
The sample at 24.5 cm in core GR02 gave an age younger than the sample at 10.5 cm. Using the date at 24.5 cm and discarding the date at 10.5 cm would result in a sedimentation rate of 18.4 cm/kyr between 24.5 and 6.5 cm, that is, between 11 and 10 ka BP (Figure 2c). Such high sedimentation rates are unusual in records from more than 1000 m water depth in the central and western Fram Strait (e.g. Bauch et al., 2001a; Nørgaard-Pedersen et al., 2003). The lateral delivery of sediment via a landslide could explain these results. However, the sediment in core GR02 consists of olive-greyish fine-grained mud and pale orange sandy mud that indicates continuous sedimentation with no signs of sediment redeposition.
Using the date at 10.5 cm and discarding the date at 24.5 cm implies the occurrence of younger sediment in deeper layers without disturbing the sediment lying above. This can be explained, for example, by the presence of U- or J-shaped burrows, tubes, or other features made by the benthos. Foraminifera can either be translocated into such structures passively or select them for habitat due to particular biotic associations and geochemical conditions (see, e.g. Loubere et al., 2011). A similar situation appeared in core PS1878 where four samples of planktic foraminifera between 42.5 and 45.5 cm yielded reversed (too young) ages (Telesiński et al., 2021).
Using the date at 10.5 cm for the GR02 age model yields sedimentation rates of up to 12.5 cm/kyr between 40.5 and 10.5 cm, that is, between 16.5 and 14.1 ka BP (Figure 2c). This is still relatively high, but more plausible than 18.4 cm/kyr. Additionally, such high sedimentation rates during the early deglaciation can be explained by the location of the coring site proximal to the GIS margin, which could have still been located on the outer shelf or even close to the shelf break at that time (e.g. Fleming and Lambeck, 2004; Simpson et al., 2009). During the last deglaciation, sedimentation rates in the Nordic Seas were generally increased due to the collapse of ice shelves, enhanced melting, and retreat of ice sheet margins (e.g. Nørgaard-Pedersen et al., 2003).
The decrease in sedimentation rates observed in our record at 14.1 ka BP falls within the Bølling-Allerød interstadial (and already after the peak of Bølling), an interval of strong AW advection into the Nordic Seas caused by a resumption of Atlantic Meridional Overturning Circulation (AMOC; McManus et al., 2004) and deep water renewal (Ezat et al., 2017; Telesiński et al., 2021; Thornalley et al., 2011). The inflow of this warm water mass could have caused a rapid retreat of the GIS margin onto the inner shelf or even into the fjords, and by 14.1 ka BP, the GIS delivered less terrestrial material resulting in a decrease in sedimentation rates at our study site.
Alternatively, we could have discarded both dates (at 10.5 and 24.5 cm core depth). This would have resulted in a constant sedimentation rate of 5.2 cm/kyr between 40.5 and 6.5 cm, that is, between 16.5 and 10 ka BP (Figure 2c). Although the lack of higher (>10 cm/kyr) sedimentation rates produced by such a scenario might seem more plausible, we find it more convincing that the sedimentation rates were higher in the early deglaciation due to the proximity of the ice sheet margin and lower during the late deglaciation, after its retreat. Although core GR02 offers a limited temporal resolution compared to other records presented here, it is sufficient to depict the millennial-scale changes that are the main focus of this study and provides valuable information regarding the RAC activity.
Results
GR02 – planktic foraminifera and stable isotopes
In core GR02, the percentage of subpolar planktic foraminiferal species was around 20% before 14 ka BP, T. quinqueloba being the most common subpolar species (Figure 3). Between 14 and 7 ka BP, the percentage was relatively high (between 25% and 42%), with brief decreases below 20% around 12 ka BP and 10 ka BP. T. quinqueloba was still the most common subpolar species (15–26%) but the relative abundance of G. bulloides increased notably (up to 19%). After 7 ka BP the relative amount of subpolar species decreased to c. 10–20% with a repeated drop in the share of G. bulloides share (<10%).
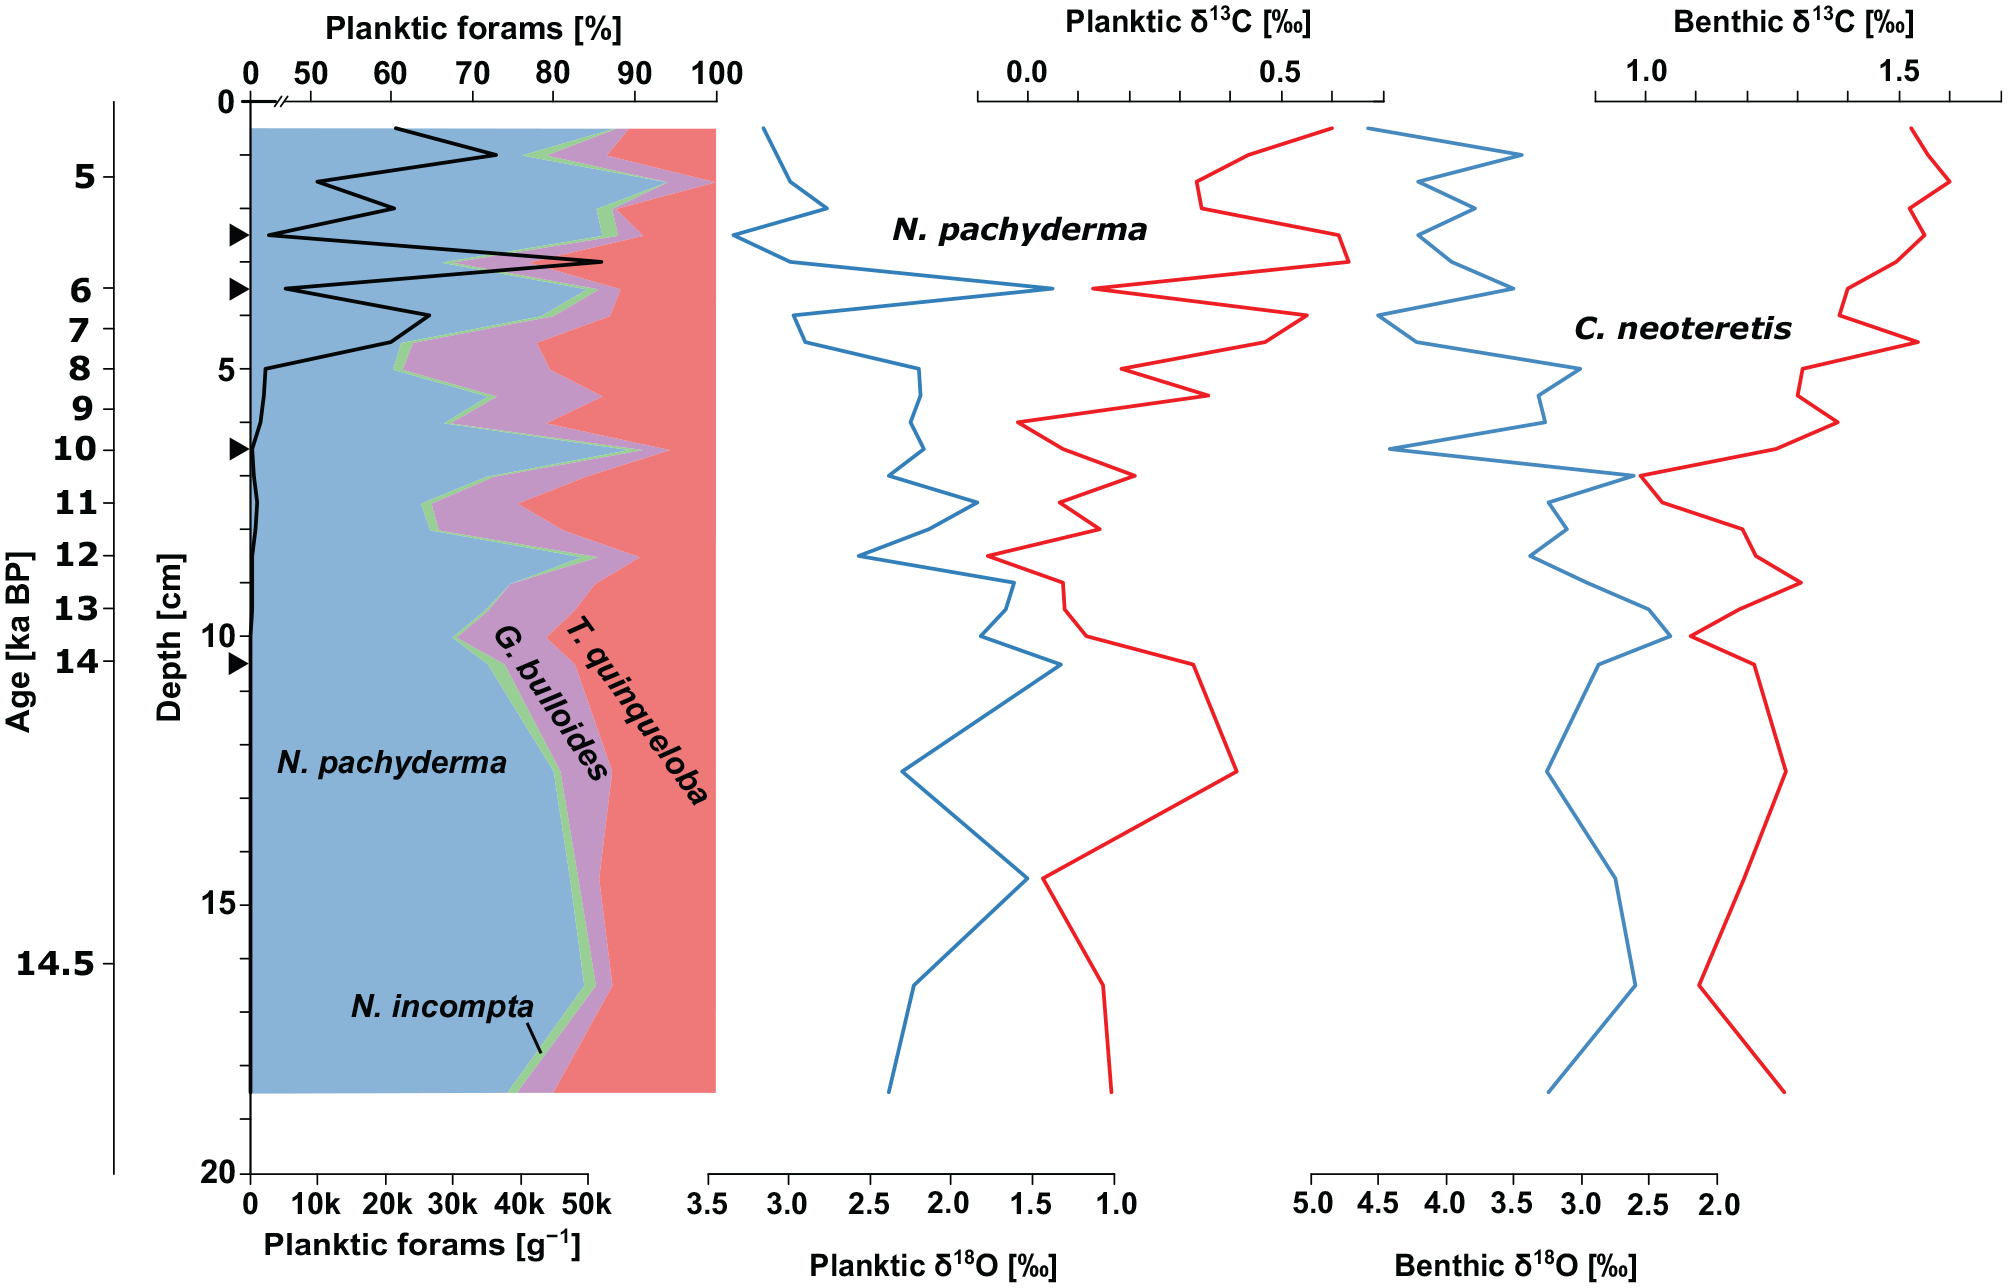
Planktic foraminiferal fauna and stable isotope proxy data of core GR02: relative abundance of planktic foraminiferal species, total abundance of planktic foraminifera (black line), planktic and benthic oxygen (blue lines) and carbon (red lines) stable isotope ratios. Black triangles on the depth axis mark the AMS 14C dates.
All the stable isotope records of core GR02 are characterised by substantial short-scale variability (Figure 3). Despite that, some general trends can be observed. The planktic δ18O record increased from c. 2‰ at 15 ka BP to c. 3‰ at 5 ka BP. The planktic δ13C values varied between c. 0‰ and 0.2‰ from 15 to 9.5 ka BP. Thereafter, they gradually increased to reach c. 0.6‰ at the end of the record. The benthic δ18O increased from c. 2.5‰ at 15 ka BP to c. 4‰ at 5 ka BP. The benthic δ13C values decreased from c. 1.3‰ at 15 ka BP to c. 1‰ at 10.7 ka BP. Thereafter, they gradually increased to reach c. 1.5‰ at the end of the record.
PS1878 – radiocarbon ventilation ages
The B-Atm ventilation ages in core PS1878 (Figure 4, Table 2) decrease from 1100 to 750 14C years in the early Holocene (~9 ka BP) to around 400 14C years between 8 and 4 ka BP, while the B-P offsets decrease from 750-350 14C years to below 100 14C in the same interval. Around 3 ka BP, the B-Atm and B-P values reach a minimum of c. 100 and −350 14C years, respectively, and subsequently increase to c. 940 and 270 14C years, respectively.
Benthic and planktic AMS 14C measurements and calculated Benthos-Atmosphere (B-Atm) ventilation ages and Benthic-Planktic (B-P) age offsets for core PS1878.
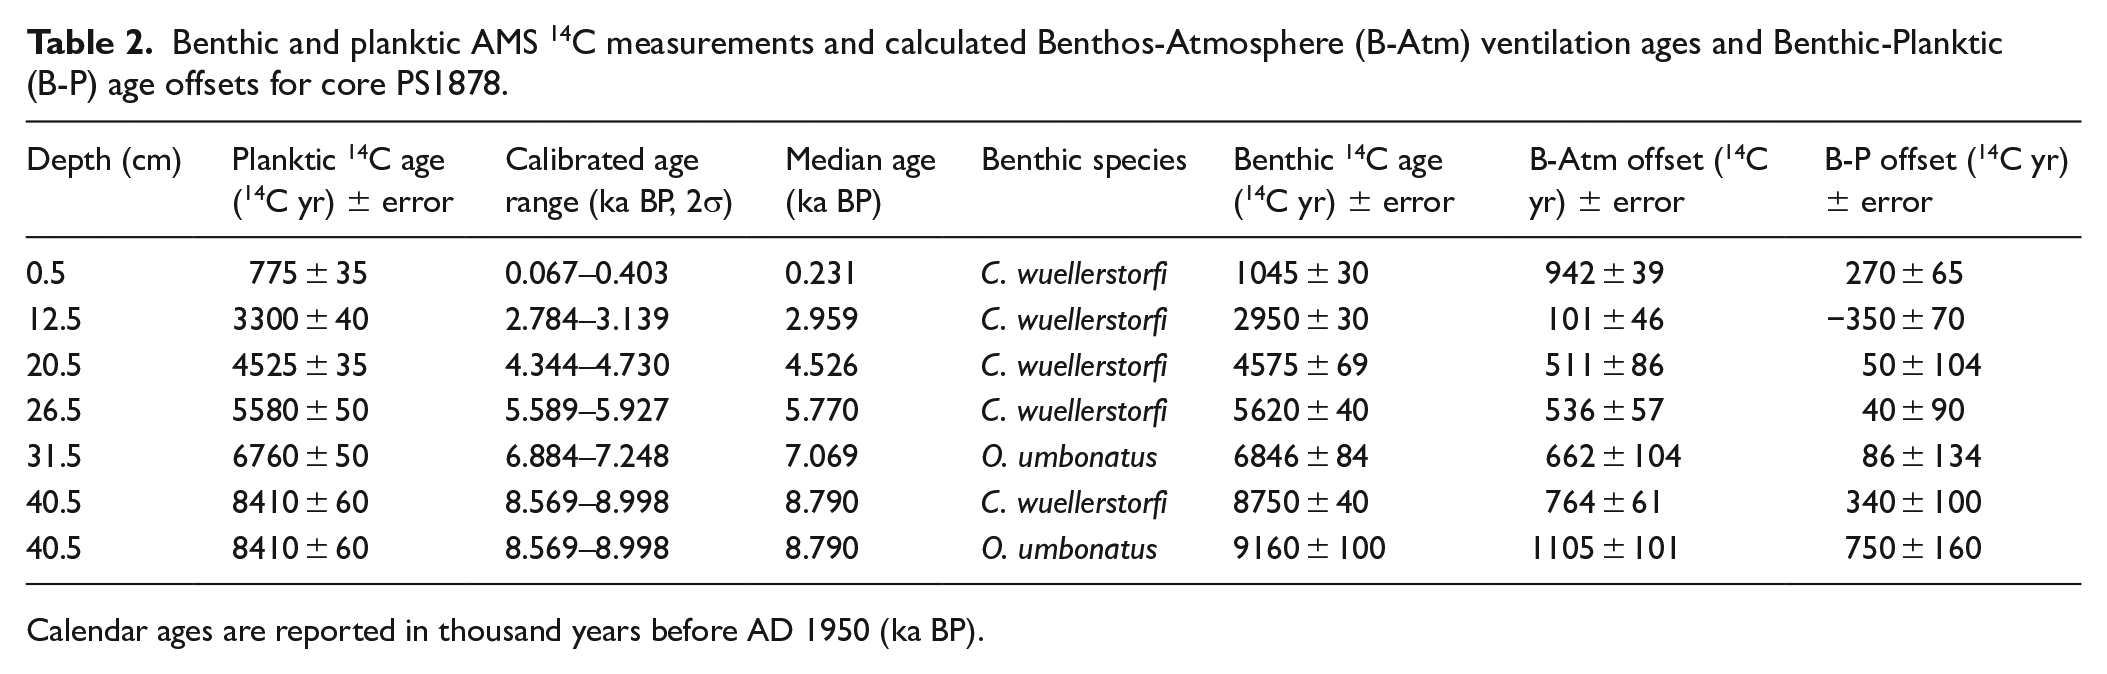
Calendar ages are reported in thousand years before AD 1950 (ka BP).
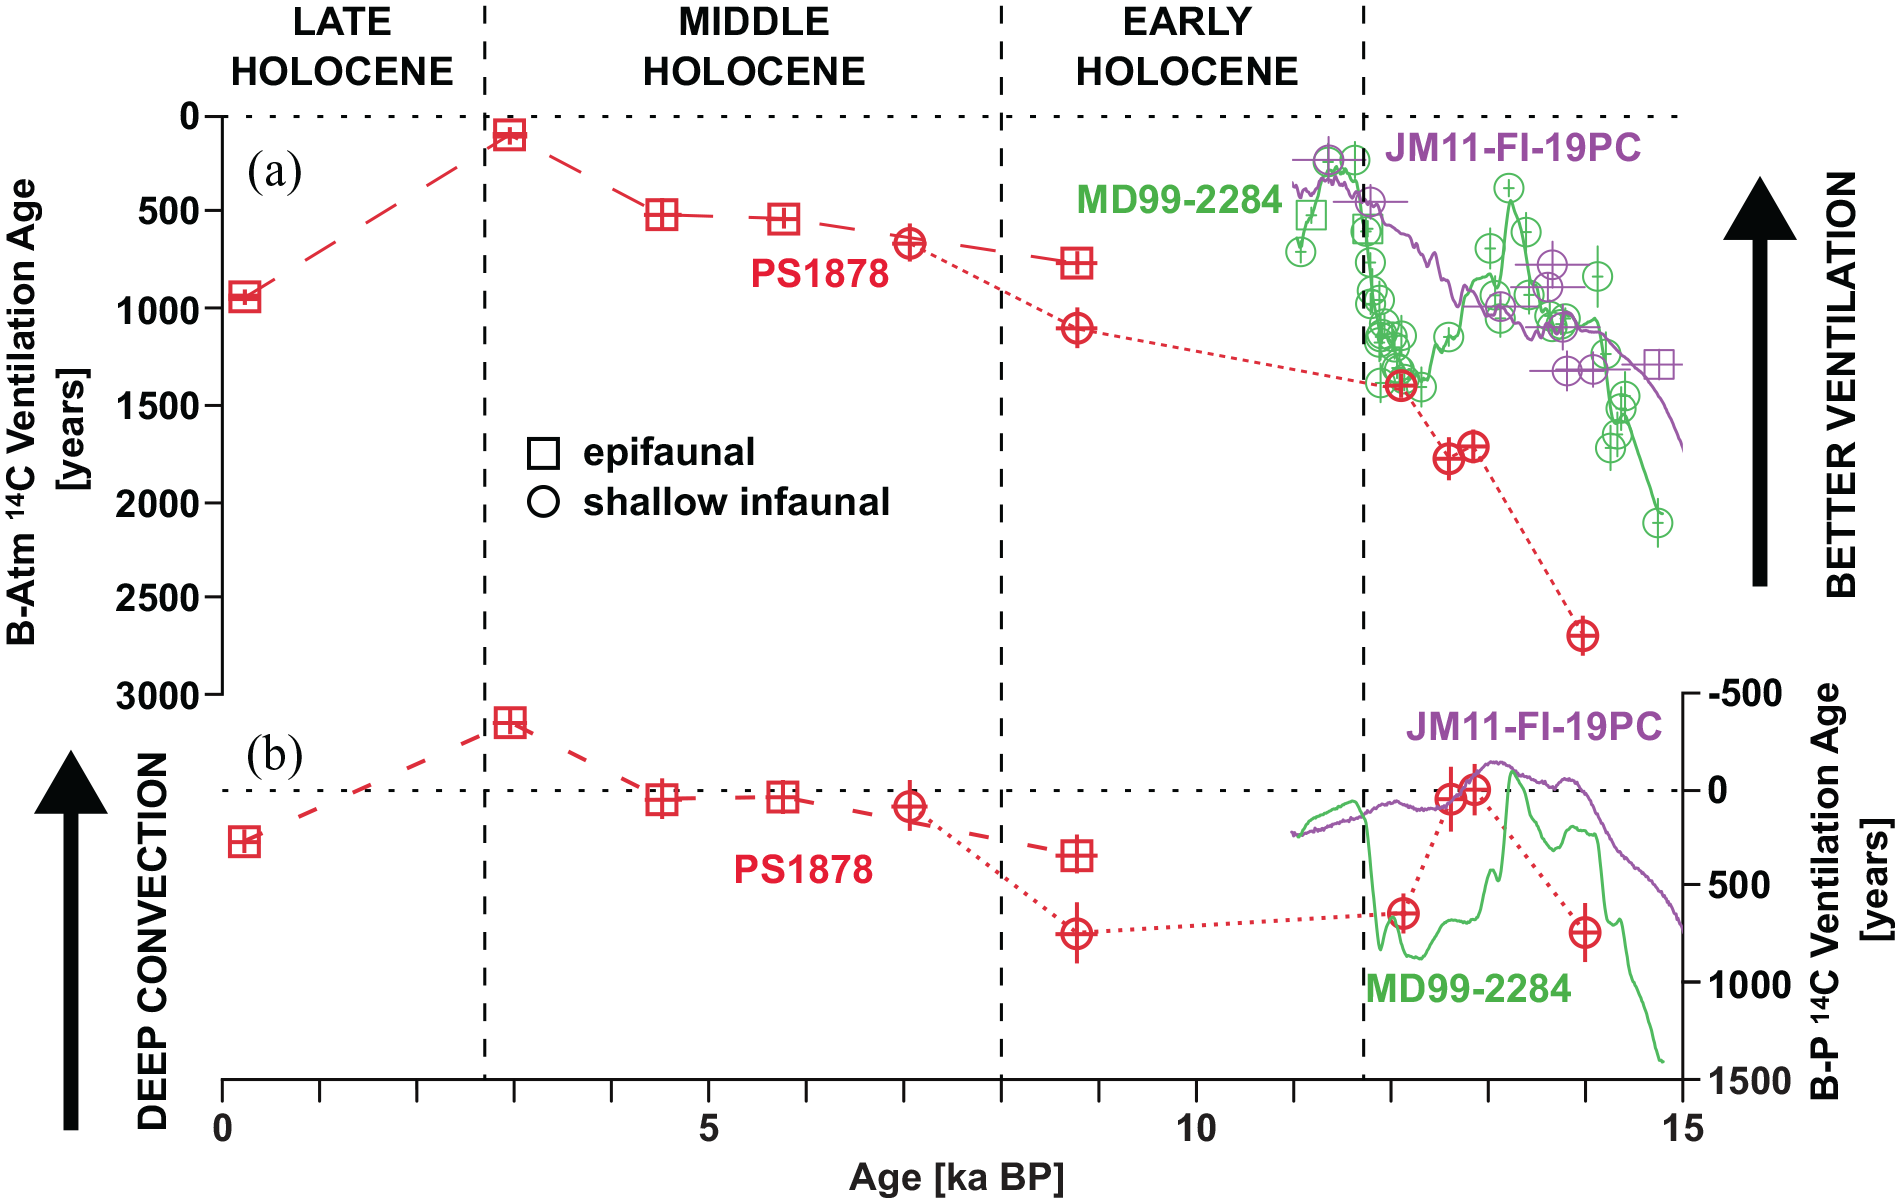
(a) Benthic-Atmosphere (B-Atm) ventilation age estimates and (b). Benthic-Planktic (B-P) offsets of core PS1878 (red; this study and Telesiński et al., 2021). Data points of epifaunal and infaunal benthic foraminifera are marked with squares and circles, respectively. B-Atm and B-P estimates from cores JM11-FI-19PC (purple) and MD99-2284 (green) are also shown (Telesiński et al., 2021).
Palaeoceanographic reconstruction
Weak (i.e. comparable with the late YD values) deepwater ventilation in the Greenland Sea (western Nordic Seas) is indicated by the PS1878 B-Atm ventilation age records at least until 8–9 ka BP (Figure 4). The B-P record indicates weak open-ocean convection that probably did not reach down to the bottom. This is in contrast with records from the southern Norwegian Sea (eastern Nordic Seas; Telesiński et al., 2021) showing decreasing B-Atm and B-P ventilation ages shortly after the onset of the Holocene (11.7 ka BP). The difference between the western and eastern Nordic Seas is also clearly seen in proxy records indicating AW advection. In core PS1878, the reconstructed sSST (Telesiński et al., 2014a), interpreted as a direct proxy of AW inflow, raised slowly and gradually (Figure 5). In comparison with the Greenland Sea record, in the northeastern Nordic Seas, the sSST (site M23258, Risebrobakken et al., 2011), as well as the abundance of AW indicators (site JM07-015, Telesiński et al., 2018), increased rapidly (Figure 5) indicating a maximum in AW advection already 10–11 ka BP (Husum and Hald, 2012; Risebrobakken et al., 2011). Shallow water (<50 m) temperatures around Svalbard were higher than at present (Mangerud and Svendsen, 2017) and AW reached the northern Svalbard shelf (Ślubowska-Woldengen et al., 2007), the northern Barents Sea (Berben et al., 2017) and as far as the western Fram Strait. Strong westward advection of AW across the Fram Strait at least since 10.6 ka BP is indicated by proxy data from the outer (Zehnich et al., 2020) and inner (Syring et al., 2020) northeastern Greenland continental shelf. The increasing planktic δ18O values (Figure 6) and the high percentage of subpolar planktic foraminiferal species (Figure 5) and, in particular, of G. bulloides (Figure 3) in core GR02 from the northeastern Greenland continental slope also support the direct AW recirculation across the Fram Strait. Since c. 11 ka BP, the planktic δ18O values at this site, hitherto relatively low and variable due to the influence of GIS meltwater, as well as the planktic δ13C values reached levels comparable with those from the eastern Nordic Seas (site M23258, Figure 6), suggesting that both sites were bathed by the same water mass.
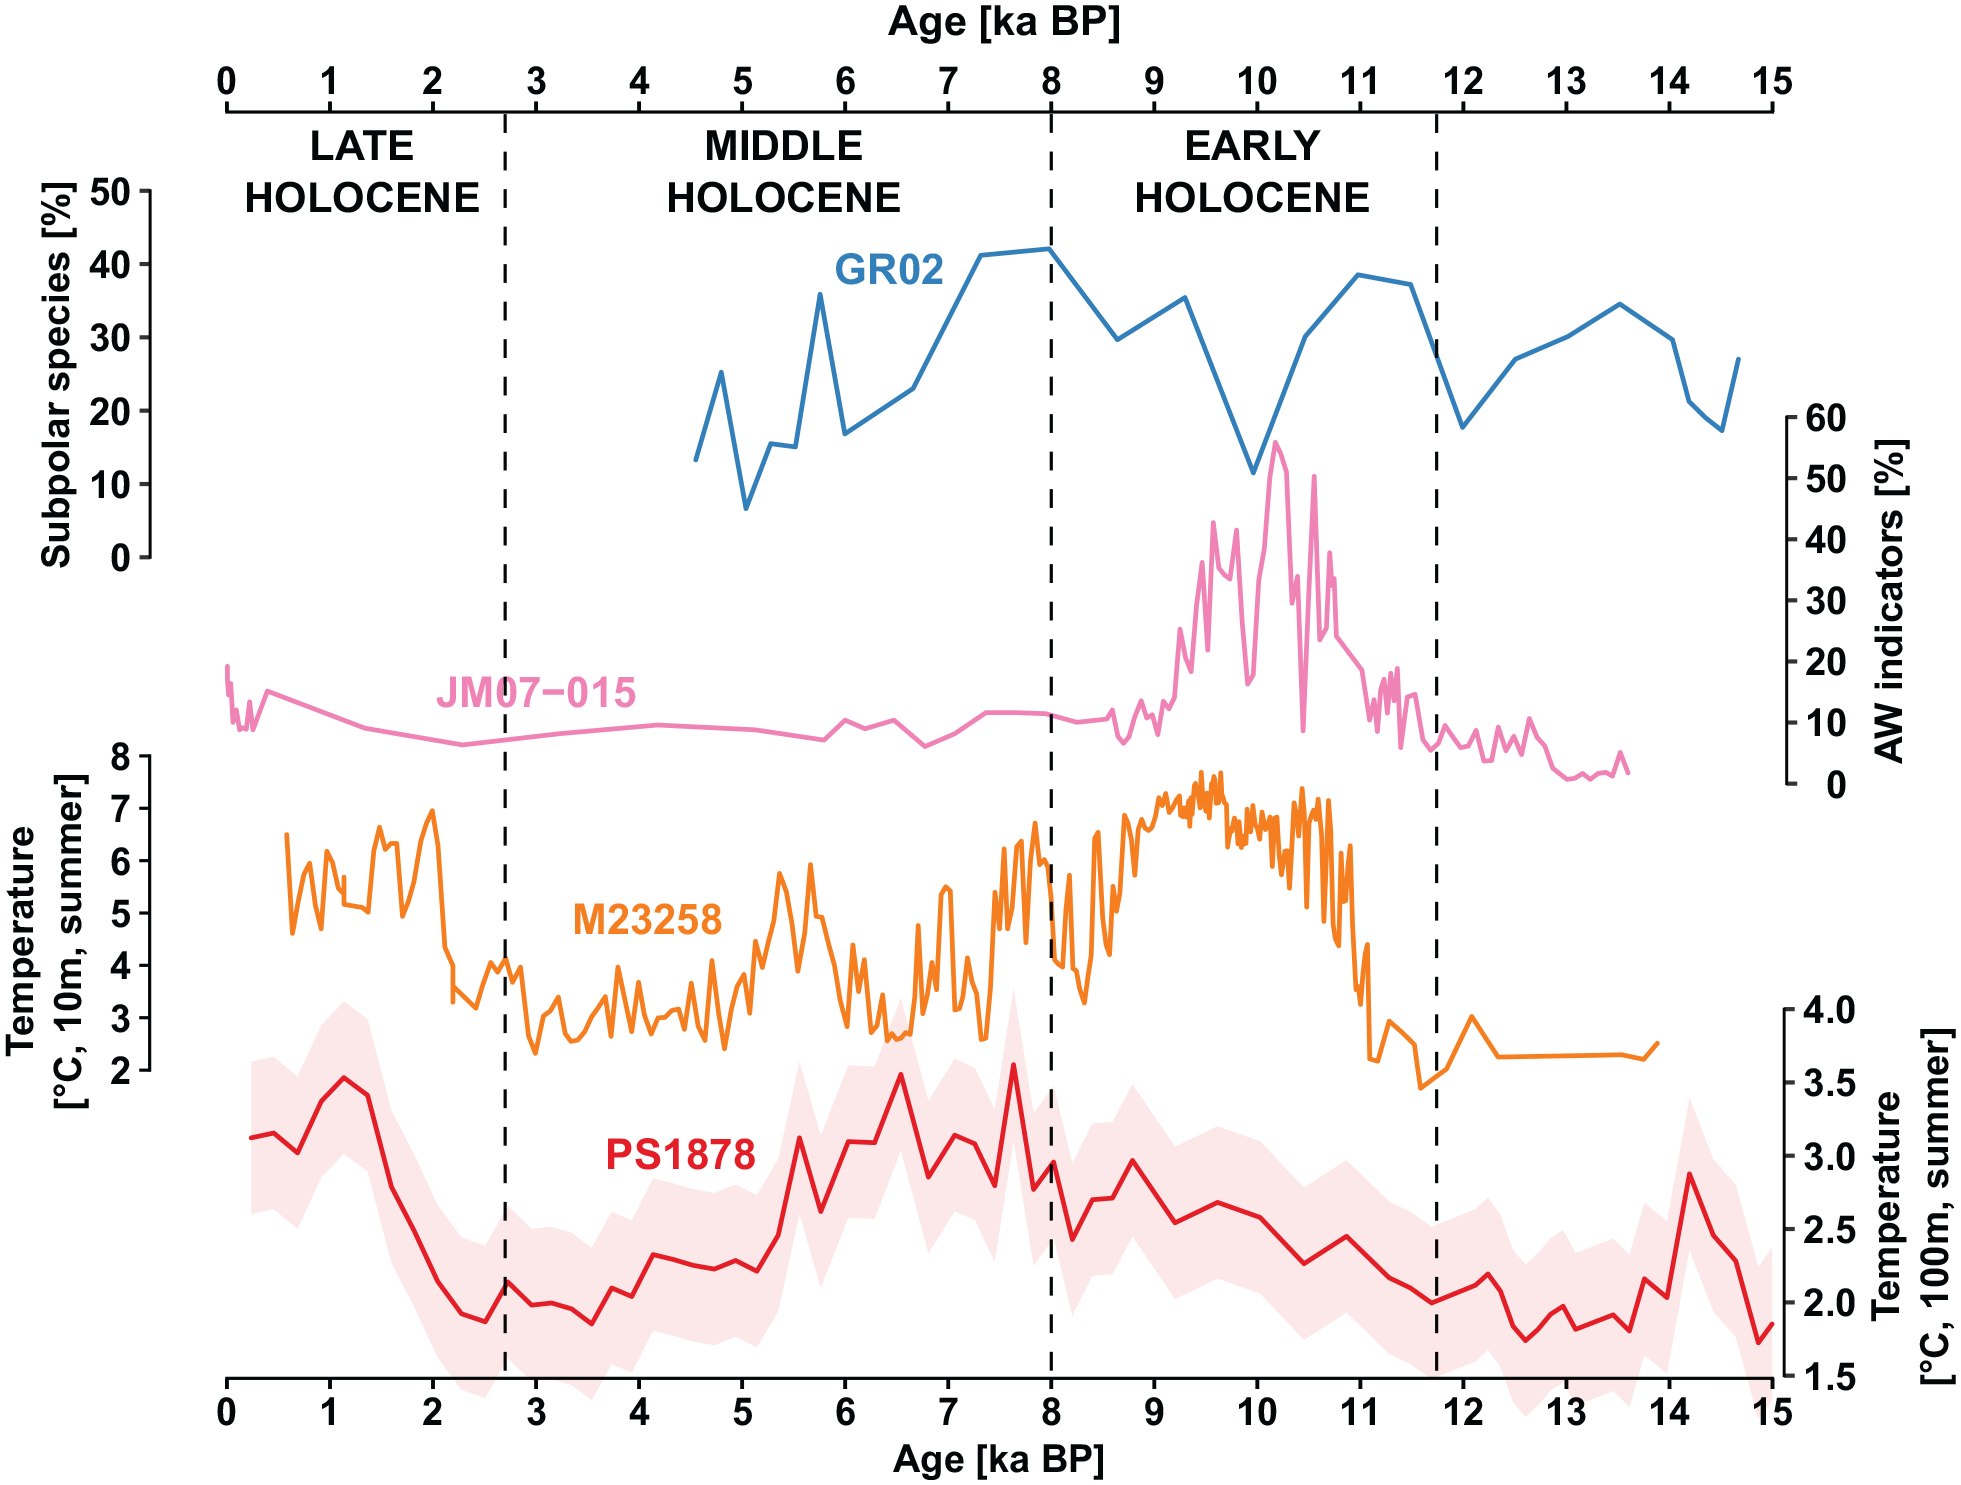
Proxy data used as indicators of AW advection: the relative abundance of subpolar foraminiferal species in core GR02 (blue), the relative abundance of benthic foraminiferal AW-indicating species in core JM07-015 (Telesiński et al., 2018), summer sSST (10 m water depth) reconstruction in core M23258 (Risebrobakken et al., 2011) and summer sSST (100 m water depth) reconstruction in core PS1878 (Telesiński et al., 2014a).
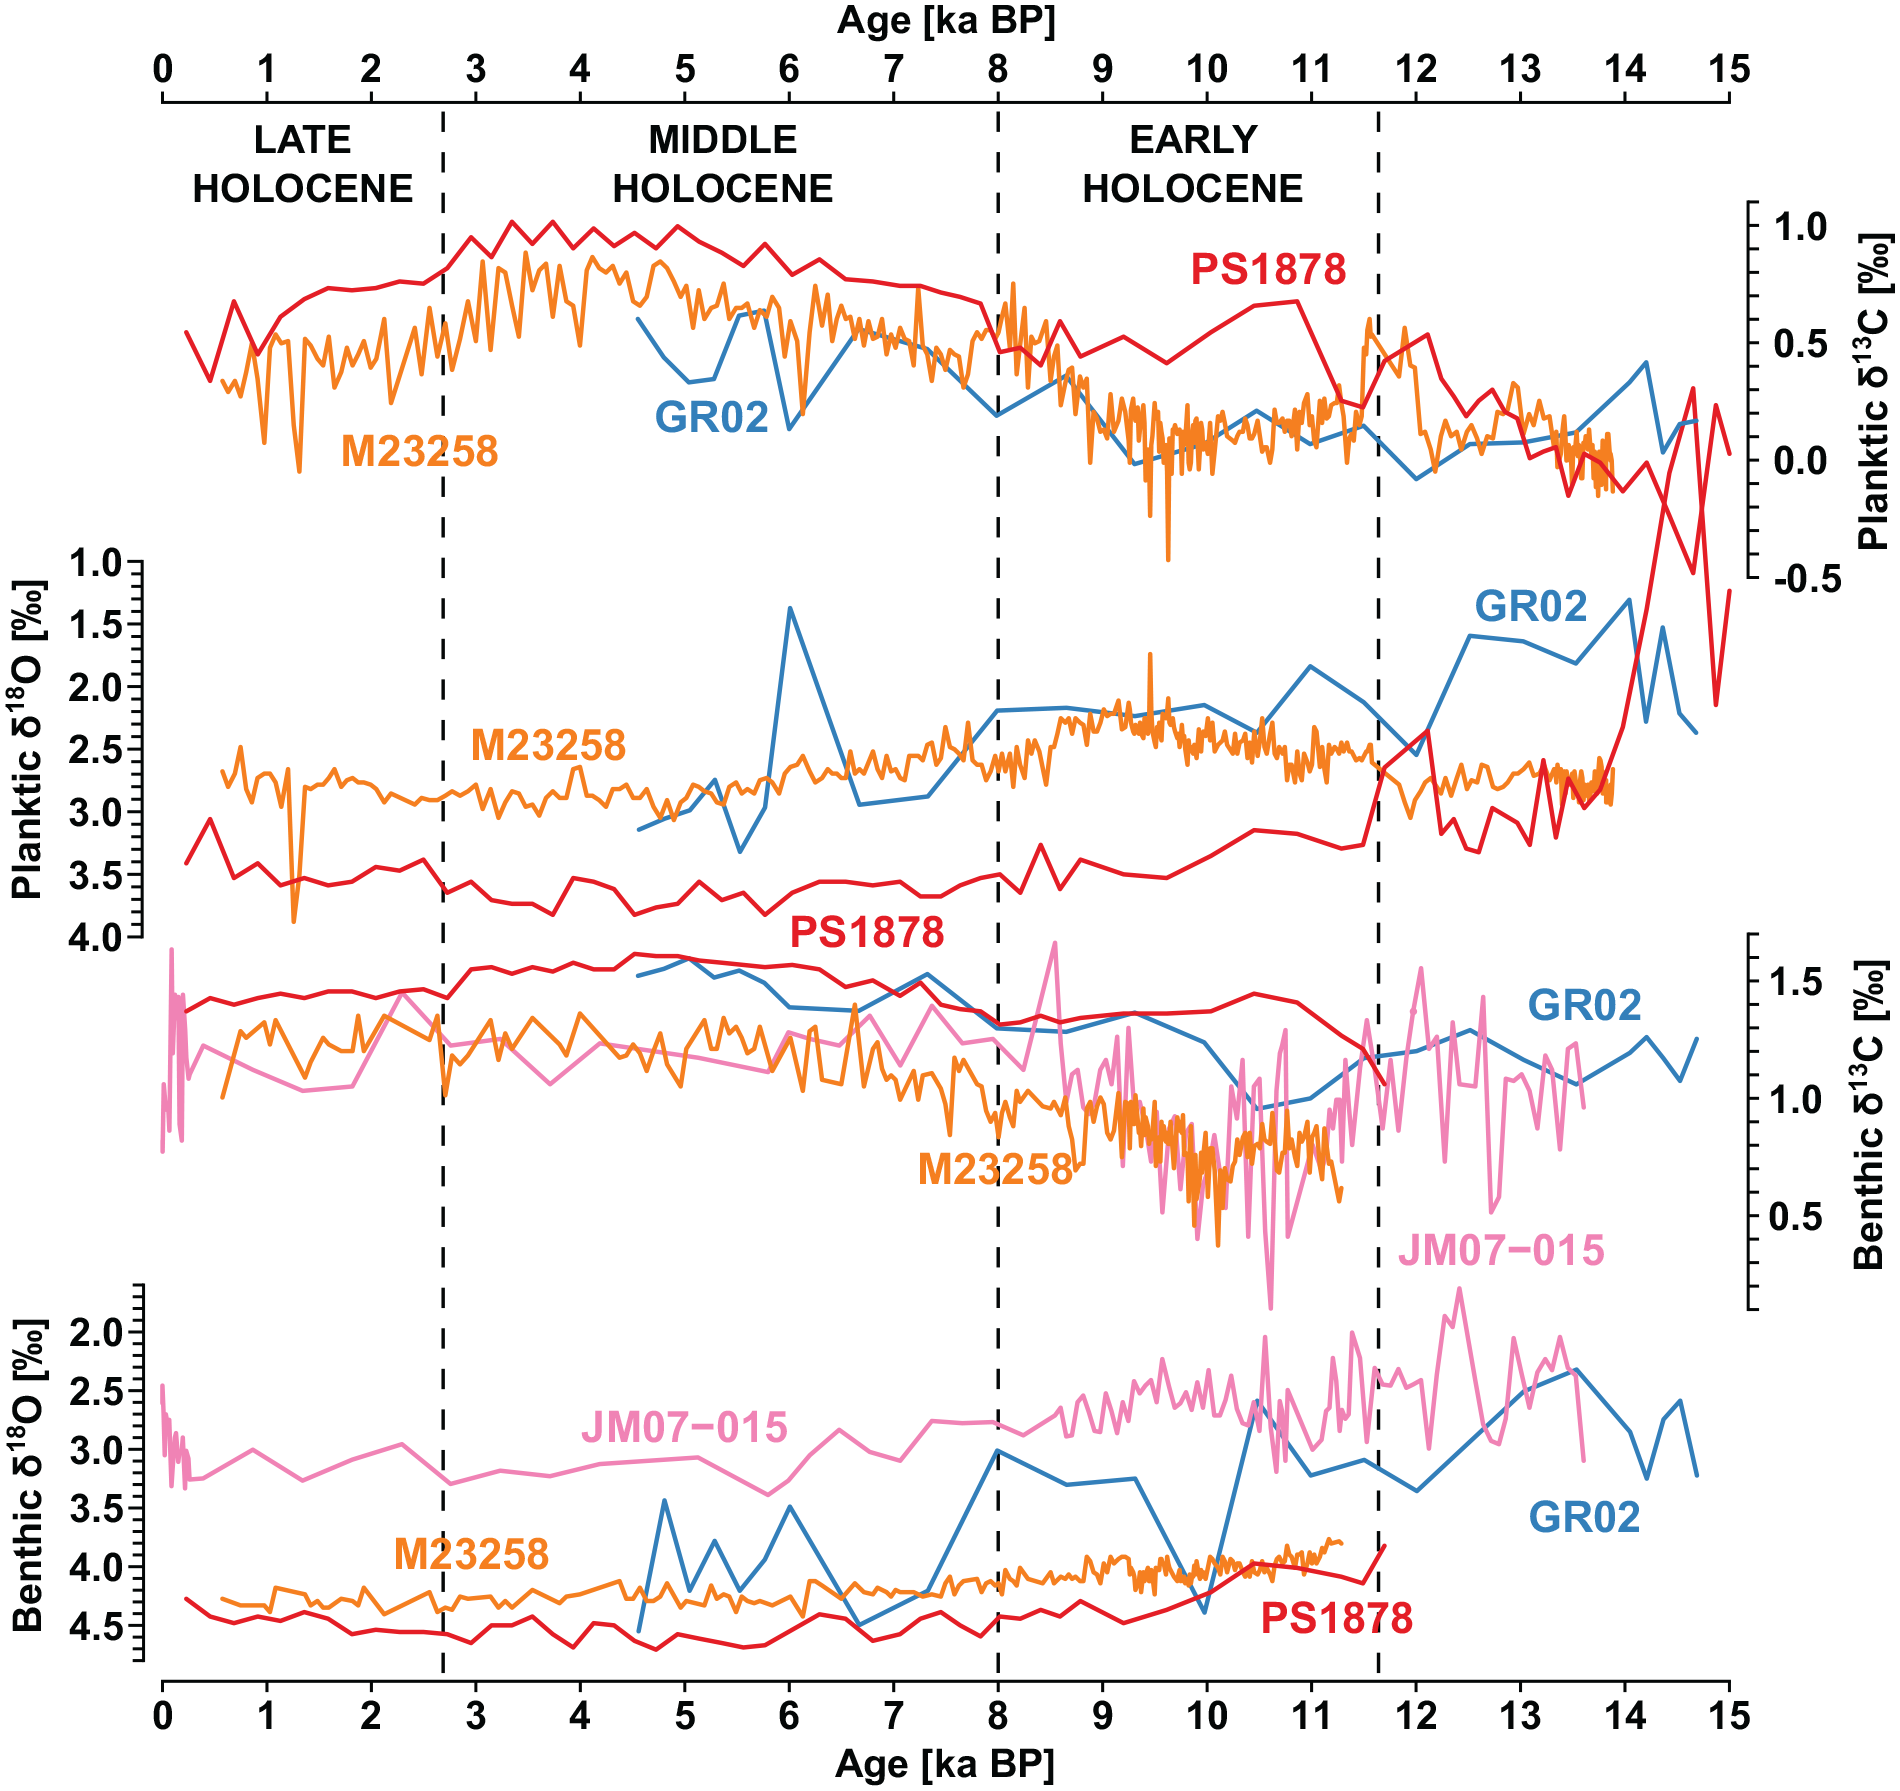
Planktic and benthic carbon and oxygen stable isotope records of cores PS1878 (Telesiński et al., 2014a; red; Telesiński et al., 2014b), GR02 (blue; this study), JM07-015 (pink; Telesiński et al., 2018) and M23258 (orange; Risebrobakken et al., 2011). All δ18O values were corrected for global sea-level changes (Fairbanks, 1989).
The sSST maximum in the northeastern Nordic Seas terminated after 9 ka BP (Figure 5, Hald et al., 2007; Husum and Hald, 2012; Telesiński et al., 2018). The RAC strength reached its maximum around 8 ka BP, as inferred from the planktic foraminiferal data of core GR02 (Figure 5), but it declined shortly thereafter (Syring et al., 2020; Zehnich et al., 2020). These shifts were accompanied by increased surface water stratification (Bauch and Weinelt, 1997).
On the contrary, in the western Nordic Seas (site PS1878) the sSST and the AW advection increased and until c. 5.5 ka BP remained at a significantly higher level than in the early Holocene (Figure 5), especially compared to the northeastern Nordic Seas (Hald et al., 2007; Risebrobakken et al., 2011; Telesiński et al., 2015). Around the same time (c. 8 ka BP), we observe a decrease in benthic radiocarbon ventilation ages in core PS1878, indicating an increase in the rate and/or depth of open-ocean convection and deepwater ventilation in the western Nordic Seas (Figure 4). Also, the benthic δ13C values of this core started to increase right after 8 ka BP (Figure 6, Telesiński et al., 2014a), supporting an enhanced bottom water ventilation in the Greenland Sea.
Around 5.5 ka BP, sSST decreased significantly both in the western (PS1878) and northeastern (M23258) Nordic Seas (Figure 5). A decrease in sSST (Werner et al., 2013), as well as surface water temperatures (Calvo et al., 2002; Łącka et al., 2019), can also be observed in other records from the northeastern Nordic Seas. The GR02 record also shows a decrease in subpolar planktic foraminiferal abundance, suggesting subsurface cooling.
At the same time, no sign of a decrease in deepwater ventilation can be found in core PS1878 (Figure 4) suggesting that the open-ocean convection remained active and that AW was still reaching site PS1878 in the central Greenland Sea. In fact, after 4 ka BP the radiocarbon ventilation ages decreased and around 3 ka BP reached a minimum. Although the negative B-P offset at this time seems improbable, it might suggest that the rate and/or depth of open-ocean convection reached its maximum and was even stronger than at present. Possibly, the planktic reservoir ages were also smaller than at present.
The radiocarbon ventilation age record of core PS1878 (Figure 4) indicates a slow-down of open-ocean convection rate after 3 ka BP. The planktic and benthic δ13C data of the same core (Figure 6), as well as other Nordic Seas records (Telesiński et al., 2015) also suggest a stepwise decrease in bottom water ventilation around that time. The decrease occurred within the Holocene minimum of sSST in the Greenland Sea (Figure 5). Around the same time, a sea-ice advance was observed in the eastern Fram Strait (Müller et al., 2012) and southern Svalbard (Knies et al., 2017). In the uppermost 1 cm of core PS1878 dated to 0.23 ka BP, the B-P ventilation age reach 270 14C years (Figure 4) which is higher than the mid-Holocene values but close to the modern B-P offset of ~100 14C years in the Nordic Seas (Ezat et al., 2019; Hansen and Østerhus, 2000). The benthic δ13C record of core PS1878 (Figure 6) also suggests that the bottom water ventilation in the late-Holocene was less intense than between 8 and 3 ka BP.
Implications for AW circulation in the Nordic Seas
The presented proxy records and their palaeoceanographic interpretation allows us to reconstruct the Holocene history of AW routing in the Nordic Seas. Shortly after the onset of the Holocene (11.7 ka BP), the AMOC accelerated rapidly (McManus et al., 2004) as exemplified by the rapid increase of bottom water ventilation in the southern Norwegian Sea (Figure 4; Telesiński et al., 2021). The AW advection into the eastern Nordic Seas increased to a maximum around 10 ka BP and finally reached the Arctic Ocean (Figure 7), a process that can be regarded as an analogue to the recent Atlantification (Spielhagen et al., 2011; Tesi et al., 2021). Based on the indications of AW presence on the western side of the Fram Strait (GR02, Syring et al., 2020; Zehnich et al., 2020), we suggest the activation of the direct east-west AW recirculation, that is, the RAC, already in the early Holocene (c. 11.5 ka BP). It is suggested that the ‘overshoot’ of AMOC around 10 ka BP (Risebrobakken et al., 2011) was caused by its reduced strength through the deglaciation and the resulting buildup of a North Atlantic subsurface reservoir of heat and salt that was available for northward advection when the ice sheets diminished, the meltwater flux decreased and the North Atlantic convection sites rejuvenated (Knorr and Lohmann, 2007). In contrast, the western Nordic Seas were in the early Holocene still strongly influenced by the deglacial freshwater input from the Arctic Ocean and the GIS, as indicated by modelling (Blaschek and Renssen, 2013) and proxy (Bauch and Weinelt, 1997; Seidenkrantz et al., 2012) results. The freshwater may have delayed the AW advection as a surface or shallow subsurface layer and the warming in the area, thereby influencing the AMOC development in general (e.g. Sejrup et al., 2016).
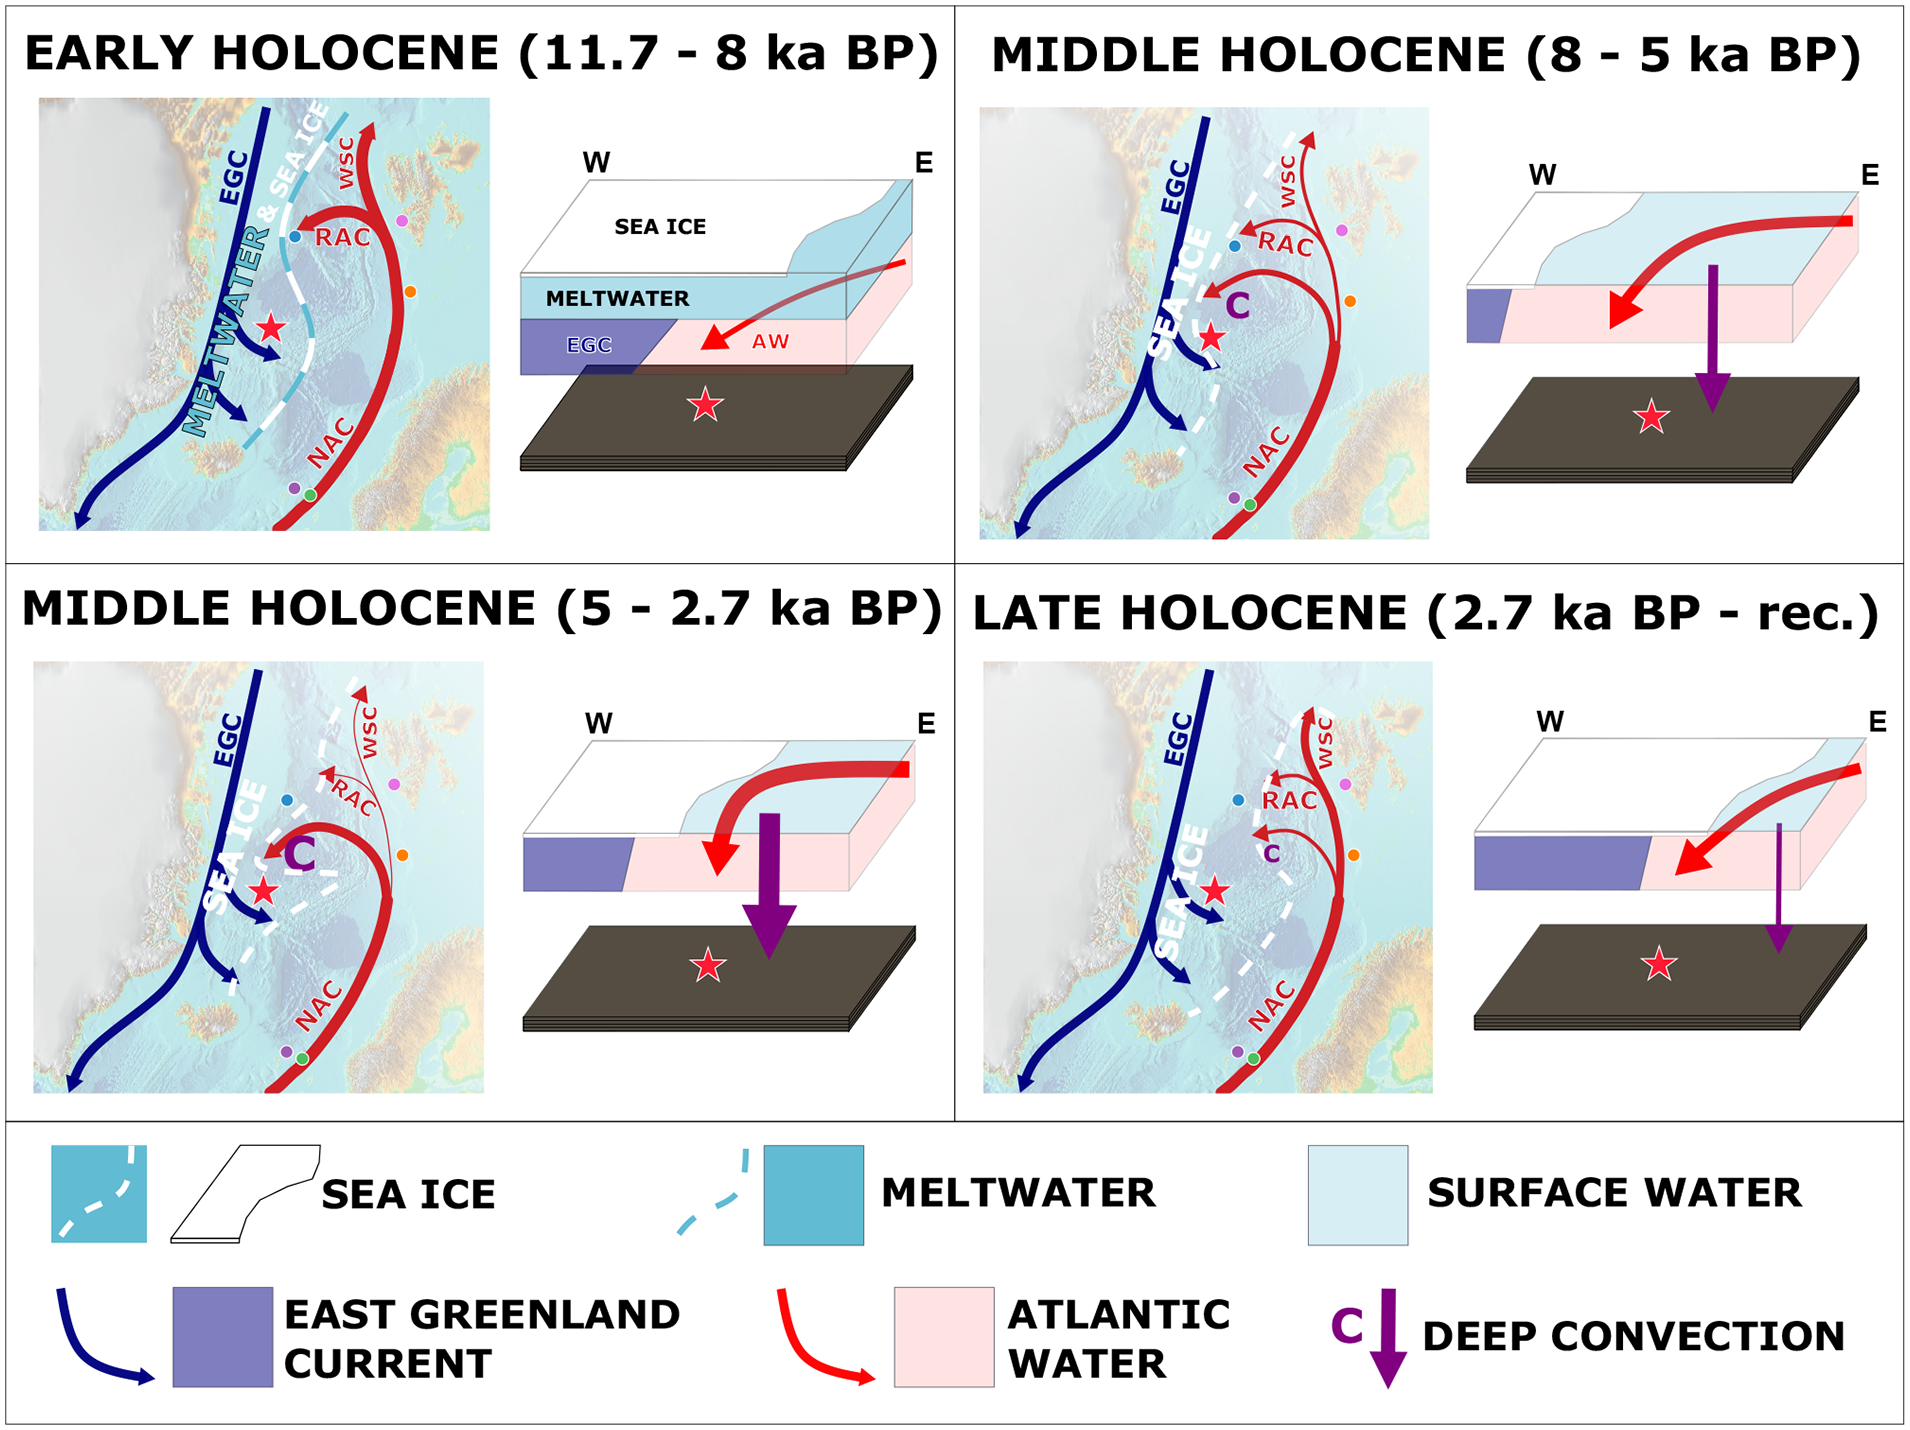
A schematic summary of circulation changes in the Nordic Seas over the Holocene along a tentative transect across site PS1878 (red star). See Figure 1 for the detailed description of the other sites marked on the maps. AW: Atlantic Water; EGC: East Greenland Current; NAC: North Atlantic Current; RAC: Return Atlantic Current; WSC: West Spitsbergen Current. The thickness of red and purple arrows indicates the intensity of AW advection and open-ocean convection, respectively.
We suggest that in the early Holocene AW in the Nordic Seas was flowing as a boundary current along the northwestern European continental slope. The advection of AW carrying large amounts of heat and salt was limited to the eastern margin of the Nordic Seas basin. Part of it entered the Arctic Ocean through the eastern Fram Strait, while the rest was recirculated westwards as the RAC. Only as the water chilled, was it able to subduct below fresher and less dense Arctic water masses (Rudels et al., 1999) and return southwards into the North Atlantic as an intermediate water mass. Open-ocean deep convection could not develop in the Greenland Sea due to the thick, low-salinity surface layer fed by the meltwater discharge (cf. Sejrup et al., 2016). The gradual subduction of AW below a thick freshwater layer without open-ocean deep convection seems analogous to the present-day circulation in the Arctic Ocean.
As the surplus heat and salt reservoir of the North Atlantic rapidly emptied, the overturning diminished, ending the maximum of the northward AW advection into the Nordic Seas after 9 ka BP (Risebrobakken et al., 2011). The decrease most probably coincided with the 8.2 ka BP event, a period of abrupt cooling across large parts of the Northern Hemisphere (Matero et al., 2017), the most prominent Holocene climatic disturbance (Alley et al., 1997). Modelling results show a decrease in AW export from the subpolar gyre into the Nordic Seas during this event (Born and Levermann, 2010; Matero et al., 2017; Renssen et al., 2001).
After 8 ka BP the freshwater input from the GIS into the western Nordic Seas had largely ceased as the ice sheet margin had withdrawn from the fjords, become mainly land-based and iceberg calving decreased (Bauch and Weinelt, 1997; Blaschek and Renssen, 2013; Seidenkrantz et al., 2012). We suggest that the retreat of the freshwater lid from the central and western Nordic Seas allowed AW to spread westwards as a surface to shallow subsurface water mass (below a thin surface water layer) which first resulted in the strengthening of the RAC around 8 ka BP (GR02 in Figure 5). Subsequently, AW reached the area where open-ocean deep convection may have developed (Figure 7), turning the deepwater production and the Nordic Seas overflows on (Thornalley et al., 2010). This is confirmed by a nitrogen isotope record from the central Nordic Seas that indicates a stepwise thickening of the mixed-layer around 8 ka BP (Thibodeau et al., 2017), suggesting deeper mixing of Atlantic-derived surface water, a process crucial to the formation of deep water. It is possible that the 8.2 ka BP event, during which at least parts of the Nordic Seas were influenced by freshwater and the AMOC was weakened (Born and Levermann, 2010; Matero et al., 2017; Renssen et al., 2001), played a role in the described shift of AW routing from primarily northward and confined to the eastern Nordic Seas to a more westward, towards the Greenland Sea. However, further studies of high temporal resolution records are necessary to support this hypothesis.
It is also worth noting that M23258 is the southernmost site in the eastern Nordic Seas where a distinct decrease in AW advection occurred after c. 8 ka BP. In contrast, in records located further south, the reconstructed sSST either remained roughly constant or even increased gradually (Hald et al., 2007). This remark might suggest that the rerouting of AW towards western Nordic Seas occurred south of site M23258,that is, somewhere around the Bear Island Trough Mouth Fan (Figure 1).
Around 5 ka BP, when the Holocene sea-level highstand was approached, the postglacial flooding of the vast Siberian shelves has been completed (Bauch et al., 2001b). As a result, Arctic sea-ice production, which mostly takes place in shallow shelf areas, reached its modern magnitude (Werner et al., 2013) and perennial sea-ice cover was established in the Arctic Ocean (Cronin et al., 2010). This process coincided with an eastward shift of the Transpolar Drift associated with enhanced Siberian runoff (Prange and Lohmann, 2003). Consequently, the sea-ice export from the Arctic Ocean through the Fram Strait into the Nordic Seas increased (Müller et al., 2012; Werner et al., 2013) leading to a cooling of the surface (Calvo et al., 2002; Łącka et al., 2019) and subsurface water masses (Figure 5, Risebrobakken et al., 2011; Telesiński et al., 2015; Werner et al., 2013). The sea ice plays an important role in preconditioning open-ocean convection in the Greenland Sea (Marshall and Schott, 1999). The increase in sea-ice advection into the Nordic Seas enhanced AW cooling and led to an intensification of the deep convection rate (Figure 7). The high rate of convectional processes must have further shifted the AW routing towards the Greenland Sea resulting in less AW reaching the western Svalbard shelf (e.g. Telesiński et al., 2018) and entering the Arctic Ocean through the Fram Strait (Ślubowska-Woldengen et al., 2007) and a maximum sSST gradient between the northeastern and southeastern Nordic Seas at that time (Hald et al., 2007). The deep convection rate in the Greenland Sea reached a maximum most probably around 3 ka BP (Figure 4).
Another major shift in ocean circulation in the Nordic Seas occurred after 3 ka BP. The late-Holocene was a time of low and decreasing insolation in the northern hemisphere (Laskar et al., 2004) that resulted in a general cooling trend in the northern North Atlantic region (e.g. Andersen et al., 2004). Superimposed on that trend, the strongest Holocene total solar irradiance (TSI) negative anomaly occurred c. 2.7 ka BP (Vonmoos et al., 2006). Numerical model simulations show that negative TSI anomalies increase the probability of temporary relocations of the deepwater formation site in the Nordic Seas, causing an expansion of sea ice that produces additional cooling (Renssen et al., 2006). However, this particular anomaly might have had much stronger implications as it coincided with the 2.7 ka BP event, the most widespread Holocene oceanic perturbation and an interval of possibly global climatic deterioration (Hall et al., 2004; van Geel et al., 2000; Wanner et al., 2011). The 2.7 ka BP event might have been triggered and/or amplified by the TSI anomaly although the exact timing and the cause and effect relationship are difficult to determine due to the discrepancies between the age models of different records (ice cores vs marine sediment cores). Nevertheless, the TSI anomaly might have relocated the deepwater formation site (Renssen et al., 2006; Telesiński et al., 2015), leading to a decrease in convection rate and/or depth in the Greenland Sea (Figures 4 and 7), an expansion of sea ice in the eastern Fram Strait (Müller et al., 2012) and southern Svalbard (Knies et al., 2017) as well as a cooling of surface water in the Norwegian Sea (Calvo et al., 2002) and an sSST decrease in the Greenland Sea (Figure 5, Telesiński et al., 2014a). The disruption of the convectional processes in the Greenland Sea might have caused the rerouting of AW back to the predominantly northward direction evidenced by increasing sSST in the northeastern Nordic Seas and a decreased temperature gradient between this area and the southeastern Nordic Seas (Hald et al., 2007).
On a larger scale, the weakening of the open-ocean convection in the Greenland Sea might have affected the entire AMOC, contributing to at least a regional and possibly global climatic deterioration (Hall et al., 2004; Thornalley et al., 2009; van Geel et al., 2000; Wanner et al., 2011). Even though the atmospheric cooling event around 2.7 ka BP, especially on a regional or global scale, might have been relatively brief (Wanner et al., 2011), the overturning circulation in the Nordic Seas did not recover to its previous state.
Summary and conclusions
The presented compilation of proxy records allows for reconstructing the changes in AW routing across the Nordic Seas over the Holocene. The buildup of a North Atlantic subsurface reservoir of heat and salt over the deglaciation led to an AMOC ‘overshoot’ shortly after the onset of the present interglacial, resulting in a maximum northward oceanic heat transport through the NAC and – together with high insolation – a maximum in sSST in the eastern Nordic Seas around 10 ka BP (Risebrobakken et al., 2011). The western Nordic Seas, however, remained cold due to the strong influence of meltwater blocking the westward spreading of AW on the surface. We suggest that from the onset of the present interglacial until c. 8 ka BP, AW in the Nordic Seas was flowing as a boundary current along the continental slopes. Part of it entered the Arctic Ocean through the eastern Fram Strait. The rest of AW was recirculated westwards via the RAC. Subsequently, it subducted below Arctic water masses and returned southwards as an intermediate water mass, not supplying the abyssal zone of the North Atlantic. The AW inflow decreased after 9 ka BP when the surplus heat and salt reservoir of the North Atlantic emptied.
Around 8 ka BP, the freshwater input from the GIS into the western Nordic Seas had largely ceased. The retreat of the freshwater lid allowed AW flow to shift westwards and reach the central Greenland Sea where open-ocean convection may have developed, turning the deepwater production and the Nordic Seas overflows on.
After 5 ka BP the increase in sea-ice export from the Arctic Ocean led to a cooling in the Nordic Seas and a further strengthening of the open-ocean deep convection in the Greenland Sea as the sea ice plays an important role in preconditioning the convectional process. The AW flow was further shifted westwards resulting in less AW reaching the Arctic Ocean.
Another major shift in the Nordic Seas circulation occurred around 2.7 ka BP. During the time of decreasing insolation, a strong TSI minimum (Vonmoos et al., 2006) triggered disruption of the convectional activity in the Greenland Sea and a further, stepwise sea-ice expansion and cooling of upper water layers. The weakening of the deep convection in the Greenland Sea might have affected the entire AMOC, contributing to possibly a global climatic deterioration (Hall et al., 2004; van Geel et al., 2000). Even though the 2.7 ka BP atmospheric cooling was a rather brief event, the overturning circulation in the Nordic Seas most probably did not recover to its previous state until the present.
The newly presented proxy records in combination with published data emphasise the importance of the Nordic Seas for the global ocean circulation and, thus, the Earth’s climate. While numerous studies have focussed on past changes in the rate of AW advection into the Nordic Seas (e.g. Rasmussen and Thomsen, 2008, 2010), in this study we demonstrate that the shifts in AW routing within the Nordic Seas are also important. Only a comprehensive reconstruction of the circulation of AW and other water masses allows us to fully understand the mechanisms governing ocean circulation in this crucial area. Furthermore, we demonstrate that the radiocarbon ventilation age reconstruction can be applied to track not only large scale (e.g. glacial-interglacial) but also minor ventilation changes (i.e. within an interglacial).
Footnotes
Acknowledgements
Funding
The author(s) disclosed receipt of the following financial support for the research, authorship, and/or publication of this article: This work was supported by the National Science Centre in Poland [grant numbers 2016/21/D/ST10/00785, 2016/21/B/ST10/02308, 2020/39/B/ST10/01698].