
Abstract
Historical salmon catch records suggest that climatic variability, and more recently human exploitation, control patterns of abundance in Atlantic salmon populations. We present the first long-term (2000-year) reconstruction of Atlantic Salmon population variations based on a Marine Derived Nutrient (MDN) lake sediment record. Our record is constructed from nitrogen isotopes (δ15N) measured from a lake sediment core, which we compare with an escapement index (EI) derived from historic net catch data on major Scottish salmon rivers. We used an isotope mixing model to demonstrate that the N isotope values are likely enriched with MDN and demonstrate that Loch Insh sediments are enriched compared with a control site (Loch Vaa) that has never had exposure to salmon. We demonstrate that current adult spawner returns are around half that of historic values prior to major human exploitation. Before the onset of widespread human exploitation and habitat degradation, large fluctuations in salmon abundance are attributed to variations in North Atlantic sea surface temperature. While our data support published reconstructions of declining Atlantic salmon stocks in Northwest European rivers over the last 1000 years, rather than point to a solely human cause, the human impact appears to be overprinted on larger-scale changes in marine habitat occurring at the transition from the warmer Medieval Climatic Anomaly (MCA) to the cooler Little Ice Age (LIA).
Introduction
Atlantic salmon (Salmo salar) are an economically important keystone species, with high conservation value (ICES, 2013). Atlantic salmon are anadromous, that is, incubating and rearing young within freshwater-river habitats, before migrating downstream and out into the North Atlantic Ocean. At sea, salmon put on most of their body mass before returning as adults to spawn in the headwaters of rivers draining to the North Sea and North Atlantic. Through their migration patterns, they provide a net import of marine derived nutrients (MDN) that help support freshwater aquatic ecosystems (Guyette et al., 2014; Nislow et al., 2010; Samways and Cunjak, 2015). Concern about recent declines in Atlantic salmon populations throughout the species range underpins debates around their role in importing nutrients into oligotrophic headwater streams and the causal mechanisms for their decline (Guyette et al., 2014).
Unlike Pacific salmon species, for which relationships with MDN have been well reported (Finney, 1998; Finney et al., 2002), Atlantic salmon, are iteroparous, with adult spawners capable of returning to sea after spawning. The number of adults that die after spawning and before migration out to sea is variable between rivers, but measured values range between 65% and 75% (ICES, 2013; Nislow et al., 2010). Sources of MDN however, are not limited to salmon carcasses but include undeveloped eggs (mortality is often 60–80%), spawned eggs, milt and excretion products (Nislow et al., 2010; Samways and Cunjak, 2015). Studies of the pathways and mechanisms by which MDN’s are sequestered into river and lake sediments and food webs emphasise the interaction of inorganic particulate matter and salmon organic matter through flocculation and subsequent incorporation into the bed through settling, and via biofilm and periphyton uptake (Nislow et al., 2010; Rex et al., 2014; Rex and Petticrew 2010). Once in the stream bed the organic matter decomposes or is released and transported down river during bed-mobilising events, including flooding and spawning activity. Invertebrates act as MDN vectors, grazing on carcasses, Fine Particulate Organic Matter (FPOM) flocs and periphyton. Invertebrates are themselves predated upon or washed downstream during floods. Finally, fish carcasses can be transported throughout the river network during flood events, being deposited preferentially in backwaters, lakes and on shallow bars (Samways and Cunjak, 2015; Williams et al., 2010).
Evidence for reduced runs of migratory fish exist in catch records of many rivers draining the North Atlantic (Limburg and Waldman, 2009), but crucially no data exist on how large salmon runs were prior to significant human exploitation. Historical documents point to a major decline in anadromous fish species in European streams in the mid-late medieval period c. 1150–1500, and continued decline into the 18th century, attributed to commercial over-exploitation and the construction of barriers (mills, weirs) (Hoffmann, 1996; Lenders et al., 2016). Since such data only report human-impacted populations, there are uncertainties surrounding the population dynamics of pre-exploitation Atlantic salmon in rivers bordering the North Atlantic. Improved understanding of natural population dynamics is important for determining baseline conditions for species conservation targets in local ecosystems; understanding the nutrient contribution to stream productivity (Guyette et al., 2014), and understanding long-term population dynamics in response to environmental change (Nislow et al., 2010). Finally, there is a need for evidence to inform current debates regarding the ecological impact of reintroducing species such as beaver (Castor fiber) on the populations of Atlantic salmon (Gaywood, 2015).
Determining prehistoric fish concentrations remains a challenge. Concentrations of fish scales and bones in lake sediments are typically low (Smol, 2008), and hence palaeolimnologists have used the signal of marine enriched stable isotopes from organic matter originating from returning salmon to reconstruct the population dynamics of migratory (Pacific) salmon species. The method depends on detecting the isotopic signal of marine (strictly Salmon) derived nutrients in lake sediments, and where possible, calibrating these to measured estimates of the numbers of returning salmon using historical catch records (Finney et al., 2002). Areas of particulate organic matter (POM) accumulation in oligotrophic systems have detectable levels of MDN that are identifiable due to enrichment of 15N in the organic matter. Marine fish have higher δ15N relative to other forms of freshwater/terrestrial sources of N, and are also generally more N-rich, resulting in lower C/N ratios (Gregory-Eaves et al., 2009). Thus, we expect oligotrophic lake ecosystems within catchments with large populations of returning Atlantic salmon and high post-spawning retention rates, to show higher δ15N, and lower C/N relative to periods when catchment sources of C and N dominate (Selbie et al., 2009). In this paper, we use the nitrogen isotope composition of sedimentary organic matter (δ15Nsed) and historical net catch records (salmon escapement, or an Escapement Index – EI) to reconstruct Atlantic salmon populations from a 2000-year sedimentary sequence from a Scottish Loch located on a major salmon river. This approach follows that used for Pacific salmon populations but represents the first such reconstruction for Atlantic salmon.
Study area
To detect the MDN from Atlantic salmon we selected a lake that met the following criteria: (i) it contained a Holocene sedimentary record, (ii) it was an on-line lake with extensive upstream Atlantic salmon spawning grounds; (iii) it was fed by a river with a large run of Atlantic Salmon for which historical data on migrating population numbers were available, (iv) it had a catchment with a limited nutrient input from Agriculture/Forestry, (v) it had a history of limited human disturbance (e.g. water abstraction; regulation) and (vi) was in a catchment with additional isolated (non-salmon influenced) lake(s). The criteria for direct connection to a main river was necessary since Atlantic salmon are not lake spawning species; hence any nutrient import requires transport of nutrient enriched material (e.g. carcasses, milt and eggs) into the lake along with secondary sources such as salmon derived organic matter, algae and invertebrates (Finney et al., 2002; Petticrew et al., 2011). The river and lake system also needed to be relatively oligotrophic to optimise the probability of detecting any MDN contribution. The isolated lake was used to derive a background catchment rate of stable isotope deposition over the same period as the salmon lake record (Gregory-Eaves et al., 2009).
Our study sites were Loch Insh (N 57°6′42.76″, W 03°55′47.72″, Figure 1), a partly infilled Pleistocene Kettle hole, located on the main channel of the river Spey, Scotland, and a control lake – Loch Vaa (N 57°14′5.83″, W 03°48′3.93″, Figure 1) which has never been connected to the main river system but drains the same geology and land use to Loch Insh. The River Spey has the seventh largest catchment in the UK and supports one of the largest Atlantic salmon populations in Western Europe, with at least 60,000 adults currently entering the river annually.
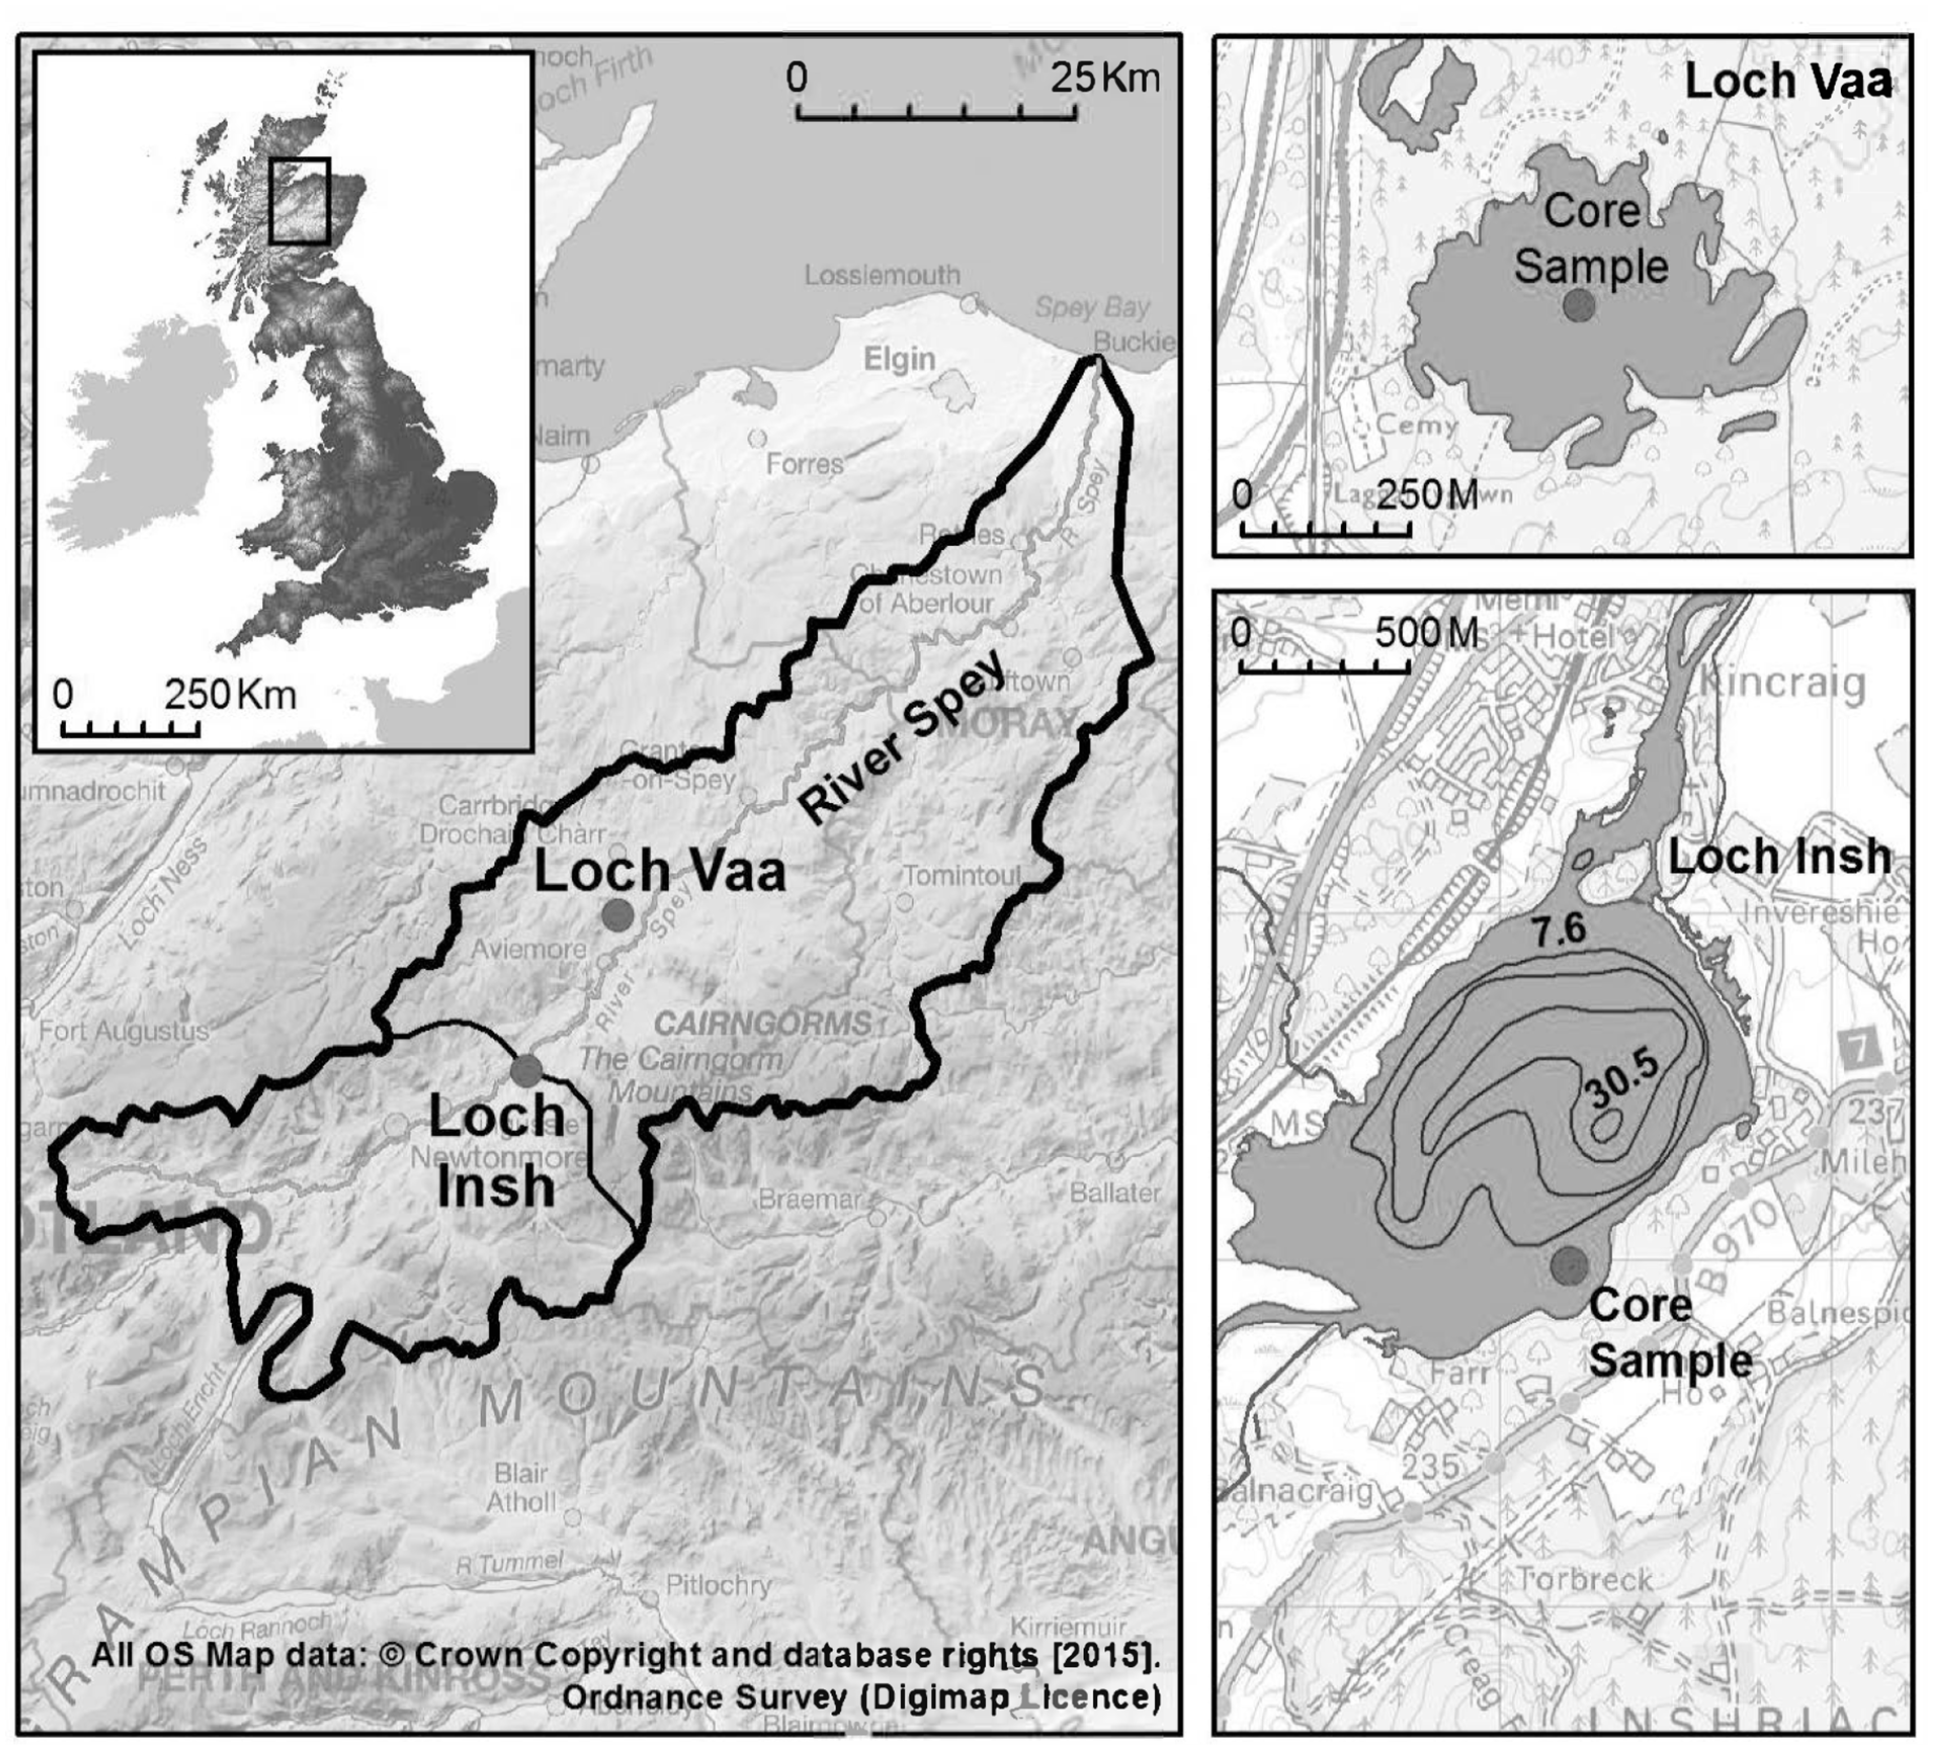
Location of study catchment (solid black outline) and coring sites within Loch Insh and Loch Vaa, Speyside, Scotland, UK. Loch Insh is an online lake that lies downstream of the Atlantic Salmon headwater spawning grounds of the River Spey. Loch Vaa is an isolated control lake that has never been accessible to Atlantic Salmon.
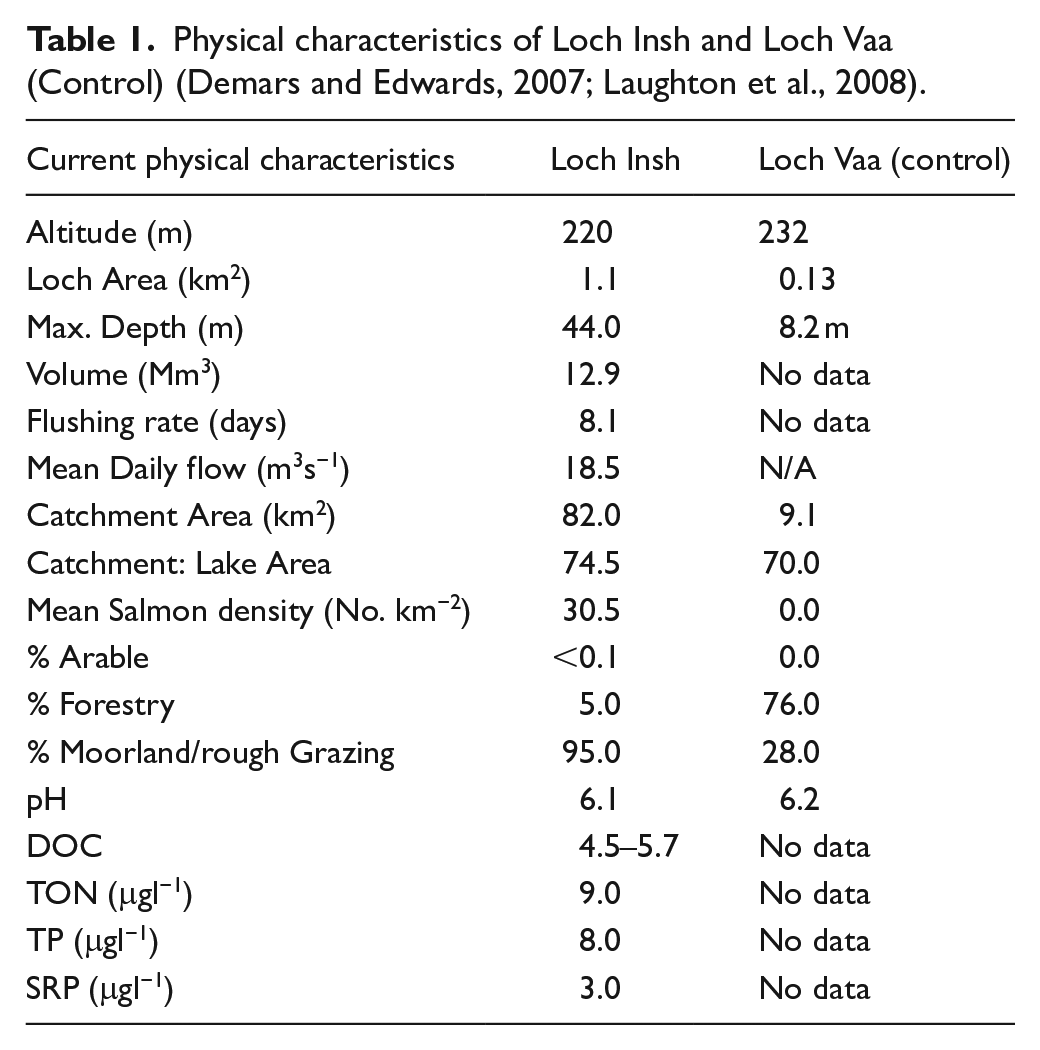
The surface area of Loch Insh is 1.1 km2 with a catchment area of 82 km2 (lake:catchment area ratio 74.5) and a maximum depth of 44 m. Loch Insh and the River Spey are classified as oligotropic with mean annual concentrations of Soluble Reactive Phosphorous of 3.0 μgl−1, 8.0 μgl−1 Total Phosphorous and 9.0 μgl−1 Total Oxidized Nitrogen (Demars and Edwards, 2007). Loch Vaa, is oligotrophic, has the same geology and land use and is local (18 km) to Loch Insh. Historical (past 150 years) changes in Loch Vaa’s catchment land use, and fisheries management recorded in local estate records show stocking with Brown trout (Salmo trutta spp.) in the early 20th century, planting of conifers (Pinus scottica) in 1865, and a major fire in 1920. These changes did not affect the Loch Insh catchment or lake. Prior to these the catchment was, like Loch Insh, dominated by a mixture of rough grazing and moorland. In the 16th–early 19th Century AD, the Spey downstream of Loch Insh was extensively used to float logs down river to timber mills although the impact of log rafting on upstream salmon migration was minor since the practice did not require use of structures to raise water level. The construction of reservoirs in the headwaters of the Spey between 1921 and 1942 regulated 288 km2 of the upper catchment and was mitigated by a fish ladder that provides access for migratory salmon to headwater spawning and rearing streams.
Materials and methods
Fieldwork and dating
In 2009 we took sediment cores from Loch Insh and Loch Vaa (Figure 1, Table 1). Using bathymetry data we selected a coring site in 5.0 m of water on the southern side of Loch Insh. The site is in a backwater embayment south of the main Spey channel and is not subject to re-working of sediments when the river Spey is in full flood. For Loch Vaa we took a core sample from the deepest (8.0 m) central section of the loch. Cores were collected from an anchored raft using a Uwitech gravity core for surface sediments (0–30 cm sediment depth), and a Livingstone corer for subsurface (20–260 cm) sediment recovery. Surface cores were stabilised using Zorbitrol™ gel and returned whole to the NERC BOSCORF facility for splitting and analysis. The Livingstone cores were extruded, sub-sampled at 1 cm intervals, bagged and labelled on site. All cores were in cold storage within 48 h.
Physical characteristics of Loch Insh and Loch Vaa (Control) (Demars and Edwards, 2007; Laughton et al., 2008).
The lake sediment cores were dated using a combination of radionuclide analyses (137Cs) and Sphereoidal Carbonaceous Particles (SCP’s) for the upper most sediments and radiocarbon (14C) for the lower sediments. SCP processing followed standard methods (Rose and Appleby, 2005), and the age model for NE Scotland was applied to the SCP concentration curve. 137Cs activity was determined using a Canberra well-type HPGe gamma-ray spectrometer for 24 samples in the top 30 cm of the core. Each activity was corrected for sample mass and volume. As is typical from many lake sediments, finding terrestrial macrofossils proved difficult in large quantities, but sufficient material was identified for three dates, which were prepared at the East Kilbride node of the NERC Radiocarbon Facility (NRCF) and passed to the SUERC AMS Laboratory for 14C analysis (Table 2). Age depth modelling on the resulting dates was undertaken using BACON v2.2 software (Blaauw and Christen, 2011). A peak in 137Cs activity taken to correspond to the 1963 maximum (Ritchie and McHenry, 1990) was found at a depth of 12.5 ± 0.5 cm in the 137Cs profile for Loch Insh, suggesting an average sediment accumulation rate from 1963 to the sampling date of 0.27 ± 0.01 cm/year. Within the constraints of the age model, average accumulation rates slow down core, to around 0.1 cm/year. The errors within the model are of the order of ±150 years for each interpolated age but reduce from ±25 years to ±5 years for the period coincident with salmon escapement data. For Loch Vaa, the age-depth model was built from a Spheroidal Carbonaceous Particle curve, with three radiocarbon dates (Table 2; Figure 2b).
Radiocarbon samples and related information.
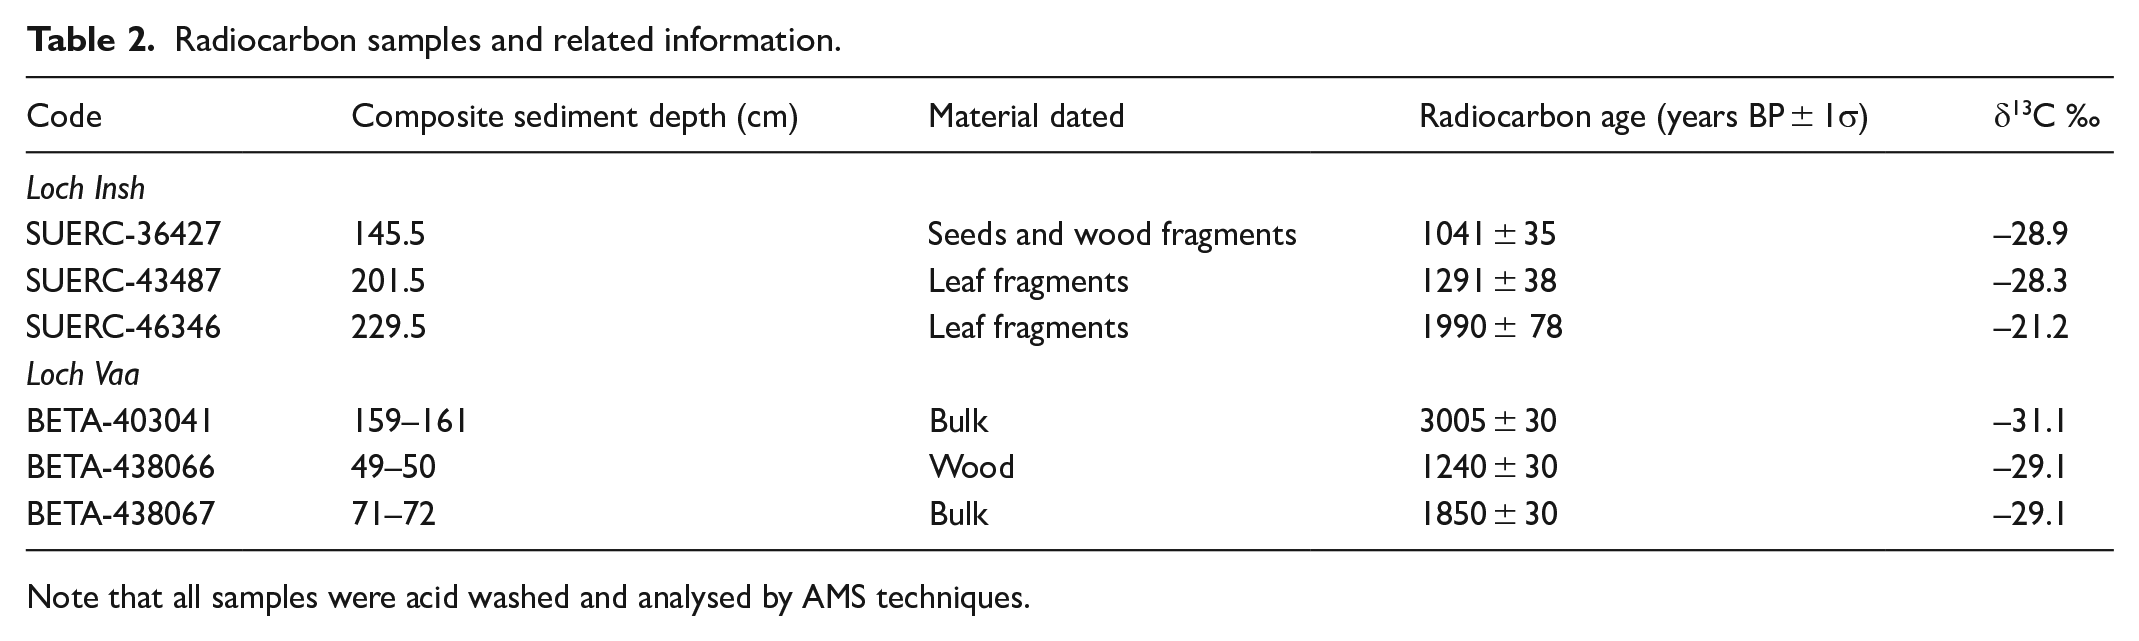
Note that all samples were acid washed and analysed by AMS techniques.
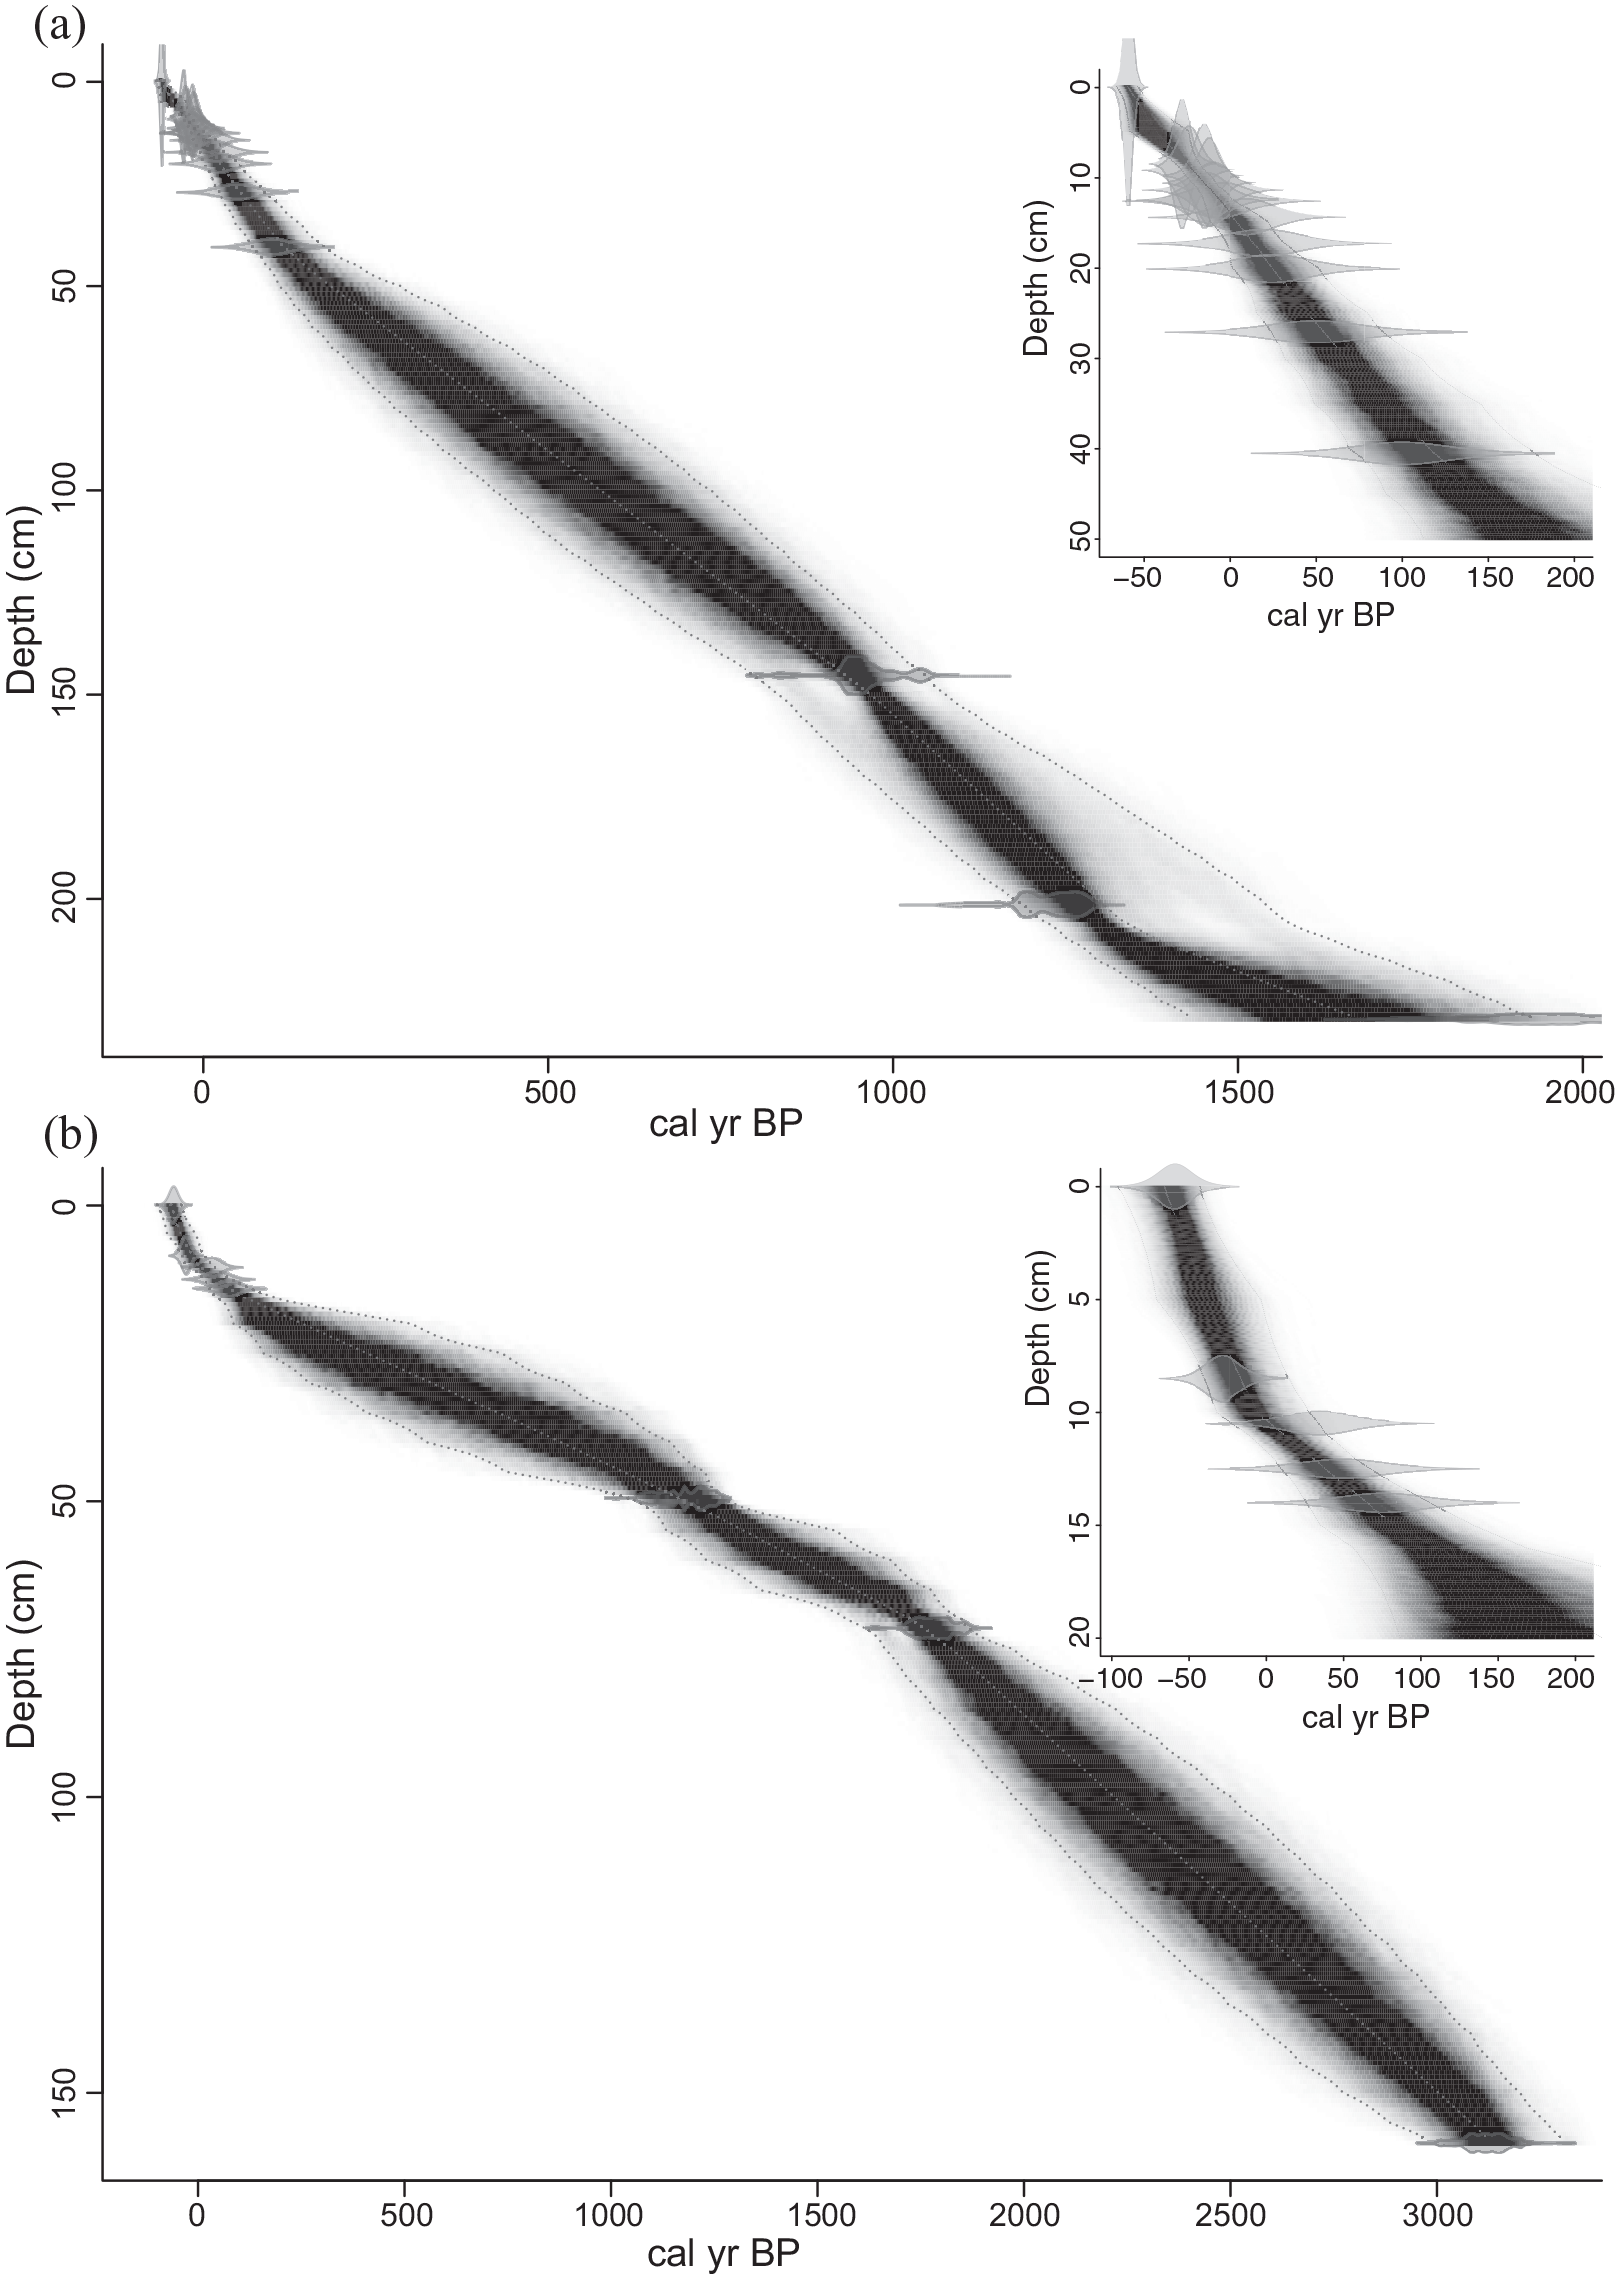
(a) Age depth model for Loch Insh. (b) Loch Vaa. Sequences modelled using BACONv2.2 and default settings (50). Model errors prior to 100 cal yr BP are ±100 – 123 years. Post 100 cal yr BP model errors are < ±25 years. Inserts show the upper age model for clarity based on SCP and 137Cs (Insh only).
Laboratory methods
The subsamples for nitrogen isotopes and C/N ratios (derived from %TOC and %TN) were dried at 40°C and ground to a fine powder. The C/N samples were treated with 5% HCl to remove inorganic carbon, washed several times with distilled water to neutral pH, and then dried again at 40°C. The nitrogen isotope samples were dried at 40°C and ground to a fine powder (no acid treatment). Percentage total organic carbon (%C) and % total nitrogen (%N) were measured at the same time at the isotope measurements and thus C/N was calculated, calibrated against an Acetanilide standard (precision generally <0.1). 15N/14N ratios were determined on N2 gas produced by combustion of sediment in a Flash 1112 elemental analyser linked to a Delta + mass spectrometer (both ThermoFinnigan, Bremen), with ratios calculated as δ15N values versus atmospheric N2 by comparison with standards calibrated against USGS 40 and 41. Analytical precision (1 S.D.) for low %N sediments was typically ⩽0.2‰.
The Loch Insh lake sediment cores were analysed for pollen to assess the degree of change in vegetation cover over the past 1000 years. One-cm3 sediment subsamples were processed for pollen using conventional techniques for lake sediments (Moore et al., 1991), and a minimum of 300 terrestrial pollen grains per sample was counted at ×400 magnification.
Net catches and historical data
The historical total population of Atlantic Salmon returning to their natal rivers is largely unknown since quantitative counts are either absent or only recently established (Youngson et al., 2002). Therefore, population proxies based on catch data from rod and/or netting are typically used (Friedland et al., 2014; ICES, 2013; Limburg and Waldman, 2009). Records of commercial net caught salmon have been shown to correlate with salmon spawning nest (redd) numbers in natal rivers (Boylan and Adams, 2006) and have been widely used as a measure of the trends in the population of returning adult Atlantic salmon (Boylan and Adams, 2006; Hoffmann, 1996; Limburg and Waldman, 2009). We used a 150 years record of net catch data from the lower River Spey net and coble records (Laughton pers comm, 2010), and compared it to similar net catch data from three other Scottish rivers (Figure 3). All four rivers drain the east coast of Scotland within 500 km of each other and may reasonably be expected to exhibit similar trends in population of returning salmon (Boylan and Adams, 2006). All data were standardised by converting to z-scores to permit inter-comparison. Approximately 17% of total tagged salmon have been found to spawn upstream of Loch Insh (Youngson et al., 2002). There are no data available for post-spawning mortality of either female or males but values reported for other east coast Scottish rivers range between 65% and 75% (Lyle and Elliott, 1998). Conversion into direct measures of escapement is problematic because we do not know the proportion of the total population caught, and although recent estimates are close to 10% (ICES, 2013), the values during the 19th Century and earlier are unknown. We therefore make the standard assumption that the trends in net catch within the lower river reflect the trends in returning spawners upstream (Finney et al., 2002; ICES, 2013). We assume that our EI reflects the relative magnitudes and trends in numbers of returning salmon (Friedland et al., 2003; Summers, 1995).
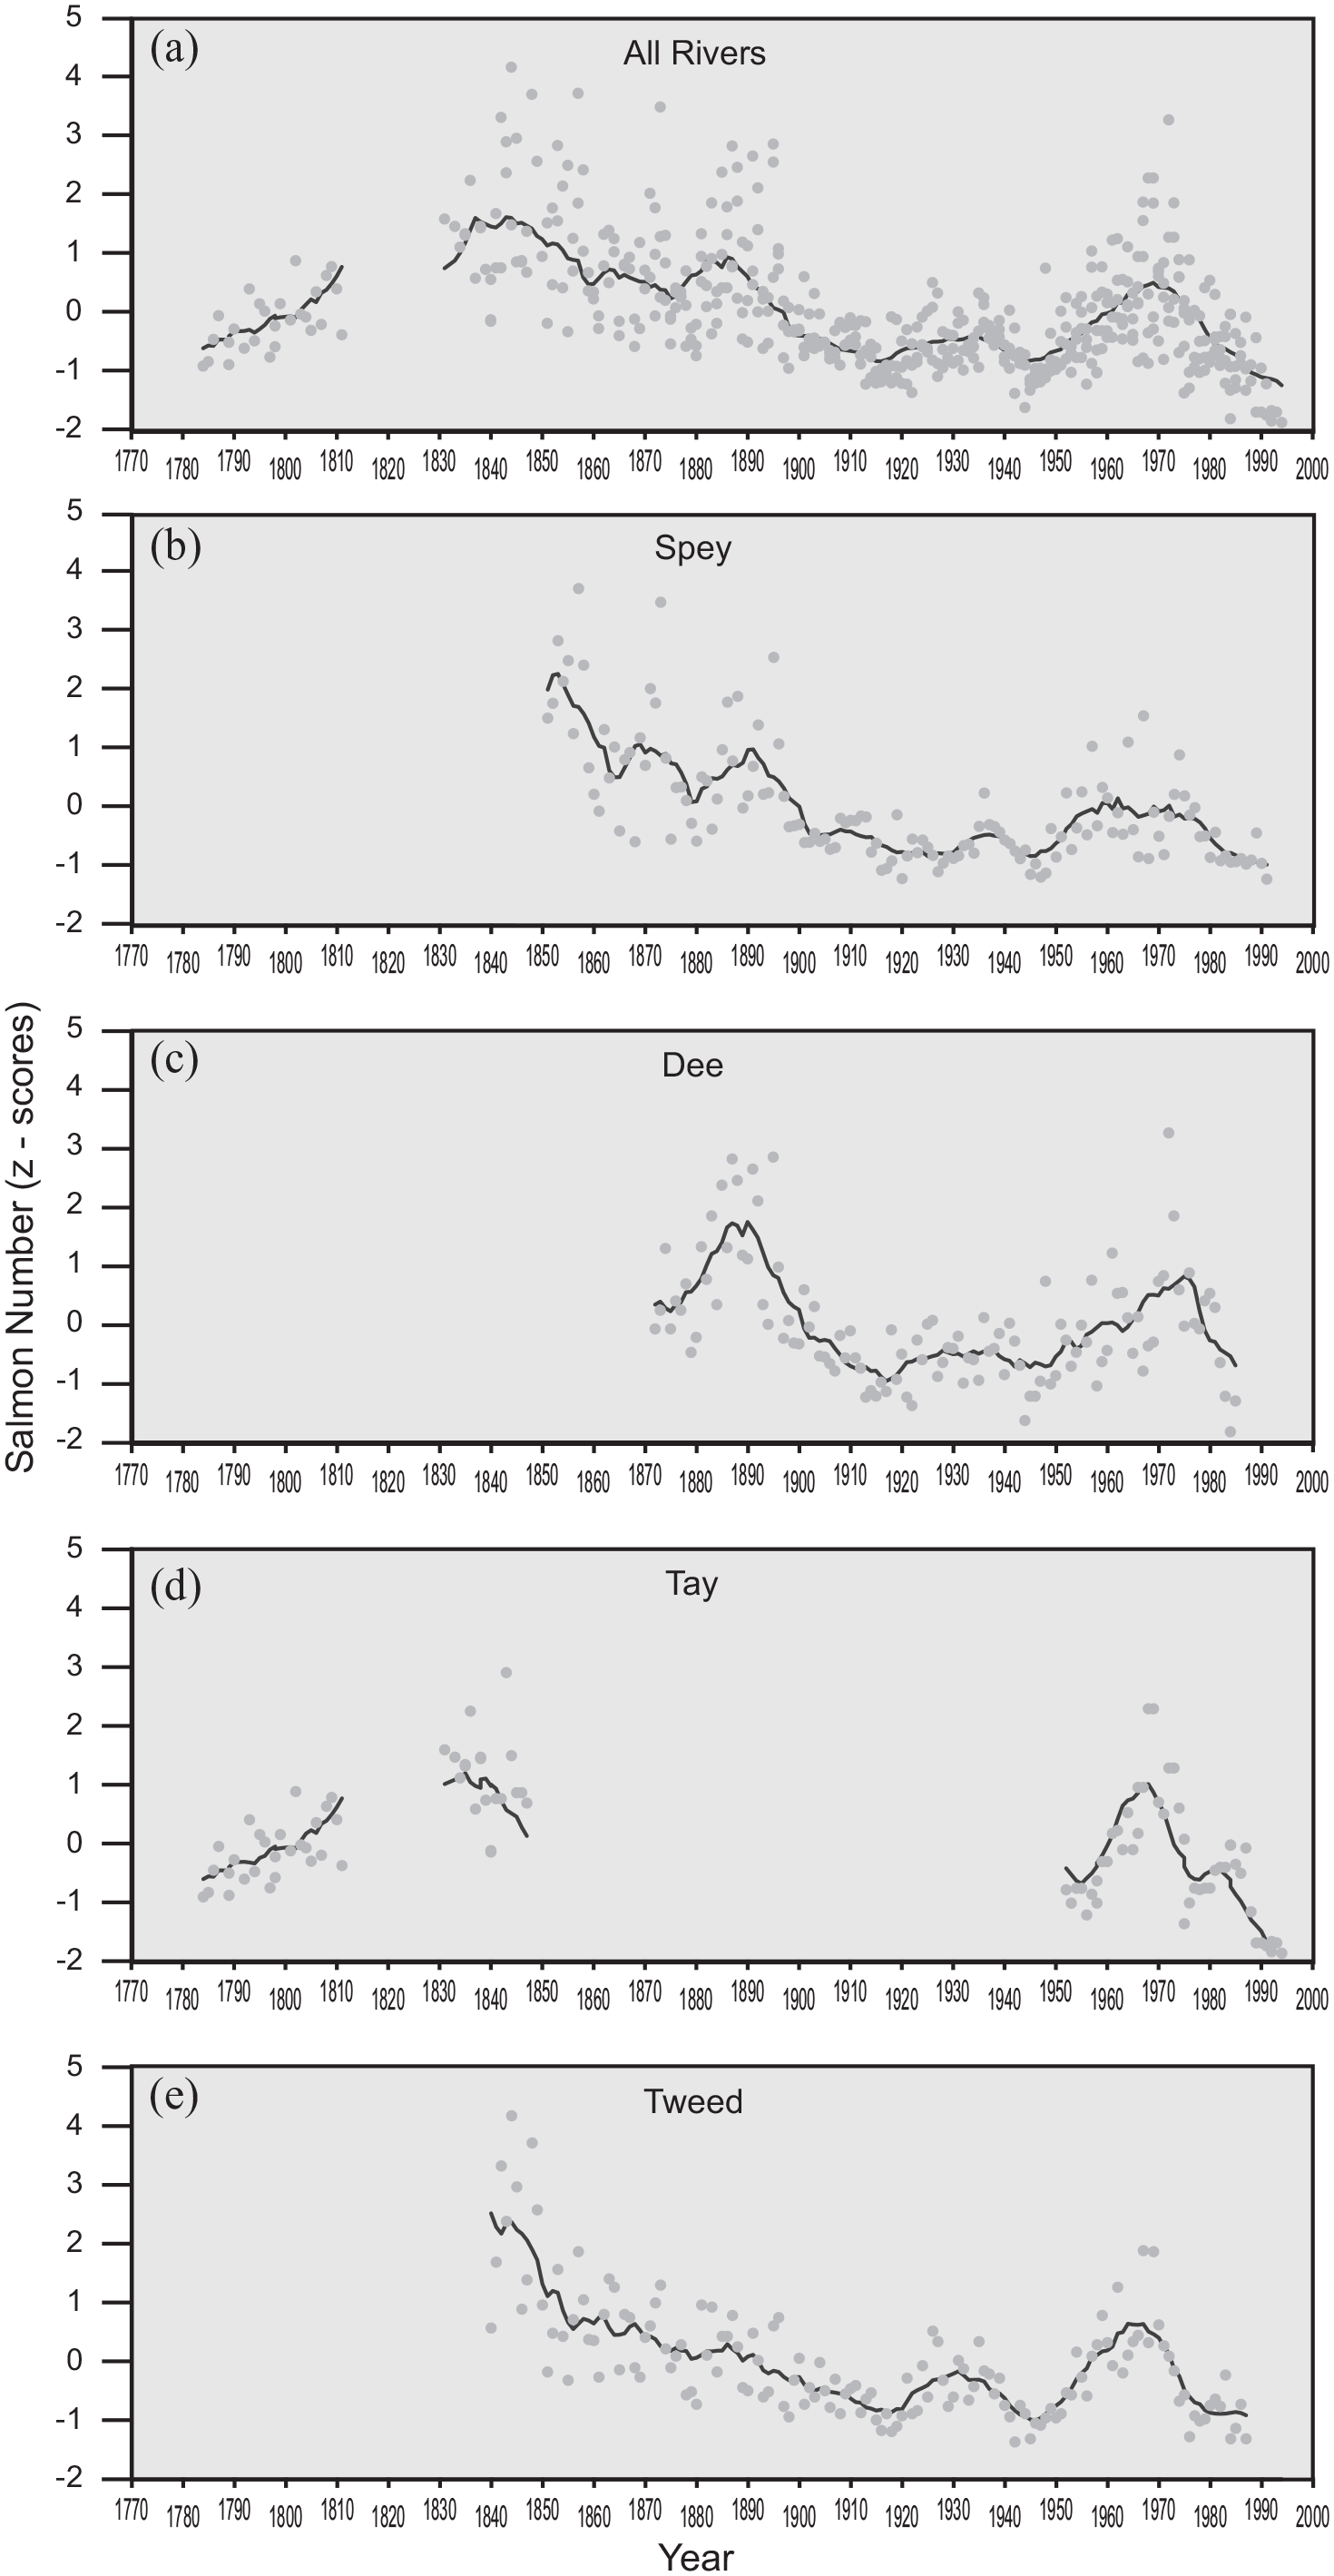
Net catch data for four Salmon rivers show similar trends with peaks in z-scores around the mid-19th Century, the 1930’s and again in the 1970’s. Marked declines in salmon occur in the early 20th century around 1910 and 1950 and post 1980. The latest decline continues into the 1990’s and coincides with reported declines across the North Atlantic region. The synoptic trends are found in all four rivers (3b-3e) and are assumed to correspond to numbers of returning spawners. (3a) uses the data from all four rivers to provide an approximation of East coast Scottish salmon returns back to AD 1783. All catch data are expressed in z-scores to permit comparison, and the black line is an 11-year moving average.
The weight of a returning adult salmon and thus the total nitrogen content, is directly linked to the time spent in the ocean. While no continuous data on the weight or age of fish are available for the River Spey, what data does exist (post 1952) shows a steady decline in the average weight of salmon caught (Spey Fisheries Research Board data; Youngson et al., 2002). Thus, reductions in both number and mass of fish will result in a more severe reduction in MDN signal than shown by net count data alone, hence our use of an escapement index rather specific salmon numbers.
Numerical analysis
The annual EI data derived for the Spey were smoothed using a 11-year moving average filter as this was the average increment of the δ15Nsed samples. We applied a linear interpolation to the EI data at the sample frequency of the δ15N data.
We detrended the annual Spey EI data, which is a measure of the salmon population after commercial harvesting, using a LOESS smoother (0.5) and applied a linear correlation with the climate drivers identified in the literature to be important for marine phase salmon growth and/or survival (e.g. Friedland et al., 2014). We initially ran the analysis on a shortened data series 1970–1991 as others had identified strong correlation with AMO (Friedland et al., 2003). We repeated the analysis for the longer time series (1856–1991) available for the Spey.
To determine if there was a statistically significant relation between our MDN record and longer-term indices of North Atlantic Ocean climate, we interpolated a series of long- term proxies for AMO, wNAOI, SST and Arctic Air Temperature at the same resolution as the δ15Nsed record.
Results and interpretation
Historical net catch data (Figure 3) show six phases that are coherent across four east-coast salmon rivers: AD 1740–1790, (low number catches recorded in the longer Dee, and Tweed records); 1790–1840, (a sharp rise in the numbers of salmon caught in all rivers); 1840–1920, (a slow decline in numbers caught with a smaller rise in 1872 and 1893); 1920–1948, (a period of low catch numbers with a rise around 1936); 1948–1965, (an increase in numbers caught, peaking in the late 1950’s and again in the 1970’s); 1974–1991, (a decline in net-caught salmon to the lowest levels since the late 18th century). Post 1991, data show a continued decline then a rise in numbers post 2004 (Youngson et al., 2002). A decline in netted salmon post 1980 is recorded across the whole Atlantic Salmon range (ICES, 2013; Limburg and Waldman, 2009), but may also reflect reduction in active net fisheries on Scottish rivers (ICES, 2013). Longer-term datasets from northern Russia (Barents Sea) show similar trends to those reported here, but in addition these show a continuation of low salmon catch numbers back to AD 1620 (Lajus et al., 2005). An independent analysis of the salmon population in the River Spey using genetics, identified a bottleneck at c.100–400 years ago (AD 1600–1900) (Nikolic et al., 2009), corresponding to the low numbers of salmon caught in the late 18th and late 19th into early 20th centuries shown in the longer records from the proximal Rivers Tay and Tweed. The same broad trends are visible in other east-coast rivers and also in published data for rivers bordering the North Atlantic (e.g. Boylan and Adams, 2006; Niemelä et al., 2004). The strongest inter-catchment correlations occur in proximal rivers, which is replicated in rod-caught data (Summers, 1995).
To determine if Loch Insh sediments were enriched in MDN we undertook two independent analyses; first we compared the same time periods of the δ15Nsed record from Loch Insh with seven control lochs from the wider region (Supplemental Table S1, available online), that have never been influenced by Atlantic salmon (Figure 4a). Control lochs are slightly enriched in δ15Nsed for the period around ~1800–1850, but their values decline to much lower than Loch Insh at around time of sampling (2005–2009); a regional trend considered to be the result of N-enrichment from atmospheric deposition (Curtis and Simpson, 2007). Second, we compared the Loch Insh record with that of the catchment control loch Vaa (Figure 5c). For the period 1800–2009, Loch Vaa, a control loch located in the Spey catchment near to Loch Insh, shows δ15Nsed enrichment following catchment disturbances (Figure 5c) including a large fire c. 1847, drainage and planting of conifers over most of the catchment c. 1910, and introduction of brown trout (Salmo trutta sp.) c. 1890 (unpublished Estate records). Prior to the catchment disturbance c. 1850, Loch Vaa had a lower and less variable δ15Nsed compared to Loch Insh (Figure 5c).
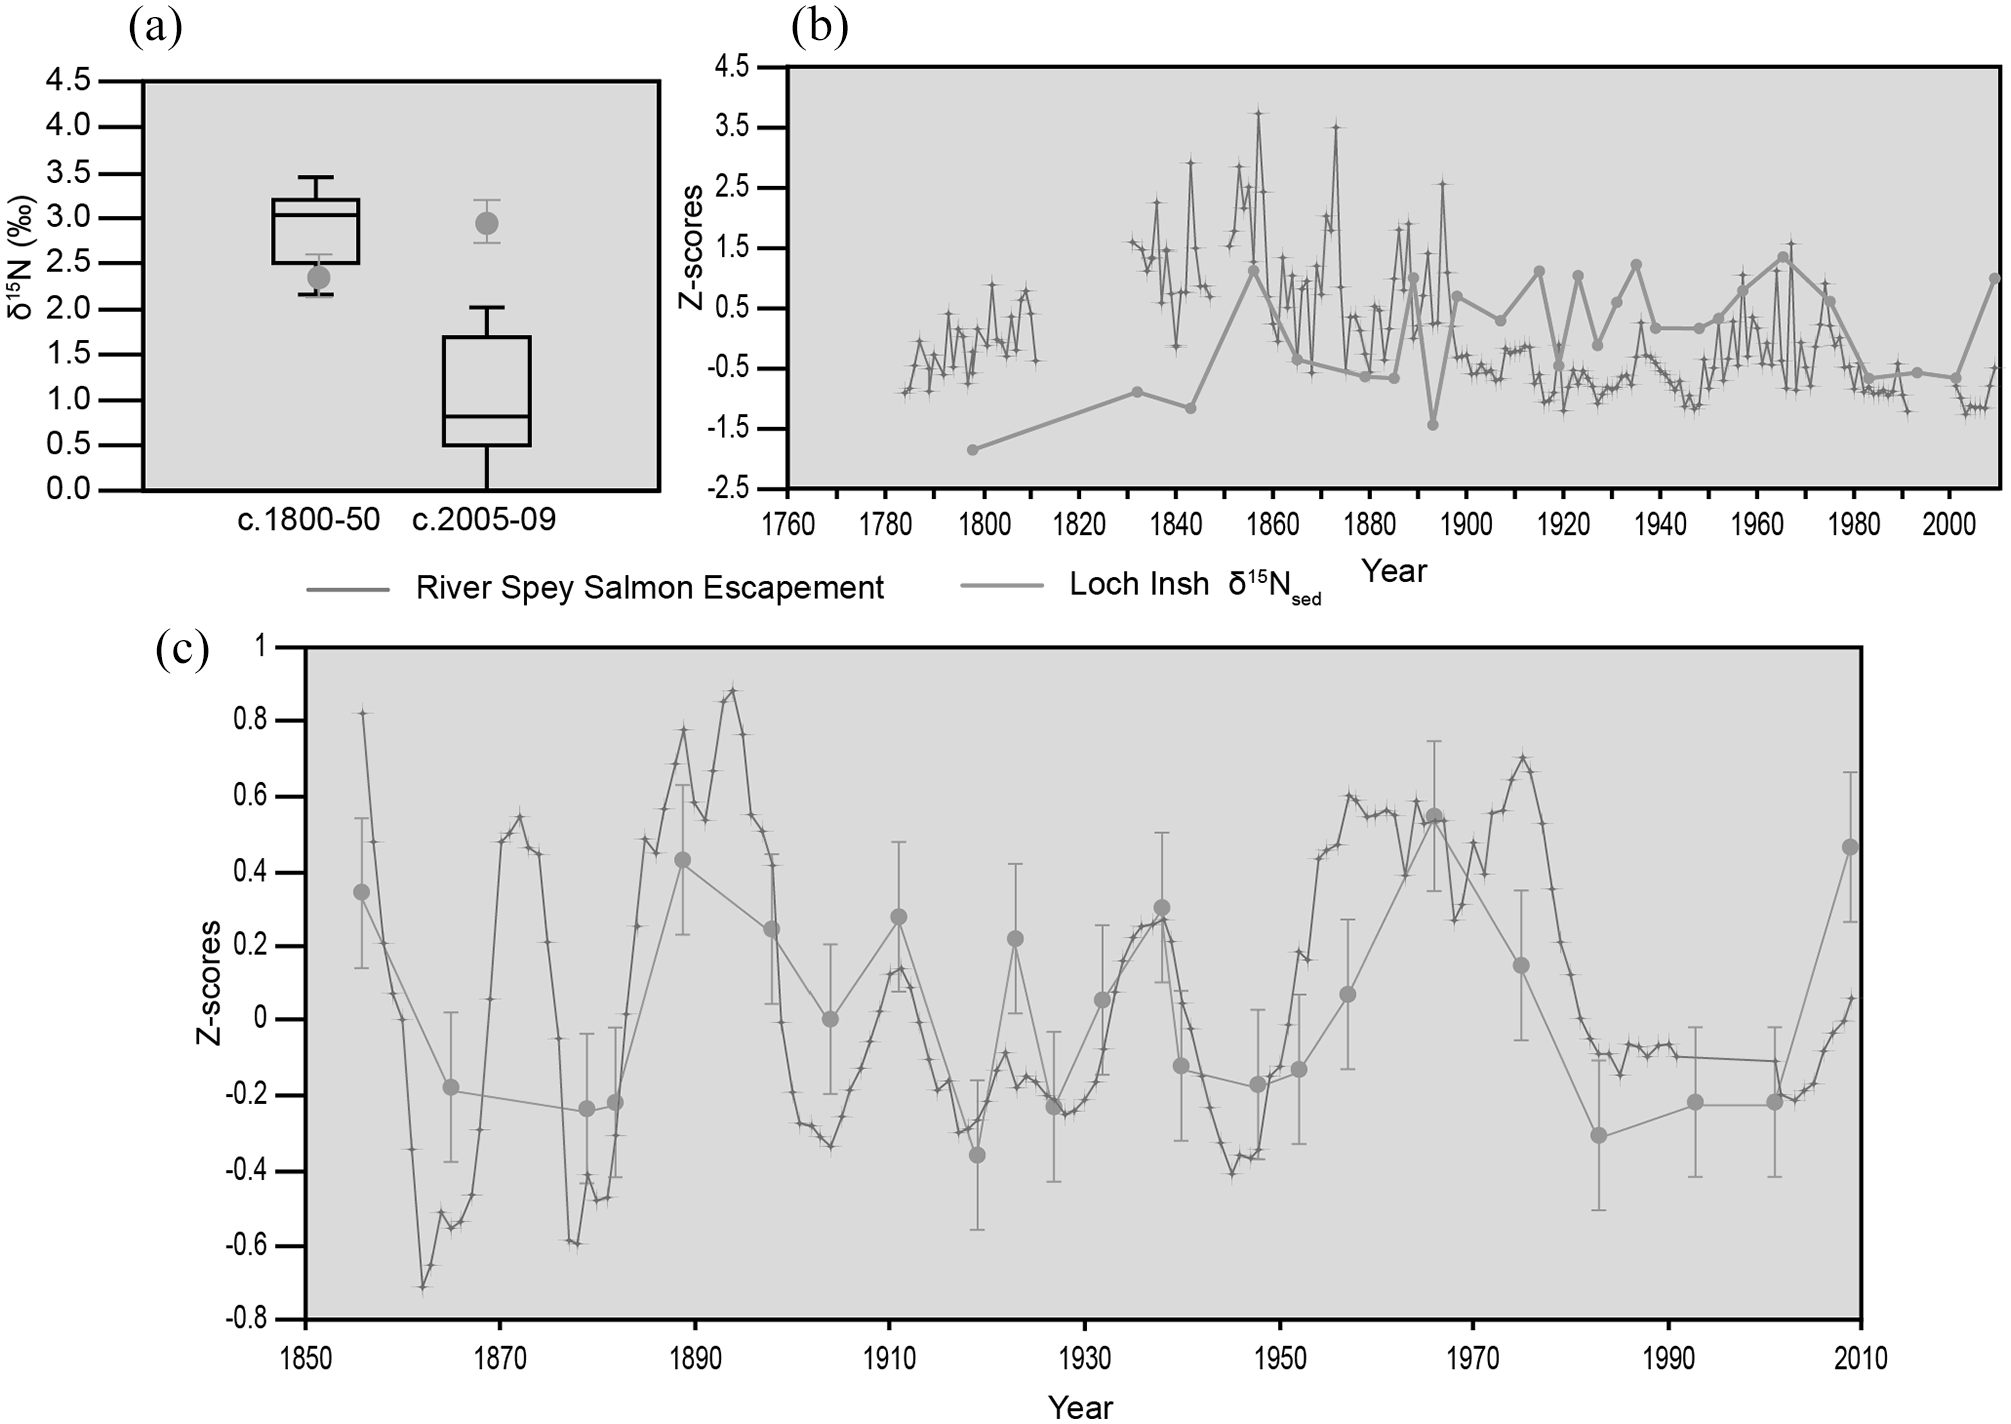
Reconstructing Atlantic salmon escapement from sedimentary δ15N. (a) Open boxplots show mean and variance in δ15Nsed for two periods in seven control lochs that are blocked to migratory salmon. Loch Insh diverges post 2005 from background values due to the effect of atmospheric N deposition diluting the signal in the control Lochs. (b) Variations in δ15Nsed from Loch Insh show statistical correspondence with measured salmon escapement data based on net catches (R2 = 0.55; p < 0.001). (c) δ15Nsed residuals from Loch Insh (blue) are strongly correlated (R2 = 0.71; p < 0.0001) with temporal variations in the amplitude of returning spawners (residuals) over the past 150 years.
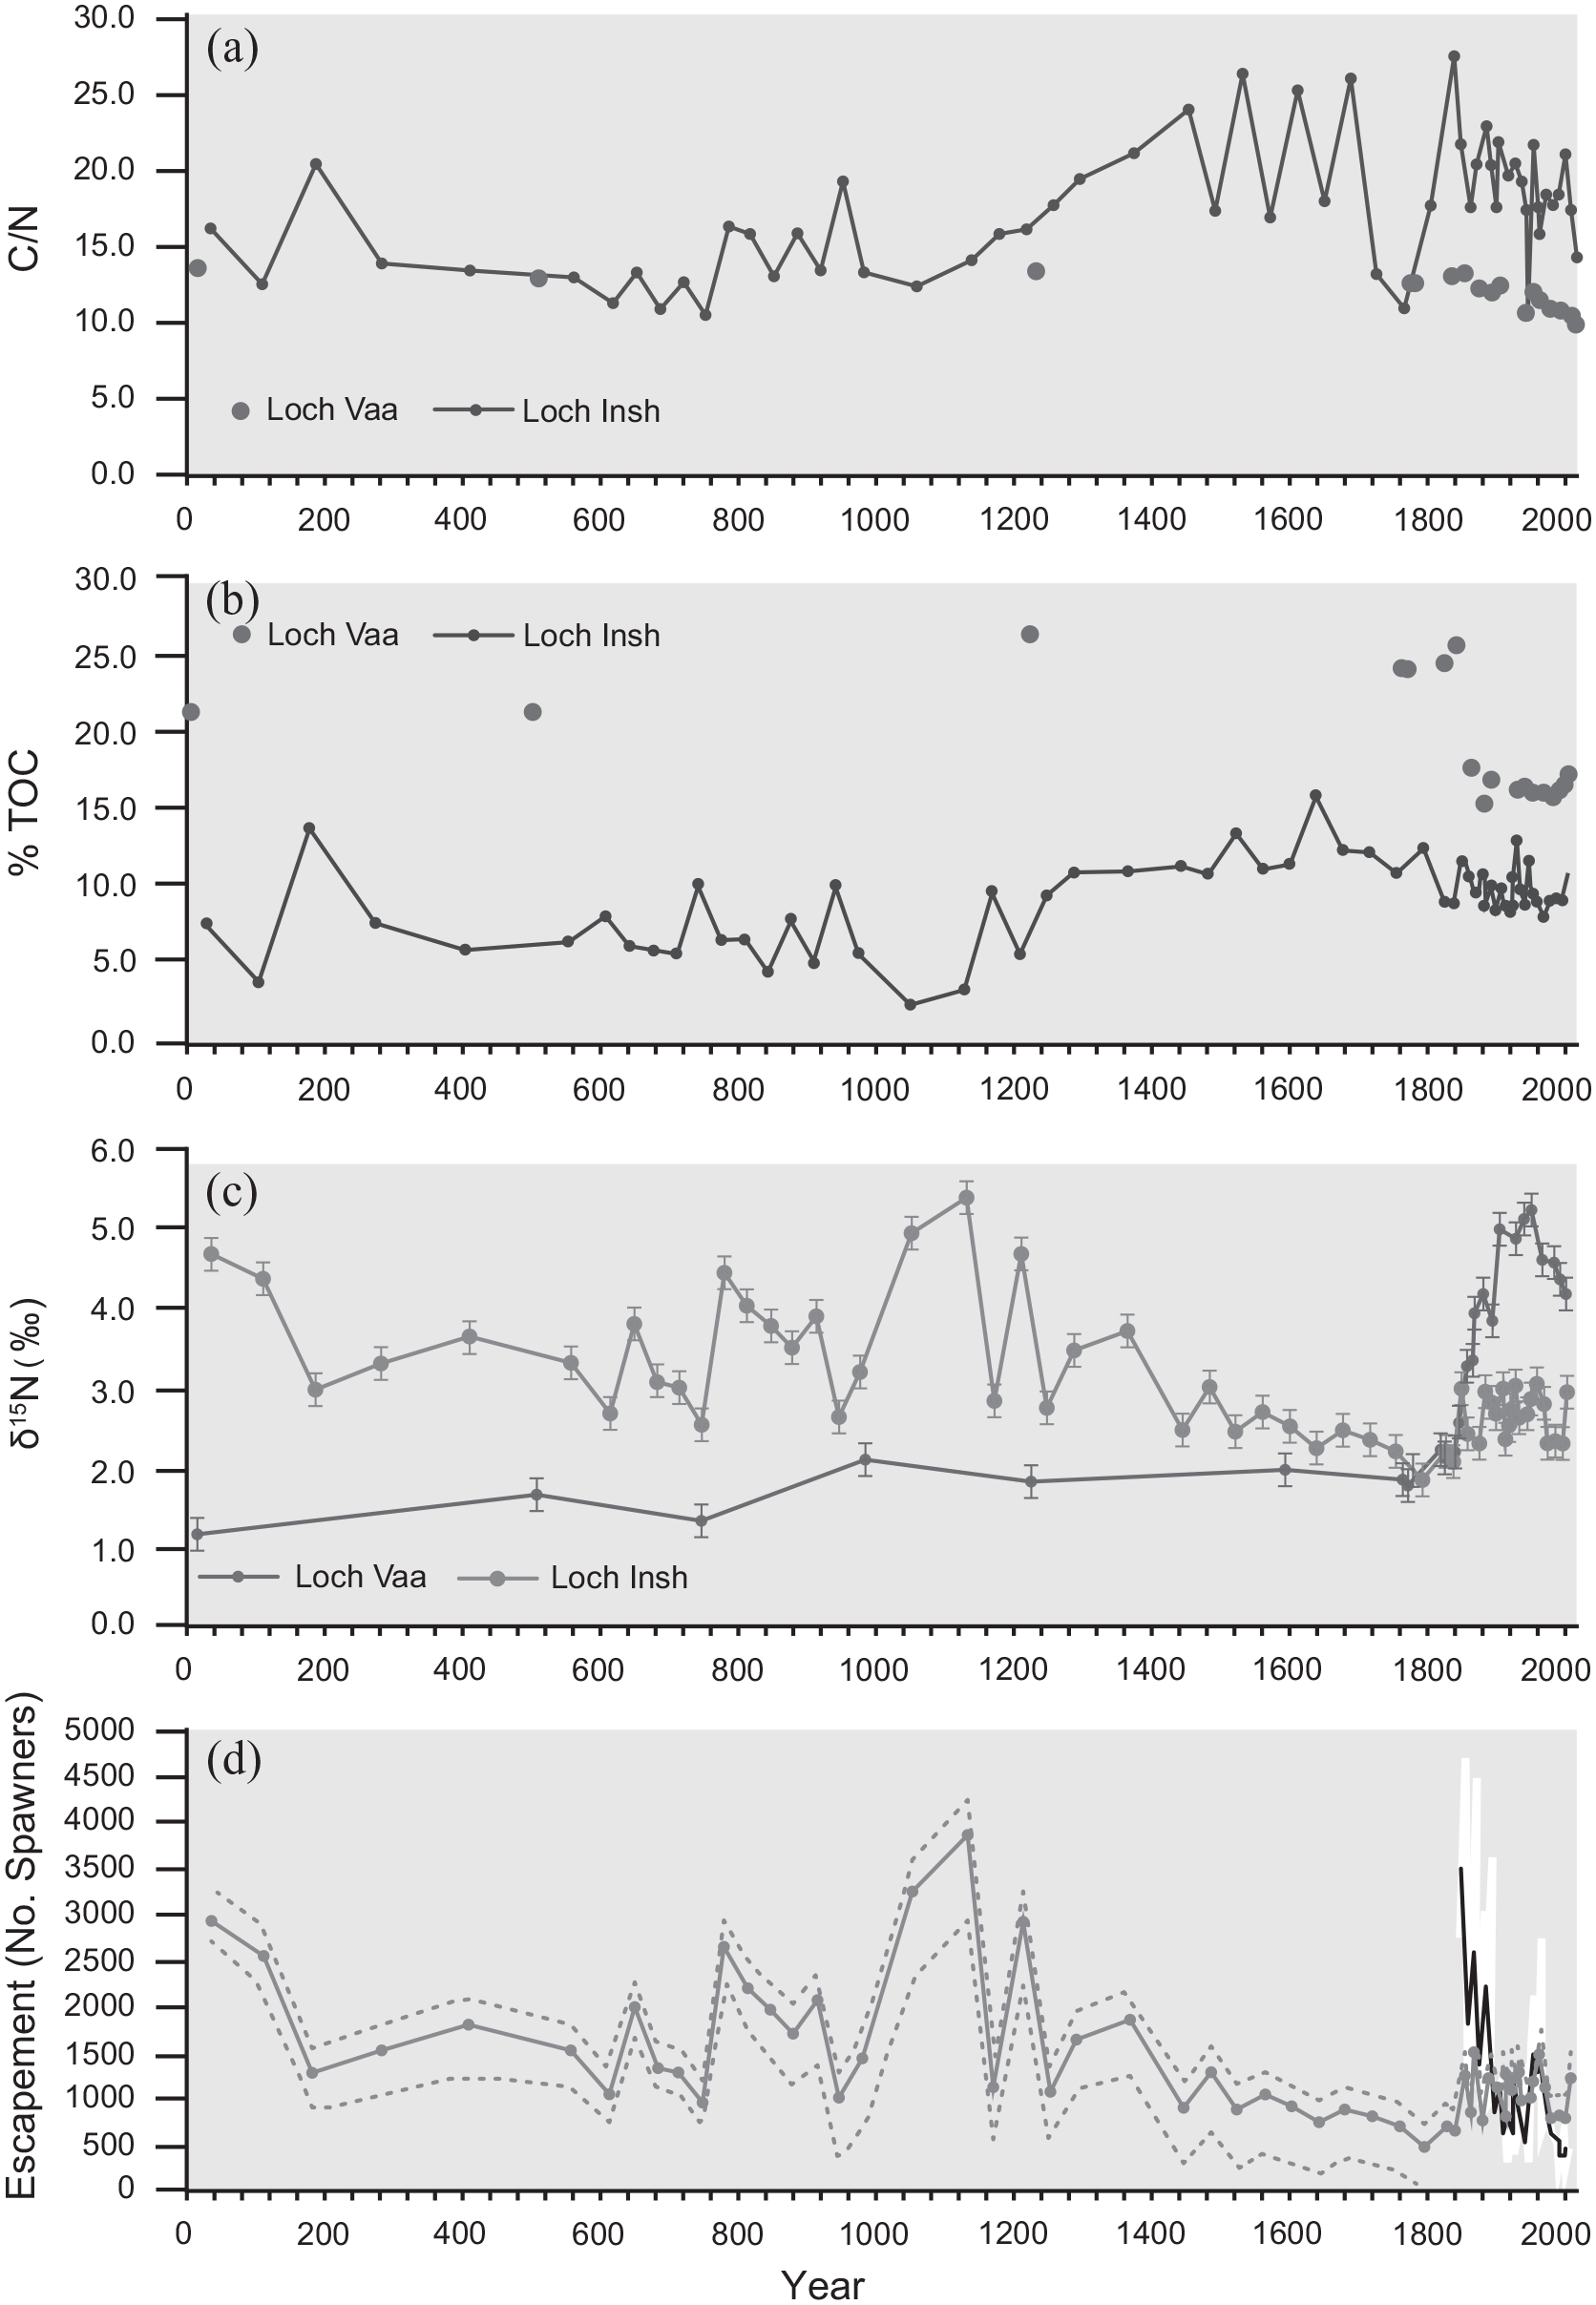
Temporal variations in sediment geochemistry within the Loch Insh core plotted over the last 2000 years showing (a) C/N content, (b) %TOC and (c) δ15Nsed trends in Loch Vaa (Control) and Loch Insh. Variability and levels of δ15Nsed in Loch Vaa are lower and more stable compared with Loch Insh. We attribute Loch Insh variability to fluctuations in salmon abundance. We refer to the δ15Nsed record in Loch Insh as reconstructed Escapement Index (EI). (d) Reconstructed escapement numbers upstream of Loch Insh, based on the Schindler et al. (2006) 2-member Mixing model. Different curves (pecked, solid blue) result from selecting different values for background δ15Nsed.Values plot within the observed (white, black 11-year moving average) escapement data adjusted for catchment area upstream of Loch Insh.
To understand this difference, we undertook a series of analyses designed to establish (a) if the Salmon runs on the Spey are likely to result in a net import or export of N to the catchment upstream of Loch Insh (Lyle and Elliott, 1998); and (b) to estimate the percentage contribution of Marine Derived Nutrients (MDN) to Loch Insh (Hill et al., 2009). We derived estimates of the various components of the budget from the literature and from the data available from fisheries records (Table 3).
Values used in equation (1) and (2) and in the estimation of Net Nitrogen import from returning Atlantic Salmon and escapement numbers upstream of Loch Insh using a 2-Member mixing model.
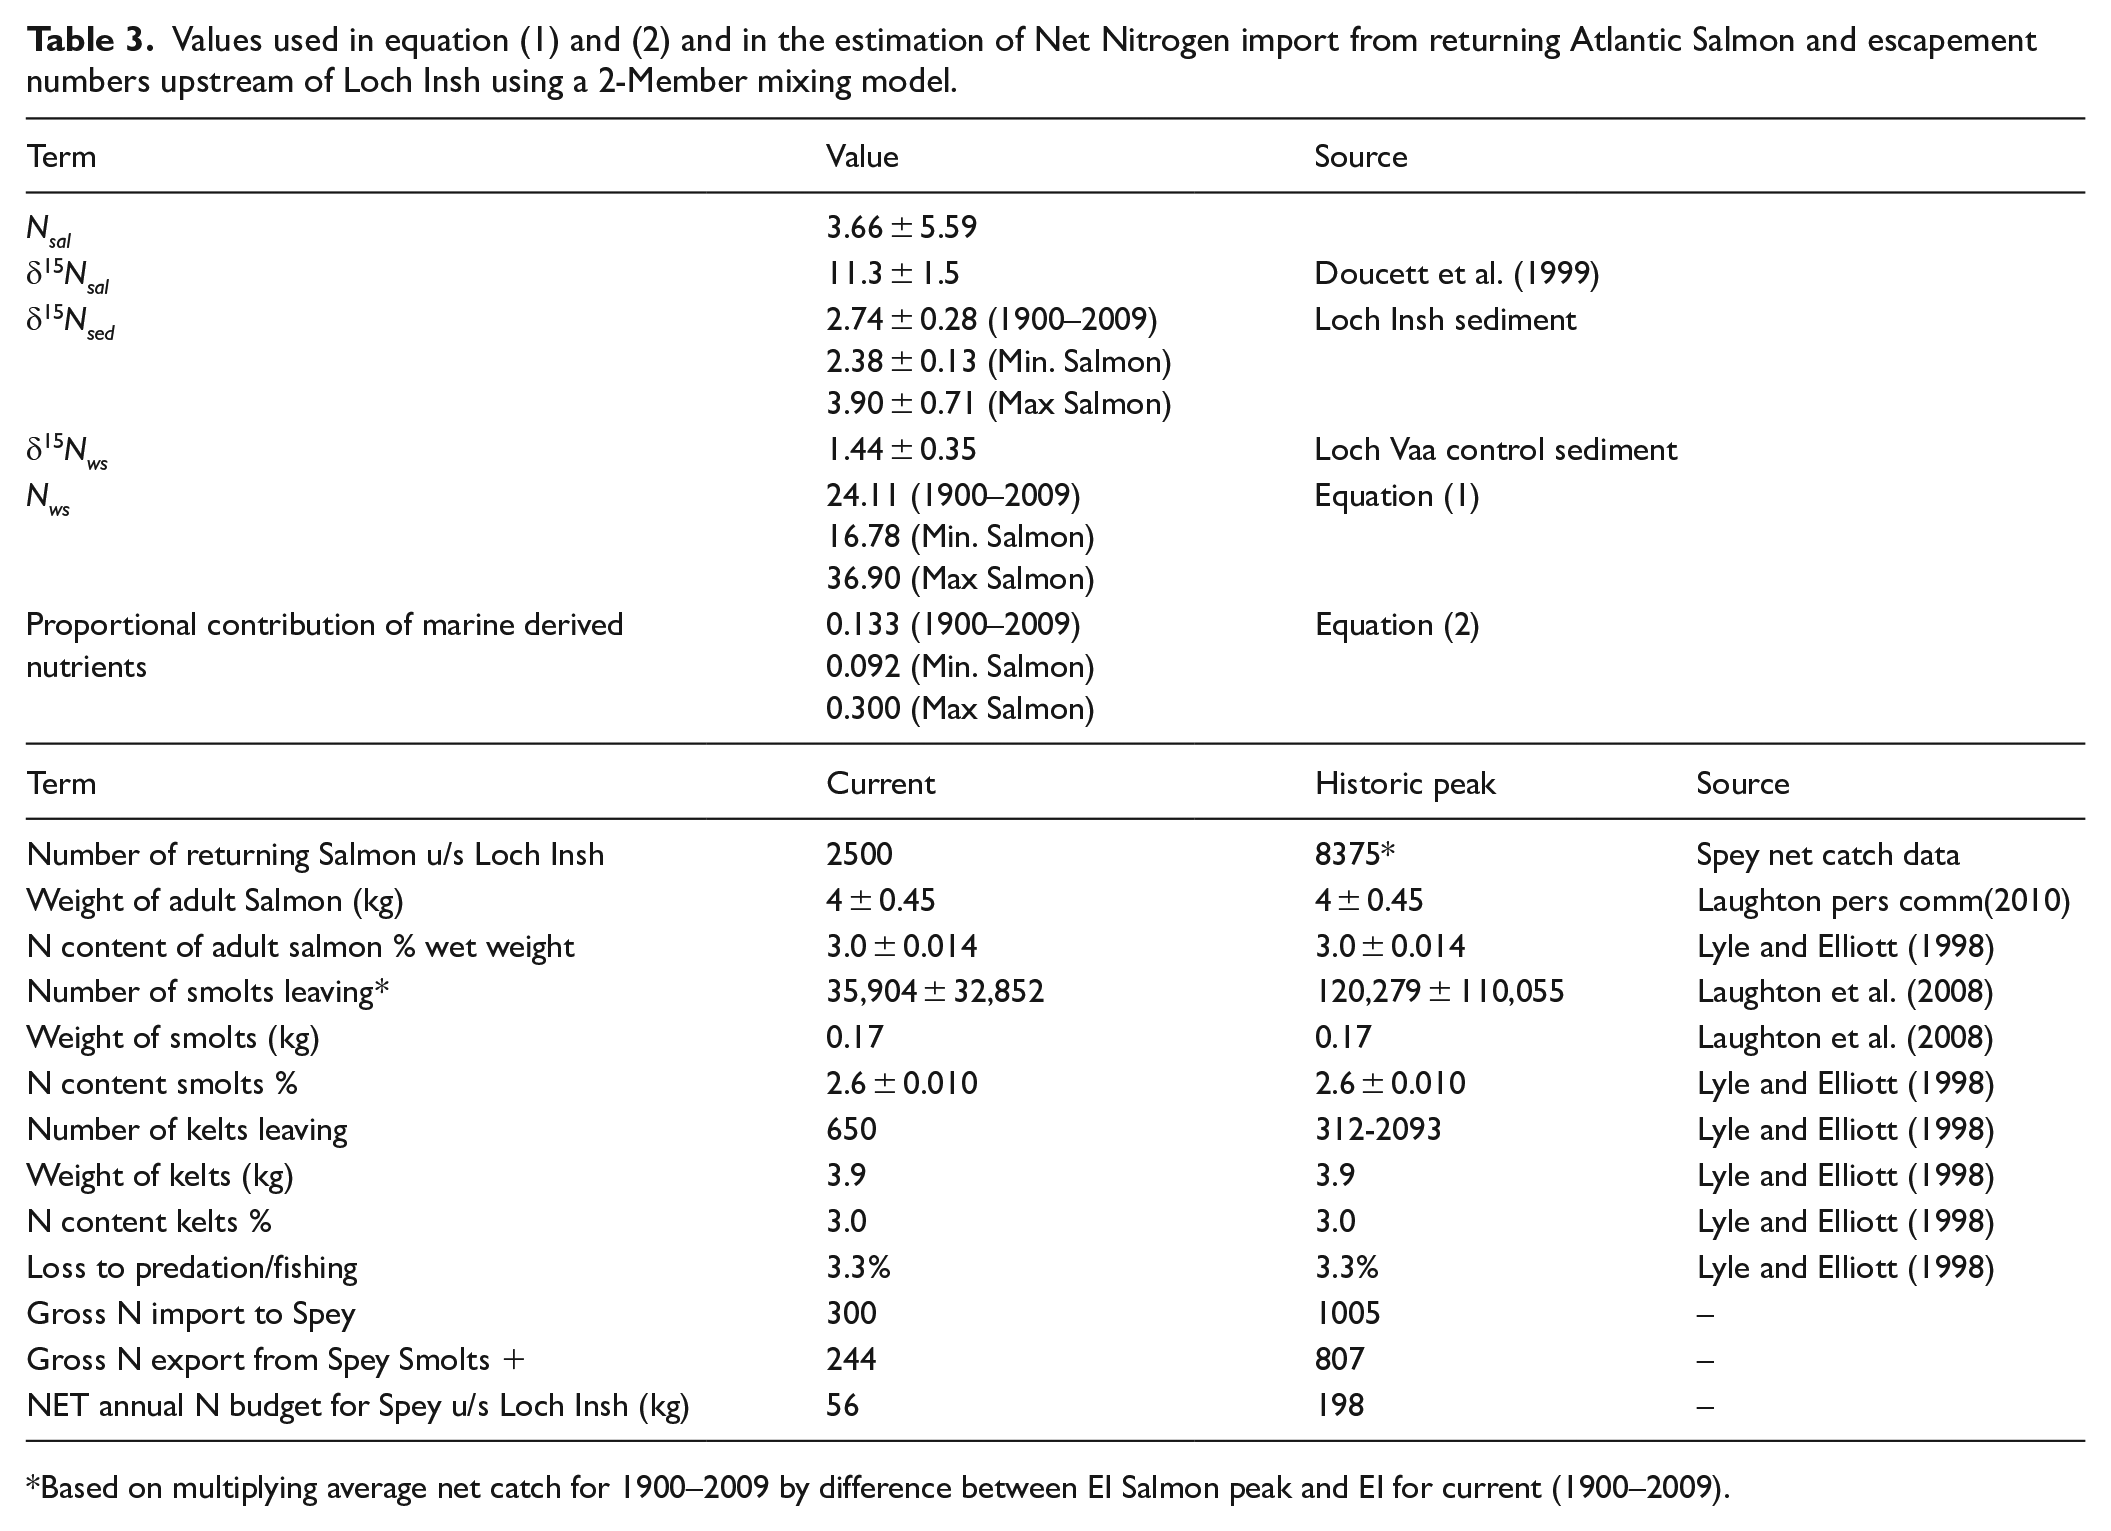
Based on multiplying average net catch for 1900–2009 by difference between EI Salmon peak and EI for current (1900–2009).
Our analysis used sedimentary δ15Nsed to estimate the fraction of ecosystem δ15N uniquely derived from salmon (Hill et al., 2009). We used equation (1) to calculate Nws, the average background N loading from allochthonous sources (Hill et al., 2009);

Where Nsal is the mean annual influx of N based on net catch data from 1900 to 2005, δ15Nsal is the mean N isotope ratio of adult salmon, δ15Nsed is the mean sedimentary N isotope ratio over three periods (Table 3), δ15Nws is the mean background N isotope ratio derived from the Loch Vaa control lake for the period before substantial catchment disturbance in AD 1850. We then calculated the relative proportion of N potentially due to MDN:

Values for the variables used in these formula are given in Table 3.
Our results show a net import of N to the Spey upstream of Loch Insh of ~56 kg N yr−1 which accords with the results of nutrient budgeting studies in other Atlantic Salmon rivers (Jonsson and Jonsson, 2003; Lyle and Elliott, 1998; Samways and Cunjak, 2015). These values are sensitive to the numbers of spawning salmon upstream of Loch Insh, the retention (mortality + transport) of salmon post-spawning, the predation (natural and fishing) and the productivity and survival of juveniles (smolts and kelts). Notwithstanding undoubted variability, our initial budgeting demonstrates the potential for the Atlantic salmon run on the Spey to import and release MDN into the ecosystem. Net import of N is estimated to have been approximately 198 kg N yr−1 during the periods of maximum EI (Figure 5d). In comparison, atmospheric N deposition over the study catchment is low relative to other parts of the UK (<2.5 kg Total N ha−1 yr−1) giving a potential catchment load of 205 kg N yr−1.
The estimated percentage of MDN from salmon range from 13% under current (1900–2009) salmon runs, up to a maximum value under peak historic salmon EI of 30%. Under minimum historic EI conditions the MDN contribution is 9.2% which is similar to values reported for lakes with low contributions from salmon (e.g. 11.2% for a lake with much lower δ15Nsed (–0.3‰ ± 0.8‰) than reported for Loch Insh (Hill et al., 2009), suggesting that our figures are realistic. The results of these estimates demonstrate not only that the contribution of salmon is a positive net gain in N to the Spey headwaters, but that the proportion of δ15Nsed derived from MDN are of the order of 9–30%.
Having established that the N record was enriched relative to background and that it could result from returning salmon we compared the δ15Nsed record from Loch Insh, to the reconstructed EI (Figure 4b). The linear correlation between EI and δ15Nsed is significant and positive (R2 = 0.55, p < 0.001, n = 26). We detrended both EI and δ15Nsed using a LOESS smoother (0.5) and plotted the residuals (Figure 4c). The resulting correlation is significant and positive (r2 = .71, p < 0.0001, n = 23). Thus, the variability in δ15Nsed reflects both the magnitude and the trends in salmon escapement over the past 150 years.
Other proxies were analysed in order to consider catchment and within-lake changes that may have impacted on δ15Nsed (Grey et al., 2001; Figure 5a–c). Values of C/N were relatively stable from the base of the sequence until around c.1080, with the exception of a short-lived peak between c. AD 750 and 950, and these data are similar to the percent total organic carbon (%TOC) (Figure 5b). During this period of relative stability, the δ15N varied, with a concomitant rise between c. AD 850 and 950, but importantly it showed a rapid increase pre-AD1080 (Figure 5c) prior to the large but more steady increase in C/N. The C/N showed a relative increase from c. AD 1080, peaking around AD 1550 while the δ15N was on a downward trajectory, and shifted from >5‰ to <3‰ over this period. Thereafter, the relatively high C/N values (between 18 and 25) continue until present, while the δ15N are reduced to values around 2‰, but with increased and oscillating values after AD 1850. The relative stability of the C cycling (C/N) data pre c. AD 1080 suggests a fairly constant source of organic matter and little by way of catchment in-wash from soils. The later (post-AD 1000) higher values of %TOC and C/N may reflect enhanced catchment disturbance. A 1000-yr pollen record from Loch Insh shows broadly stable woodland communities, as major woodland clearances had already happened by the start of our record (grasses contribute >30% of the pollen), but an increase in Calluna post AD 1000 (Figure 6), likely linked to heathand development and hence possible depletion of catchment soils, may be linked to the increase in %TOC. Birch, pine, alder and hazel characterised the woodland communities that remain and there is an increase in the relative abundance of pine during the last c. 200 years due to plantations, particularly in the 20th century. An alternative source of C could be from authigenic sources, possibly enhanced (emergent) macrophytes, which tend to have higher C/N as they preferentially utilise atmospheric CO2, whereas an internal algal source (as a result of eutrophication) is unlikely as it should be associated with high N. The increase in C/N between AD 1150-1850 could thus partly be attributable to increases in %TOC as outlined above, but may also be reflective of a decrease of external N input. As marine fish have high N and δ15N, a reduction of salmon would increase C/N and decrease δ15N exactly as observed. Ranges for ‘natural’ δ15N signatures have an upper boundary of +4‰ for the last few millennia (McLauchlan et al., 2013); our data show higher δ15N (+6‰) prior to the increase in C/N. Prior to c. AD 1850, δ15N and C/N of organic matter in sediments from Loch Vaa, the neighbouring closed control lake basin (i.e. no salmon nutrient contribution), has lower δ15N (+1.4 ± 0.4‰) and C/N (13.7 ± 0.8). Thus, our results likely show that the 2000-year record of δ15N in Loch Insh reflects additional contributions of MDN from populations of spawning Atlantic salmon.
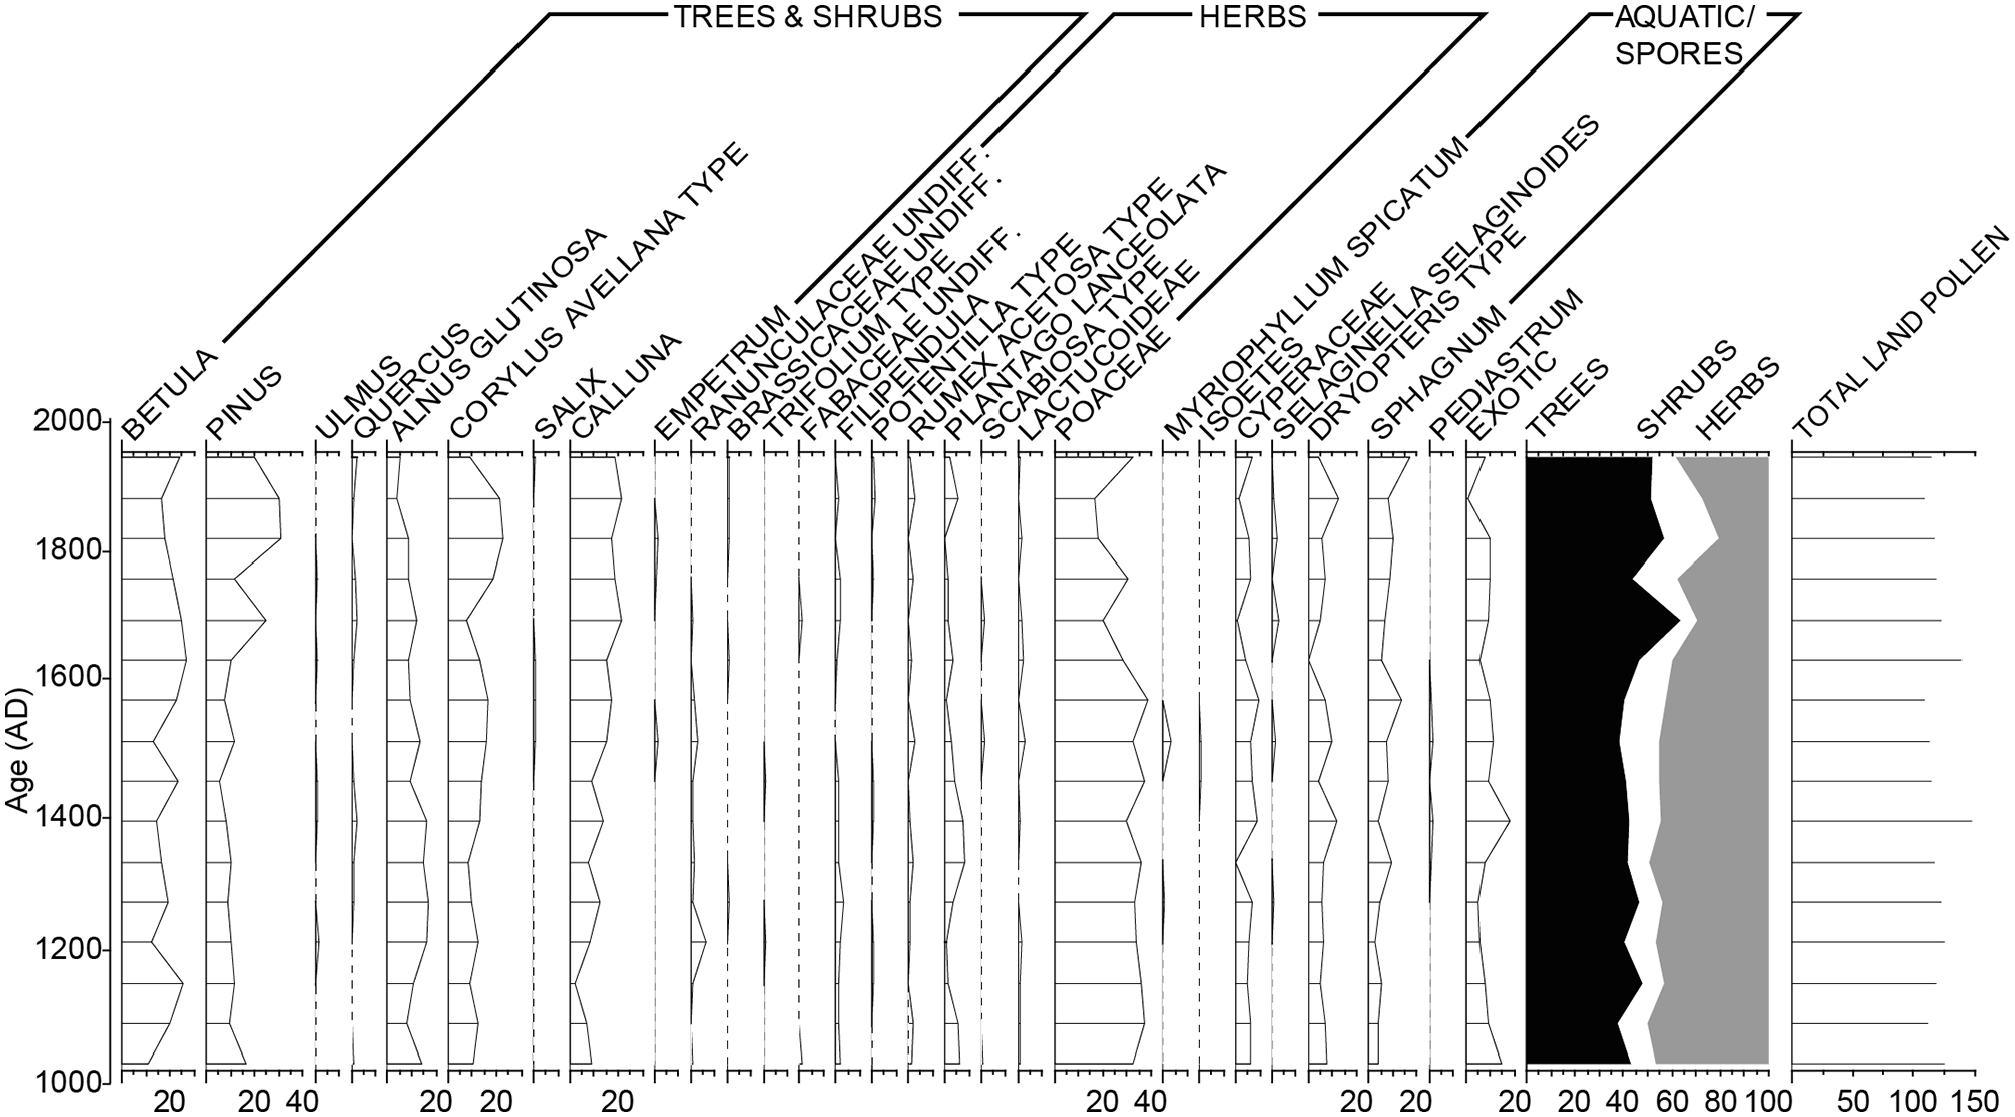
Pollen frequency diagram covering the last 1000 years and showing vegetation patterns (major taxa only) for the upper Spey catchment and environs of Loch Insh. Land cover is relatively stable over the period of interest. There are no major changes concurrent with the decline in δ15Nsed at AD 1150–1800 and increasing %TOC and C/N ratio.
The 2000-year record of δ15Nsed reveals substantial variability at much larger magnitudes than those seen in the historical period for which EI salmon data exist (Figure 5c). A similar observation for Pacific salmon stocks was attributed to changes in ocean conditions and natural variations in the population, independent of human exploitation (Finney et al., 2002; Rogers et al., 2013).
Previous studies have attempted to estimate escapement from marine nutrient records within lake sediments (e.g. Schindler et al., 2006). Here we apply a 2-Member mixing model to estimate escapement above Loch Insh using the method of Schindler et al. (2006) and the data contained in Table 3. We used three options for background δ15Nws; an average of the pre-1800 data from Loch Vaa (i.e. before catchment disturbance), the average for the last decade from other control lochs in the region (Curtis and Simpson, 2007), and the Loch Vaa data with the post catchment disturbance set to 0 to represent an extreme scenario.
Estimated escapement numbers are shown in Figure 5d, relative to estimated escapement based on the catch statistics for the lower Spey. Estimates are of similar magnitude. Low values in the later 17th century coincide with the timing of a genetic bottleneck (Nikolic et al., 2009). Estimated escapement numbers before the major decline in salmon at c. AD 1150–1250, are on average 51% higher than current levels, with maxima up to 348%.
Discussion
Recent research emphasis on the marine phase of the Atlantic salmon life history highlights changes in the ocean system that affect the location of feeding grounds, growth, survival and fitness and Nitrogen content of returning adult fish (Doucett et al., 1999; ICES, 2013). In the North Atlantic, during periods of cooler Sea Surface Temperatures (SST) the numbers of returning Atlantic salmon are lower and the fish smaller and less fit than during warmer conditions (Lajus et al., 2005). In contrast, recent (1970–2010) fish catch data show declines in Atlantic salmon catches coinciding with the positive state of the Atlantic Multidecadal Oscillation (AMO) index (i.e. a warmer North Atlantic; Friedland et al., 2014). Growing evidence for geographical differences in population responses to ocean temperature from both Pacific salmon lakes and north Atlantic rivers (Davidson and Hazelwood, 2005; Rogers et al., 2013) suggests that location of natal rivers dictate the nature of the relationship between the marine environment and salmon population. This is most probably mediated through genetic traits and position of feeding grounds (Hale, 2007). Furthermore, Rouyer et al. (2008) point out that any relationship between salmon populations and large-scale ocean or climate proxies is likely to be complex, as ecosystem processes and exploitation trends will both affect population-environment interactions.
We used four datasets to explore the potential for ocean/climate control on Atlantic salmon EI over the last two millennia (Figure 7a–f): the winter North Atlantic Oscillation Index (wNAOI) (Trouet et al., 2009), the composite May – October SST record for the NE Atlantic (Cunningham et al., 2013), the reconstructed Icelandic Air temperature records (Kaufman et al., 2009) for the last 2000 years, and the reconstructed AMO (Gray et al., 2004).
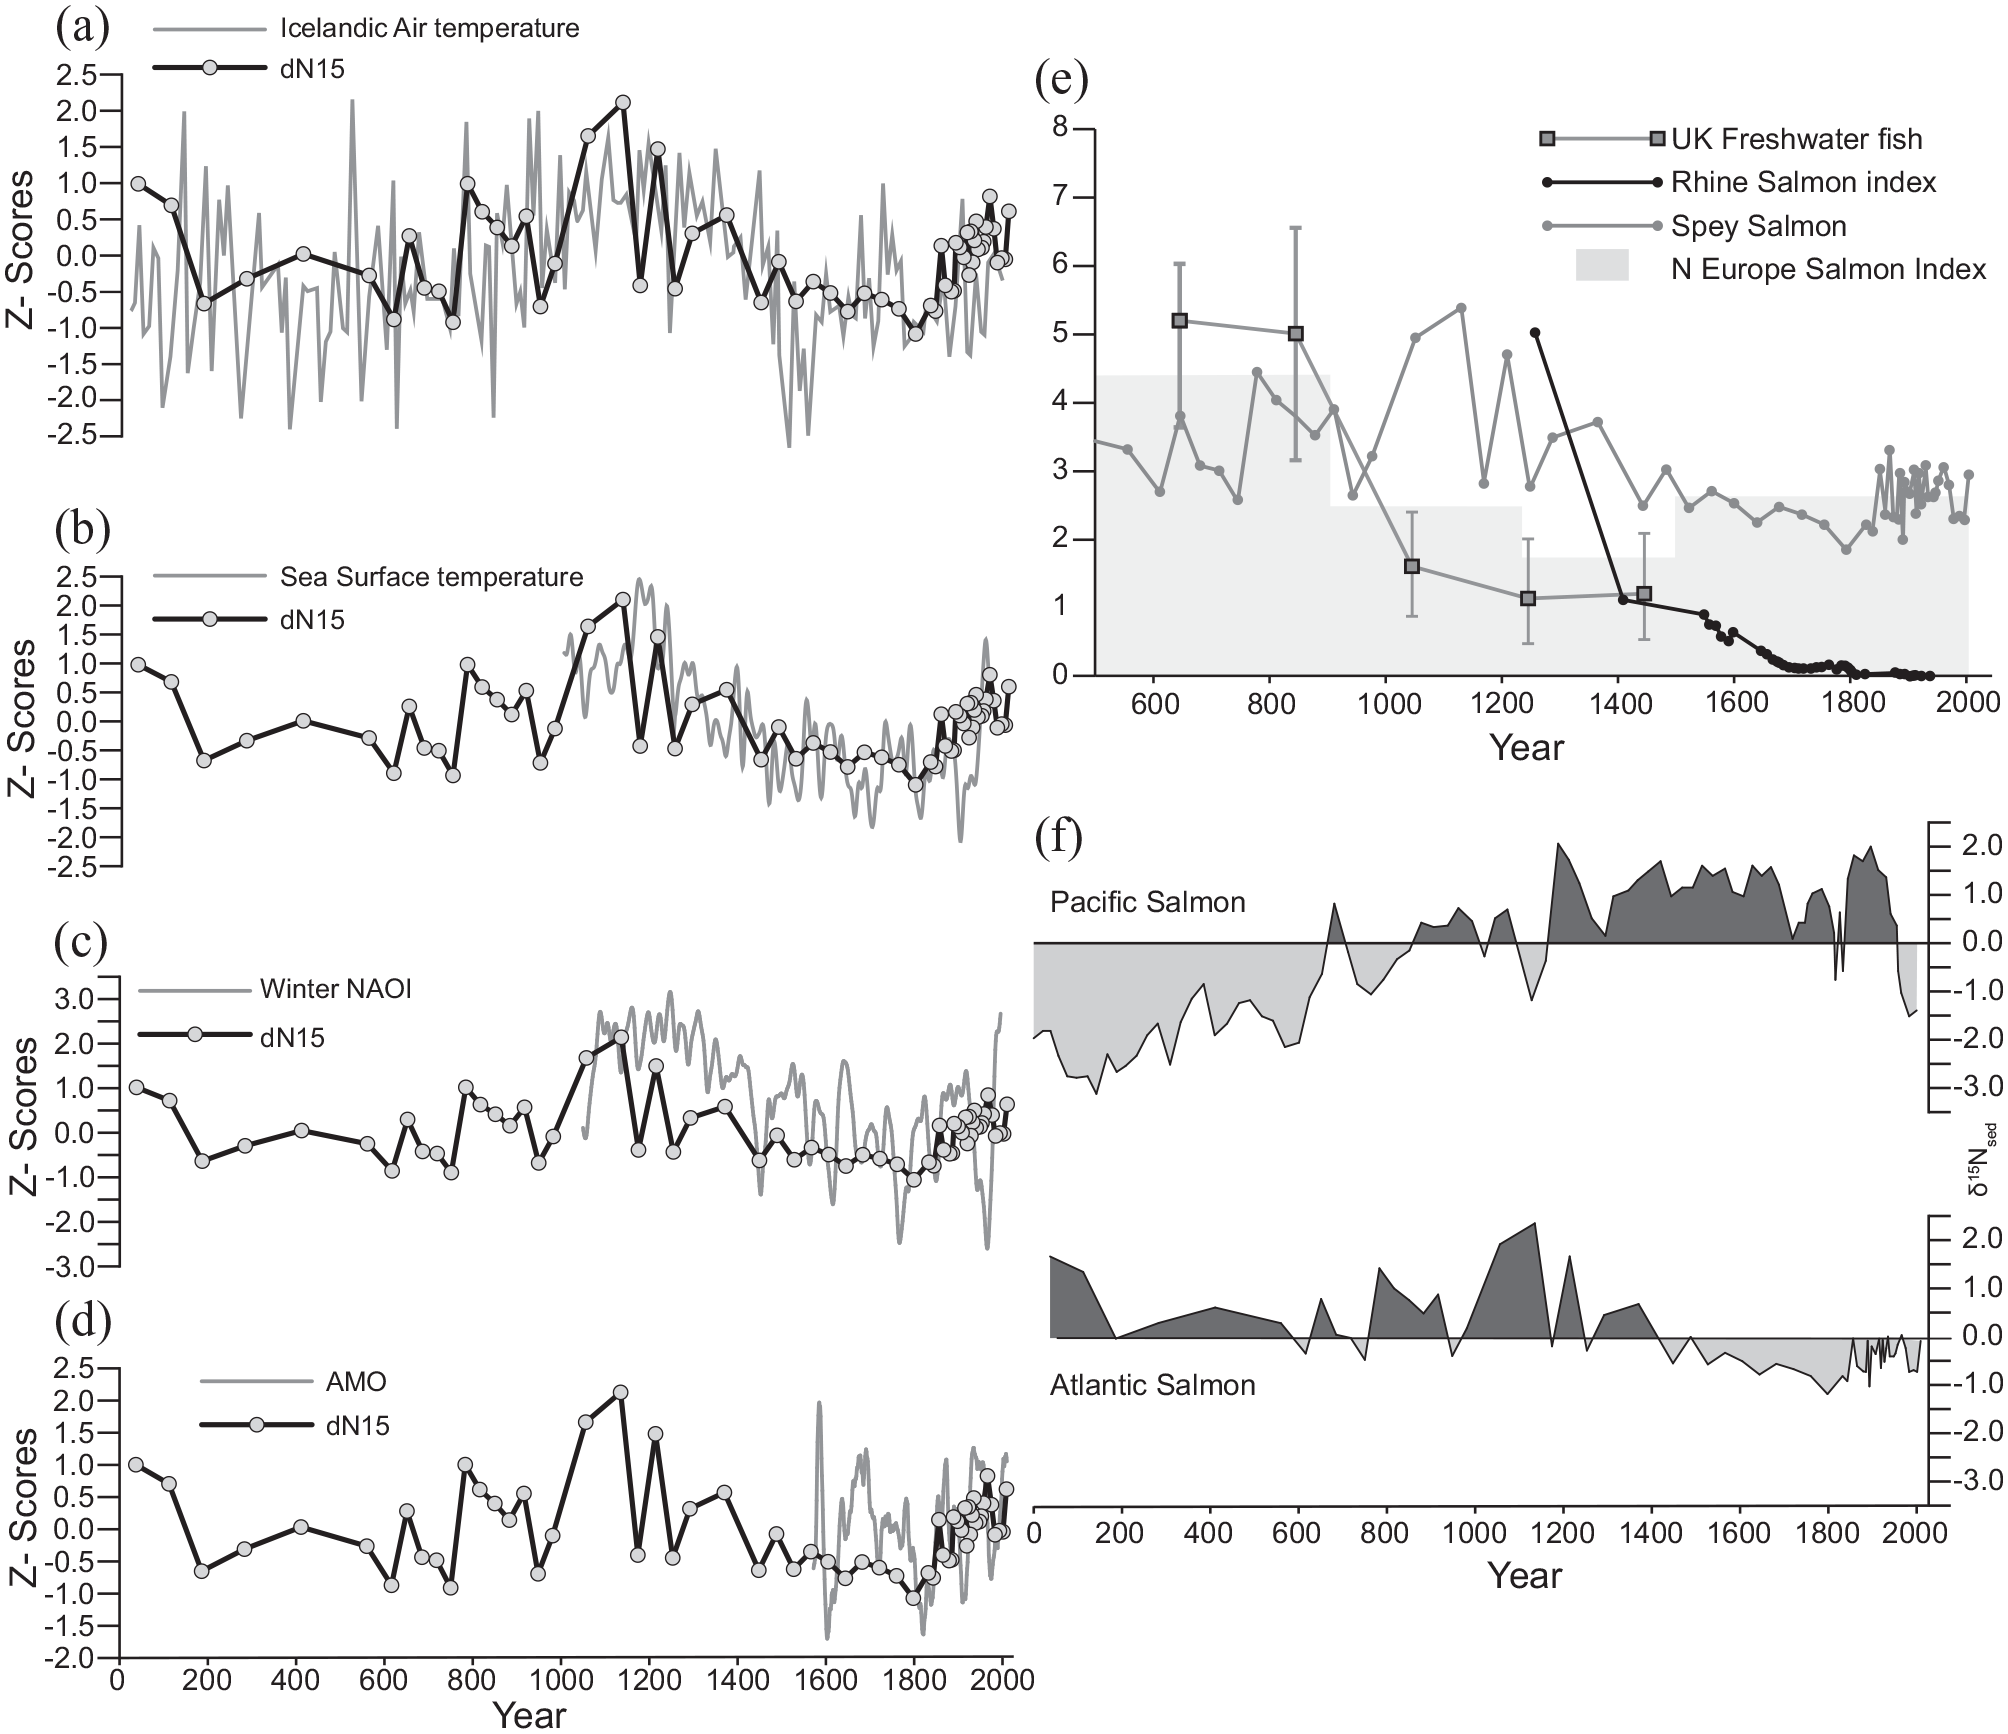
Temporal variations in Atlantic Salmon E.I (Escapement Index in z-scores) and North Atlantic Ocean/climate proxies. The figure highlights the complexity and non-stationarity in the relationships between ocean/climate forcing and salmon escapement for the River Spey. Reconstructed E.I shows broad correspondence with (a) reconstructed Arctic Air temperature (Kaufman et al., 2009). (b) SST reconstructions for Spey salmon feeding grounds NW of Iceland (Cunningham et al., 2013). (c) Winter North Atlantic Oscillation index wNAOI (Trouet et al., 2009). (d) Proxy Atlantic Multidecadal Oscillation AMO (Gray et al., 2004). The Medieval Climatic Anomaly (c. AD 850–1350) shows persistently high salmon escapement corresponding with persistent positive wNAOI, higher SST and Icelandic Air temperatures, declining into the dominantly negative wNAOI phase with lower SST and Icelandic air temperatures and negative AMO during the Little Ice Age (c. AD 1400–1850). Correlation Coefficients show statistically significant relationships between the Salmon escapement and SST and AMO. The major decline in EI occurs around the time documentary and zooarchaeological data show decreases in Atlantic salmon in Northern European rivers Lenders et al., 2016) (e). (f) We observe a similar response to higher SST in Atlantic salmon as the North Pacific salmon escapement: declining runs during periods of cooler ocean temperatures. This points towards a marine habitat control on returning spawners upon which human modification of riverine habitats and exploitation are overprinted. Shaded areas denote periods above and below average values for δ15Nsed.
We initially ran the analysis on the period 1970–1991, as others have identified a strong correlation with AMO (Friedland et al., 2014). We detrended the EI data for the period of observed salmon escapement (1970–1991) and correlated this time series with the climate proxies (Friedland et al., 2014). At annual resolution, observed escapement is significantly negatively correlated with AMO in the Spey for this shorter period (r2 = −0.55, p < 0.001, n = 22). Negative AMO (cooler North Atlantic) is associated with increased EI, however this relationship is dominated by the period 1970–1980 when EI and AMO are in anti-phase. For the later decade 1980–1991 EI and AMO are not significantly correlated. For wNAOI the correlation is also negative and strong (–0.59, p < 0.001, n = 22), though again this masks periods of anti-phase and in-phase. Equivalent SST anomaly data only extended to 1974.
We repeated the analyses for the Spey EI data from 1856 to 1991. The resulting positive correlations with AMO and wNAOI were not significant. SST and air temperature were negatively correlated but not statistically significant. These results arise from a complex relationship between ocean-atmosphere conditions and EI, wherein decadal trends that are strongly correlated become out of phase later in the time series. Between 1850 and 1905, AMO and EI are in phase (positively correlated). For the Spey, EI (and δ15Nsed) both become out of phase with AMO after c. 1910, as seen in other Scottish east coast rivers (Otero et al., 2011). From c.1960, values become increasingly negatively correlated. With wNAOI, there is little clear relationship with EI; 1850–1860 negative wNAOI occurs during high EI, but thereafter there is little correlation. Reconstructed SSTs in the North Atlantic and Norwegian sea show a similarly complex relationship, with increasing EI in the 1950’s corresponding with a phase of warming SST. Thus, unlike shorter regional studies, we find a complex and temporally varying relationship between EI based on catch data and proxy measures of north Atlantic climate and ocean-temperature.
To determine if there was a statistically significant relation between our MDN record and longer-term indices of North Atlantic climate we interpolated the proxy records at the same resolution as our δ15Nsed data. All proxy indices show visual correspondence with the major decline in δ15Nsed between c. AD 1150 and 1800, but of these only AMO (r2 = 0.43, p < 0.010, n = 33) and SST (r2 = 0.59, p < 0.001, n = 43) are statistically significant (Figure 7b and d). AMO and SST are positively correlated at millennial timescales, and δ15Nsed decreases with declining AMO and SST in the region of the population’s marine feeding grounds. This is the opposite of the trends revealed at shorter timescales used in previous studies (Friedland et al., 2003; Rouyer et al., 2008). Long-term MDN records from the Pacific have been shown to exhibit similar trends, with increasing salmon populations during warmer periods of SST, and large-amplitude variations that coincide with millennial- and centennial-scale variation in ocean and climate conditions when upwelling of nutrient rich water occur in the northwest Pacific (Finney et al., 2002; Gregory-Eaves et al., 2009; Figure 7f).
In the North Atlantic, a major cooling event occurred c. AD 1200–1500 at the transition from the Medieval Climatic Anomaly (MCA) into the Little Ice Age (LIA). It is present in composite NE Atlantic SST records (Figure 7b) and coincides with the end of the high positive wNAOI (Figure 7c). The largest decline in δ15Nsed occurs during this event and, with an age-depth model uncertainty of ±250 years, corresponds with the archaeological evidence in the UK for a reduction in consumption of migratory fish (Barrett et al., 2004) (Figure 7e). The subsequent persistent cool phase (c. AD 1450–1850), characterised by both cooler air temperatures and SSTs and a dominant negative state of the wNAOI, corresponds with the (LIA) and a phase of decreasing δ15Nsed in Loch Insh, against a background of a relatively stable δ15Nsed in Loch Vaa for the same period (Figure 5c). The observed declines in δ15Nsed during the cooler phases of the last millennia, could arise from both a reduction in the mass of returning spawners (smaller fish) and/or a decline in numbers of returning spawners. Cooler temperatures reduce growth rates in the first year at sea (Jensen et al., 2011), whilst increased storms and changes in ocean currents such as occurred during the MCA-LIA transition, can disrupt pelagic food webs and increase mortality (Lehner et al., 2013). In addition, increased river ice in headwater streams of the Spey during the LIA may have reduced survival rates of incubating salmon embryos (Huntington et al., 2003).
We interpret variations in EI during the earlier period of record (AD 50–1200) to be driven by a combination of climatic and ecosystem processes, as observed in long term Pacific Salmon species (Finney et al., 2002). However, post c. AD 1100, these natural variations are increasingly imprinted by human modifications to salmon populations. Historical data have been used to argue that a rapid and sustained collapse in Atlantic salmon numbers in NW Europe commencing around AD 1000–1250 and continuing until present, resulted from the increased prevalence of barriers to adult and smolt migration, particularly due to the progressive construction of mills (Lenders et al., 2016). Zoo-archaeological evidence (Barrett et al., 2004; Lenders et al., 2016) shows a similar decline in salmon in rivers of Northern Europe and the UK between c. AD 800–1250 that continues to the present (Figure 7e). Our data support the notion of a rapid collapse in returning Atlantic salmon starting around the same period (AD 1000–1250) and continuing to c. AD 1850. We postulate, however, that this arose in part from natural changes in the marine environment. Human modifications to the River Spey were minor in comparison with the Rhine and other major European and industrialised UK rivers used to support the barrier hypothesis. Further support for a larger scale marine change effect on salmon populations at that time, comes from comparison with the Northwest Pacific salmon species, where a rapid change (increase) in returning spawner populations occurred between c. AD 1000 and 1250 in response to warming SSTs (Finney et al., 2002) (Figure 7f). We hypothesise that northern hemisphere ocean-atmospheric changes at the transition from the MCA into the LIA, drove persistent changes in salmon populations. Human modification of rivers and increasing exploitation of Atlantic salmon in European river systems exacerbated this natural population decline, leading to extirpation in some rivers.
For the Spey, the low MDN period AD 1600–1800 corresponds with the genetic bottleneck reported for the river (Nikolic et al., 2009) which corresponds with increased and more efficient netting. This in turn resulted in stronger regulation of netting post-AD 1800 in response to observed rapid declines in salmon catches (Hale, 2007) leading in part to recovery of the population in the later 19th century.
Our long-term record of Atlantic salmon EI has implications for several current environmental management debates. First, beaver reintroduction into Scotland and the wider UK, has led to concerns from fisheries and angling communities about their impact via barrier formation, on Atlantic migratory salmon. The higher values and variability in δ15Nsed before AD 1250 that we interpret as evidence for increased numbers and size of Atlantic salmon spawners in the Spey, coincide with the presence of European beaver (Castor fibre) populations in the landscape, supporting contemporary evidence that Atlantic salmon and European beaver are able to co-exist in larger numbers than present (Gaywood, 2015). Secondly, past MDN loads were higher than contemporary levels, which would have cascading impacts for riverine food webs and stream productivity (Boylan and Adams, 2006; Samways and Cunjak, 2015). Thirdly, the data support the emerging evidence based on short (<150 years) catch records, that variations in returning Atlantic salmon populations are influenced by ocean conditions. In contrast to comparisons of shorter time series, however, we observe non-stationary relationships between AMO, wNAOI, SST and reconstructed Atlantic salmon EI that vary over centennial and millennial timescales.
From a paleoenvironmental perspective, the identification of a detectable contribution of MDN suggests that this source of macronutrients needs to be more carefully considered in the interpretation of biogeochemical records from oligotrophic lakes with historical anadromous fish populations. Similarly, whilst term records of salmon populations based on MDN in the Pacific are well established, we demonstrate that carefully selected lakes can produce similar records for Atlantic salmon. Atlantic and Pacific data show variations in salmon populations which arise from changes in the marine phase of salmon habitat. These natural changes interact with ecological and human pressures to generate different relationships between marine conditions and salmon populations. Understanding these different interactions will be key to forecasting future impacts arising from a growing human population and a warming world.
Supplemental Material
sj-docx-1-hol-10.1177_09596836221095983 – Supplemental material for Climate and human exploitation have regulated Atlantic salmon populations in the River Spey, Scotland, over the last 2000 years
Supplemental material, sj-docx-1-hol-10.1177_09596836221095983 for Climate and human exploitation have regulated Atlantic salmon populations in the River Spey, Scotland, over the last 2000 years by David Sear, Pete Langdon, Melanie Leng, Mary Edwards, Tim Heaton, Catherine Langdon and Julian Leyland in The Holocene
Footnotes
Acknowledgements
The authors thank the Atlantic Salmon Trust for funding a part of this research, Mr Clive Freshwater at Loch Insh Watersports Centre for permission to conduct the research on Loch Insh, and Ms Hannah Crabb for field and laboratory assistance. Data on historic salmon populations on the River Spey were provided by the Spey Fisheries Research Board. Dates were provided by the NERC Radiocarbon Facility NRCF010001 (allocation number 1457.0310), and Beta Analytical Ref:Beta – 403041, 438066 stable Isotope analysis was provided by NERC Isotope Facility. Finally, our thanks to Maarten Van Hardenbroek and John Dearing for constructive reviews of earlier drafts of this manuscript and three anonymous reviewers whose comments have greatly helped improve the final paper. The datasets generated during and/or analysed during the current study are available from the corresponding author on reasonable request.
Funding
The author(s) disclosed receipt of the following financial support for the research, authorship, and/or publication of this article: The field research was part-funded by a small grant from the Atlantic Salmon Trust.
Supplemental material
Supplemental material for this article is available online.
References
Supplementary Material
Please find the following supplemental material available below.
For Open Access articles published under a Creative Commons License, all supplemental material carries the same license as the article it is associated with.
For non-Open Access articles published, all supplemental material carries a non-exclusive license, and permission requests for re-use of supplemental material or any part of supplemental material shall be sent directly to the copyright owner as specified in the copyright notice associated with the article.