
Abstract
The 4.2 ka event is one of the most prominent climate events of the Holocene. In this study, several climate model experiments were performed to investigate its causal mechanism. The focus in these experiments was on the impact of anomalies in sea surface temperatures (SSTs) associated with enhanced El Nino activity, as this has been proposed as an important driver for the event. Six different SST anomaly scenarios were considered, covering the tropical sectors of the Pacific, Indian, and Atlantic Oceans. In addition, the possible impact of desertification in Northern Africa and Arabia was taken into account. The model results were evaluated against the global humidity anomaly signature for the 4.2 ka event as provided by proxy-based reconstructions from 129 different sites. It is found that a scenario with desertification and warm Pacific SSTs and cold Atlantic SSTs provides the best match with these proxies. This experiment produces significant decreases in precipitation in South Asia, West and East Africa, and increases in South America and northwest North America. These results are partly forced by the strong increase in albedo in North Africa and Arabia, leading to regional cooling and more stable atmospheric conditions, and partly by enhanced atmospheric moisture transport to South America related to an enhanced land-sea thermal contrast. Based on these results, it is proposed that the 4.2 ka event was caused by tropical SST anomalies, leading to drying in North Africa, assisted by ongoing desertification in Northern Africa and Arabia.
Introduction
One of the most prominent Holocene climate events occurred around 4.2 ka (calendar years before present). This so-called “4.2 ka event” is registered in proxy records in many parts of the world (Figure 1, Supplemental Table S1, available online, e.g. Booth et al., 2005; Marchant and Hooghiemstra, 2004; Rousseau et al., 2019; Walker et al., 2012) and archeological evidence suggests that it had a major impact on early civilizations (Weiss, 2016; Weiss and Bradley, 2001), for instance in the Middle East (Cullen et al., 2000; DeMenocal, 2001; Weiss et al., 1993), China (Wang et al., 2016; Wenxiang and Tungsheng, 2004), and India (Dixit et al., 2014; Staubwasser et al., 2003). This 4.2 ka event is so prominent that it was used to mark the transition between middle to late-Holocene (Walker et al., 2012). The event has been primarily referred to as a global mega-drought event (e.g. Booth et al., 2005; Weiss, 2016), although this interpretation has become more controversial in recent years (e.g. Voosen, 2018). Indeed, research has shown that the climate impact of the 4.2 ka event depends strongly on the geographical location. Although in many places the event has been linked to dry conditions, such as in North and East Africa, Central North America, South and East Asia, and around the Arabian Sea, in other areas anomalously wet conditions dominated, notably in South America, western North America, and SW Africa (Marchant and Hooghiemstra, 2004; Railsback et al., 2018; Wang et al., 2016). Regardless of the nature of the climate anomaly, the 4.2 ka event stands out among other Holocene climate events (e.g. at 9.2, 8.2, 5.3, or 2.8 ka) because its main impact was in the tropics instead of the mid-to-high latitudes (e.g. Bradley and Bakke, 2019). In this paper I explore the forcing of the event in climate model experiments.
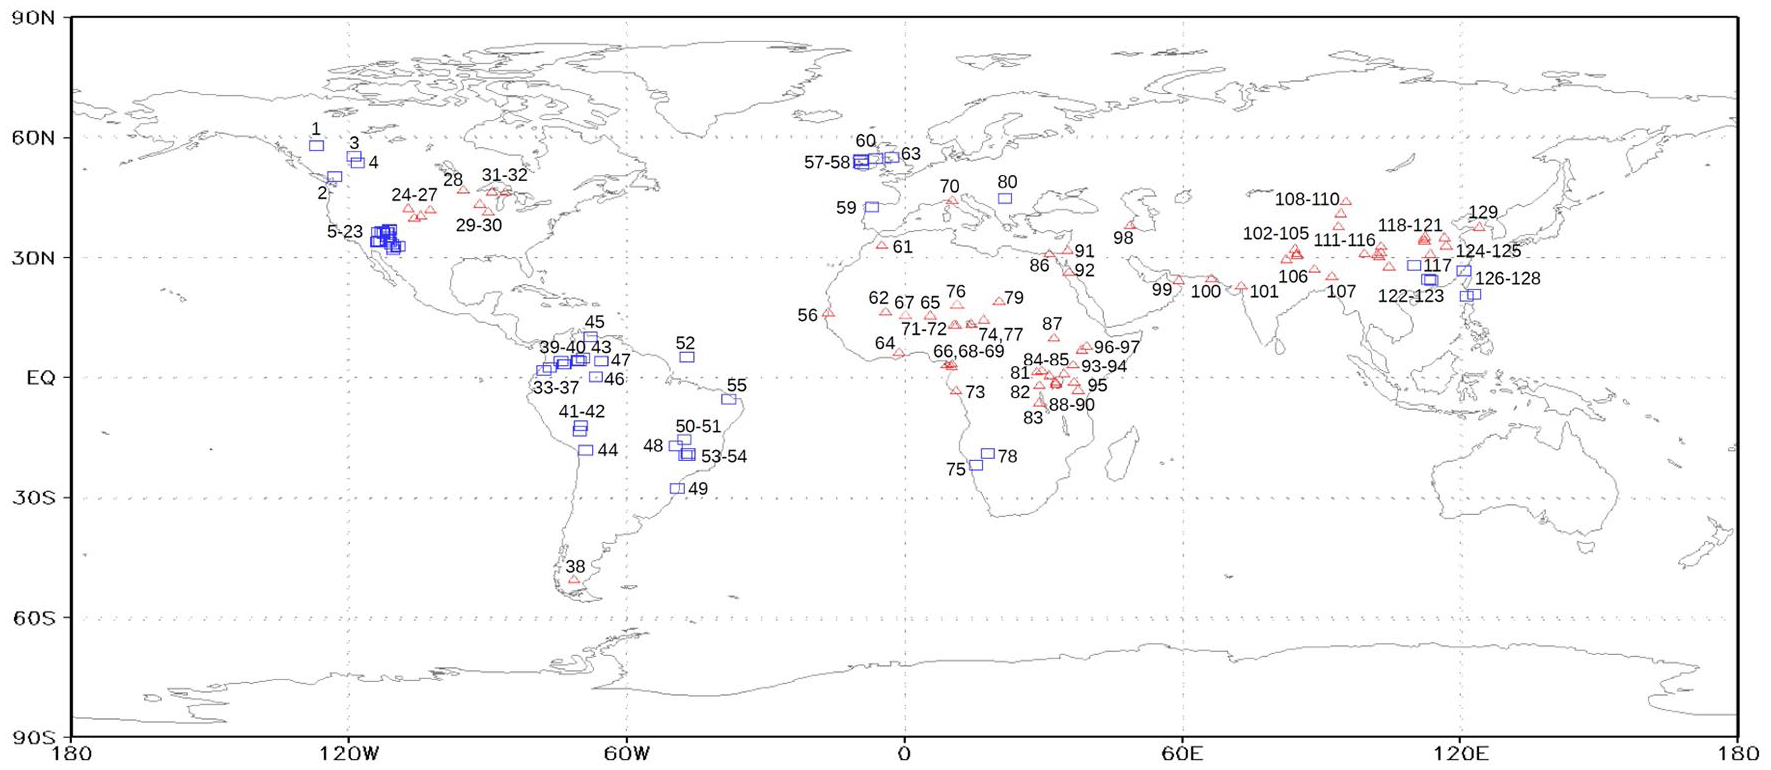
Global signature of the humidity anomaly associated with the 4.2 ka event: a blue rectangle signifies anomalous wet conditions; a red triangle signifies anomalous dry conditions. The numbers refer to Supplemental Table S1, available online.
The noted global pattern, with spatially contrasting humidity anomalies and a core response in the tropics, raises questions on the causal mechanism of the event. Most other mentioned prominent Holocene climate events have been linked to forcings external to the atmosphere-ocean system, for instance by a large meltwater pulse into the North Atlantic Ocean (events at 9.2 and 8.2 ka; Alley et al., 1997; Fleitmann et al., 2008; Wiersma and Renssen, 2006), or a sudden reduction in solar irradiance (2.8 ka event; Renssen et al., 2006, 2007; Van Geel et al., 1997). These external forcings are unlikely to have caused the 4.2 ka event. At that time there were no remnant ice sheets left to produce a strong North Atlantic meltwater flux (e.g. Licciardi et al., 1999), and there is no evidence for an important reduction in solar activity around 4.2 ka (Steinhilber et al., 2009). Given the prominence of the climate response in the tropics, a low-latitude origin of the 4.2 ka event is most likely. Indeed, there have been several suggestions involving a shift in the inter-tropical convergence zone and El Nino, and associated sea surface temperature (SST) anomalies (e.g. Marchant and Hooghiemstra, 2004), but the mechanism remains uncertain.
One powerful approach to investigate the mechanism behind the 4.2 ka event is by running climate model experiments. Such experiments require assumptions about the climate forcings involved. The main forcing proposed for the 4.2 ka event involves anomalies in tropical SSTs (Marchant and Hooghiemstra, 2004). Several modeling approaches can be used to evaluate the impact of such SST anomalies on the Holocene climate. One option is to take transient Holocene AOGCM simulations and look for periods that resemble the climate signature for the 4.2 ka event and subsequently analyze the surface ocean conditions to see to what extent SST anomalies play a role. This approach has for instance been followed by Yan and Liu (2019) and Ning et al. (2019). However, the involved transient simulations have not been specifically designed to study the 4.2 ka event and include the combined effects of continuous changes in several forcings (i.e. trace gas concentrations, astronomical parameters), making it difficult to separately analyze the impact of SST anomalies.
In this paper, I therefore take a different modeling approach by evaluating the atmospheric response to a series of SST anomaly scenarios in equilibrium experiments and by comparing the global signal of climate change to the proxy-based humidity signature for the 4.2 ka event. This approach requires a global atmospheric model that can be easily forced with SST anomalies and that is sufficiently computationally efficient to allow exploration of a range of different possibilities. An analysis of the experiment with the best match with the proxy-based humidity signature provides clues on the atmospheric conditions that are associated to the spatial precipitation patterns specific for the 4.2 ka event. The focus of this paper is on the following questions:
- What is the sensitivity of the atmosphere to different tropical SST anomaly patterns?
- What SST forcing scenario represents a best match with the global humidity signature for the 4.2 ka event?
- What are the atmospheric conditions associated with this scenario?
Methods
Applied model
I have performed experiments with an Atmospheric General Circulation model (AGCM) that can be efficiently forced with SST anomalies. For this purpose, I use the EdGCM version of the GISS Model II atmospheric general circulation model developed in the 1980s at the Goddard Institute for Space Studies (Chandler et al., 2005; Hansen et al., 1983). This first-generation AGCM allows for an efficient computation on a desktop computer, allowing for the evaluation of a range of different scenarios. I realize that the GISS model has been developed further (i.e. the state-of-the-art GISS ModelE), with many improvements, enhanced functionality, and higher resolution (Schmidt et al., 2014). However, running such a state-of-the-art model would require advanced computer resources with reduced flexibility, while I argue that the GISS Model II has sufficient complexity to evaluate the first-order response to the type of forcing studied here.
The applied GISS Model II has a relatively low spatial resolution of 8° × 10° latitude-longitude, nine layers in the atmosphere and two hydrological layers in the soil (Hansen et al., 1983). The model includes both the seasonal and diurnal cycles, and its radiation scheme explicitly incorporates cloud particles, aerosols, and the most important trace gases. The model predicts large-scale and convective clouds and generates precipitation when supersaturation occurs. I applied the version in which sea surface temperatures and sea-ice cover must be specified. Eight different vegetation types are prescribed on a fractional basis, implying that more than one vegetation type can be assigned to a grid cell. The different vegetation types are desert, tundra, grassland, mixed shrub/grass, mixed tree/grass, deciduous forest, evergreen forest, and rain forest (Matthews, 1984). These vegetation types determine the surface albedo and the soil water holding capacity. A balance between snowfall, melting and sublimation determines the snow depth, while the albedo of snow depends on both depth and age.
The GISS Model II has been widely used in paleoclimate studies, for instance to study the climate of the Last Glacial Maximum (Rind, 1987) and the Younger Dryas (Rind et al., 1986), and to perform middle Holocene simulations within the first phase of the Paleoclimate Modelling Intercomparison Project (PMIP, Joussaume et al., 1999).
Experimental setup
The experiments performed in this study are summarized in Table 1. All experiments were run for 35 years. To account for model spin-up, only the last 30 years were used in the analysis.
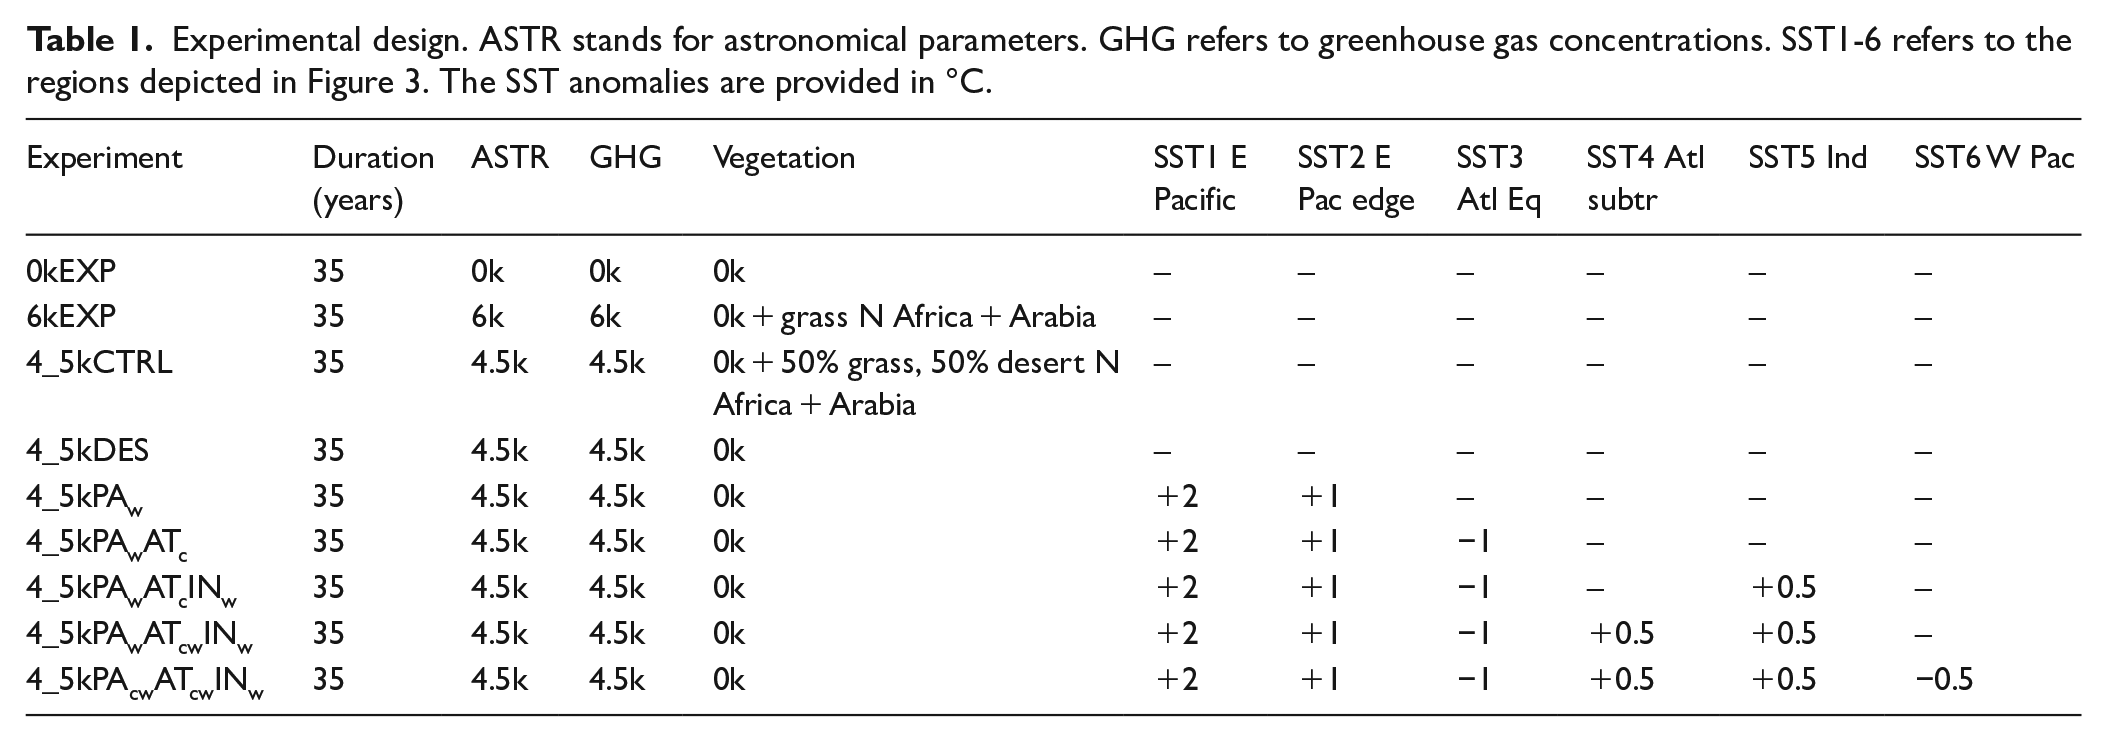
Experimental design. ASTR stands for astronomical parameters. GHG refers to greenhouse gas concentrations. SST1-6 refers to the regions depicted in Figure 3. The SST anomalies are provided in °C.
Experiment for 6 ka
To evaluate the model’s response to Holocene forcings, I first performed a simulation for 6 ka (hereafter 6kEXP), as this is a time-slice for which the response has been documented well. Compared to an experiment with present-day forcings (0kEXP), I prescribed appropriate astronomical parameters and greenhouse gas concentrations for 6 ka based on PMIP recommendations. In addition, in Northern Africa and the Arabian Peninsula I transformed the surface vegetation from “desert” to “grassland” (i.e. 100% grass cover) to account for the greening associated with the so-called African Humid Period (AHP, DeMenocal et al., 2000; Hoelzmann et al., 1998; Shanahan et al., 2015). In both experiments, I prescribed the modern observed monthly SSTs from NASA-GISS as provided by Chandler et al. (2005).
Basic experiments for 4.5 ka
As a next step, I ran the model with astronomical parameters and greenhouse gas concentrations for 4.5 ka, and with and without 50% grassland in the Sahara and the Arabian Peninsula. A recent study summarizing the evidence for the AHP (Shanahan et al., 2015) suggests that generally the timing of its termination varied per latitude, from around 6 ka in Northern Africa north of 20°N, to 5 and 4 ka further south. However, this timing depends on how “termination” is defined, as Shanahan et al. (2015) show that a substantial part of the records still indicates wet or moderately wet conditions around 4 ka, that is, 25% of the records north of 20°N, and 40% between 10°N and 20°N, compared to 0% at 0 ka. This suggests that the climate conditions around 4.5 ka were still substantially more humid than today, raising the question what the vegetation was like and if there were still important areas covered by grass or other vegetation. Here I explore the possibility that a substantial part of Northern Africa and Arabia still had grass cover at 4.5 ka and that this vegetation was close to collapse due to reduced humidity. I therefore take the 4.5 ka experiment with 50% grass cover and 50% desert in Northern Africa and Arabia as my control experiment (4_5kCTRL) with which I compare the 4.5 ka basic experiment with present-day vegetation (i.e. desert) in this region (hereafter 4_5kDES). The difference between the simulations with and without 50% grassland indicates what the impact of the final stages of the desertification could have been. Both basic experiments were run with modern SSTs as in 0kEXP and 6kEXP, astronomical parameters for 4.5 ka Berger, 1978) and appropriate trace gas concentrations (CO2, CH4, and N2O; Joos and Spahni, 2008; Loulergue et al., 2008; Schilt et al., 2010).
Experiments with SST anomalies
Several studies have suggested that the 4.2 ka event was related to intensification of El Nino-type conditions (Booth et al., 2005; Li et al., 2018; Marchant and Hooghiemstra, 2004; Toth and Aronson, 2019; Walker et al., 2012). El Nino-conditions are associated with specific anomalies in the surface temperatures of the world oceans, prominently in the Pacific Ocean, but also in the Atlantic and Indian Oceans (Figure 2). Although El Nino-conditions are relatively short lived, at least relatively to the 4.2 ka event, and have an important seasonal component, an intensification of El Nino-activity at the end of the middle Holocene could have represented an important atmospheric forcing. If one constructs a composite map of significant SST anomalies during strong El Nino phases, a positive SST anomaly stands out in the tropical Pacific Ocean, in the form of a warm tongue stretching from the South American coast westward to 170°E (Davey et al., 2014; Deser et al., 2010; Sohn et al., 2016). In the core of this warm anomaly, SSTs are more than 1.5°C above long-term temperatures. This is accompanied by a warm anomaly in the tropical Indian Ocean, and a cold anomaly in the western tropical Pacific, both of smaller magnitude (Sohn et al., 2016). In the tropical Atlantic Ocean, a cold anomaly is present around the equator, but to the north and south the SSTs are warmer than average (Deser et al., 2010). Based on present-day ENSO variability, it is highly unlikely that such El Nino conditions in the oceans persisted for a prolonged period of several years or even decades. Still, in search of the cause of the 4.2 k event, it is worthwhile to explore the sensitivity of the atmosphere to El Nino-type SST anomalies on a decadal timescale. Therefore, to evaluate the first-order impact of such SST anomalies on the climate around 4.5 ka, I performed a range of experiments with standardized SST anomalies applied as boundary conditions for six different areas of the low-latitude global oceans (Figure 3, Table 1). The rest of the set-up was identical to the 4_5kDES experiment described in the previous section. A comparison of these experiments to 4_5kCTRL thus provides the response of both vegetation change and the concerned SST anomaly. These simulations must be considered as sensitivity experiments rather than attempts to simulate a realistic climate.
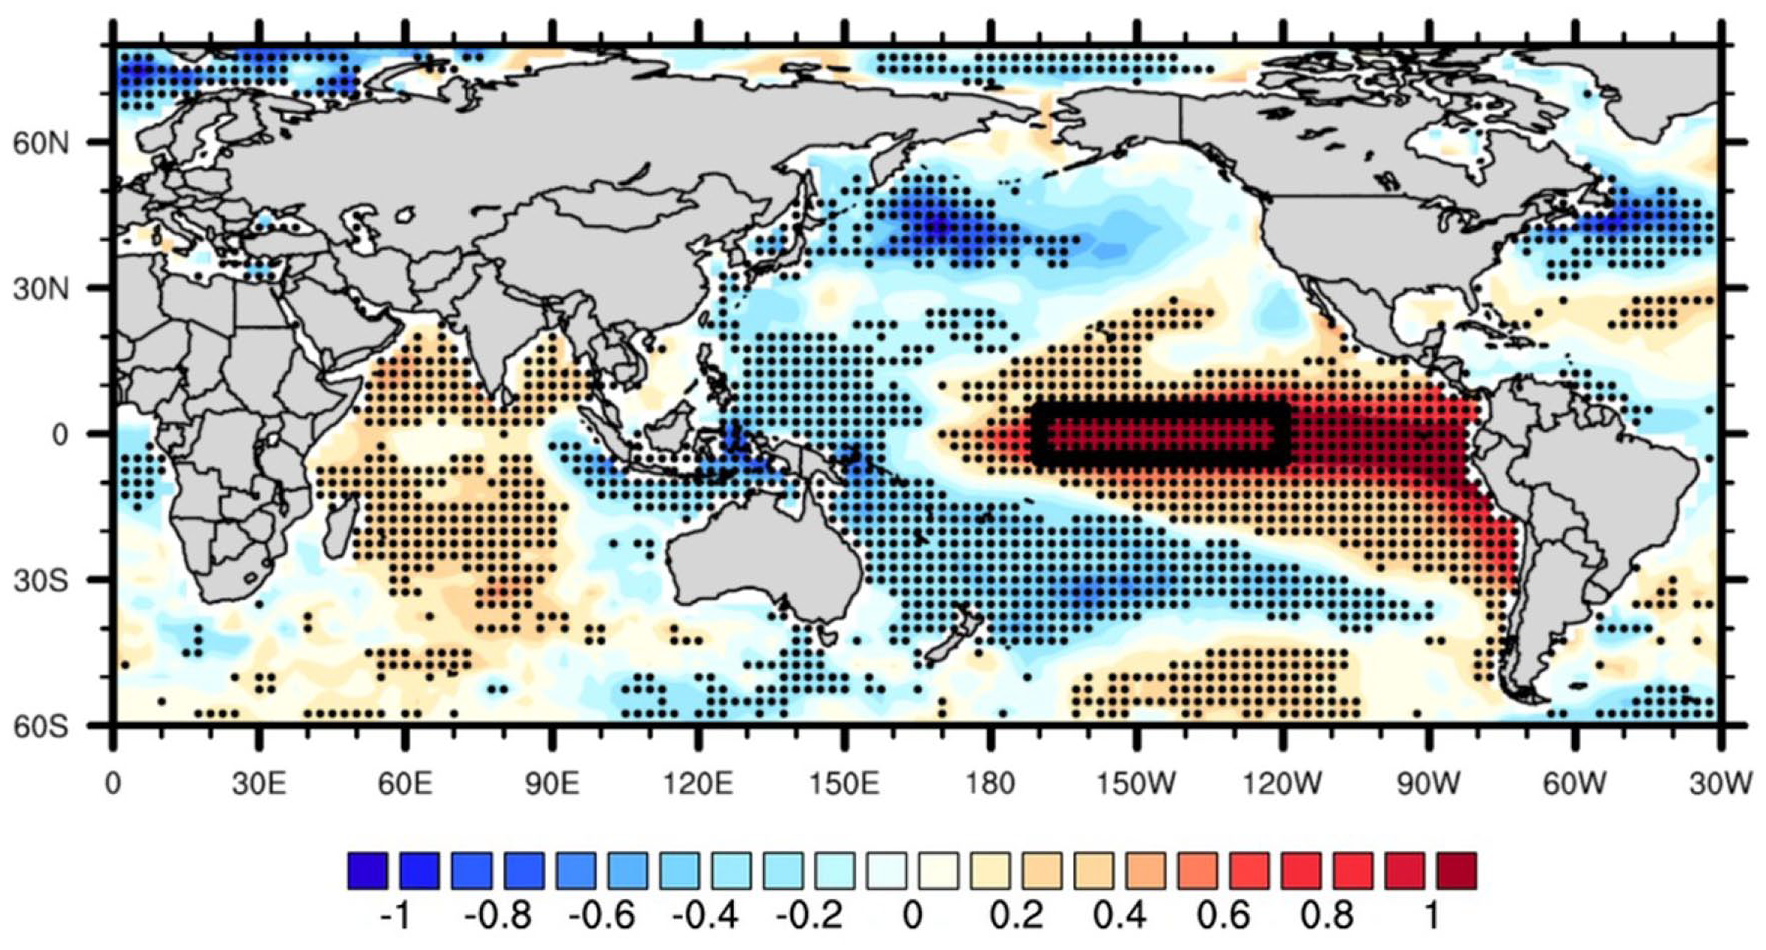
Composite map of anomalous SSTs during strong ENSO events for the boreal warm season. An ENSO event is classified as “strong” if the standard deviation of the Niño3.4 index exceeds 1.3. The black box indicates the Niño3.4 region. Black dots indicate grid points where the SST anomalies are statistically significant at the 95% level. Reproduced with permission from Sohn et al. (2016).
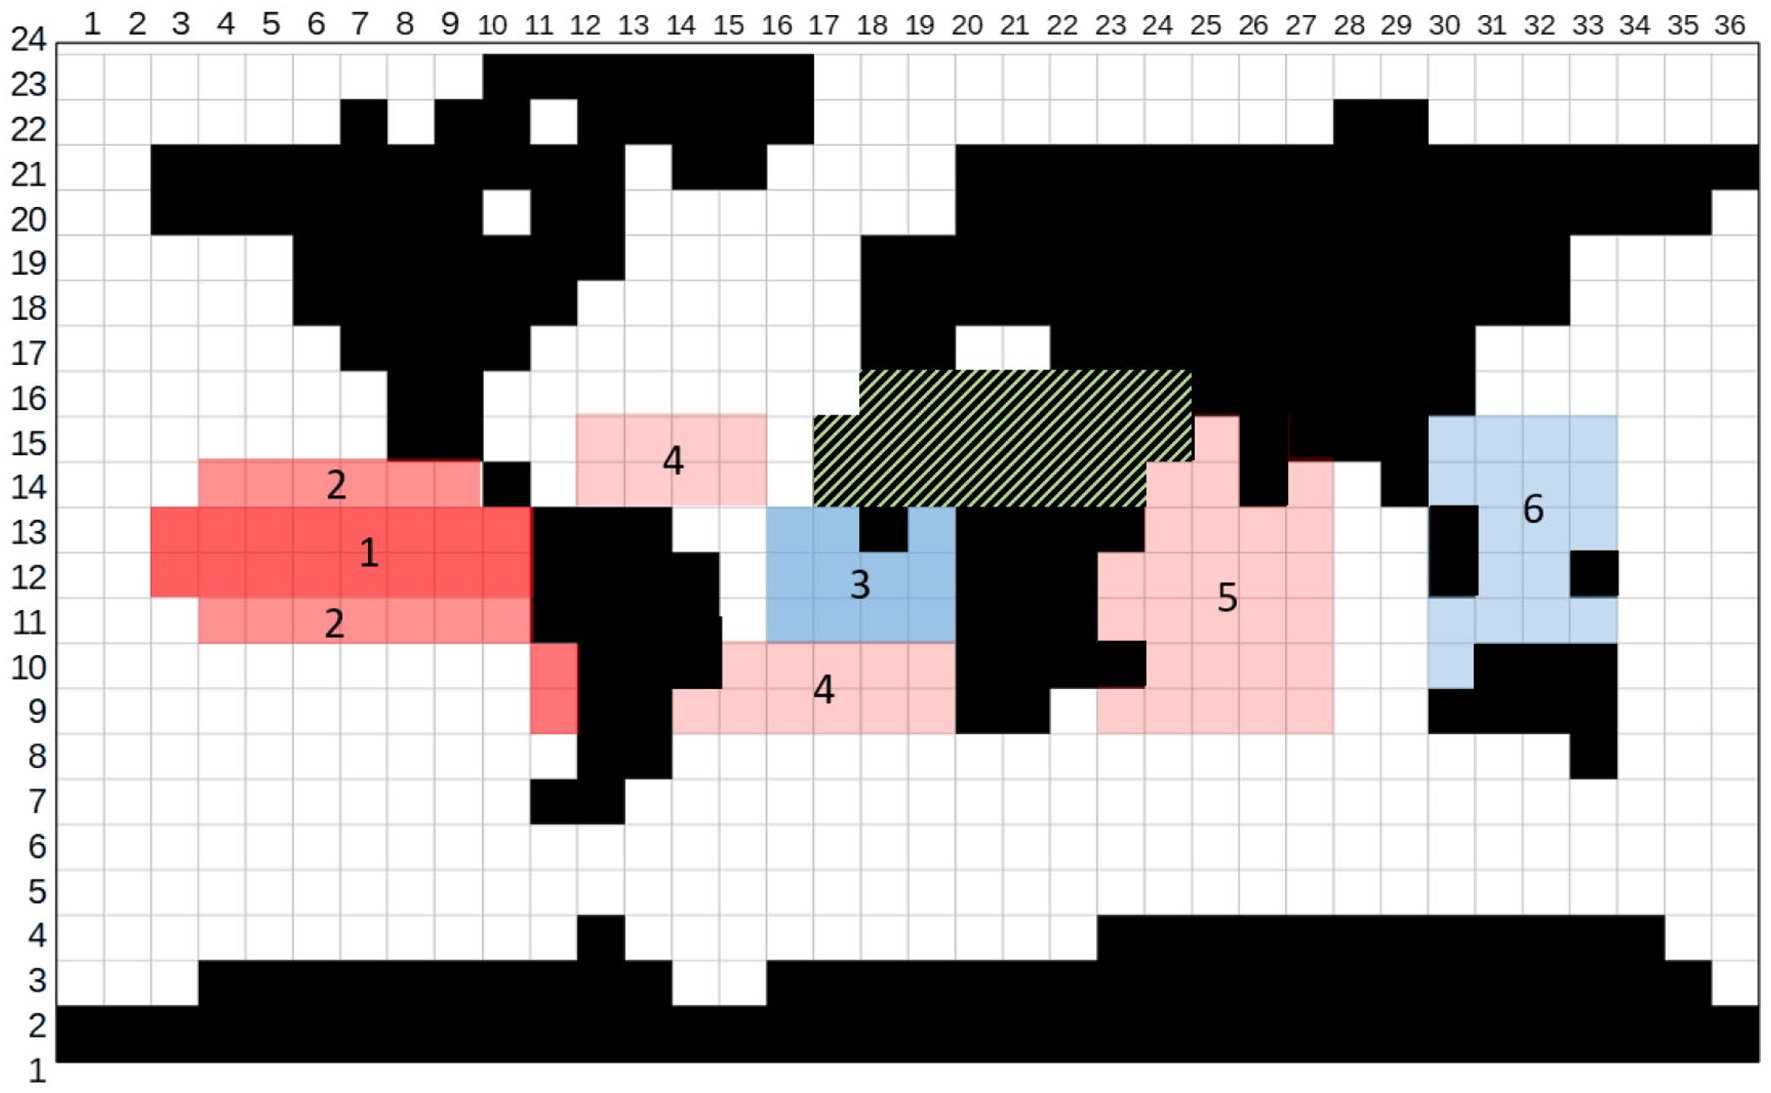
The land-sea distribution of the applied GISS II model, shown on the model’s grid. The numbered regions are the sectors where SST anomalies are applied. The vegetation changes (grass in 6kEXP and 4_5kCTRL) are prescribed in the hatched area.
Analysis of results using the proxy-based signature
In the analysis, my focus is on precipitation, as the main signature of the 4.2 ka event in proxy records is either anomalous dryness or wetness (Figure 1). As mentioned, the results of each experiment are compared to a control experiment (4_5kCTRL) with appropriate greenhouse gas and astronomical forcings for 4.5 ka and 50% grassland in North Africa and Arabia. The results are evaluated against this control experiment using a 2-sided student t-test at a 90% significance level. To evaluate the model results, I focus on regions for which a clear proxy-based signal is available (Figure 4). The proxy data used for this evaluation (Figure 1, Supplemental Table S1, available online) were derived from three overview studies on the 4.2 ka event, published by Marchant and Hooghiemstra (2004), Wang et al. (2016), and Railsback et al. (2018), respectively. To make the analysis straightforward, I follow the interpretations from these authors and only consider contrasting “wet” and “dry” anomalies. Since these proxy-based anomalies represent annual conditions, the focus in the analysis is on the annual mean model results.
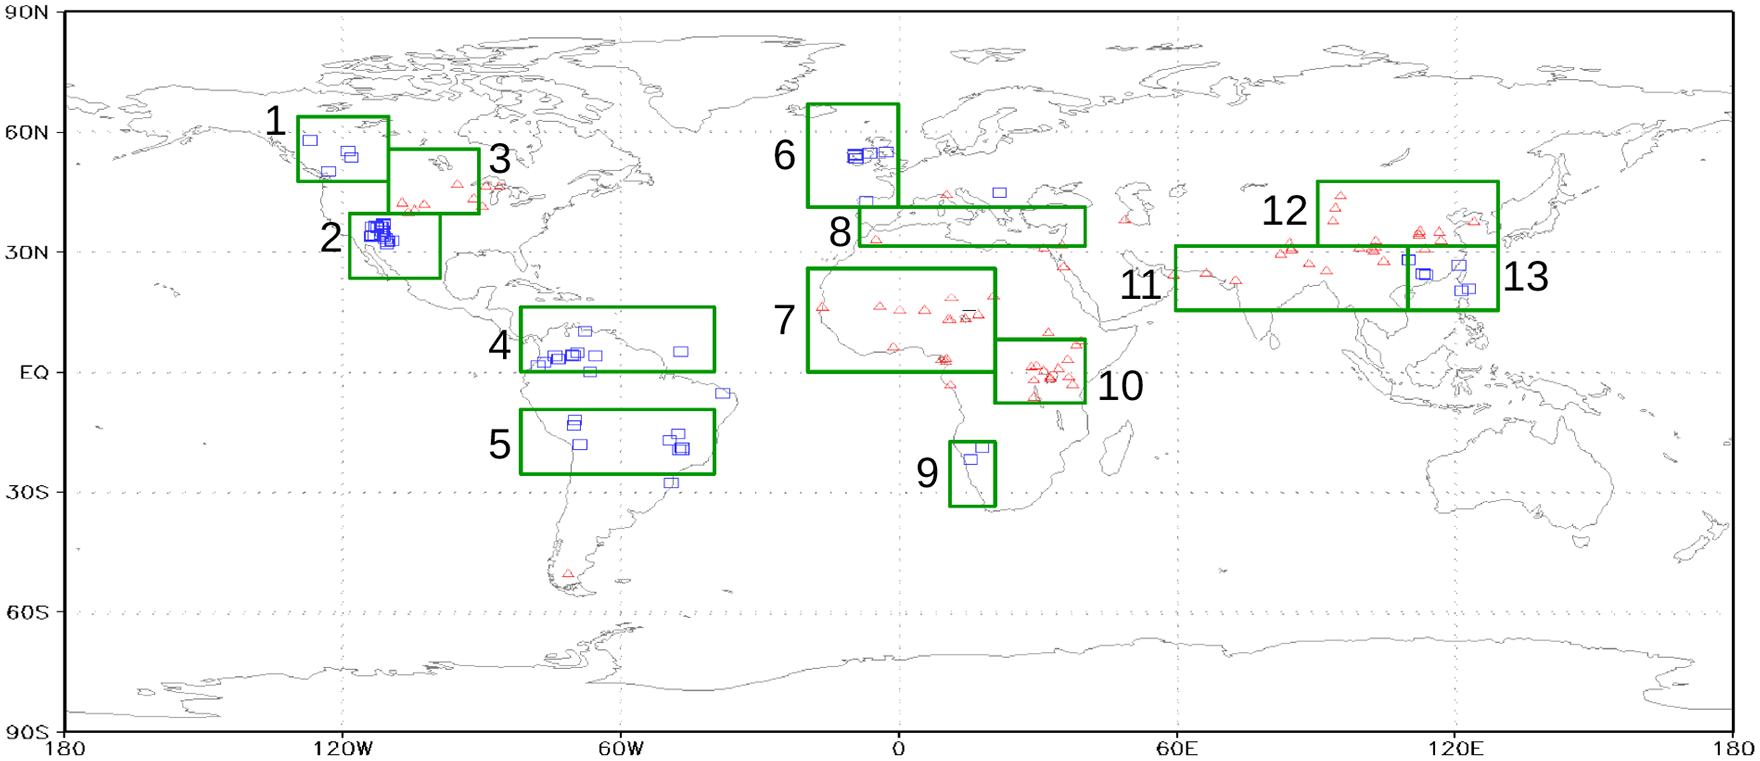
The green rectangles show the regions for which the model results are analyzed in more detail (see Table 2). 1: Northwest North America, 2: Southwest North America, 3: Central North America, 4: Northern South America, 5: Central South America, 6: Western Europe, 7: West Africa, 8: Mediterranean, 9: Southwest Africa, 10: East Africa, 11: South Asia, 12: Northern East Asia, 13: Southern East Asia.
Results
Simulation 6 ka
Experiment 6kEXP produced a similar response to other simulations with forcings for 6 ka performed with PMIP1 models (Joussaume et al., 1999). Compared to a 0 ka control experiment, the June-July-August temperature was 0.5°C–2°C higher over most continental areas, and over the Arctic Ocean (not shown). This response is consistent with the higher astronomically-forced summer insolation in the Northern Hemisphere. Precipitation increased markedly in areas affected by summer monsoons, such as South Asia, West Africa, and western South America, while precipitation was reduced in parts of Southeast Asia and the Caribbean region.
Proxy-based signature of the 4.2 ka event
Paleoclimatic proxies indicate a clear dry anomaly in Northern and equatorial Africa, the near East, central North America, and most of South and East Asia (Figures 1 and 4). In contrast, anomalously wet conditions are reported for most of South America, western North America, Southwest Africa, western Europe, and land areas north of the South China Sea.
Simulated precipitation anomalies
Impact of desertification (4_5kDES)
Desertification in Africa and Arabia produces wet or dry conditions that agree with the proxy-based signal in 11 out of the 13 areas considered (Figure 5a, Table 2). Wetter conditions are simulated in parts of South and Central America and Southeast Asia, while reduced precipitation is especially clear in Northeast Africa and Arabia (Figure 5a). However, on a regional basis (Table 2), only the simulated 3% increase in precipitation in southern East Asia is statistically significant.
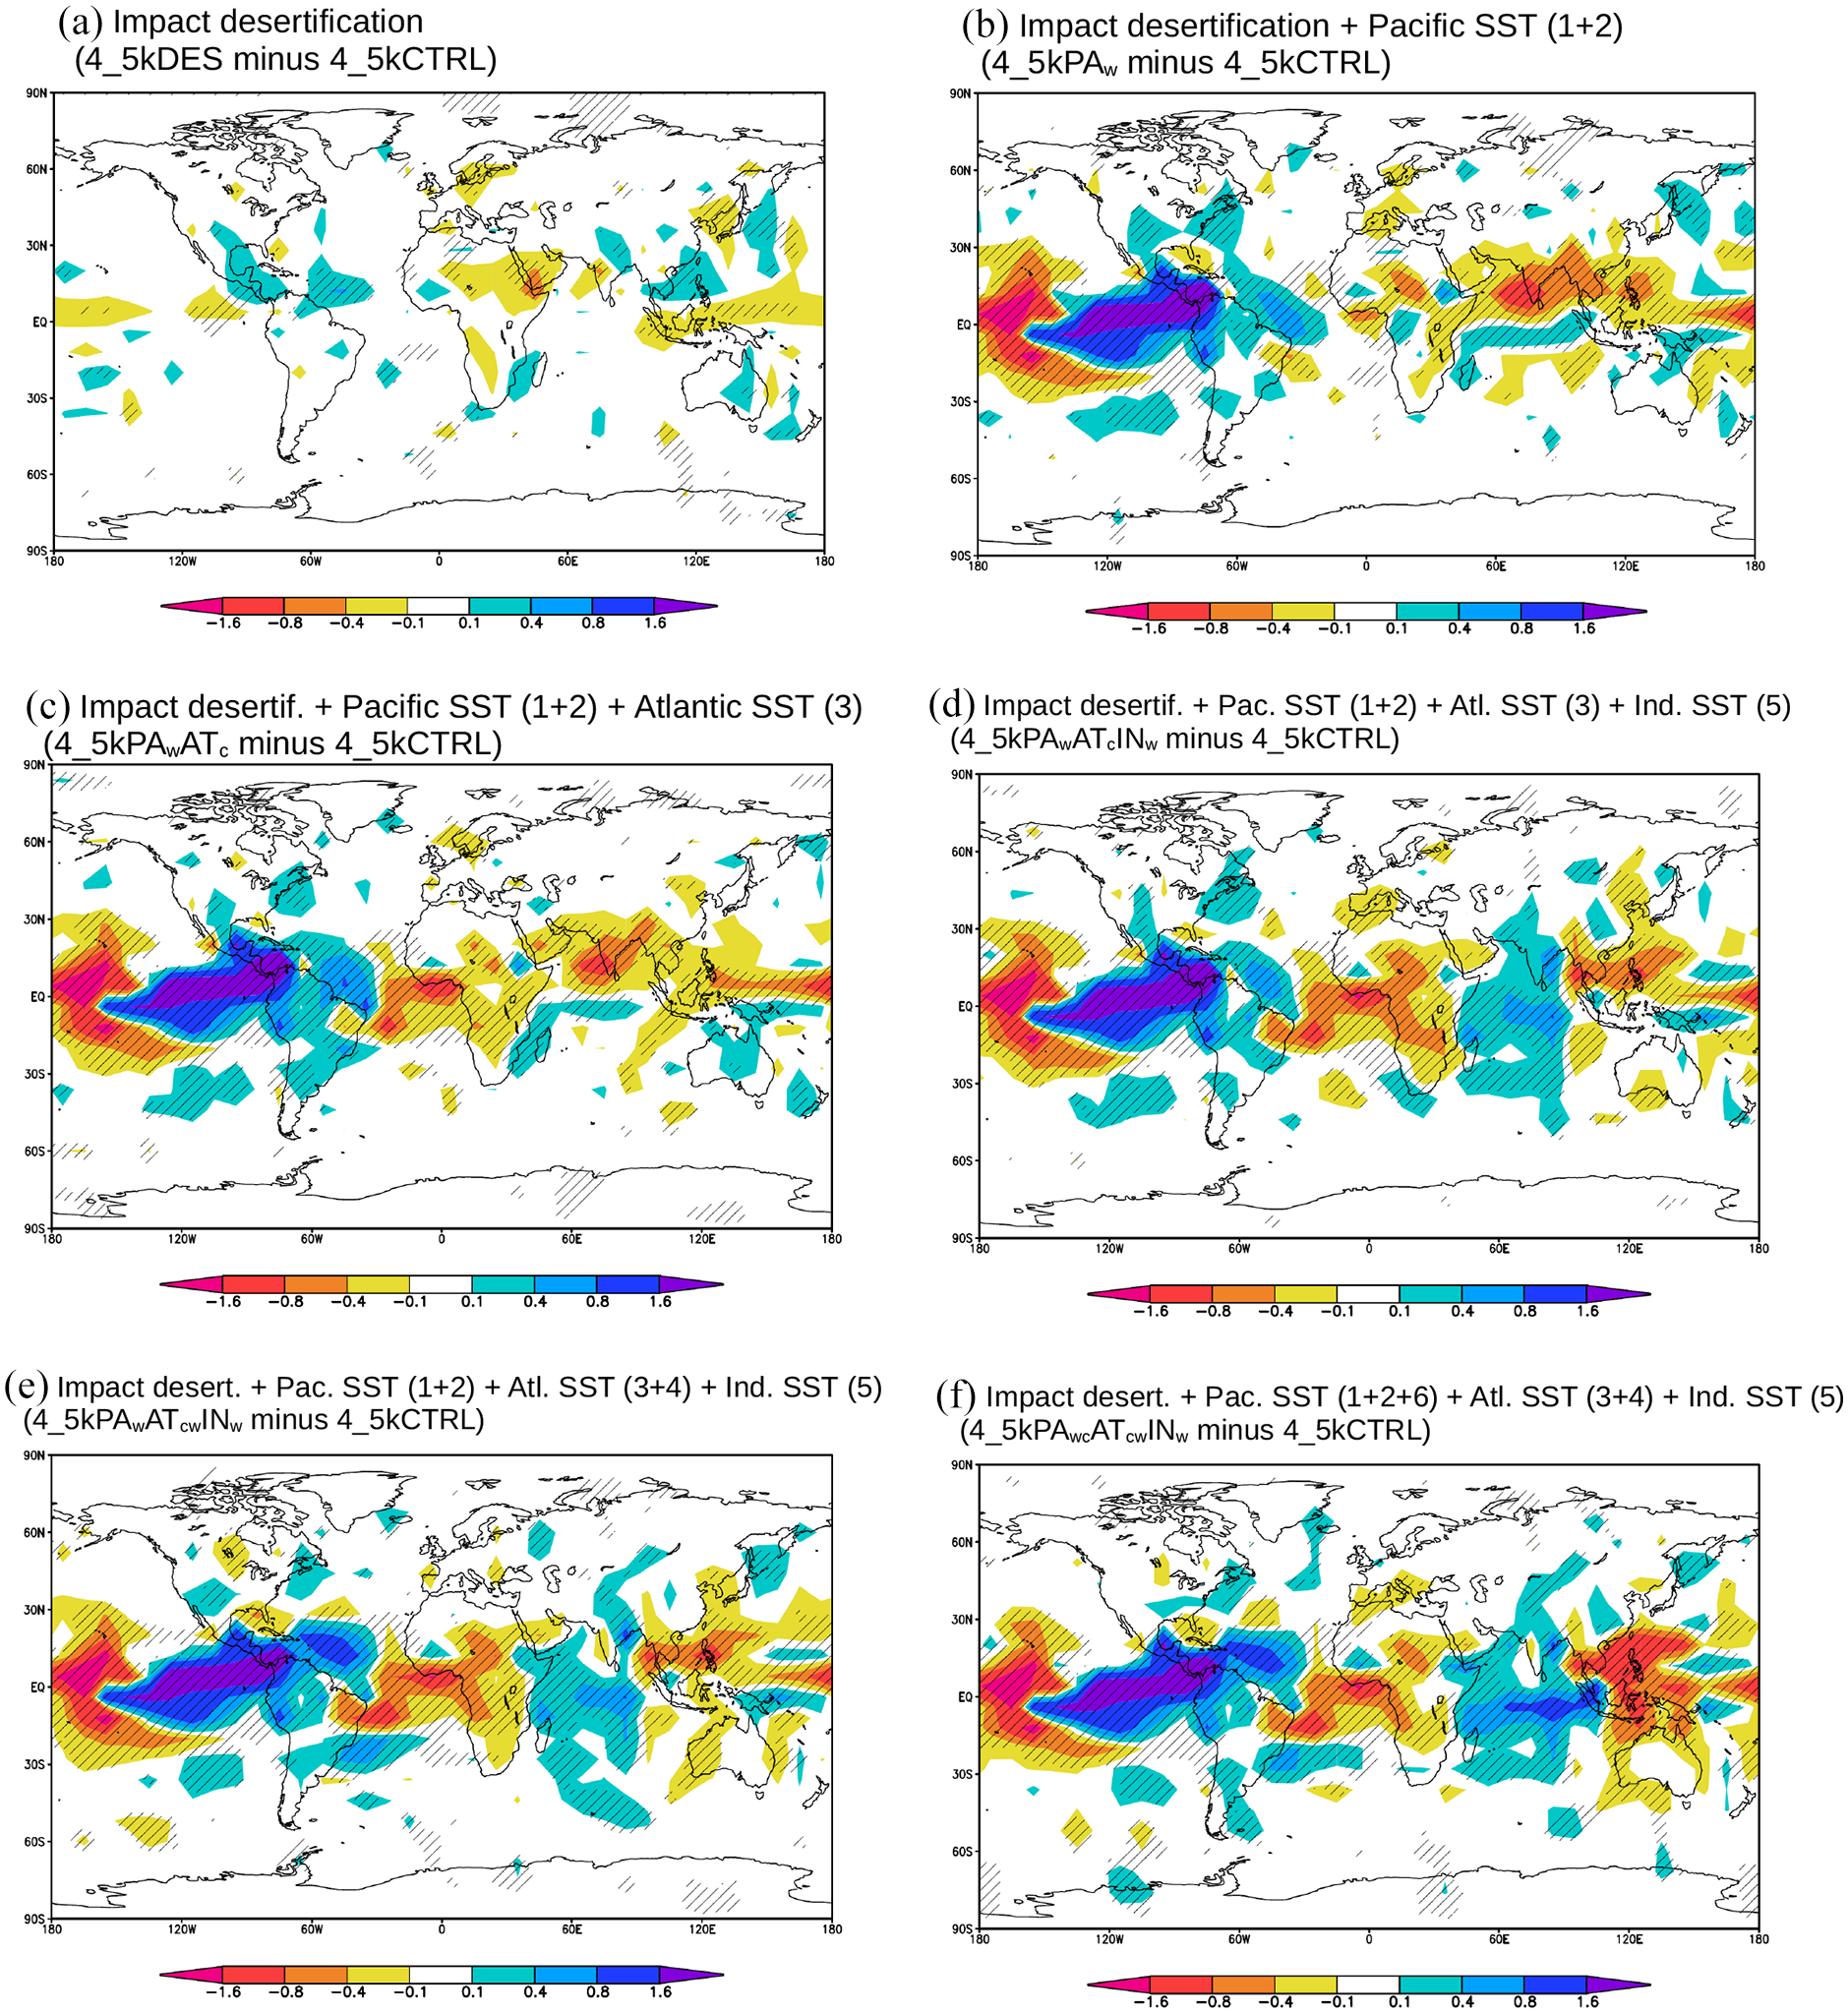
(a–f) Simulated response in annual mean precipitation (in mm/d), shown as anomalies from the control experiment (4_5kCTRL), so including the impact of desertification. (a) Impact of desertification (4_5kDES), (b) as (a) plus warm SST anomaly in the tropical East Pacific Ocean (areas 1 and 2, experiment 4_5kPATw), (c) as (b) plus cold SST anomaly in the tropical Atlantic Ocean (areas 1, 2, and 3, experiment 4_5kPAwATc), (d) as (c) plus warm SST anomaly in the Indian Ocean (areas 1, 2, 3, and 5, experiment 4_5kPAwATcINw), (e) as (d) plus cold SST anomalies in the northern and southern subtropical Atlantic Ocean (areas 1–5, experiment 4_5kPAwATcwINw), (f) as (e) plus cold SST anomaly in the tropical West Pacific Ocean (areas 1–6, 4_5kPAcwATcwINw).
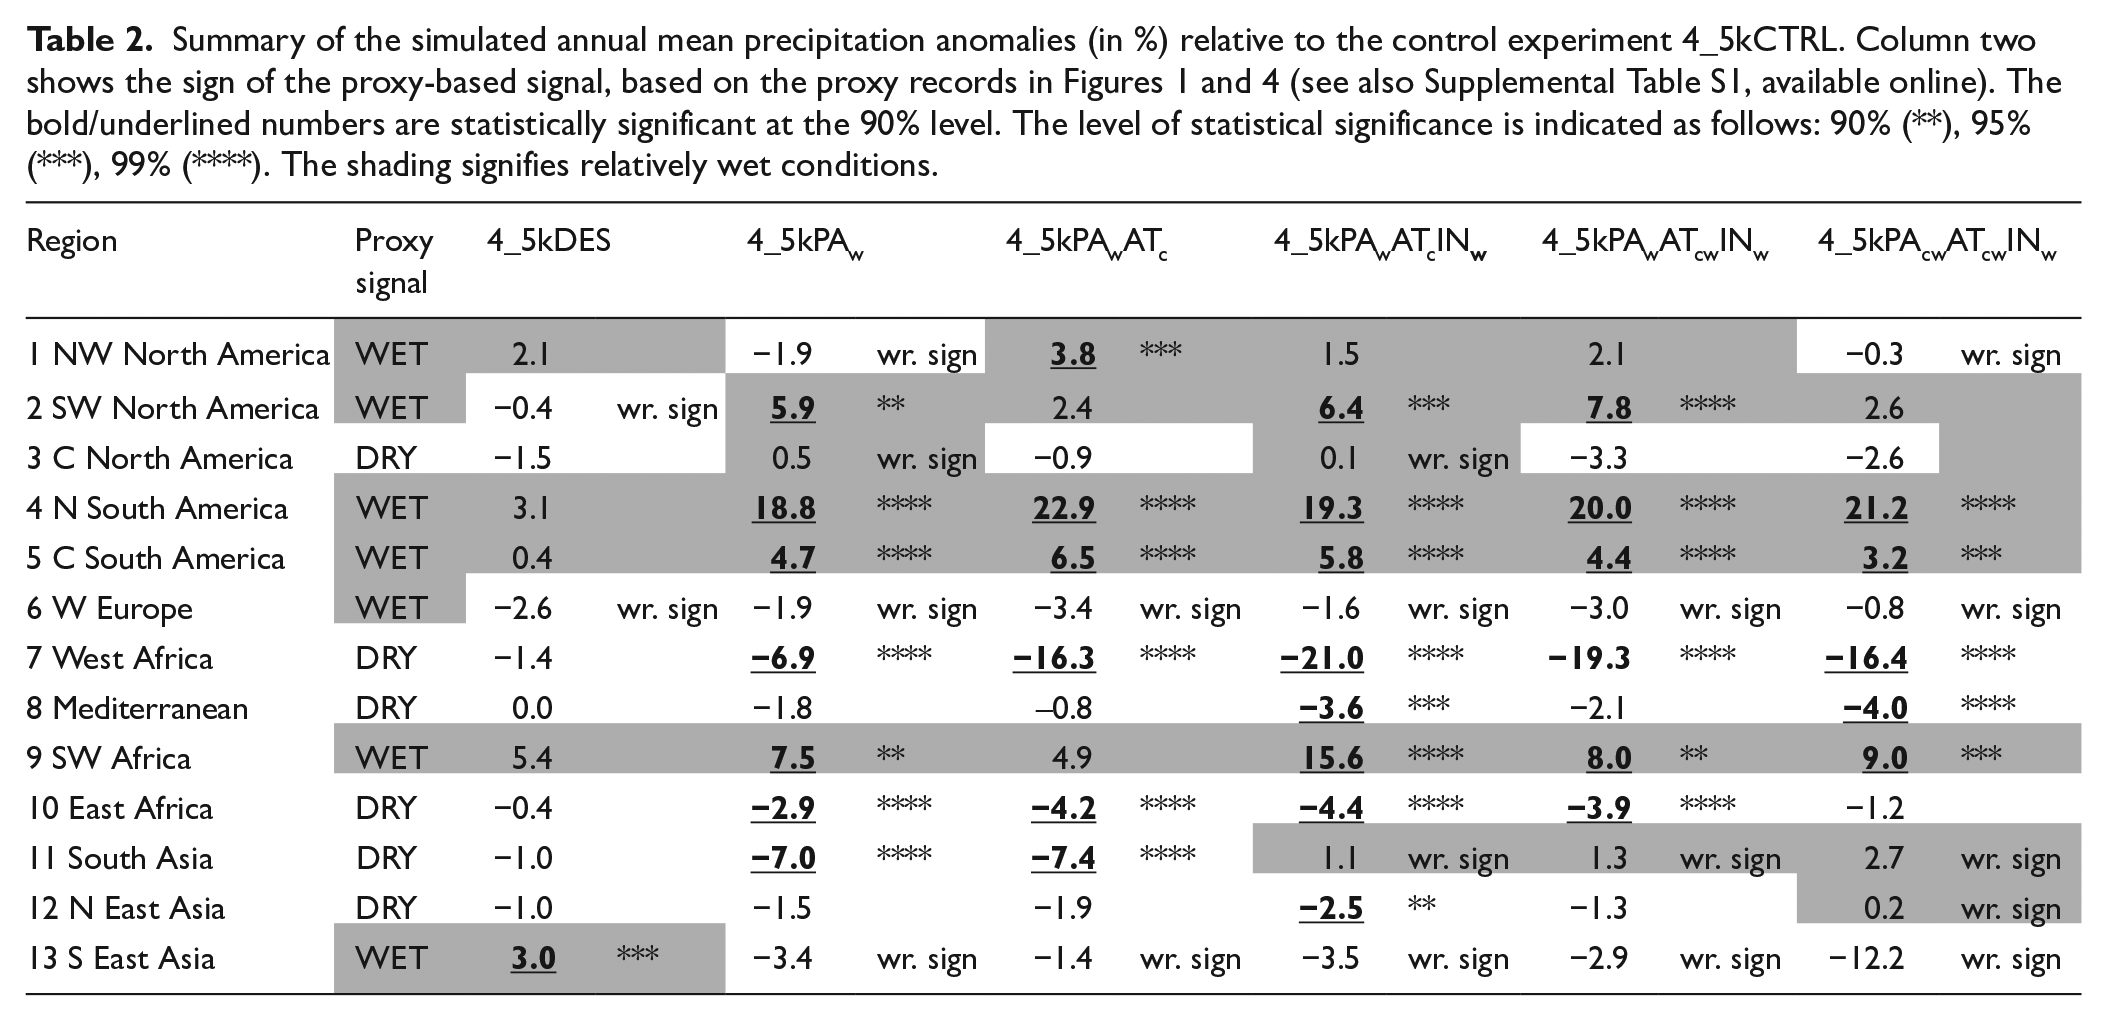
Summary of the simulated annual mean precipitation anomalies (in %) relative to the control experiment 4_5kCTRL. Column two shows the sign of the proxy-based signal, based on the proxy records in Figures 1 and 4 (see also Supplemental Table S1, available online). The bold/underlined numbers are statistically significant at the 90% level. The level of statistical significance is indicated as follows: 90% (**), 95% (***), 99% (****). The shading signifies relatively wet conditions.
Added impact equatorial Pacific warm SSTs (4_5kPAw)
When the effect of warm SSTs in the equatorial Pacific (areas 1 and 2) is added to the impact of desertification (Figure 5b, Table 2), the magnitude of the discussed precipitation response is clearly amplified, resulting in statistically significant positive anomalies over southwest North America (+6%), northern South America (+19%), Central South America (+5%), and SW Africa (+8%). Likewise, significant reductions in precipitation were simulated in West Africa (−7%), East Africa (−3%), and South Asia (−7%). All these changes agree with the humidity pattern suggested by proxies. On the other hand, over southern East Asia the precipitation is now decreasing, in contrast to the proxy-based signal. It is also noted that anomalies of the wrong sign are simulated for four regions (NW North America, Central North America, Western Europe, and southern East Asia).
Adding cold SSTs in the tropical Atlantic (4_5kPAwATc)
The clearest additional response when relatively cold tropical Atlantic SSTs (area 3) are included is a marked reduction in precipitation over W Africa (−16%, Figure 5c, Table 2). In addition, the response intensifies in northern South America (+23%) and Central South America (+7%), and in East Africa (−4%). Moreover, in NW North America, a significant increase is now simulated (+4%) in agreement with the proxies from this region. However, the changes in southwest North America and SW Africa are no longer statistically significant.
Adding warm SSTs in the Indian Ocean (4_5kPAwATcINw)
Adding warm SSTs in the Indian Ocean (area 5) leads to marked changes in South Asia (Figure 5d, Table 2), where a small precipitation increase of 1% is now simulated in conflict with the proxy-based signal (+1% vs −7% in 4_5kPAwATc). The response in South America and Africa is similar to Figure 5c, with the exception of SW Africa where a significant increase of 16% is simulated in agreement with the proxies here. In the Mediterranean region also a significant 4% decrease in precipitation is noted.
Adding warm SSTs in the subtropical Atlantic (4_5kPAwATcwINw)
Adding a warm anomaly at the Atlantic surface north and south of the equatorial region (area 4) does not result in important changes in the precipitation (Figure 5e, Table 2). For the Americas and Africa there is still quite a good match with the proxy-based signal. However, the results in Asia are no longer statistically significant above the 90% level, so here the model-data correspondence becomes much weaker.
Adding cold SSTs in the western tropical Pacific (4_5kPAcwATcwINw)
The main impact of including this cold anomaly in the western tropical Pacific (area 6) is a marked 12% reduction in precipitation in southern East Asia (Figure 5f, Table 2), which is opposite to the signal suggested by proxies. For the rest, the match with proxies does also not improve.
Discussion
What model experiment provides the best match to the proxy-based result?
If we take the proxy-based response (wetness or dryness) in the study regions as a measure (Figure 4), a favorable similarity is found for experiment 4_5kPAwATc, with desertification plus SST anomalies in the tropical E Pacific (areas 1 + 2), and the equatorial Atlantic (area 3), shown in Figure 5c. This experiment has the right sign in precipitation in no less than 11 out of 13 study regions, although only the results in six of these regions are statistically significant at the 90% level (Table 2). However, it is noted that these six regions include the core area where the 4.2 k event is most clearly recorded (South America, Africa and S Asia, cf. Figure 1). In two regions this experiment suggests the opposite sign relative to the proxies, that is, southern East Asia and western Europe. For the latter region, all experiments suggest drier conditions that contrast with the proxy-based evidence for a wet anomaly. However, the latter proxy-based signal is not as evident as in the tropics (e.g. Bradley and Bakke, 2019). In southern East Asia, only experiment 4_5kDES with just desertification (Figure 5a) simulates a significant increase in humidity in accordance with the proxies for this region.
The experiment 4_5kPAwATcINw is similar to 4_5kPAwATc, but includes the effect of a warm SST anomaly in the Indian Ocean (Figure 5d). It produces statistically significant results in eight regions, but at the same time simulates the wrong humidity sign in four regions (Table 2). Importantly, the prominent drought signal in South Asia is absent in this experiment, as a small increase (+1%) in precipitation is simulated compared to −3% in the experiment 4_5kPAwATc in Figure 5c. So, for this important region, the match with proxy data is much better when the Indian Ocean is not anomalously warm. Because of the prominence of the drought signal in proxy records in South Asia (Dixit et al., 2014; Staubwasser et al., 2003), 4_5kPAwATc is arguably the experiment with the best match with proxy data.
On a global scale, the main signal of the 4.2 ka event can be summarized as follows: much wetter in the Americas, much drier in Africa, the Middle East, and most of South Asia. The experiment with only desertification already produces part of this main response, but not as widespread and pronounced as suggested by the global proxy signature. If the response to the main SST anomalies is analyzed against the 4.5 ka experiment without grassland in Northern Africa and Arabia – so only considering SSTs without the effect of desertification – the model also only partly reproduces the proxy-based signal (Figure 6ab). If we look at two experiments with the best match to proxy data (4_5kPAwATc and 4_5kPAwATcINw), we see that in both cases an increase in precipitation is simulated in the Horn of Africa, instead of a decrease. If we take a warming of the Indian Ocean into account (4_5kPAwATcINw), this increase is extended to South Asia (Figure 6b). Excluding the Indian Ocean SST anomaly (4_5kPAwATc), reduces the precipitation in South Asia (Figure 6a), but the reduction is much less expressed than with desertification being included, where we see an extension of the drier conditions toward the west, reaching the Arabian Peninsula (Figure 5c). So, importantly, the characteristic drought in South Asia and the Horn of Africa is not so well captured by the model when just forced with SST anomalies. In addition, the wet-dry west-east pattern suggest by proxies in North America is only present in experiments that include the desertification in Northern Africa and Arabia. All in all, it may thus be concluded that tropical SST anomalies alone are insufficient to have forced the 4.2 ka event.
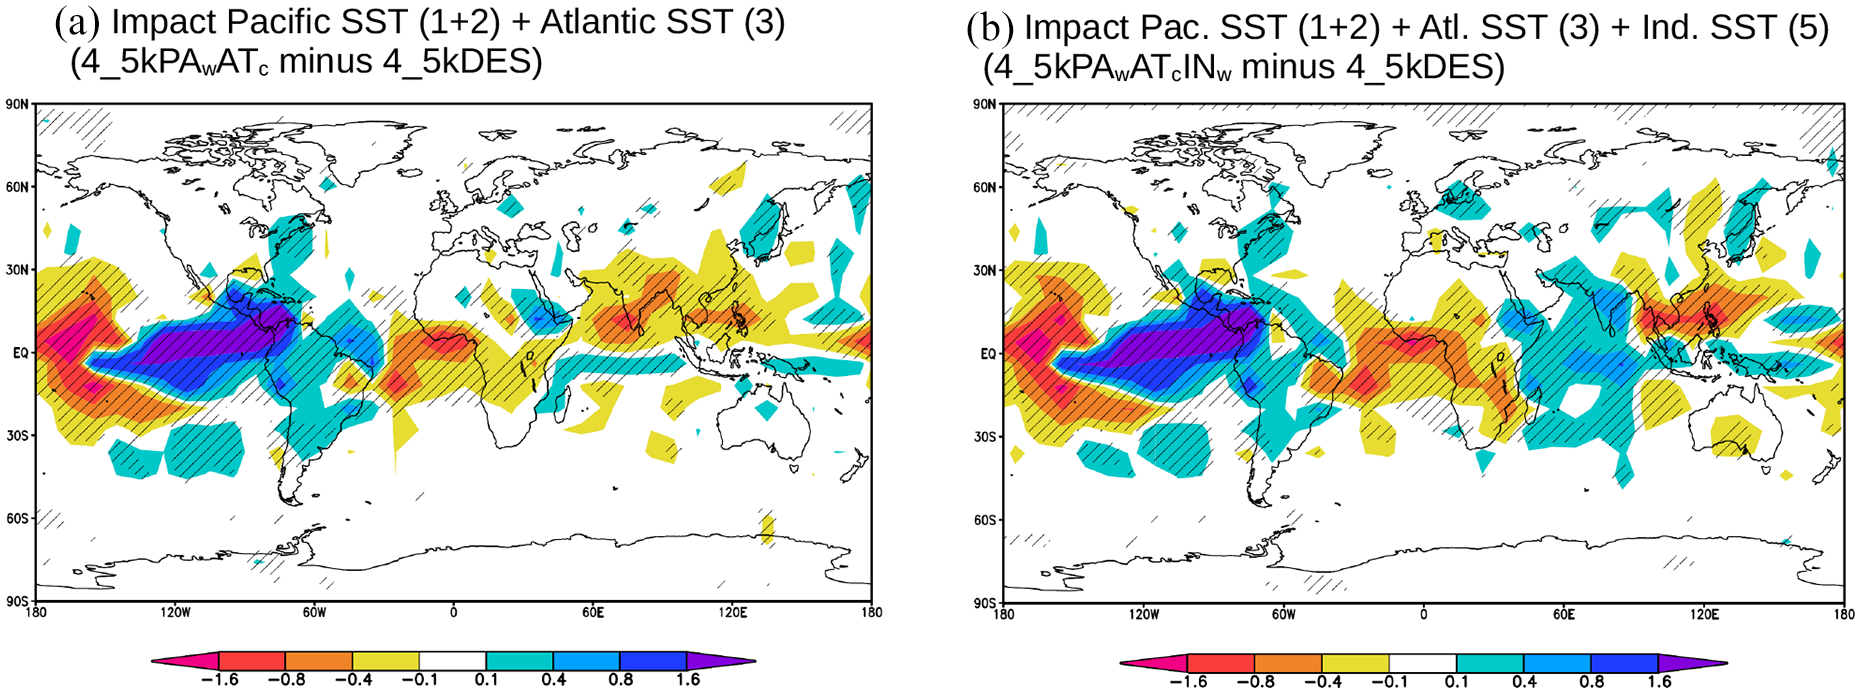
(a and b) Simulated response in annual mean precipitation (in mm/d), shown as anomalies from 4_5kDES, so excluding the impact of desertification. (a) warm SST anomalies in the tropical East Pacific Ocean plus cold SST anomaly in the tropical Atlantic Ocean (areas 1, 2, and 3, experiment 4_5kPAwATc) and (b) as (a) plus warm SST anomaly in the Indian Ocean (areas 1, 2, 3, and 5, experiment 4_5kPAwATcINw).
Based on the model results, it is more likely that the global humidity patterns shown in Figure 1 were forced by a combination of anomalous SSTs and desertification. It is clear that the desertification associated with the end of the AHP was a time-transgressive feature, lasting from about 5.5 to 3.5 ka (Shanahan et al., 2015). A speculative scenario is that tropical SST anomalies, produced by internal climate system variability, promoted drying in Northern Africa, which added to the long-term drying trend associated to the astronomically-forced weakening of the summer monsoon and resulted in the collapse of the last AHP vegetation that was still present in places where there is desert today. Based on the model results presented here, such a scenario could explain most of the global signature and the abruptness of the 4.2 ka event.
Enhanced ENSO variability could have been an important source of variations in tropical SSTs during the middle-to-late-Holocene. However, proxy-based records of El Nino activity in the Holocene do not show a coherent picture (e.g. Toth and Aronson, 2019). There is consensus that the middle Holocene was a period of low El Nino variability, with some records showing clearly reduced variability between 5 and 3 ka (e.g. Dang et al., 2020; Toth and Aronson, 2019; Zhang et al., 2014). On the other hand, there are also records that indicate a marked increase in the variability and frequency of El Nino events near the end of the middle Holocene between 5 and 4 ka, suggesting this was the start of the modern ENSO regime present in the Late-Holocene (Koutavas et al., 2006; Li et al., 2018; Rein et al., 2005; Toth and Aronson, 2019; Toth et al., 2012). For instance, the study by Koutavas et al. (2006) suggests that the frequency of El Nino events increased between 5 and 4 ka from below 10 to more than 20 events per 100 year. It is however unclear to what extent such an increase in El Nino activity would produce long-lasting SST anomalies of the type applied in this model study. This should be further explored in coupled atmosphere-ocean modeling studies.
The proposed scenario contrasts with findings of other climate model studies. Ning et al. (2019) and Yan and Liu (2019) conclude on the basis of an analysis of transient simulations (He, 2011) that the event was caused by a weakening of the Atlantic Overturning Circulation. However, this would produce a markedly different climate anomaly, dominated by cooling in the North Atlantic region. Such an explanation seems inconsistent with evidence from that region (Bradley and Bakke, 2019) and with the global humidity anomaly pattern presented in Figure 1.
What are the atmospheric conditions associated with the best-matching scenario (4_5kPAwATc)?
When analyzing the atmospheric conditions, a distinction should be made between the responses to the desertification in Northern Africa and Arabia on the one hand, and to the SST anomalies on the other hand. Concerning the desertification applied in our experiments, from 50% grassland cover to 100% desert, the most important effect is the strong increase in surface albedo up to 6% (Figure 7a), leading to a reduction in net radiation. This implies that less energy is available to heat the surface, resulting in a small radiative cooling over part of North Africa (Figure 7b) and a decrease in the sensible heat flux (Figure 7c). As result the stability of the atmosphere increases here, with higher atmospheric surface pressure, leading to drier air, less convective precipitation (Figure 5a), and a reduction in soil moisture. In Western Africa, the noted radiative cooling reduces the land-sea contrast, leading to a weakening of the monsoonal circulation and reduced west-to-east moisture transport (compare Figure 8a and b). This is consistent with reduced cloudiness (Figure 7e) and contributes to the reduction in precipitation along 5°N–10°N (Figure 5a). The reduced moisture content of the air also affects downwind areas where the vegetation was not changed, such as the Horn of Africa and South Asia, where the prescribed desertification also leads to reduced precipitation (Figure 5a). This response is forced by the desertification, as it is present in the experiment with changed vegetation without any SST anomalies (compare Figure 8a and b). The SST anomalies actually cause an increase in precipitation over the Horn of Africa instead of a decrease (Figure 6a and b).
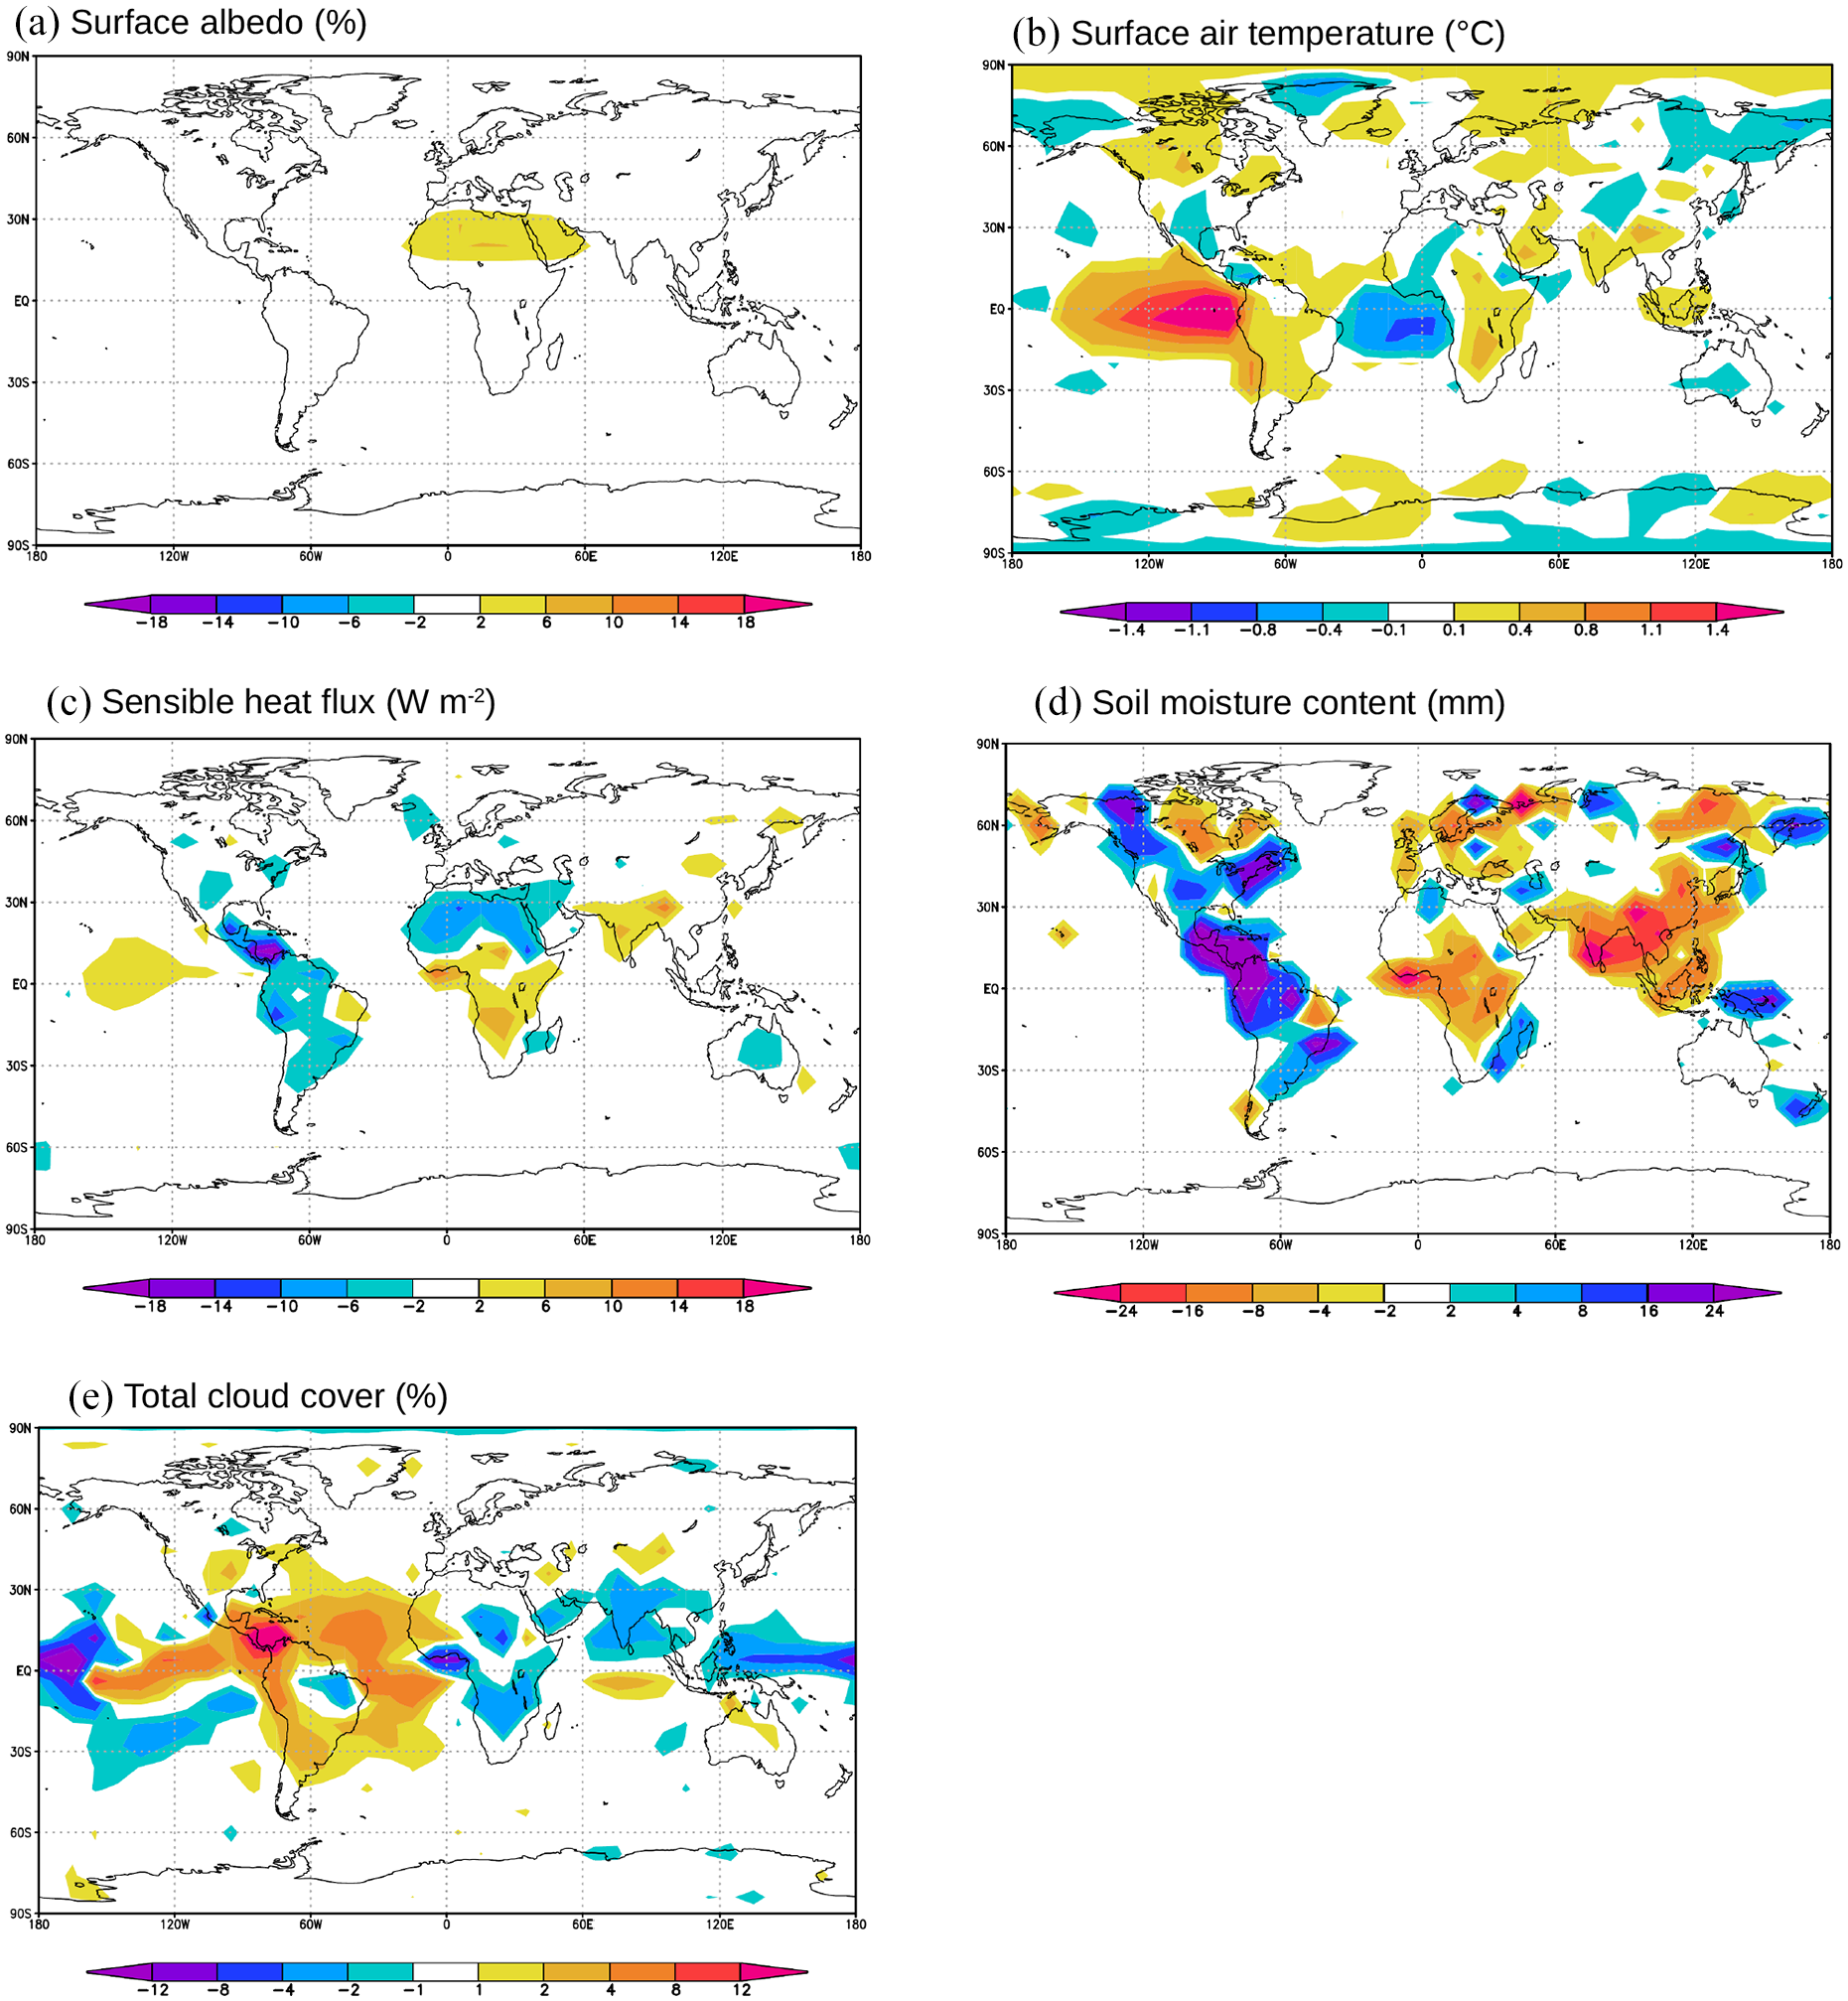
(a–e) Simulated annual mean response for 4_5kPAwATc minus 4_5kCTRL in (a) surface albedo, (b) surface air temperature, (c) sensible heat flux, (d) soil moisture content, and (e) total cloud cover.
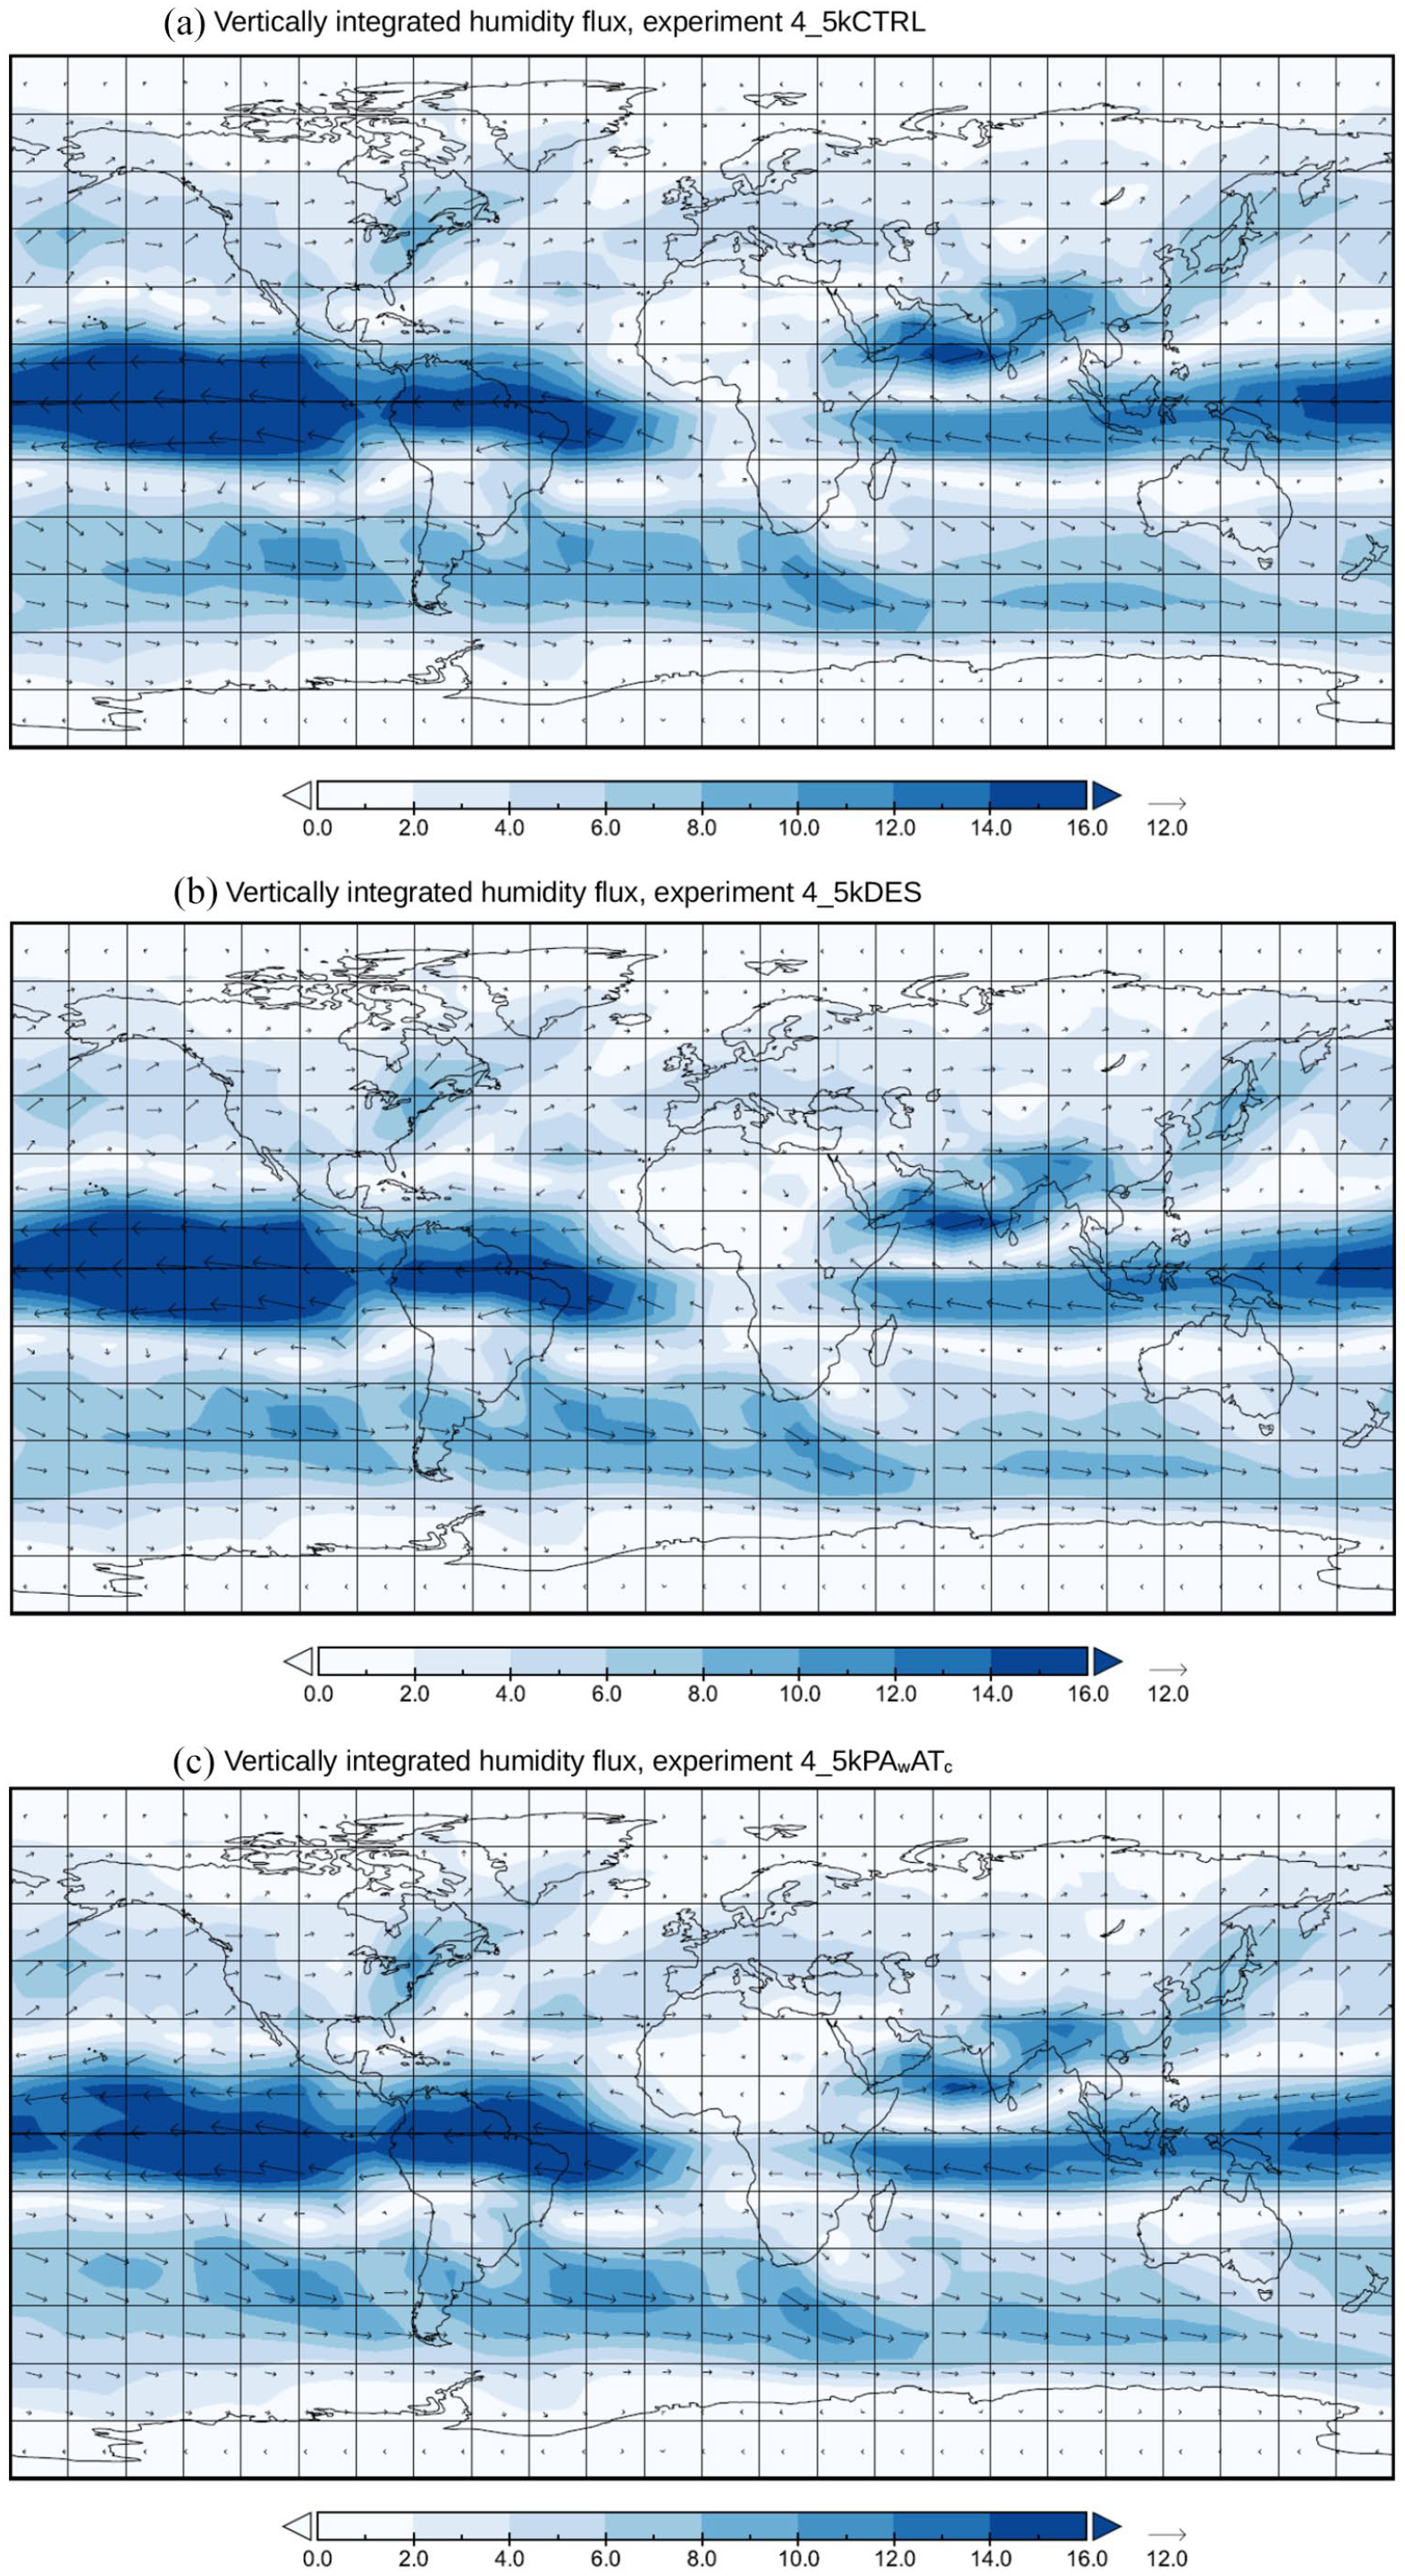
(a–c) Simulated humidity flux (kg ms−1), integrated over the atmospheric column in (a) experiment 4_5kCTRL, (b) 4_5kDES, and (c) 4_5kPAwATc.
Over South America, the conditions are different as no local change in vegetation is implied. Equatorial South America is downwind from the relatively cold tropical Atlantic (Figure 7b). Here the land-sea thermal contrast increases, resulting in enhanced monsoonal east-to-west moisture transport by the atmosphere (Figure 8c), leading to more precipitation. In addition, there is enhanced atmospheric instability over the relatively warm waters of the eastern tropical Pacific, promoting convective precipitation on the western side of the continent.
Uncertainties in the analyses
Several uncertainties can be distinguished, both regarding the modeling and proxy data. The results presented here are obtained with only one climate model with a relatively low spatial resolution. It is important to study the possible scenarios for the 4.2 ka event further using state-of-the art models. In this study, SST anomalies are simply prescribed to analyze the impact on the atmosphere. Potentially, feedbacks between the oceans and atmosphere are important, implying that it would be crucial to perform analyses with coupled atmosphere-ocean models that include all these feedbacks and provide results at a higher spatial resolution. In addition, the impact of desertification is simply evaluated by considering two states of vegetation (i.e. 100% desert or 50% grass/50% desert). It is unlikely that North Africa and Arabia were everywhere covered by 50% grass around 4.5 ka. As a next step, it is therefore important to also study the impact of transitional conditions in vegetation cover. Such additional simulations could also shed light on why cold SST anomalies in the tropical Atlantic appear to be more important in forcing the 4.2 ka event than anomalies in the Indian Ocean and the western tropical Pacific that could also be associated to enhanced El Nino activity.
The proxy-based dataset providing evidence for the 4.2 ka event could also be improved substantially. In this paper, I just distinguish between “wetter” and “drier” (Figure 1), so a next step would be to quantify the wet or dry anomalies and to make an estimate of the duration. In addition, it is simply assumed that all the humidity anomalies noted in the proxy records are representations of one global climate anomaly that was more or less synchronous. Other Holocene events may have been time-transgressive (cf. Wiersma et al., 2011), so it would be important to verify this important assumption.
Conclusions
To study the cause of the 4.2 ka event, a range of experiments was performed with an atmospheric general circulation model. The experiments all had identical appropriate boundary conditions for 4.5 ka (astronomical parameters and greenhouse gas levels) but differed in prescribed SSTs to evaluate the possible relation to tropical sea surface temperature anomalies in the oceans. SSTs were changed in six different regions based on SST anomalies during a modern canonical El Nino event: two in the eastern tropical Pacific, west Pacific, equatorial Atlantic, subtropical Atlantic, and Indian Ocean. In addition to these SST anomalies, also the impact of middle Holocene desertification in North Africa and Arabia was accounted for. The results were compared to the previously published estimates of the proxy-based global humidity anomaly signature for the 4.2 ka event. The specific signal (either dry or wet) of 13 global regions was considered, based on 129 different sites. My focus was on the following questions:
What is the sensitivity of the atmosphere to different tropical SST anomaly patterns?
Generally, warm SST anomalies generated more precipitation, while cold SSTs caused a reduction in precipitation. As a consequence, in scenarios with a warm anomaly in the Indian Ocean the dry conditions in Southern Asia, typical for the 4.2 ka event were not reproduced.
What forcing scenario represents a best match with the global humidity signature for the 4.2 ka event?
The optimal forcing scenario (4_5kPAwATc) produced a matching sign in precipitation anomaly with the proxy-based signature in 11 out of the 13 regions, of which six were statistically significant. This experiment included the effects of warm SSTs in the eastern tropical Pacific and cooling in the equatorial Atlantic. The effect of desertification was also included. In experiments with warming in the Indian Ocean, the important drought in South Asia and parts of Africa that is considered characteristic for the 4.2 ka event was not reproduced.
What are the atmospheric conditions associated with this scenario?
This scenario produced statistically significant increases in precipitation in South America (+23%) and northwest North America (+4%), and decreases in South Asia (−7%), and East (−4%) and West Africa (−16%). The desertification was an important driver of the drought in Africa and South Asia. The higher albedo of the desert resulted in reduced availability of energy, leading to small cooling over North Africa and more stable atmospheric conditions, resulting in less precipitation over large parts of Africa. Also downwind, to the east, the drier air also caused a reduction in atmospheric moisture transport, producing less precipitation over South Asia.
The enhanced precipitation over South America is related to SST anomalies in the equatorial Atlantic and Pacific Oceans. The relatively cold equatorial Atlantic resulted in enhanced land-sea thermal gradient, producing an increase in atmospheric moisture transport toward South America. At the same time, the warm SSTs in the equatorial Pacific generated instability and more convective rain on the western side of the continent.
Based on the model experiments presented here, the most likely forcing of the 4.2 ka event is a combination of rapid desertification in Northern Africa and Arabia, and anomalous conditions in the tropical Pacific and Atlantic Oceans, with warm SSTs in the equatorial Pacific and cold SSTs in the tropical Atlantic. One possible scenario is that such SST anomalies were produced by internal climate variability, promoting drought in North Africa that resulted in a collapse of the remaining vegetation associated with the African Humid Period. The SST anomalies could be associated with the marked increase in El Nino activity found in several proxy-based studies, and with a recent study suggesting that around 4.5 ka conditions in North Africa were still more humid than today, possibly supporting a remnant vegetation cover with a significantly lower albedo than pure desert.
Supplemental Material
sj-docx-1-hol-10.1177_09596836221074031 – Supplemental material for Climate model experiments on the 4.2 ka event: The impact of tropical sea-surface temperature anomalies and desertification
Supplemental material, sj-docx-1-hol-10.1177_09596836221074031 for Climate model experiments on the 4.2 ka event: The impact of tropical sea-surface temperature anomalies and desertification by Hans Renssen in The Holocene
Supplemental Material
sj-docx-2-hol-10.1177_09596836221074031 – Supplemental material for Climate model experiments on the 4.2 ka event: The impact of tropical sea-surface temperature anomalies and desertification
Supplemental material, sj-docx-2-hol-10.1177_09596836221074031 for Climate model experiments on the 4.2 ka event: The impact of tropical sea-surface temperature anomalies and desertification by Hans Renssen in The Holocene
Footnotes
References
Supplementary Material
Please find the following supplemental material available below.
For Open Access articles published under a Creative Commons License, all supplemental material carries the same license as the article it is associated with.
For non-Open Access articles published, all supplemental material carries a non-exclusive license, and permission requests for re-use of supplemental material or any part of supplemental material shall be sent directly to the copyright owner as specified in the copyright notice associated with the article.