
Abstract
The Southern Hemisphere Westerlies (SHW) play a major role in the global climate system. The winds drive ocean circulation and affect the Southern Oceans’ ability to take up atmospheric CO2. Recently, the SHW core belt has strengthened and shifted south, but there is an insufficient understanding of its long-term behaviour. Palaeoclimatic records are key for capturing long-term variability through the SHW’s effect on surface temperature and moisture availability. However, terrestrial records are sparse in the Southern Hemisphere. We use a palynological record from Lake Diamond on sub-Antarctic South Georgia to provide reconstructions of vegetation and climate for the last ~10,000 years. Influx of long-distance transported pollen is used as a measure of surface wind strength. Changes in relative pollen abundance of native taxa occupying either upland (cold) or lowland (warm) environments indicate local climatic variability. On South Georgia, we find long-distance transported pollen from South American taxa, mainly Nothofagus and Ephedra. They show a general increase in abundance throughout the Holocene, with peak influxes between 5700–5400, 2800–1500 and 1000–500 cal yr BP. These intervals coincide with colder periods inferred from the palynological record, suggesting that SHW variation and temperature on South Georgia are highly connected. Agreement with palaeoecological records from eastern Patagonia show that climatic changes have been regionally consistent. The record from Lake Diamond further illustrates the importance of remote islands in contributing to a deeper understanding of atmospheric circulation and climatic variability in the sub-Antarctic.
Keywords
Introduction
The Southern Hemisphere Westerlies (SHW) are one of the main drivers of climate variability in the sub-Antarctic region. The SHW largely drive the steep temperature gradient between 40 and 65°S (Fogt and Marshall, 2020) and supplies moisture and precipitation to the region (Mayr et al., 2007). The core belt of the SHW is said to intensify and shift southwards during warmer periods and weaken and shift northwards during colder periods, on both millennial and multidecadal timescales (Lamy et al., 2010). Forcing mechanisms of long term SHW changes have previously been proposed to include insolation changes (Bentley et al., 2009), while on decadal time scales ocean-atmosphere feedbacks, sea-ice extent and connections to El Niño Southern Oscillation drive variability (Fogt and Marshall, 2020; Hudson and Hewitson, 2001). Recent findings show that a more intense and poleward shift in the core belt of the SHW can enhance upwelling of deep water through the Antarctic Circumpolar Current (Kilian and Lamy, 2012), bringing CO2-rich deep water to the surface and reducing CO2 uptake by the ocean (Fletcher and Moreno, 2011; Landschützer et al., 2015). Constraining the long-term natural variability of this system provides valuable baseline data to understand how the global system might react to future climate changes.
Terrestrial records are key for capturing these surface atmospheric changes but are sparse owing to the scarcity of land masses in the Southern Ocean. Records from sub-Antarctic islands are thus crucial to help constrain the spatio-temporal dimensions of regional surface change. Several studies have successfully used pollen records from lake and bog sediments on these islands as a proxy for past climate shifts during the Late glacial and Holocene periods (e.g. Barrow, 1983; Barrow and Lewis Smith, 1983; Scott, 1985; Van der Putten et al., 2015), or long-distance transported (LDT) pollen fluxes as a measure of wind transport (e.g. Kappen and Straka, 1988; Scott and van Zinderen Barker, 1985; Strother et al., 2015; Turney et al., 2016a). Furthermore, differences in species assemblages of LDT pollen might be used to infer the source areas and thus reflect past position of the SHW core belt over the source area. As pollen is produced during the growing season, the LDT pollen will reflect austral summer (DJF) SHW conditions. Locally, vegetation is governed by temperature conditions and moisture availability, both affected by the SHW regime (Mayr et al., 2007; Van der Putten et al., 2008).
Temperature changes on sub-Antarctic islands have previously been inferred using the upland-lowland principle: upland taxa are usually adapted to colder environments, while lowland taxa prefer warm conditions. Relative changes in abundance of these taxa are therefore taken as a measure of relative changes in temperature. The upland-lowland principle has successfully been used on South Georgia (Strother et al., 2015) and other sub-Antarctic islands (e.g. Young and Schofield, 1973), but should be used with caution due to the broad ecological niche of some sub-Antarctic taxa (Van der Putten et al., 2012a).
Here, we present a lake sediment core from Lake Diamond, South Georgia (Figure 1). Its location in the core belt of the SHW and at the boundary of the Antarctic Circumpolar Current and Polar Frontal Zone is ideal to capture latitudinal shifts in the strong air temperature gradient separating the subtropical and polar air masses (Mayr et al., 2007) and variations in SHW strength (Groff et al., 2020; Turney et al., 2016b). We present the results of pollen and sedimentological analysis, and subsequent vegetation and climate reconstruction. We aim to (1) determine to what extent the composition of the local plant community changed during the Holocene, to (2) assess whether the LDT pollen can be used to track SHW changes in strength and position over South Georgia and to (3) use this information to infer natural climate variability during the Holocene. We then compare our results to independent palaeoclimate records from South Georgia and the broader sub-Antarctic region.
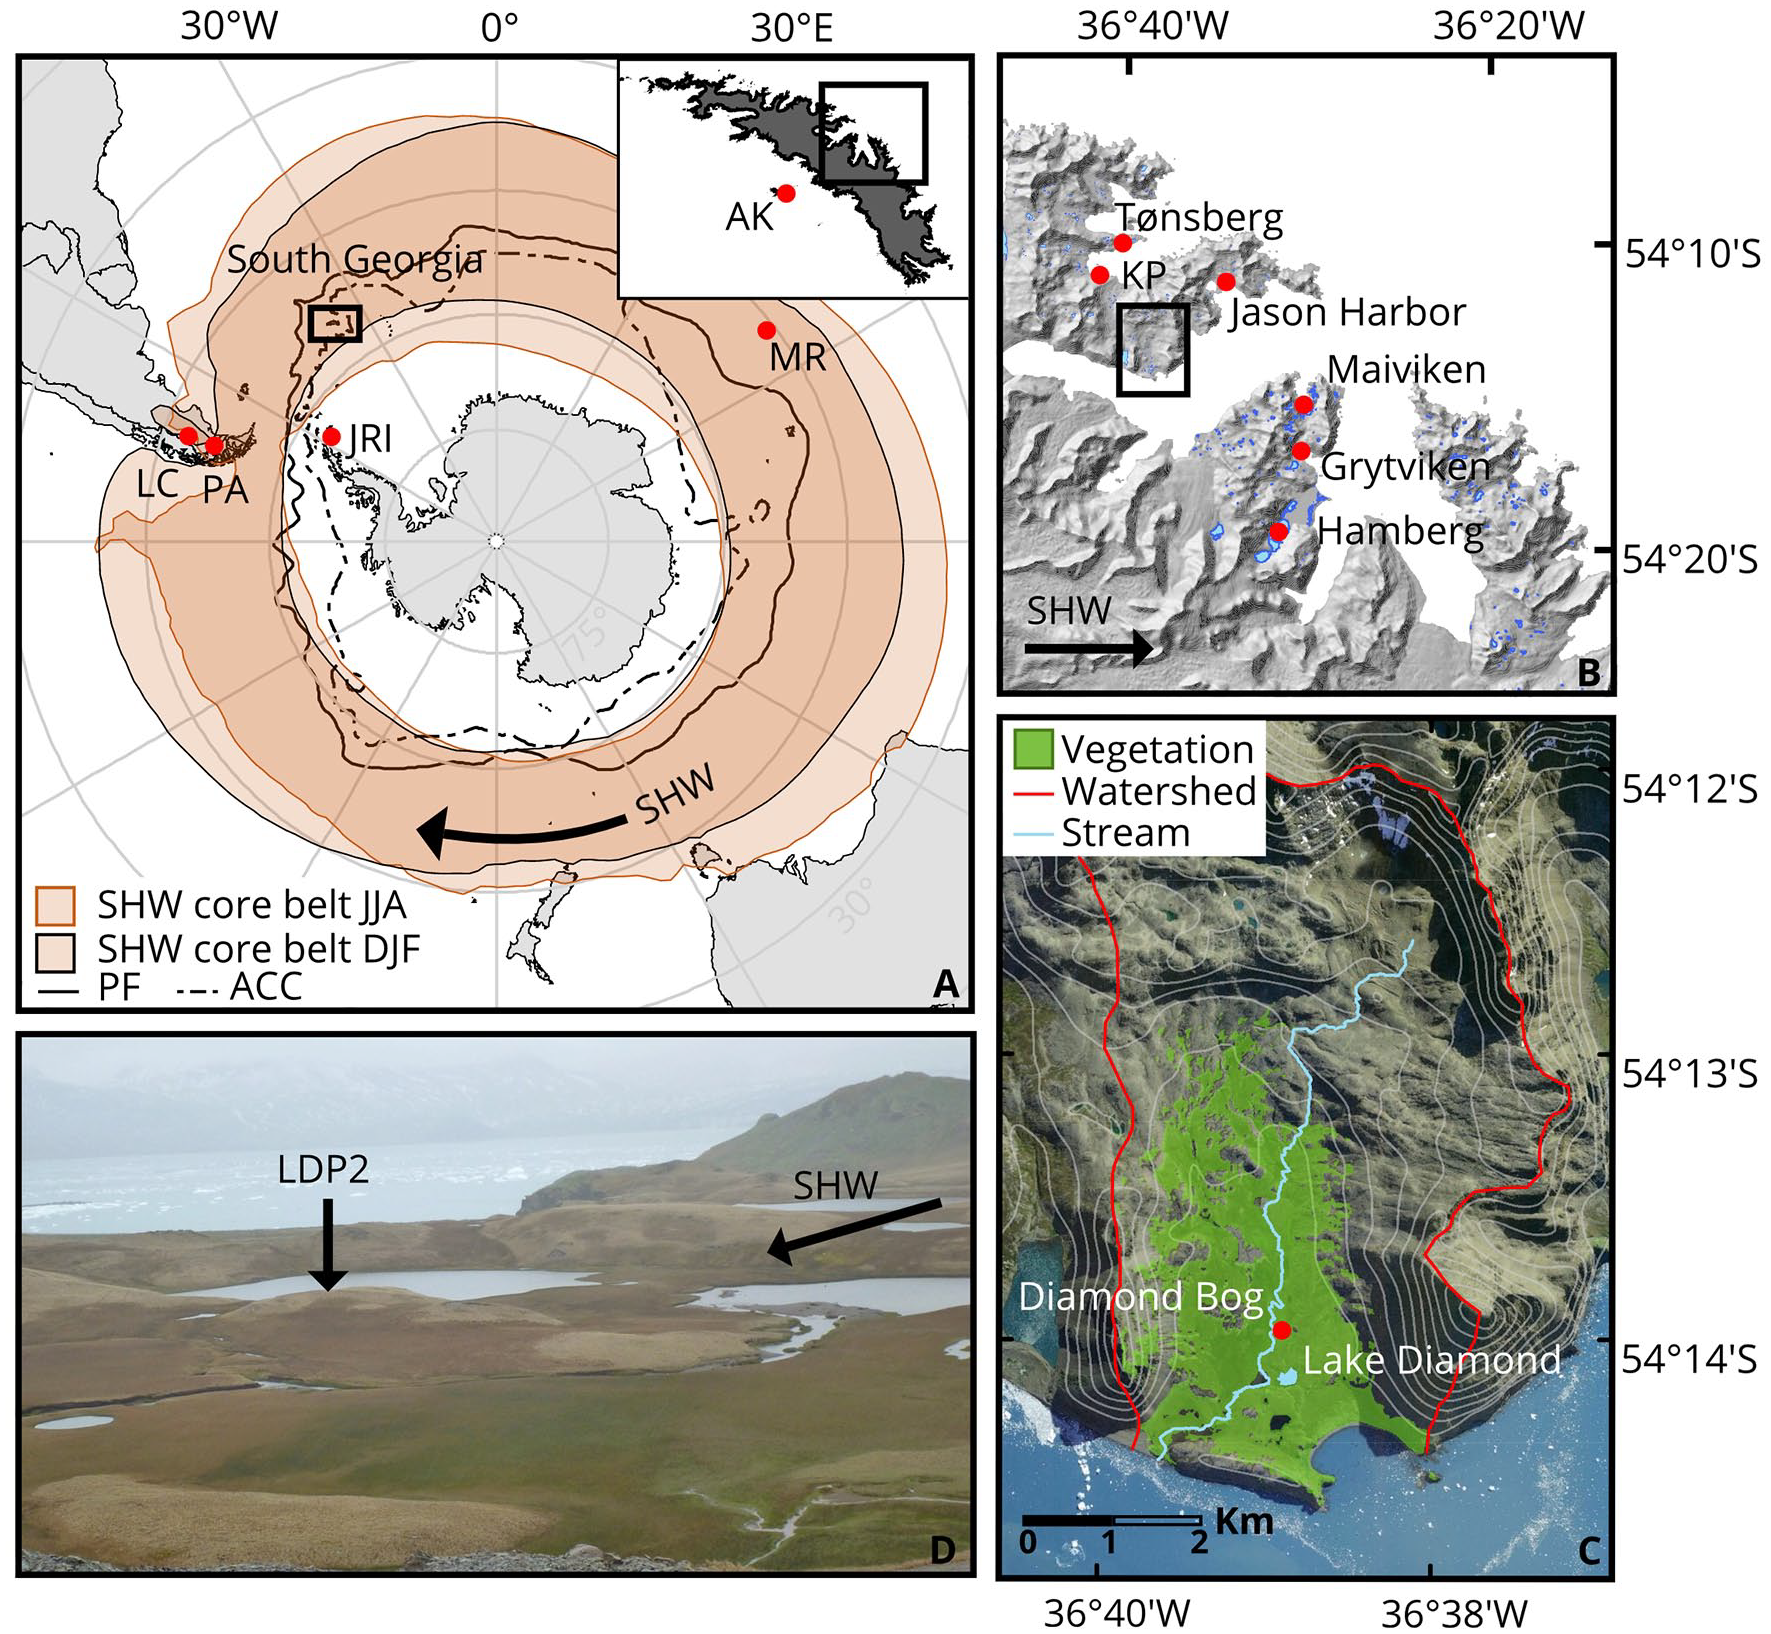
(a) Overview map showing the location of South Georgia, other sites mentioned in text and the position of the main atmospheric and oceanic front systems in the Southern Ocean; LC: Lago Cardiel (Markgraf et al., 2003), PA: Laguna Potrok Aike (Mayr et al., 2007), JRI: James Ross Island (Mulvaney et al., 2012), MR: Morne Rouge (Van der Putten et al., 2008), SHW: Southern Hemisphere Westerly Wind core belt after Van der Bilt et al. (in prep), PF: Polar Front, ACC: Antarctic Circumpolar Current. Inset showing South Georgia with AK: Annenkov Island (Strother et al., 2015). (b) Elevation map of the Cumberland Bay region with locations mentioned in text, KP: Kanin Point (Van der Putten et al., 2009). (c) Overview of Olsen Valley and location of Lake Diamond, SWIR vegetation cover after Van der Bilt et al. (in prep). Watershed after Oppedal et al. (2018). (d) Coring location in Lake Diamond with the alluvial fan on the right.
Background
Geography and climate
The sub-Antarctic island of South Georgia (c. 54°S 36°W) is positioned about 1700 km southeast of Patagonia in the core belt of the SHW and at the boundary of the Antarctic Circumpolar Current. It is one of the few sub-Antarctic islands positioned south of the Polar Frontal Zone (Figure 1a). The approximately 170 km long island is dominated by the glacier-covered Allardyce and Salvesen mountain ranges, which extend across two thirds of its length. The highest peaks reach over 2900 m above sea level, making the island one of the main topographic barriers in the SHW core belt. The orientation of the mountain range almost perpendicular to the main wind direction creates a sheltered environment on the north-eastern side of the island with warmer temperatures and a rain shadow (Thomas et al., 2018). Nevertheless, strong winds reaching 40 ms−1 have been recorded at the meteorological station of King Edward Point at Grytviken (Figure 1b), with föhn winds occurring often and ameliorating the local climate on the lee side of the mountain range (Bannister and King, 2015). Recent (1905–2019) mean annual temperature is 1.9°C, mean summer (December–February) and winter (June–August) temperature are 4.8°C and −1.3°C, respectively. The average precipitation total was recorded at 1450 mm a year at Grytviken, with most precipitation in autumn and winter (Lawrimore et al., 2011).
Vegetation
There are 17 native flowering plant species on South Georgia, consisting mostly of herbs and graminoids which are all non-endemic (Van der Putten et al., 2010). Several spore-producing ferns, mosses and clubmosses (Barrow, 1976), as well as a multitude of lichen dominate the ice-free parts of the island. All vascular plant species are believed to have been present on the island throughout the Late Glacial (Van der Putten et al., 2010). Vegetation is present in sheltered areas of the island (Figure 1c) and peat formation occurs where the soil is waterlogged (Greene, 1964). Peak pollen production of the native flora is generally reached in mid-December (Walton, 1982). Currently 47 introduced species are recorded on South Georgia, mainly growing around human settlements but posing threats of spreading further (Floyd, 2019).
This species-poor and treeless flora allows easy identification of pollen at low taxonomic levels. However, the broad ecological tolerance of the native species is also reason for caution when using palynological data to infer climatic changes (Scott and van Zinderen Barker, 1985; Van der Putten et al., 2012a). The use of a multi-proxy method where pollen analysis is combined with sedimentological evidence of environmental change has resulted in more reliable climatic interpretations (Strother et al., 2015). In contrast, the restricted local diversity makes the island particularly well-suited for the identification of LDT pollen in the sediments; especially South American arboreal pollen is easily distinguished from local palynomorphs. Exceptions are pollen from grasses and certain Amaranthaceae and Caryophyllaceae which are indistinguishable from native species but thought to make up part of the LDT component as well (Barrow, 1978). The absence of humans from the island until the 18th century allows distinction between naturally LDT and anthropogenic introduced pollen, which mostly consist of European taxa brought in by whalers from the beginning of the 20th century.
Study site
Lake Diamond (unofficial name) is located in Olsen valley on the north east side of the island (54°14′24.0″S, 36°39′0.0″W, Figure 1b). The lake is located 400 m from the coastline of Carlita Bay at around 16 m above sea level. The lake covers c. 10,000 m2 and is approximately 3 m deep at its deepest point (Oppedal et al., 2018). A meltwater stream fed by the Diamond cirque glacier could drain into Lake Diamond during periods of high water (>0.5 m) on the nearby alluvial fan, carrying glaciogenic sediments into the lake. Oppedal et al. (2018) suggest that this likely occurred every melting season, but new analysis by Van der Bilt (in prep) shows that this has not happened since 1979. Vegetation is present up to 150 m altitude on the gentle slopes surrounding Lake Diamond (Figure 1c). From the flowering vascular plant species, grasses, especially Festuca contracta, sedges and rushes dominate the area around the lake site. Acaena magellanica and other herb species were registered in the lower parts of the valley around Lake Diamond. Scattered moss patches are present in the area as well. The steeper slopes of the catchment area are bare (Figure 1c). During the last 100 years, reindeer were introduced to the island by Norwegian whalers and influenced the vegetation composition by selective grazing (Leader-Williams, 1988) until removal in 2013 (Floyd, 2019).
Material and methods
Sediment coring and stratigraphy
During a field campaign to South Georgia in the austral summer of 2011/2012, multiple sediment cores were recovered from Lake Diamond using a modified piston corer, and surface sediments were retrieved with a gravity corer. In this study, piston core LDP2 (246 cm, 54°14′07.97″S, 36°38′50.68″W) was used together with gravity core LDS2 (46 cm), taken at the same location. Sedimentological descriptions, geochemical analyses, loss-on-ignition (LOI), and a core chronology are available for LDP2 and described in detail in Oppedal et al. (2018). Magnetic susceptibility was measured by Oppedal et al. (2018) for both LDP2 and LDS2. Dry weight and LOI measurements on LDS2 were performed, as described in more detail by Van der Bilt et al. (in prep), by drying 0.5 ml of sediment overnight at 105°C and burning at 550°C for 4 h. LDS2 captures the most recent sediments and overlaps with the instrumental climate record.
Chronology
The age model for LDP2, as presented in Oppedal et al. (2018: table 2, figure 7), is based on 12 radiocarbon dates, calibrated using the SHCal13 calibration curve (Hogg et al., 2013) and post-bomb curve 4 (Hua et al., 2013). The bottom of gravity core LDS2 overlaps with LDP2. However, the exact overlap is unknown as some sediments at the top of LDP2 are missing (Oppedal et al., 2018; supplementary). Therefore, the core was initially cross-matched with LDP2 based on a Bayesian model using the sedimentation rates in the upper part of LDP2 and age constraint of the LDS2 core top (year of sampling) as a priori input, and corrected using the magnetic susceptibility records for both cores (Oppedal et al., 2018).
For this study, eight 210Pb samples from the upper 15 cm of LDS2 were submitted to the NIOZ dating facility in the Netherlands to better constrain the LDS2 chronology and finetune the cross-matching to LDP2. For the analysis, 0.05–0.5 g of freeze-dried and homogenised sediment was spiked with 1000 μl of a standard solution of 209Po and leached for 6 h at 80°C in a 10 ml solution of concentrated hydrochloric acid. After diluting with 40 ml of demineralised water and 5 ml of ascorbic acid solution, silver platelets were immersed and left in the solution for 16 h at 70°C in order to collect the natural 210Po and the added 209Po by spontaneous electrochemical deposition. Activity of 210Po and 209Po was then counted by a Canberra alpha detector, after which activity of 210Po was calculated by reference to the added 209Po spike. The obtained downcore profile of total 210Pb, plotted against a vertical scale of cumulative dry sediment mass to compensate for downcore increase in sediment compaction, was fitted with a conventional one-dimensional, two-layer, vertical eddy diffusion model assuming constant 210Pb flux and constant sedimentation (Carpenter et al., 1982), yielding a value for sediment accumulation rate (g cm−2 y−1). Dividing the cumulative mass depth by sediment accumulation rate yielded sediment ages and allowed for extrapolation of the age-depth model beyond the conventional limits of 210Pb dating, assuming constant sedimentation rates. The errors in the 210Pb model are calculated from the 1σ measuring uncertainty of the alpha detector and subsequent uncertainty in the best fit of the model for sediment accumulation rate.
Palynological analysis
A total of 45 pollen samples from LDP2 and LDS2 were taken in intervals ranging 4–10 cm; 4 cm intervals were taken in intervals with glacier fluctuations as interpreted from Oppedal et al. (2018). These are expected to indicate climate shifts that are likely reflected by the vegetation composition. In surface core LDS2, samples were taken every 10 cm due to limited sediment availability. Prior to pollen preparation, we added marker tablets to each sample to allow calculation of pollen and spore concentration and influx: Lycopodium clavatum tablets (batch# 177745) were initially used, but afterwards we found the marker indistinguishable from native Lycopodium magellanicum, Eucalyptus tablets (batch# 903722) were added to all subsequent samples. Preparations were performed using standard methods (Faegri and Iversen, 1989): 1 cm3 of sediment was treated with KOH, HF, and acetolysis to successively remove humic acids, silicates, and colloids. Residues were mounted in glycerol to allow turning of grains during analysis using a Zeiss light microscope at 400× magnification. Samples with <100 pollen grains were excluded from further analysis. Native species identification was based on Barrow (1976) and the modern pollen reference collection at the Department of Biological Sciences at the University of Bergen. Additional reference slides were made from plant samples collected on various sites on South Georgia during the fieldwork in 2011/2012, and in 2015 by the British Antarctic Survey (J Lee, 2015, personal communication). Reference samples were prepared using conventional methods (Faegri and Iversen, 1989), using KOH and acetolysis.
LDT pollen encompasses all taxa with pollen morphology different from the native and introduced taxa on South Georgia. LDT pollen determination was based on Heusser (1971), Reille (1995), and the modern reference collection from the University of Bergen. Additionally, non-pollen palynomorphs (NPPs) were counted and compared with finds from Barrow and Lewis Smith (1983) and Van Geel (1972) and named accordingly as types. The algae Pediastrum was counted as one taxon and not further identified to the species level. Abundances (%) were calculated based on the pollen sum taken as all pollen and spores from native taxa, to exclude closed sum effects in the LDT pollen signal. Pollen diagrams were constructed with Tilia version 2.6.1 (Grimm, 1992). Pollen influx rates (grains cm−2 year−1) were calculated based on our age-depth model.
Multivariate analysis of the pollen data
Constrained cluster analysis was carried out to provide an objective zonation of the pollen diagram. Percentage data of native vascular species, excluding rushes and sedges because of their uneven preservation in the fossil pollen record (Strother et al., 2015), were square root transformed prior to clustering using the stratigraphically constrained incremental sum of squares method in CONISS (Grimm, 1987). A broken-stick model was used to test the significance of the zonation using the vegan package (Oksanen et al., 2020) in R (R Core Team, 2017).
Principal component analysis (PCA) of the Lake Diamond pollen data was carried out using the vegan package (Oksanen et al., 2020). Percentage data of the native vascular plant species were square root transformed prior to analysis to downweight the dominant species. LDT pollen data were not included in the PCA analysis to focus on the local climate signal and thereby verify the upland-lowland principle. According to previous studies, pollen from Poaceae (consisting of indistinguishable Deschampsia antarctica, Festuca contracta, Poa flabellata, Alopercus magellanicus and Phleum alpinum) was used as upland indicator and Acaena magellanica, Acaena tenera, Galium antarcticum, Austroblechnum penna-marina, Lycopodium magellanicum and Uncinia compacta as lowland indicators (e.g. Strother et al., 2015; Young and Schofield, 1973). The number of interpretable PCA axes was tested using a broken stick model.
Results
Sediments
Piston core LDP2 consists of a bottom layer of glacial till overlain by highly decomposed peat (243.5–223 cm depth). A sharp erosive bedding separates the peat from organic-rich lake sediment (221.5–0 cm), which is interrupted by a slump layer at 185.5–194 cm depth. Gravity core LDS2 consists of unconsolidated, highly organic sediments and captures the top part of the lake sediment and the sediment-water interface (upper 5–6 cm).
Chronology and age depth model
The downcore profile of total 210Pb shows a clear quasi-exponential decline, from almost 400 mBq g−1 near the top of the core to 40 mBq g−1 at 13.5 cm depth (Figure 2 and Supplemental Table S1). In view of the shape of the profile, the latter value was assumed to be close to the supported 210Pb activity. Biological mixing of the sediment was assumed to be negligible. Under that assumption, model fitting yielded a sediment accumulation rate of 0.8 mm y−1 in the upper part of the core.
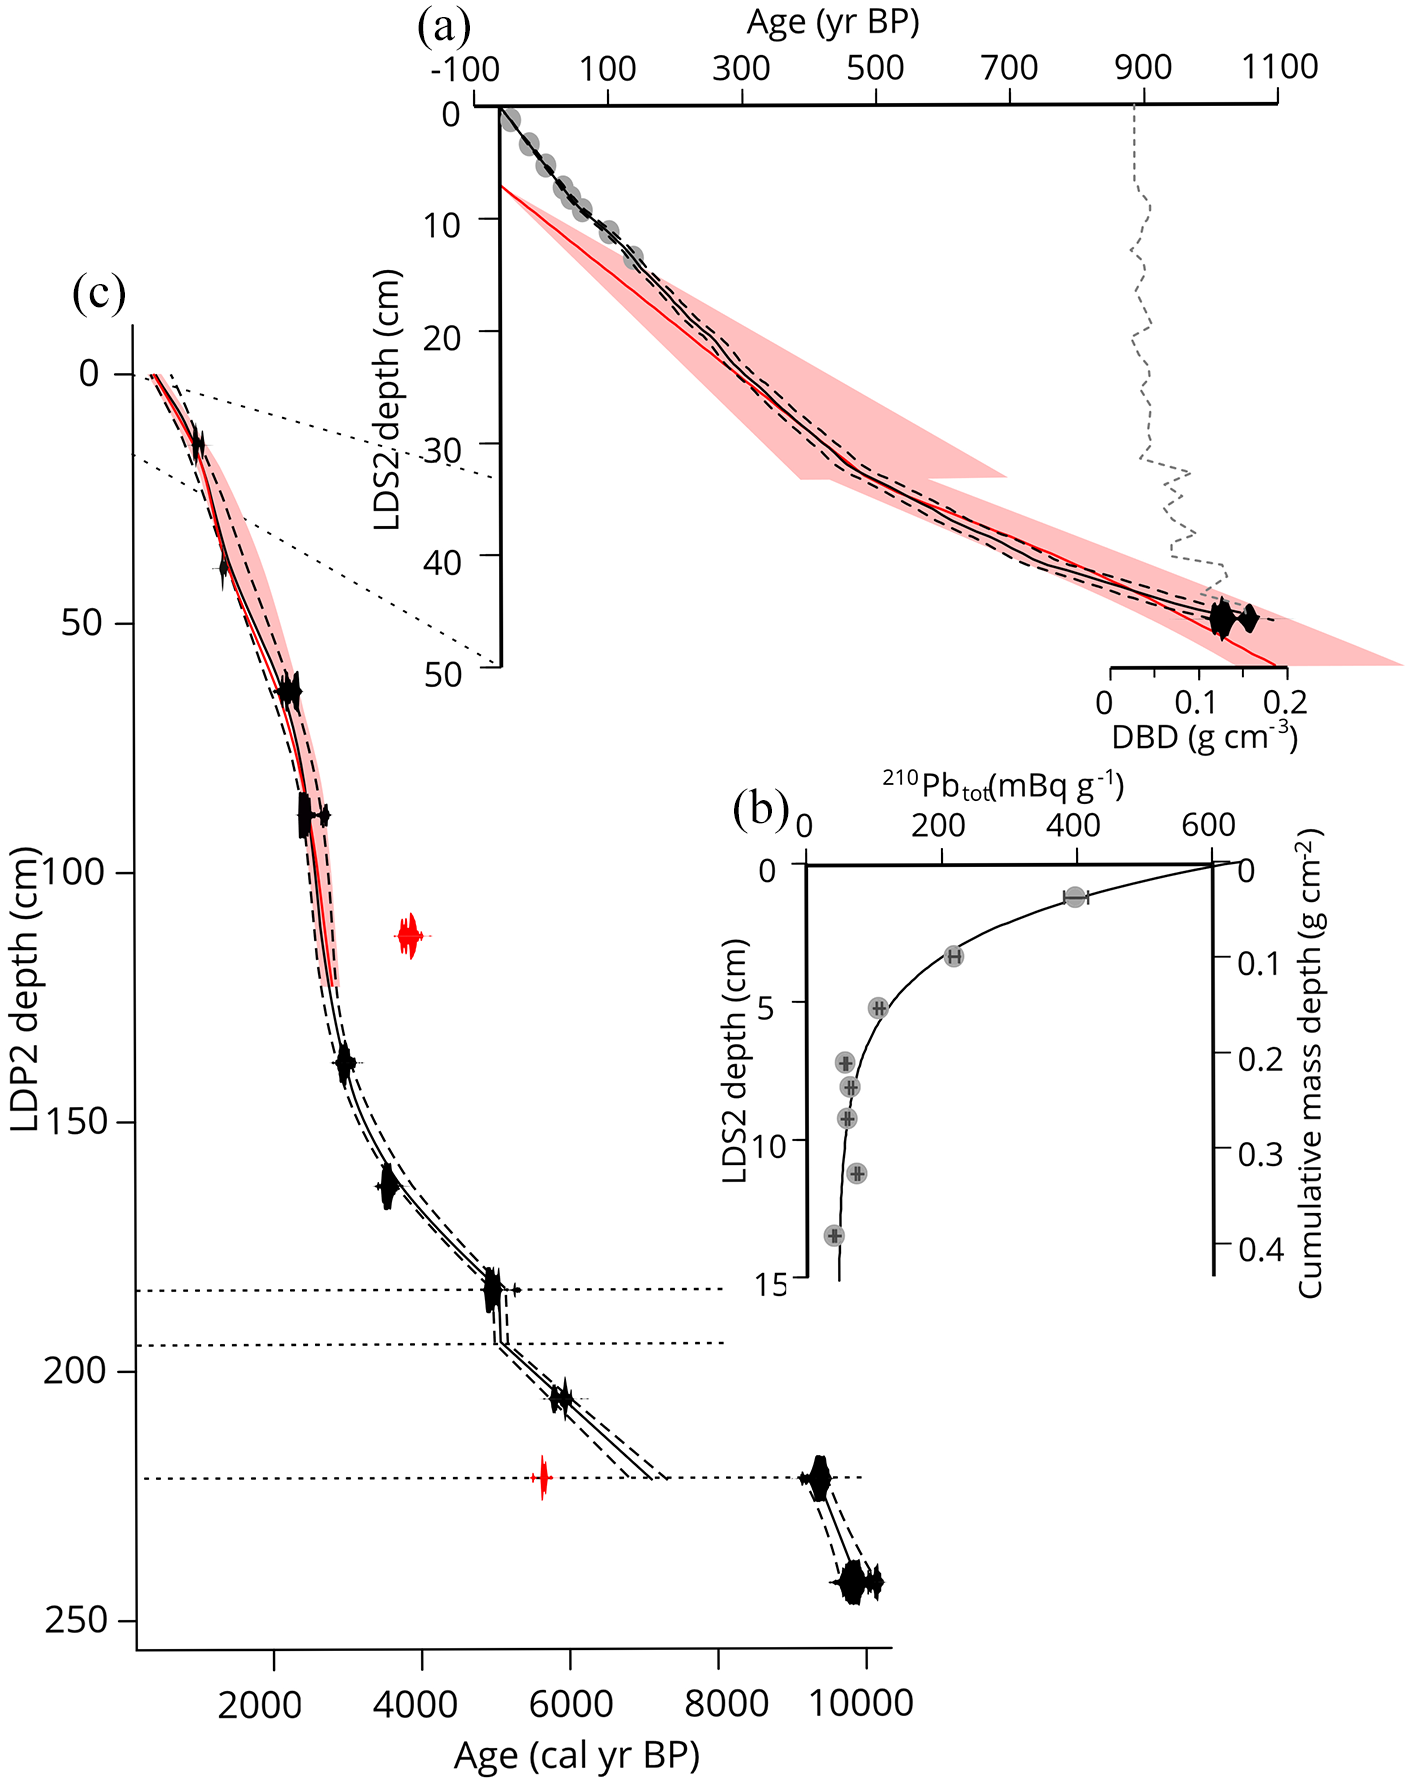
(a) 210Pb based age-depth model with 1σ uncertainty for core LDS2, showing 210Pb dates in grey and overlap with the Bayesian age-depth model with 95% confidence interval in red. Dry bulk density (DBD) values in dotted grey line show a downcore increase in sediment compaction. (b) Downcore profile of total measured 210Pb and the fitted CFCS model shown on both the LDS2 depth scale and cumulative dry mass depth. 210Pb sample activity is shown with 1σ error range. (c) Radiocarbon based age-depth model for LDP2. Outliers are shown in red. The CLAM model run is displayed by the solid black line, with 95% confidence bands indicated by the dotted lines. In red the Bayesian model constraining the upper part of LDP2 and 95% confidence interval.
Using their independent chronologies, the LDS2 and LDP2 cores were spliced together onto one common depth scale. To make comparison to Oppedal et al. (2018) possible, the top of LDP2 is taken as 0 cm depth, thus the 33 cm of overlying sediments from LDS2 are reported with a negative depth scale (Figure 3).
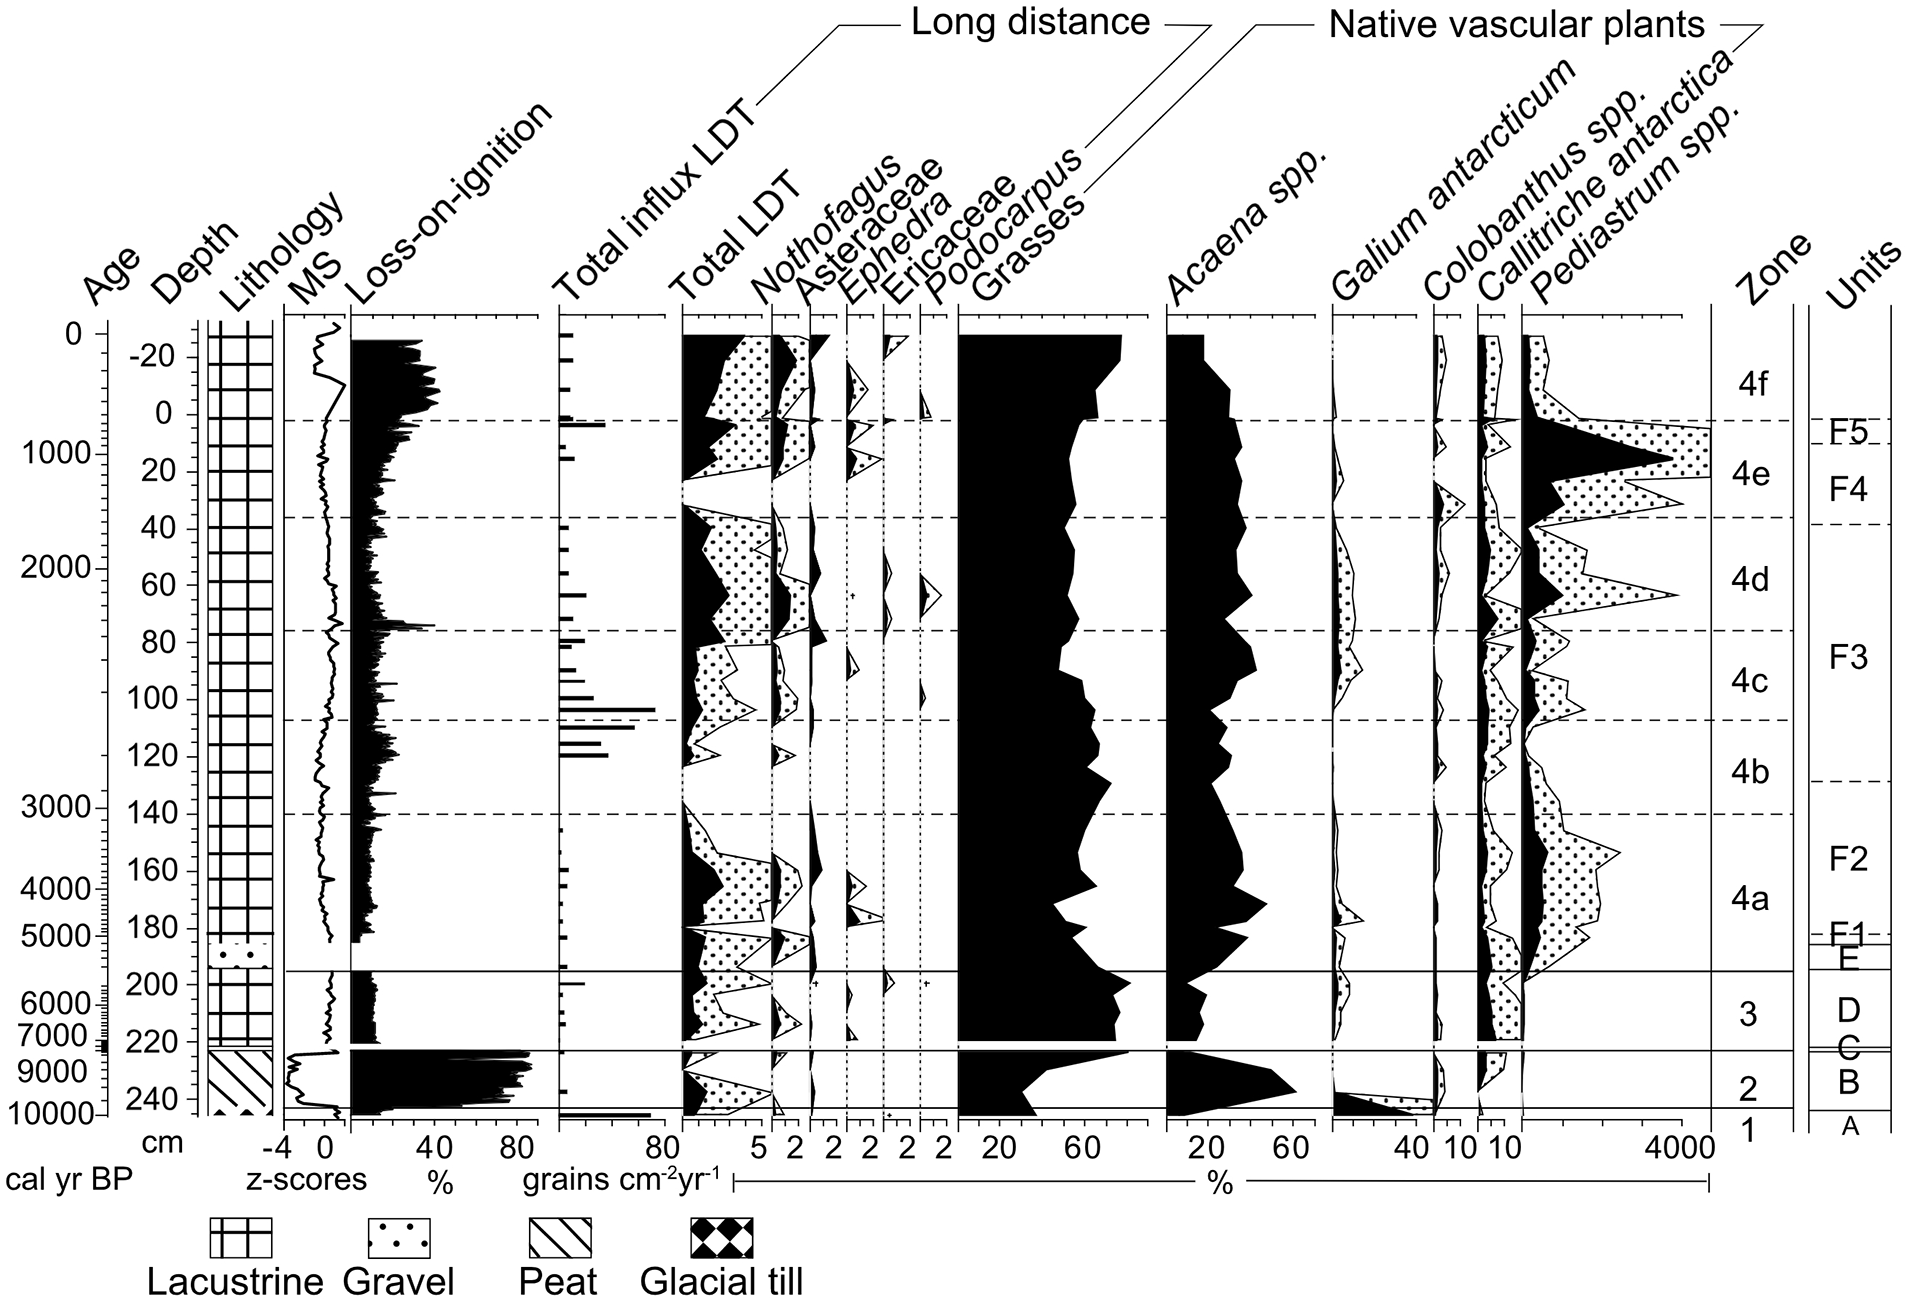
Overview of the Lake Diamond record showing lithology, mass specific magnetic susceptibility (MS) and organic-matter content (loss-on-ignition) adapted from Oppedal et al. (2018), pollen influx of total LDT species and abundance of the main pollen taxa and algae Pediastrum. Note the different abundance scales for some species. The dotted pattern shows four times exaggeration of the curves. Zones are based on constrained cluster analysis, additionally units from Oppedal et al. (2018) are shown. LDT: Long-distance transported pollen.
Palynological analysis
LDT pollen comprises mostly Nothofagus dombeyi-type, Ephedra, Podocarpus, Ericaceae and Asteraceae and mainly originates from South America, with species occurrence comprising the entire length of southern South America and no distinct LDT pollen assemblages in our record matching known vegetation zones (Villa-Martínez and Moreno, 2007) (S2). The LDT pollen on average makes up 1.1% of the pollen sum, with maxima of 3.6% in LDS2 and 3.2% in LDP2. Grasses and Acaena spp. (A. magellanica and A. tenera) dominate the pollen diagram with combined abundance averaging 90% throughout the record (Figure 3). Stratigraphically constrained cluster analysis of the native taxa resulted in comparable zonation to the units distinguished by Oppedal et al. (2018), apart from subzones 4a–4f. In this paper the data are discussed based on zonation of the pollen diagram.
Zone 1 (243.5–246 cm; >9900 cal yr BP)
One pollen sample from the top of the inorganic basal glacial till was analysed. The LDT pollen taxa in this zone consist of Nothofagus, Ericaceae, Amaranthaceae and Asteraceae (Figure 3). Galium antarcticum pollen dominates the native herb species. Grass pollen abundance is relatively low (<40%).
Zone 2 (243.5–223 cm; ~9900–9350 cal yr BP)
Zone 2 represents a peat bog environment, reflected by the high LOI (>80%) and low mass specific magnetic susceptibility (MS) values (Figure 3) (Oppedal et al., 2018). LDT pollen input mostly consists of Asteraceae and Amaranthaceae but shows low influx rates. Of the local pollen taxa, Acaena pollen abundance peaks to over 60%. Towards the top of the zone, grass pollen increases in abundance as well as pollen from Callitriche antarctica and Ranunculus biternatus, accompanied by a decrease in Acaena pollen. Some Pediastrum remains were found, but in very low abundance (Figure 3).
Zone 3 (223–194 cm; ~7300–5140 cal yr BP)
After the hiatus, conditions became lacustrine. The organic lake sediment (LOI ~15%) shows high MS values and variable grain size input ranging from clay to sand (Oppedal et al., 2018). The diversity and total abundance of LDT pollen increases compared to zone 2, with the first occurrences of Ephedra and Podocarpus pollen. Grass pollen percentages remain between 70% and 80%. Pollen from Callitriche antarctica and Montia fontana, two semi-aquatic taxa, increase in abundance. Pollen from Colobanthus spp., often growing in dry rocks habitats, decrease in abundance.
Zone 4 (194 cm–top; ~5140 to −61 cal yr BP)
Zone 4a (194–140 cm; ~5140–3040 cal yr BP)
The base of zone 4a consists of a sandy layer containing pebbles and is described by Oppedal et al. (2018) as a slump from mass-wasting of moraine sediments. We propose a flash flood event as an alternative interpretation, as the gentle vegetated slopes around Lake Diamond are unfavourable for mass-wasting to occur. A high energy flooding event may have been able to transport sandy gravel from upstream moraines (Oppedal et al., 2018, Figure 2b) or the alluvial fan next to Lake Diamond (Figure 1d). In the pollen diagram this layer is evident from many broken and corroded pollen grains (S1). Throughout the rest of the zone MS values show a gradual decline (Oppedal et al., 2018). LDT pollen presence is initially high reaching 2% but declines from 153.5 cm. Pollen from native taxa abundances vary throughout this zone. Poaceae and Acaena spp. remain the dominant taxa, with Acaena pollen percentages higher compared to zone 3 (>40%). Pediastrum becomes very abundant.
Zone 4b (140–107 cm; ~3040–2750 cal yr BP)
Higher MS values, sandy layers and large organic fragments indicate a high energy system with intermitted spill-overs from the river into Lake Diamond, which results in high sedimentation rates reaching 25 mm y−1 (Oppedal et al., 2018). LDT pollen is absent between 140 and 120 cm but shows very high influx rates (~40 grains cm−2 year−1) from 120 to 108 cm. Grass pollen becomes more abundant than Acaena, respectively ~70% and ~20%. Pediastrum abundance declines throughout this zone.
Zone 4c (107–76 cm; ~2750–2470 cal yr BP)
Sediment characteristics remain similar to zone 4b, although MS values increase (Oppedal et al., 2018). LDT pollen percentage lies between 1% and 2%, but most importantly, shows very high influx rates (Figure 3). Pollen from grasses show a small decline (~50%). Acaena and Galium, pollen and Pediastrum increase in abundance to 30%, 5% and 500%, respectively.
Zone 4d (76–36 cm; ~2470–1560 cal yr BP)
The sediment is less organic (LOI ~10%) than underlying zones and MS values gradually decline (Oppedal et al., 2018). Zone 4d shows high abundance in LDT pollen. The native plant composition is very stable, although Pediastrum becomes slightly more abundant.
Zone 4e (36–2.5 cm; ~1560–570 cal yr BP)
MS values increase throughout zone 4e and the organic content of the sediment increases to 25% (Oppedal et al., 2018). Almost no LDT pollen is observed for the interval from 36 to 20 cm but LDT pollen abundance increases to ~1% towards the top of the zone. The diversity in LDT taxa is very low. Native taxa show little variation, only Galium pollen shows a small decrease (~1%). A huge peak in Pediastrum abundance is seen in the upper part of zone 4e (>4000%).
Zone 4f (2.5 cm–top; ~570 to −60 cal yr BP)
MS values are low, indicating less glacial input, but increase in the upper cm (Oppedal et al., 2018). LDT pollen abundance increases to 3.6% in the top of the core, and shows high influx rates (130 grains cm−3 year−1). Pollen from Tilia, Alnus and Brassicaceae, is found in the uppermost sample. Grass pollen increases in abundance (60–75%) towards the top of the core while Acaena pollen abundance declines (35–20%). Pediastrum abundance is quite low (490%).
Multivariate analysis of the pollen data
The first PCA axis (PC1) explains 55% of the variance in the native species occurrence and clearly separates grasses as an upland indicator and Acaena spp. as a lowland indicator (Figure 4). This result supports the use of the upland-lowland principle on South Georgia. This division of species on PC1 is also seen in the ordination of pollen taxa from Annenkov island (Strother et al., 2015), c. 40 km southwest of Lake Diamond (Figure 1a). Strother et al. (2015) include LDT pollen in their PCA analysis, thereby blending both the local and regional climate signal, which might explain the lower percentage of explained variance (20%) in their ordination. Even though the two records show a similar result, the broad ecological niche of the native species should still be considered. Pollen from grass species cannot be distinguished from each other and while Poaceae as a group is taken as an upland indicator, F. contracta, one of the most abundant grass species on South Georgia, grows mainly in lowland coastal areas. Therefore, we argue that the upland-lowland principle should not be taken as a single temperature indicator but needs to be supported by independent proxy records. The second PCA axis (PC2) in the Lake Diamond ordination is insignificant according to the broken stick model but is shown to plot the ordination diagram (Figure 4).
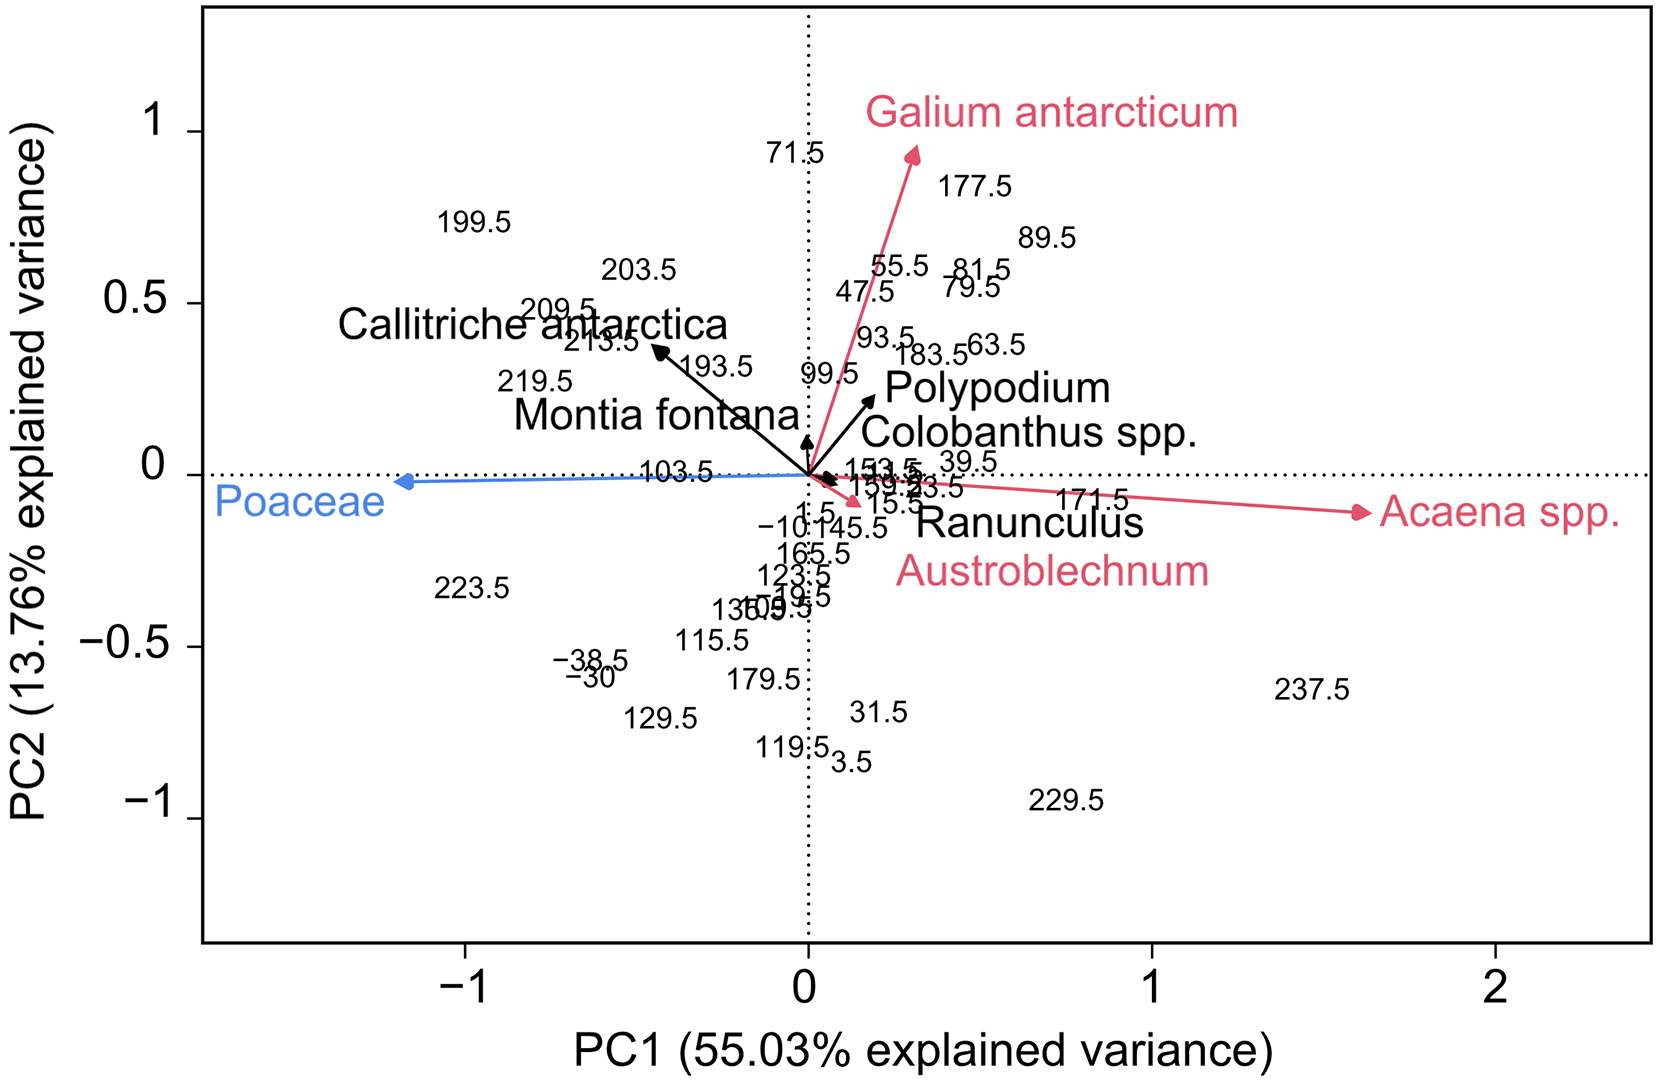
Principal Component Analysis (PCA) of the main terrestrial taxa and sample depths from the Lake Diamond record. The first axis separates the ‘upland’ grass species (n = 5) from the ‘lowland’ Acaena spp., Galium antarcticum and Austroblechnum penna-marina.
Discussion
Local vegetation and climate
After deglaciation prior to 9900 cal yr BP, the fresh rocky substrate of the glacial till (zone 1) at the relatively low elevation of the Lake Diamond site was likely dominated by Galium antarcticum which is common in dry and rocky habitats. G. antarcticum is a lowland indicator and its abundance suggests an ameliorating climate and first colonisation by plants after the Olsen valley became ice free at the end of the Last Glacial (Clapperton et al., 1989). Pollen from most of the native species is present in the lowermost sample of the core (Figure 3, S1), indicating that they must have been locally present around Lake Diamond or survived in local glacial refugia during the Last Glacial Maximum (Van der Putten et al., 2010). The high abundance of lowland taxa indicates ameliorating temperatures at the onset of the Holocene.
In the subsequent development of a peat bog from ~9900 to 9350 cal yr BP (Figure 3, zone 2) it became too wet for G. antarcticum and Acaena became the dominant herb species, likely growing both on the bog surface and in the surrounding areas. The high abundance of this lowland species indicates further warming during the Early Holocene. Although most South Georgian palynological records do not date back as far as ours, a warming climate in the Early Holocene is also reflected in the Tønsberg peat record (Van der Putten et al., 2004) and records of glacier retreat (Bentley et al., 2007; Berg et al., 2019). Palaeoclimate records in Patagonia and the ice-core record from James Ross Island on the Antarctic Peninsula show a similar signal (Kilian and Lamy, 2012; Mulvaney et al., 2012). During this interval, grasses were probably present on slightly drier areas surrounding Lake Diamond. The rare presence of Pediastrum in zone 2 may indicate some small bodies of standing water on the peat bog suitable for algal growth.
The hiatus between ~9350 and 7200 cal yr BP in the Lake Diamond core corresponds with a local dry period between approximately 9000–7900 cal yr BP (~8150–7100 14C yr BP), inferred by Van der Putten et al. (2004) based on restricted sedimentation in the peat bog record from Tønsberg Peninsula (Figure 1b). Even if it is unclear whether this could also have caused the gap in the Lake Diamond record, drier conditions would stop peat growth and inwash of sediments to the lake. A diatom inferred lake level low stand in Laguna Potrok Aike from 8700 to 7300 cal yr BP (Wille et al., 2007) and retreat of Nothofagus woodland in Southern Patagonia (Mansilla et al., 2018; McCulloch et al., 2020) suggest that warm and dry conditions prevailed in the south Atlantic region.
From ~7200 cal yr BP the site was occupied by a lake (zone 3). This succession was accompanied by increasing abundances of pollen from the semi-aquatic Callitriche antarctica and Montia fontana, likely growing along the lake and stream edges (Figure 3, S1). A high upland pollen component suggests cold conditions and low Pediastrum percentages indicate unfavourable growing conditions in the lake during summer. This agrees with records from nearby Little Jason Lagoon (Figure 1b) showing a reduced vegetation cover and cold conditions from ~7000 to 4000 cal yr BP (Berg et al., 2019). Furthermore, in Patagonia a cold and wet anomaly is observed from 7500 to 5800 cal yr BP based on a lake sediment record (Moreno et al., 2018).
A warmer climate is inferred from ~5300 to 3000 cal yr BP in Lake Diamond and its catchment from the increase in pollen from lowland herb species and the algae Pediastrum. The sedimentological record shows less variability and activity of the Diamond glacier from 4800 to 2700 cal yr BP (Oppedal et al., 2018). Additionally, low Callitriche antarctica pollen abundance indicates a slightly dry climate. Warmer temperatures for this period are also observed in the James Ross Island ice core record (Figure 5j) (Mulvaney et al., 2012). Dry conditions on the west side of James Ross Island are inferred from precipitation of gypsum starting at 5700 cal yr BP, with a return to warm and humid conditions from ~4700 to 3100 cal yr BP (4200–3000 14C yr BP) (Björck et al., 1996), suggesting region-wide synchronous temperature changes, but alternating moisture regimes on the wind- and leeward sides of mountain chains.
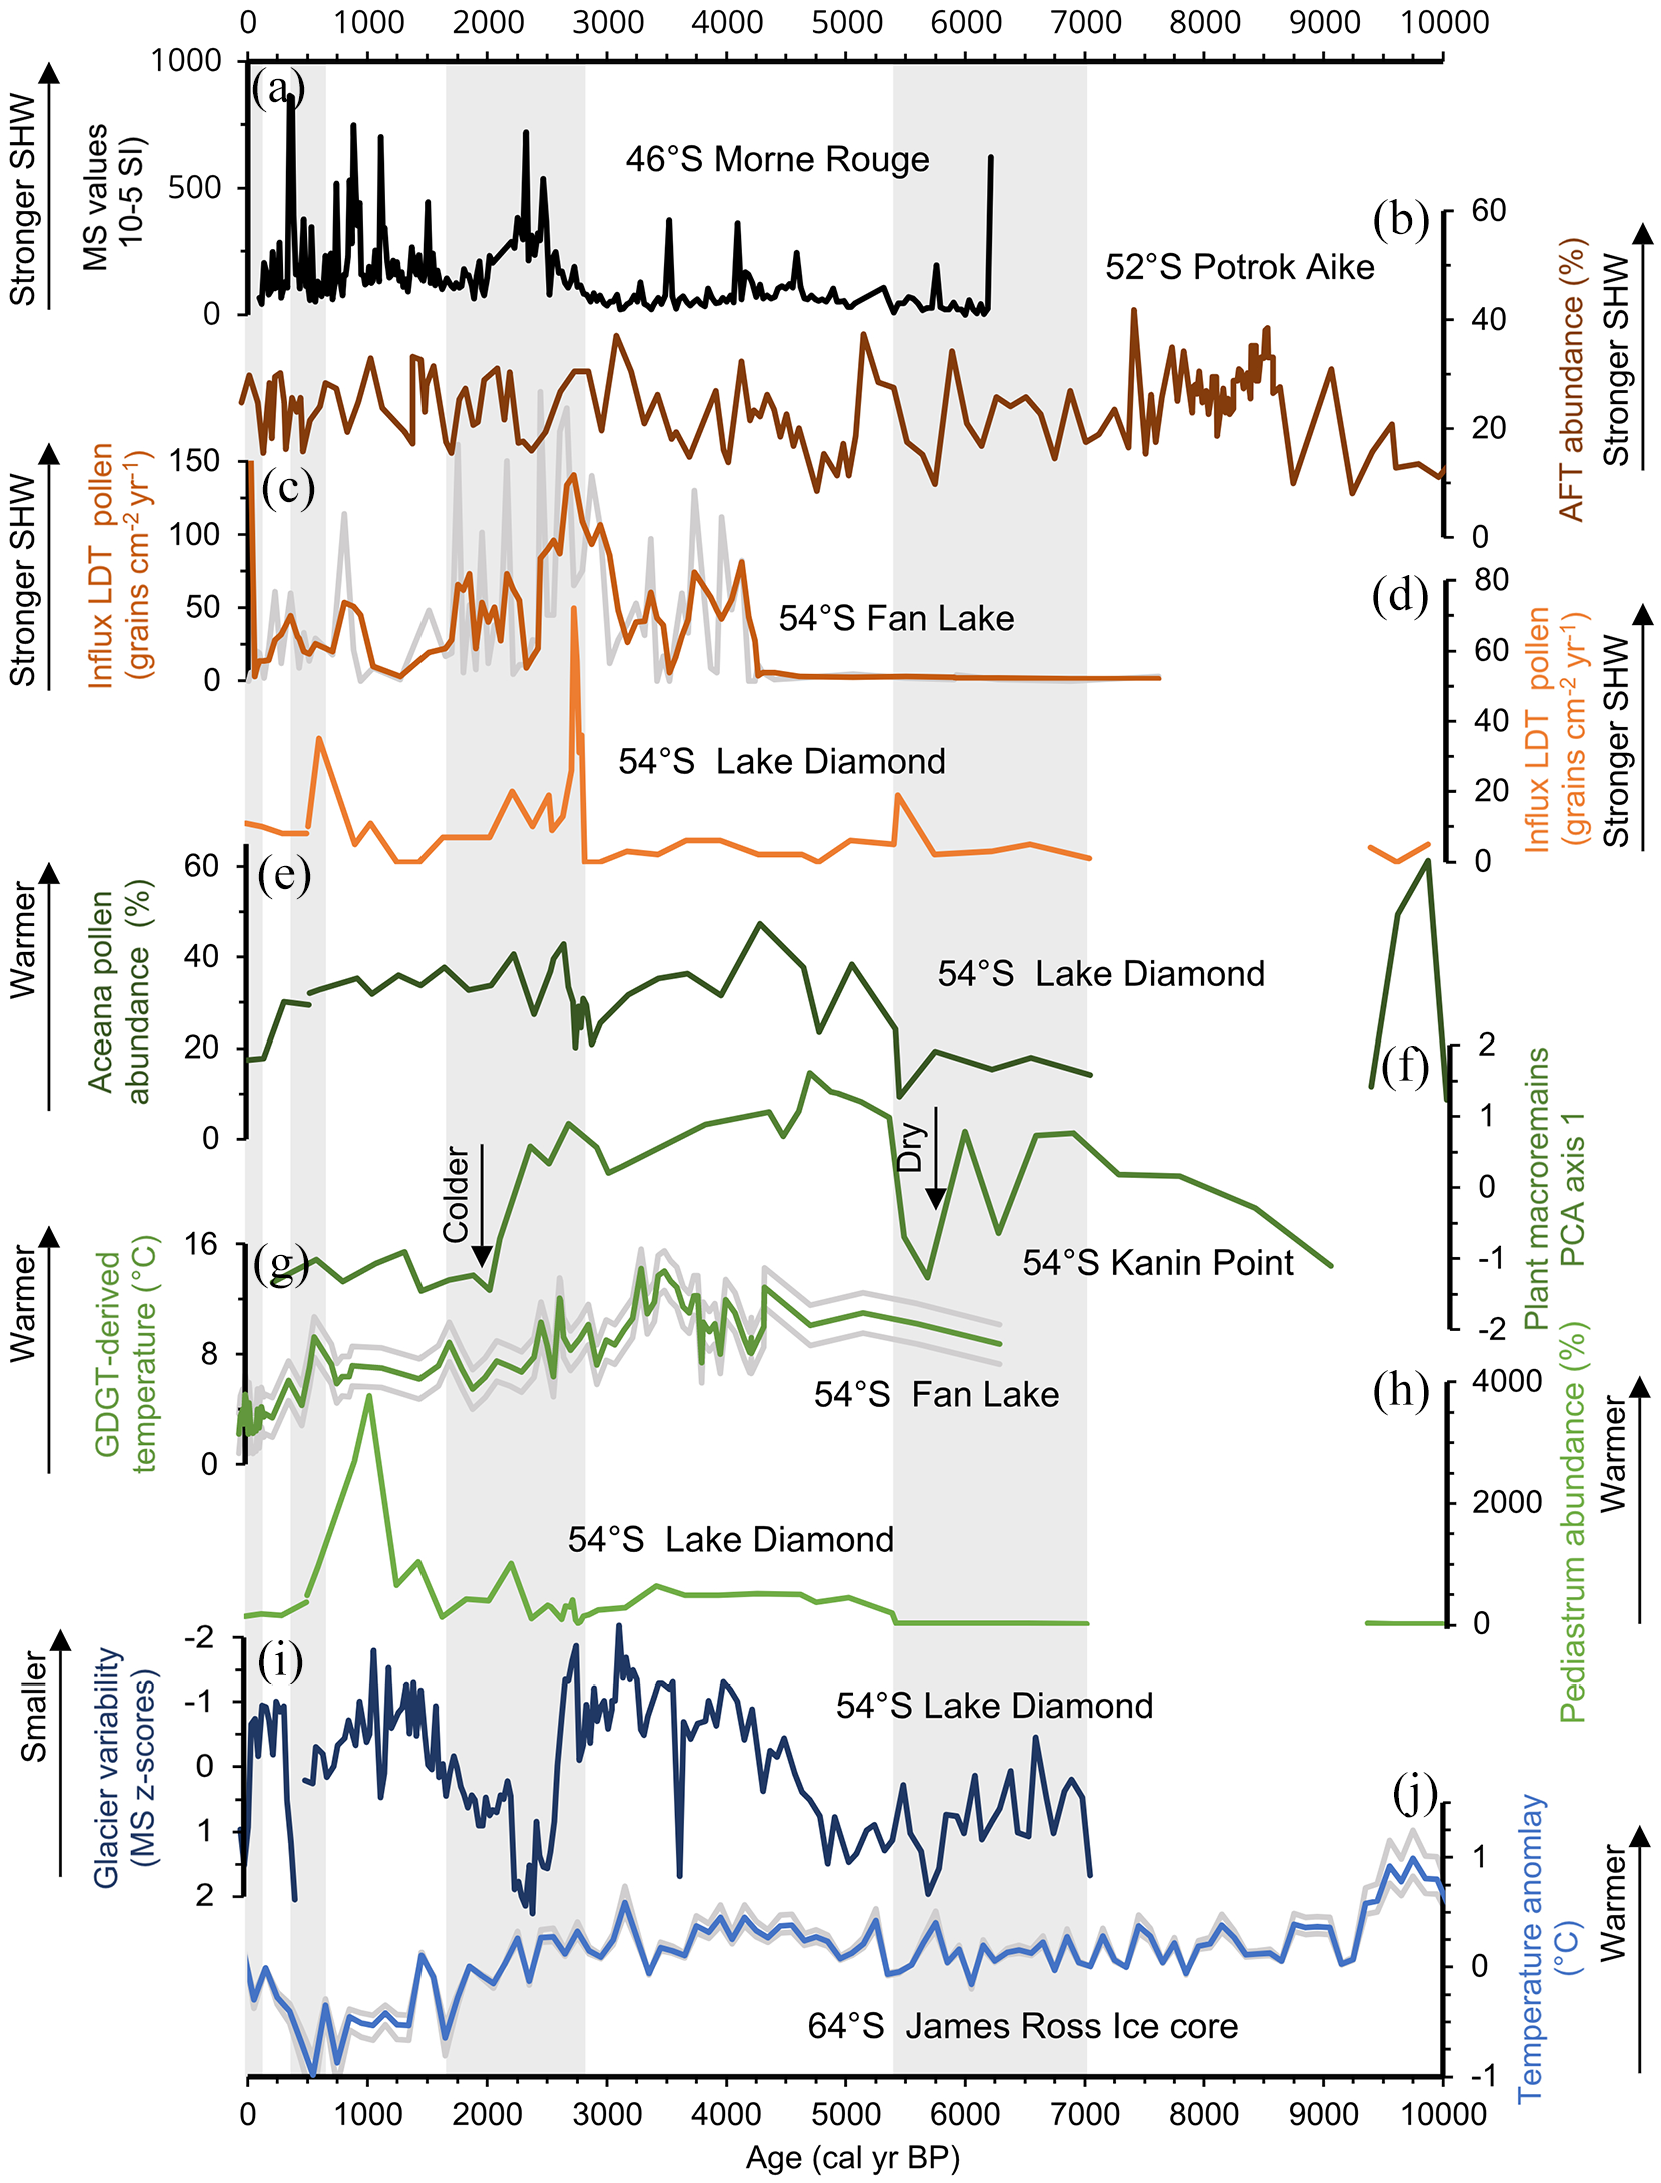
Compilation of palaeoclimatic records from the south Atlantic region to compare SHW variability and climatic changes. Shaded bands show colder periods inferred from the Lake Diamond palynological record. Records indicative for SHW variability: (a) Magnetic Susceptibility (MS) values in the Morne rouge peat bog (Van der Putten et al., 2008); (b) influx of Andean forest taxa (AFT) to Laguna Potrok Aike (Mayr et al., 2007); (c) long distance transported (LDT) pollen influx to Fan Lake, showing 3-pt average to reduce counting effects by multiple analysts (Strother et al., 2015); (d) LDT pollen influx to Lake Diamond (this study). Vegetation-based reconstructions indicative for temperature changes: (e) Acaena spp. pollen abundance from Lake Diamond (this study); (f) macrofossil species principal component analysis (PCA) axis 1 from Kanin Point peat bog (Van der Putten et al., 2012a); (g) GDGT-derived temperature reconstruction from Fan Lake (Foster et al., 2016); (h) Pediastrum abundance in Lake Diamond (this study). Glacier and ice core records (i) Diamond glacier variability reconstruction (Oppedal et al., 2018); (j) δD-derived temperature anomalies relative to the 1961–1990 mean from James Ross Island showing 100-year averages and calibration uncertainty (Mulvaney et al., 2012).
From ~2900 to 2600 cal yr BP (zone 4b), the Lake Diamond record is characterised by high sedimentation rates. Higher influx of sediment into the lake likely resulted from overflow of the alluvial fan. A high energy environment with subsequent sedimentation of glacial erosion products is also seen in the Diamond Bog (Figure 1c) macrofossil record where mosses are unable to cope with a high sediment influx (Xia et al., 2020). The decrease in lowland Acaena pollen, indicates a cold spell from 2900 to 2600 cal yr BP, while the sedimentological record of Lake Diamond (Figure 5h) reveals higher glacier variability from 2700 to 2200 cal yr BP (Oppedal et al., 2018). This offset might result from the fast response time of the vegetation on climate disturbances: during cold phases pollen production will be immediately affected, while glaciers have a maximum decadal lag time (Van der Bilt et al., 2016 and references therein). Furthermore, hydrological factors also affect glacier variability, and glacier growth is particularly dependent on winter precipitation (Van der Bilt et al., 2016). The Tønsberg record (Van der Putten et al., 2004) northwest of Lake Diamond, and a lake sediment record from Maiviken (Birnie, 1990); southeast of Lake Diamond (Figure 1b), both show a shift to wetter conditions starting around 2700 cal yr BP (2600 14C yr BP). The combination of both a wet and cool climate might have resulted in the increased Diamond glacier variability and increased input of glacial erosion products into the Diamond Bog and Lake. Most of the few palynological records on South Georgia show a similar timing of cold and wet conditions, for example as inferred from a decline in total native pollen influx indicating lower productivity combined with an increase of pollen from water-starwort Callitriche antarctica from 2710 cal yr BP in the Fan Lake record (Strother et al., 2015). The Kanin Point peat sequence (Figure 5e) indicates a change to colder conditions from ~3400 cal yr BP but shows the most pronounced Holocene cooling at 2200 cal yr BP, based on the change from a Warnstorfia fontinaliopsis dominated moss peat to a Polytrichum-Chorisodontium moss peat bank (Van der Putten et al., 2009). This highlights local climate variability. In Chile colder temperatures are inferred from glacier advances starting 2800 cal yr BP (2700 BP) (Van Geel et al., 2000 and references therein). Van Geel et al. (2000) hypothesise that this shift originates from a decrease in solar irradiance. This is supported by a spring/summer insolation-sensitive TEX86 based record of sea surface temperature that shows lowest Holocene temperature and insolation occurred between 2700 and 1700 cal yr BP west of the Antarctic Peninsula (Shevenell et al., 2011).
While the Tønsberg peat sequence indicates cool conditions lasting up to the present (Van der Putten et al., 2012b) and the James Ross Island ice-core record shows continued Late-Holocene cooling lasting up to 600 cal yr BP (Figure 5j), our record shows a short Late-Holocene warm interval. From ~1500 to 500 cal yr BP a peak abundance of Pediastrum and high LOI values indicate high within-lake productivity, suitable light conditions and nutrient supply, and increased temperatures during the growing season (Björck et al., 1993). Evidence for a warm interval is supported by reduced variability of local glaciers (Oppedal et al., 2018; Van der Bilt et al., 2017). The Kanin Point PC1 record (Figure 5f) does not show a clear signal in the Late-Holocene, although reduced peat preservation from 1800 cal yr BP could point to a drier and/or warmer climate (Van der Putten et al., 2012b). On Annenkov Island warmer conditions were inferred from 1670 to 710 cal yr BP (Strother et al., 2015) with a peak in warming from ~700 to 500 cal yr BP as reconstructed by the glycerol dialkyl glycerol tetraether (GDGT) record (Figure 5i) (Foster et al., 2016). Increased aquatic productivity is also seen in marine records around the Antarctic Peninsula (e.g. Bentley et al., 2009 and references therein; Shevenell et al., 2011). The timing of this warm interval coincides with the Medieval Warm Period as described in many Northern Hemisphere records and might suggest interhemispheric teleconnections (Broecker, 2001).
The rapid decline in Pediastrum abundance suggest a return to colder (summer) conditions on South Georgia starting from ~900 cal yr BP (Figure 5h). Further cooling is inferred from ~300 cal yr BP when we record a decline in lowland pollen abundance. The timing of these events coincides with reconstructions of glacier advances on South Georgia (Bentley et al., 2007; Rosqvist and Schuber, 2003) and the expression of the Little Ice Age as recorded in the Hamberg glacier reconstruction by Van der Bilt et al. (2017). The Lake Diamond palynological record suggests cool temperatures lasting up to the 1940s. The Diamond glacier reconstruction shows the end of the LIA and what could be the start of the current rapid warming from the 1980s (Oppedal et al., 2018) (Figure 5i). This most recent period in our data is covered by observational data on South Georgia. Thomas et al. (2018) constructed a daily temperature record from Grytviken which shows cooling from 1905 to 1920 and rapid warming starting around 1950, supporting our findings.
Long-distance pollen signal
The north-south distribution of the LDT taxa found in the Lake Diamond record generally comprises plants growing along the entire length of southern South America (Villa-Martínez and Moreno, 2007), making it difficult to infer past changes in the source region of LDT pollen and thus the position of the SHW belt across South America based on LDT species assemblages (S2). Furthermore, as opposed to South America, our record is situated in the core of the SHW belt both during the current summer and winter state of the SHW (Figure 1a). It could be that the SHW core belt also continuously covered South Georgia in the past. Therefore, most variability in LDT pollen input is expected to come from variations in SHW strength. Stronger wind speeds lead to further aerial pollen transport (Chamberlain, 1967), with likely more pollen grains reaching South Georgia from South America. Total pollen production from the source area is expected to have been relatively stable. However, shifts in the forest-steppe ecotone in southern Patagonia occurred throughout the Holocene (Mansilla et al., 2018), thereby affecting the taxonomic composition of the LDT pollen flux. The eastward extend of the precipitation-sensitive Nothofagus forest has varied substantially following dry/wet phases related to weak/strong SHW intervals (Mansilla et al., 2018; McCulloch et al., 2020; Moreno et al., 2010, 2014). This could amplify the Nothofagus pollen influx to Lake Diamond during periods of strong SHW.
The LDT pollen in our record does not show any signs of degradation, arguing for direct deposition into the lake during summer, or quick transportation from the catchment into the lake (Jessen et al., 2011).
The LDT pollen abundance of Lake Diamond shows a gradual increase throughout the Holocene (Figure 3). A similar trend is seen in pollen records on Annenkov Island (Figure 5c) (Strother et al., 2015) and at various sites in eastern Patagonia such as Lago Cardiel and Laguna Potrok Aike (Figure 5b) upwind from South Georgia, where it is ascribed to an increasing intensity of the SHW on the leeward side of the Andean mountain range (e.g. Markgraf et al., 2003; Mayr et al., 2007). Centennial scale variability of the SHW is superimposed on this main trend. In the Patagonian records this is shown by very variable (LDT) pollen input of a semi-periodic nature (Figure 5b). The Lake Diamond LDT pollen record shows more pronounced, aperiodic variations (Figure 5d) that could indicate stronger events in SHW variability as the record is located further away from the LDT pollen source region.
The lowermost pollen sample from the Lake Diamond record shows low LDT pollen influx, which could suggest a relatively weak SHW. However, this sample may also represent a mixed signal as it is taken at the top of the glacial till which may contain reworked material from older deposits and should be interpreted with caution. When the site was occupied by a peat bog from ~9900 to 9350 cal yr BP (zone 2) LDT pollen influx remained low, suggesting a weak SHW. This is in line with Mayr et al. (2007) who inferred a reduced SHW strength in Patagonia before ~9200 cal yr BP based on long-distance transport of pollen from Andean Forest Taxa (AFT) to Laguna Potrok Aike in the Patagonian lowlands (Figure 5b), and Moreno et al. (2018) who studied a pollen and charcoal record from Lago Cipresse. The agreement between the Lake Diamond and eastern Patagonian records suggests that the SHW intensity in the Southern Atlantic section was synchronous over a larger region.
The increasing abundance and diversity of LDT pollen in the Lake Diamond record from ~7000 to 3100 cal yr BP (zones 3 and 4a, Figure 3) suggest a strengthening of the SHW over South Georgia. A peak in LDT pollen influx is seen around 5700–5400 cal yr BP, corresponding with a large increase of AFT to Laguna Potrok Aike (Figure 5b). A stronger SHW during the mid-Holocene coincides with an intensification of the westerlies recorded by other palaeorecords in Patagonia (e.g. Moreno et al., 2018, 2021). The details of this are not fully known, but it has been suggested that this intensification is linked with a southward deflection of the SHW by the South Pacific High (Mayr et al., 2007 and references therein), while modelling results imply that this displacement can also be driven by a decrease in sea-ice (Hudson and Hewitson, 2001). The near absence of LDT pollen from ~3100 to 2800 cal yr BP (zone 4b) in the Lake Diamond record coincides with low LDT pollen influx in Fan Lake on Annenkov Island (Strother et al., 2015). Orographic effects can complicate the relationship between wind strength and pollen influx (Kilian and Lamy, 2012; Saunders et al., 2018). As the location of the Fan Lake record is less sheltered compared to Lake Diamond, we hypothesise that reduced wind speeds on the lee (eastern) side of the high Allardyce mountain range might have reduced the LDT pollen influx at our study site (Figure 1).
The main feature in the Lake Diamond LDT pollen record is a peak LDT pollen influx from ~2800 to 1500 cal yr BP (zone 4c and 4d), with pollen influx rates exceeding 70 grains cm−3 yr−1 suggesting a relatively large increase in SHW intensity. The high sedimentation rates and uncertainty in the age-depth model (outlier in 14C date) in this interval could have caused an exaggeration of the influx values. However, the peak in LDT pollen is also seen in the calculated pollen concentration values, independent of the age-depth model. Increased LDT pollen influx coincides with a peak in LDT pollen observed by Strother et al. (2015) at Fan Lake (Figure 5c). The pronounced shift to local colder conditions combined with an intensification of the SHW suggest a strong interaction between changes in SHW strength and local climate. Simultaneously in Patagonia increased SHW strength is inferred from pollen evidence showing a stepwise increase in Nothofagus woodland expansion around Lago Guanaco, as seen from the normalised Nothofagus/Poaceae index (Moreno et al., 2010). Eastward from South Georgia a stronger SHW is also recognised on Iles Crozet where an increase in MS values in the Morne Rouge sequence (Figure 5a) reflects higher input of windblown minerogenic material from c. 2800 cal yr BP (Van der Putten et al., 2008). This suggests a signal of SHW intensification in both the southern Atlantic and southern Indian Ocean.
A lower influx of LDT pollen in Lake Diamond from 1500 to 1000 cal yr BP indicates a return to weaker SHW. In contrast, Turney et al. (2016a) propose a period of strong SHW airflow between 2000 and 1000 cal yr BP based on LDT pollen and charcoal influx from a peat record in the Falkland Islands. Although they show a continuous high influx of both proxies during this interval, highest influx of Nothofagus pollen in particular, occurs concurrent with our LDT record before and after this period (Turney et al., 2016a). As the island is located relatively close to South America, we argue that their interpretation reflects a smaller scale variation in SHW strength as also seen in the Potrok Aike record in eastern Patagonia (Figure 5b) (Mayr et al., 2007).
Between ~1000 and 500 cal yr BP, we infer increasing SHW strength from LDT pollen influx. This is supported by findings from Moreno et al. (2010) that show that the SHW substantially strengthens around 51°S in Patagonia after 1000 cal yr BP based on Nothofagus woodland expansion, and Moy et al. (2008) who show increased evaporation in Lago Guanaco related to SHW strengthening.
In the uppermost pollen sample dated to ~AD 1941, nearly 40 years after the first arrival of the whalers, occurrences of pollen from non-native taxa such as Brassicaceae and Tilia is likely due to anthropogenic activity on the island. Several Brassicaceae species have since become established invasives on South Georgia (Floyd, 2019). Although various related species occur in South America, the large and heavy Brassicaceae pollen grains are unlikely to have been transported by wind. This also goes for Tilia pollen grains. Furthermore, Tilia is native to the Northern Hemisphere. Because this warm-loving tree species cannot grow in the harsh sub-Antarctic climate, Tilia pollen can be attributed to accidental transportation to the site by whalers or contamination in the laboratory. In case of the latter, all the exotic pollen grains might have been derived from contamination, but this seems unlikely as no other samples showed signs of contamination by pollen from European taxa.
Conclusion
The influx of long-distance transported pollen and changes in the native pollen composition in Lake Diamond provide the opportunity to study Southern Hemisphere Westerly Wind variability in connection to Holocene climate change. The LDT pollen record shows an overall increase in abundance throughout the Holocene. Peak LDT pollen influx occurs from 5700–5400, 2800–1500 and 1000–600 cal yr BP, interpreted as a strengthening of the SHW core belt. Peak influx of LDT pollen was found to concur with colder periods as inferred from the palynological and sedimentological record from 7200–5300, 2800–1500 and 900–0 cal yr BP. This suggests that SHW variation and temperature changes on South Georgia are highly connected.
As only the second study from South Georgia that interprets both the native and LDT pollen signal (Strother et al., 2015), our results help to finetune the palaeoclimate reconstruction on South Georgia. Resolving these local complications is essential for improving regional comparisons of past climate and SHW variability and makes it possible to link changes in the SHW’s behaviour to forcing mechanisms. The Lake Diamond record shows similar variability as palaeoclimatological records in eastern Patagonia, indicating synchronous regional-wide changes in both palaeoclimate and SHW variability.
Supplemental Material
sj-doc-1-hol-10.1177_09596836211060495 – Supplemental material for Pollen evidence of variations in Holocene climate and Southern Hemisphere Westerly Wind strength on sub-Antarctic South Georgia
Supplemental material, sj-doc-1-hol-10.1177_09596836211060495 for Pollen evidence of variations in Holocene climate and Southern Hemisphere Westerly Wind strength on sub-Antarctic South Georgia by Maaike Zwier, Willem GM van der Bilt, Henko de Stigter and Anne E Bjune in The Holocene
Supplemental Material
sj-jpg-1-hol-10.1177_09596836211060495 – Supplemental material for Pollen evidence of variations in Holocene climate and Southern Hemisphere Westerly Wind strength on sub-Antarctic South Georgia
Supplemental material, sj-jpg-1-hol-10.1177_09596836211060495 for Pollen evidence of variations in Holocene climate and Southern Hemisphere Westerly Wind strength on sub-Antarctic South Georgia by Maaike Zwier, Willem GM van der Bilt, Henko de Stigter and Anne E Bjune in The Holocene
Footnotes
Acknowledgements
We would like to thank Jostein Bakke and Eivind Støren for their thoughts, ideas, and assistance in the sediment laboratory. We also thank Jostein Bakke, Åsmund Bakke and Sunniva S. Vatle for their contributions in the field and Piet van Gaever for his help with the 210Pb analysis. Many thanks to Nathalie van der Putten and Ulrich Salzman for kindly sharing the data from their study sites. We thank the SHIFTS project and its project members for access to the data already available from Lake Diamond. We are also very grateful for the critical and constructive comments from two anonymous reviewers that helped improve this manuscript.
Author contributions
MZ: proxy analysis, data analysis, generating figures, writing original version of the manuscript. AEB: conceptualising ideas, fieldwork, manuscript comments. WGMB: LOI analysis, draft figures, manuscript comments. HS: construction of 210Pb age-depth model, manuscript comments.
Data availability
Palynological data from this manuscript will be uploaded into the NEOTOMA palaeoecological database upon publication.
Funding
The author(s) disclosed receipt of the following financial support for the research, authorship, and/or publication of this article: The SHIFTS project was funded by the Norwegian Research Council (NFR grant nr. 210004). Fieldwork was supported by funding to AEB from L. Meltzers Høyskolefond in 2011 and MZ was supported by the Olaf Grolle Olsens legat til Universitetet i Bergen med tilførsel av arv etter Miranda Bødtker.
Supplemental material
Supplemental material for this article is available online.
References
Supplementary Material
Please find the following supplemental material available below.
For Open Access articles published under a Creative Commons License, all supplemental material carries the same license as the article it is associated with.
For non-Open Access articles published, all supplemental material carries a non-exclusive license, and permission requests for re-use of supplemental material or any part of supplemental material shall be sent directly to the copyright owner as specified in the copyright notice associated with the article.