
Abstract
We combined biostratigraphical analyses, archaeological surveys, and Glacial Isostatic Adjustment (GIA) models to provide new insights into the relative sea-level evolution in the northeastern Aegean Sea (eastern Mediterranean). In this area, characterized by a very complex tectonic pattern, we produced a new typology of sea-level index point, based on the foraminiferal associations found in transgressive marine facies. Our results agree with the sea-level history previously produced in this region, therefore confirming the validity of this new type of index point. The expanded dataset presented in this paper further demonstrates a continuous Holocene RSL rise in this portion of the Aegean Sea. Comparing the new RSL record with the available geophysical predictions of sea-level evolution indicates that the crustal subsidence of the Samothraki Plateau and the North Aegean Trough played a major role in controlling millennial-scale sea-level evolution in the area. This major subsidence rate needs to be taken into account in the preparation of local future scenarios of sea-level rise in the coming decades.
Highlights
Relative sea level in the Northern Aegean region is today at its Holocene peak
Assemblage of benthic foraminifers established as a valid sea-level index point
Field-based data challenge existing GIA models
Archeological sea-level limiting points help to clarify the sea-level evolution
Introduction
A number of factors drive sea-level changes (eustatic, isostatic, steric and geotectonic factors, sediment supply, coastal dynamics, and sediment compaction) at diverse spatial and temporal timescales (Benjamin et al., 2017; Khan et al., 2017; Lambeck and Purcell, 2005; Shennan et al., 2018). This is especially true for the region of the Meriç delta on the border between Greece and Turkey. Together with the Nestos, Kompsatos, and Lissos rivers, the Meriç (Evros, Maritsa; ancient name: Hebros) constitutes one of the largest sources of fresh water and sediment load to the northern Aegean Sea (Poulos and Kotinas, 2020; Sakellariou and Galanidou, 2015; Uckac et al., 2006; Figures 1 and 2). 1
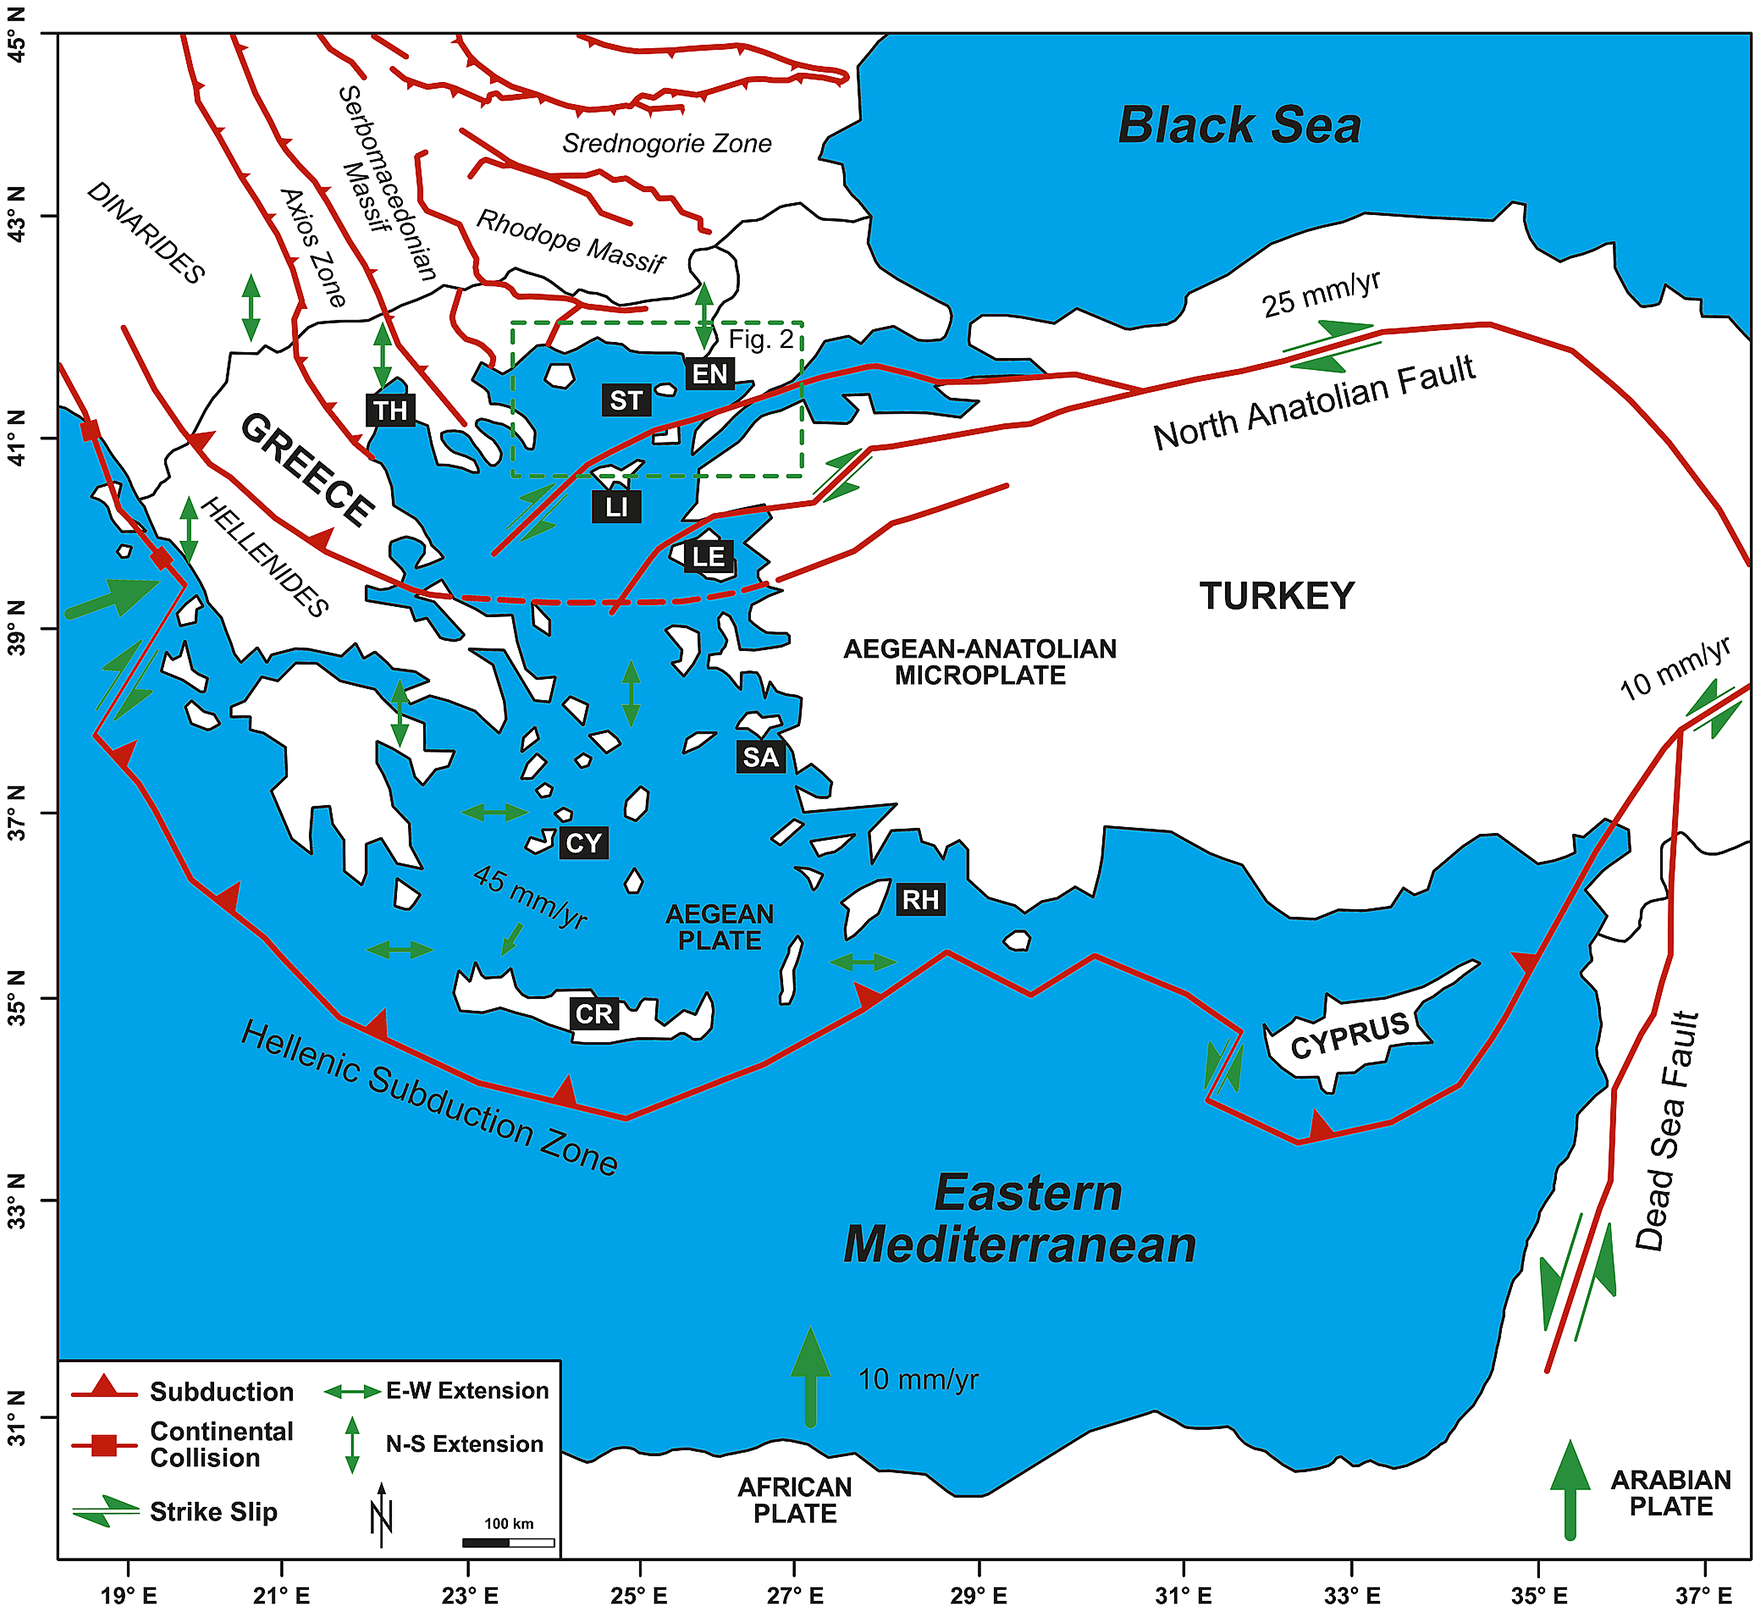
Tectonic overview of the Aegean Region.
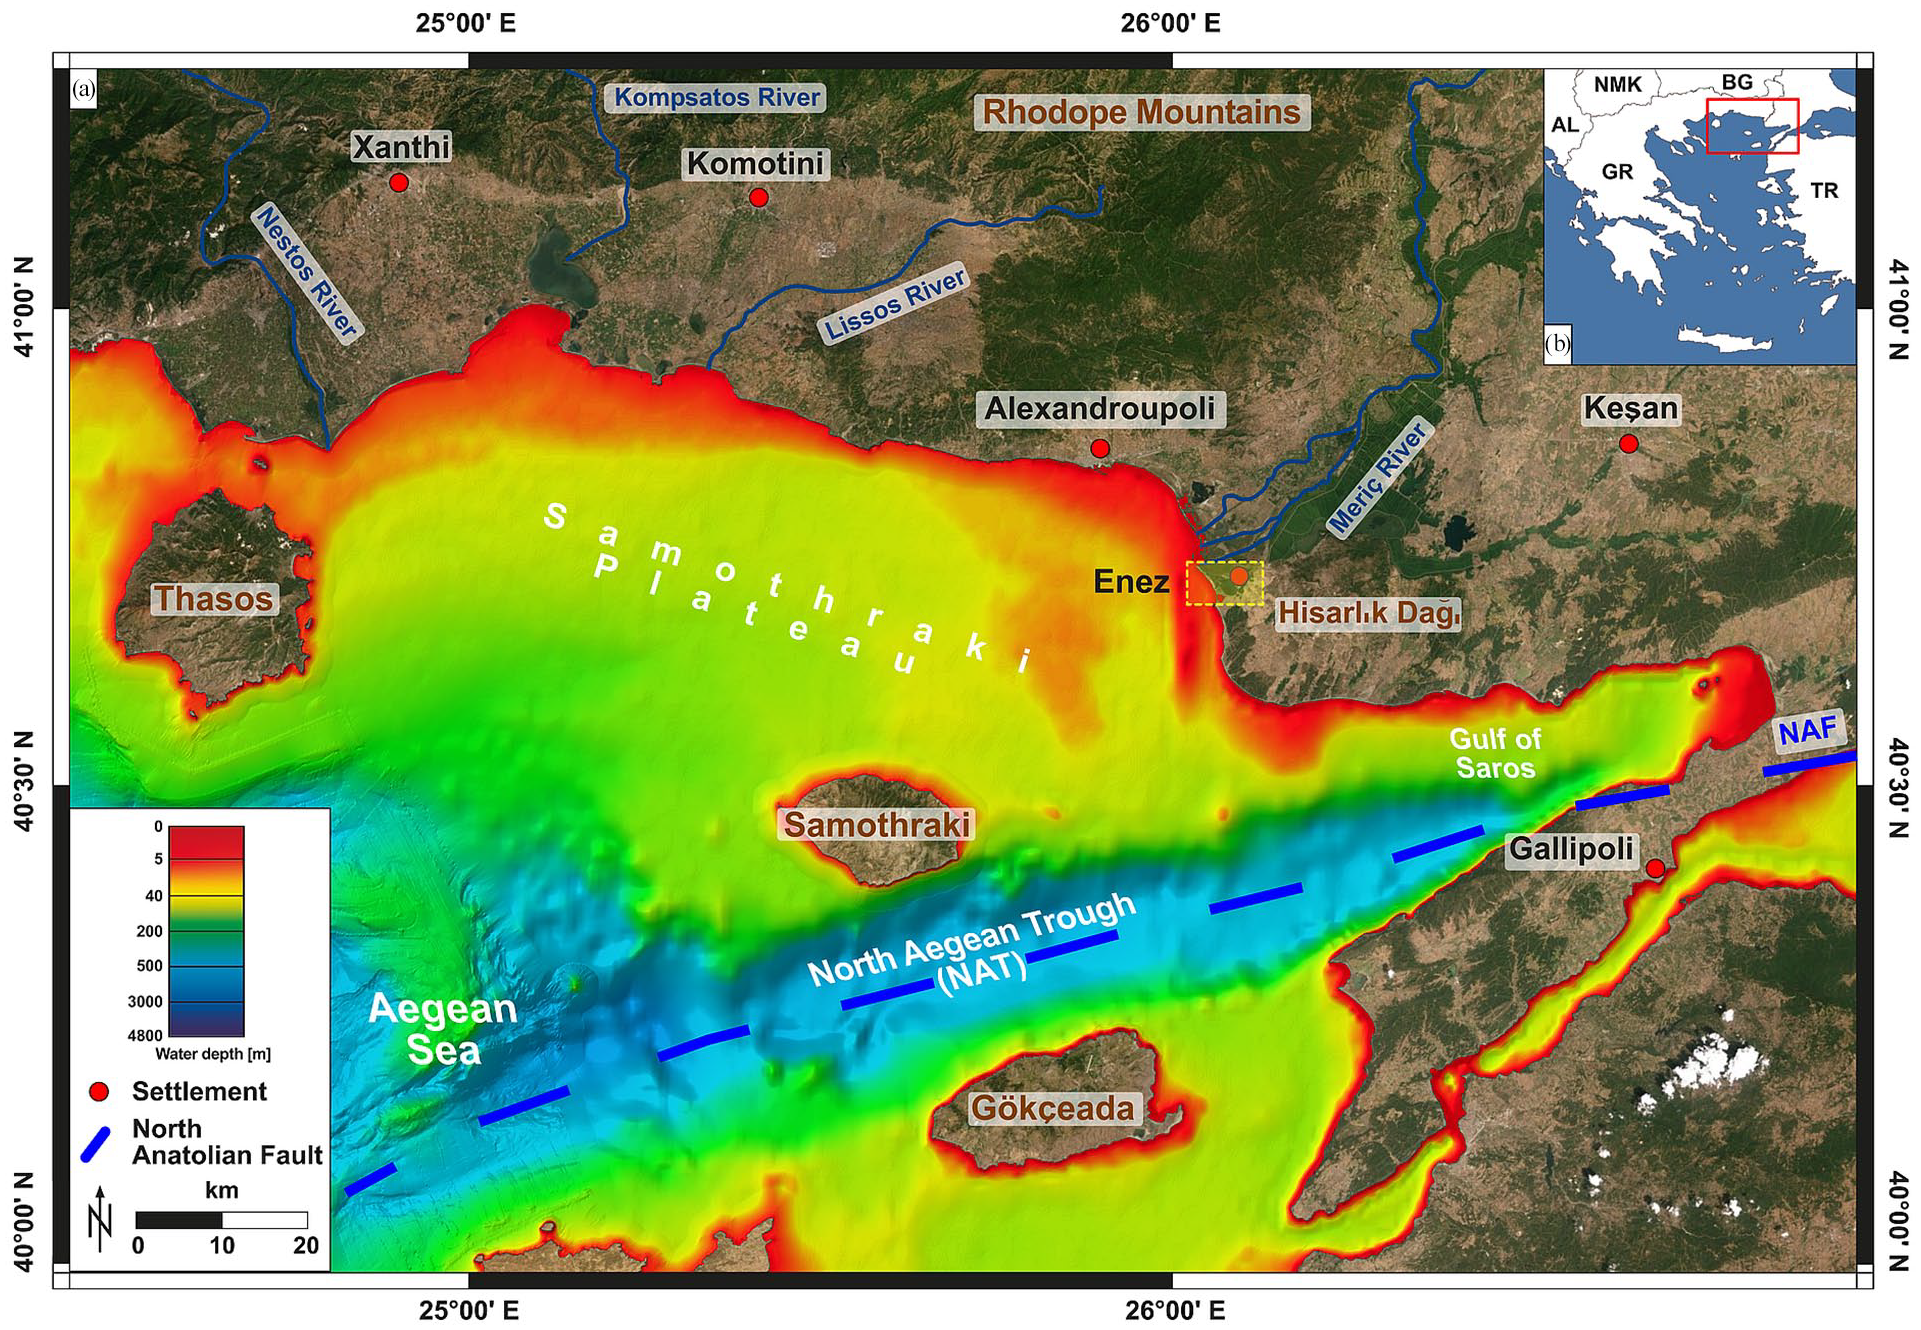
Research area in the northern Aegean between the Island of Thasos and the Gulf of Saros. (a) Overview map with locations mentioned in the text and the four major rivers of the region (Nestos, Kompsatos, Lissos, and Meriç), which have their sources in the Rila and Rhodope Mountains and deposit their high sediment load on the shallow shelf of the Samothraki Plateau. (b) Position of Figure 2a on a general map of the Aegean Sea and its bordering countries.
Like the adjacent Samothraki Plateau – a very shallow portion of the Northern Aegean with a bathymetry <100 m and extending between the islands of Thasos and Samothraki and the Enez region – the Meriç delta has been significantly affected by sea-level fluctuations during the Quaternary (Sakellariou and Galanidou, 2015; Theocharis and Georgopoulos, 1993). The Samothraki Plateau was dry, presenting a near-coastal dune landscape during most of the Quaternary glacial periods and, in particular, at the end of the Last Glacial Maximum (LGM, around 21 ka BP), when sea level was at least 120 m below the present datum (Lambeck and Purcell, 2005; Papoulia, 2017).
This paper provides new insights into the area’s Relative Sea-Level (RSL) history, where just a few studies have been conducted so far. In particular, the hypothesis of an isostatic-driven mid-Holocene sea-level highstand between 6000 and 3500 cal yrs BP that exceeded present mean sea level (Brückner et al., 2006; Kayan, 1988; Kraft et al., 1980) was recently confuted by the production of new RSL data (Vacchi et al., 2014). These new analyses indicate a continuous rise of the RSL in the North Aegean throughout the Holocene period. However, the different mechanisms, which controlled sea-level evolution in recent millennia in this portion of the Aegean, are poorly constrained. To fill this knowledge gap, the results of geoarcheological (Brückner et al., 2015) and geophysical (Schwardt et al., 2020; Seeliger et al., 2018) studies offer possibilities to produce new relative sea-level data and furnish fresh perspectives on its evolution.
While reconstructing the coastal evolution of the ancient harbor city of Elaia (Feuser et al., 2018; Seeliger et al., 2019), the maritime satellite of Pergamon (today Bergama/Turkey), Seeliger et al. (2017) established an RSL curve for the area by presenting a new sea-level indicator, based on Holocene foraminiferal successions. The reconstructed RSL curve meshes well with results from studies of adjacent Aegean regions (Seeliger et al., 2017) and shows – in accordance with Vacchi et al. (2014) – that RSL has never been higher than present during the Holocene.
To investigate the relative sea-level evolution in a different area of the Aegean, this study aims to: (I) validate this “new” sea-level indicator in a different area of the Aegean; (II) establish a regional RSL curve; and (III) compare and contrast this curve with other field-based RSL data and modeled geophysical data based on available Glacial Isostatic Adjustment (GIA) models for the Aegean region.
Geographical and geological setting
The study area – around the city of Enez (ancient Ainos) – is located in the westernmost part of Turkish Thrace (Figures 1 and 2), in direct vicinity to the river mouth of the Meriç.
In general, the Nothern Aegean region’s geotectonic setting is triggered by the northward drift of the Arabian microplate that pushes the Aegean-Anatolian microplate westwards along the dextral strike-slip North Anatolian Fault (NAF; Figure 1). As a westward prolongation of the NAF into the Aegean Sea acts the North Aegean Trough (NAT), which comprises a series of deep basins developed due to transtension along the westernmost parts of the NAF reaching water depths of 1000 m (Figure 2). The NAT is the border between the relatively non-deforming but, roughly speaking, subsiding North Aegean Shelf region, including the shallow Samothraki Plateau from the deforming Aegean to its south. The North Aegean shores south of the Rhodope Massif generally show long-term subsidence. However, due to its fragmentation into different orogenetic blocks (Figure 1), the subsidence rates are not uniform between Thessaloniki and Enez (Galanidou et al., 2020; Jackson, 1994). In contrast, fault-bounded crustal blocks, such as the islands of Samothraki and Thasos and the Peninsula of Chalkidiki, act differently from this regional trend. They show tectonic uplift attested by human traces of Pleistocene age on Thasos and at Chalkidiki (Figures 1 and 2; Armijo et al., 1999; Brückner et al., 2015; Maravelis et al., 2015; Sakellariou and Galanidou, 2015).
The Meriç debouches into the Aegean Sea by creating an extensive deltaic floodplain of 180 km2 between the Greek city of Alexandroupoli and the Turkish city of Enez (Figures 2 and 3; Barut et al., 2015). The Holocene evolution of the Meriç delta is complex and unclear at present. This knowledge gap is compounded by the delta’s position on the border between Turkey and Greece, which renders transboundary investigations challenging. Due to the delta’s complexity, the use of the sea-level indicator established by Seeliger et al. (2017) is particularly suitable, thanks notably to the stable bedrock of the castle hill of Ainos. Immediately in front of the Meriç River mouth, the Samothraki Plateau extends between the islands of Thasos and Samothraki with water depths <100 m. The entire region is fed with fresh water and sediments from the Nestos, Kompsatos, Lissos, and Meriç rivers, all sourced in the Rila and Rhodope Mountains, north of the Greek cities Xanthi, Komotini, and Alexandroupoli (Poulos and Kotinas, 2020; Saltogianni et al., 2016; Figures 1 and 2).
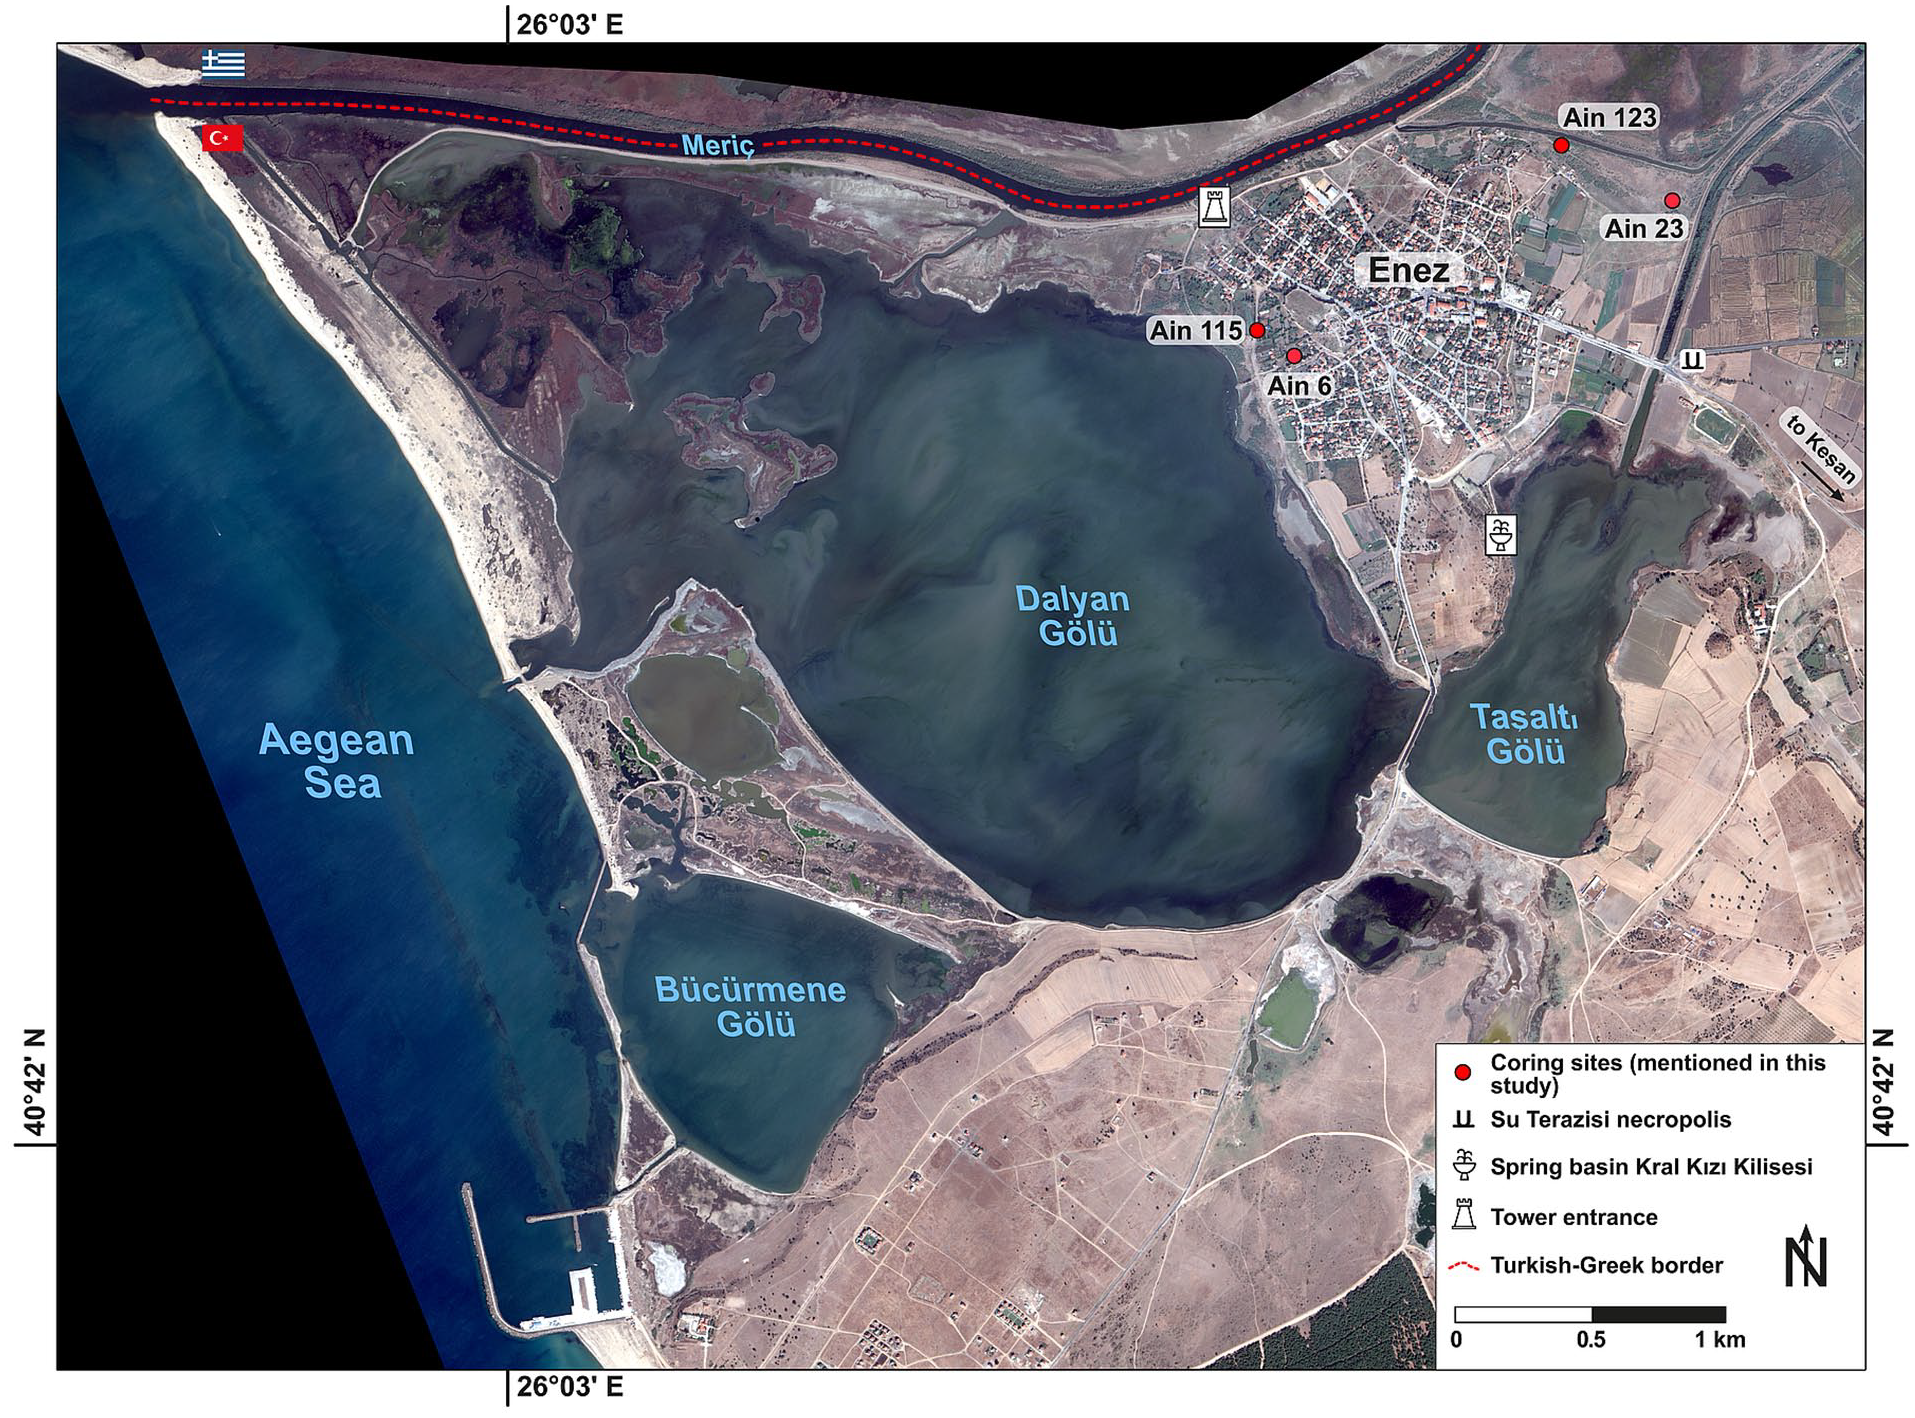
The coastal setting of Enez (Ainos). The locations of the corings presented in this study (Ain 6, 23, 115, and 123) are shown. Furthermore, the position of the used archeological sea-level limiting points is marked. Based on Worldview2; acquired 04th October 2012; composition of bands 1, 3, 6.
Materials and methods
Between 2011 and 2017, sediment cores were taken to reconstruct the palaeoenvironmental evolution of the area close to the Meriç river mouth. This study includes the data of three of them (Ain 6, 115, and 123; Figure 3). These cores hit bedrock, topped by the marine transgression, and are used for relative sea-level reconstructions based on the indicator described by (Seeliger et al., 2017; Brückner et al., 2015; Pint et al., 2015; Rabbel et al., 2015; Schwardt et al., 2020; Seeliger et al., 2018).
Fieldwork and geodesy
Coring was performed using an Atlas Copco Cobra TT vibracorer. Open steel auger heads (outer diameters: 6 and 5 cm, respectively) were used to probe the stratigraphy. In the field, the cores were sampled at constant intervals (10–15 cm). DGPS leveling (<2 cm resolution) was performed using a Topcon HIPER Pro device. The local coordinate system (LCS) applied in Enez and used in this study is based on UTM (zone 35N) using WGS84. Ellipsoidal heights were transformed to orthometric ones by applying the geoid model EGG97. The altitude correction of the LCS is undergirded according to the ITRF08 standard by processing the data with the web service of the Geodetic Survey Division, Canada Centre for Remote Sensing, Natural Resources Canada. Our sea-level measurements by DGPS, during fieldwork in 2013–2015, supported the LCS sea-level heights. Furthermore, these DGPS measurements revealed a micro-tidal regime (tidal range: approx. 20 cm), common for the Aegean Sea (Seeliger et al., 2019; Vacchi et al., 2012). All elevations are stated in m b.s. (meters below the surface), m a.s.l. (meters above present-day mean sea level) or m b.s.l. (meters below present-day mean sea level).
Laboratory analyses
Grain-size analyses were conducted on the retrieved sediment samples (Bartz et al., 2017; Ernst, 1970; Ginau et al., 2018). Samples were air-dried, ground with a mortar and pestle, and sieved to separate the ⩽2 mm grain-size fraction for further analyses. The organic content was decomposed using hydrogen peroxide (H2O2; concentration: 15%). Sodium pyrophosphate (Na4P2O7; concentration: 47 g/l) was used as a dispersant before laser-based grain-size analyses were performed (Beckman Coulter LS13320). For the calculation of grain-size parameters after Folk and Ward (1957), the GRADISTAT software (Blott and Pye, 2001) was applied.
Up to 30 elements were determined using a portable XRF spectrometer (Niton XL3t 980). To ensure comparability of all XRF data and to reduce grain-size dependencies, each sample was ground to powder in a ball mill (Retsch PM 400) and subsequently pressed to pills before being measured (Ginau et al., 2018, 2020; Seeliger et al., 2018; Vött et al., 2011).
Due to the significant amount of XRF data, a Principal-Component Analysis (PCA) was performed using the SPSS 25 software package to isolate the most important independent factors. The Kaiser–Meyer–Olkin measure of sampling adequacy was 0.779, representing a good factor analysis, and Bartlett’s Test of Sphericity was significant (p < 0.000), indicating that correlations between parameters were robust enough for a PCA. Only factors with eigenvalues of ⩾1 were taken into consideration (Guttman, 1954; Kaiser, 1960). Examination of Kaiser’s criteria and the scree plot yielded empirical justification for retaining two factors with eigenvalues exceeding 1 that accounted for 90.891 of the total variance. Among the factor solutions, the varimax-rotated two-factor solution yielded the most interpretable one, and most parameters loaded highly on only one of the two factors.
Foraminifers and ostracods were prepared by wet-sieving 1 cm³ samples through a 100 μm mesh to concentrate foraminiferal tests. At least 300 individual tests were subsequently picked from the retained sediment, under a stereoscopic microscope. For samples in which there were <300 specimens, all tests and valves were picked. Species were identified according to Cimerman and Langer (1991) and Meriç et al. (2004) for foraminifera, and following Bonaduce et al. (1975) and Joachim and Langer (2008) for ostracoda.
Dating
The chronological framework of the cores is based on 14C-AMS age estimates. 14C-AMS dating was done at the Centre for Applied Isotope Studies, University of Georgia, Athens, USA (lab code: UGAMS) and the Beta Analytic Inc. Laboratory, Miami, USA (lab code: BETA). When possible, we used soft charcoal that is not prone to reworking. Otherwise, we bulk-sampled about 50 foraminiferal tests of the genus Ammonia for dating. Depending on the δ13C value, each sample was calibrated using either the IntCal20 or the MARINE20 calibration curves of the recent Calib 8.20 (http://calib.org/calib) software (Reimer et al., 2020) with a marine reservoir effect of 390 ± 85 years and a ΔR of 35 ± 70 years (Siani et al., 2000). The latter used marine shells of known age sampled on the Dardanelles’ shores and later stored in the Muséum national d’Histoire naturelle (Paris) to calculate the local marine reservoir age and its ΔR. However, because the spatio-temporal variation of the marine reservoir effect for the Aegean Sea – as well as worldwide – is still not fully understood, the 14C-ages of marine carbonates should be interpreted carefully. Ages are reported in cal yrs BP (calibrated years before present; present = AD 1950) using a 2σ-confidence interval (Table 1).
Radiocarbon datasheet. 14C-AMS dating was carried out at Centre for Applied Isotope Studies, University of Georgia, Athens, USA (lab code: UGAMS) and the Beta Analytic Inc. Laboratory, Miami, USA (lab code: BETA). All ages were calibrated with the IntCal20 or Marine20 calibration curves depending on sample δ13C using the recent Calib 8.20 software (Reimer et al., 2020). A marine reservoir effect of 390 ± 85 years and a ΔR of 35 ± 70 years (Siani et al., 2000) were applied. The calibrated ages are presented in calendar years BP with a 2σ confidence interval.
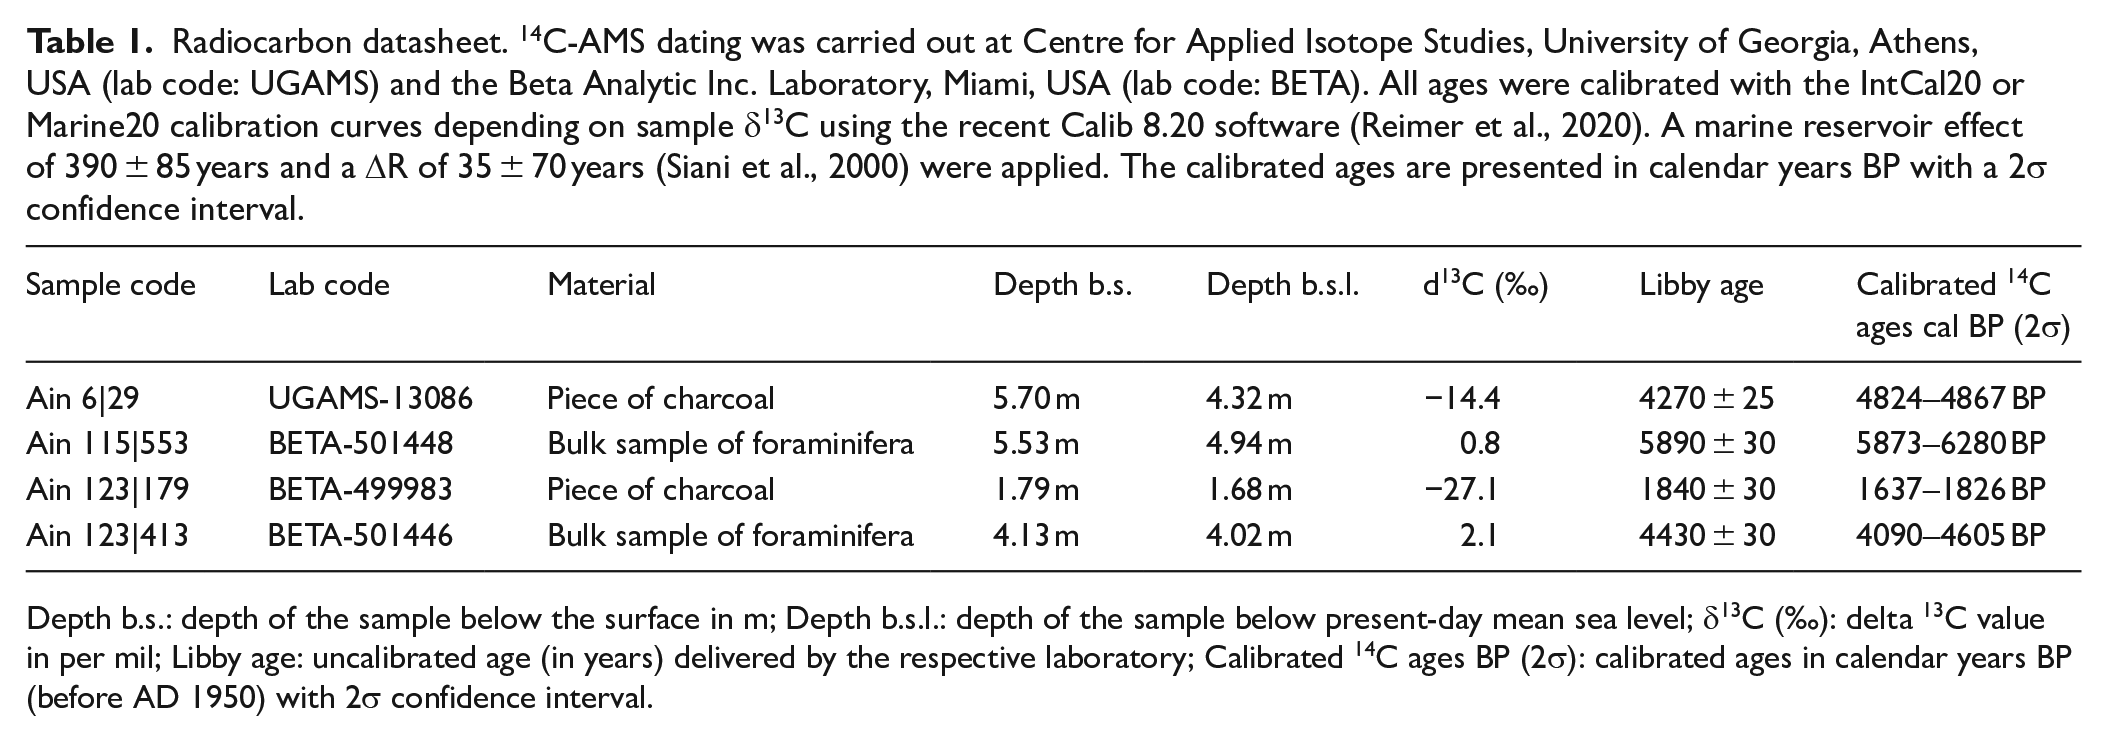
Depth b.s.: depth of the sample below the surface in m; Depth b.s.l.: depth of the sample below present-day mean sea level; δ13C (‰): delta 13C value in per mil; Libby age: uncalibrated age (in years) delivered by the respective laboratory; Calibrated 14C ages BP (2σ): calibrated ages in calendar years BP (before AD 1950) with 2σ confidence interval.
Sea-level indicators
Sea-level index point based on Seeliger et al
Seeliger et al. (2017) present a novel approach to determine the position of former relative sea levels in sediment cores with transgressive contacts above bedrock, based on foraminiferal associations (Figure 4). The first occurrence of foraminifera in the sediments – for example, Ammonia compacta and Elphidium crispum – deposited during the Holocene marine transgression shows very robust species able to withstand the high-energy environment (Figure 4, unit II). Due to wash effects in the surf zone, they are transported to the lowermost part of the supratidal zone, directly above mean-sea level. Sea-level rise completely drowned the investigated site, attested by a shallow-marine association of foraminifera (Rosalina globularis, Elphidium complanatum, Asterigerinata mamilla, and Lobatula lobatula). The first occurrence of this association in the stratigraphy acts as a reliable sea-level indicator. Since the presented foraminifera are benthic species, the indicative meaning – that is, the quantitative relationship between the sample and the contemporary mean sea level (Shennan et al., 2018) – ranges from the mean low water (LWL) to the mean high water (HWL) (Figure 4, unit III).
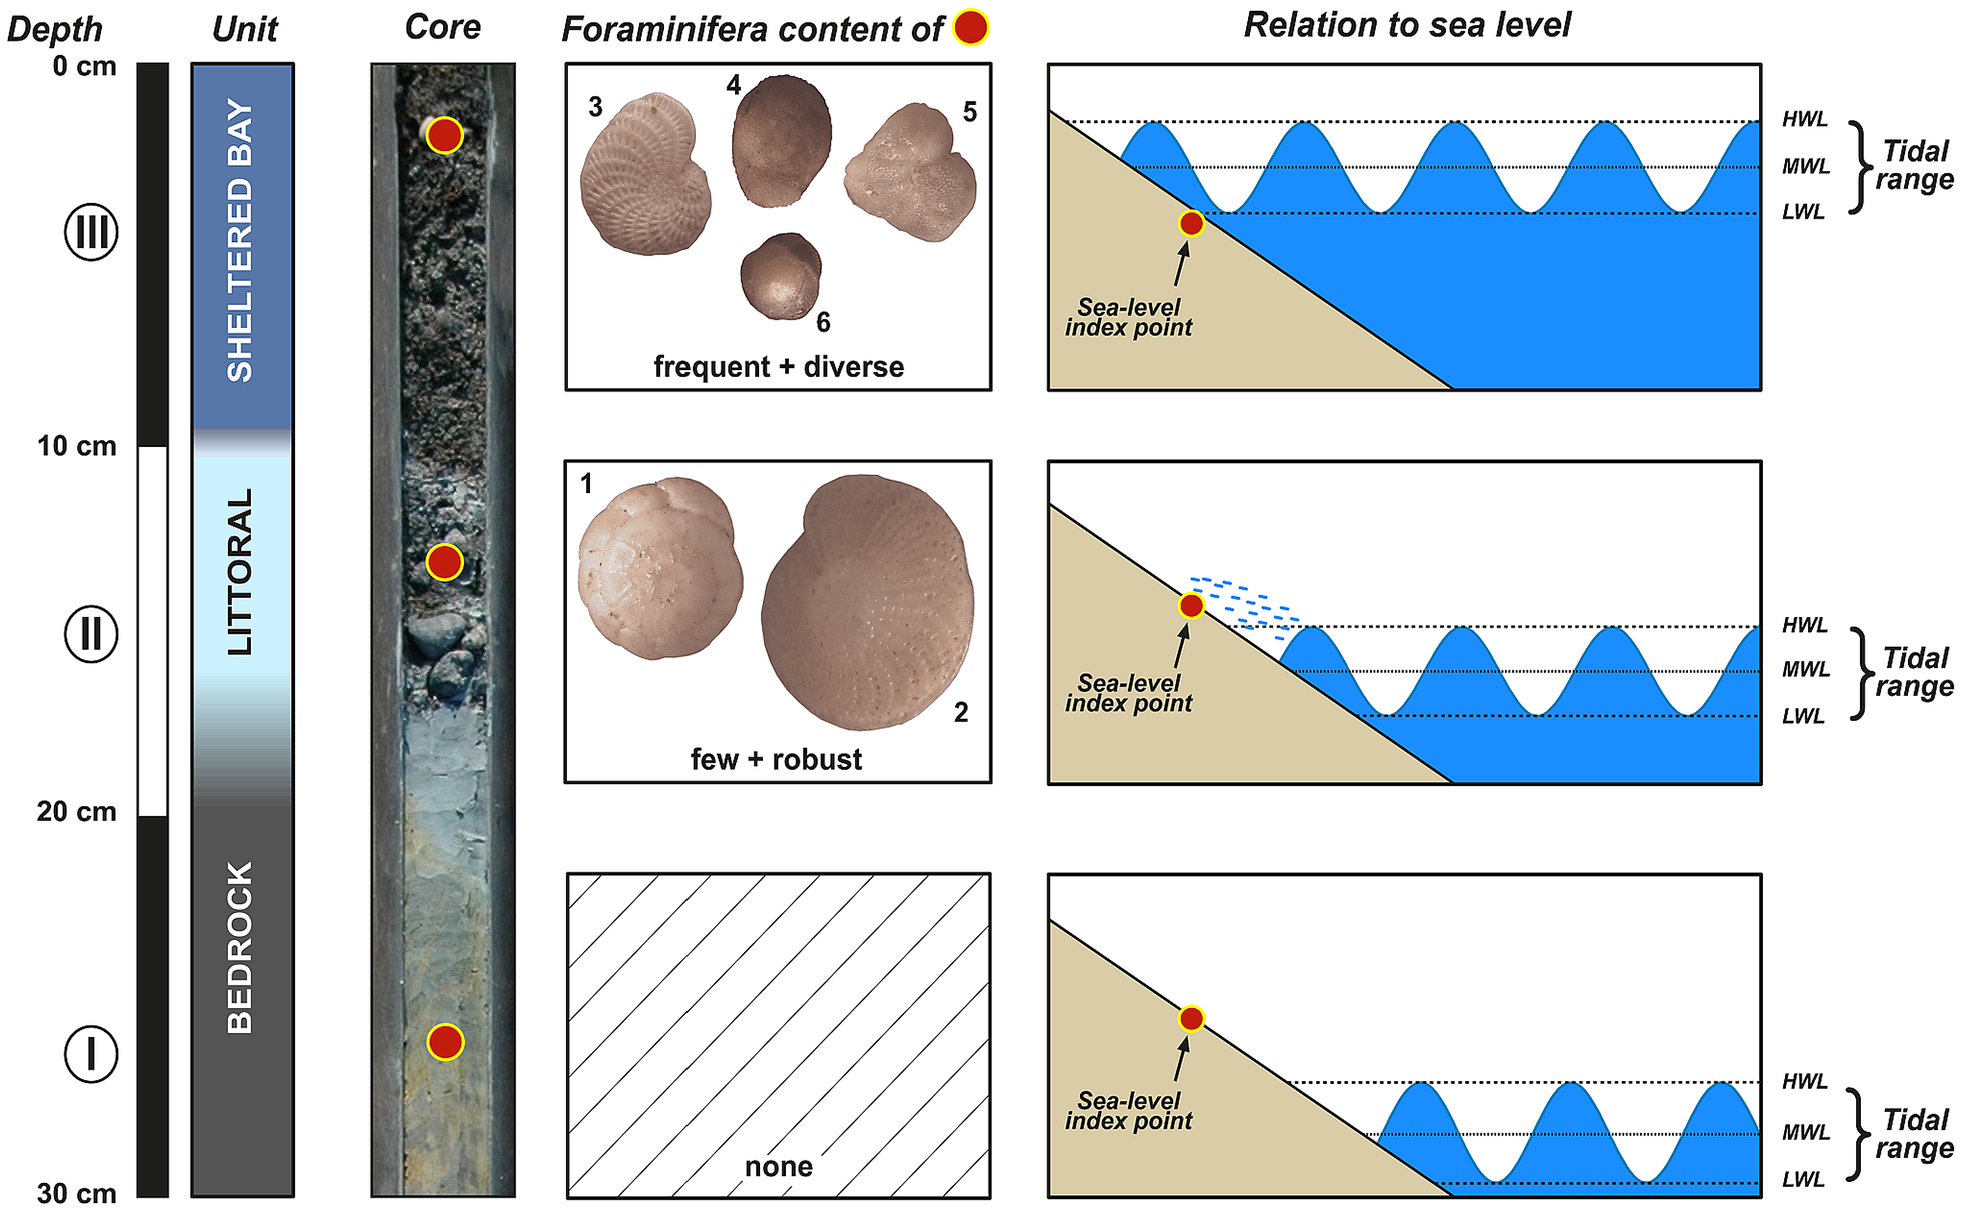
Foraminifera association in the context of the transgressive contact. (I) Before the onset of transgression. (II) The littoral facies with foraminifera Ammonia compacta (1) and Elphidium crispum (2). (III) Beginning of the shallow marine facies with Elphidium complanatum (3), Rosalina globularis (4), Lobatula lobatula (5), and Asterigerinata mamilla (6). The lowermost sample with characteristics of (III) was radiocarbon dated to gain the age of this sea-level index point. As the presented foraminifera are benthic species, the indicative meaning (e.g. the quantitative relationship between the sample and the present-day mean sea level (Shennan et al., 2018) ranges from the mean low water (LWL) to the mean high water (HWL).
Since the sampling location is close to the bedrock, sediment compaction for this type of sea-level indicator is minor. This study adopted this approach and used charcoal and foraminifera for radiocarbon dating (Table 1).
Archeological sea-level limiting points
Furthermore, several archeological discoveries provide information about sea-level variations (Auriemma and Solinas, 2009; Khan et al., 2015, 2019; Vacchi et al., 2016, 2020; Figure 3). Judging by their chronology and function in Enez, these are: (1) a necropolis outside the ancient city walls; (2) a spring tapping inside a Byzantine church (Kral Kızı Kilisesi); and (3) the entrance level of a Late Byzantine fortification tower.
Su Terazisi necropolis
To the east of Enez, where the modern road to Keşan exits the city, the so-called “Su Terazisi” (“Water-Terrace”) necropolis has been excavated (Figure 3). It includes inhumation and incineration graves of different types covering the whole period from the Greek Archaic period to Late Antiquity. The remains of the oldest unearthed tombs are of Archaic and Classical age (2650–2550 BP; seventh century BC). The base level of the deepest one was 0.5 m b.s.l. Initially, they were definitely placed on solid ground above sea level (we assume at least 1 m above the former sea level). Their position acts as a maximum limiting point of the Archaic and Classical sea level of in sum 1.5 m b.s.l. The graves from younger eras are situated above the present-day sea level and do not refine the RSL history.
Spring tapping inside a Byzantine church (Kral Kızı Kilisesi)
Inside the Kral Kızı Kilisesi constructed on the western shore of the Taşaltı lagoon, two fresh-water spring basins were found used for religious purposes (Figure 3). The lowest point of the lower basin is 0.69 m b.s.l. It is assumed that these tappings were constructed above the former relative sea level to avoid the water turning brackish. Auriemma and Solinas (2009) discussed the indicative meaning of wells similar to these but stated that this is site-dependent. Therefore, we use the spring at Enez as an approximation that sea level was below that height. The age of the basin is constrained to older than 750 BP (AD 1200).
The entrance of a Late Byzantine tower in the northwest of modern Enez
In the northwest of Enez, directly at the Meriç River’s southernmost branch, the ruins of a 10.7 m × 8.6 m large tower are located. Having been constructed on a bedrock outcrop, it is still standing, with two remaining floors; it is, however, in a degraded condition. The building technique and spolia of Late Byzantine age (600–500 BP; 1350–1450 AD) date the tower. Its entrance to the north is well preserved and leveled 0.25 m a.s.l. Auriemma and Solinas (2009) and Antonioli et al. (2007) stated a general value of about 0.6 m above former relative sea level for this type of public buildings, which fits our assumptions for Enez of 0.5–1 m. In sum, we can state a relative sea level of at least 0.25–0.75 m b.s.l. for the Late Byzantine period.
GIA modeling
To estimate the expected variation of RSL in the study area, we simulated the Glacial Isostatic Adjustment (GIA) process in response to the melting of the Late-Pleistocene ice sheets, based on global models currently available in the literature. In particular, we used the GIA models ICE-6G(VM5a) by Peltier et al. (2015) and the one developed at the Australian National University by Kurt Lambeck and collaborators (see, e.g. Lambeck et al., 2003; Nakada and Lambeck, 1987), hereafter referred to as ANU. The ice-time history of these three GIA models was implemented in the Sea-Level Equation solver SELEN4 (Spada and Melini, 2019), which has been solved on a global grid to maximum harmonic degree Lmax = 256. For the ICE model, we adopted the viscosity profile given by the author, while for ANU we employed a lithospheric thickness of 90 km, an upper-mantle and lower-mantle viscosity of 0.5 × 10²¹ Pa s and of 1022 Pa s, respectively, according to the range of parameters provided in Lambeck et al. (2017). In our modeling, we account for Earth-rotational variations, the migration of the shorelines in response to sea-level rise, and the transition from grounded to floating ice. For details, see Melini and Spada (2019) as well as Spada and Melini (2019) and the related Supplemental Material.
Results
As all three selected corings present similar sedimentological units, Ain 123 was selected as a case example (Figures 3 and 5).
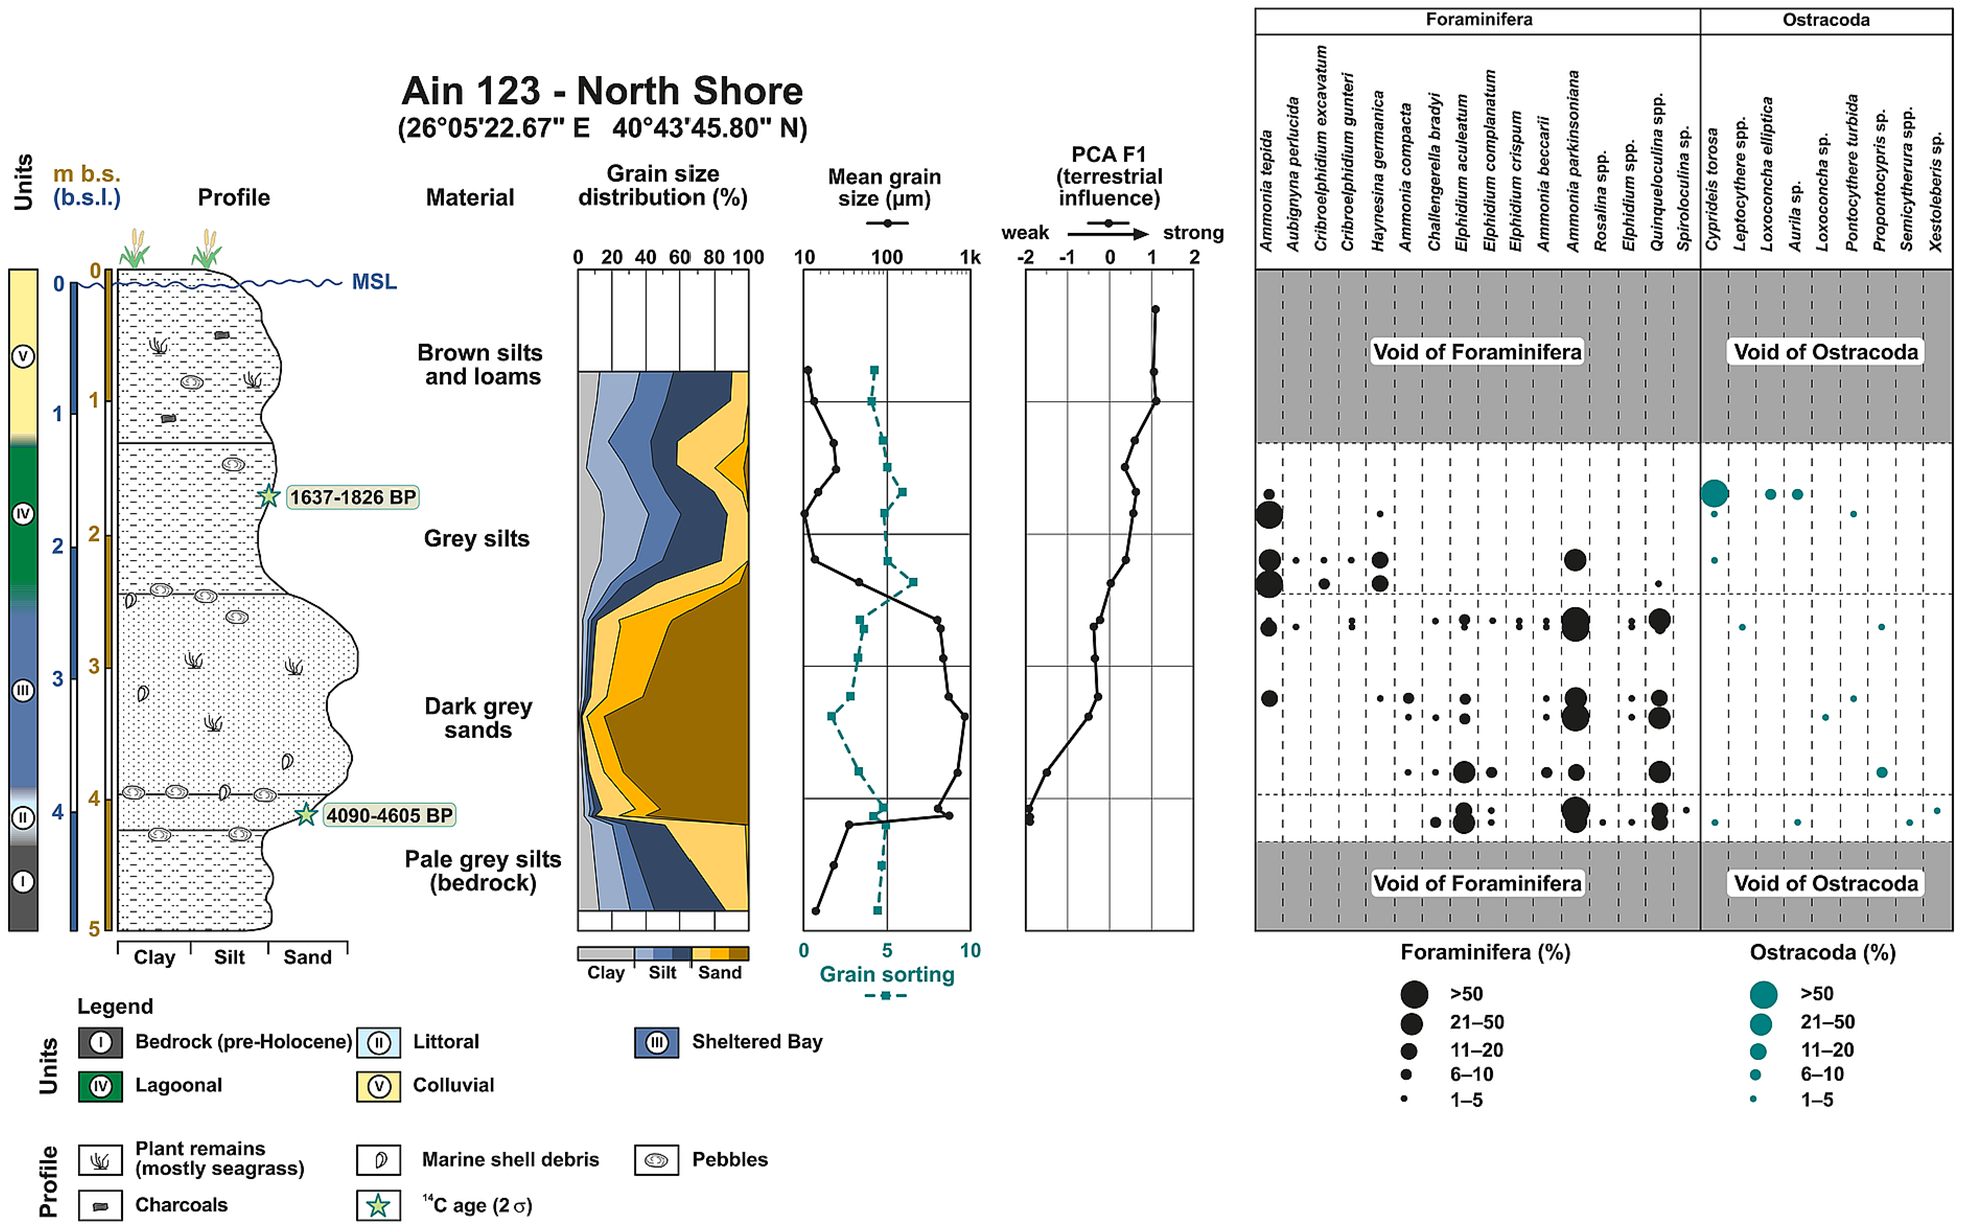
Sedimentary units, geochemical and microfaunal records of core Ain 123 at the northern shore of Enez (for location, see Figure 3). The abundance of ostracoda and foraminifera is given semi-quantitatively. The PCA F1 curve is based on the elements Ti, Rb, Al, Fe, and Pb reflecting terrestrial processes (see supplemental Appendix A1).
Results of core Ain 123
Ain 123 (26°05′22.67″E; 40°43′45.80″N; final depth: 5 m b.s.; elevation: 0.11 m a.s.l.; Figures 3 and 5) is situated in the very north of Enez, close to the adjacent swampy-marsh area. Based on the microfaunal associations and the sedimentological results, the profile was divided into five (I–V) units (Figure 5).
The lowermost unit I – pre-Holocene, weathered limestone – was encountered at 4.22 m b.s. (4.11 m b.s.l.).
The overlying unit II extends up to 3.97 m b.s. (3.86 m b.s.l.) and consists of dark gray, well-sorted sands (mean 396–526 µm). PCA factor 1 (PCA F1), which represents the terrestrial influence based on Ti, Rb, Al, Fe, and Pb loadings, shows the lowest values of the entire profile (supplemental Appendix A1). Unit II is interspersed with relatively large pebbles (<3 cm) and some marine-shell debris. The foraminiferal suite comprises Elphidium aculeatum, Ammonia parkinsoniana, and Quinqueloculina spp., while Cyprideis torosa, Aurila sp., and Semicytherura spp. are the most abundant ostracod species. This unit is dated by a set of foraminifera at 4.13 m b.s. (4.02 m b.s.l.) to 4090–4605 cal yrs BP (Ain 123|413; Table 1).
Unit III extends to 2.45 m b.s. (2.34 m b.s.l.) and consists of dark gray sands (mean 428–850 µm) and is rich in organic micro-remains (mostly charcoal, shell fragments, and seagrass) as well as small pebbles (<1 cm). Toward the upper limit, a pebble cluster is noted. The values of PCA F1 are steadily rising. The foraminifera association is diverse and comprises mostly Ammonia tepida, Ammonia parkinsoniana, Quinqueloculina spp., and Ammonia beccarii, while just a few ostracod tests are present (Propontocypris sp., Loxoconcha sp., Pontocythere turbida, and Leptocythere spp.).
Above the pebble layer, unit IV starts at 2.45 m b.s. (2.34 m b.s.l.) and extends up to 1.30 m b.s. (1.19 b.s.l.). Unit IV is made of homogeneous fine gray silts (mean 13–93 µm) and shows lenses of clay and organic material in random order. PCA F1 is still steadily rising in this unit. The foraminifer association is not as diverse as in unit III. It comprises mostly Ammonia tepida, Haynesina germanica, Ammonia parkinsoniana, while the ostracod association is dominated by Cyprideis torosa associated with just a few specimens Loxoconcha elliptica and Aurila sp. A charcoal piece dates unit IV to 1637–1826 cal yrs BP (Ain 123|179 at 1.79 m b.s., 1.68 m b.s.l.).
Unit V is the topmost unit, developed between 1.30 m b.s. (1.19 m a.s.l.) and the present surface. It comprises poorly sorted, fine-grained brown silts and loams (mean 11–23 µm) with small pebbles (<0.5 cm), small fragments of charcoal, and plant remains. PCA F1 attains maximum values in this unit. Moreover, unit V does not contain foraminifera or ostracods, and farming activities mark the uppermost 0.34 m (plow horizon).
Discussion and interpretation
Combining the sedimentological and microfaunal findings helps to refine the results of Brückner et al. (2015) in characterizing the paleoenvironmental conditions in the surroundings of modern Enez. The present study provides new insights into the relative sea-level evolution of this area combined with the geochronological results.
Interpretation of core Ain 123 and a summary of the paleogeographic evolution of the area
The bedrock (Neogene limestone, unit I) outcrops on parts of the hill on which the Enez castle was built. This limestone was used at the regional scale as a building material. Consequently, its weathered part was encountered at the location of Ain 123 (Figure 5) at 4.22 m b.s. (4.11 m b.s.l.).
The transgressive, littoral unit II represents the onset of the Holocene sea-level rise at this site, tops unit I. Many pebbles, the coarse grain size, the poor sorting, and minimum PCA F1, which points to low terrestrial influence, attest to the high-energy nature of this environment. The low biodiversity and the sole occurrence of robust foraminifera, such as Ammonia spp. and Elphidium spp. in the lower part of unit II, indicate the high stress level of this littoral environment that is too energetic for most species. Following the dating results of Ain 123|413 (4090–4605 cal yrs BP; Table 1), the Holocene transgression had already reached this area during the second half of the 5th millennium BP.
Ongoing relative sea-level rise led to the formation of a shallow-water body represented by unit III. The greater water depth caused by the shoreline’s inland migration led to reduced wave action at the core site, attested by good sorting. Besides, the high microfaunal diversity is consistent with a shallow-marine water body.
Due to the Meriç Delta’s progradation, the area was later separated from the sea and transformed into a lagoonal environment (unit IV), comparable to core Ain 23 just east of coring site Ain 123 (see Brückner et al., 2015). The fine grain size, the poor sorting, the increasing terrestrial influence (PCA F1), and the decrease in microfauna species diversity are typical of lagoonal environments. These environmental changes started around a similar time to Ain 23, as shown for the Late Roman period by the core Ain 123|179 (1637–1826 cal yrs BP). This area was gradually silted up by high sediment supply from the Meriç, including human impact on sediment budgets. By Late Antiquity, the area had become marshland (unit V). This is supported by the disappearance of microfauna and the peak of PCA F1, consistent with terrestrial influence.
Sea-level index point from Ain 123
Following the approach described by Seeliger et al. (2017), the first occurrence of a fully established shallow-marine association of foraminifera (Elphidium aculeatum, Elphidium complanatum, Rosalina spp., Ammonia parkinsoniana, and Quinqueloculina spp.) occurred at 4.13 m b.s. (4.02 m b.s.l.). A bulk sample of foraminifera from this depth was dated to 4090–4605 cal yrs BP (Ain 123|413; Table 1) and constituted our first sea-level index point.
An RSL curve for the Meriç delta
Using the aforementioned sea-level indicator, we created an RSL-curve based on three index points for the Meriç-delta region (Figure 6). Each coring (Ain 6, 115, and 123) furnished one index point, that is, the Holocene transgression’s onset at the specific site (Figure 2). The curve starts with an index point at a depth of 4.94 m b.s.l. and ~6000 years ago (5873–6280 cal yrs BP; Ain 115|553 in Table 1). Rising rates are 0.6 mm/year until the next index point at a depth of 4.32 m b.s.l., ~4850 years ago (4824–4867 cal yrs BP; Ain 6|29 in Table 1) is reached. Due to the broad age range of the uppermost index point at 4.02 m b.s.l. ca. 4300 yrs ago (4090–4605 cal yrs BP; Ain 123|413 in Tab. 1), the gradient increases to 1.1 mm/yr. Unfortunately, no younger ages were generated due to the limitations of the indicator itself. Therefore, the upper part of the curve was extrapolated to the present day, with average rising rates of 0.9 mm/yr. The three archaeological sea-level limiting points fit this overall trend within their error limits. Referring to the entire study period, sea level rose at an average of 0.81 mm/yr.
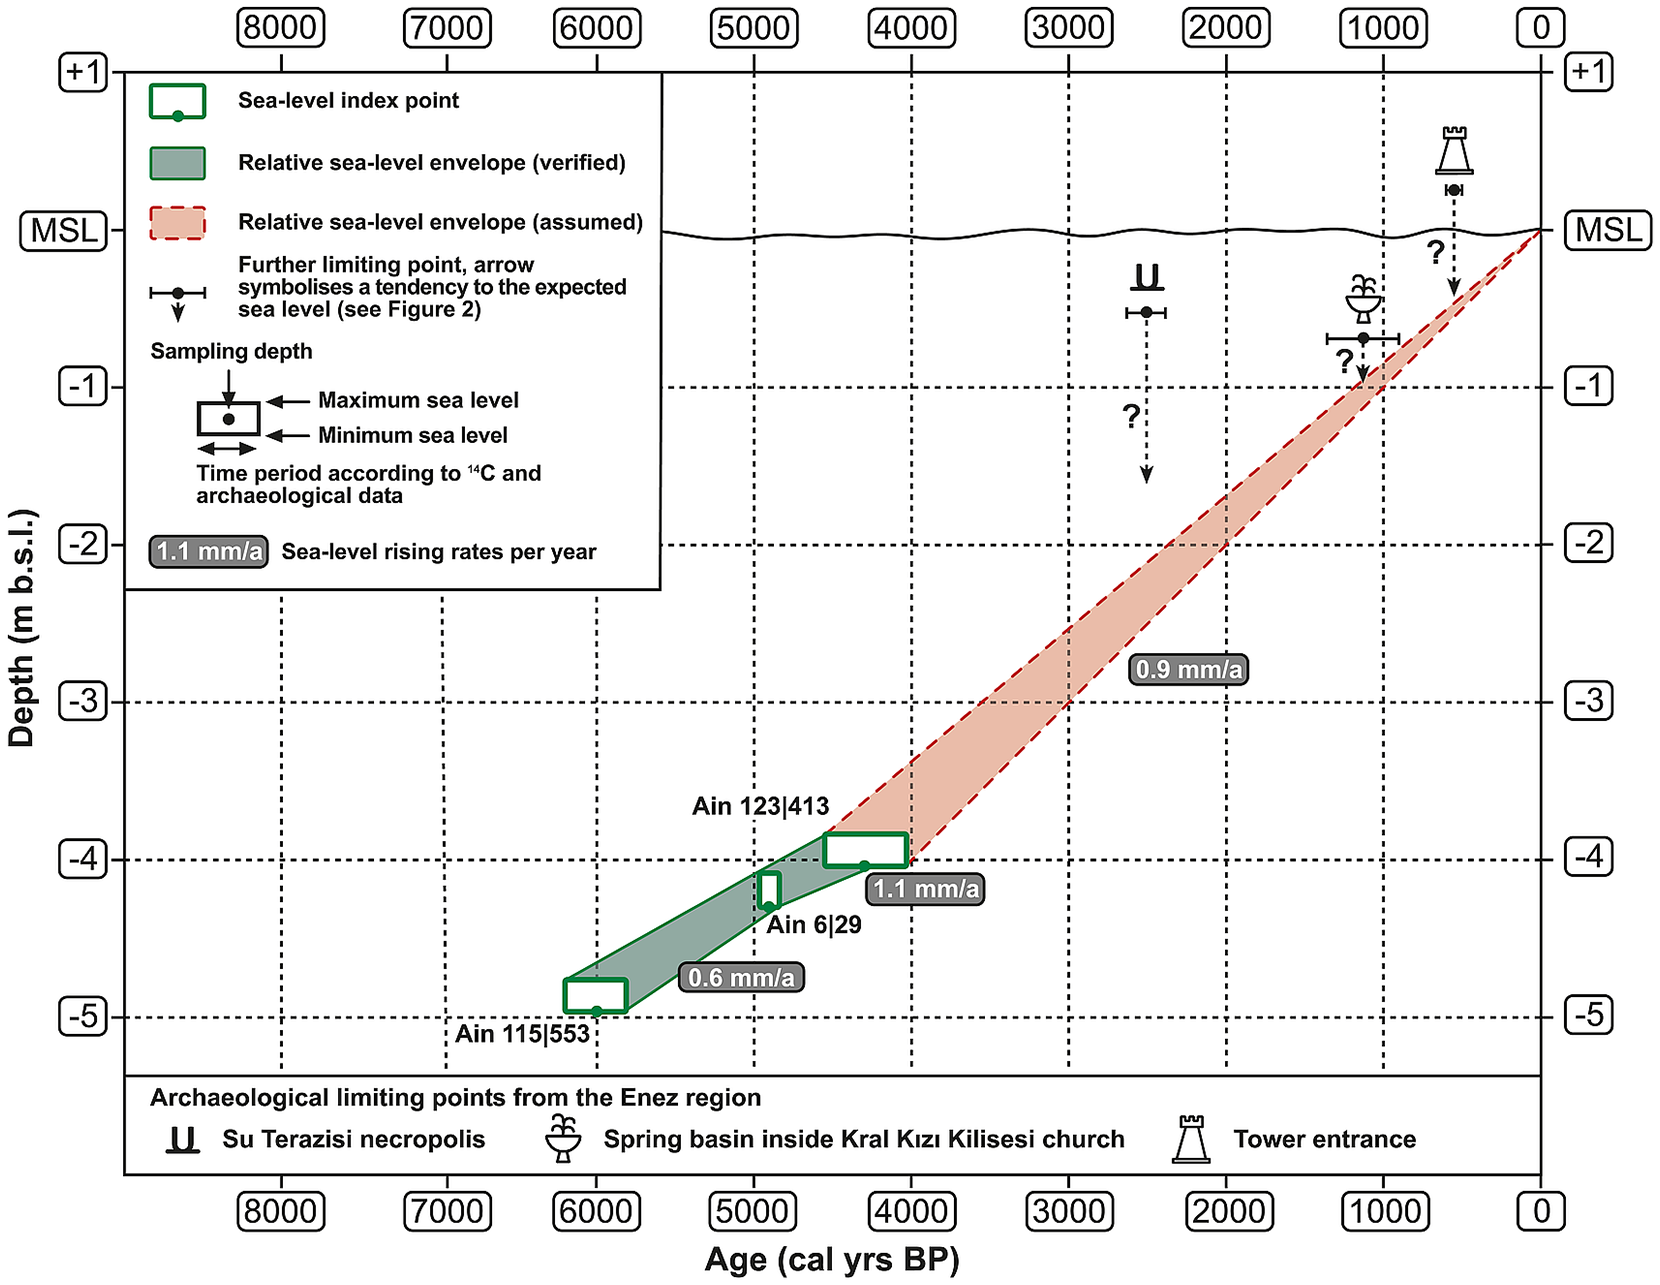
Relative sea-level (RSL) curve for the Meriç delta based on three sea-level index points following the approach of Seeliger et al. (2017) and the three archeological sea-level limiting points. The green envelope curve symbolizes the section with high sea-level estimation accuracy, while the red envelope curve shows an extrapolation until today.
Comparison with other RSL data from the Aegean
In the northern Aegean Sea, further field-based RSL curves were established (Figure 7) by Syrides et al. (2009), Pavlopoulos et al. (2007, 2013), and Seeliger et al. (2017).
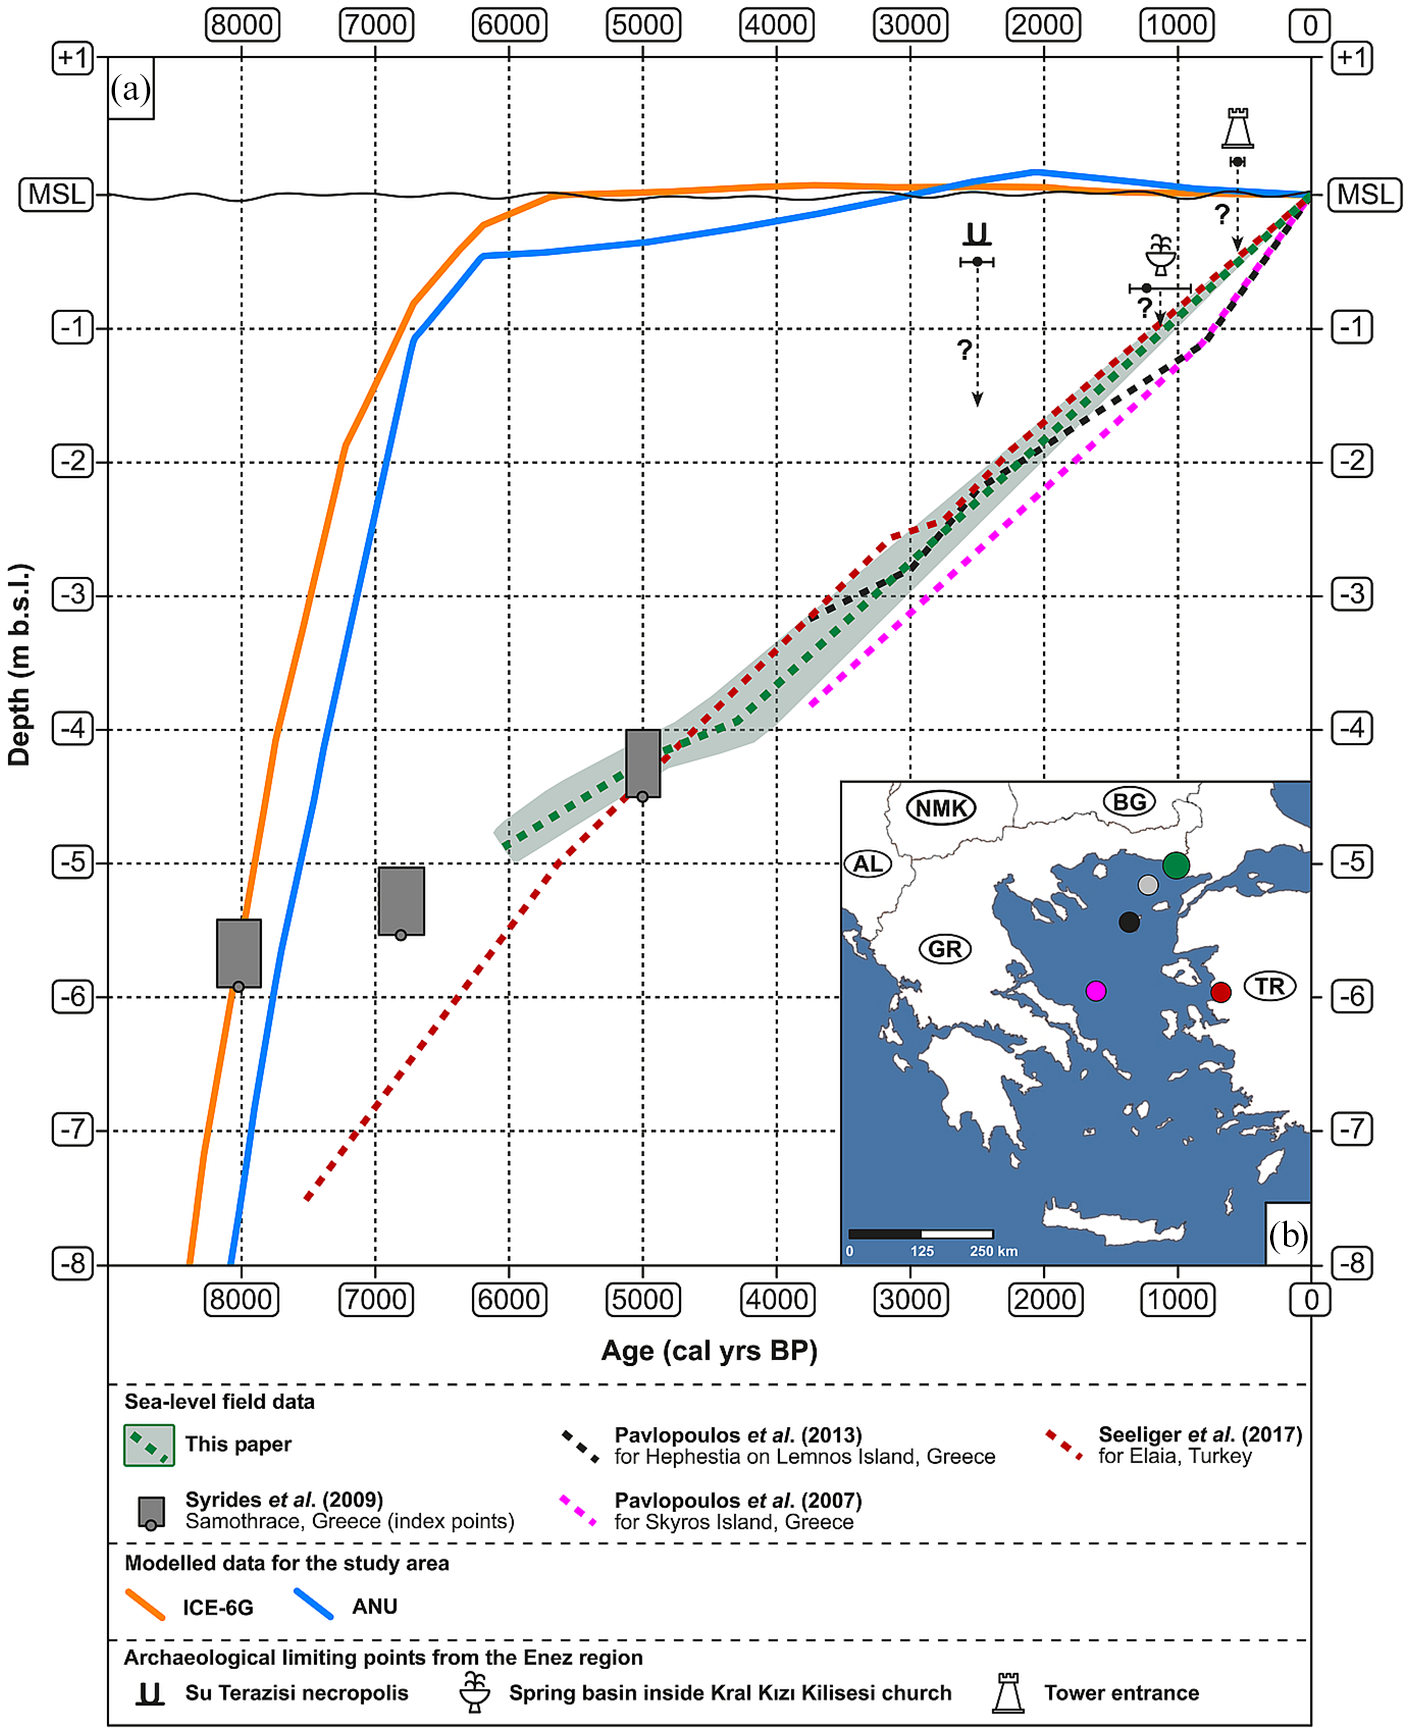
Modeled RSL curve for the area around Ainos compared with other curves for the northern Aegean region. (a) Selected RSL curves for sites in the Aegean Sea as well as the predicted GIA curves according to the two models described in section 3.5 ICE-6G (VM5a) and ANU for the sea area south of Enez. (b) Location of the study sites mentioned in Figure 7a in the Aegean region projected in Figure 2b. The same colors are used for each study site in Figure 7a and b.
Fifty kilometers south-west of Enez, Syrides et al. (2009) reconstructed the RSL history of the Greek island of Samothraki (Figure 7, gray squares). Therefore, valves of Cerastoderma glaucum collected just above the transgressive contact in several corings (upward error bar of 0.5 m) were dated. These index points mesh nicely with our curve and provide insights into the RSL history before 7 ka BP. The combination of the Samothraki data and our index points shows a homogenous sea-level rise for the period 8–4.5 ka BP, and a backward extension of our curve is plausible.
Further south, on the island of Lemnos, Pavlopoulos et al. (2013) present an RSL curve for the region of the ancient city of Hephestia, which is tectonically active and often hit by earthquakes (ex. Figure 7, dashed black line). Because no morphological sea-level indicators exist above the present sea level, an absence of uplift is assumed. Based on the radiocarbon ages of mollusk shells (Cerastoderma sp.) and organic matter, the curve starts ~3900 cal yrs BP and is nearly identical to our curve with an average gradient of 0.79 mm/year.
The RSL curve published by Pavlopoulos et al. (2007) for the island of Skyros (Greece), a region with slight subsidence, is based on 14C-dated peat and organic matter, supplemented by dated beachrock (ex. Figure 7, dashed pink line). The curves for Lemnos and Skyros are nicely correlated for the past 3750 years. A similar gradient, but with a vertical offset of approximately –0.5 m, hints at a more substantial subsidence rate, most probably caused by peat compaction (Marriner et al., 2012).
Finally, the curve described by Seeliger et al. (2017) for the Elaia region (Turkey) is the only curve with a similar temporal range as our curve (ex. Figure 7, dashed red line). Until approx. 4800 yrs BP, our curve is above that for Elaia. Beyond this date, and until present, it is below it. This could be due to the subsidence of the Bergama and Zeytindağ grabens (western Turkey) that, in the case of Elaia, is estimated to be ~1 mm/year (Aksu et al., 1987; Seeliger et al., 2013). Between 4500 yrs BP and today, both curves are broadly congruent, but it is important to stress that our curve has no data points for this time window. It is tenuous to state that the relative subsidence of the Meriç delta for the past 4500 yrs BP is similar to the subsidence rates of the Bergama and Zeytindağ grabens (Seeliger et al., 2014, 2017). Nonetheless, our curve is in good agreement with all other regional curves for the last 4.5 ka.
Not only these RSL data underscore significant spatial variability in time-averaged rates of RSL change in the Aegean (Figure 8a), ranging from +4.6 mm/year at Epanomi to −5.4 mm/year at Chrisoskalitissa (Figure 8b). This significant spatial variability is the expression of highly vertical displacements caused by tectonic activity, sediment-isostasy, sediment compaction, and sediment budgets set against global eustatic changes and regional glacio-hydro-isostatic adjustments of the lithosphere. We generated three maps based on observed, predicted, and observed-predicted time-averaged rates of RSL change (Figures 9–11). Our analysis shows that tectonic uplift occurs along the Hellenic Arc’s frontal margin (parts of Crete, Nisyros), in the northeast Aegean region (Thrace), and much of the central Aegean region. Sediment compaction and sediment loading play an essential role in the subsidence of areas in the northwest Aegean region (e.g. Enez, Thessaloniki Plain-Thermaikos Gulf). There is contrasting RSL evidence from Thessaloniki coastal plain with evidence for both regional uplift and subsidence. Finally, coastal sites in Turkey manifest opposite RSL trends due to the effects of tectonic fragmentation on vertical displacements (Figure 11).
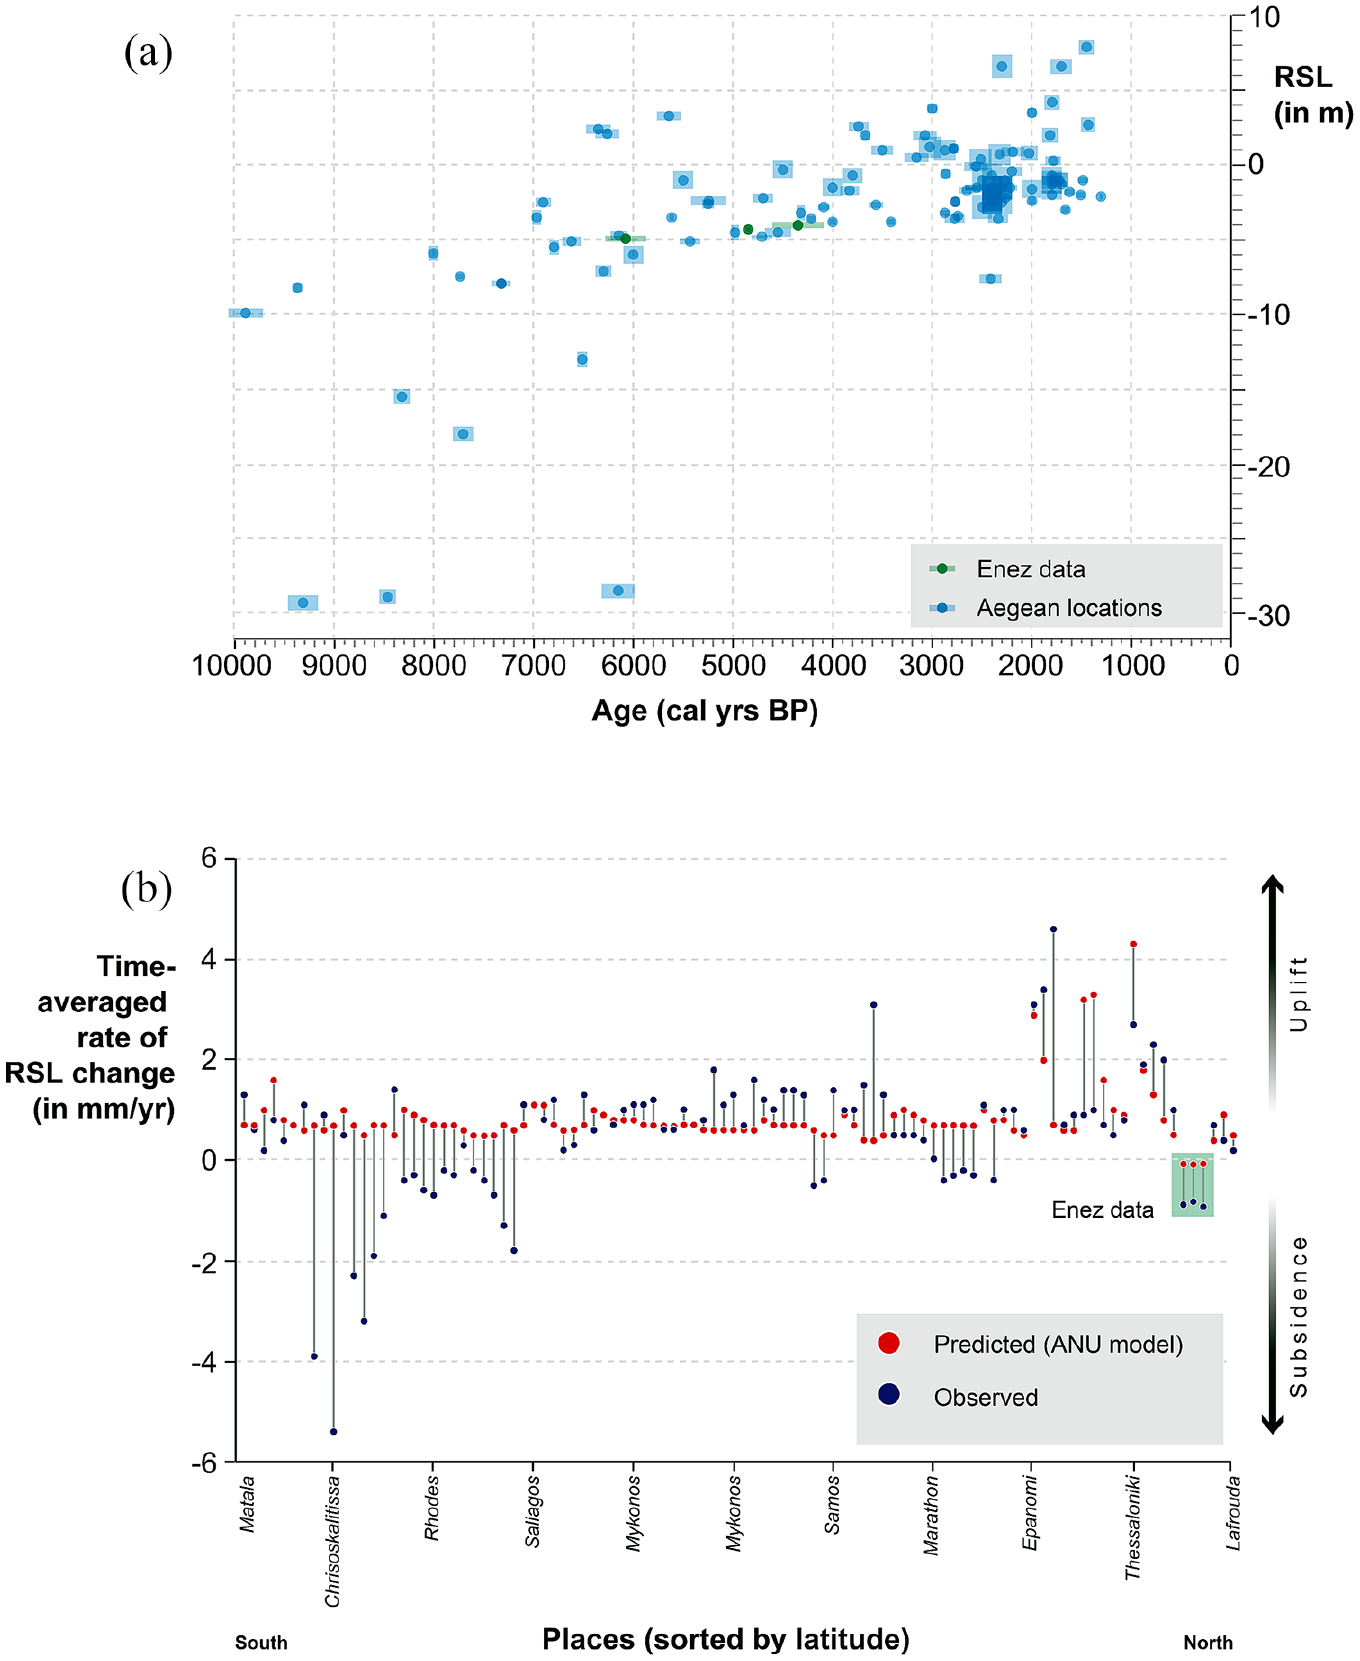
(a) Overview of all sea-level index points mentioned in this study. The three new ones from the Enez region are marked in green and fit well with the overall data cloud. (b) Comparison of the predicted and the observed heights for the locations of this study.
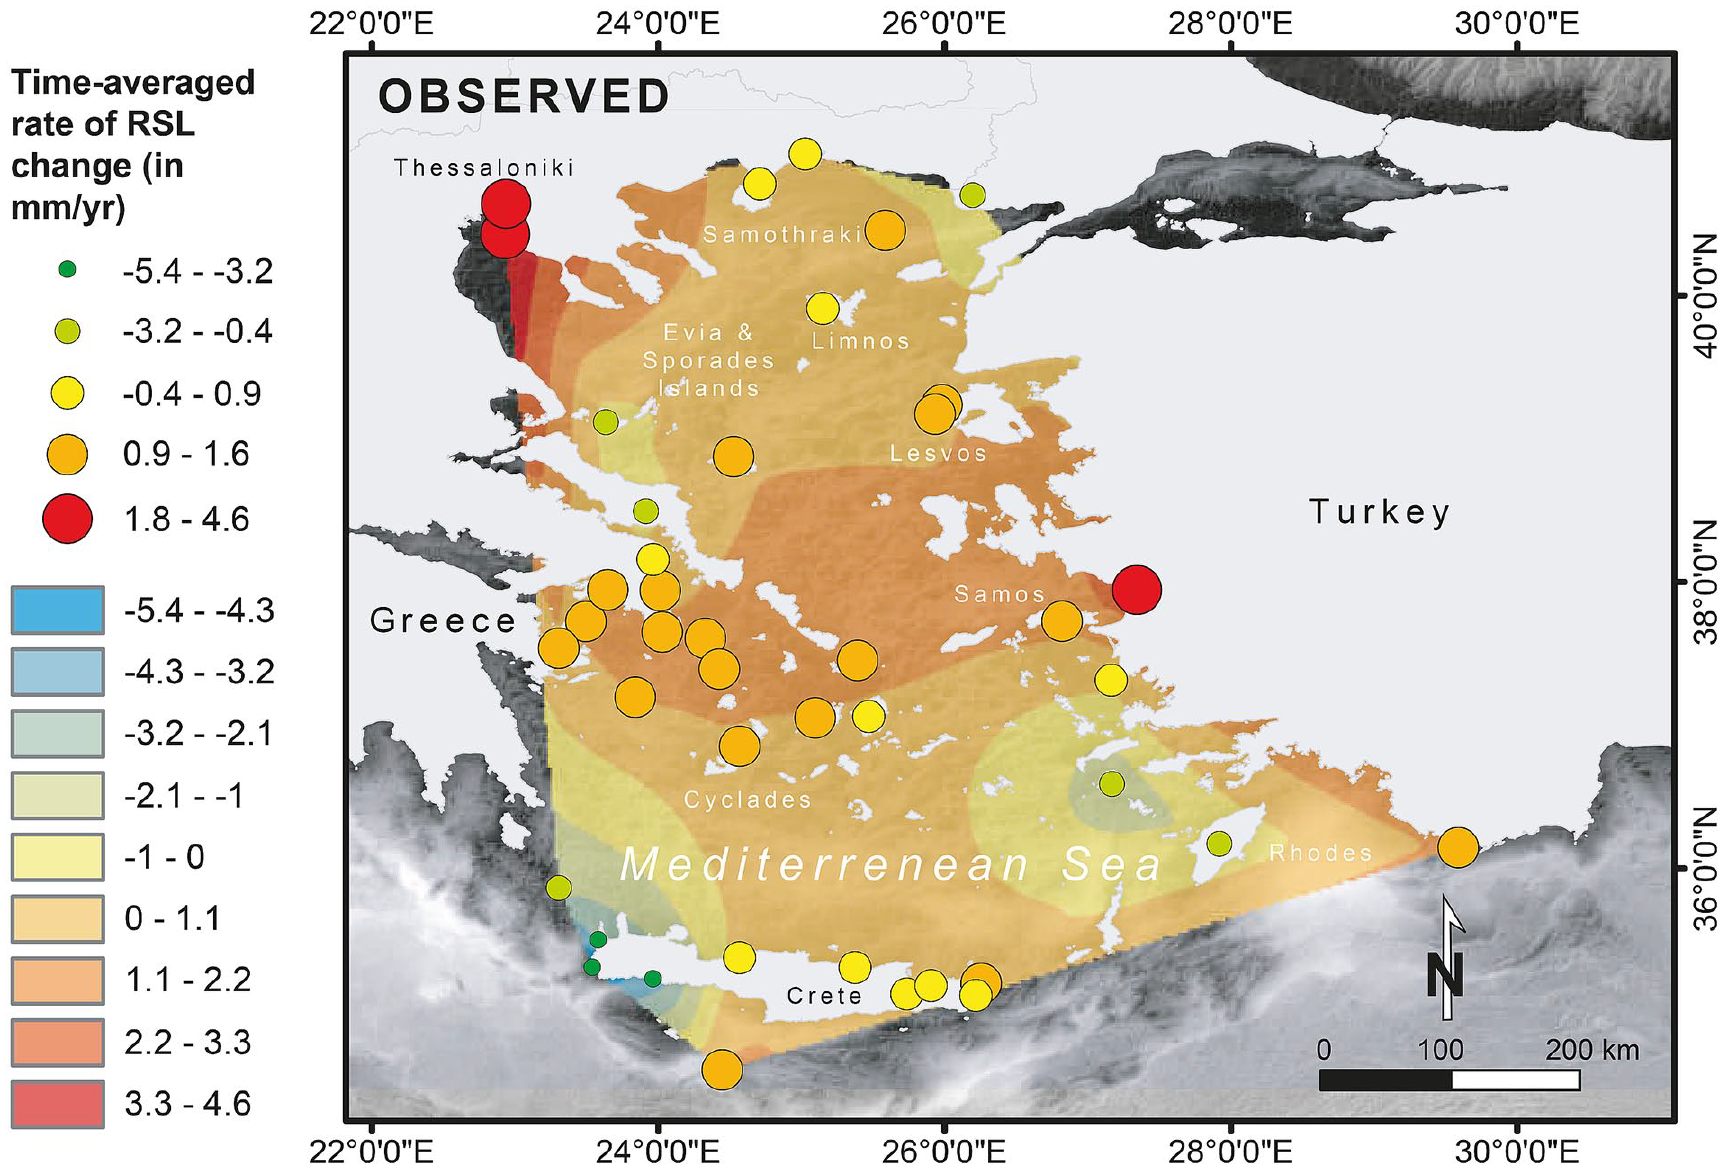
Observed rates of RSL changes in the Aegean Region based on field data.
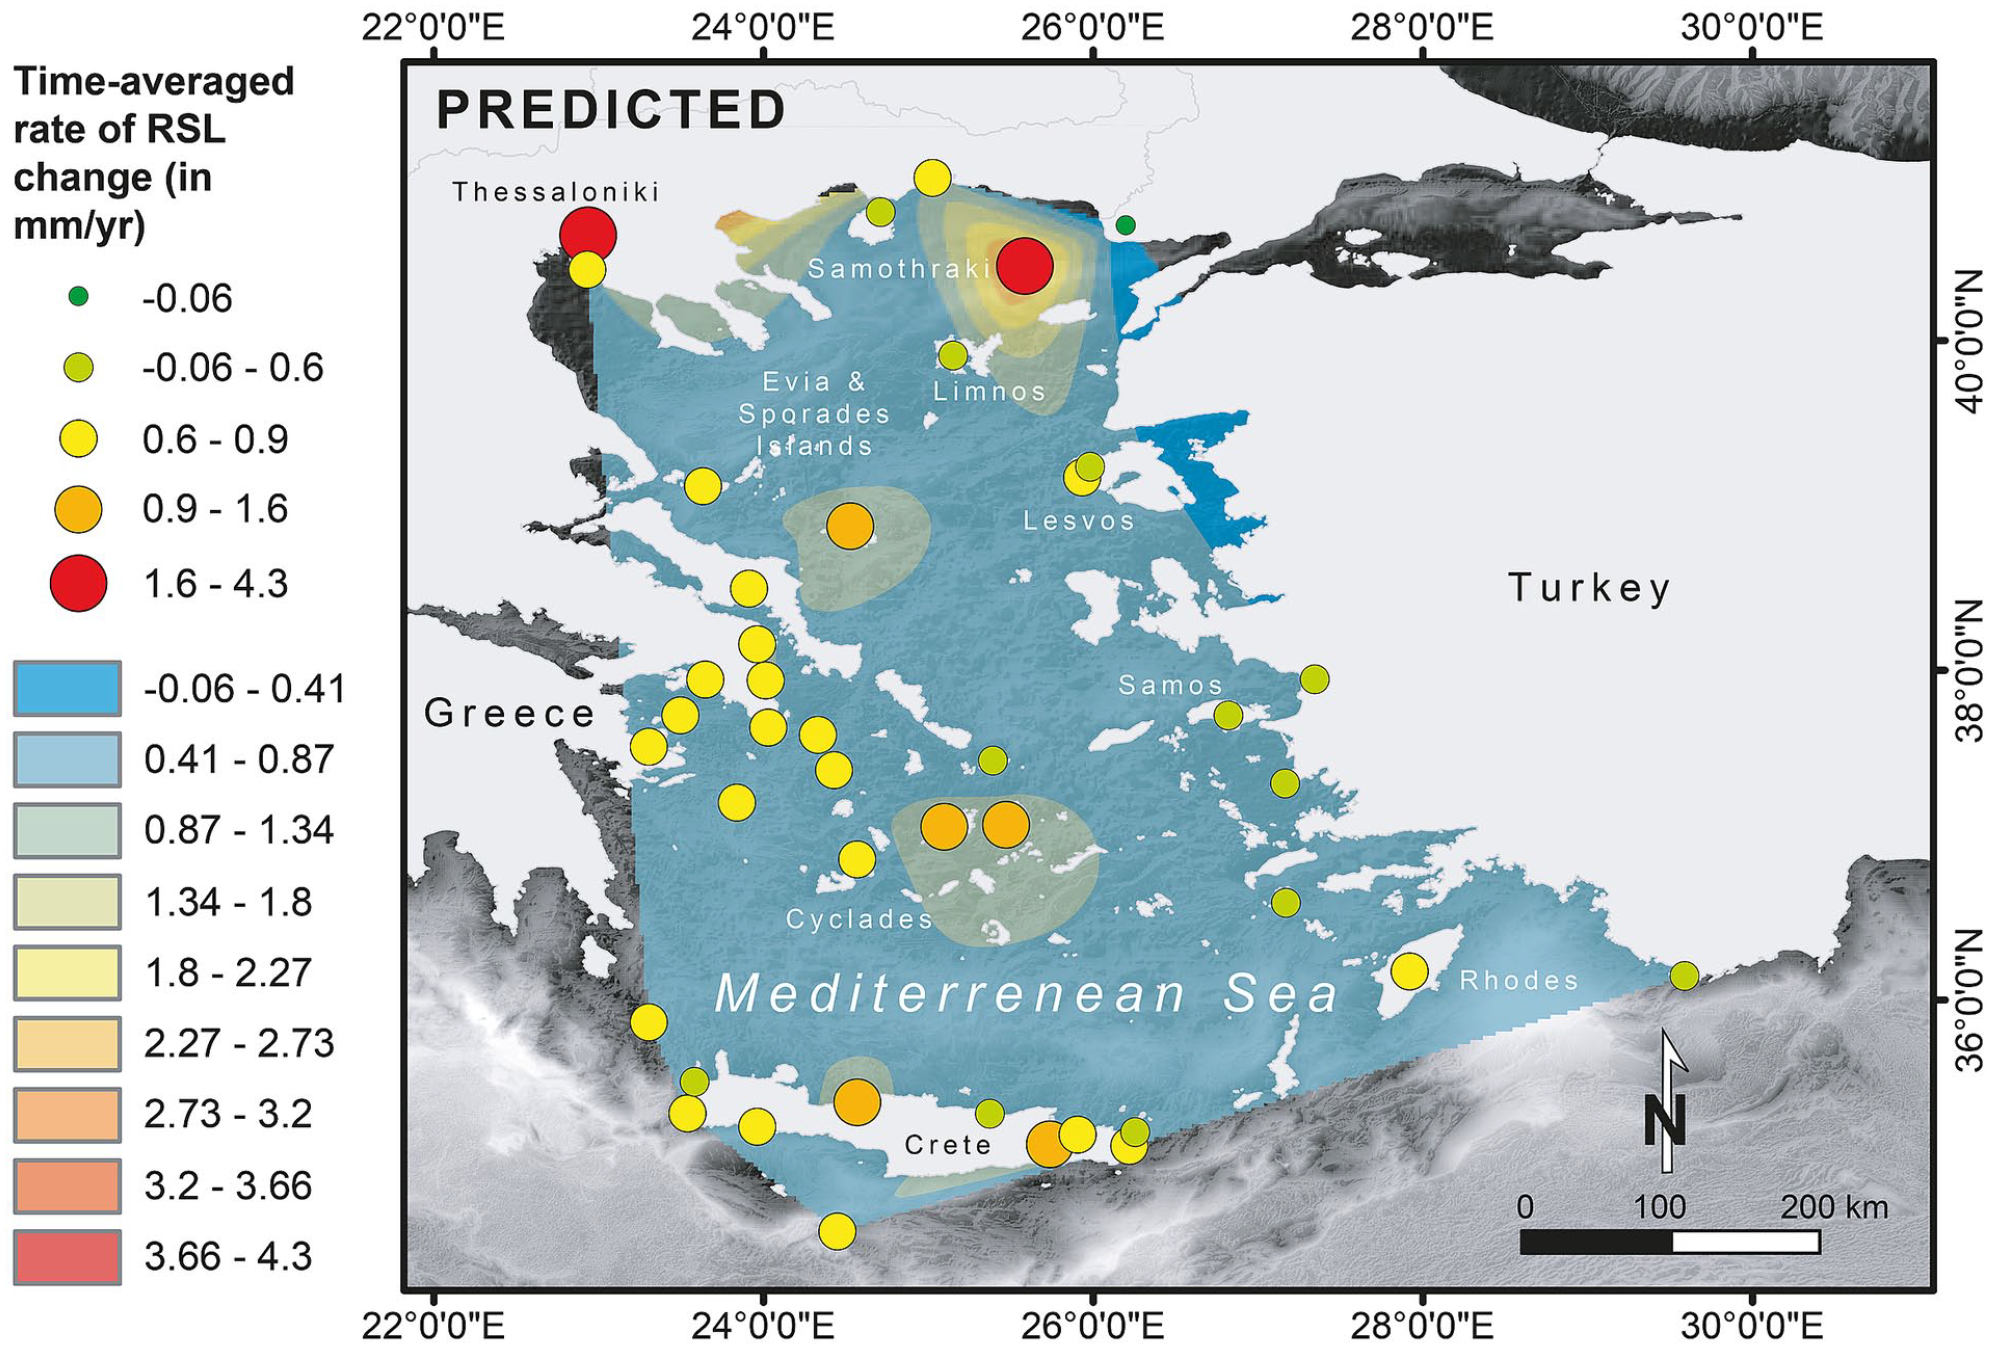
Predicted rates of RSL change in the Aegean Region based on the ANU geophysical model.
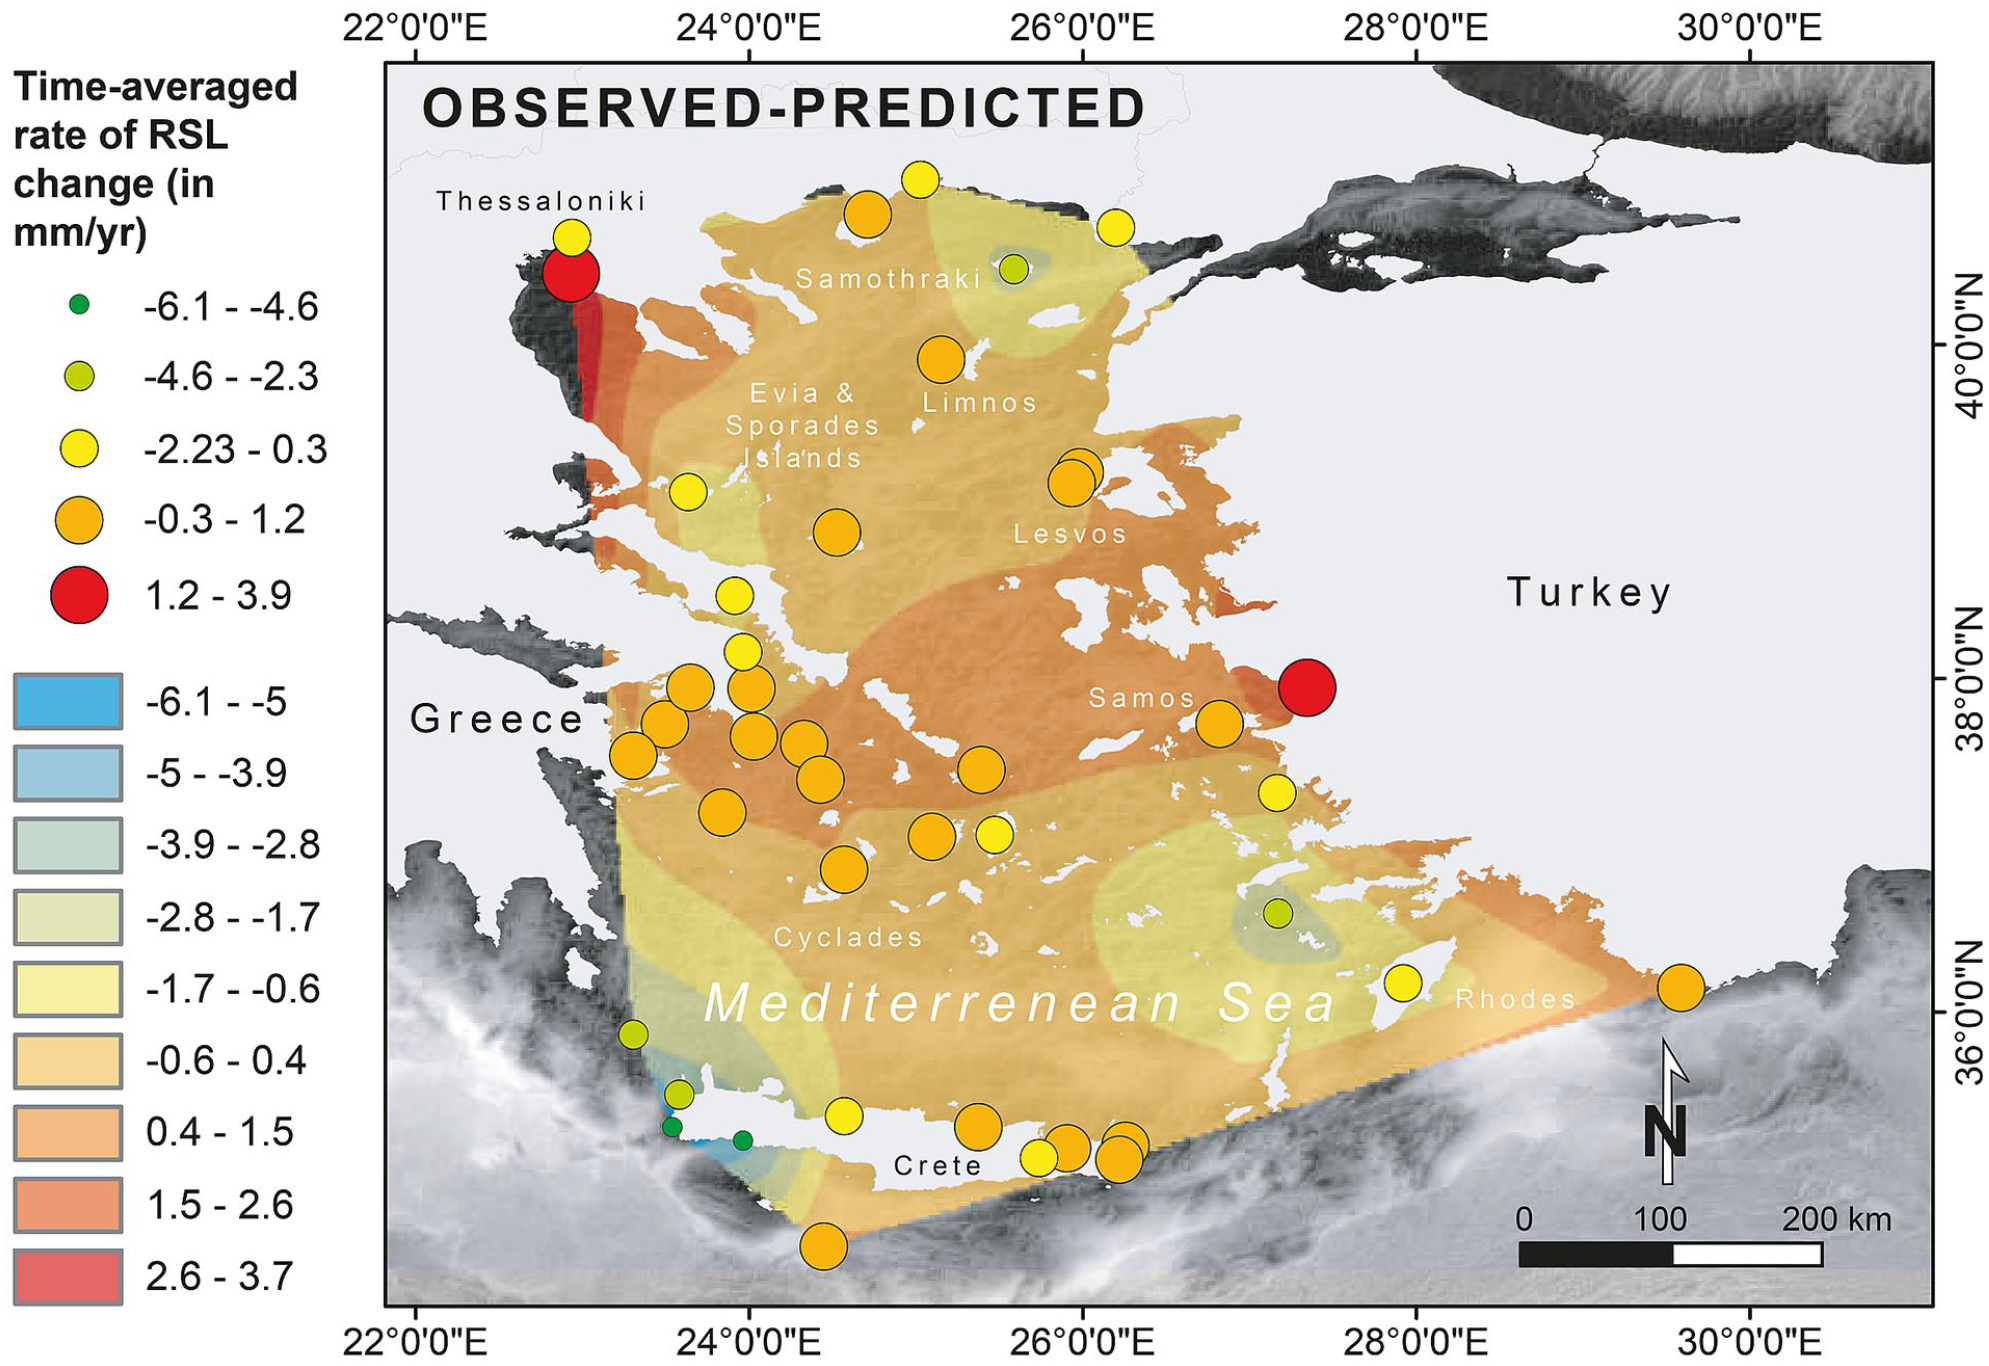
Observed – predicted rates of RSL change in the Aegean Region. The ANU geophysical prediction data were subtracted from the field data points to assess the amplitude of land-level movements (tectonics, sediment compaction).
Comparison with modeled sea-level curves for the study area
We calculated two models of RSL rise for the study area. All show a steady rise in RSL up to −0.5 m b.s.l. at ~6500 yrs BP. Following the ICE-6G (VM5a), RSL reached the present-day level ~5800 years ago and persisted at that level until today. The ANU model is in good agreement with ICE-6G (VM5a), showing a slower rate in RSL rise but reaching a maximum of ~+0.20 m above the present-day around 2000 yrs BP, when Ainos was densely settled. For the ANU model and ICE-6G (VM5a), constant relative sea-level variations for the past 3000 years can be stated. Interestingly, all modeled curves are above the level of the graves of Archaic age and the spring basin, which is, of course, in conflict with reality.
The reasons for this significant offset between the modeled curves and the field-based data points are manifold. The RSL predictions obtained by the two GIA models in Figure 7 reflect structural differences among them. These include the geometry of the ice complexes, their deglaciation chronology, the viscosity profile of the mantle, and the lithospheric thickness (Melini and Spada, 2019). The study area lies far from the major glaciation centers, such as the Fennoscandian Ice Sheet or the glaciated European Alps. Therefore, the ice equivalent meltwater (eustatic) factor is more important compared to the ice-induced component.
Furthermore, it is widely accepted that the world’s deltas have subsided at various temporal and spatial scales (Syvitski et al., 2009) – a phenomenon mainly attributed to dewatering, compaction, oxidation of organic material, isostatic adjustment, and neotectonics. Within this context, tectonic subsidence of the Samothraki Plateau and adjacent areas is attested and attributed to sediment loading by the Nestos, Kompsatos, Lissos, and Meriç rivers (Poulos and Kotinas, 2020; Figure 1). Furthermore, the nearby NAT also manifests high rates of subsidence at a regional scale. Based on the work of Perissoratis and Conispoliatis (2003) as well as Piper and Perissoratis (1991), the rate of subsidence on the Samothraki Plateau varies between 0.05 mm/year and 0.7 mm/year, with a spatially averaged subsidence rate for the Plateau of 0.3 mm/year.
Additionally, calculating a minimum value of subsidence using the graves basement back to the seventh century BC (2650–2550 BP) is helpful in this context. The deepest basement was found at 0.5 m b.s.l. Assuming the water level was just below the basement (1 m b.s.l. for the calculation, which is unrealistic as the former settlers left more space between the dead body and the water table), we can calculate a minimum rate of subsidence of ~0.3 mm/year and therefore neglect all rates below that number for further calculations. Using 0.3 mm/year for the period of interest results in 1.5 m (5000 years ago) and 1.8 m (6000 years ago) of subsidence. In contrast, using the maximum rate of 0.7 mm/year suggested by Piper and Perissoratis (1991) leads to a total amount of subsidence of 3.5 m (5000 years before today) and 4.2 m (6000 years before today). Therefore, most of the resulting differences between the field-based data and the modeled ones are due to the Samothraki Plateau subsidence.
Conclusions
We applied the methodology of Seeliger et al. (2017) to the Meriç delta on the northern Aegean coast. The reconstructed RSL history meshes nicely with the areas of Samothraki (Syrides et al., 2009) and Elaia. We avoided problems of post-depositional compaction by using index points close to bedrock. Regressive phases were hard to identify using the Seeliger et al. (2017) methodology. Furthermore, the use of archeological sea-level limiting points (tombs, a spring basin, and the entrance of a tower) confirms that sea level is presently at its Holocene maximum. By comparing the curve with the predictions from the implementation of two GIA models, that is, ICE-6G(VM5a) and ANU, we conclude that most of the offset between the modeled and field-based data results from subsidence of the area of Ainos in connection with the Samothraki Plateau (sediment loading, dewatering, compaction, neotectonics). This does not explain all of the variations. Therefore, we argue that the models do not satisfactorily mirror the Holocene sea-level evolution of the northern Aegean region. This statement is supported by the fact that the RSL curves for other areas in the region – the islands of Lemnos, Skyros, and Samothraki – fit well with our curve but do not match the modeled ones. Our data further confirm that none of the available geophysical models can resolve the GIA-related deformations in the Mediterranean in a comprehensive manner (Vacchi et al., 2018). The development of a Mediterranean transfer function based on micropaleontological assemblages may help to overcome this problem. In fact, an improved tuning of the GIA models is strongly dependent on the production of high-resolution sea-level data derived from low-energy coastal environments (e.g. Shaw et al., 2016). These proxies are notably lacking in much of the eastern Mediterranean basin, notably for the early to mid-Holocene. This is an exciting avenue for future RSL research in the area.
Supplemental Material
sj-tif-1-hol-10.1177_09596836211025967 – Supplemental material for Mid- to late-Holocene sea-level evolution of the northeastern Aegean sea
Supplemental material, sj-tif-1-hol-10.1177_09596836211025967 for Mid- to late-Holocene sea-level evolution of the northeastern Aegean sea by Martin Seeliger, Anna Pint, Peter Frenzel, Nick Marriner, Giorgio Spada, Matteo Vacchi, Sait Başaran, Anca Dan, Friederike Seeger, Katharina Seeger, Thomas Schmidts and Helmut Brückner in The Holocene
Footnotes
Acknowledgements
This project was conducted in the context of the DFG priority program (SPP) 1630 “Harbours – from the Roman Period to the Middle Ages” (2012–2018). Our research was part of the Ainos Project, headed by the excavation director Sait Başaran (İstanbul Üniversitesi, Turkey). We thank his team for their generous support during fieldwork. The authors wish to thanks Daniele Melini of the Istituto Nazionale di Geofisica e Vulcanologia of Rome (Italy) for establishing, the ANU curve. Furthermore, Majid Pourkerman, Iranian National Institute for Oceanography, Tehran, Iran, is thanked for helping with the creation of some of the maps. Finally, the Ministry of Culture and Tourism of the Republic of Turkey kindly granted the research permits.
Author contributions
MS, AP, and PF designed this study. FS, KS, AD, HB, and MS performed the geoarchaeological fieldwork, mainly containing drilling, sediment sampling, and leveling the coring locations via DGPS. AP and MS carried out the laboratory analyses. NM, MV, and GS designed the study of the different GIA models and calculated the final plots. MS wrote the first draft of the manuscript that all co-authors later improved. MS created most of the figures. HB, TS, and AD acquired the funding for this research. SB acted as a valuable counterpart during the fieldwork and dated the necropolis due to his immense archaeological expertise. SB, AD, and TS provided the archaeological and historical data for this paper.
Funding
The author(s) disclosed receipt of the following financial support for the research, authorship, and/or publication of this article: Financial support was granted to HB (DFG ref. no. BR 877/31-1, -2) and to TS (SCHM 2831/2-1, -2) by the German Research Foundation and to AD (CNRS, Paris; project “Legecartas”). GS is funded by an FFABR (Finanziamento delle Attività Base di Ricerca) grant of the MIUR (Ministero dell’Istruzione, Ministerio dell’Università e della Ricerca) and by a DiSPeA (Dipartimento di Scienze Pure e Applicate dell’Università di Urbino) research grant.
Supplemental material
Supplemental material for this article is available online.
Notes
References
Supplementary Material
Please find the following supplemental material available below.
For Open Access articles published under a Creative Commons License, all supplemental material carries the same license as the article it is associated with.
For non-Open Access articles published, all supplemental material carries a non-exclusive license, and permission requests for re-use of supplemental material or any part of supplemental material shall be sent directly to the copyright owner as specified in the copyright notice associated with the article.