
Abstract
Anthropogenic stressors to freshwater environments have perpetuated water quality and quantity challenges for communities across Arctic Canada, making drinking water resources a primary concern for northern peoples. To understand the ecological trajectory of lakes used as freshwater supply, we conducted a paleolimnological assessment on two supplemental sources in Igloolik, Nunavut, Arctic Canada. A stratigraphic examination of biological indicators (Insecta: Diptera: Chironomidae) allowed for paleotemperature reconstructions with decadal and centennial resolution over the past 2000 years. Between 200 and 1900 CE, the sub-fossil chironomid community was comprised of cold-water taxa, such as Abiskomyia, Micropsectra radialis-type, and Paracladius. Reconstructed temperatures were consistent with known climate anomalies during this period. A rapid shift in the composition of the chironomid assemblages to those with higher temperature optima (Chironomus anthracinus-type, Dicrotendipes, and Tanytarsus lugens-type) in the late 20th century was observed in both systems. Our results demonstrate that these ecosystems are undergoing marked transformations to warmer, more nutrient-rich environments, and suggest that water sustainability pressures will likely continue in tandem with ongoing climate change. To contextualize the influence of recent warming and elucidate the status of freshwater resources over the longer term, paleolimnological methods can be usefully applied as components of vulnerability assessments.
Introduction
The sustainability of Arctic freshwater resources is uncertain in regions undergoing large-scale transformations in response to 20th century climate warming (Wrona et al., 2016). Greenhouse gas radiative forcing and positive feedback mechanisms, such as reduced ice-albedo and altered hydrological cycles (Linderholm et al., 2018; Müller et al., 2012), have increased heat transport to high-latitude regions (Ahmed et al., 2013). One manifestation of modern warming is increased evaporative stress on Arctic lakes during lengthening summer seasons (Bouchard et al., 2013; Serreze and Barry, 2011), which can affect the recharge capacity of freshwater basins (Bakaic et al., 2018). Hydroclimate varies both spatially and temporally; this arises from strong seasonal controls during ice-free periods, and on permafrost thaw, snowmelt, and evapotranspiration, which can alter the distribution and availability of water (Bring et al., 2016). The cascading effects of climate warming are depreciating the naturally low storage capacities of Arctic watersheds, threatening the provisioning of drinking water resources in Arctic communities (Medeiros et al., 2017).
At the local level, risks to drinking water are experienced through a multitude of socioeconomic factors. In the majority of communities in the eastern Canadian Arctic, freshwater undergoes basic primary treatment through chlorination before being transported and deposited into the water storage tanks of individual buildings (Medeiros et al., 2017). As such, boil water advisories, and reports of residents running out of water and waiting for water refills (for hours or days), are not uncommon (Daley et al., 2015). Population growth is also expected to impact water availability and increase short-term vulnerability (Bakaic and Medeiros, 2016). Cultural and personal preferences of Inuit also include drinking untreated water from its source (Daley et al., 2015), especially when traveling out on the land during camping and subsistence activities (Goldhar et al., 2013, 2014). Thus, the concomitance of climate warming and socioeconomic factors emphasize that water security is an increasingly important component of community sustainability (Medeiros et al., 2017).
Water security is achieved through sustainable access to adequate quantities of acceptable quality water to support drinking water needs, human well-being, ecosystem integrity, and socio-economic development, as well as protect against water-related hazards and climate change (UN Water, 2013). Across the North American Arctic, water security challenges remain largely unaddressed and have been reported in Nunavik, Quebec (Martin et al., 2007), Rigolet, Labrador (Goldhar et al., 2014), Coral Harbour, Nunavut (Daley et al., 2015), and much of rural Alaska (Penn et al., 2017). Vulnerability assessments (Ford and Smit, 2004) are often conducted to address climate related impacts within a water security framework, where water resource vulnerability refers to the susceptibility of a system to damage caused by external forces, the sensitivity of the system, and the ability of the system to respond (Kelly and Adger, 2000; Luers, 2005; Plummer et al., 2012). While water resource indices tend to assess vulnerability at one specific time or over short (decades) time scales (Dunn and Bakker, 2011; PRI, 2007; Raskin et al., 2017), environmental variability is not effectively captured over limited temporal scales (Wu et al., 2013). Alessa et al. (2008) highlight the potential importance of using a timescale longer than 30 years for water vulnerability assessments to account for the interannual and interdecadal effects of climate variability on freshwater ecosystems. In the Arctic, with few long climate records, paleoclimate methods are needed to provide the required data.
Proxy-based paleoclimate reconstructions have documented long-term Arctic climate variability during the Common Era (last 2000 years) (e.g. Briner et al., 2016; Kaufman et al., 2009; Werner et al., 2018), and indicate that the rate of recent warming is anomalous. Arctic lakes are an important source of climate information, as the examination of physical, chemical, and biological indicators preserved in their sedimentary sequences can be used to infer past environments (Walker, 2001). The subfossil remains of chironomids (Insecta: Diptera: Chironomidae) are well preserved in lake sediments and are often used as indicators of paleoenvironments due to their association with variables such as temperature, dissolved oxygen, and nutrients (Brooks et al., 2001; Walker et al., 1991). At the scale of importance to this study, chironomid-inferred paleotemperature reconstructions conducted across the Arctic have detected climate variability during the Medieval Climate Anomaly (Porinchu et al., 2009a), Little Ice Age (Fortin and Gajewski, 2016), and 19th century (Medeiros et al., 2012; Quinlan et al., 2005). This suggests that a paleolimnological analysis can provide an understanding of climate history and associated ecological changes, which are useful for assessing current and future trends in a vulnerability context.
In this study, we apply a paleolimnological approach to establish the local water resource vulnerability for the community of Igloolik, Nunavut, Canada. During June of 2015, Igloolik exhausted the supply of its primary reservoir due to a late thaw (Bakaic and Medeiros, 2016). The reservoir has since been expanded, but questions remain about whether the existing supply sources that feed into the reservoir are sufficient in a warming and variable future. In addition to the primary reservoir and a shallow lake (South Lake) that is used to refill the reservoir in the summer, two additional sources of freshwater are used by the community as supplemental sources of freshwater; (1) Small Fish Lake, the designated alternative water supply source by the Government of Nunavut, and (2) a source of water commonly used by residents for subsistence hunting activities (designated here as Lake IG8). Through stratigraphic examination of biological indicators that respond rapidly to limnological changes (chironomids), we characterize the relationship between climate change and aquatic ecosystem functioning by (1) reconstructing the climate of Igloolik over the past 2000 years, (2) relating the temperature reconstruction to past lake productivity, and (3) using the paleoenvironment to quantify the ecological trajectory of the system. Our development of quantitative estimates of temperature and biological productivity is motivated by freshwater sustainability challenges, and we aim to address the research gaps that currently exist regarding climate change and indicators of drinking water resource vulnerability in the Canadian Arctic. This study can also serve as a template for freshwater sustainability strategies for other northern peoples and contributes to our understanding of water vulnerability in remote Arctic communities.
Site description
The hamlet of Igloolik (69°22′34″N, 81°47′58″W, 53 m.a.s.l) is located on Igloolik Island in the Qiqiktaaluk (Baffin) Region of Nunavut Territory, Arctic Canada (Figure 1). The island is 103 km2 in size and the hamlet lies adjacent to Turton Bay. The population is 95% Inuit (Ford et al., 2006), and has grown from ~1500 to 1700 between 2011 and 2016 (Statistics Canada, 2016). Igloolik is located within a continuous permafrost zone, and the geology consists of Precambrian rock flanked by Paleozoic sediments (Schau, 1984). Catchment vegetation is sparse, characteristic with the mid to high Arctic biome, and consists of short grasses (Dupontia sp.), mosses (Bryum sp., Plagiomnium medium), occasional dwarf shrubs (Salix sp.), and some flowering plants (Dryas integrifolia, Saxifraga sp.) (Derry et al., 1999). The region has a polar climate with a mean July air temperature of 7.4°C and a total annual precipitation of ~222.4 mm (Station 2402541, Environment Canada).
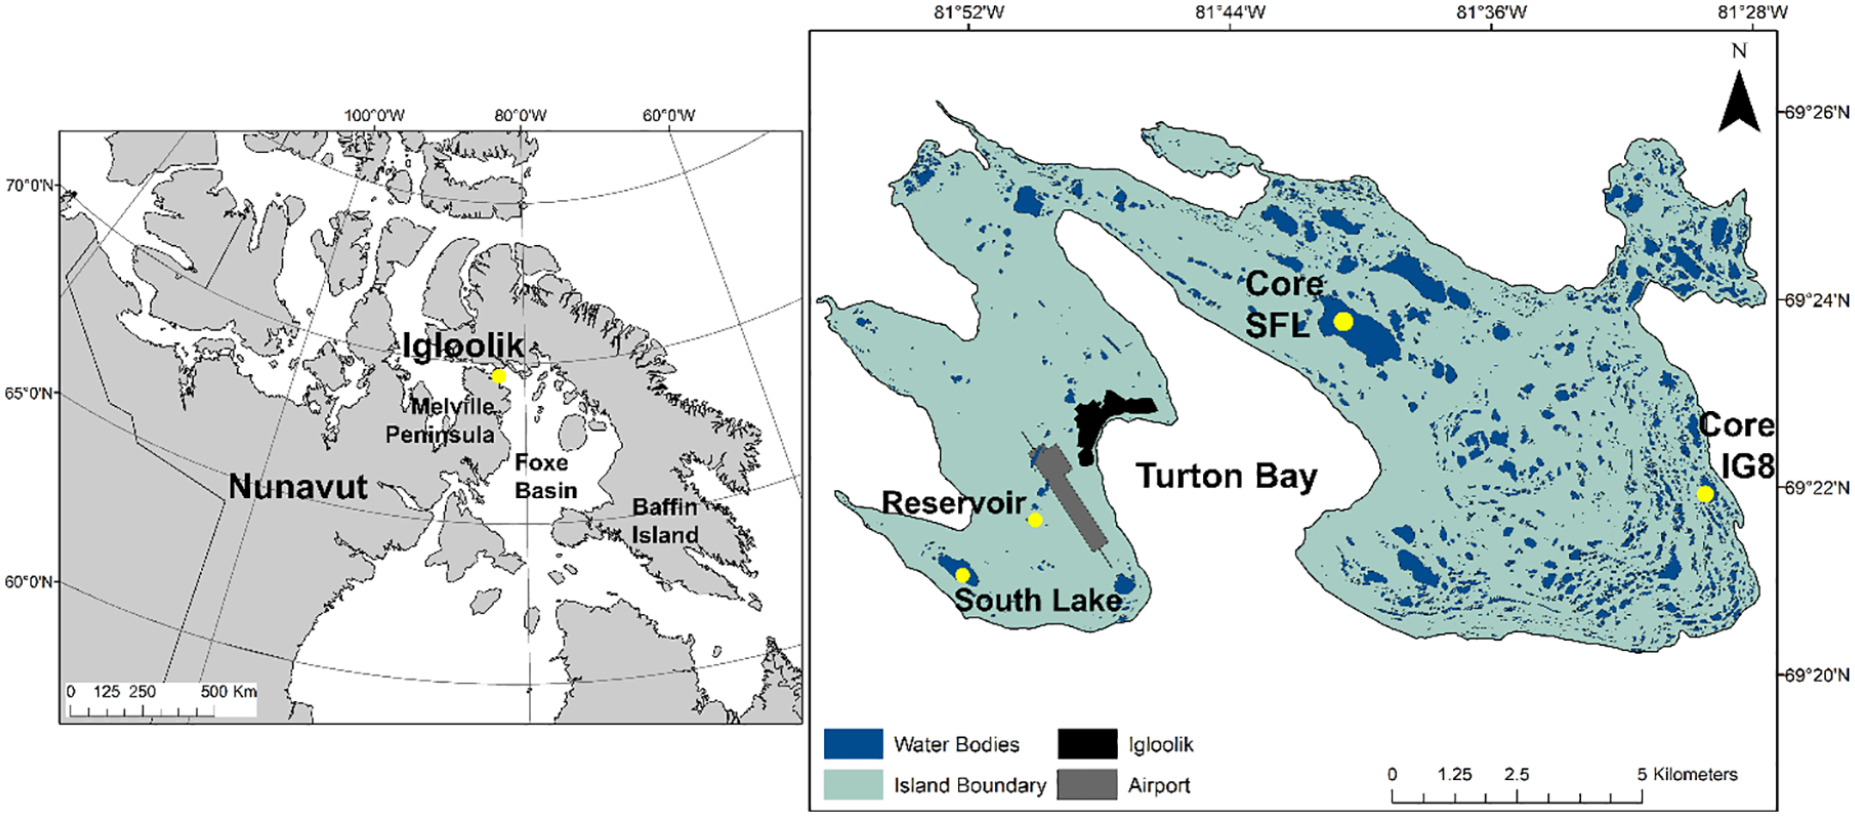
Location of the small fish lake (core SFL) and lake IG8 (core IG8) coring sites in Igloolik, Nunavut, Canada.
Currently, the municipality receives its drinking water from an un-named reservoir, which is recharged from South Lake (Figure 1). Water is transported to the hamlet by tanker trucks and deposited into household water storage tanks. Small Fish Lake (SFL) (69°23′35″N, 81°41′2″W) is the largest freshwater lake on the island (surface area 4.2 km2), with a maximum depth of 5.6 m and has a known lake trout population, which local residents use for recreational fishing. In 2015, SFL was designated as a supplemental drinking water source for Igloolik due to its volume after an over-winter shortage of reservoir water, and the exhaustion of the available end-of-winter supply from South Lake, which is not sufficiently deep for winter resupply purposes. Lake IG8 (69°21′41″N, 81°29′4″W) is situated in the eastern end of the island (surface area 1 km2) with a maximum depth of 3.8 m and used seasonally for drinking water by residents who camp near the site for recreation and subsistence hunting purposes. The nearest mainland freshwater source in Melville Peninsula is approximately 10 km from the hamlet.
Methods
Field methods
Two sediment cores were collected from Small Fish Lake and Lake IG8 on 17 July and 19 July 2018, respectively. The first, totalling 40.5 cm in length, was extracted from the mid-basin (5.3 m depth) of Small Fish Lake (core SFL). The second, totalling 12.5 cm in length, was extracted from the mid-basin (1.9 m depth) from Lake IG8 (core IG8). Both cores were collected using an Uwitec gravity corer (8.4 cm diameter) deployed from a boat, extruded on site at 0.5 cm intervals into Whirl-Pak® bags, then transported, stored, and refrigerated at 4°C at the University of Ottawa in Ottawa, Ontario.
Laboratory methods
Organic matter and carbonate content (expressed as % dry weight) were determined by measuring the weight loss-on-ignition (LOI), where the sediment cores were analyzed at 0.5 cm intervals by sequentially igniting at 550°C for 4 h and 950°C for 2 h (Heiri et al., 2001) using a LECO TGA701 Thermogravimetric Analyzer. Core chronologies were established using 210Pb for core IG8 and the uppermost horizons of core SFL, and 14C for the remainder of core SFL. Nine subsamples from core IG8 and 17 subsamples from core SFL were measured for levels of 210Pb activity using alpha spectroscopy and converted to age using a constant rate of supply model (CRS) (Appleby and Oldfield, 1978), performed by Chronos Scientific Inc., in Ottawa, Ontario. Due to insufficient plant remains extractable from core SFL, four bulk sediment samples weighing between 300 and 500 mg dry weight were analyzed for 14C at the André E. LaLonde Accelerated Mass Spectrometry Laboratory at the University of Ottawa. The samples were calibrated using OxCal v4.3 (Bronk Ramsay, 2009) and the IntCal13 calibration curve (Reimer et al., 2013). The age-depth model was built in the “clam” package (Blaauw, 2010) in R v.3.6.0 (R Core Team, 2019).
Standard methods for chironomid processing followed Walker (2001). The subfossil head-capsule remains of chironomids were analyzed at 0.5 cm intervals between 0 and 10 cm, then at 2 cm resolution between 12 and 40 cm with two additional samples from 11 and 39 cm depth for core SFL. For core IG8, 12 samples were analyzed at 1 cm intervals between 1 and 12 cm, as well as two additional samples at 0.5 and 12.5 cm core depth. For each interval, a minimum of 50 head capsules were enumerated (Heiri and Lotter, 2001; Larocque, 2001; Quinlan and Smol, 2001) from 1 to 2 g (wet weight) of sediments washed through a 90 µm mesh sieve. The head capsules were individually picked from the sediment remaining on the sieve, oriented onto glass coverslips, and affixed to permanent slides. Remains were identified at 400x magnification under a compound light microscope to the best taxonomic resolution possible following Brooks et al. (2007), Medeiros and Quinlan (2011), and Oliver and Roussel (1983).
Numerical analyses and climate reconstructions
All data analyses were completed in R v.3.6.0 (R Core Team, 2019). Rare taxa were removed from analysis, and taxa that were retained comprised of at least > 2% of the chironomid sum per sample. Stratigraphic diagrams were divided into zones using a constrained cluster analysis with incremental sum of squares partitioning (CONISS) and a squared chord distance dissimilarity coefficient (Gordon and Birks, 1972). Significance of the zones was identified using a broken stick model (Bennett, 1996). Species richness was estimated through rarefaction using the “vegan” package v.2.5-6 (Oksansen et al., 2019). The chironomid assemblages were Hellinger-transformed and summarized using Principal Components Analysis (PCA) using the “FactoMineR” package v.2.0 (Lê et al., 2008) and visualized using the “factoextra” package v.3.6.3 (Kassambara and Mundt, 2017).
A chironomid-inferred paleotemperature model (Fortin et al., 2015) was applied to the relative abundance of chironomids from both lakes to estimate July air temperatures for the past two millennia. This was based on a weighted-averaging partial-least squares (WA-PLS) transfer function and validated with a goodness-of-fit test using the “palaeoSig” package v.2.0-3 (Telford, 2019). The root-mean square error of prediction (RMSEP) indicated a two-component model was most appropriate for the temperature reconstructions for both cores. The overall trends in the WA-PLS2-derived temperature profiles were then summarized using Gaussian smoothing Generalized Additive Modeling (GAM) in the “mgcv” package v.1.8-34 (Wood and Wood, 2019). Finally, the rate of change for temperature from 1850 CE to present was calculated for each lake.
Results
Chronology
The chronology for SFL was based on eight 210Pb and four 14C dates (Supplemental Table S1). The level of unsupported 210Pb activity in core SFL was 0.528 Bq/g in the uppermost sediment horizon and reached the supported level of 0.0326 Bg/g by 10.25 cm (Figure 2a). The lowermost three samples were below background, with activity <0.046 Bg/g; a CRS model was used to estimate the age of each interval. Four radiocarbon dates (Table 1) had no reversals and the upper three dates increase linearly with depth. However, the uppermost calibrated 14C date at 11.25 cm was dated at 870–800 cal BP (1080–1150 CE; median 834 cal yr BP), whereas the lowermost 210Pb age at 10.25 cm was dated at 1876 CE, inferring an unusually high sedimentation rate between the last 210Pb date and first 14C date. It is likely that a reservoir effect was observed, which is common in Arctic sediments (Gajewski et al., 2000; MacDonald et al., 1991; Peros and Gajewski, 2009; Tamo and Gajewksi, 2019). Thus, we corrected for reservoir effects by calculating the difference between the oldest 210Pb date (75 cal BP) and youngest 14C date (834 cal BP), then subtracted this value from the remaining radiocarbon dates following Peros and Gajewski (2009) and Tamo and Gajewski (2019). Similarly, the lowermost 14C date was unusually old, and was discarded. To compute the ages of samples deeper than 32.5 cm, 50 years were added to the third hardwater-corrected radiocarbon date for every 2-cm intervals. A new age-depth model was established by linear interpolation between the hardwater corrected calibrated ages, where the estimated hardwater correction is 731 years (Figure 3).
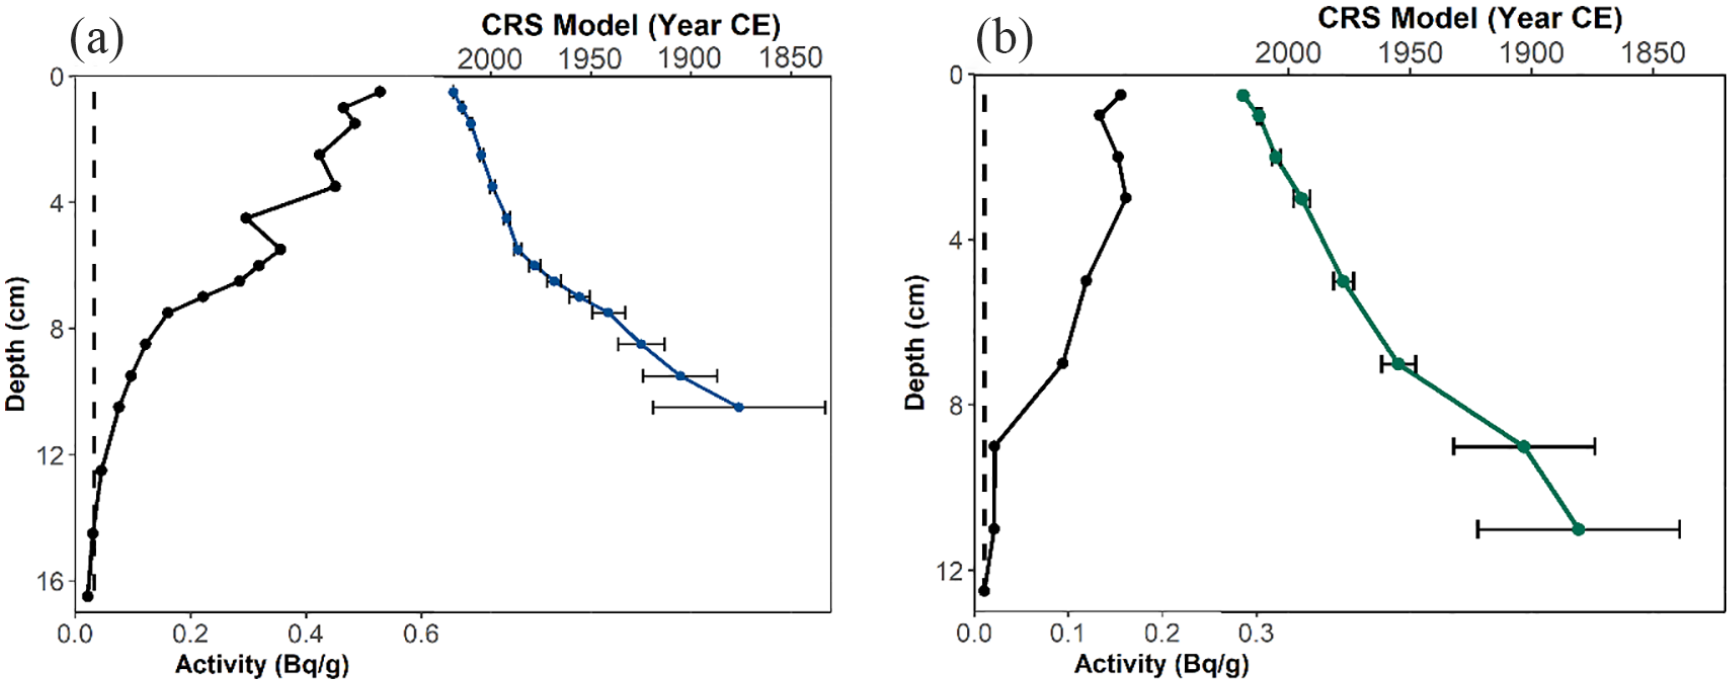
Age-depth models for cores (a) SFL and (b) IG8 based on a constant-rate-of-supply (CRS) model. Black lines represent unsupported 210Pb activity; colored lines represent CRS dates; error bars represent standard deviation; vertical dashed line represents supported 210Pb activity, respectively.
Radiocarbon dates for core SFL.
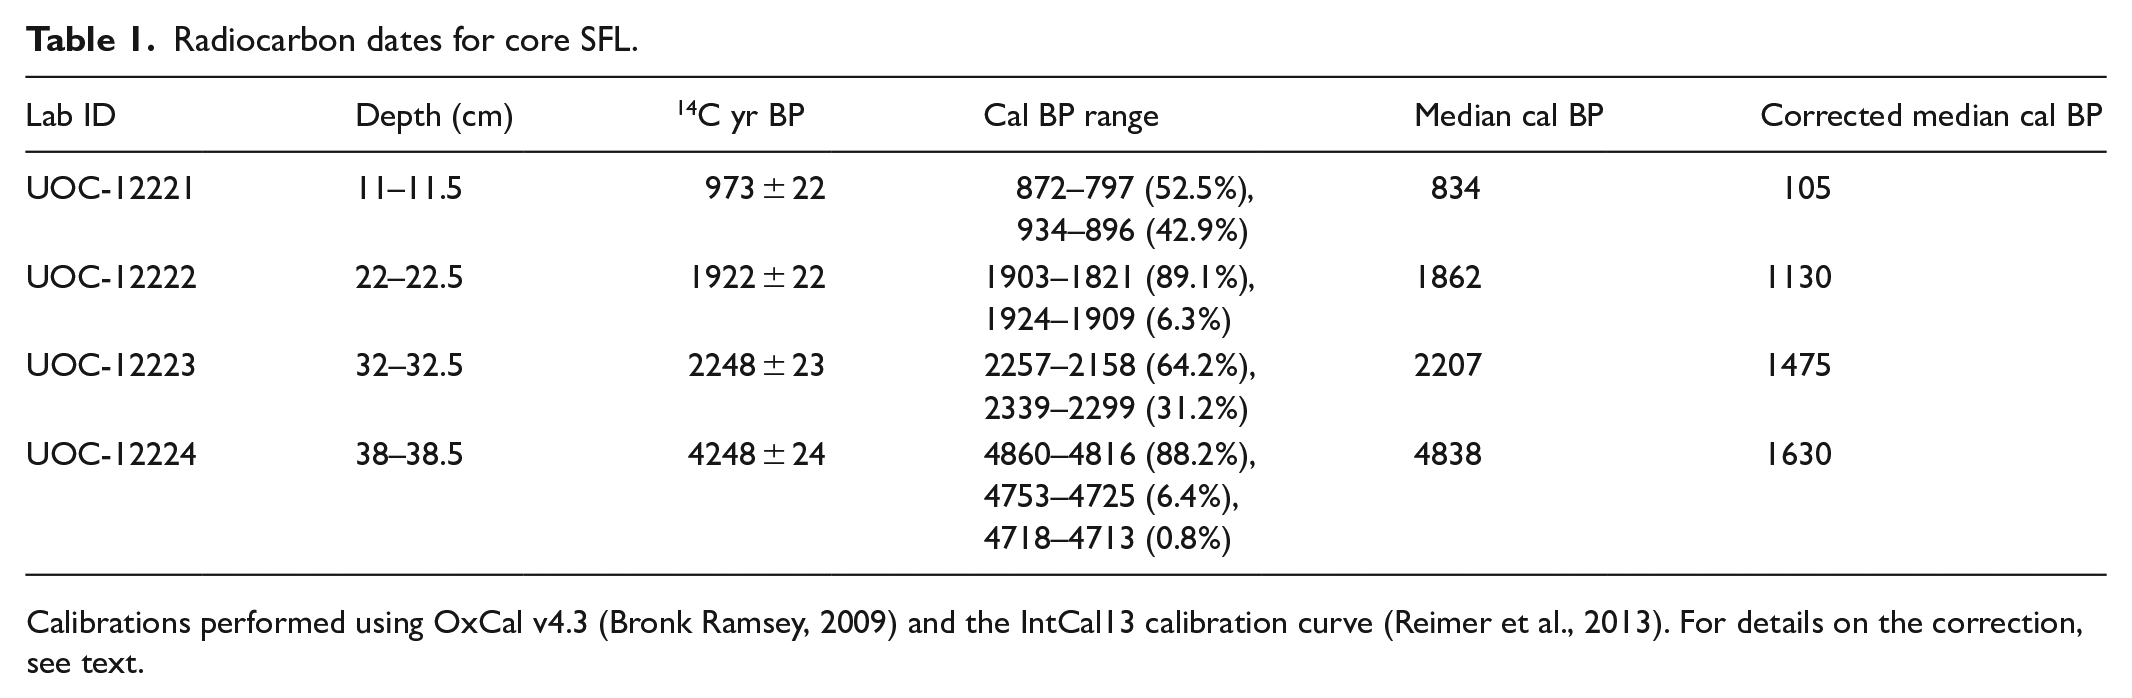
Calibrations performed using OxCal v4.3 (Bronk Ramsey, 2009) and the IntCal13 calibration curve (Reimer et al., 2013). For details on the correction, see text.
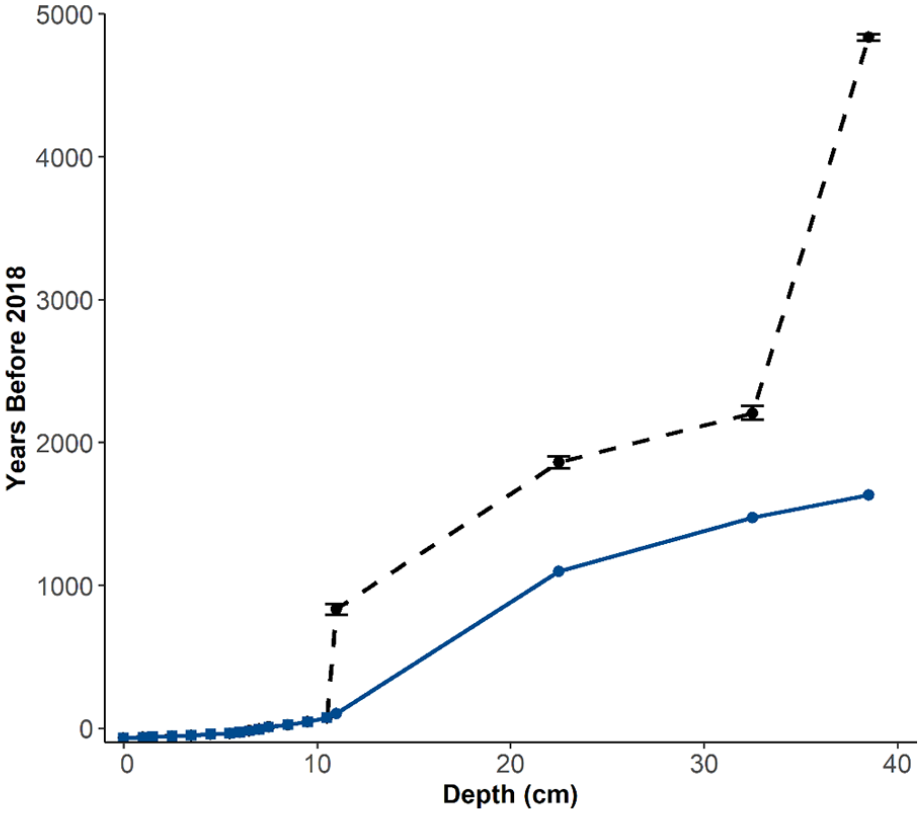
Age-depth model for core SFL. Black circles are 14C median calibrated dates with age range; squares are 210Pb dates; blue circles are hardwater-corrected 14C dates. Dashed line represents the age-depth model without hardwater correction; solid line represents the corrected age-depth model. See text for details.
The chronology for core IG8 was established using eight 210Pb dates (Supplemental Table S2). The level of unsupported 210Pb was 0.156 Bq/g in the uppermost horizon (2018 CE) and reached background at 0.0106 Bq/g at 11.75 cm. The 12.25 cm sample was below background (<0.011 Bq/g). Using the CRS model for the core, and linear extrapolation, a basal date of 1843 CE was determined. The resulting age-depth sequence for core IG8 spanned between 1843 and 2018 CE (Figure 2b).
Sedimentary stratigraphy
In core SFL %Organic matter, based on loss-on-ignition at 550°C (%OM), ranged from 6 to 60% dry mass. %OM was greatest (48–60%) in the uppermost 5.5 cm (2018–1990 CE) (Supplemental Figure S1a), and gradually decreased with depth to 7% dry mass at 40.5 cm (240 CE). From 7.5 to 9 cm (1915–1940 CE), there was a slight decrease in organic matter that spanned four samples. Carbonate content ranged from 2.5 to 11% dry mass from 0 to 30.5 cm (570–2018 CE), then increased to 28% in the remaining 10 cm of the core. In core IG8 %OM ranged from 22 to 39%, with the lower percentages occurring in the middle horizons of the core (Supplemental Figure S1b). Carbonate percentages were high and remained relatively uniform throughout the core.
Chironomid stratigraphy
The dominant taxa in core SFL were Abiskomyia, Micropsectra radialis-type, Paracladius, Sergentia, and Tanytarsus lugens-type (Figure 4a). A stratigraphically constrained cluster analysis was used to divide the chironomid assemblages into three zones. Zone 1 (240–650 CE; 28–40 cm) was comprised of samples with high values of Abiskomyia, M. radialis-type, and Sergentia, which reached maximum abundances of 45, 25, and 20%, respectively. An abrupt decrease in these taxa and an emergence of Corynocera oliveri-type and T. lugens-type, as well as Corynoneura arctica-type and Psectrocladius sordidellus-type was observed from 290 to 440 CE. Species richness increased from 12 to 16, then decreased to 13 during this time period.
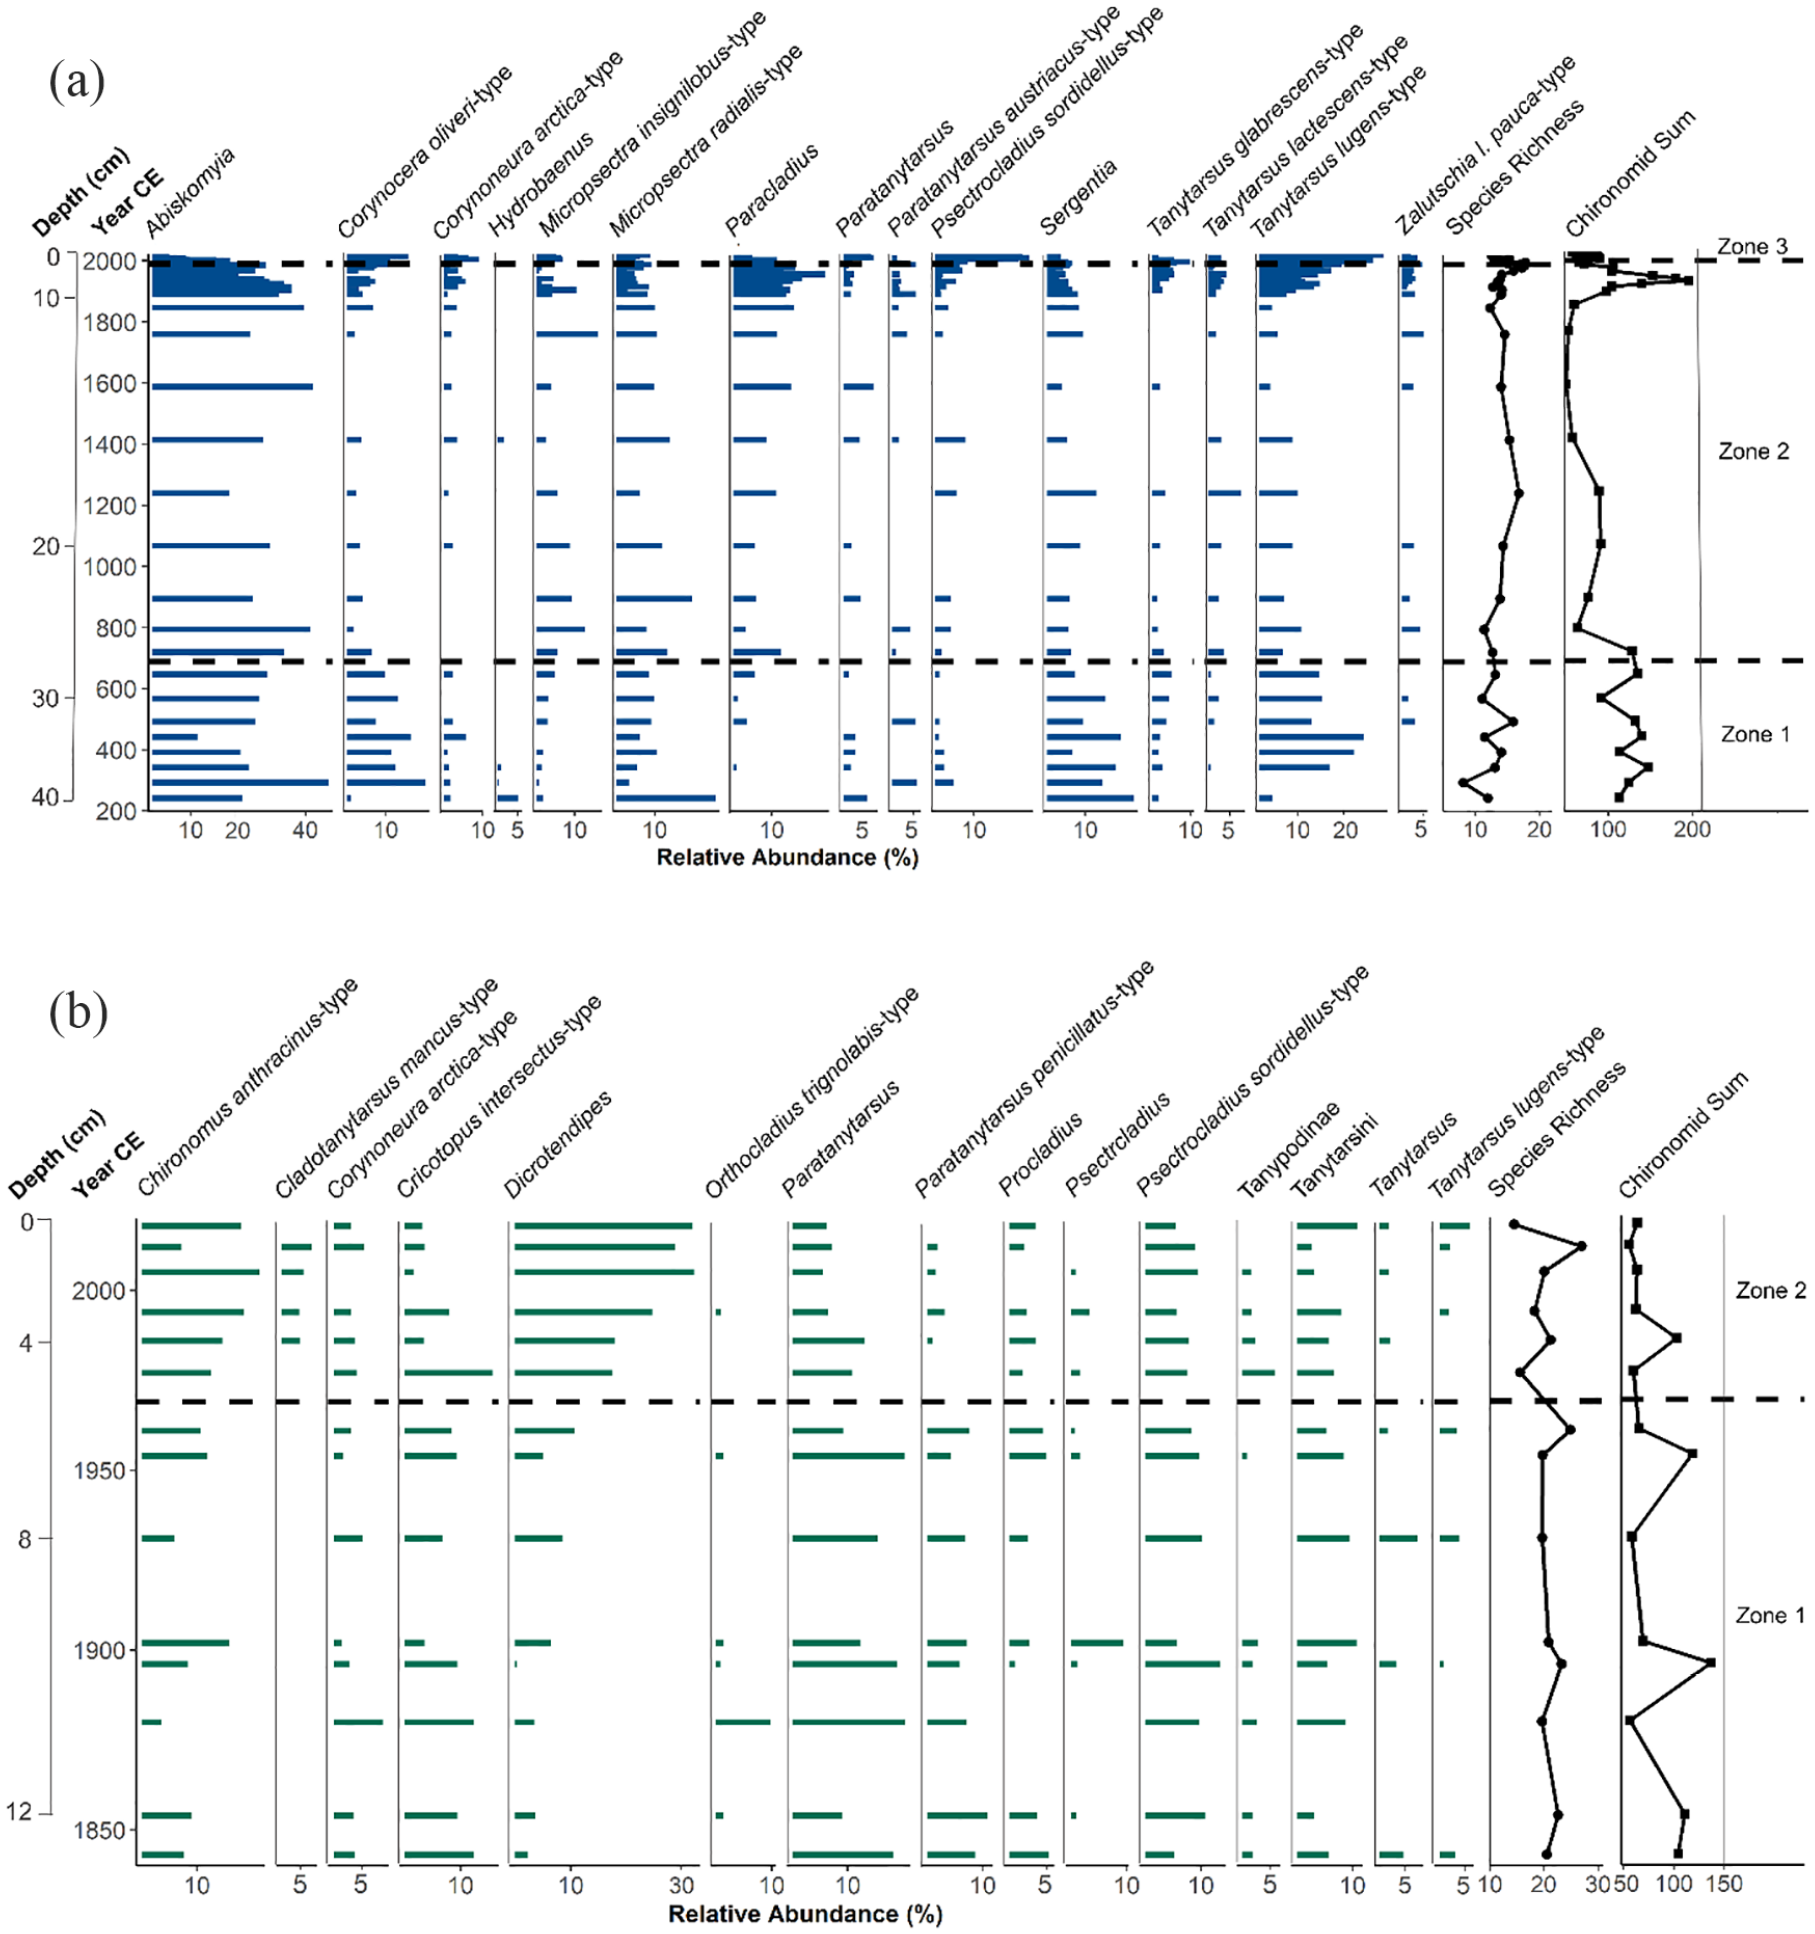
Percentages of major chironomid taxa in cores (a) SFL and (b) IG8. Species richness calculated through rarefaction analysis using all taxa from the respective depth interval. Chironomid sum is all individuals counted from each depth interval. Horizontal dashed lines denote the time zones within the respective cores based on a constrained cluster analysis.
A gradual compositional shift was observed that characterized Zone 2 (650–1990 CE; 5.5–28 cm). Abiskomyia, M. radialis-type, and Paracladius dominated between the years 720 and 1850 CE and reached maximum abundances of 40, 20, and 20%, respectively. Between the years 1850 and 1990 CE, Abiskomyia decreased from 40 to 20%, M. radialis-type from 10 to 3%, and Paracladius from 15 to 9%. During the period 1850–1990 CE, C. oliveri-type, P. sordidellus-type, and T. lugens-type increased in abundance. Species richness remained relatively stable throughout Zone 2 and increased from 12 to 18 between 1850 and 1990 CE. Zone 3 (1990–2018 CE; 0–5.5 cm) was the most dissimilar period as identified by the cluster analysis. Abiskomyia decreased from 20 to 4%, and Paracladius disappeared from the assemblages after 2010 CE. During the years 2000–2018 CE P. sordidellus-type and T. lugens-type dominated the chironomid assemblages and reached maximum abundances of 25 and 32%, respectively. Species richness decreased throughout Zone 3 from 18 to 12.
The chironomid assemblages in core IG8 were divided into two significant zones, where Zone 1 was characterized by Paratanytarsus, and P. sordidellus-type, and Zone 2 was dominated by Chironomus anthracinus-type and Dicrotendipes. Zone 1 (1840–1970 CE; 6–12.5 cm) was comprised of samples with high values of Cricotopus intersectus-type, Paratanytarsus, and P. sordidellus-type, which reached maximum abundances of 15, 20, and 15% respectively. Zone 2 (1970–2018 CE; 0–5 cm) marked the increase of C. anthracinus-type from 12 to 21%, and Dicrotendipes from 17 to 32%. Cladotanytarsus mancus-type appeared in 1980 CE, and after 2000 CE, C. intersectus-type and Paratanytarsus reached minimum abundances of 2 and 5%, respectively. Species richness was highest in 2012 CE at 27, and lowest in 1980 CE at 16.
Ordinations of chironomid assemblages
A principal components analysis (PCA) was used to evaluate temporal trends in the chironomid taxa through time. For core SFL, component 1 explained 22.9% of the variance, with taxa such as Abiskomyia, Hydrobaenus, M. radialis-type, Sergentia, and Paracladius positively correlated, and C. oliveri-type, T. lugens-type, and P. sordidellus-type negatively correlated (Figure 5a). The scores of the first component were generally positive, except between the years 390–430 CE, and again from 1990–2018 CE (Figure 5b). The scores also highlight an abrupt change after 1990 CE, when taxa negatively correlated with this axis increased in abundance. Component 2 of the PCA explained 18.8% of the variance, with C. oliveri-type, Hydrobaenus, M. radialis-type, and Sergentia negatively correlated, and T. glabrescens-type, T. lugens-type, and Paracladius positively correlated. The second component showed negative loadings between 240 and 440 CE, and high values between 1890 and 2018 CE (Figure 5c).
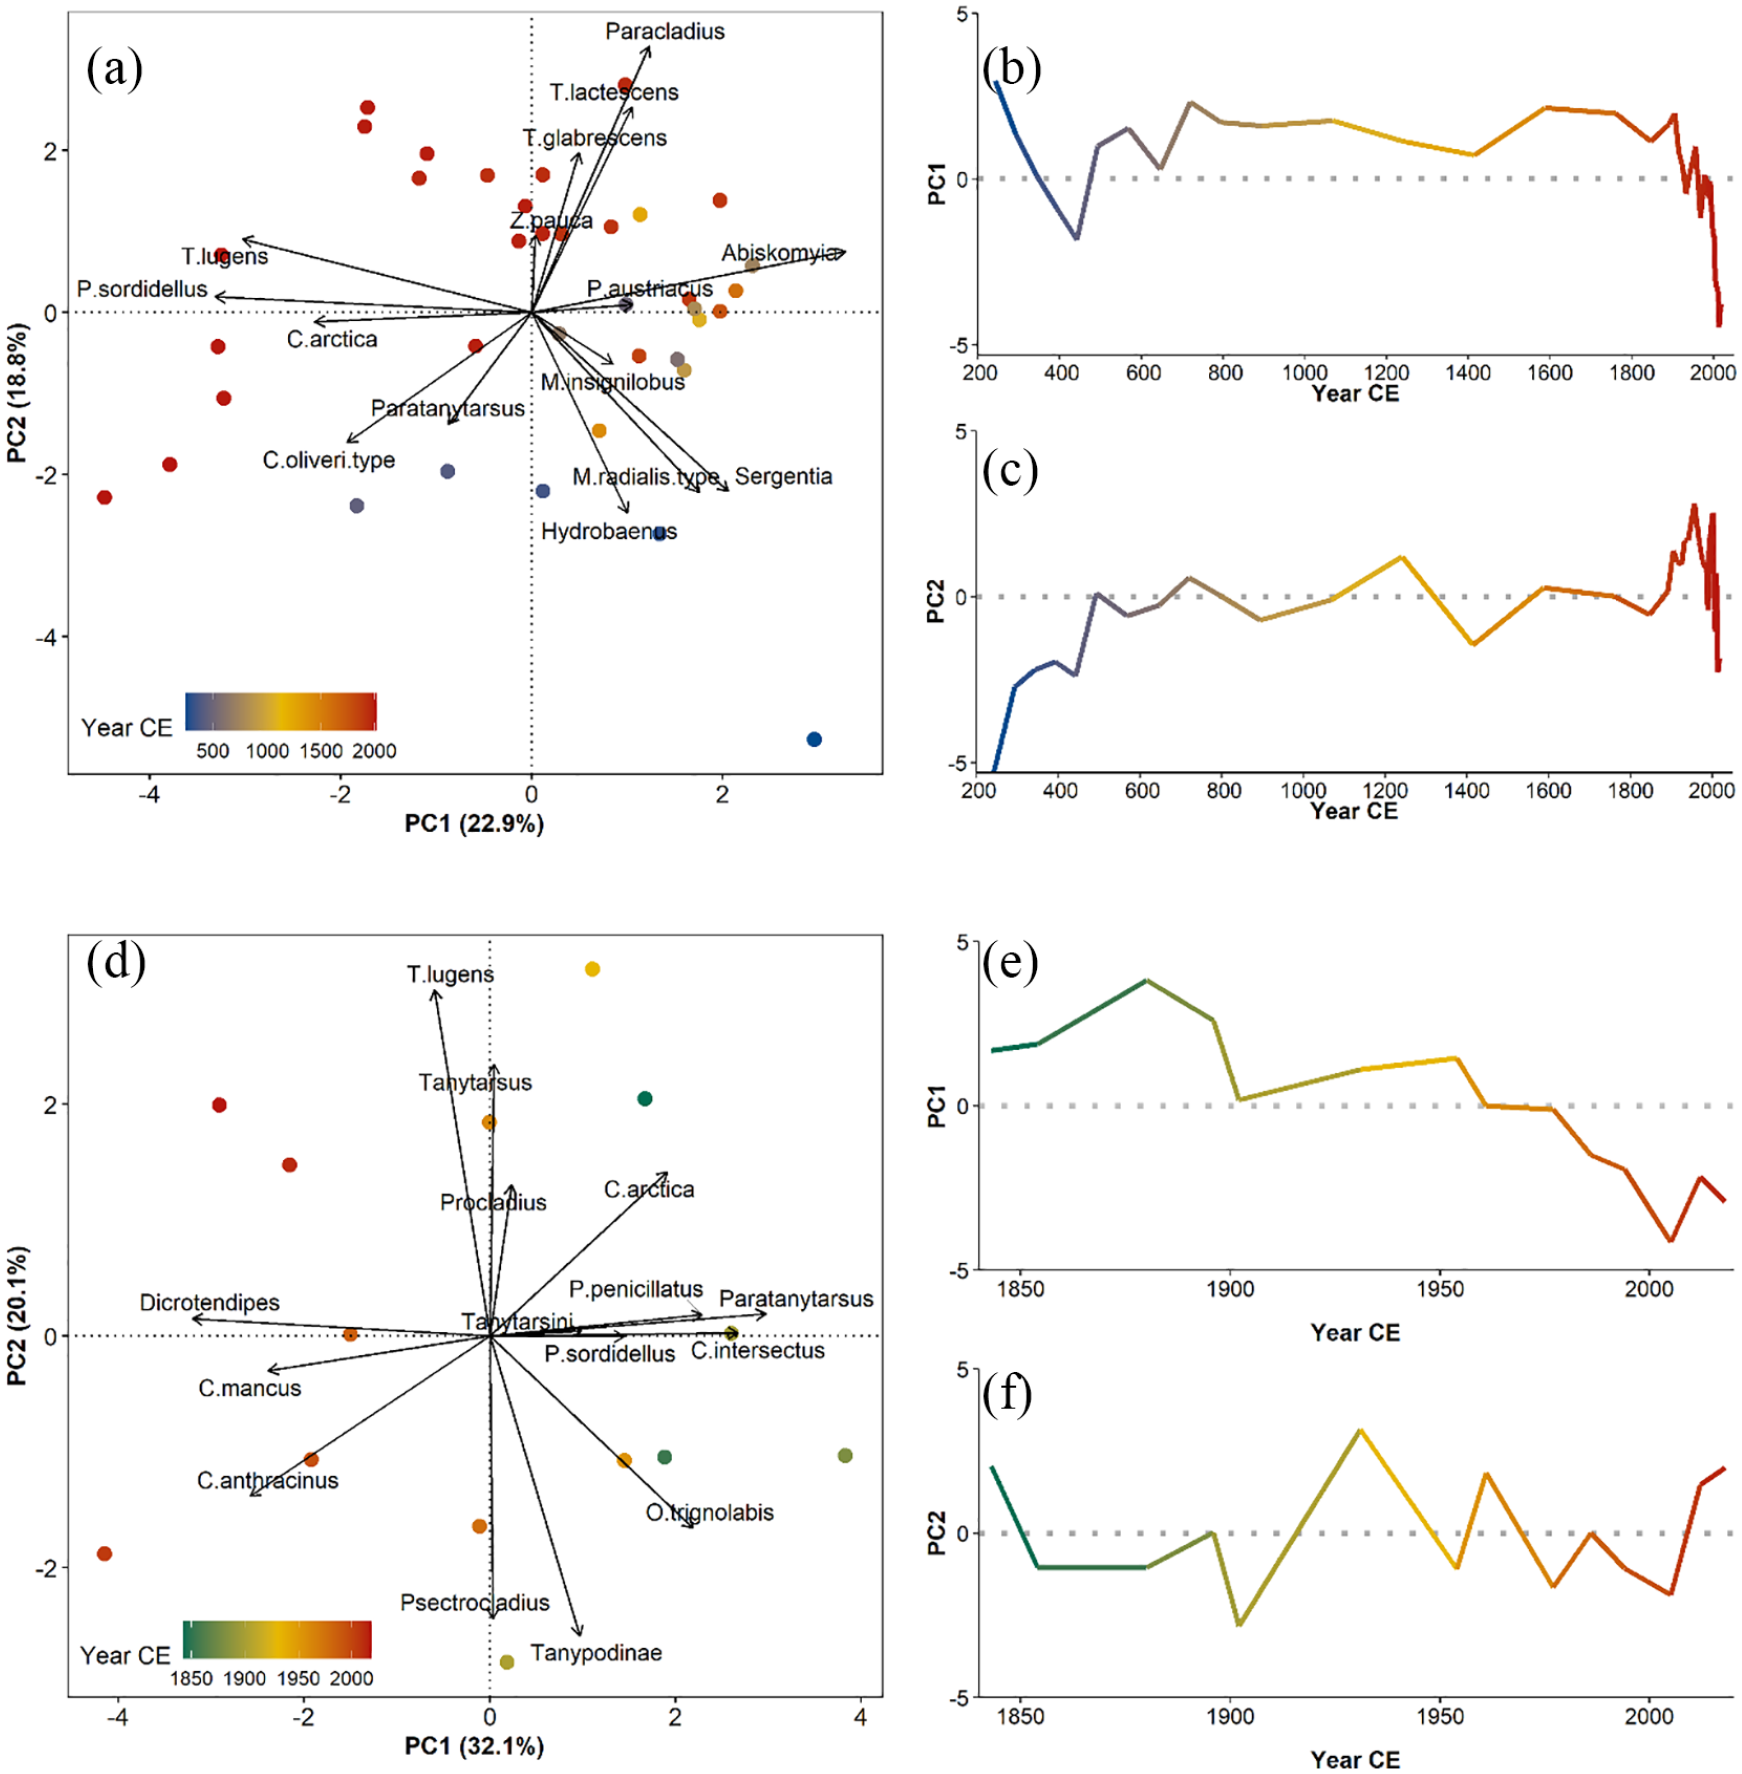
Principal components analysis of cores SFL (a–c) and IG8 (d–f). (a, d) Biplot of the loadings (arrows) and scores (dots); (b, e) scores of the first principal component through time; and (c, f) scores of the second principal component through time. The percent variance of the axis is listed on the respective biplot labels.
The first two components of the PCA of the chironomid assemblages from core IG8 explained 52.2% of the total variance. The first component explained 32.1% of the variance where C. mancus-type, Chironomus anthracinus-type, Dicrotendipes, and T. lugens-type were negatively loaded, and Corynoneura arctica-type, Cricotopus intersectus-type, and Paratanytarsus positively loaded (Figure 5d). The scores of the first component revealed a long-term decline (Figure 5e). The second principal component explained 20.1% of the variance, with C. arctica-type, Tanytarsus (undifferentiated without spur), and T. lugens-type positively loaded, and C. anthracinus-type, Orthocladius trignolabis-type, Psectrocladius, and undifferentiated Tanypodinae negatively loaded. The scores of the second component oscillate around zero (Figure 5f).
Climate reconstructions
Reconstructed July air temperatures for core SFL ranged from 4.8°C to 7.9°C and showed warmer temperatures in Zone 1, a cool period during Zone 2, and rapid warming through Zone 3 (Figure 6). The lowest reconstructed temperature in the record (4.8°C) occurred at 720 CE in Zone 2 (650–1990 CE), where temperatures ranged from 4.8°C to 6.1°C. The most recent 30 years of the record (Zone 3; 1990–2018 CE) revealed a 1.9°C increase in temperature and the highest reconstructed temperature in the record occurred in 2014 CE (7.9°C). Reconstructed July air temperatures for core IG8 showed warmer July air temperatures compared to core SFL, where the coldest reconstructed temperature occurred in 1896 CE (6.0°C) and the warmest in 2005 CE (9.2°C) (Supplemental Figure S13). During the period 1850 CE to the present, core SFL showed little change from 1850 to 1970 CE and a subsequent increase in temperature (Figure 7a), while core IG8 showed a relatively continuous increase in temperature (Figure 7b). Between the years ~1950 and 2018 CE, temperatures in core IG8 rose from 6.2°C to 8.9°C, and from 5.1°C to 7.8°C in core SFL. The linear trends for SFL and IG8 over the last ~175 years were +0.40°C and +0.17°C per decade, respectively.
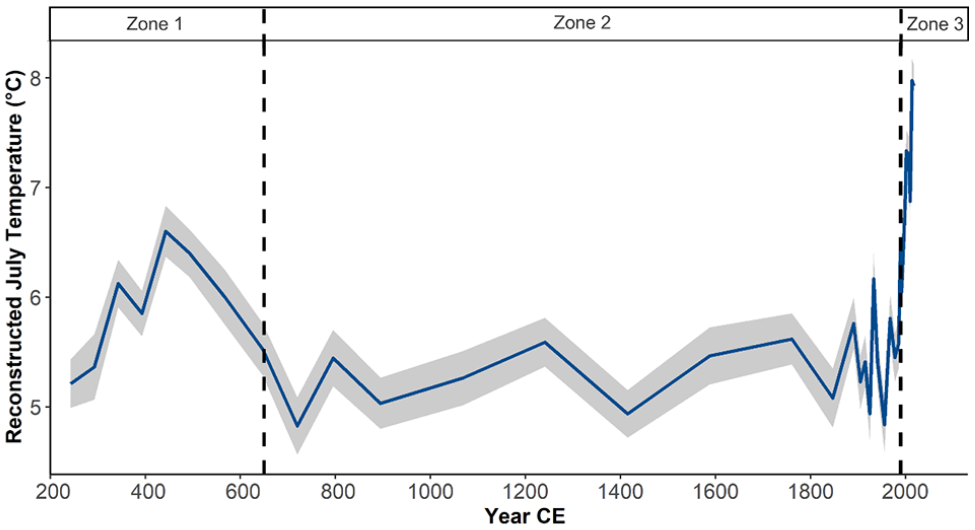
Reconstructed July air temperatures for core SFL using the Fortin et al. (2015) modern training set and the WA-PLS2 transfer function. Gray shaded area represents the standard error of the model.
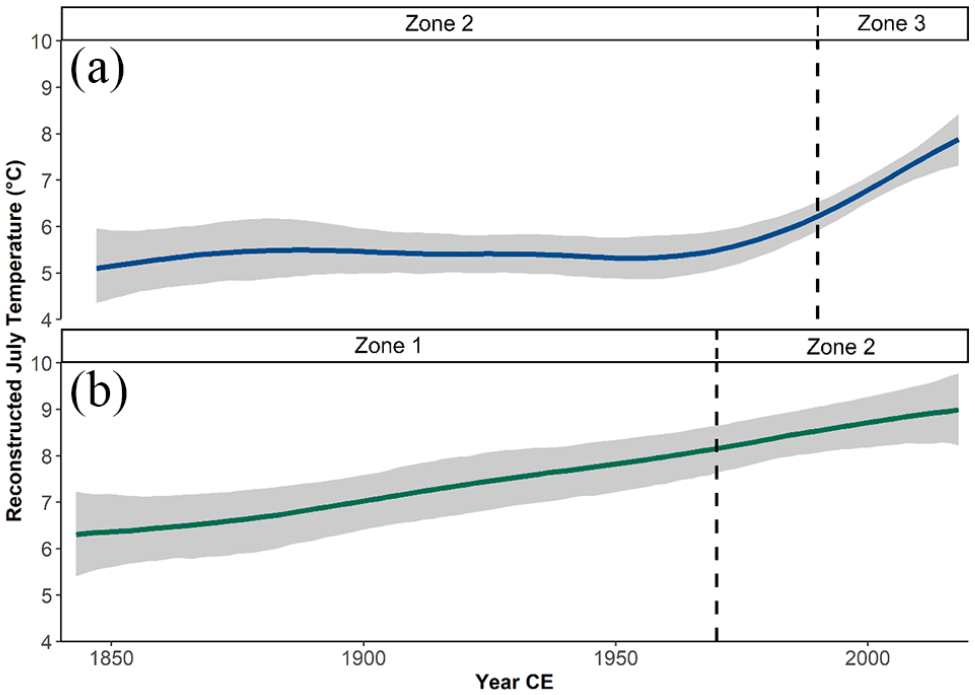
Comparison of trends in the July air temperature reconstruction over the last ~175 years for lakes (a) SFL and (b) IG8 as fit using GAM; see text for details. Gray shaded areas represent the standard error of the respective models.
Discussion
The examination of two supplemental water supply lakes for the hamlet of Igloolik, Nunavut demonstrated synchronous shifts in chironomid community structure in response to climate variability over the past 175 years. The increase in abundance of indicator taxa associated with higher temperature optima and decrease in cold-water taxa after 1980 CE in both archives suggests Small Fish Lake (Figure 4a) and Lake IG8 (Figure 4b) were transitioning to warmer, more productive systems in the recent past. The consequences of climate warming may impact water quality and quantity, thus increasing the vulnerability of these drinking water sources.
Context of the late-Holocene
The chironomid taxa in core SFL were similar to those identified in other paleolimnological records of the late-Holocene from Victoria Island (Fortin and Gajewski, 2010), Baffin Island (Thomas et al., 2011), Baker Lake (Medeiros et al., 2012), and Boothia Peninsula (Fortin and Gajewski, 2016). Temperature is an important factor in determining the composition of chironomid assemblages in this region (Medeiros and Quinlan, 2011). Previous work has identified several climate oscillations over the past 2000 years, as well as an overall cooling over this period (Ahmed et al., 2013; Kaufman et al., 2009, 2020; Werner et al., 2018).The coolest reconstructed temperatures (4.8°C) in this study (Figure 6) occurred ~720 CE, consistent with chironomid-based temperature reconstructions in the central Canadian Arctic (Porinchu et al., 2009a) and Victoria Island (Fortin and Gajewski, 2010b), for example, as well as a circum-Arctic multi-proxy reconstruction (Shi et al., 2012). Other studies have reported cooling at various times in the late-Holocene, such as during the onset of the Little Ice Age on Baffin Island (Thomas et al., 2011), or the Boothia Peninsula (Fortin and Gajewski, 2016). These observations suggest spatio-temporal heterogeneity in temperature regimes across Arctic environments (Kaufman et al., 2009; Shi et al., 2012; Werner et al., 2018), especially during the Medieval Warm Period and Little Ice Age (Ahmed et al., 2013; Nicolle et al., 2018). However, low temporal resolution of many records and dating issues make it difficult to make conclusions about the spatio-temporal climate variability across the region at this time. The most recent decades in the SFL record exhibited a reversal of the long-term cooling trend, which have been attributed to anthropogenic disturbance, and highlight that modern temperatures are anomalously warm compared to the past two millennia (Ahmed et al., 2013; Briner et al., 2016; Stocker et al., 2013).
Taxonomic richness was highest during Zone 2 of core SFL (650–1990 CE). The relative abundance of several taxa reflective of colder temperature optima (Fortin et al., 2015) declined during this period, including Sergentia, Tanytarsus lugens-type, and Corynocera oliveri-type. The relative abundance of other cold-stenotherms (Paracladius and Abiskomyia) remained high, and Micropsectra insignilobus-type increased. The coexistence of a variety of cold-temperature-optimized taxa could be reflective of the intermediate disturbance hypothesis (Connell, 1978; Finkelstein and Gajewski, 2007), which suggests that productivity is most active during periods of climate transition (Fortin and Gajewski, 2016). Recent years exhibited decreases in abundance of cold-water taxa (Abiskomyia, Paracladius, Sergentia) and suggests a transition away from oligotrophic conditions (Gajewski et al., 2005).
Recent environmental change
Over the last few decades, the chironomid assemblages in both lakes responded to temperature warming. After 1980 CE, Small Fish Lake was characterized by large declines of several cold-tolerant taxa (e.g. Abiskomyia, Paracladius, Sergentia), an increase in taxa typically found in lakes with higher dissolved organic carbon (T. lugens-type), and eurytopic taxa (P. sordidellus-type) (Figure 4a). These assemblage changes are characteristic with increases in temperature and organic matter content (Brooks et al., 2007; Gajewski et al., 2005). Lake IG8 resembles contemporary warm, shallow, Arctic lakes (Fortin et al., 2015; Gajewski et al., 2005; Medeiros and Quinlan, 2011), where biological responses appeared to be more pronounced and inferred the evolution to more mesotrophic conditions (Figure 4b). This was reflected in the compositional transition from warm water-taxa (C. intersectus-type, Paratanytarsus) in Zone 1 (1840–1970 CE) to taxa associated with higher thermal optima (C. anthracinus-type, C. mancus-type, Dicrotendipes) in Zone 2 (1970–2018 CE) (Medeiros and Quinlan, 2011; Porinchu et al., 2009b). While temperature increases are normally associated with higher taxon richness, the overall decrease in chironomid abundance and taxon richness in both cores potentially indicates secondary environmental variables such as dissolved organic carbon and nitrogen may be influencing the assemblages (Medeiros et al., 2015), affecting ecosystem stability (Mayfield et al., 2020). The increased abundance of taxa known to respond to increased nutrient availability (C. anthracinus-type, C. mancus-type, Dicrotendipes) (Gajewski et al., 2005) in Lake IG8 suggests this lake may not be a potable source of freshwater unless first subjected to standard treatment.
Both paleoclimate reconstructions (Figure 7) displayed a strong response to recent warming (Ahmed et al., 2013; Kaufman et al., 2009; Nicolle et al., 2018). The decadal rates of change for Lakes SFL and IG8, respectively, were +0.40°C and +0.17°C since 1950 CE, similar to the Stocker et al. (2013) CMIP5 projections of a 0.10°C–0.23°C per decade increase in global mean surface air temperatures for the period 2016–2035. Whereas small Arctic lakes like IG8 are more sensitive to increased air temperatures through evaporative stress (Rautio et al., 2011), SFL may be responding faster to atmospheric temperature due to thermal stratification (Medeiros et al., 2012; Rühland and Smol, 2005). These mechanisms nonetheless affect lakes of varying sizes, where recent observations of ponds evaporating (Abnizova and Young, 2010; Andresen and Lougheed, 2015), thermally stratifying (Medeiros et al., 2012; Rühland and Smol, 2005), experiencing regime shifts (Randsalu-Wendrup et al., 2016), and decreasing in size (Muster et al., 2019) have been made throughout the Canadian Arctic. Such catchment characteristics, when subjected to climatic-induced changes, have the potential to modify natural ontogenic processes and ecological successions in lacustrine environments (Kivilä et al., 2019; Law et al., 2015; Luoto et al., 2017).
Consequences for freshwater vulnerability
For water resource vulnerability assessments, a fundamental problem stems from the lack of long-term measures of change based on the data sources used for quantitative estimates. A review by Plummer et al. (2012) of 710 indicators across 50 water vulnerability assessment tools showed that the plethora of resources used to characterize water vulnerability across different geographical scales and environmental considerations generally rely on annual and decadal data. Our quantitative analysis of the paleoenvironment demonstrates that Small Fish Lake and Lake IG8, respectively, warmed by 2.56°C and 1.15°C since 1950 CE (Figure 7), and the temperature trajectories in both systems infer higher productivity, and accelerated rates of change when placed in the context of reconstructed temperatures over the last two millennia (Figure 6). Likewise, our estimates of temperature are contextualized by past ecosystem dynamics from a centennial and millennial perspective, which can increase our confidence in future change.
To facilitate future water resource assessments, we propose including paleolimnology as a method for quantifying water resource vulnerability. Paleolimnology provides a meaningful long-term perspective of climate variability to evaluate the extent of recent environmental changes. With this temporal dimension of vulnerability, uncertainty regarding natural processes and future trajectories can be reduced (Saulnier-Talbot, 2016). Informing sustainable freshwater use for community and regional planning is essential for Arctic water security (Medeiros et al., 2017), especially with the prevalence of population expansion and limited water infrastructure (Instanes et al., 2016). Addressing Arctic water security in relation to climate change ultimately requires a contextual approach (Ingram, 2008) to reduce water vulnerability and increase sustainability for human and environmental well-being (Bunch et al., 2011).
Conclusions
A paleolimnological assessment applied to two supplemental drinking water sources in Igloolik, Nunavut, analyzed biological responses to climate change over the late-Holocene and indicated water resource vulnerability. Reconstructed July air temperatures showed an overall cooling that preceded significant warming from 5.4°C to 7.9°C after 1980 CE, and stratigraphic changes from cold- to warm-water taxa after 1980 CE were observed in both lakes. Historical biological responses to climate perturbations demonstrated that recent environmental changes are anomalous in the archives, and increased lake productivity in Lake IG8 may impact potable usage. Utilizing biological indicators from centennial and millennial archives expands upon current water resource assessments that operate on annual and decadal scales to better contextualize aquatic ecosystem functioning. As well, paleolimnology allows for improved quantifications of water resource vulnerability, which can inform community and regional planning in the context of evolving, dynamic socioeconomic, and environmental pressures.
Supplemental Material
sj-pdf-1-hol-10.1177_09596836211003234 – Supplemental material for Quantifying the vulnerability of Arctic water supply lakes through paleolimnological assessment: The case of Igloolik, Nunavut, Canada
Supplemental material, sj-pdf-1-hol-10.1177_09596836211003234 for Quantifying the vulnerability of Arctic water supply lakes through paleolimnological assessment: The case of Igloolik, Nunavut, Canada by Paige Cincio, Andrew Scott Medeiros, Sonia D Wesche and Konrad Gajewski in The Holocene
Footnotes
Acknowledgements
We are grateful to Michael Bakaic, Andy Williams, Sherry Wu, and Simon Qamanirq field sampling assistance, and the staff at the Nunavut Research Institute for providing fieldwork support. We thank Cara MacKenzie for assistance in processing and identification of chironomids, and Freddy Liu for GIS assistance. We also thank Igloolik SAO Greg Morash, Mayor Merlyn Recinos, and Council for their guidance and support. Samples were collected under a Land and Water Scientific Research License (02-046-18N-M) from the Nunavut Research Institute and a Nunavut Water Board approval for the use of water without a license (8WLC-WRA1819). We thank two anonymous reviewers whose constructive comments helped to improve this manuscript. Primary data generated from this study can be found archived on the corresponding authors github repository (DOI: 10.5281/zenodo.4591542).
Funding
The author(s) disclosed receipt of the following financial support for the research, authorship, and/or publication of this article: This project was funded by the Climate Change Preparedness in the North Program awarded to ASM and SDW by Crown-Indigenous Relations and Northern Affairs Canada, the Northern Scientific Training Program awarded to PC, and Dalhousie University.
Supplemental material
Supplemental material for this article is available online.
References
Supplementary Material
Please find the following supplemental material available below.
For Open Access articles published under a Creative Commons License, all supplemental material carries the same license as the article it is associated with.
For non-Open Access articles published, all supplemental material carries a non-exclusive license, and permission requests for re-use of supplemental material or any part of supplemental material shall be sent directly to the copyright owner as specified in the copyright notice associated with the article.