
Abstract
Daily weather diaries and meteorological records from Scotland reveal complex weather patterns following the 1783–84 fissure eruption of the Laki volcano, Iceland. Four diarists in eastern and northern Scotland describe the near-simultaneous occurrence of discrete groups of days characterised by ‘foggy’, ‘gloomy’ and ‘hazy’ conditions during June and July 1783. The weather records suggest that an ash-rich portion of the initial plume may have arrived synchronously across eastern Scotland on June 15th, 5 days after the first eruption in Iceland, and lingered for between 5 and 7 days. Following a 3-day interval of fine weather, a sulphurous haze arrived on June 24th and persisted for the rest of the summer. As the summer progressed air pollution episodes became shorter, less frequent and more influenced by air pressure fluctuations. The effect of the eruption on Scotland’s climate is unclear although a negative air temperature anomaly of 1.5°C to 2.5°C below the decadal average occurred in September 1783 lasting for 16 days at Dalkeith and 33 days at Fochabers. The 1783–84 winter in Scotland was one of the coldest in recent centuries and was accompanied by prolonged snow and frost through the first 4 months of 1784. During this period, temperatures in eastern Scotland averaged 2.0°C to 2.6°C below the decadal average. The duration and amplitude of post-eruption negative temperature anomalies appear to have been strongly associated with synoptic air pressure and wind flow patterns and not simply related to volcanically-forced cooling. This challenges the hypothesis that the Laki eruptions were responsible for the sustained lowering of air temperatures over the three successive winters of 1783–84, 1784–85 and 1785–86.
Introduction and aims
One of the greatest natural catastrophes to have affected Europe was air pollution from the 1783–84 fissure eruption of the Laki volcano in Iceland (Oppenheimer, 2011). The eruption commenced on June 8th 1783 and continued episodically for 8 months until February 1784. Over this period, approximately 120 Tg of sulphur dioxide (SO2) and 0.4 km3 of volcanic tephra was released into the upper troposphere and lower stratosphere. A huge volume of dilute H2SO4 entered the atmosphere from the Laki fissure, and the volume of sulphates released exceeded all other Holocene volcanic eruptions (Thordarson and Self, 2003). An estimated c.105 Mt of H2SO4 aerosol was released in the 2 weeks following the start of the eruption and remained within the troposphere for 2–3 years (Pausata et al., 2015).
The environmental and climatic effects of the eruption were far-reaching. Laki was indirectly responsible for the death of the majority of Iceland’s livestock and c. 25% of the human population (Edmonds et al., 2018; Thordarson and Self, 2003). In Europe, a plume of sulphurous aerosols (variously described as ‘dry’, ‘yellow’ or ‘sulphurous’ fog or haze) spread across the continent during the 2 weeks following the eruption causing significant respiratory illnesses (Durand and Grattan, 1999) and considerable excess mortality (Balkanski et al., 2018; Grattan et al., 2005; Schmidt et al., 2011; Witham and Oppenheimer, 2005) (Figure 1). The eruption is considered to have caused a lowering of northern hemisphere air temperatures of c. 1.0°C in the summer of 1783 and has been implicated in winter cooling over a 3-year post-eruption period (Grattan and Brayshay, 1995; Grattan et al., 1998; Oman et al., 2006; Schmidt et al., 2012). Unlike short-lived explosive eruptions such as Tambora (AD 1815) and Pinatubo (AD 1991), long-lasting high-latitude fissure eruptions such as Laki are not well understood in terms of their sulphate dispersal, radiative forcing and atmospheric circulation (Briffa et al., 1998; Fischer et al., 2007; Pausata et al., 2015; Zambri et al., 2019a). Similarly, the persistence of Laki sulphate aerosols in the atmosphere and their effect on regional climate is uncertain, as well as the magnitude and duration of volcano-induced radiative forcing of climate and its impact (D’Arrigo et al., 2011; Oman et al., 2006; Zambri et al., 2019b).
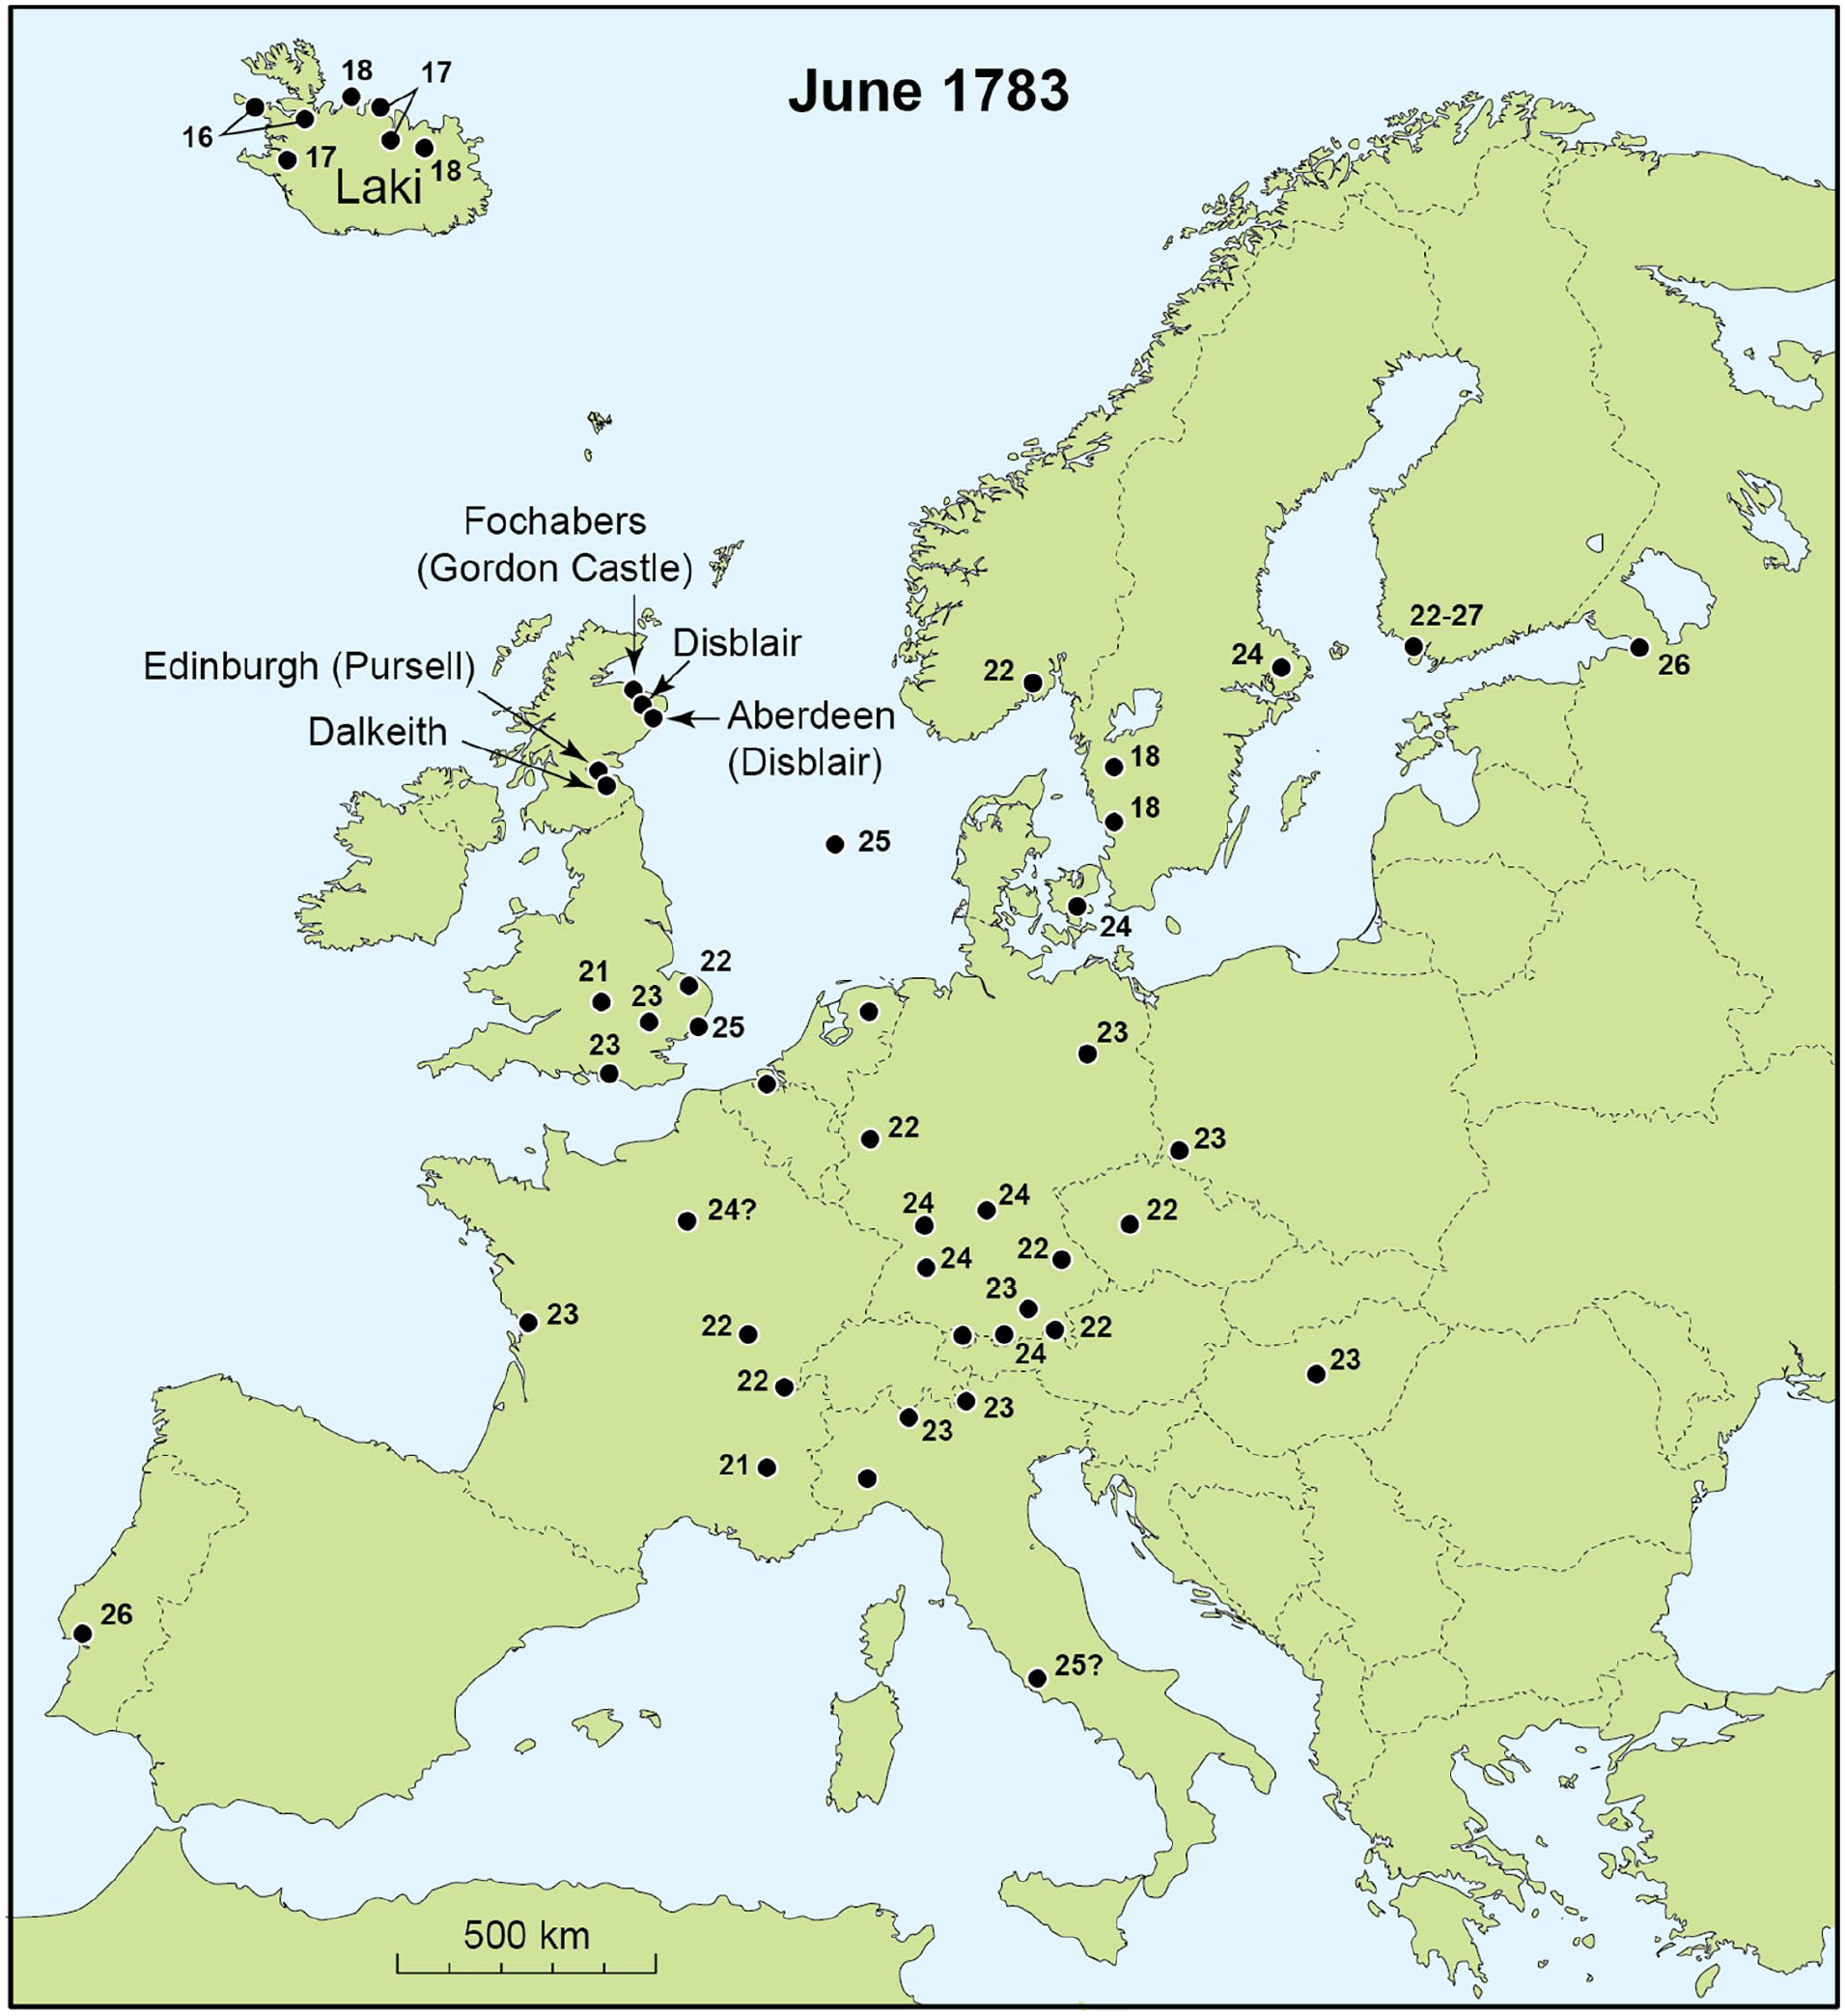
Dates of the first recorded occurrence of sulphurous haze and fog following the Laki eruption on 8 June 1783 (adapted from Thordarson and Self, 2003). The numbers refer to June dates. The locations of the Scottish archive sources used in this study are indicated.
Terrain located immediately downwind of eruption sources may be expected to exhibit the greatest climatic impacts (Zambri et al., 2019b). In respect of the British Isles, the effect of the aerosol plume on the atmosphere as well as on health and mortality are well-documented only for central and southern England and further afield (Balkanski et al., 2018; Grattan et al., 1998, 2005; Stothers, 1996; Witham and Oppenheimer, 2005). For Scotland there is almost no published information apart from Thordarson and Self’s (2003) review that refers to a single observation of ‘haze’ in Caithness (northern Scotland) around June 10th 1783.
The summer of 1783 was dominated by long-lasting anticyclonic circulation that led to it being one of the warmest summers across Europe during recent centuries (Kington, 2010; Manley, 1974). Equally, the winters of 1783–84 and 1784–85 were two of the coldest and were associated with extensive sea ice cover around Iceland and the Greenland Sea (Brazdil et al., 2010; D’Arrigo et al., 2011; Lamb, 1977; Parker et al., 1992; Yiou et al., 2014). Some authors regard these exceptional winters as a consequence of the Laki eruption while others argue that they were simply part of natural climatic variability unrelated to the Laki eruption (D’Arrigo et al., 2011; Schmidt et al., 2012). Surprisingly, the now classic long-term (1764–1896) Edinburgh weather compilation of Mossman (1896, 1897, 1902) makes no reference to meteorological changes caused by the Laki eruption.
Climate models suggest that the warm summer of 1783 in Europe was unrelated to volcanic radiative forcing (Highwood and Stevenson, 2003; Oman et al., 2006; Schmidt et al., 2011; Zambri et al., 2019b). The models produce a short period of strong radiative cooling, with different model versions placing the peak forcing in mid-July 1783 (Zambri et al., 2019b), early August (Oman et al., 2006), or late September (Highwood and Stevenson, 2003), while Schmidt et al. (2012) note that the duration of volcanogenic cooling would have exceeded the timing of peak forcing. Thus, the very cold post-eruption winter (1783–84) has been widely ascribed to the climatic effect of Laki (Brazdil et al., 2010; Schmidt et al., 2012; Thordarson and Self, 2003). An opposing interpretation was proposed by D’Arrigo et al. (2011) who concluded from model experiments that ‘. . .these events likely resulted from natural variability unconnected to Laki’. While these studies use volcanic forcing and ‘natural climatic variability’ as independent variables, other work suggests that large volcanic eruptions may themselves induce distinctive post-eruption circulation patterns in the troposphere (Esper et al., 2013; Fischer et al., 2007).
We present here an analysis of archive documents from eastern and northern Scotland that contain daily measurements of weather contemporaneous with the Laki eruption as well as for the years that followed. Whereas the climate model outputs almost always make use of monthly and seasonal means, the results presented here are based on contemporary daily weather observations that enable us to examine short-term relationships between weather and climate phenomena focusing, in particular, on the post-eruption period between June 1783 and December 1784. The research seeks firstly to document the onset, character and duration of Laki post-eruption atmospheric pollution phenomena in Scotland. A second aim is to construct for eastern and northern Scotland a daily record of post-eruption weather anomalies. Thirdly, we attempt to compare the daily records of local weather with the predicted patterns of weather and climate changes derived from numerical models. Lastly, we use the meteorological data for Scotland to evaluate the relative importance of changes in the synoptic climatology and volcanic forcing on regional climate.
Weather diaries and meteorological observations
Archive sources
Five archive sources are used in our reconstructions (Figure 1; Table 1). The first of these is for Dalkeith Castle, 10 km south-east of Edinburgh, and comprises daily measurements and observations by John Alvus, chamberlain to his Grace, Henry, Duke of Buccleuch (Dalkeith Weather Diary (1783–1790)). Nearby, a Dr Pursell (we think John Warrack Pursell, a surgeon on George Street, Edinburgh) provided detailed weather descriptions for central Edinburgh (Edinburgh Weather Diary (1783–84)) (Figure 2), while 300 km to the north a record from Fochabers (Morayshire) contains twice-daily readings from Gordon Castle (Gordon Castle Weather Diary (1781–1812)). These records are supplemented by the diary of Janet Burnet of Kemnay and Disblair, Aberdeenshire (Pearson, 1994), and the well-known long-term monthly Edinburgh weather series for 1769–1896 constructed by Mossman (1896, 1897, 1902). Burnet’s weather records are descriptive and are specific to individual days. By contrast, Mossman’s record represents a compilation of 135 years of monthly average air temperature data which we use here to put into context the weather and climate of the 1781–90 decade.
Summary of the archive sources employed in this study.
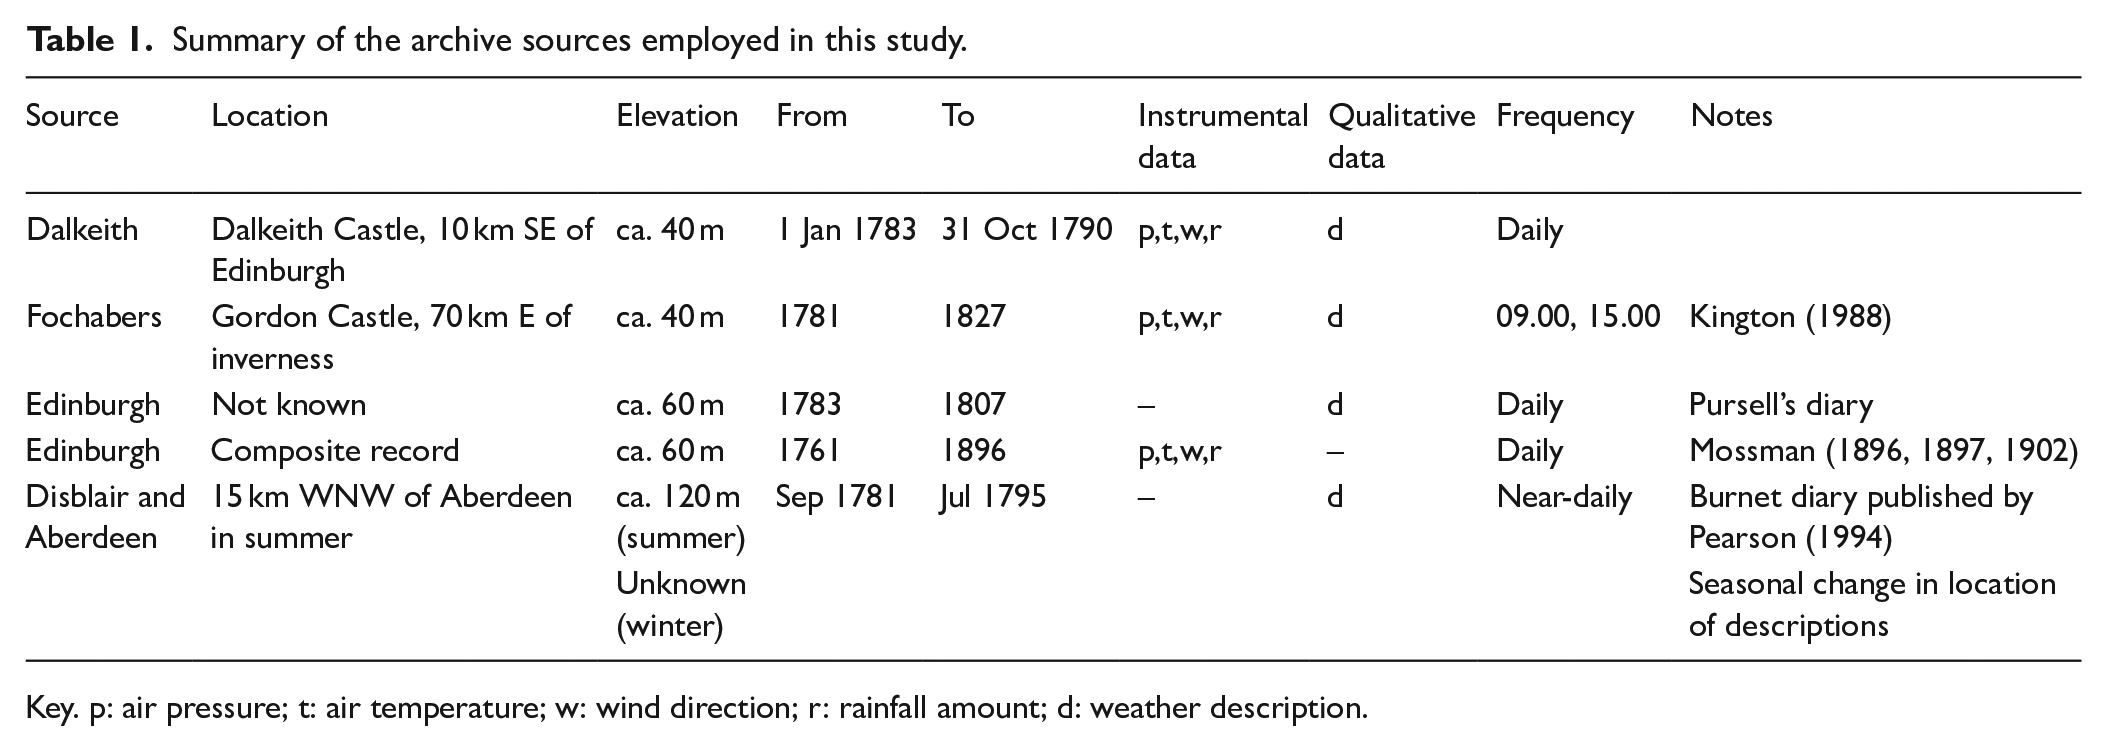
Key. p: air pressure; t: air temperature; w: wind direction; r: rainfall amount; d: weather description.
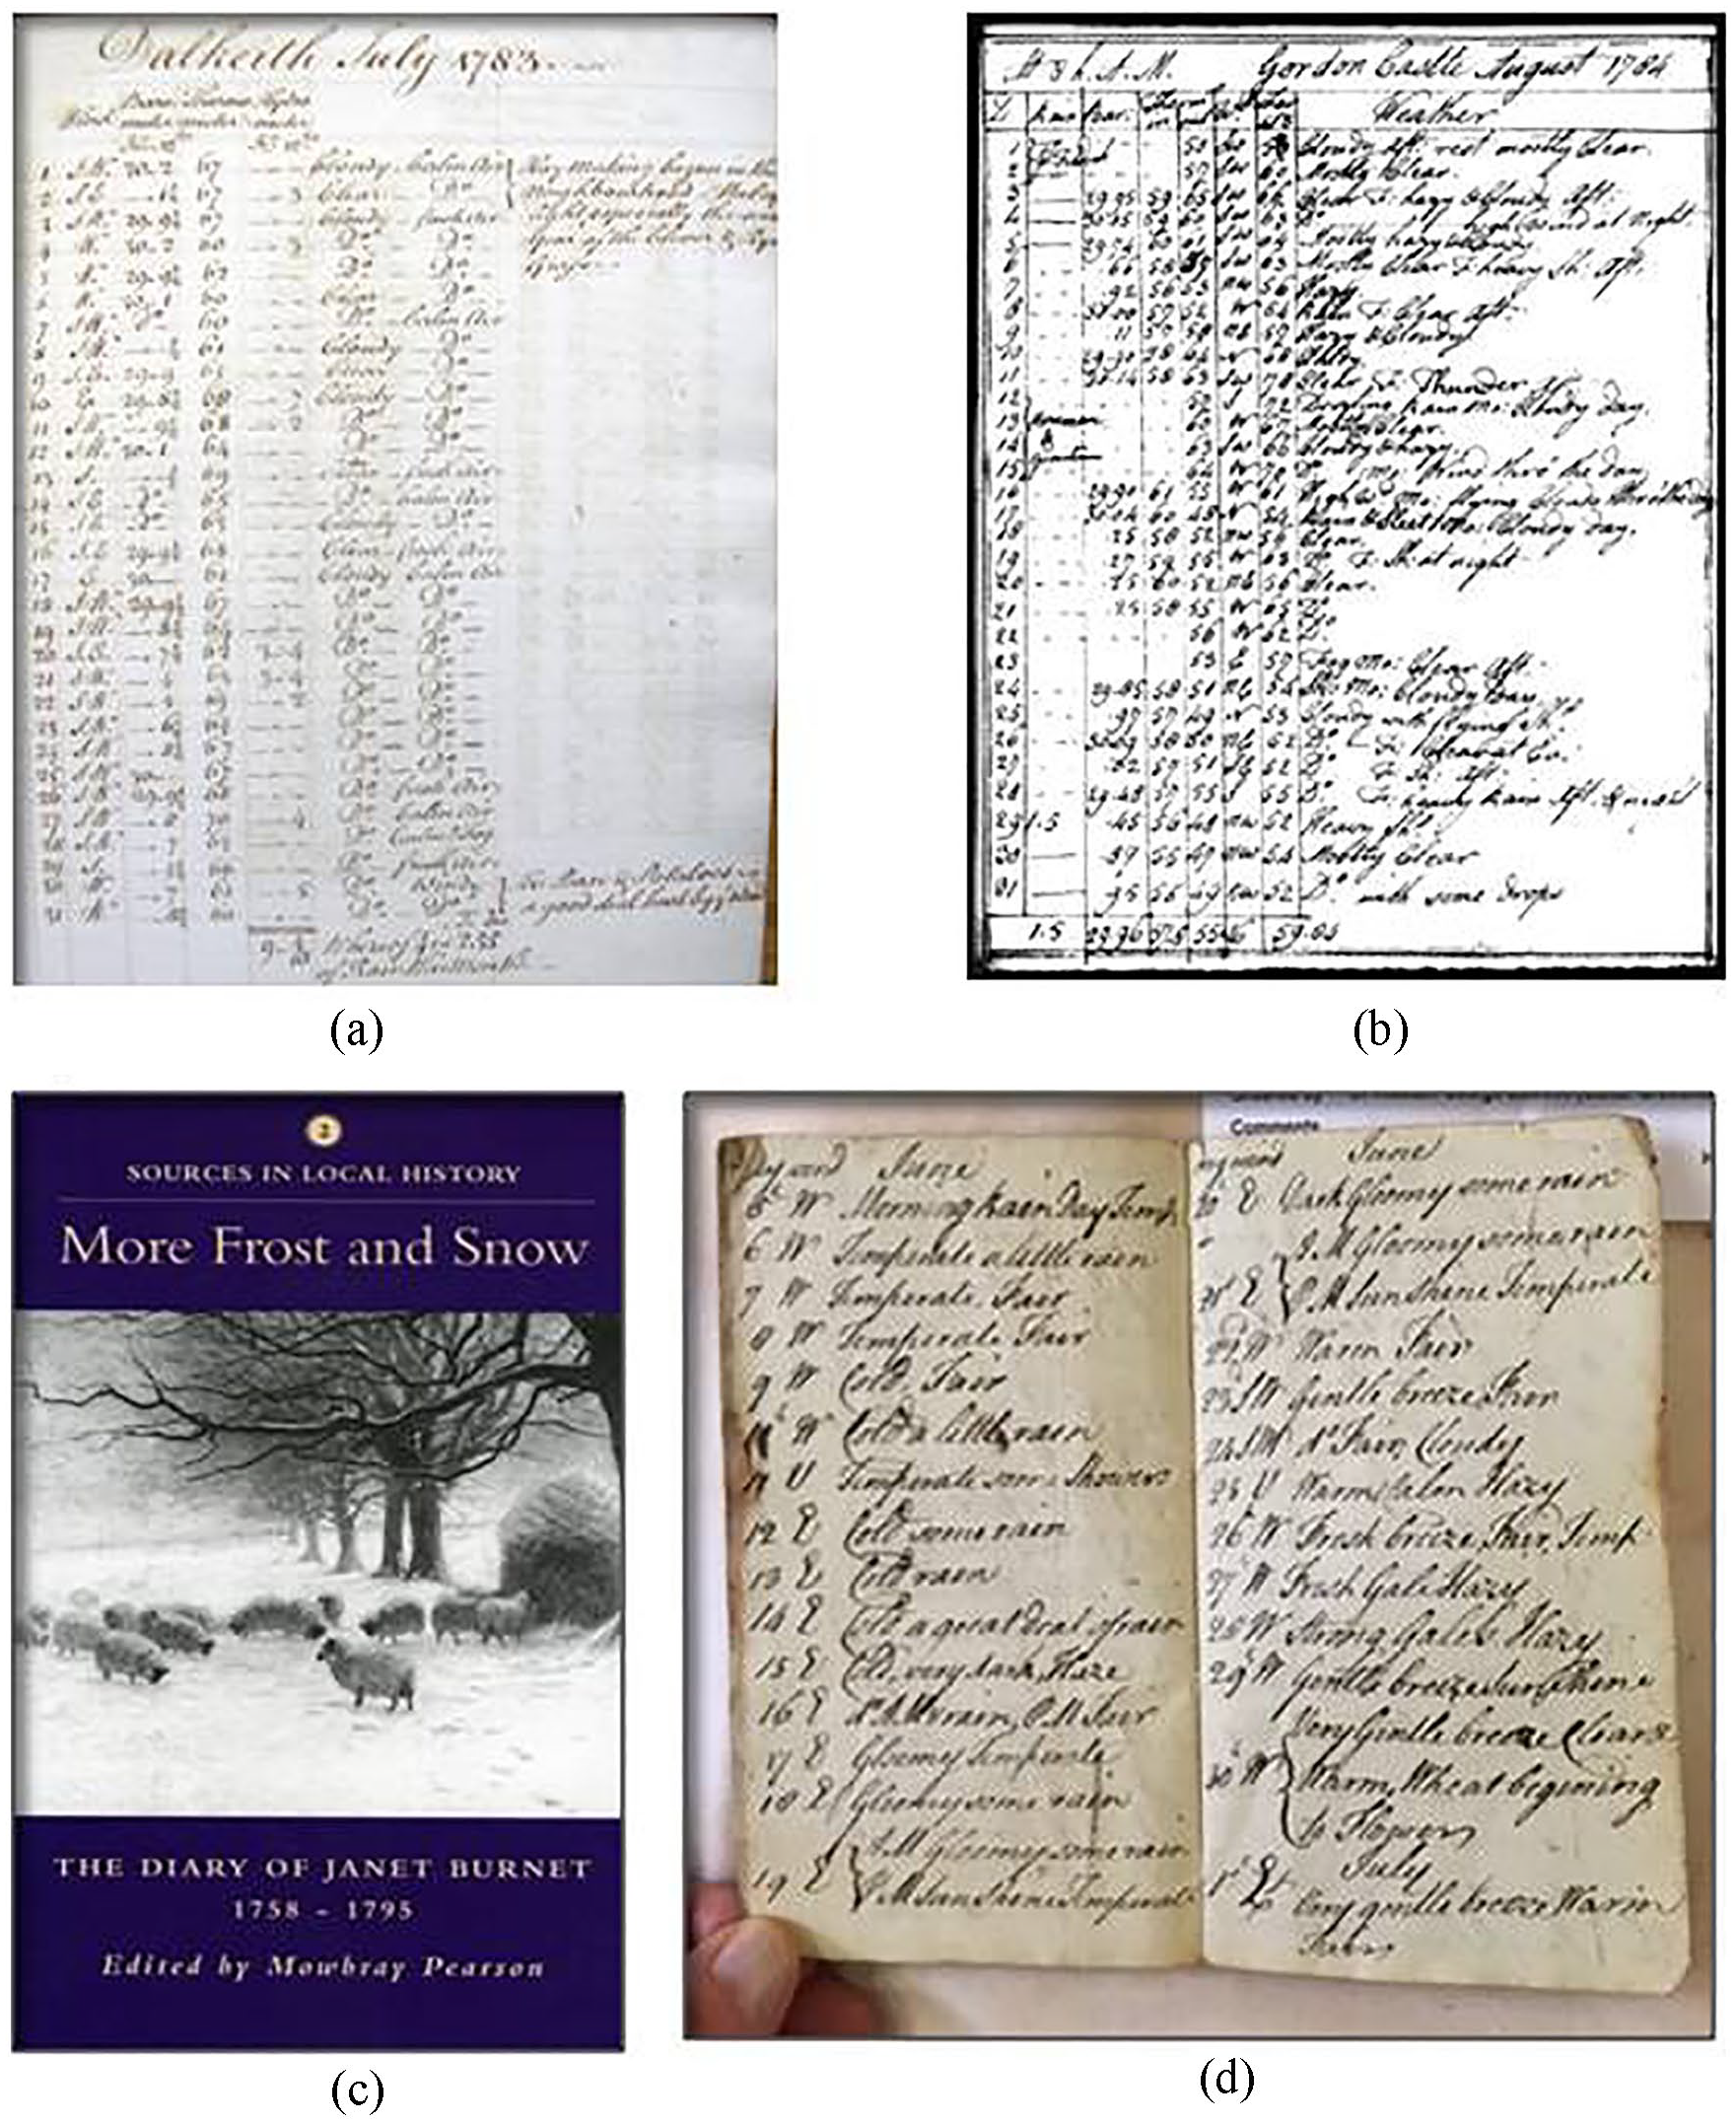
Examples of data sources. (a) Dalkeith weather diary page. (b) Fochabers weather diary page. (c) Front cover of Janet Burnet diary (after Pearson, 1994). (d) Dr Pursell weather diary page for Edinburgh.
Our investigation of these weather archives points to the likelihood that the various observers who were compiling the weather records during the summer and autumn of 1783 were unaware that a large volcanic eruption had taken place in Iceland. None of the various diary entries make any reference to a distant volcanic eruption. However, considered together, the diaries enable a reconstruction to be made of the effects of the Laki eruption on weather across eastern and northern Scotland. In particular, the Dalkeith and Fochabers data represent rare examples for northern Europe of daily weather records covering the late 18th century.
The hand-written notes contained within the weather diaries provide descriptions of atmospheric phenomena that demonstrate the presence over Scotland during the summer of 1783 of a sulphurous aerosol from Laki. By contrast the instrumental records of air pressure, air temperature and wind direction are sufficient to enable a reconstruction of the pattern of atmospheric changes that took place throughout the post-eruption period. Each archive has its strengths and weaknesses. The Dalkeith diary lacks a statement of the time of day of the meteorological readings, though we presume that the measurements were made at the same time each day. The Fochabers diary provides information on the time of day when weather readings were taken but the time series has occasional gaps in the measurement history. Neither of these two diaries provides information on either the specific instruments used to make the weather measurements, their maintenance or calibration, nor the altitudes or locations of the ground surfaces on which the instruments were used. This is a particular issue in respect of the air pressure readings. Our best estimate is that for both Fochabers and Dalkeith the estate grounds where the respective barometers were placed occur ca. 40 m above sea level (Ordnance Datum). Since the exact instrument elevations are unknown, the air pressure readings are not corrected for altitude (although this correction is likely to be negligible).
Data analysis
The daily instrumental weather records for Fochabers and Dalkeith were analysed for the time interval January 1st 1783 (6 months prior to the first Laki eruption) until October 31st 1790 (the end of the Dalkeith time series). Daily temperature and air pressure series and monthly averages were derived (the respective time series for Dalkeith and Fochabers are available for inspection on request). The mean values of air temperature for each day within this study period were calculated for each site to allow daily temperature anomalies for the 1780s to be compared with mean values for individual days within the decade. The Dalkeith and Fochabers data were also compared with the monthly Mossman time series that provides a longer reference series but at lower temporal resolution. Daily time series were also calculated for each instrumental record of air pressure, wind direction and observations of ‘haze’, ‘fog’ and ‘gloom’. At Fochabers, air temperature was measured twice daily at 9 am and 3 pm, and often indoors and outdoors: here we use the outdoor 9 am time series only.
Results
Long term context using Mossman monthly temperature averages
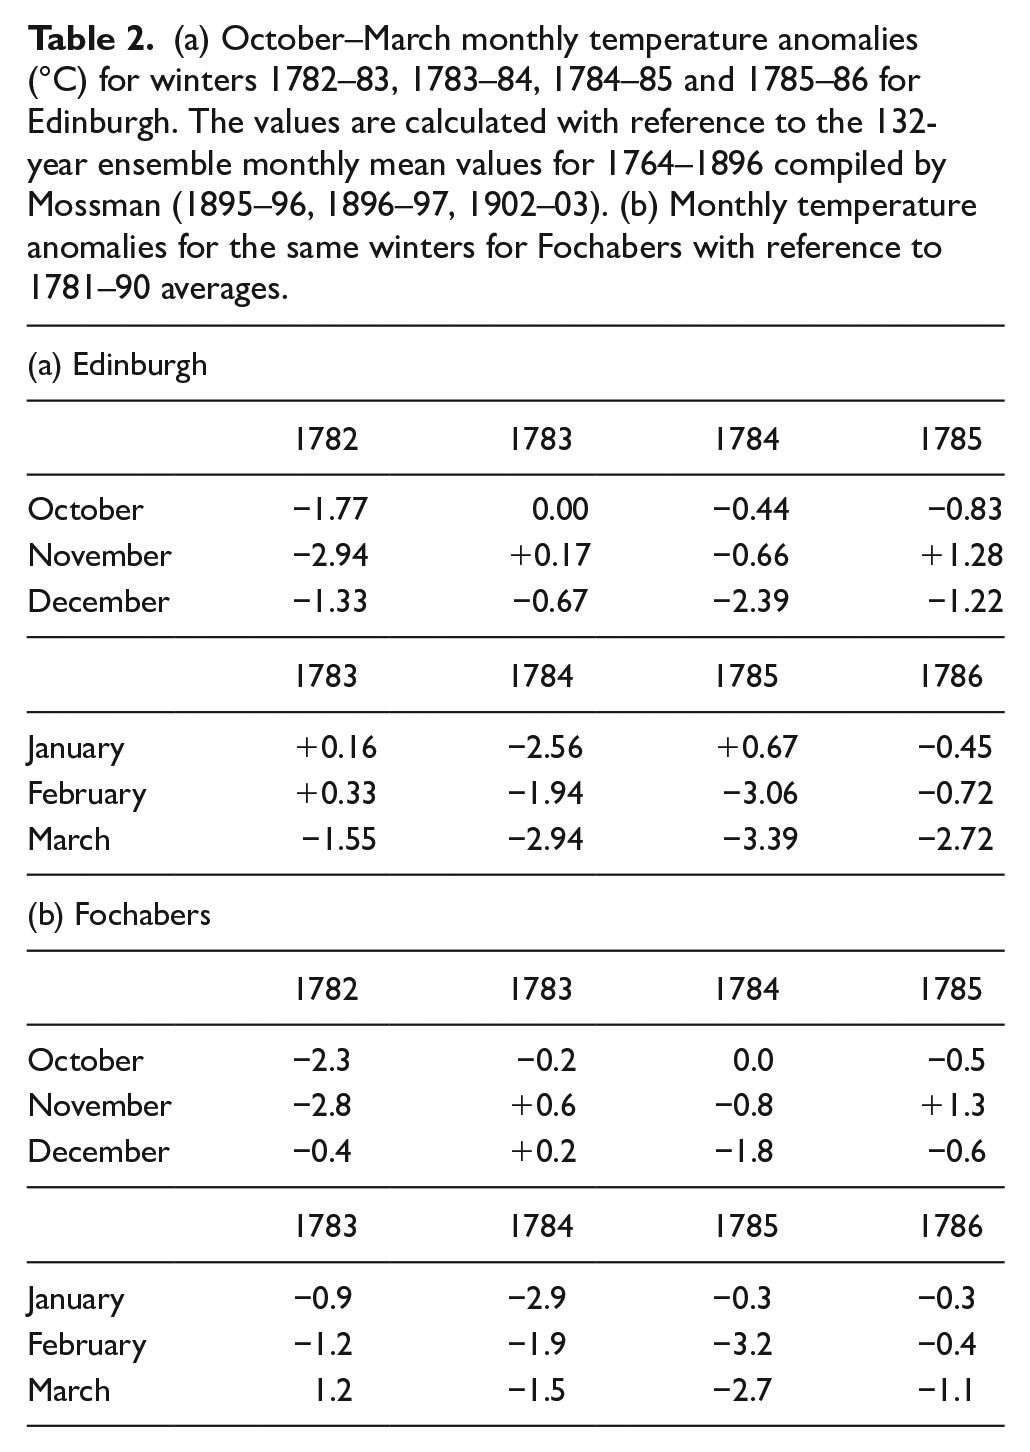
A long-term context for the decade of the 1780s is provided by the Edinburgh Mossman temperature series (Table 2). It shows that 1783 as a whole was an unexceptional year in eastern Scotland, notable only for very warm temperatures in April and July (the month following the eruption), the latter showing the fourth highest monthly temperature anomaly of the decade. In contrast, Edinburgh during 1784 experienced 10 months below the long-term average (though May was very warm) and exhibits the greatest average negative monthly anomaly of the decade. The months January to April accounted for a cumulative temperature anomaly of −9.5°C of the −11.4°C annual cumulative total. Cooler-than-average temperatures occurred more frequently between 1782 and 1786, and warmer-than-average temperatures more frequently later in the decade.
(a) October–March monthly temperature anomalies (°C) for winters 1782–83, 1783–84, 1784–85 and 1785–86 for Edinburgh. The values are calculated with reference to the 132-year ensemble monthly mean values for 1764–1896 compiled by Mossman (1895–96, 1896–97, 1902–03). (b) Monthly temperature anomalies for the same winters for Fochabers with reference to 1781–90 averages.
1780s context using Dalkeith and Fochabers monthly temperature averages
Monthly temperature anomalies through the 1780s for Dalkeith and Fochabers have been calculated using available mean monthly temperatures from these locations (Table 3). It is not possible to make direct quantitative comparisons between these temperature series and the Mossman record, though Dalkeith (located near Edinburgh) broadly mimics the Mossman time series. Monthly anomalies in Table 3 are therefore specific to each site, and to reference periods of 94 months long at Dalkeith and 112 months long at Fochabers. The temperature anomalies correspond in sign between these two locations in 72/94 months (77%). Post-eruption summer temperatures were anomalously warm in Dalkeith with the exception of September 1783. In contrast, at Fochabers, July was the only anomalously warm summer month, showing the largest positive monthly temperature anomaly of a generally cool year. The data suggest that the unusual heat across Europe and southern England during the summer of 1783 did not extend into northern and eastern Scotland.
Monthly temperature anomalies for Dalkeith (1783–1790) and Fochabers (1781–1790). Negative anomalies shown in bold, with anomalies exceeding 2°C are highlighted. Anomalies are calculated with reference to the mean monthly anomaly for each location over the time period shown.
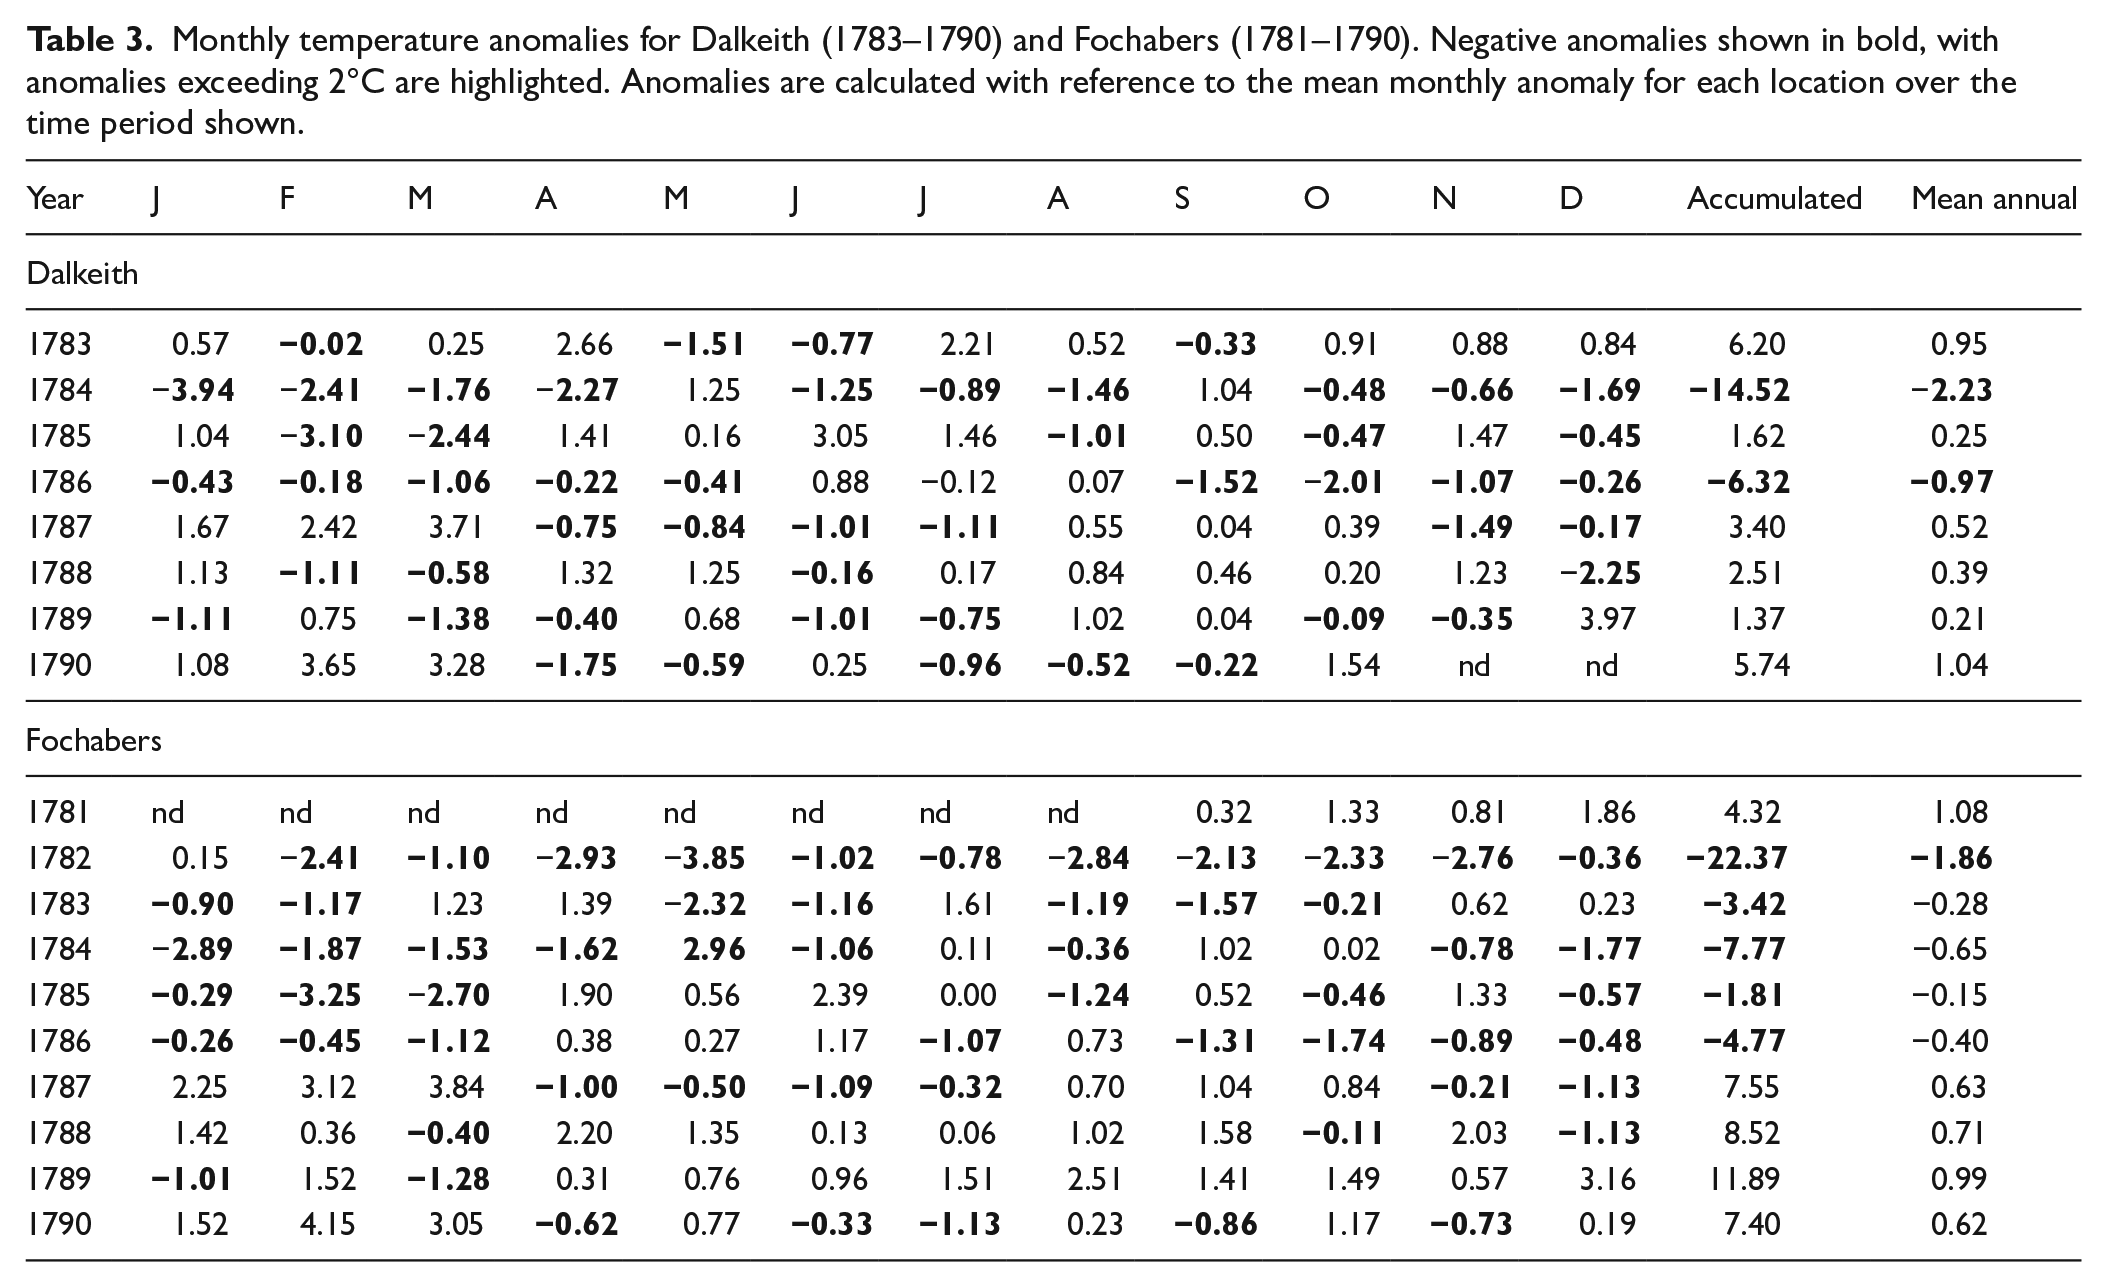
In summary, the Edinburgh, Dalkeith and Fochabers air temperature data demonstrate that July 1783 was unusually warm at all three locations but the remainder of the summer was unexceptional. Other warm summers occurred during the 1781–90 decade but with significantly smaller monthly anomalies.
Short-term temperature variability in the post-eruption summer
A complete time series of Dalkeith and Fochabers daily temperatures and anomalies for 1783 and 1784 are presented in Figure 3, the daily temperature anomalies expressed with reference to mean daily temperatures at both locations. Here we focus on two particular time intervals; firstly the summer and autumn following the first eruption of 8 June 1783 (Figure 4) and secondly the exceptionally cold early months of 1784 (Figure 5). Comparison of the two seasonal series shows a covariation of temperature anomalies between the two locations, though on occasions dramatic changes are slightly lagged between sites, although daily temperature anomalies correlate strongly (r2 = 0.46 and 0.70 in summer and winter, respectively).
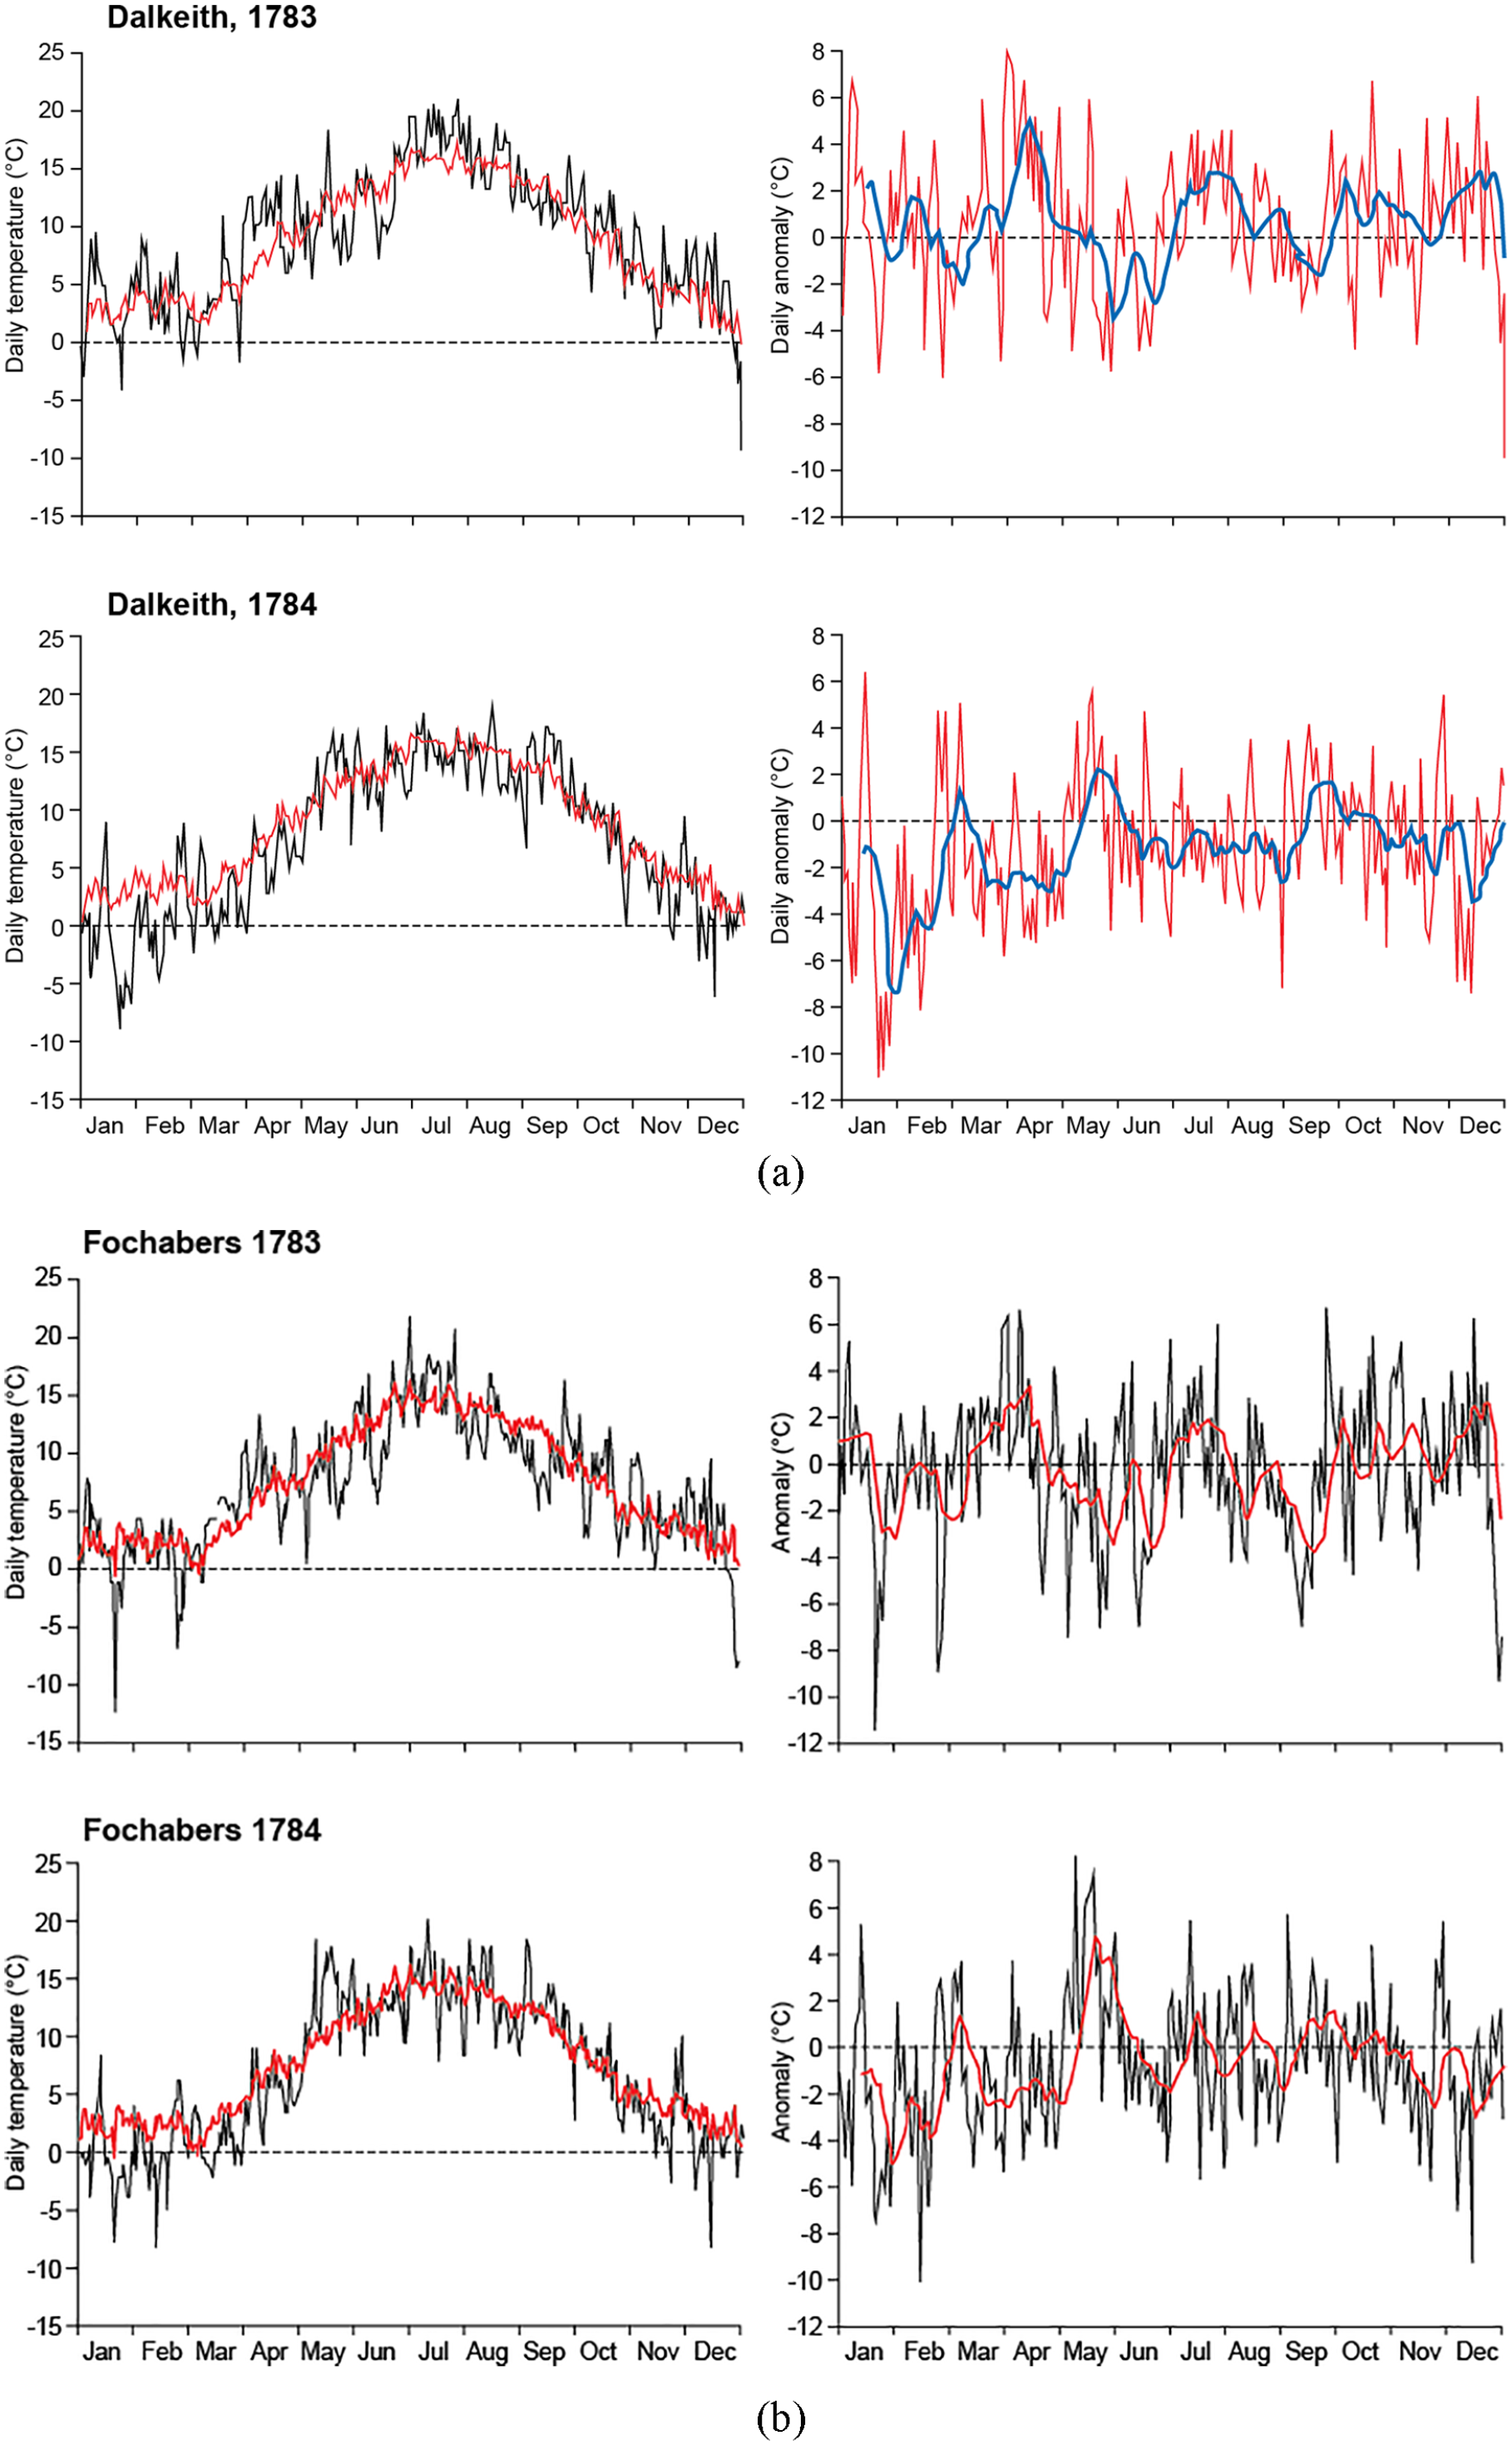
(a) Daily air temperatures and temperature anomalies for 1783 and 1784 for Dalkeith. Anomalies are based on the average temperature for each day during the decade of the 1780s. (b) Daily air temperatures and temperature anomalies for 1783 and 1784 for Fochabers. Anomalies are based on the average temperature for each day during the decade of the 1780s.
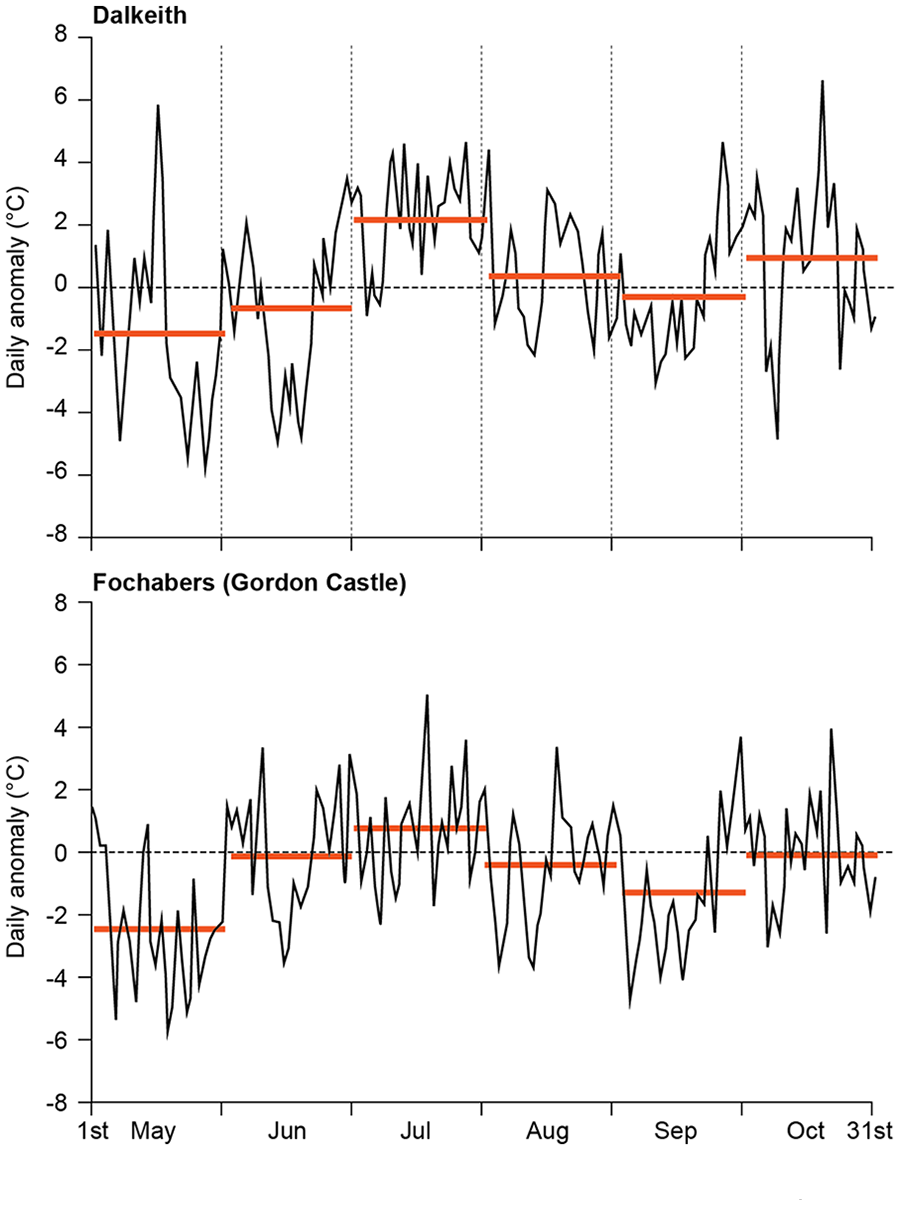
Summer–autumn daily temperature anomalies for Dalkeith and Fochabers, May–October 1783. Horizontal lines are monthly averages whose values are given in Table 2.
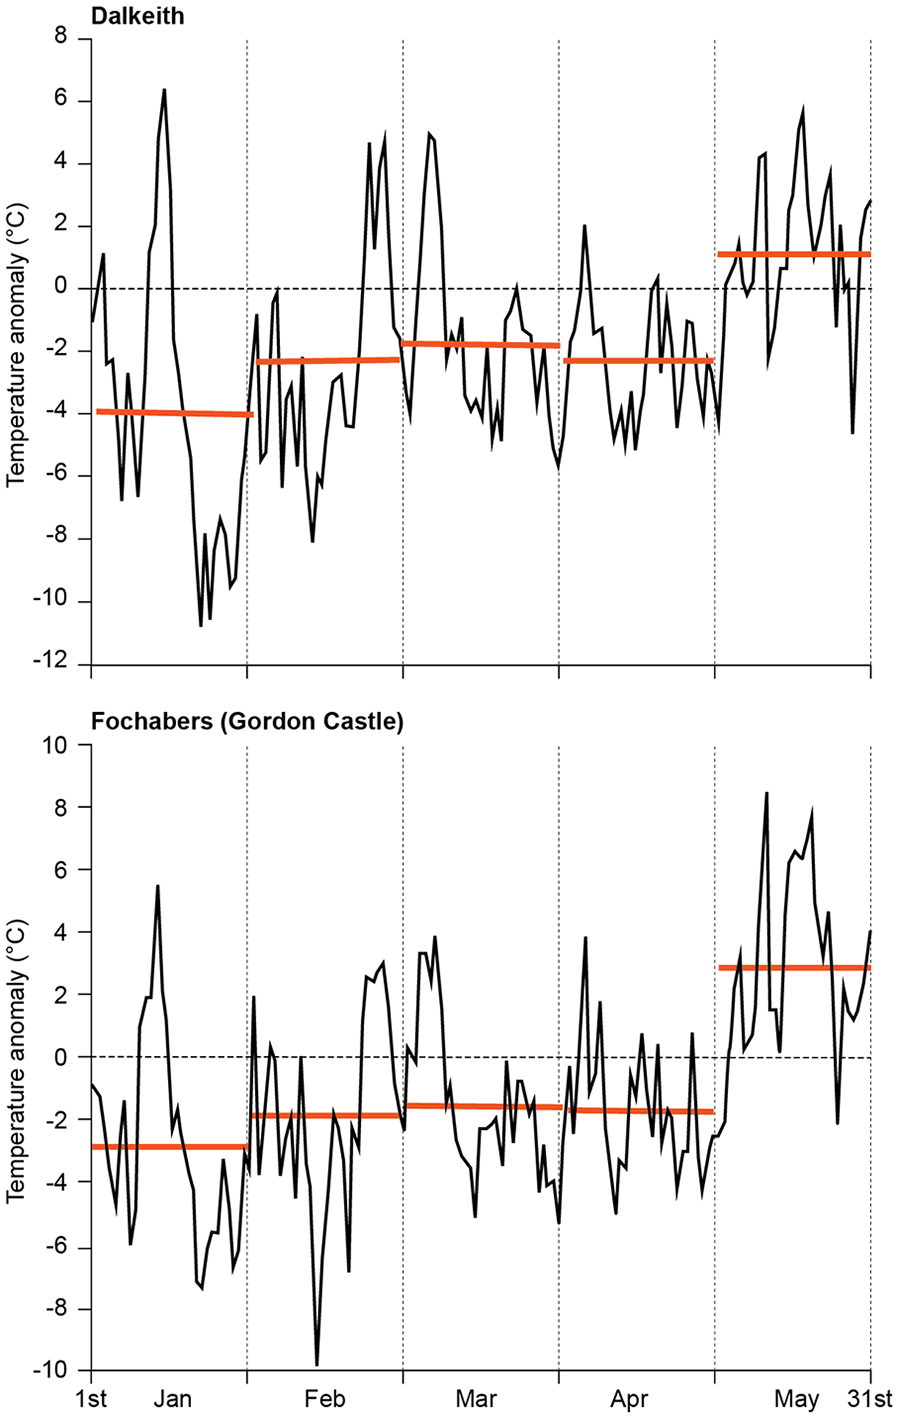
Winter–spring daily temperature anomalies for Dalkeith and Fochabers, January–May 1784.
Prior to the first eruption on June 8th, early June was characterised by warmer than average air temperatures followed by a sharp decline on June 11th that continued until June 21st (Figure 4). During this 10-day period, daily temperatures reached their lowest values of c. 7°C on June 14th–16th. Temperatures rose again on June 22nd reaching ~16°C, thereafter remaining high until late July. The cool early June weather coincided with the onset of NE and E winds and high air pressure from the June 11th until June 22nd (Table 4). At Dalkeith the onset of a NE airflow and lowered temperatures occurred on June 12th and warm conditions did not return until June 22nd. Thereafter, the strongest monthly positive anomaly of the year persisted until a cool first week in August. Temperatures dropped sharply on 22–23rd August, firstly in Fochabers, heralding a significant negative anomaly that lasted for 4 weeks until September 19th. An 11-day period from September 7th to 17th witnessed an average temperature of −4.4°C below the decadal norm for the same period at Fochabers, while Dalkeith was −1.7°C below normal. The remainder of the autumn until early winter remained mild. In summary, the most significant post-eruption cooling occurred from late August to mid-September, preceded by unusual warmth and succeeded by average to mild conditions.
Daily weather observations from Dalkeith and Fochabers from 5 June to 1 July 1783. The first eruption of Laki occurred on 8 June. The date of the first appearance of haze in England was 21 June.
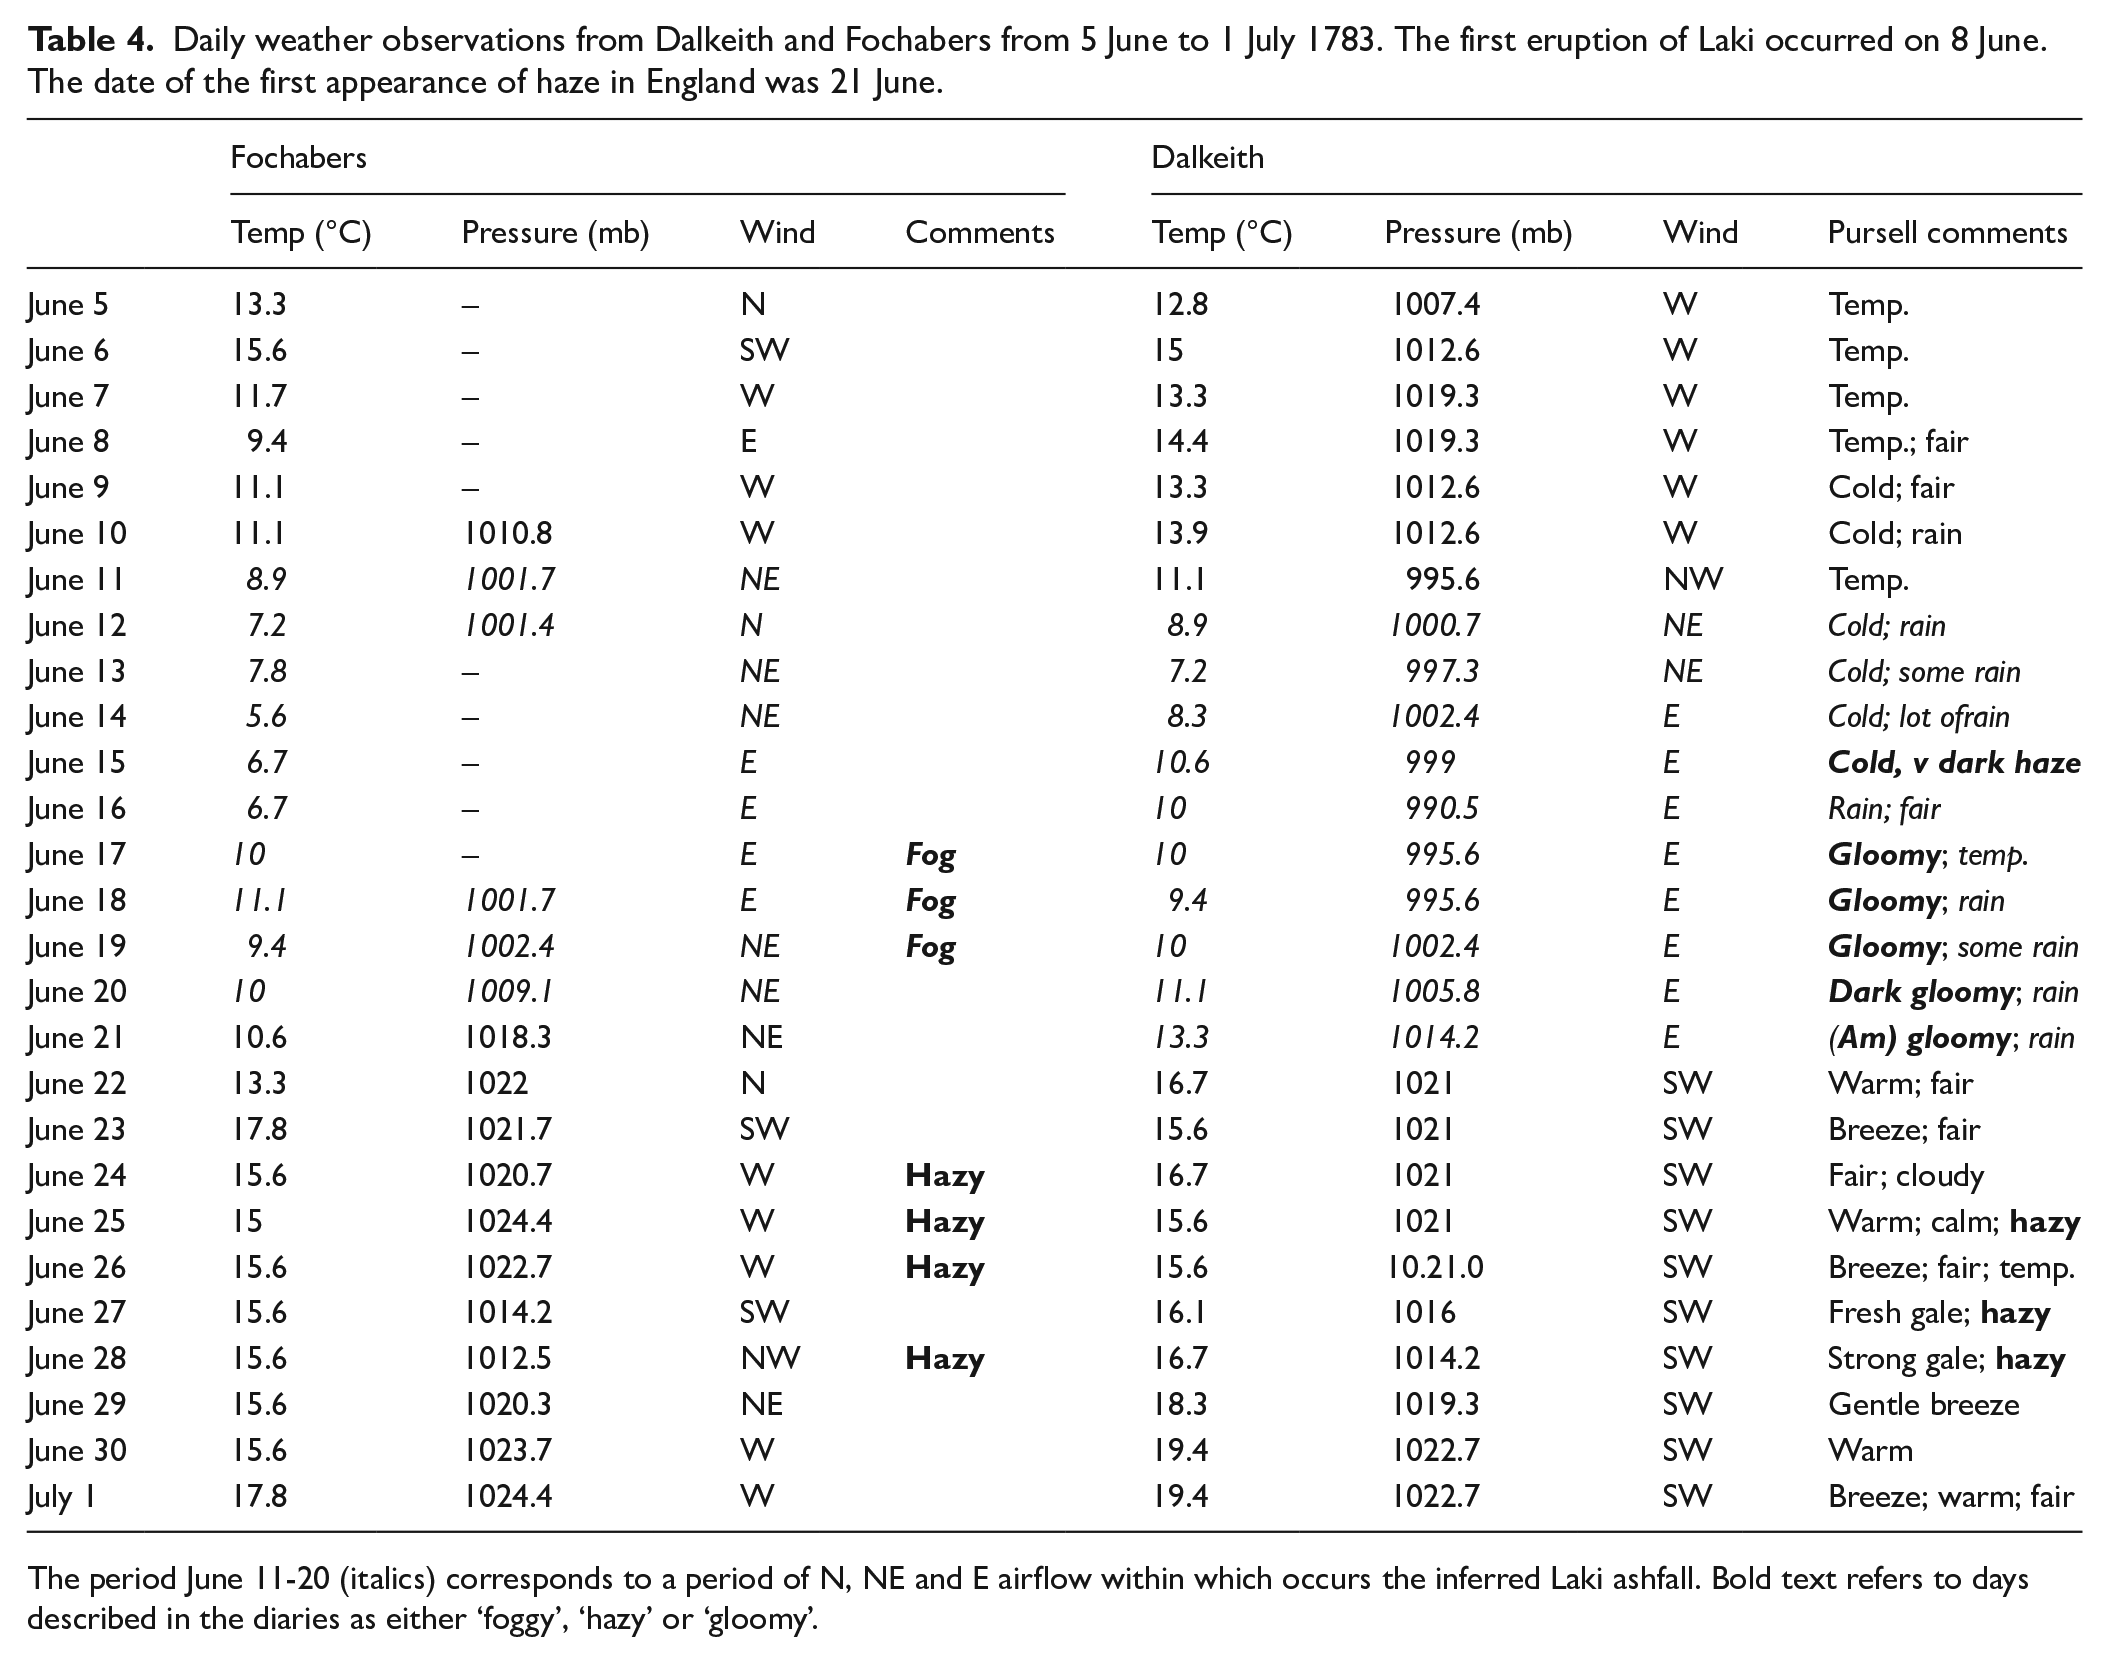
The period June 11-20 (italics) corresponds to a period of N, NE and E airflow within which occurs the inferred Laki ashfall. Bold text refers to days described in the diaries as either ‘foggy’, ‘hazy’ or ‘gloomy’.
Air quality: Fog and haze episodes
The sulphurous nature of rainfall and snowfall across Scotland during 1783–84 is known in the Gaelic language as the Bhlaidne nan Sneachdha Bhuidhe (the Year of the Yellow Snow: Dawson, 2009). However, the only published reference to the arrival of Laki aerosols in Scotland is by Thordarson and Self (2003) who cite Holm (1784) to conclude that Caithness may have experienced acid rainfall and ashfall on June 10th. Otherwise, the nearest published contemporary record is from central England.
Figure 6 shows days when ‘fog’ or ‘haze’ were recorded by the weather observers in Edinburgh, Dalkeith and Disblair. Pursell’s diary notes June 15th as the first day that was ‘cold, very dark with haze’ while June 17th–21st are described as ‘gloomy’ and many days up to 21st July are described as ‘hazy’. To investigate possible associations between ‘dry fogs’, ‘gloomy’ and ‘hazy’ conditions and the timing of individual eruptions of Laki, we have identified discrete sequences of days between June and October 1783 described by the various authors as characterised by ‘fog’, ‘haze’ and ‘gloom’ and compared these with the seven main eruptive phases of Laki (cf. Thordarson and Self, 2003) (Table 4).
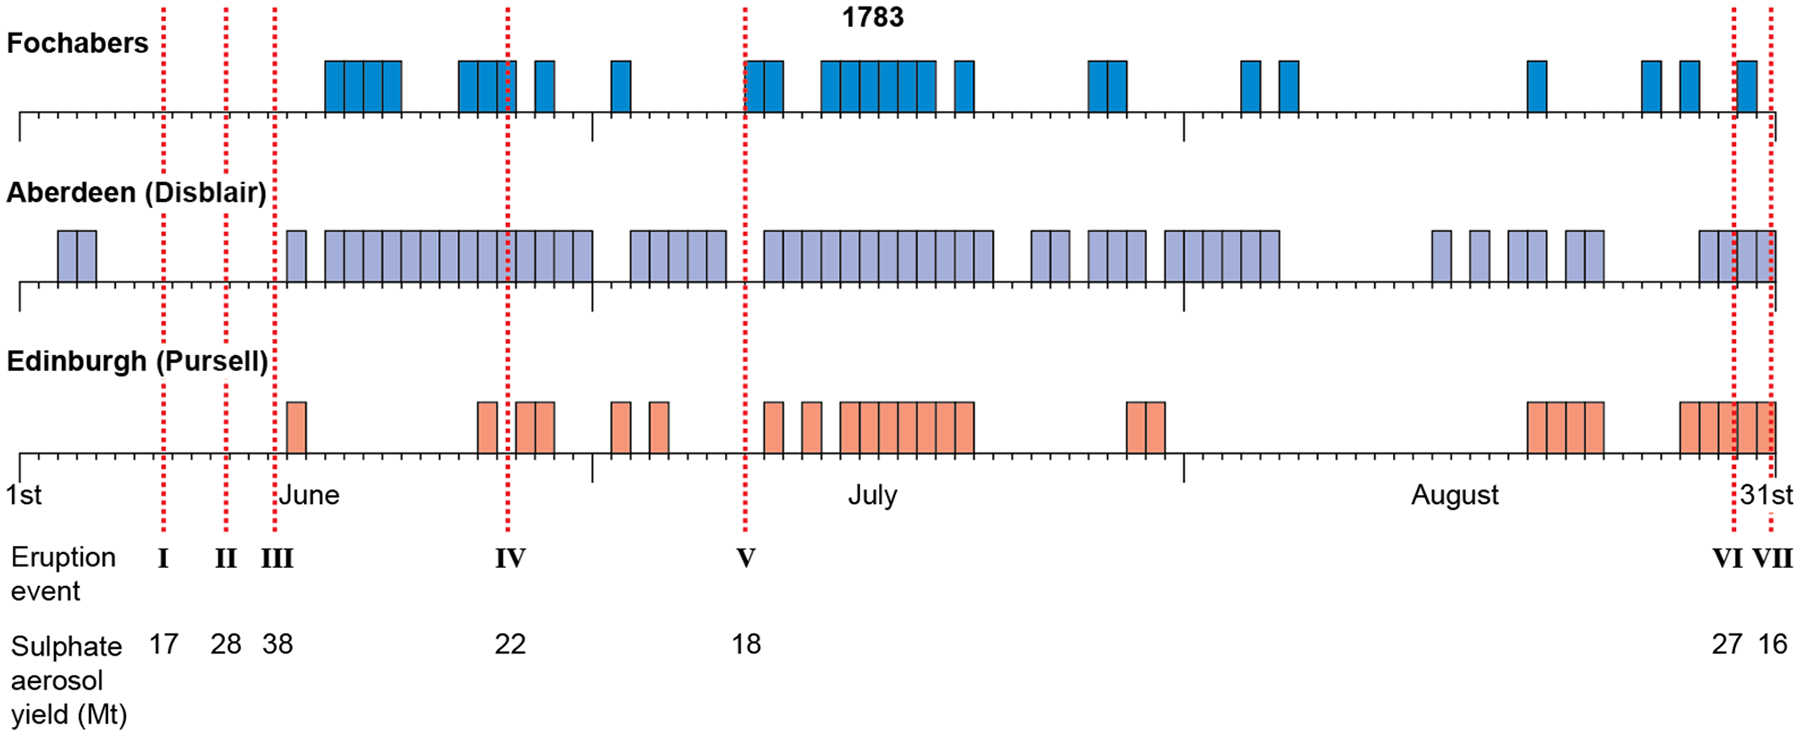
Time series of fog events for three locations in eastern Scotland, separated by 300 km, as well as eruption events and aerosol yields (after Thordarson and Self, 2003). Note the concentration of sulphuric acid yield early in the eruption.
Eruptive phases I to III on June 8th, 11th and 14th 1783 appear not to have been associated with sulphurous fogs in Scotland. Thordarson and Self (2003) noted that sufficient time would have been required to convert SO2 within the eruptive plumes to dilute H2SO4 in the atmosphere. Burnet records only a single day of continuous fog on June 15th (as distinct from meteorological morning fogs noted on May 1st and ‘thick fogg & drizzling rain’ on June 3–4th). Thereafter, she describes the occurrence of fog every day until July 7th. Entries for July 8th and 9th are lacking, while for July 22nd–23rd the sky was ‘clearer but still exceding hot’.
Particular attention is given here to observations in the daily weather comments of days described as ‘foggy’, or days classified as ‘fog’ as well as days reported as ‘haze’. Fog periods are described most frequently by Burnet, whereas days of both ‘fog’ and ‘haze’ are separately described in the Fochabers instrumental series. Pursell’s meteorological descriptions for Edinburgh use the terms ‘haze’ and ‘gloomy days’ as separate categories. Burnet’s qualitative descriptions are more difficult to classify in terms of weather phenomena although she makes a few explicit references to days of ‘yellow fog’ (interpreted here as sulphurous fog) as well as numerous days of ‘fog’. For all documentary records considered here, care has been taken to distinguish ‘dry fogs’ from seasonal sea fogs (locally called ‘haar’) that develop over coastal areas during spring and early summer, as well as radiation fogs caused by temperature inversions.
The descriptions from both Fochabers and Edinburgh show a clear pattern in the use of the terms ‘fog’, ‘gloom’ and ‘haze’. Whereas the onset of hazy conditions occurs at approximately the same time at both locations (June 24th and 25th) there is an earlier and distinct meteorological phenomenon represented by the accounts of ‘fog’ at Fochabers and ‘gloomy’ conditions in Edinburgh. We infer here that some other event connected with the Laki eruption persisted across northern and eastern Scotland for between 5 and 7 days between June 17th (possibly June 15th) until June 21st and was sufficient to darken the sky. Most significantly, 3 days of clear air conditions are recorded for all locations between June 21st and June 24/25th before the arrival of the main sulphurous haze on June 24/25th.
Air pressure and atmospheric circulation in the post-eruption summer
Wind direction data from Dalkeith and Fochabers indicate the occurrence of a westerly air stream across Scotland immediately prior to and up to 3 days after the eruption on June 8th. This was replaced on June 11th and 12th by NE and E airflow that was continuous until June 22nd–23rd when it was replaced by W and SW winds that continued into July. Both weather records show that a clear drop in daily air temperatures accompanied the onset and duration of NE and E winds.
Thordarson and Self (2003) describe two processes of aerosol and ash dispersal from Laki. They argue that the majority of the erupted SO2 during the early part of the eruption was dispersed within eruption columns as high as 9–13 km. Therefore, the majority of this material would have been transported within the lower stratosphere and within the jet stream at the top of the troposphere. Importantly, there is evidence that the ash-rich portion of the initial plume subsided rapidly down into the lower troposphere. The latter authors use Kington’s (1988) synoptic weather maps for June 10th (indicative of circulation during 8–12th June), June 17th (indicative of 13–20th June) and June 23rd (indicative of 21st June to 5th July) showing reconstructions of tropospheric circulation and likely travel paths of the westerly jet stream (Figure 7). For the period 8–12th June the jet stream appears to have moved to the NE over Iceland, carrying the aerosol cloud northward over the Arctic which explains the absence of haze at more southerly latitudes.
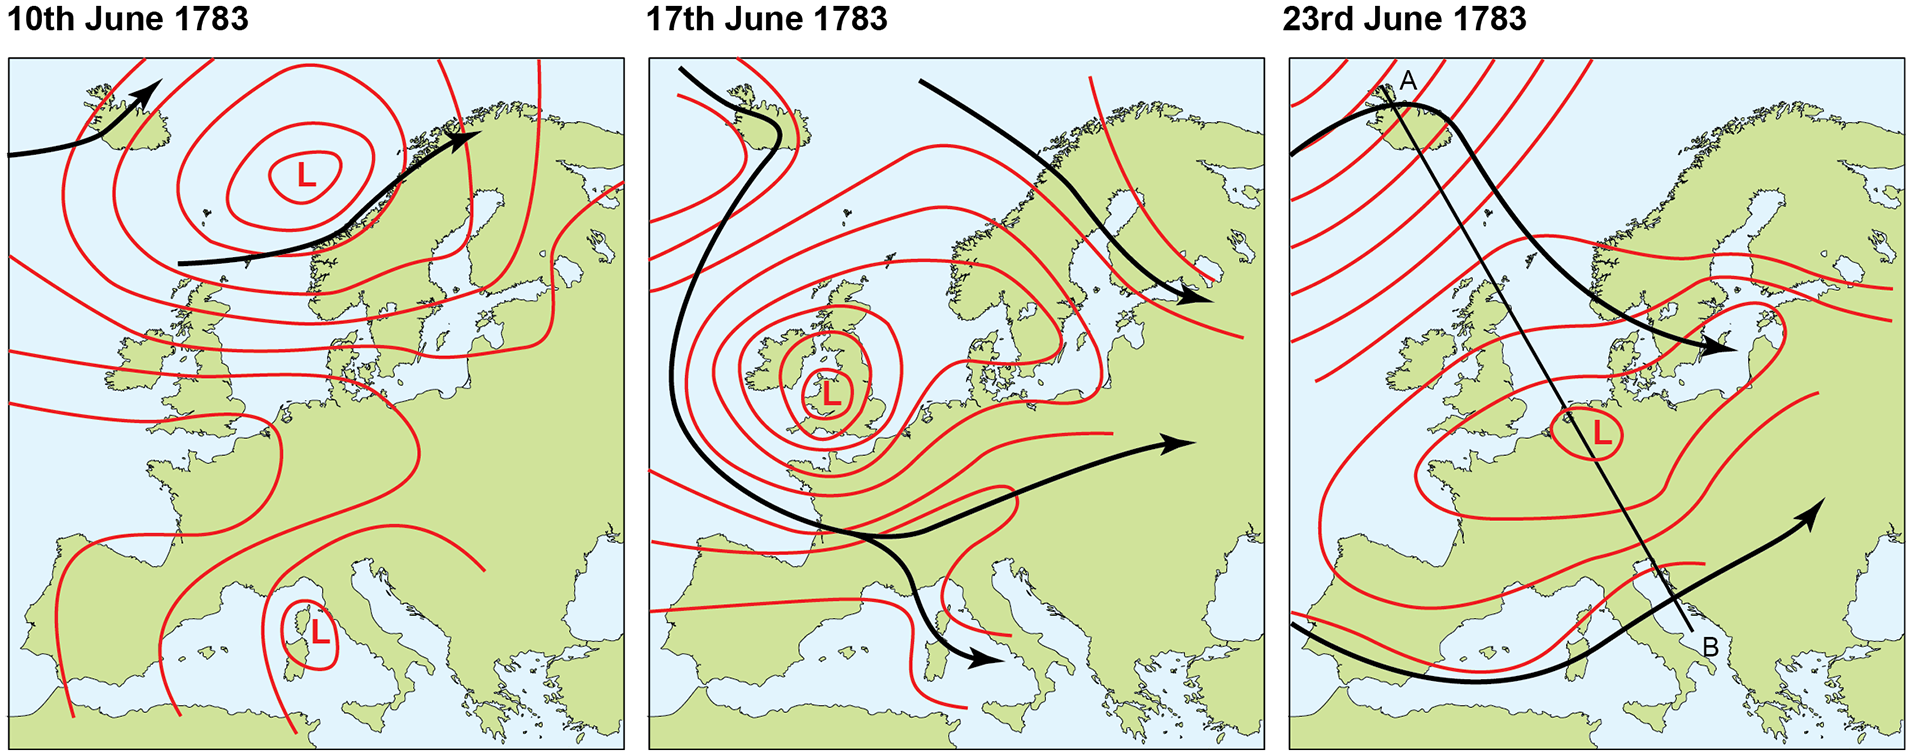
Synoptic pressure maps for the 10, 17 and 23 June 1783. The black arrows are inferred flow paths of the westerly jetstream (after Kington, 1988; Thordarson and Self, 2003).
Air pressure and wind direction data presented here supports this view, but also highlights a change to a NE airflow during June 10–12th (Table 4) accompanied by lowered air pressure and limited rainfall. This change suggests the development of an occluded front associated with a deepening low-pressure cell over Britain between June 13–20th (as suggested by Thordarson and Self, 2003) with a westerly jet stream deflected around its northern and southern flanks. The establishment of a NE airflow at Fochabers during June 13–14th followed by 4 days of easterly winds (June 15th–18th) and three additional days of wind from the NE (June 19–21st), together with air pressure values consistently above 1001 mb suggests that eastern Scotland was located along the northern flank of this low pressure cell (Table 4). Part of this time interval (June 15th–21st) corresponds to Pursell’s ‘gloomy’ days in Edinburgh following ‘cold, very dark, haze’ on June 15th.
The air pressure and wind data for Edinburgh (Dalkeith) show that between June 11 and 18th barometric pressure remained consistently between 990 and 1000 mb and was accompanied by some rainfall, most of which fell on June 14th. This may imply that during this time Edinburgh was located closer to the centre of the low-pressure cell. From June 21st until the start of July, eastern Scotland experienced a quite different weather regime characterised by anticyclonic circulation, high air pressure (1014–1022 mb) and light winds. As Thordarson and Self (2003) suggest, the movement of aerosols from the jet stream towards the ground surface within the subsiding air of this anticyclone may account for the onset and spread of the sulphurous haze that appears to have started to spread across eastern Scotland on June 24th. It also may be possible that following the first eruption, an ash-rich portion of the initial plume subsided rapidly into the lower troposphere and was responsible for the anomalous weather conditions for 15–21st June described by Pursell for Edinburgh as ‘dark’ and ‘gloomy’ and for Fochabers as ‘foggy’. In respect of the Fochabers and Dalkeith air pressure, the measured values from this study exactly match the Kington (1988) and Thordarson and Self (2003) synoptic weather maps for 8–12th June and 13–20th June. However, their published extent of the 22–25th June anticyclone appears to be much smaller than the measured air pressure values for eastern and northern Scotland appear to indicate.
Post-eruption winter climate
The weather records presented here are consistent with the well-established view that the 1783–84 winter in Scotland was extremely cold. In the context of determining whether or not this severity was attributable to the effects of Laki, daily data for Dalkeith and Fochabers provide information that is not evident in the monthly summary data of Mossman (1896, 1897, 1902). The air temperature anomaly data highlight the occurrence of three prolonged periods of exceptionally cold weather: December 29th 1783 to January 14th 1784; January 21st to February 27th 1784; and a prolonged ‘late’ period of cold between March 14th and 8th May (Figure 5). This winter did not thus effectively start until the beginning of 1784 with severe cold, snowstorms and deep snow-lie that continued until early May (Pearson, 1994) and ended with a 4-week period of relative warmth between May 8th and June 5th.
The coldest spell of weather of 19th to 30th January witnessed daily negative temperature anomalies of −5.4°C to −10.8°C below the decadal average in Dalkeith and −2.9°C to −7.4°C below average for the same period in Fochabers (Figure 5). Monthly average temperatures were lowest in January 1784 (3.9°C at Dalkeith and 2.9°C at Fochabers) while the two locations respectively recorded 99 and 93 days of negative temperature anomalies between 1 January and 30 April 1784. The coldest days occurred at Dalkeith on December 30th 1783 (−9.4°C) and at Fochabers on 30th December and again on 13th February 1784 (−8.3°C).
The Mossman series for Edinburgh (1896, 1897, 1902) highlights four consecutive months with negative monthly anomalies of between −1.9°C and −2.9°C with average temperatures for December (2.8°C), January (0.1°C), February (1.6°C), March (1.7°C) and April (5.1°C) not exceeding the 135-year monthly average values until May 1784. The persistent cold weather marks out this winter as remarkable although the winters of 1782, 1785, 1786 and 1789 had individual monthly anomalies at least as great yet with more short-lived spells of cold weather (Table 2). These statistics make it clear that the 1783–84 winter was one of a series of four very cold winters between 1782–83 and 1786−87, the exception being the winter of 1782−83. Burnet’s diary records persistent frosts and successive heavy snowfalls interspersed with short periods of thaw during the 1783–84 winter, with deep snow lying for most of January and February. On 7th February 1784 she wrote: ‘This Snow Blown in new wreath by the wind that was along with it made travelling Still worce then ever, & Except the South Post Road there is no was a wheel machin can go – the wind all this Storm has kept s much to the North that few Ships Could get from the South here, which has made Coals almost not to be got a& distressed the poor exceedingly’.
Wind directions are recorded at Dalkeith from the easterly quarter (NE, E and SE) on 51% of days between January and April 1784, compared to the 9-year average of 37%. At Fochabers for the January–April time intervals between 1782 and 1790 there were only 5 months when average temperatures were colder than −2°C below the long-term average. Analysis of wind directions for Fochabers shows that these extreme cold months averaged 9.2 days of wind from between NW and E compared with 16.6 days of wind from the quadrant between South and West (Figure 8). By contrast, there were only 6 months within this 8-year period where average temperatures were warmer than 2°C above average. The frequency of SW winds averaged 12.7 and 3.6 days per month in these two cases: differences between unusually mild and cold winter and spring weather are clearly expressed by the frequency of winds from the south-westerly quarter. When this modal direction is suppressed, wind directions become variable with no strong modal vector, but associated with a greater advection of cold air masses. The average monthly air pressures for each set of months (at Dalkeith, where data are complete) are identical at 1012 mb, indicating that the regional synoptic pressure pattern is important, but the absolute monthly average value does not distinguish extremes.
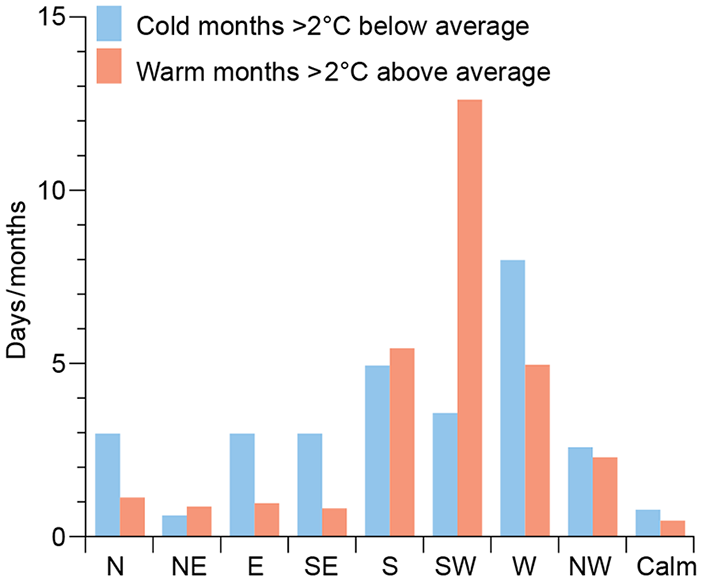
Frequency of wind directions for ‘warm’ and ‘cold’ months with mean daily temperature anomalies greater and less than 2°C above and below the reference average.
Across the North Atlantic region a strongly negative NAO characterised February, March and April 1784 (D’Arrigo et al., 2011; Zambri et al., 2019b). The synoptic weather patterns for this time interval are described using Lamb weather types by Kington (1988). He observed that January 1784 was dominated by anticyclonic conditions until 13th then northerly weather types till c. 11th February. Over the rest of February, the prevailing winds veered from easterly through southerly to westerly and round to anticyclonic north-easterly by the end of the month. March was variable throughout with alternations of several days of anticyclonic, cyclonic and generally easterly weather types. April commenced with anticyclonic circulation, replaced by cyclonic northerlies around the 9th to 12th. Thereafter variable cyclonic north-west and westerly weather types dominated until a warm anticyclone became established after 29th April to give a warm May. Overall, cold conditions in this winter did not result from a single air mass type advecting over Scotland, but both maritime polar and cold continental air depressed air temperatures in the region at different times.
Discussion
The archival data presented here for three geographically distant areas of eastern and northern Scotland represent a remarkably precise chronology from which the impact of the Laki eruptions on Scottish weather and climate can be deduced. We highlight in particular two aspects of post-eruption atmospheric conditions. The first is the reconstruction at a daily timescale of the arrival in Scotland of a possible Laki ash plume on June 15th 1783, followed by the arrival of a sulphurous haze on June 24th that persisted throughout most of the summer. Second, our reconstruction of daily air temperature changes for the ca. 9-month period that followed the first eruption has enabled us to evaluate possible effects of the Laki eruption on regional climate.
Arrival of the Laki plume in Scotland
Many authors have described the dry haze that spread across Europe during the summer of 1783 (Stothers, 1996; Thordarson and Self, 2003). On June 10th tephra deposition from Laki occurred in the Faeroe Islands and western Norway (Thordarson and Self, 2003). Less well known are descriptions of unusual post-eruption phenomena in Scotland, yet they echo the environmental impacts described in well-known accounts from England (e.g. Grattan and Brayshay, 1995). In addition to the observations presented above, unpublished records from Belmont Castle, Perthshire, Scotland, record: ‘. . .a very uncommon fog began about the 20th June and still continued more or less till November without the least interruption. . ..this fog was universal throughout Britain, France and Italy, tho’ (except it being foggy) the weather in summer was very fine, generally calm and sometimes very warm .. what makes this fog very extraordinary is that neither the thunder and lightning, high gales of wind at times, some heavy showers of rain that happened, nor the height of the Sun at that season, were able to dispel it’ (Belmont Castle Weather Diary (1771–99)).
In Aberdeenshire, Janet Burnet observed in July 1783: ‘. . . the leaves of the corn and bear [barley] is yellowed and the tops of the potatoes blackened – from what cause we know not. . .’ (Pearson, 1994).
Reconstructions of the exact dates when this sulphurous haze first appeared in specific areas converge on its first arrival across central Europe around 18th–22nd June (Figure 1) yet in south-east England the haze was not observed until 23rd June. Differences in chronology may in part reflect the observability of high-level aerosols due to cloud cover variations but are consistent with the synoptic climatology (Thordarson and Self, 2003). The weather information described here for Scotland appears to be remarkably authoritative, having been recorded by amateur diarists (Pursell and Burnet) and meteorological observers (Alvus, and the recorder (T Hoy) on the Gordon Castle estate). Pursell’s account is particularly significant in providing a narrative of an initial 7-day period that started 7 days after the June 8th eruption (June 15th) with a, ‘. . .cold, very dark, haze. . .’ followed by five successive days that he described as ‘gloomy’ (June 20th was ‘dark, gloomy’). Four days later, on June 25th, after a spell of clear weather, his description changed to the reporting of ‘hazy’ conditions that continued intermittently throughout the rest of the summer of 1783.
We suggest that it is no coincidence that the weather recorder at Fochabers described two analogous yet different types of weather for the same time period. The first of these is a series of 4 days of ‘fog’ that started on June 17th. As with Pursell’s descriptions, the last day described as ‘foggy’ (June 20th) was followed by a 4-day gap of fine weather after which descriptions of ‘hazy’ conditions began on June 24th. The use of these different words to describe the atmospheric conditions at two separate locations ca. 300 km apart appears to be no accident: independent observers were describing the same chronology of change across the lower troposphere.
It is inferred here from these descriptions that the first of the ‘gloomy’ days may represent the arrival of an early atmospheric plume from Laki that first appeared on June 15th and lasted for 7 days. The second was the sulphurous fog that arrived in Scotland on June 24–25th. There was a brief period of 3–4 days of fine weather (June 22nd–June 25th) in both areas that followed the disappearance of the first phase of ‘foggy’ and ‘gloomy’ conditions but preceded the arrival of the ‘haze’. Of wider significance is that these inferences, if correct, demonstrate that contemporary descriptions by most authors of Laki ‘fog’ and ‘haze’ are not interchangeable: in the examples above they represent different meteorological phenomena.
We therefore suggest that the Laki plume comprised two phases. An initial tephra plume (corresponding to that witnessed in Norway on 10th June) is represented by the initial ‘gloomy’ phase in eastern Scotland, the ‘gloom’ being caused by fine airborne ash arriving on 14th–15th June and persisting for 4–5 days. The second and long-lasting phase was the sulphurous aerosol plume and haze that arrived on 24–25th June.
Controls on post-eruption summer and winter atmospheric conditions in Scotland
Contemporary data demonstrate that daily air temperature variation at Fochabers and Dalkeith are both regionally correlated and strongly controlled by synoptic weather patterns. Following the start of the Laki eruptions until September 1783, daily air temperature anomalies had amplitudes of up to ±4.9°C. However, between January and April 1784, temperature anomalies had altered to between −10.8°C and +6.4°C. Air temperatures during the summer of 1783 were unexceptional in Scotland apart from a very warm July (c.f. Edmonds et al., 2018). Notably tree-ring studies in NE Scotland do not recognise 1783 as having been a significantly warm year within an 800-year reconstruction (Rydval et al., 2017). Our data show that for the decade of the 1780s, the very warm period from 22 June until 27 July was only exceeded in warmth on one other occasion (June 1785). This period of warmth coincides with a well-developed cell of high pressure across northern Europe, indicated also by the air pressure data from Fochabers and Dalkeith (Kington, 1988; Table 6.5) (Figure 10). Though Grattan and Sadler (1999) speculate that the volcanic aerosols may have caused the warmth of summer 1783 coincident with a high incidence of sulphurous hazes and thunderstorms, neither modelling nor empirical data support this suggestion (Zambri et al., 2019b).
Three models of post-Laki radiative cooling of the surface (Figure 9) show maximum forcing occurring between late July and late August 1783 with cooling persisting after peak forcing (Highwood and Stevenson, 2003; Oman et al., 2006; Schmidt et al., 2011; Zambri et al., 2019b). The Dalkeith and Fochabers air temperature anomalies are negative for 39/53 days between 2 August and 23 September corresponding with the only unusually cool period between 22 June and December 1783 and was primarily associated with air pressure fluctuations (Figure 10). Zambri et al. (2019b) ascribe the abnormally warm summer in Europe in 1783 to the internal variability of the climate system, whereby a blocking high pressure cell over northern Europe caused polar air to bypass western Europe. Their only concession to volcanic forcing of summer 1783 climate is that ‘Europe may have been even warmer had the eruption not occurred’ (Zambri et al., 2019b: 6787). Our data support this interpretation as well as Sadler and Grattan’s (1999) general finding that the amplitude of post-eruption summer temperature lowering falls within the normal range of statistical variability.
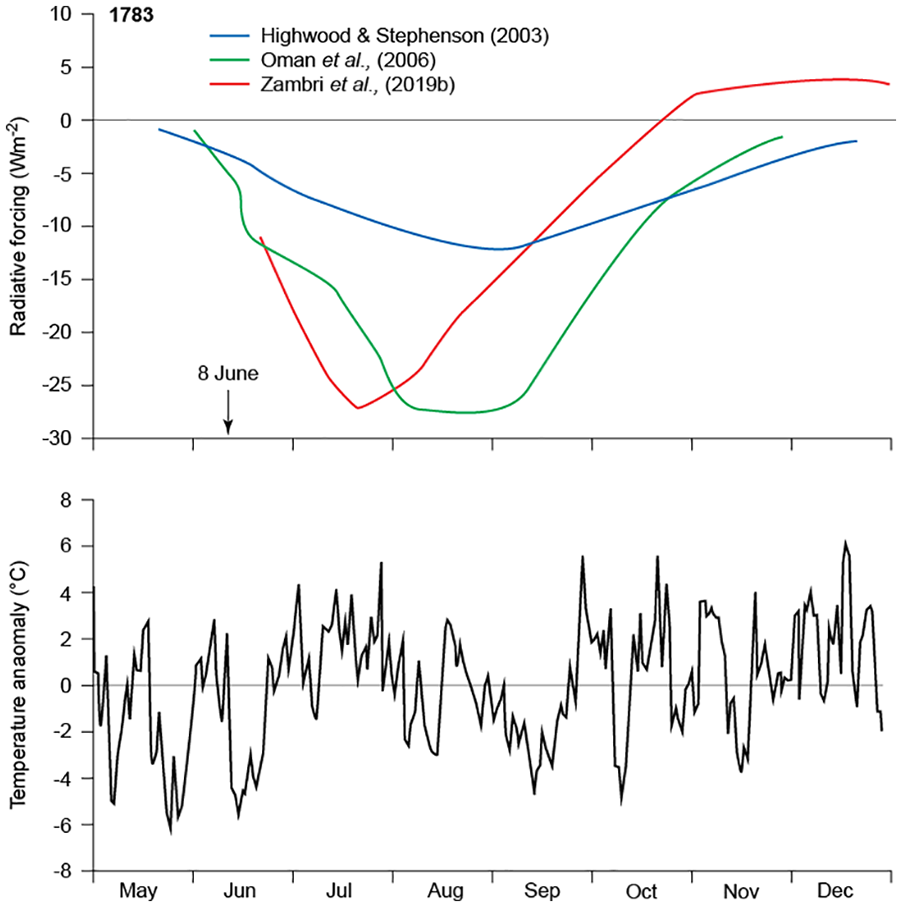
Comparison of three radiative forcing models and daily temperature anomalies from 1st June to 31st December 1783. The anomaly curve is the average daily anomaly of the Dalkeith and Fochabers series.
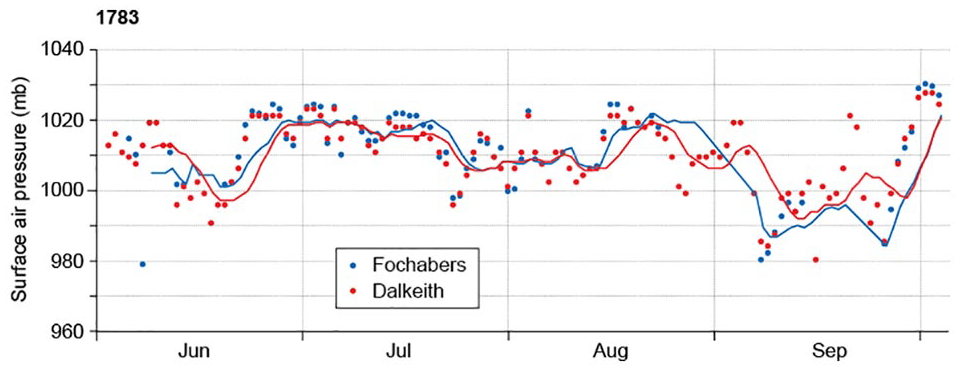
Variation in daily surface air pressure from 1st June to 30th September 1783 at Dalkeith and Fochabers, with 7-day running means.
If the air temperature record is to be interpreted in terms of volcanic forcing, it is necessary to explain how radiative cooling may influence regional air pressure and wind flow characteristics to produce climatic anomalies. Esper et al. (2013) suggest that after large explosive eruptions (VEI > 5), air pressure anomalies tend to be positive across the central Atlantic Ocean and negative in eastern Scandinavia resulting in anomalous NW and N airflow across Europe. Their analysis does not include extreme Laki-type high latitude fissure eruptions but their findings suggests mechanistic links may exist which are not currently understood. More recently, the numerical modelling of Zambri et al. (2019a) demonstrate a southward shift in the subtropical jet stream in response to the Laki eruption, associated with a negative perturbation in the North Atlantic Oscillation.
The argument that the exceptionally cold climate of January-April 1784 was caused by volcanic forcing (Grattan et al., 1998; Schmidt et al., 2012; Thordarson and Self, 2003) has been challenged by others who have suggested that the cold winter was part of natural climatic variability associated with the North Atlantic Oscillation and that its timing with respect to the Laki eruption was coincidental (D’Arrigo et al., 2011). The January to April period is particularly variable under normal conditions, when most positive and negative temperature anomalies within the year occur, as well as the largest anomalies as warm air masses intermittently replace winter cold air masses (Figure 11).
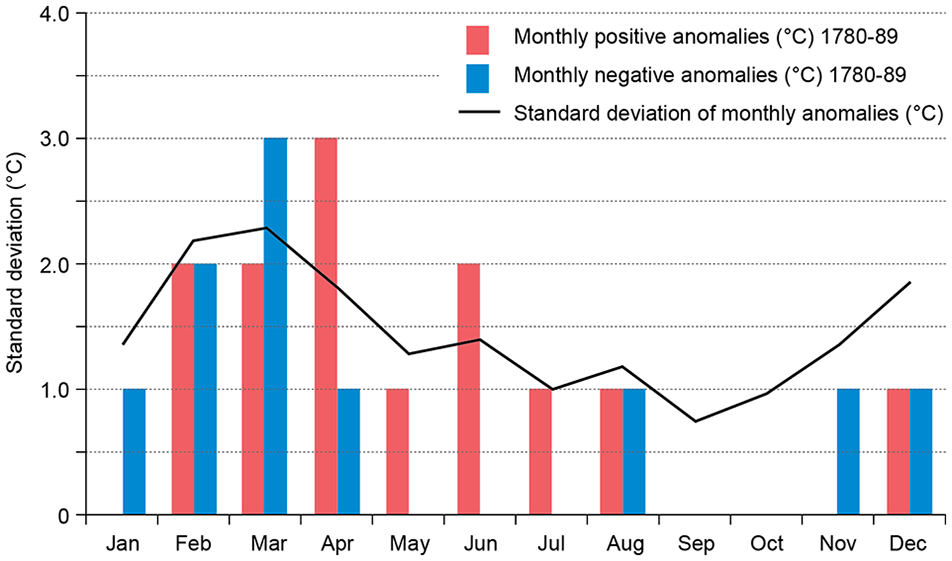
Seasonal variation in extreme temperature anomalies during the 1780s derived from the Mossman (Edinburgh) record. Extreme anomalies are defined as an individual mean monthly temperature deviating by more than 2°C above (red) and below (blue) the 135-year monthly mean. The standard deviation of monthly anomalies for the decade is shown as a black line.
A comparison between published air temperature anomalies for the 1783–84 winter is difficult because there is no standard reference period for calculating these. For example, Zambri et al. (2019b) make use of climatic data for the 5 year period prior to the eruption, while Schmidt et al. (2011) use a 30-year reference period, and others compare the post-Laki climate with different 20th century periods (D’Arrigo et al., 2011; Yiou et al., 2014). In general, the models that make use of 18th century reference data point to negative air temperature anomalies (December 1783–February 1784) of no more than −0.5°C. By contrast, those based on 20th century reference periods yield anomalies of c. −2.0°C below the long-term average. The Dalkeith and Fochabers data for 1780–89 show that air temperature anomalies for this particular winter were considerably larger, between −1.5°C and −1.8°C.
Although the severity of the 1783–84 winter is beyond dispute, the generally accepted view is that the low winter temperatures resulted from the Laki aerosol veil (Schmidt et al., 2012; Thordarson and Self, 2003). However, this view has been challenged by some modellers (Zambri et al., 2019b). One interpretation is that Laki-type high-latitude eruptions may induce patterns of northern hemisphere cooling similar to those that occur during major El Nino events (Pausata et al., 2016). Our results provide quantitative information for eastern and northern Scotland on the magnitude of winter cooling that followed the Laki eruption. The data show that an unusual winter synoptic climatology was necessary to achieve much lower air temperatures than the values predicted from published numerical models.
There is a clear relationship between regional air pressure variations and the occurrence of sulphurous haze from Laki (Grattan and Charman, 1994; Thordarson and Self, 2003). Our data points to the near-synchronous arrival of a sulphurous haze across eastern and northern Scotland on June 24th coincident with the establishment of a blocking anticyclone that persisted over late June and the whole of July 1783 (cf. Kington, 1988). The huge volumes of aerosol generated in eruption episodes I to III (8th–21st June) remained trapped in the lower troposphere until late July (Figure 12). Aerosol concentrations were reduced over succeeding weeks despite the supply of new material during the later phases of the eruption. The documentary archives for Scotland indicate that, as the autumn progressed, individual episodes of aerosol pollution became shorter, less frequent, and more dependent on suitable atmospheric conditions characterised by brief intervals of unseasonally warm temperatures and high surface air pressure (Figure 12). It is notable that until late October occasional periods of lowered air pressure correspond with periods of time when there were no reports of haze.
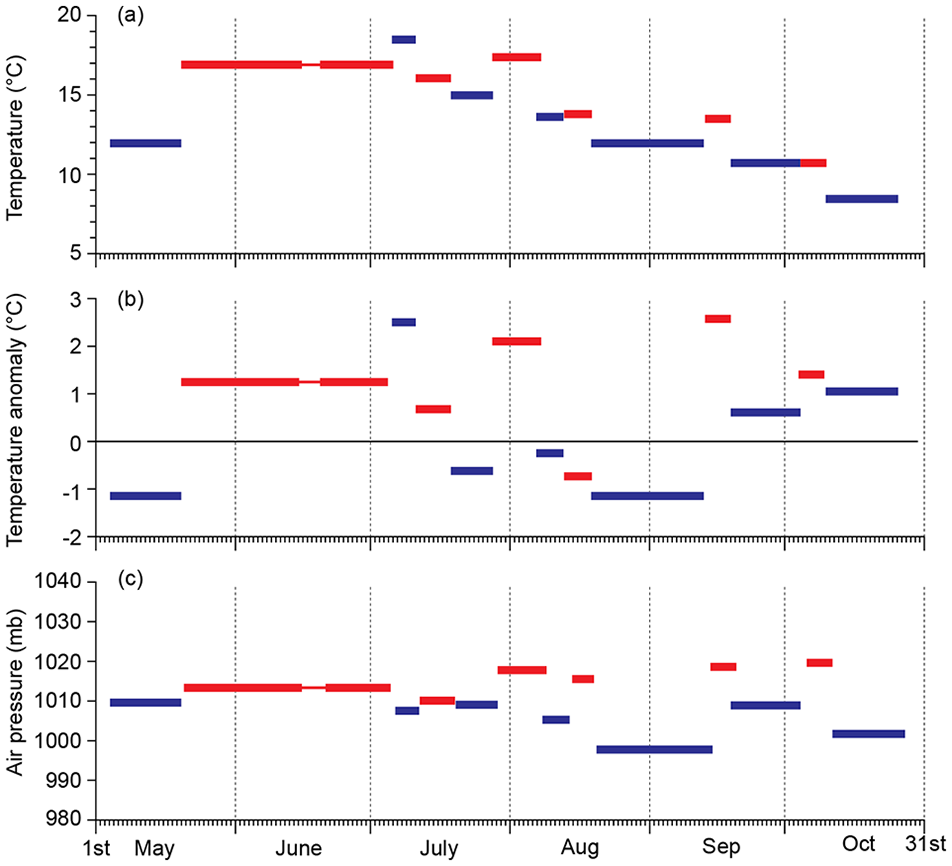
Relationships between fog recorded at Disblair (Aberdeenshire) by Janet Burnet (Pearson, 1994), Dalkeith air temperature (a) air temperature anomalies (b) and surface air pressure (c) Periods of haze and fog are red lines and haze-free intervals are in blue. Climatic variables are averaged for each period from daily values.
Conclusion
The descriptions and interpretations presented here of the atmospheric effects in Scotland of the Laki eruption of 1783 are mostly based newly discovered archival material. In particular, the weather diaries for Fochabers and Dalkeith represent the oldest instrumental weather records that exist for Scotland and two of the oldest daily weather records in Europe. The Pursell weather diary for Edinburgh is also an extremely rare document that provides a daily account of atmospheric conditions both prior to, during and after the Laki eruption. One of the most striking aspects of the three diaries is that the sequence of changes in weather and climate are near-synchronous at all three locations despite Fochabers being located ca. 300 km north of Edinburgh and Dalkeith. The diaries provide compelling evidence that on June 15th, 7 days after the start of the Laki eruption, ‘dark’ and ‘gloomy’ conditions occurred across eastern and northern Scotland and persisted until June 21st. We infer here that these conditions represent the presence of a volcanic ash veil within the troposphere.
All three locations then describe the occurrence of clear sky and fine weather between June 21st and June 24th. On June 24th, however, all locations document the arrival of a dry haze that persisted for the remainder of the summer. We interpret this haze as the sulphurous haze that is described at this time by many observers across Europe and which was associated with a blocking cell of high pressure. The high air pressure values recorded for this period for Fochabers and Dalkeith would appear to indicate that this blocking anticyclone was more extensive than hitherto believed (cf. Kington, 1988). Our interpretation of an initial 6-day Laki ash veil over Scotland followed by a 2–3 day weather window prior to the arrival of a long-lasting sulphurous haze differs from all other European accounts of the effects of the Laki eruption that are restricted to documentary accounts of a dry haze. We attribute this difference to rarity of the Scottish weather diaries that provide such a detailed account of the atmospheric effects of the eruption.
The weather diaries also provide detailed information on the nature of the 1783–84 winter in Scotland and enables a comparison to be made with the published results of numerical modelling of the atmospheric effects of the eruption. It would appear that the radiative forcing caused by the eruption resulted in a negative air temperature anomaly that occurred both at Fochabers and Dalkeith during September 1783. At Dalkeith it lasted for 16 days with temperatures averaging −1.5°C below the decadal average while at Fochabers the temperature lowering lasted for 33 days at −2.5°C below the decadal average. The timing of this anomaly matches that of the Highwood and Stevenson (2003) radiative forcing model but occurs several weeks after the predicted peak forcing in other climate models.
The winter of 1783–84 experienced a significant negative air temperature anomaly with average air temperatures between January and April 1784 at Dalkeith close to −2.6°C below average and –2.0°C below the decadal average at Fochabers. However, our analysis indicates that the duration and amplitude of these negative temperature anomalies are strongly associated with the occurrence of blocking anticyclones and associated wind flow patterns and need not relate solely to any volcanically-forced radiative cooling that may have taken place . Of concern to public health, we draw attention to the fact that the chronology and meteorology of haze occurrence in Scotland during the summer of 1783 has clear implications for understanding the hazard posed by potential future Laki-type eruptions (Edmonds et al., 2018; Grattan, 1998; Schmidt, 2014; Schmidt et al., 2011). The summer synoptic weather in 1783 approximates a worst-case scenario for the arrival of volcanogenic pollution in Europe. At the time, it is thought to have resulted in tens of thousands of fatalities (Grattan et al., 2005; Witham and Oppenheimer, 2005). We draw attention to the potential of a future volcanic fissure eruption in Iceland similar to Laki that, through the dispersion of sulphate aerosols, has the capacity to create a major public health crisis across Europe.
Footnotes
Acknowledgements
The authors would like to thank Sandra Mather, Karen Cullen, Conner Morison and staff at the National Records of Scotland and National Library of Scotland, Edinburgh, for their contributions to the preparation of this manuscript.
Funding
The author(s) received no financial support for the research, authorship and/or publication of this article.