
Abstract
According to a basic model, the formation of the coastal barriers in the southwestern Baltic can be divided into four evolutionary stages which are characterized by different rates of sea-level rise and varying relations between sediment supply and accommodation space. This model is tested using the example of a strandplain of the island Usedom, along with a local sea-level curve that reflects even smaller fluctuations of the water table and a detailed chronostratigraphy based on OSL measurements that allows the correlation of the morphodynamics with specific climatic phases. The resulting evolution scheme generally confirms the basic model but the timing of the stages depends on the inherited relief and has to be adjusted locally. A comparison with barriers from the W and SW Baltic region shows that the development during the past 5000 years was controlled by climate fluctuations which caused minor variations of the rather stable sea level and consequential changes in sediment supply, accommodation space and foredune deposition. Progradation decline can mainly be related to cool and windy climate phases which centered around 4.2, 2.8, 1.1, and 0.3 ka b2k, while increasing progradation correlated with warmer climate around 3.5, 2.0, and 0.9 ka b2k. The climate warming and the increasing sea-level rise in the recent past, however, led to shrinking progradation rates and may indicate a critical point beyond which the main progradation trend of the past turns into erosion.
Keywords
Introduction
Along the coasts, climate-driven sea level and wind-field variations cause altering sediment supply, transport direction and accommodation space, and largely determine, together with the inherited morphology, the sediment budget of a particular coastal section (Beets and van der Spek, 2000). While a negative budget implies erosion and shoreline retreat, a positive budget causes net sediment deposition and is a precondition for the evolution of a coastal barrier. This paper exemplifies the barrier formation along the almost tideless, wave dominated, low to medium energy coast of the Baltic Sea of NE Germany. Following Forbes et al. (1995) it can be classified as a paraglacial coast, whose glacial sediments of the elevated uplands can be easily eroded by waves, moved by currents and redeposited on the edges of the uplands as sandy spits. Due to the elongation of such spits and their coalescence barriers are formed which connect adjacent uplands and truncate lagoons from the sea. Ongoing net sediment accumulation causes the barrier shorelines to become progradational, thus forming strandplains with landforms such as beach ridges, dunes, inlets and wind-flats. As a result, the SW Baltic coast consists of cliff-faced Pleistocene headlands and Holocene sandy bay-mouth or lagoon-blocking barriers (terminology sensu Otvos, 2012) in between.
Based on the investigations of paraglacial barrier formation by Davis (1994), Forbes et al. (1995), Oertel (1985), Orford et al. (1991), and Shaw and Forbes (1992) a conceptual model of the southwest Baltic barrier evolution was outlined by Hoffman et al. (2005) and further detailed by Hoffmann and Lampe (2007). According to this model, the barrier formation is primarily driven by sea-level variation and can be divided into four evolutionary stages. The first two stages are determined by a rising sea level, known as Littorina Transgression (Kliewe, 1979). In the first stage, characterized by a rapid rise, an archipelago-like coast developed. In the second stage the sea-level rise decreased continuously. The accommodation space mainly created during the first stage filled up and the deposition of larger spits started. Behind the spits large areas developed in wind-flats and the growing barriers isolated lagoons from the open sea. A third stage set in when the sea level became nearly stable for several thousand years and the beach-ridge systems became progradational. The fourth stage of coastal evolution started with a new increase of the sea-level rise (Post-Littorina Transgression (Kliewe, 1979)) or Late Subatlantic Transgression (Lampe et al., 2007). Remaining inlets connecting the lagoons and the open sea closed, the sand intake into the wind-flats stopped and peat commonly accumulated on the back-barrier surface.
This model, which reflects the main evolution of the southwest Baltic barriers, suffers from two weaknesses. Firstly, it is based on a regional sea-level curve, which does not consider differential isostatic adjustment of specific coastal sections. Such differences cause a wider spread of the data and a higher uncertainty of the rise rates by which the stages are defined. Secondly, it provides only a rough time frame. The established stages do not rely on dated coastal landforms but only on some few 14C ages from peat underlying or covering the marine sediments or base on sedimentological evidence (for data see Hoffmann et al., 2005, 2009). To overcome these flaws, data concerning the local relation of age and sea level as well as a chronostratigraphy of the barrier landforms are needed.
To determine the ages of barrier landforms the radiocarbon method is seldom useful. Organic remains are very rare in the siliciclastic deposits and are often redeposited. The latter holds likewise for mollusk shells from shallow water deposits whose dating is precarious due to a mostly unknown and varying reservoir effect. In contrast, quartz grains from southern Baltic beach ridges and dunes are predominantly well bleached (Lampe and Lampe, 2018; Reimann et al., 2010, 2011), which makes the OSL method most promising for the dating of such deposits. However, there is little experience about the suitability of this method for the dating of sandy shallow water sediments of the barrier bases and inlets.
The objective of this study is to detail the barrier formation at a specific section of the SW Baltic Sea coast and thus to substantiate and enhance the basic model of barrier evolution. It will be shown that with only minor restraints both the eolian and the shallow water sediments of the study area can be reliably dated by the OSL-SAR method. A sea-level curve for the study area will be proposed and used to discuss sea-level changes as a driving force for the barrier evolution. Our results will be compared with those of other studies from the wider vicinity and put in context with major climatic changes during the past 5000 years.
Study area
The study area comprises the Peenemünde-Zinnowitz strandplain (PZS for briefness) embedded between four Pleistocene uplands (for simplicity named here after the settlements Zinnowitz, Neuendorf, Bannemin and Peenemünde, Figure 1) of the northwestern part of the island Usedom. The PZS forms a 12.5 km long and 3 to 5 km wide barrier which covers an area of approximately 52 km² with c. 15 km² of beach ridges and dunes (Figure 2). The geological setting has been described by Kliewe (1960) and in some more detail by Hoffmann et al. (2005), and Hoffmann and Lampe (2007).
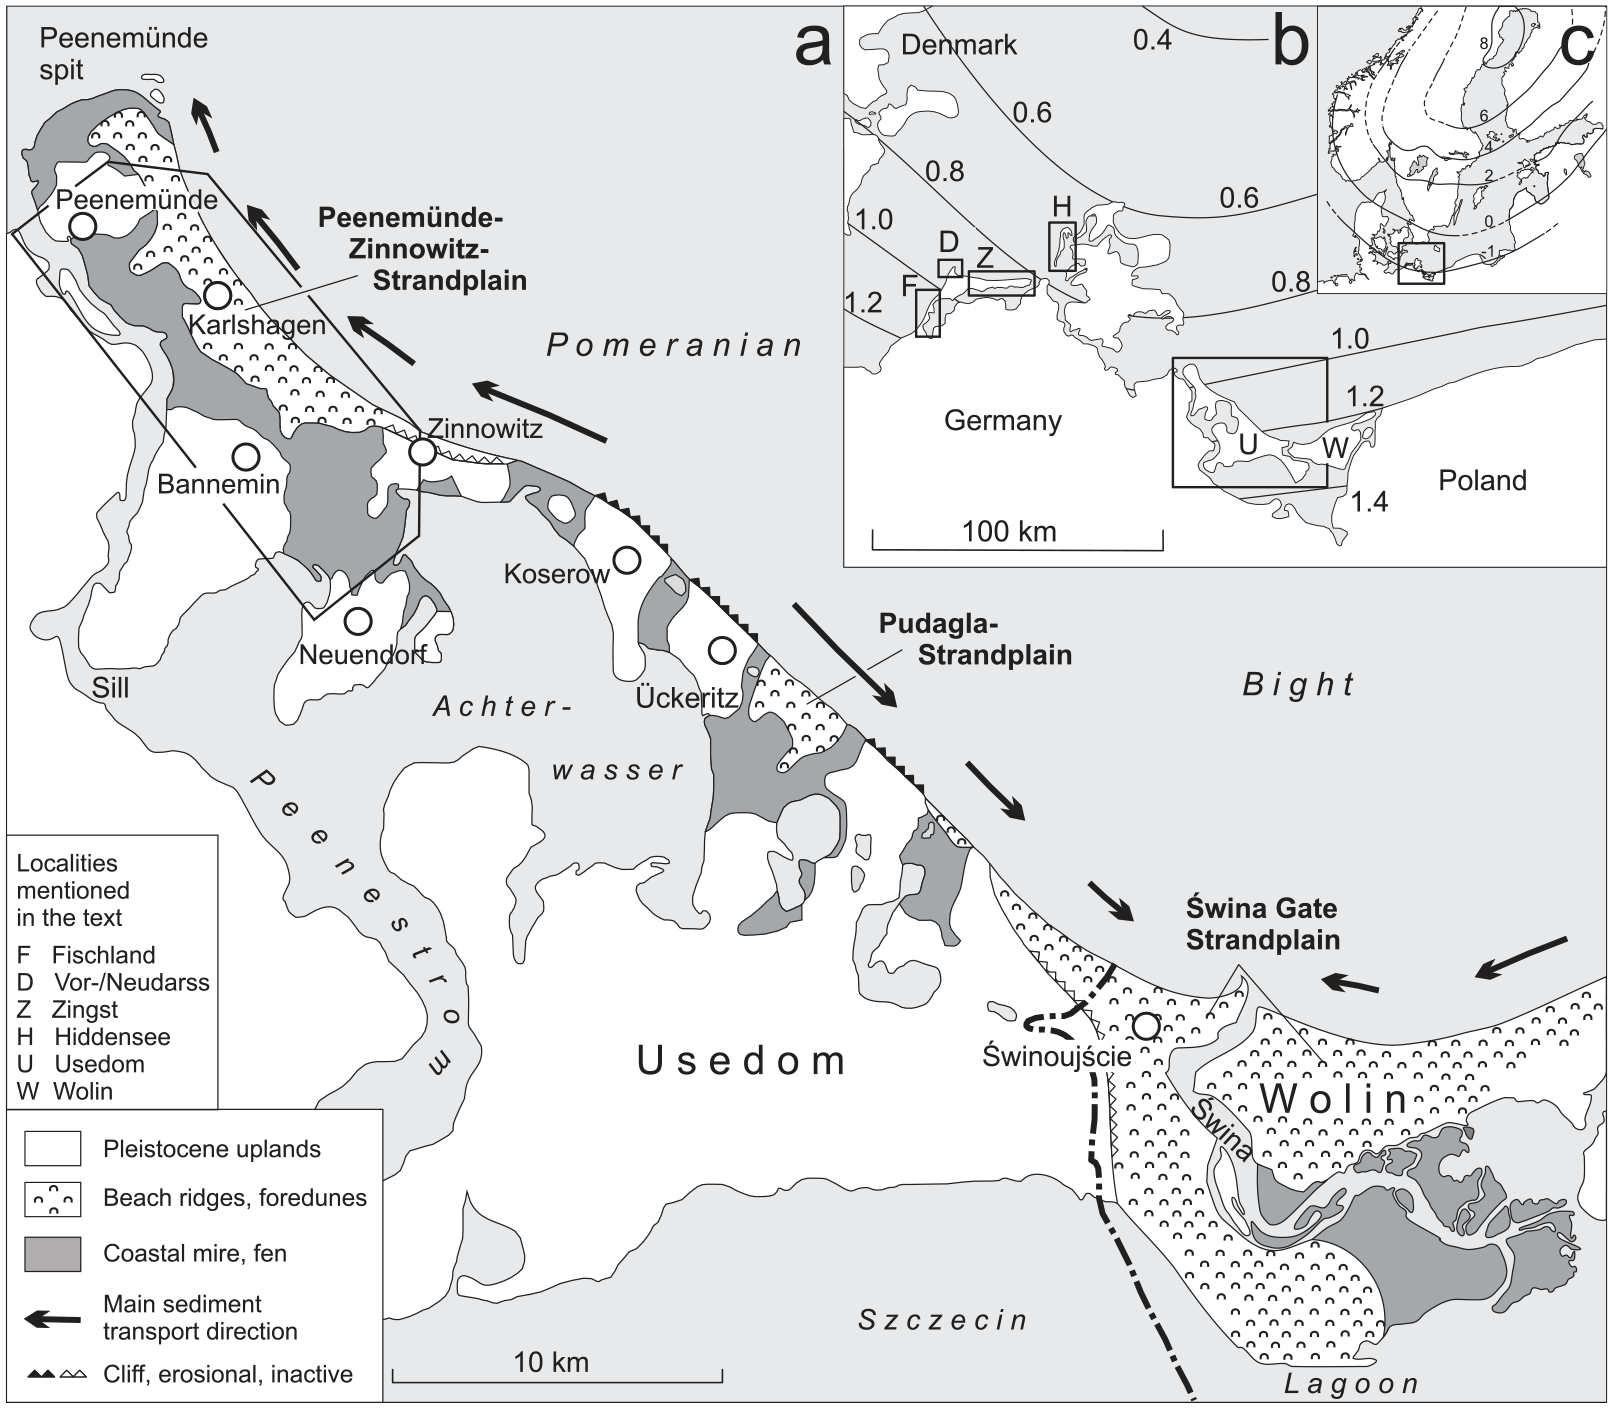
(a) The island Usedom with the study area (framed, cf. Figure 2), the Świna river and the westernmost part of the island Wolin. Also shown are three feeder cliffs and the net sediment flow toward the Peenemünde-Zinnowitz strandplain in the NW as well as the Pudagla and Świna Gate strandplains in the SE (Röber et al., 2006; Schwarzer et al., 2003). Two cliffs near Zinnowitz and Świnoujście are inactive due to foredune development in front of them. Note the position of a sill in the Peenestrom, south of the Bannemin upland. (b) The position of (a) in the southwest Baltic region, other locations mentioned in the text and the isolines of the recent relative sea-level change in mm a−1 (Richter et al., 2012). (c) The position of (b) in the Baltic Sea region is shown as well as the isolines of the recent land uplift in the realm of the former Scandinavian Ice Shield (Ekman, 1996). Note that the recent sea-level rise of 1 mm a−1 in the study area fits approximately the land uplift isoline of −1 mm a−1 and, thus, marks the area where the glacioisostatic adjustment tends to zero.
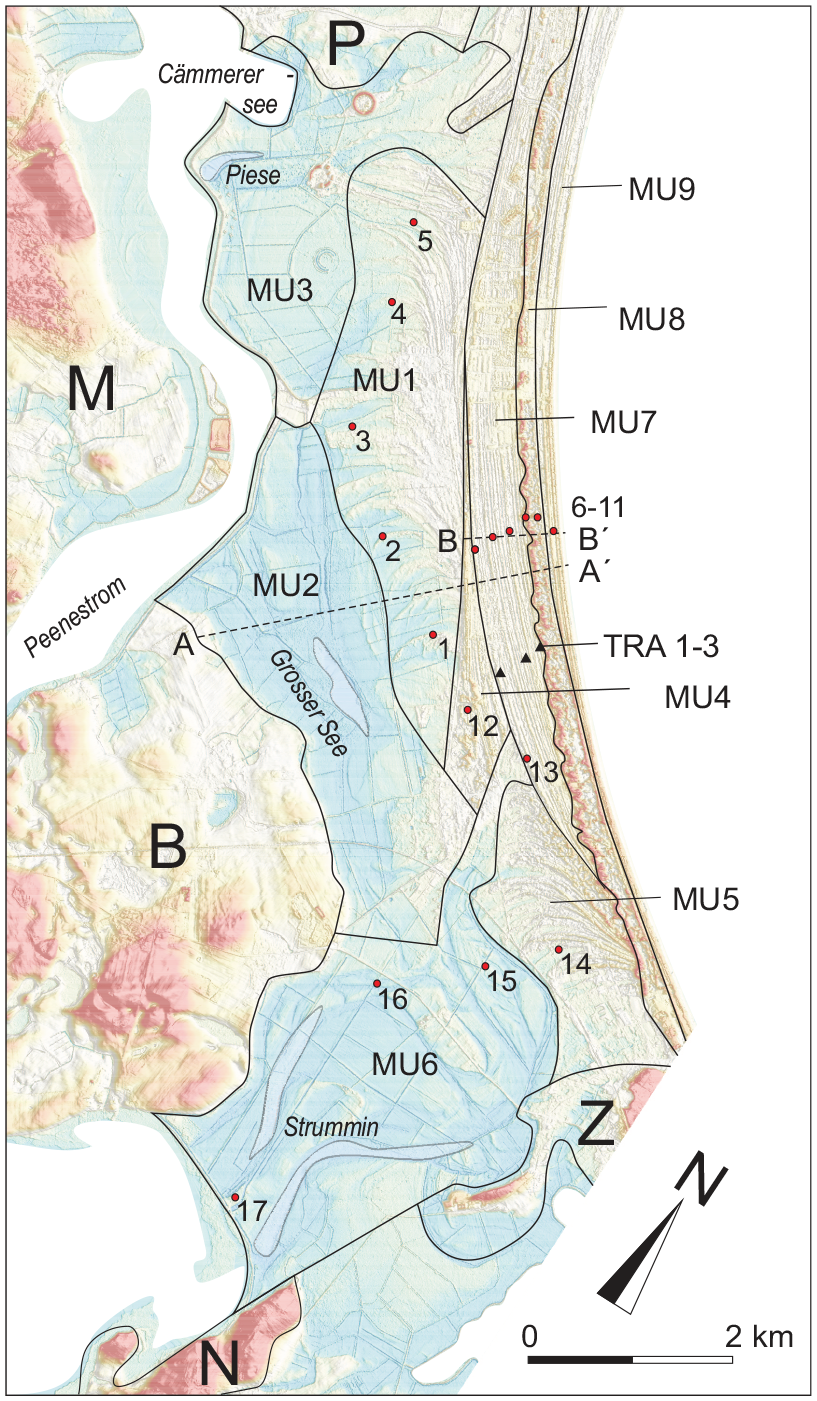
The study area (Data source: AfGVK Mecklenburg-Vorpommern, © GeoBasis-DE/M-V 2017, ETRS89 zone 33N) located between the Pleistocene uplands of Peenemünde (P), Zinnowitz (Z), Neuendorf (N) and Bannemin (B), separated from the mainland (M) by the river Peenestrom, subdivided into morphological units MU1 – 9. Also shown are the locations and labeling of boreholes 1–17 (circles), boreholes TRA 1–3 (triangles), investigated by Noppradit (2018), and positions of two cross sections (A–A′, B–B′, cf. Figure 3). A colored figure is available in the online version of the paper.
To the E the PZS borders on the Zinnowitz upland, to the S on the uplands of Bannemin and Neuendorf as well as the Achterwasser lagoon, while to the W it is separated from the mainland by the river Peenestrom. The lowly elevated Peenemünde upland delimits the PZS in the N (Figures 1 and 2). The Pleistocene uplands consist predominantly of glaciolimnic sand with some till beds and are characterized by an undulating relief with elevations up to 60 m relative to mean sea level (msl) and interjacent depressions down to −20 m. Up to a level of c. −12 to −8 m the depressions are filled with limnic sand deposited during the Lateglacial. The surface of these sands dips very slightly to −15 to −18 m in northward direction. This horizon can be found in the subground of almost all West Pomeranian barriers (Hoffmann et al., 2005; Lampe, 2005; Naumann, 2012) and was probably formed by an interconnected drainage system. The deepest part of the depressions is located between the uplands Neuendorf, Zinnowitz and Bannemin and was formerly used by the Peenestrom (Hoffmann and Lampe, 2005; Kliewe, 1960) for drainage into the Pomeranian Bight.
In the NE, the barrier is exposed to the Baltic Sea where it forms a drift-aligned coastal section with a recent mean progradation rate of 0.23 m a−1 (averaged between 1829 and 1998) which tends to increase in northern direction (Röber et al., 2006). The sources of the sediments which form the barrier have to be seen in the four headlands mentioned above and the headlands of Koserow and Ückeritz farther southeast (Figures 1 and 2) as well as their shorefaces. The headlands of Zinnowitz, Koserow and Ückeritz are assumed the most important (Schwarzer et al., 2003) in this respect.
Figure 3 shows a typical cross section through the barrier, displaying the marine base and the subsequent infill with lagoonal mud, sandy barrier and beach ridge sediment as well as the final cover with eolian sand on the seaward side (front-barrier) and with peat on the landward side (back-barrier). On the front-barrier, the relief is characterized by several sets of lower beach ridges or linear dunes and further to the sea by irregular, sometimes parabolic dunes, which pile up to 15 m. The youngest ridges are again linear dunes (Figure 3, bottom). On the back-barrier, large areas formerly developed as wind-flats (Hoffmann et al., 2005; Lehfeldt and Barthel, 1998), shallow water areas where bottom surfaces largely fell dry when seaward-blowing winds temporarily lowered the water table. During storm events with sea levels higher than normal sand was transferred from the coast through the inlets and accumulated on top of the wind-flats. Thus, sediment accumulation on the wind-flats kept pace with the slowly rising water level as long as the sediment transfer toward the back-barrier took place. Numerous relict channels can still be identified on the flatlands (cf. MU6, Figure 2). They are mostly shallow but a few are deep enough that they remain filled with water (Cämmerersee, Piese, Grosser See, and Strummin, Figure 2).
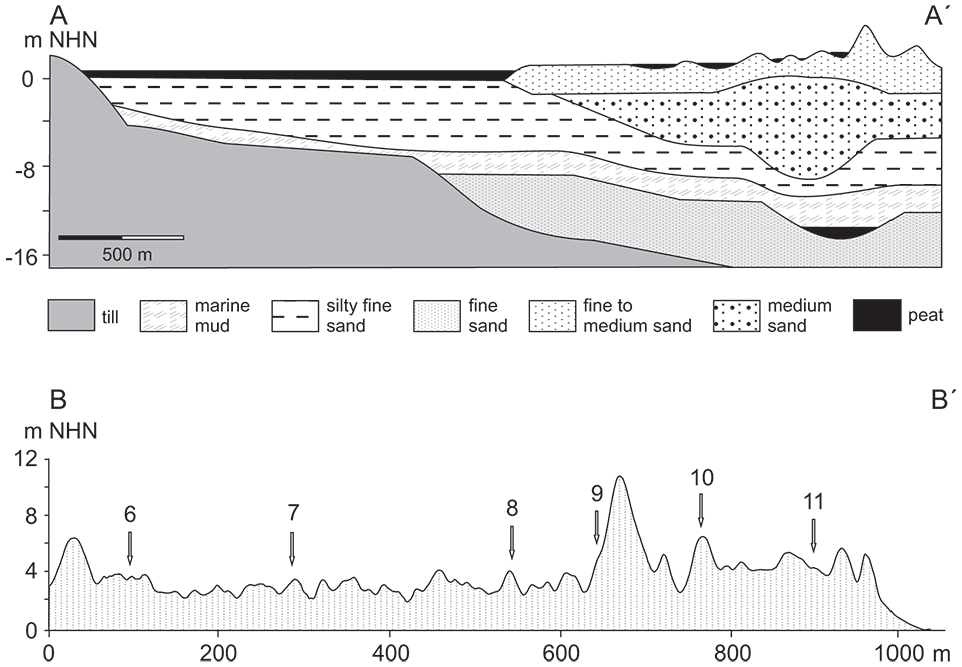
Top – Schematic cross section of the Peenemünde-Zinnowitz strandplain along section A–A′ in Figure 2 (redrawn from Hoffmann and Lampe, 2007). Sediments accumulated prior to the marine ingression are grey shaded. Bottom – Height profile of the front-barrier dune belt of the Peenemünde-Zinnowitz strandplain along section B–B′ in Figure 2. Arrows mark projected borehole positions #6–#11.
With the closure of the inlets, the sand intake terminated and the wind-flats stopped growing. Instead of clastic sediment accumulation, peat, rich in silty material, started to cover the former wind-flats (Lampe and Janke, 2004). Due to their low elevation of a few decimeter above msl, these areas frequently inundated during storm surges. They were diked during the 19th and the onset of the 20th centuries and, today, these parts of the lowland are completely technically drained and used as pastures. Because the drainage initiated widespread peat degradation, the altitude of these areas now ranges closely about msl.
In the past, research has focused on the beach ridges and dunes of the front-barrier. Keilhack (1912) distinguished three dune generations (brown, yellow, white dunes) based on the different degrees of soil development (podzols and syrozems). Janke (1971), who investigated the dune vegetation and soil development, related the formation of the irregular and elevated dunes to the Little Ice Age (LIA) and established them as a fourth generation (grey dunes) between the yellow and white dunes. Recently, Noppradit (2018) provided ten OSL ages of the front-barrier. The three sampled boreholes cover only a small section of the dune belt, which does not allow wider conclusions concerning the barrier development. Nevertheless, the results are important for an independent test of our data. Thus, until now no comprehensive investigation has been undertaken to date the different evolutionary stages and to identify the driving forces of the development.
Methods and materials
Throughout we specify altitudes with respect to NHN, the geodetic datum, which is nearly identical with the regional mean sea level. OSL dating results are given in thousand years (ka) before the sampling year 2016 (Table 1). However, in the text all ages, including those from the literature, are rounded and referenced to 2000 CE (ka b2k) for ease of reading.
Sample positions, environmental parameters, and dating results.
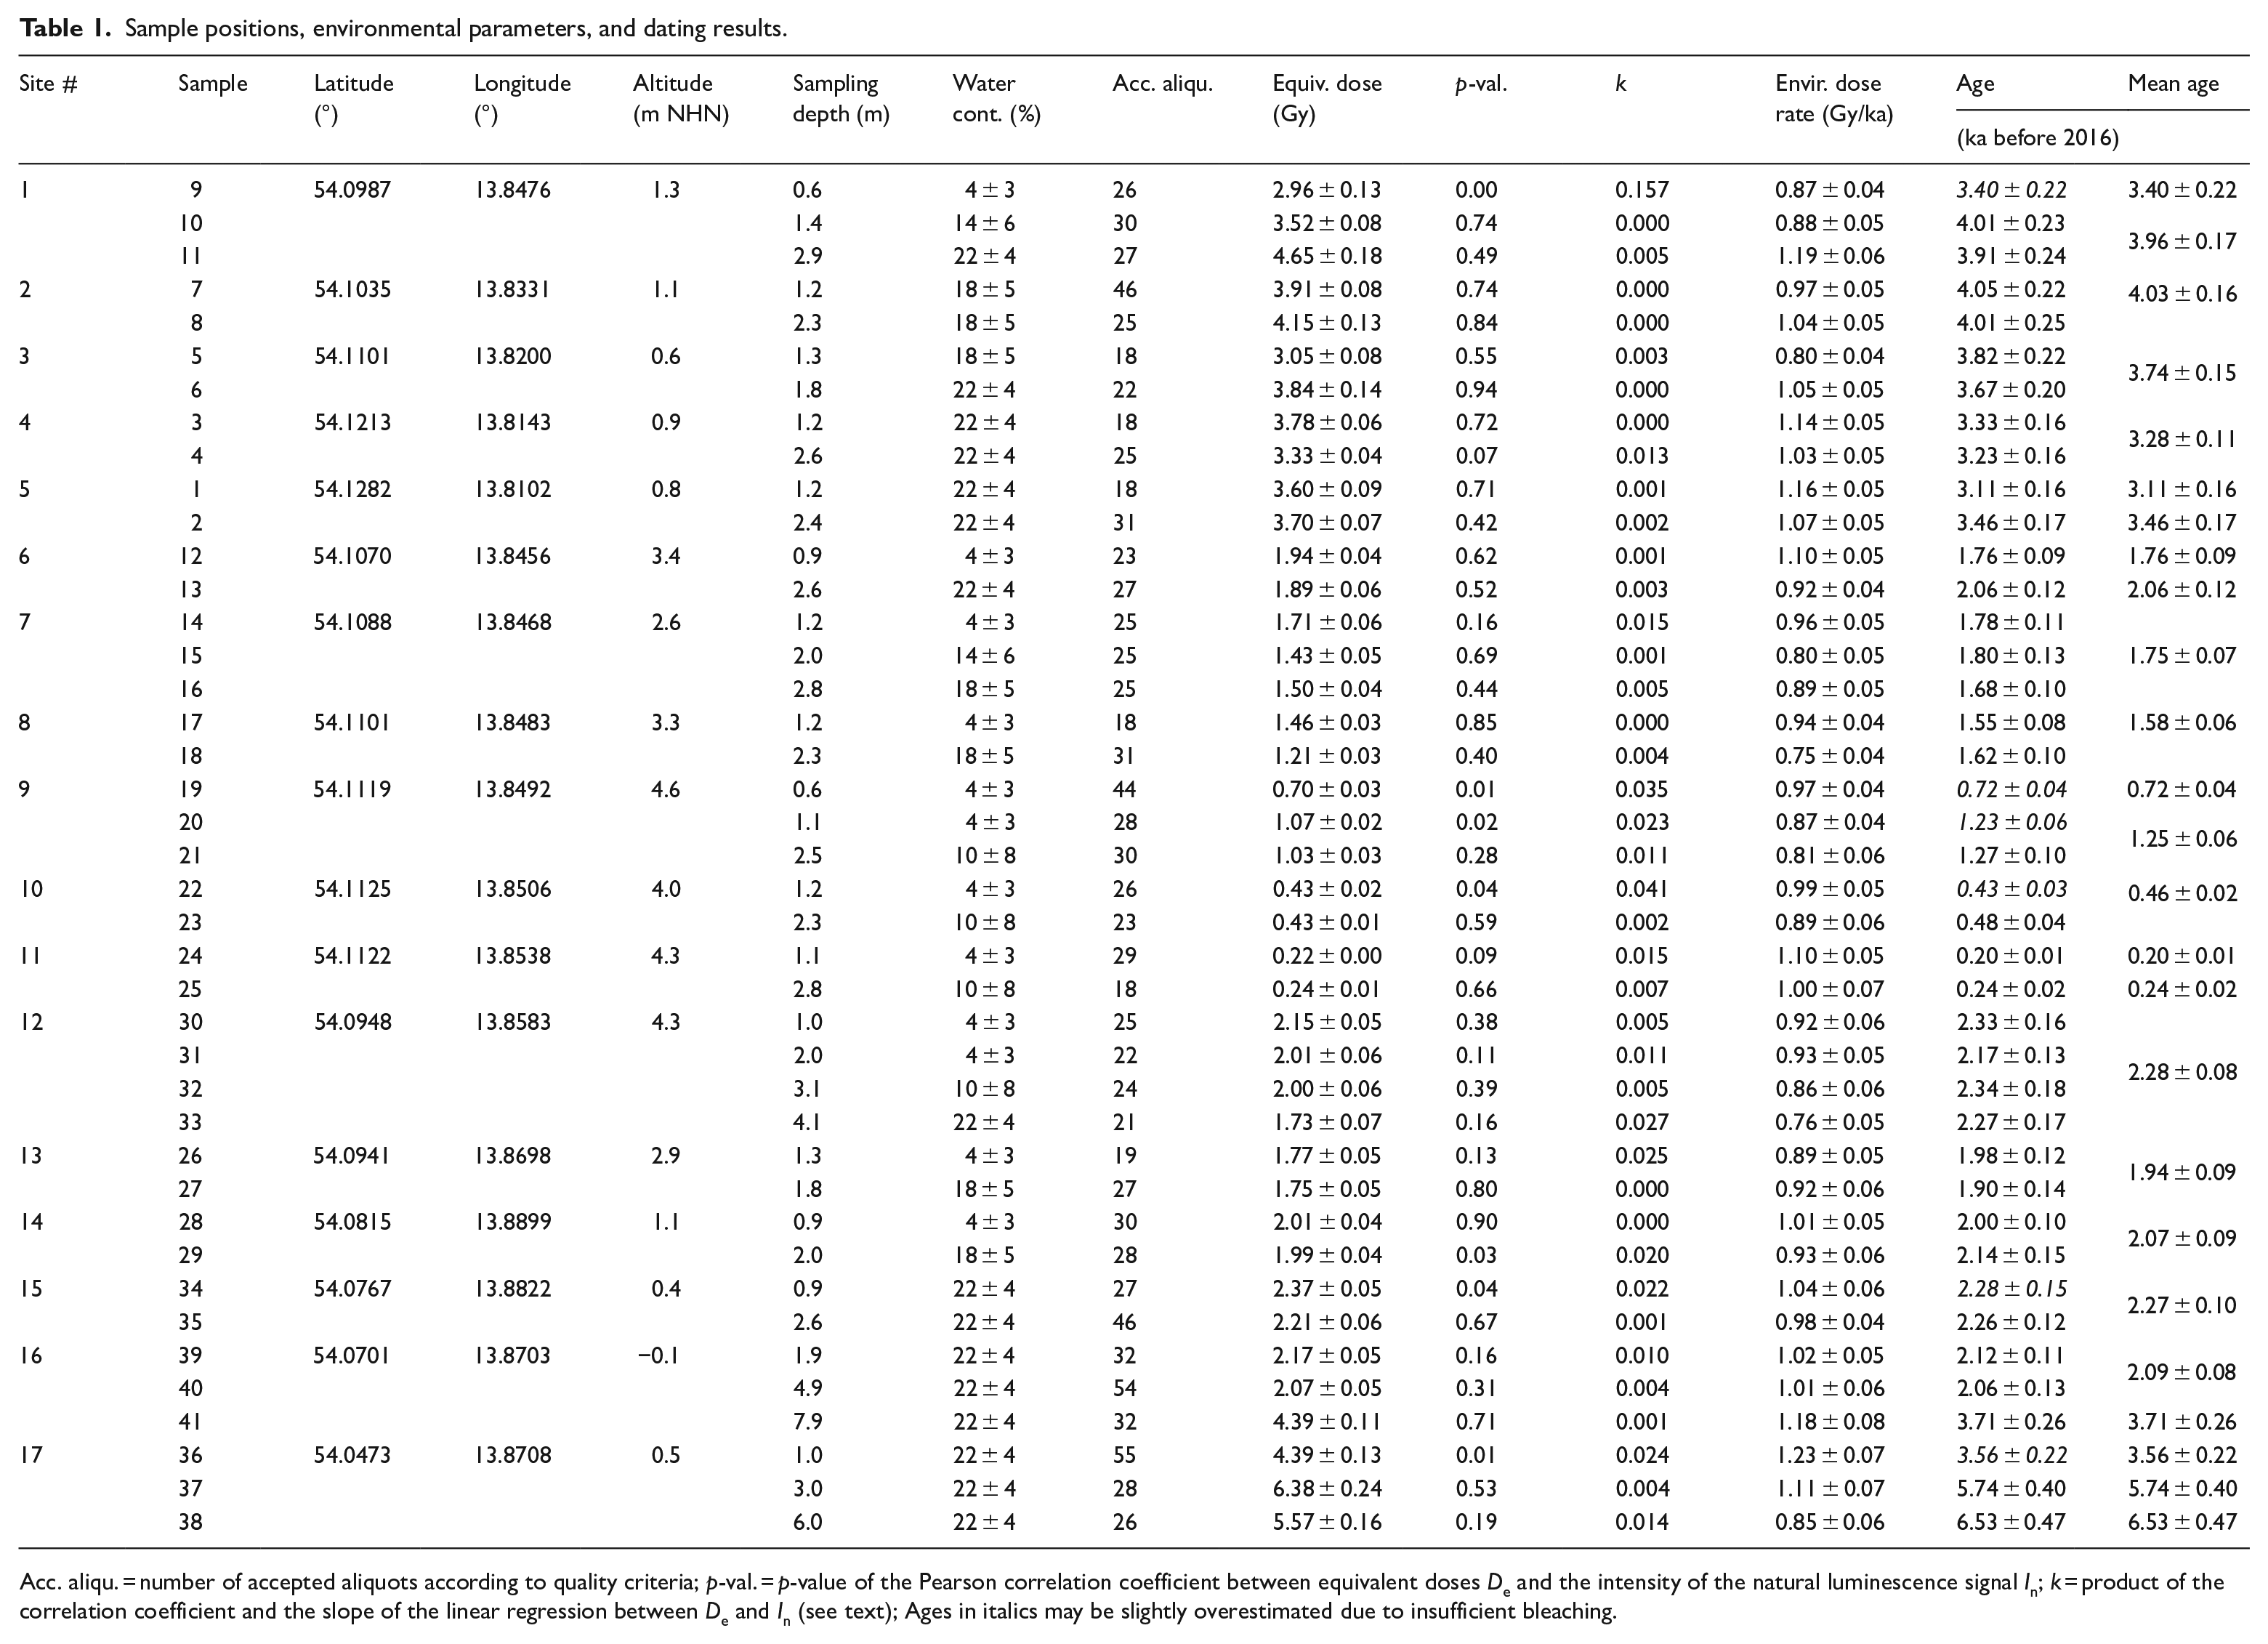
Acc. aliqu. = number of accepted aliquots according to quality criteria; p-val. = p-value of the Pearson correlation coefficient between equivalent doses De and the intensity of the natural luminescence signal In; k = product of the correlation coefficient and the slope of the linear regression between De and In (see text); Ages in italics may be slightly overestimated due to insufficient bleaching.
Airborne laser scanning based DEM provide detailed insights into landform patterns and height distribution. For geomorphological inspection, we used a terrain model of 1 × 1 m2 grid size with a vertical accuracy better than 0.3 m from which we identified morphological units (MU). The units were distinguished by height distribution, spacing, outline and direction of elongation or progradation of the beach ridges or dunes, visible erosional truncation of the ridges, convergence of beach ridges into hinge-points or transgression over older ridges, indications of breakthroughs, occurrence, course and depth of overwash channels and technical infrastructure, which indicate drainage, diking and earth moving.
The sea-level curve established by Lampe et al. (2010) for the Fischland region was checked for its validity also for the study area. The Fischland lies about 100 km westward on the same isoline of recent relative sea level (rsl) change as the study area (Figure 1b, Richter et al., 2012). Given the temporal stability of this coincidence, it would allow the extrapolation of the Fischland rsl curve to the study area. This was tested by means of the radiocarbon data published by Hoffmann et al. (2005, 2009) for the wider study area. Additionally, for the period of the past five thousand years, the more detailed sea-level curve published by Lampe and Janke (2004) is used.
Apart from the topography, the sediment transport system in the tideless study area is determined by wind driven waves and currents. The impact of a changing wind field on the coastal evolution is considered by means of the wind data of the ECHO-G Holocene Simulation Oetzi-2 (Hünicke et al., 2014). For the past 5 ka the mean annual magnitudes of the wind vector components with directions SW–NE and NW–SE, calculated from 720 wind vector records per year for grid cell 26 (southwestern Baltic), were smoothed with a Gaussian filter with a bandwidth of 60 years.
Samples for OSL dating were taken from eleven 3 m deep boreholes drilled along two transects, one along the elongation direction of the oldest curved spits (#1–#5) and one along the progradation direction of the parallel stretching beach ridges and dunes (#6–#11). Additionally, four 3–4 m boreholes were drilled in the area of the Bannemin inlet’s opening to the sea (#12–#15) and two boreholes of 9 m and 6 m on its lagoonward site (#16, #17, Figure 2). From each borehole opaque plastic liners (8 or 5 cm in diameter) were recovered. The site positions were determined by GPS, altitudes were taken from the DEM. The northernmost part of the plain could not be sampled due to ammunitions remains from World War II.
In the lab, the liners were split in 25 cm long sections under subdued red light. From all sections subsamples were taken for gravimetrical measurements of water content after drying at 105°C. Forty-one sections were selected from depths either clearly above or below the groundwater level wherever possible in order to minimize water content variations through time. From each borehole, at least two samples were selected both for control and the detection of aggradation rates and dune stacking.
The samples were dried at 50°C and wet sieved to get the fraction 100–200 µm. Separation of quartz grains, 6 mm aliquot preparation, performance tests and OSL measurements on a Risø TL/OSL-DA-20 set according to the SAR protocol (Murray and Wintle, 2000) are comprehensively described in the supplement (Supplementary data: Table S1). From the distributions of the equivalent doses (Supplementary data: Table S2) the average dose (Guérin et al., 2017) was computed for each sample. The radionuclide contents (K, Th, and U) in the sediment surrounding the samples were measured with gamma spectrometry (subsamples of c. 100 g) by VKTA Rossendorf. Environmental dose rates and ages were computed with DRAC v1.2 (Durcan et al., 2015) using conversion factors of Liritzis et al. (2013) and beta grainsize attenuation according to Guérin et al. (2012). DRAC calculates cosmic dose rates from the altitude and latitude of the sampling sites, the depths from which the samples were taken and the density of the overburden (Prescott and Hutton, 1994). The latter was modelled on depth and ranges between 1.7 and 2.0 g cm−3. The sediment’s water content crucially affects the determination of the environmental dose rate. To reduce the bias in the measurements due to changing climate and the influence of groundwater extraction, the groundwater table was modelled on altitude using data from 114 boreholes in the drilling database of Mecklenburg-West Pomerania. For each sample, the water content was estimated using measured water content and the distance to the modelled groundwater table.
To check whether the samples were sufficiently bleached the samples were tested for any dependency between the intensity of the natural luminescence signal, In, and the equivalent dose, De, both divided by their means. The variability in the data should mainly be caused by different sensitivities and, hence, show up in the In. For well-bleached samples, there should be no correlation between De and In (Li, 1984; Wallinga, 2002). For comparison, we used the respective data from dose recovery tests of nine samples (16 aliquots each) from shallow water and beach/dune deposits. The dependency was measured as the product, k, of the Pearson correlation coefficient (degree of dependence) and the slope of the linear regression between In as the independent variable and De (degree of deviation). The maximal value of k (0.02) observed for the well bleached samples was used as a threshold to identify insufficiently bleached samples, given that the p-value of the correlation coefficient was less than 0.05 (alternative: true correlation is not equal to 0). Examples are given in Table S1.
Results
Sea-level evolution
Hoffmann et al. (2009) report nine radiocarbon data from sediment cores taken from the PZS and the nearby Pudagla barrier (Figure 1). The sampling depths are corrected for compaction and the samples are evaluated with regard to their meaning as sea-level index points. The investigators assess the two oldest data as maximum ages for the onset of the transgression. Another three samples are found to be deposited in shallow water, thus pointing only to a minimum water table (white squares in Figure 4). The remaining four data are identified as true sea-level indicators (black squares in Figure 4). Two additional radiocarbon data are available from basal peats found in sediment cores taken from the Pomeranian Bight and the Szczecin Lagoon (Lampe, unpubl. data, black circles in Figure 4). Plotting these sea-level index points into the Fischland rsl diagram shows that they fit well the estimated depth-age relation. This confirms the assumption that the Fischland curve is valid for the study area.
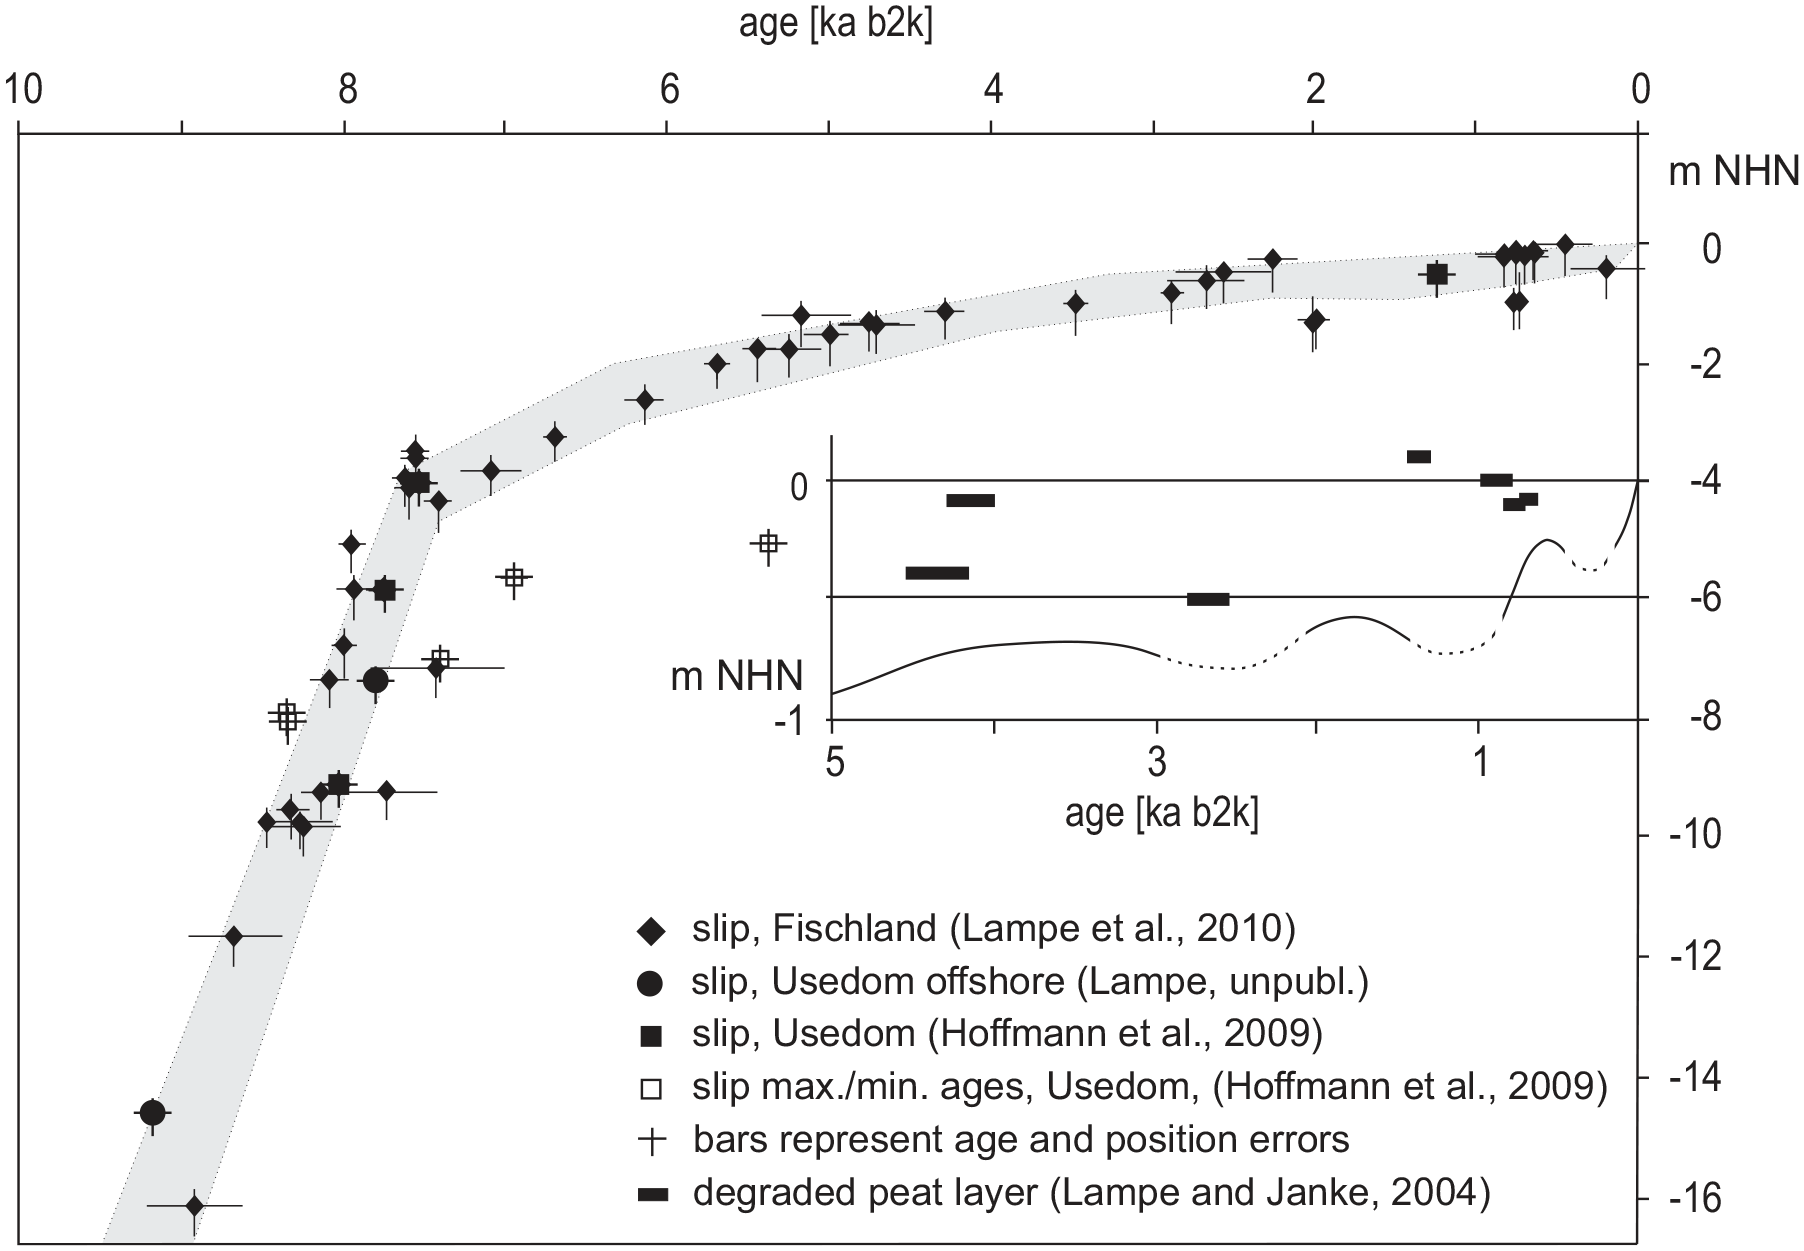
Relative sea-level curve for the Fischland area (Lampe et al., 2010). The fit of sea-level index points (slip) for Usedom (Hoffmann et al., 2009; Lampe, unpubl. data) indicates that the Fischland curve is valid for the study area. The inset shows the relative sea-level curve derived from West Pomeranian coastal mires, located on the same isoline of glacioisostatic adjustment as the Fischland area (Lampe and Janke, 2004). Layers of degraded peats in the mires point to dryness probably caused by sea-level drops.
A more detailed sea-level curve was developed for West Pomeranian coastal mires, which are also located on the same rsl isoline as the Fischland (Lampe and Janke, 2004). It gives only the uppermost meter, in other words, the last 5000 years of sea-level variation, but, due to the record of decomposed peat layers, it may resolve slight sea level drops much better than a rsl curve based on basal peat samples. Note that the decomposition occurred after the peat accumulated and, thus, these layers provide maximum ages of the sea-level lowstands. In the following, we use both curves, the Fischland curve for the period until 5 ka b2k and the coastal mire curve for the time afterwards.
Morphological units
After thorough inspection of the DEM, the PZS was subdivided into nine morphological units (MU1 to MU9, Figure 2). The numbering of the units is chosen independently of the stratigraphic order of their deposition as this is not quite clear from the visual inspection. However, the numbering starts with the unit which obviously holds the oldest beach ridges and dunes. Their topography allows a rather simple delineation and age determination relative to other units.
MU1 comprises broad, wide spaced ridges, showing an elongation direction from the Zinnowitz upland toward NW. At the distal end of the spit system the trajectory of the progradation turns toward NNE. The youngest spit necks display a similar growing direction as the ridges in the much younger MU7. Relative to the recent msl the altitude of the MU1 ridges is mostly low (<1.5 m). A relief flattening due to human impact may have occurred as the area is used as farmland since centuries. Only in some places higher elevated ridges, probably due to local dune deposits, can be observed.
MU2 is characterized by a flat, even surface, which borders on the Bannemin upland in the south. In the north, it indents with the beach ridges of MU1. Some shallow channels stretch from the Peenestrom eastwards where the transition to MU6 is gradual. Wider and deeper channel sections contain shallow lakes (e.g. Grosser See) and indicate repeated activation during storm floods prior to diking.
MU3 lies between the Peenemünde upland, MU1 and MU2. The relief is similar to that of MU2 and the transition between them is not sharp. The shallow channels on its surface reveal a former water and sediment transfer between the Pomeranian Bay and the Peenestrom and identify the unit as an old inlet. On the landward side, a back-delta like area developed, with the Cämmerersee and the Piese as deeper channels. On the seaward side, the ridges of MU7 truncate the unit.
MU4 extends on the seaward side of MU1 erosionally cutting almost all of its ridges and transgressing them at least partially. It consists of closely spaced beach ridges and dunes, significantly higher than those in MU1. They diverge toward SE and converge in a hinge point somewhere in Karlshagen, whose precise location is not recognizable due to settlement superstructure. At the eastern downdrift end, higher and irregularly formed dunes appear and a narrow funnel-like channel truncates the ridges (see MU6).
MU5 is located at the opposing bank of the channel just mentioned. It shows a well-developed system of short, recurved spits, which grew toward NE and converged in a now eroded hinge point some hundred meters offshore Zinnowitz. Along the seaward edge, irregular and sometimes transgressive dunes replace the well-defined beach ridges along the landward side.
MU6 is the third sand flat area which, like MU2 and MU3, represents a former inlet. It is characterized by a nearly even surface close to msl, winding former channels and two lakes in places where the channels were deeply scoured (Strummin, Figure 2). In the north, the wide flat turns into a narrow channel which represents the remnant of a large former opening between the Pomeranian Bay and the MU6 back-barrier area.
MU7 consists of narrow-spaced, nearly parallel stretching beach ridges which prograde in front of all other units. The oldest ridge of this unit ultimately truncated the inlet MU6, thus stopping the sediment and water exchange between the lagoon and the sea via the sand flat.
MU8 displays irregularly, sometimes parabolically shaped dunes, which reach heights of up to 15 m and transgress over the seaward side of MU7. In the NW of the study area, this dune belt is located at a greater distance from the recent shoreline than in the E indicating that the progradation in the NW became greater during or after the dunes’ deposition. While in the NW a separation into two belts might be suspected, the belts converge toward the SE – the section with lower progradation – into a wide, less differentiated zone with higher dunes which transgress farther over older ridges. In the W of Zinnowitz, the dune belt transgresses parabolic dunes and blowouts of MU5.
MU9 is built by very few regularly formed dunes in front of MU8, which in many places are reshaped by earthmoving activities. The youngest dune ridges are designed and planted as a coastal protection measure. Because the boundary between MU9 and the protection dunes is rather gradual and not always clear, we subsume the latter into this unit.
Dating results
Detailed OSL dating results are listed in Table 1. The environmental dose rates vary between 0.75 and 1.23 Gy ka−1 and show a slight trend to greater dose rates at higher ages. Relative age errors range between 5 and 9% and are well within the typical range for OSL data. Due to correlations between De and In values, insufficient bleaching and age overestimation cannot be excluded for samples 9, 19, 20, 22, 34, and 36. These samples are the topmost from the dune sites #1, #9, and #10 and the two inlet sites #15 and #17. However, we observe no violations of the stratigraphic order at these sites and the ages fit the relations with neighboring sites. We conclude that the six ages are not severely overestimated.
Higher site internal age differences are expected for the subaqueous infill of the depression between the Pleistocene uplands. In contrast, for subaerial beach ridges and dunes typical deposition rates are expected to be high and should yield lesser age differences in the vertical. For most sites, the awaited pattern is confirmed by the data. Largest differences were found for the inlet sites #16 and #17, where the ages spread over 1.6 ka and 3.0 ka, respectively. The ages from #15 and from almost all beach ridges and dunes are similar or show a trend to younger ages in higher elevated samples. The latter is most pronounced in cases of stacked dunes, where older deposits were covered by (much) younger ones (#1, #5, #6, #9, and #11). Except for #16 and #17, which mirror depression fill over some thousand years, for each site a mean age of the primary deposit and, where applicable, for the younger cover, was calculated and is shown in the last column of Table 1.
Due to lacking data, an independent verification of the dating results is only possible to a limited extent. Janke (1971) found that the transgressive dunes were deposited during the LIA, which is in accordance with our data although we found an earlier beginning of the sedimentation. One radiocarbon dating from the Bannemin inlet is provided by Hoffmann and Lampe (2005) reporting a basal peat from a depth of 5.5 m. The calibrated 14C age of 6.93–6.73 ka b2k is comparable with that of 6.53 ± 0.47 ka b2k found at #17 in a similar depth. Noppradit (2018) reports ten OSL ages from three 3 m boreholes (TRA-1 to TRA-3) taken from a transect 1.25 km away from and parallel to the transect we investigated (#6–#11, cf. Figure 2). TRA-1 is located near the boundary between MU4 and MU7 and – according to our data – should yield ages of c. 2 ka b2k. From top to bottom, Noppradit found ages of 2.28 ± 0.31, 2.48 ± 0.27, and 2.04 ± 0.27 ka. TRA-2 was taken from nearly the same ridge as #8. While the latter reveals a mean age of 1.58 ka, TRA-2 gave, from top to bottom, 1.92 ± 0.13, 1.73 ± 0.17, and 1.63 ± 0.21 ka. TRA-3 is located at the very leeward edge of the transgressive dune belt, somewhat farther inland than #9 and, thus, on older beach ridges. From top to bottom ages of 0.58 ± 0.05, 1.73 ± 0.24, 1.73 ± 0.25, and 1.90 ± 0.26 ka were found, revealing a younger dune sand cover over older beach ridges, as in #9. Methodological differences in the determination of environmental dose rates and the estimation of water contents may have caused some of the discrepancies. Nevertheless, the independent data roughly confirm our results.
Timing and dynamics of the barrier’s evolution
The transgressing sea inundated the depressions of the study area about 8.2 ka b2k when the water level reached about −10 m msl. At c. 7 ka b2k the sea level was approximately at −3.5 m msl (Figure 4). Very few accumulations are known from this time because the rapid transgression was accompanied by a lack of sediment to be deposited in the basins (Figure 5a).
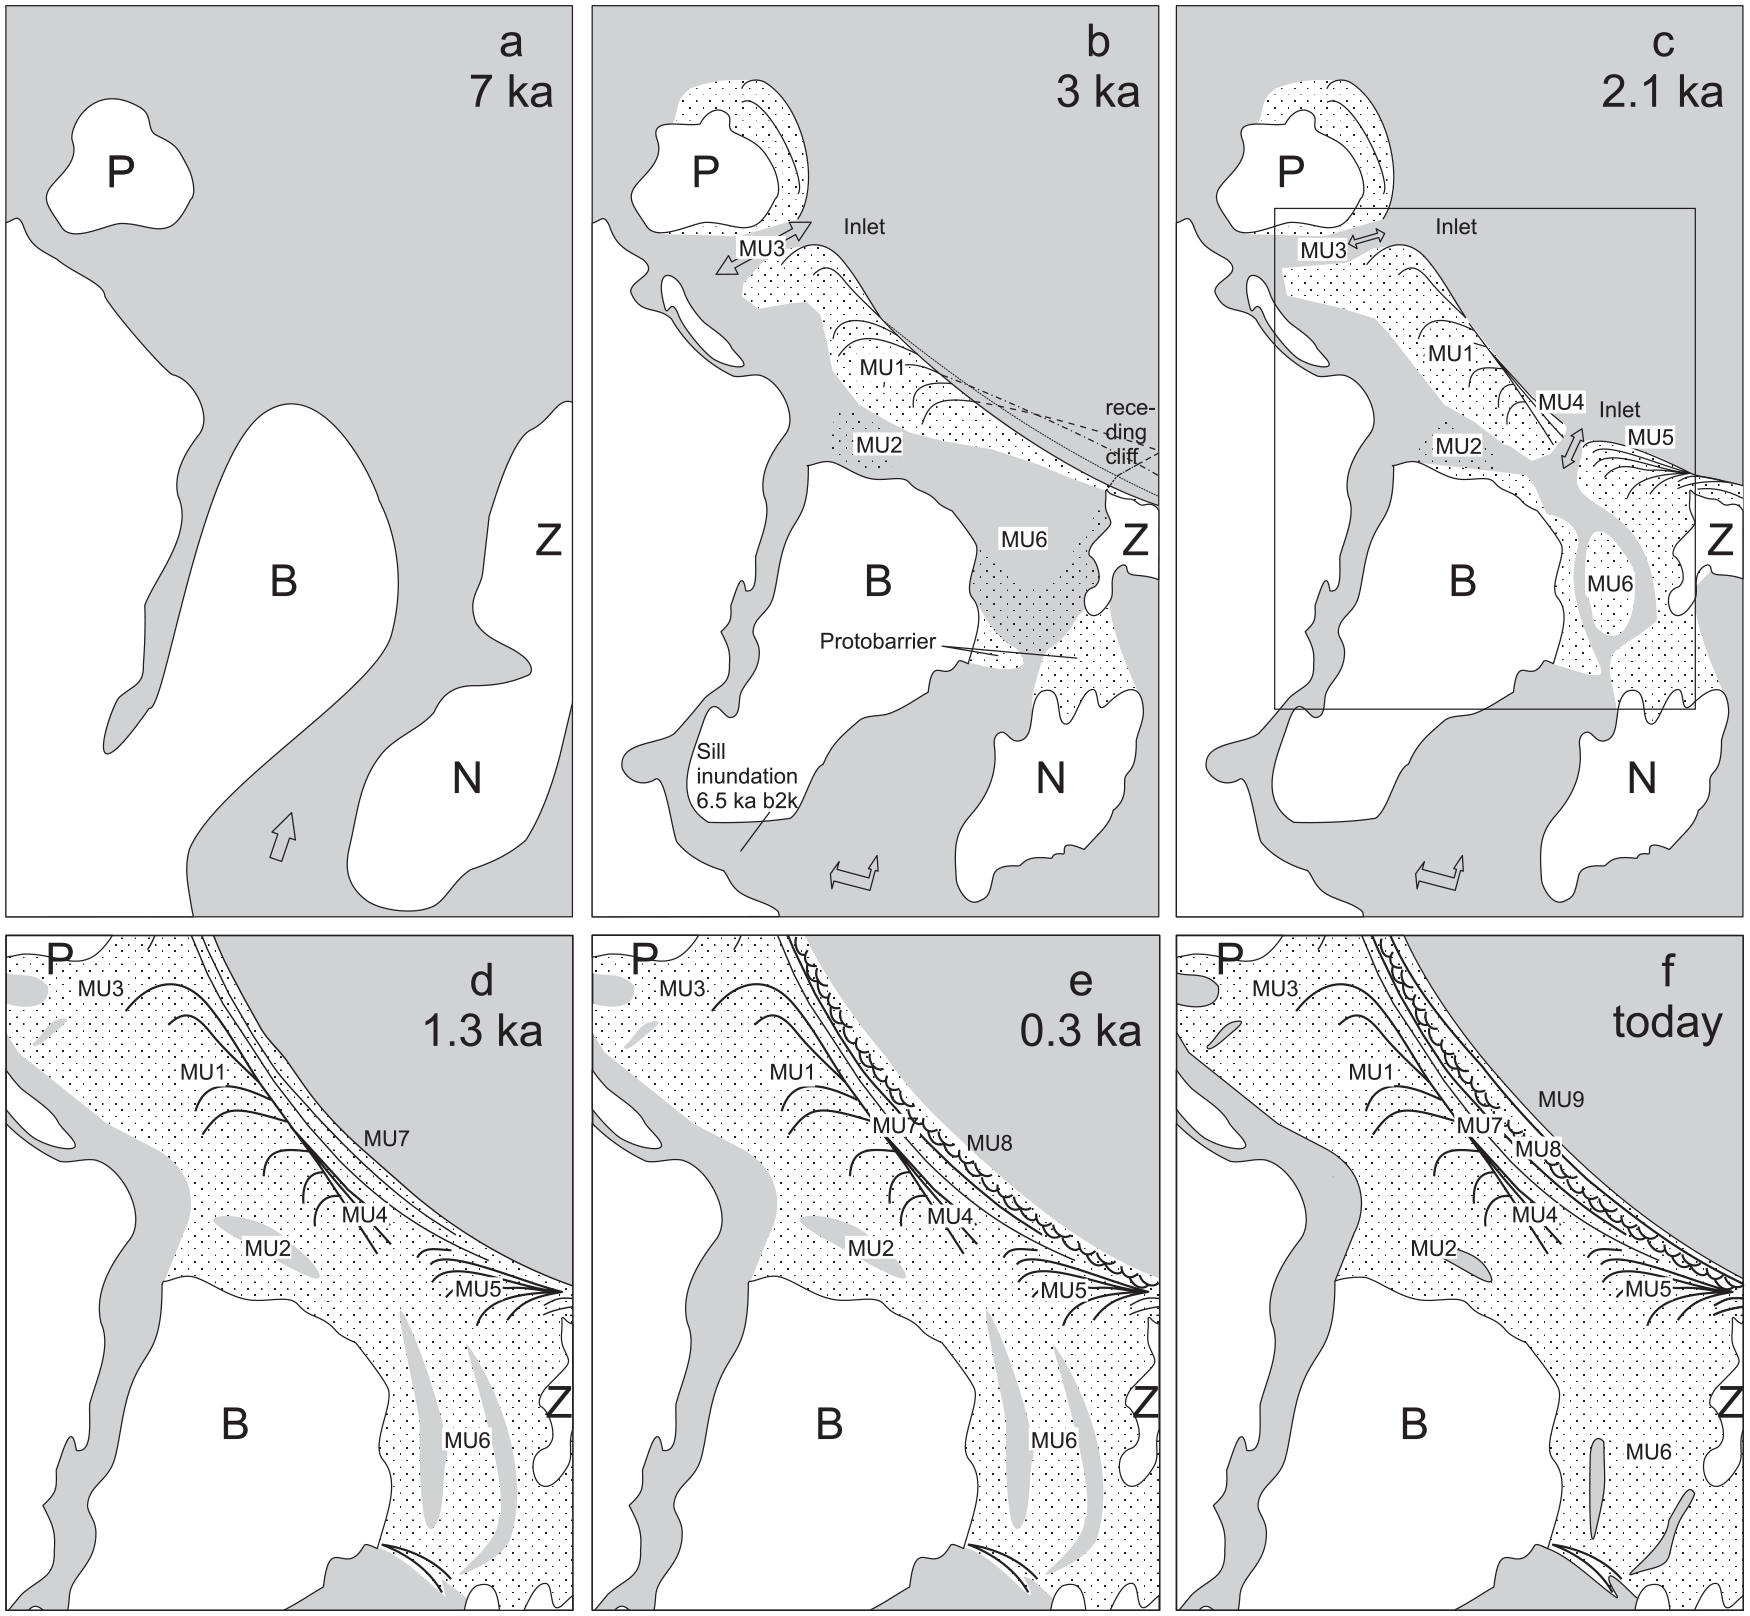
Evolution of the Peenemünde-Zinnowitz strandplain, approximated from sea-level position and deposition of morphological units, the lower sketches show the area framed in (c). (a) The transgressing Littorina Sea reaches c. −3.5 m msl, inundating the Pleistocene relief. The Peenestrom drains through the depression (arrow) between the uplands of Bannemin (B) and Neuendorf (N). Accumulations from this period were not found in this study. (b) Around 6.5 ka b2k the sea level is at −3 to −2.5 m msl and inundates the sill south of the Bannemin upland. Subsequently, the Peenestrom drains increasingly through this channel (arrow). The declining discharge in the northward direction fosters the accumulation in the narrowest part between the Bannemin and the Neuendorf upland. At c. 4 ka b2k (sea level at −1 m msl) the first beach ridges of MU1 develop. The accumulation in the back-barrier areas increases (MU2, MU6) and parts of a protobarrier became landfast around 3.6 ka b2k. The evolving MU1 spit grows fast toward the Peenemünde upland (P) where a distal inlet forms (MU3) around 3 ka b2k. (c) After a breakthrough at the MU1 spit neck, a proximal inlet forms by which sand is transported into the depression behind. MU6 and MU2 emerge widely and shallow drainage channels establish. On both sides of the inlet spit systems grow (MU4, MU5), which increasingly narrow the inlet. The passage is closed by 1.95 ka b2k at the latest. (d) After the inlet closure the strandplain becomes progradational, inlet MU3 closes and shore-parallel foredunes (MU7) accumulate at least until 1.25 ka b2k. (e) During the LIA hummocky dunes pile up (MU8) and transgress landward over MU7 foredunes. (f) After the LIA shore-parallel foredunes accumulate again (MU9) which later become increasingly altered by coastal protection measures.
The oldest marine sediments were found in the Bannemin inlet (MU6) near the lagoonal shore at the base of core #17 where the accumulation started around 6.5 ka b2k at −5.5 m msl . At that time the sea level reached about −3 to −2.5 m msl which corresponds approximately to the depth of the Peenestrom sill south off the Bannemin upland (Figure 1). The inundation of this sill allowed for the first time a redirection of the Peenestrom which may have fostered the subsequent sediment accumulation in the inlet (Figure 5b). The age data show that the inlet was successively filled from the lagoonward side toward the sea. At #17 the age of the sediment in a depth of −0.5 m msl is slightly younger than the sediments in a depth of −8 m msl at #16 and is some 100 years younger than the oldest ridges (#1, #2, #3) of the spit system MU1. We conclude that a protobarrier evolved at the narrowest section between the two Pleistocene uplands at a time when the water exchange through the inlet decreased due to the opening of the present Peenestrom (Figure 5b). Subsequently, marine-brackish mud and, later, sand accumulated in the bay-like depression in front of the protobarrier.
Soon after 6.5 ka b2k, the sea level reached −2.5 to −2 m and the Littorina transgression ceased (Kliewe and Janke, 1982). For about the next 5000 years its rise slowed to a mean rate of less than 0.5 mm a−1 with only minor fluctuations. The accommodation space in the PZS depression stopped growing and started to decrease due to accumulating sediments. About 4 ka b2k the first spits (MU1, #1) appeared above the sea level (which was nearly at −1 m) and the spit system elongated very fast toward NW at a rate of c. 4 m a−1 on average. The youngest age in #5 indicates that the MU1 spit system reached its final extension around 3 ka b2k (Figure 5b). We assume that the Zinnowitz headland was source area and hinge point for the evolving spit system, but a significant sediment portion was probably supplied from the seabed, too (Schwarzer et al., 2003). During that time a two-spit system existed, with the older proto-barrier in the back and the MU1 spit system in front of it, separated by a remaining depression in the center of the inlet (see age data of #16, Table 1 and Figure 5b). Accordingly, the former river mouth closed and the water drained more and more through the channel, which forms the Peenestrom today. Probably parts also flowed through the still open MU2 connection (Figure 5b).
The age data show that the spit system MU1 grew slower when it approached the Peenemünde upland. A narrow inlet evolved between the northern tip of the MU1 spit system and the Peenemünde upland, witnessed by dune covered spit heads on both opposing inlet banks, shallow overwash channels in between as well as the lakes Cämmerersee and Piese in the back-barrier area MU3 (Figures 2 and 5b). Further, the growth trajectory and longitudinal direction of the spit system turned clockwise. While the visible remains of the oldest ridges stretch nearly perpendicularly to the shore-parallel ridges of the adjoining MU4, the youngest ridges in the NW are truncated by the MU7 ridges at a very small angle (Figures 2 and 5b–d). We conclude that the anchor of the MU1 spits was originally located farther offshore and successively stabilized along with a slowdown of the Zinnowitz cliff retreat due to the retarding sea-level rise. This, in turn, means that sources farther east, that is, the headlands Koserow and Ückeritz (Figure 1), increasingly supplied the sediment needed for the deposition of the younger MU4, MU5 and MU7.
After a time gap of about 1000 years – a period from which no deposits were detected – the sedimentary system appears completely changed. The proximal part of the MU1 spit system eroded and the Bannemin inlet opened again. On its both opposing sides the two units MU4 and MU5 started to accumulate somewhat earlier than 2.3 ka b2k (cf. ages at sites #12, #14) thereby transgressing older MU1 and MU6 sediments. Whereas the spit tips in MU5 are well preserved, the MU4 spit tips appear eroded (Figures 2 and 5c). We conclude that the opening between the Bannemin back-barrier area and the Baltic continuously narrowed and shifted westwards toward the MU4 system thereby eroding its recurved spits. This points to a stronger sand intake from the Koserow and Ückeritz headlands into MU5, while MU4 was less nourished from redeposited MU1 or bypassed MU5 sediment. However, in both units the main transport direction was directed toward the inlet and this sediment intake caused the final infill and levelling of the Bannemin sand flat MU6 (see age of #15 and #16 upper sediments). One might expect that from the same intake also the MU2 back-barrier area successively filled, but no data are available for this unit.
MU4 and MU5 were active for about 200 or 300 years only. As revealed by the age of the first beach ridge of MU7 (#13) which crosses the former channel the inlet closed nearly 2 ka b2k. Because MU7 truncates also the Peenemünde inlet (MU3), we assume that it closed at approximately the same time. After the closure of both inlets, beach ridge progradation started along the entire coastal section from Zinnowitz to the Peenemünde upland and further northward. About 20 to 25 shore parallel beach ridges accumulated until at least 1.25 ka b2k (#9, lower samples). Along the sampled transect, the mean progradation rate between #6 and #9 (lower samples) is estimated at c. 0.65 m a−1 (Figure 5d).
The most seaward ridges of MU7 and their ages are unknown because they were transgressed by MU8 or have been eroded and redeposited (hiatus in #9, Figures 2 and 5e). According to Janke (1971), MU8 was built during the LIA, the strongest and longest cold period in the Late-Holocene (Mayewski et al., 2004), which is also known as a period of highly increased eolian activity (Costas et al., 2016). This major climate event has significantly altered the coastal dune landscape of western Europe (Jackson et al., 2019). The characteristic transgressing dunes appear as an obvious feature on all baymouth barriers and other strandplains along the West Pomeranian coast and in some cases exhibit two separate pronounced dune belts (Lampe and Lampe, 2018; Osadczuk, 2002). Along the investigated coastal section, two such belts are visible only in the very NW while they amalgamate to one wider belt in the SE. We interpret this as a sign of a northward increasing progradation rate, which is evident also from historical map data covering the past 300 years (Röber et al., 2006).
Seaward of the transgressive dune belt only a few ridges have so far been built (MU9, Figure 5f). They are represented by core #11 with an age of about 0.2 ka b2k, which gives an upper bound for the period during which transgressive dunes developed. In front of the Peenemünde upland, the unit is significantly wider due to a greater progradation rate. At its SE-end MU9 can be traced to the shore in front of Zinnowitz, where the cliff is now inactive (cf. Figure 1). This corroborates the above interpretation that the source area for the units younger than 2 ka b2k has shifted to the east. In addition, the progradation rate in the SE remained as low as observed for the LIA dunes. The most recent dunes are maintained for coastal protection purposes and have not been investigated.
Discussion
Because of the different response of the mid- to late-Holocene sea level, which depends on the position relative to the Pleistocene ice shields, we primarily compare our findings with investigation results from southwest Baltic strandplains. In doing so, we focus on two groups of processes. The first group involves processes which cause the onset of subaerial deposition, pronounced spit elongation/progradation, timing of inlet opening/closing. Such processes are mostly related to sea-level variations. Secondly, we try to identify phases of significant wind field alterations, detectable by changes in sediment transport volumes and/or directions or by the occurrence of parabolic, hummocky or transgressive dunes, often exceptionally piled up. We note that such processes are not mutually independent. Sea-level lowering occurs in periods of cooler climate, which are also stormier (Pouzet et al., 2018). The correlation between increased eolian activity and cooler periods is described in Sorrel et al. (2012), Clemmensen et al. (2009, 2015), Costas et al. (2016). Specific time ranges centered at about 4.2, 2.8, 1.1, and 0.3 ka b2k may be seen as stormy periods in western Europe.
Reimann et al. (2011) investigated the NW Polish Świna Gate strandplain (SGS for brevity), located only 35 km away from our study area and of same age (Figures 1 and 6). Due to the similarity of the environmental conditions in the SGS (wind and wave field, sea-level change, sediment) their results are of particular importance for the evaluation of the PZS data. Nevertheless, there are important distinctions in the topography of the relief prior to the transgression and in the location and volume of the source areas, which must be taken into account for more general conclusions.
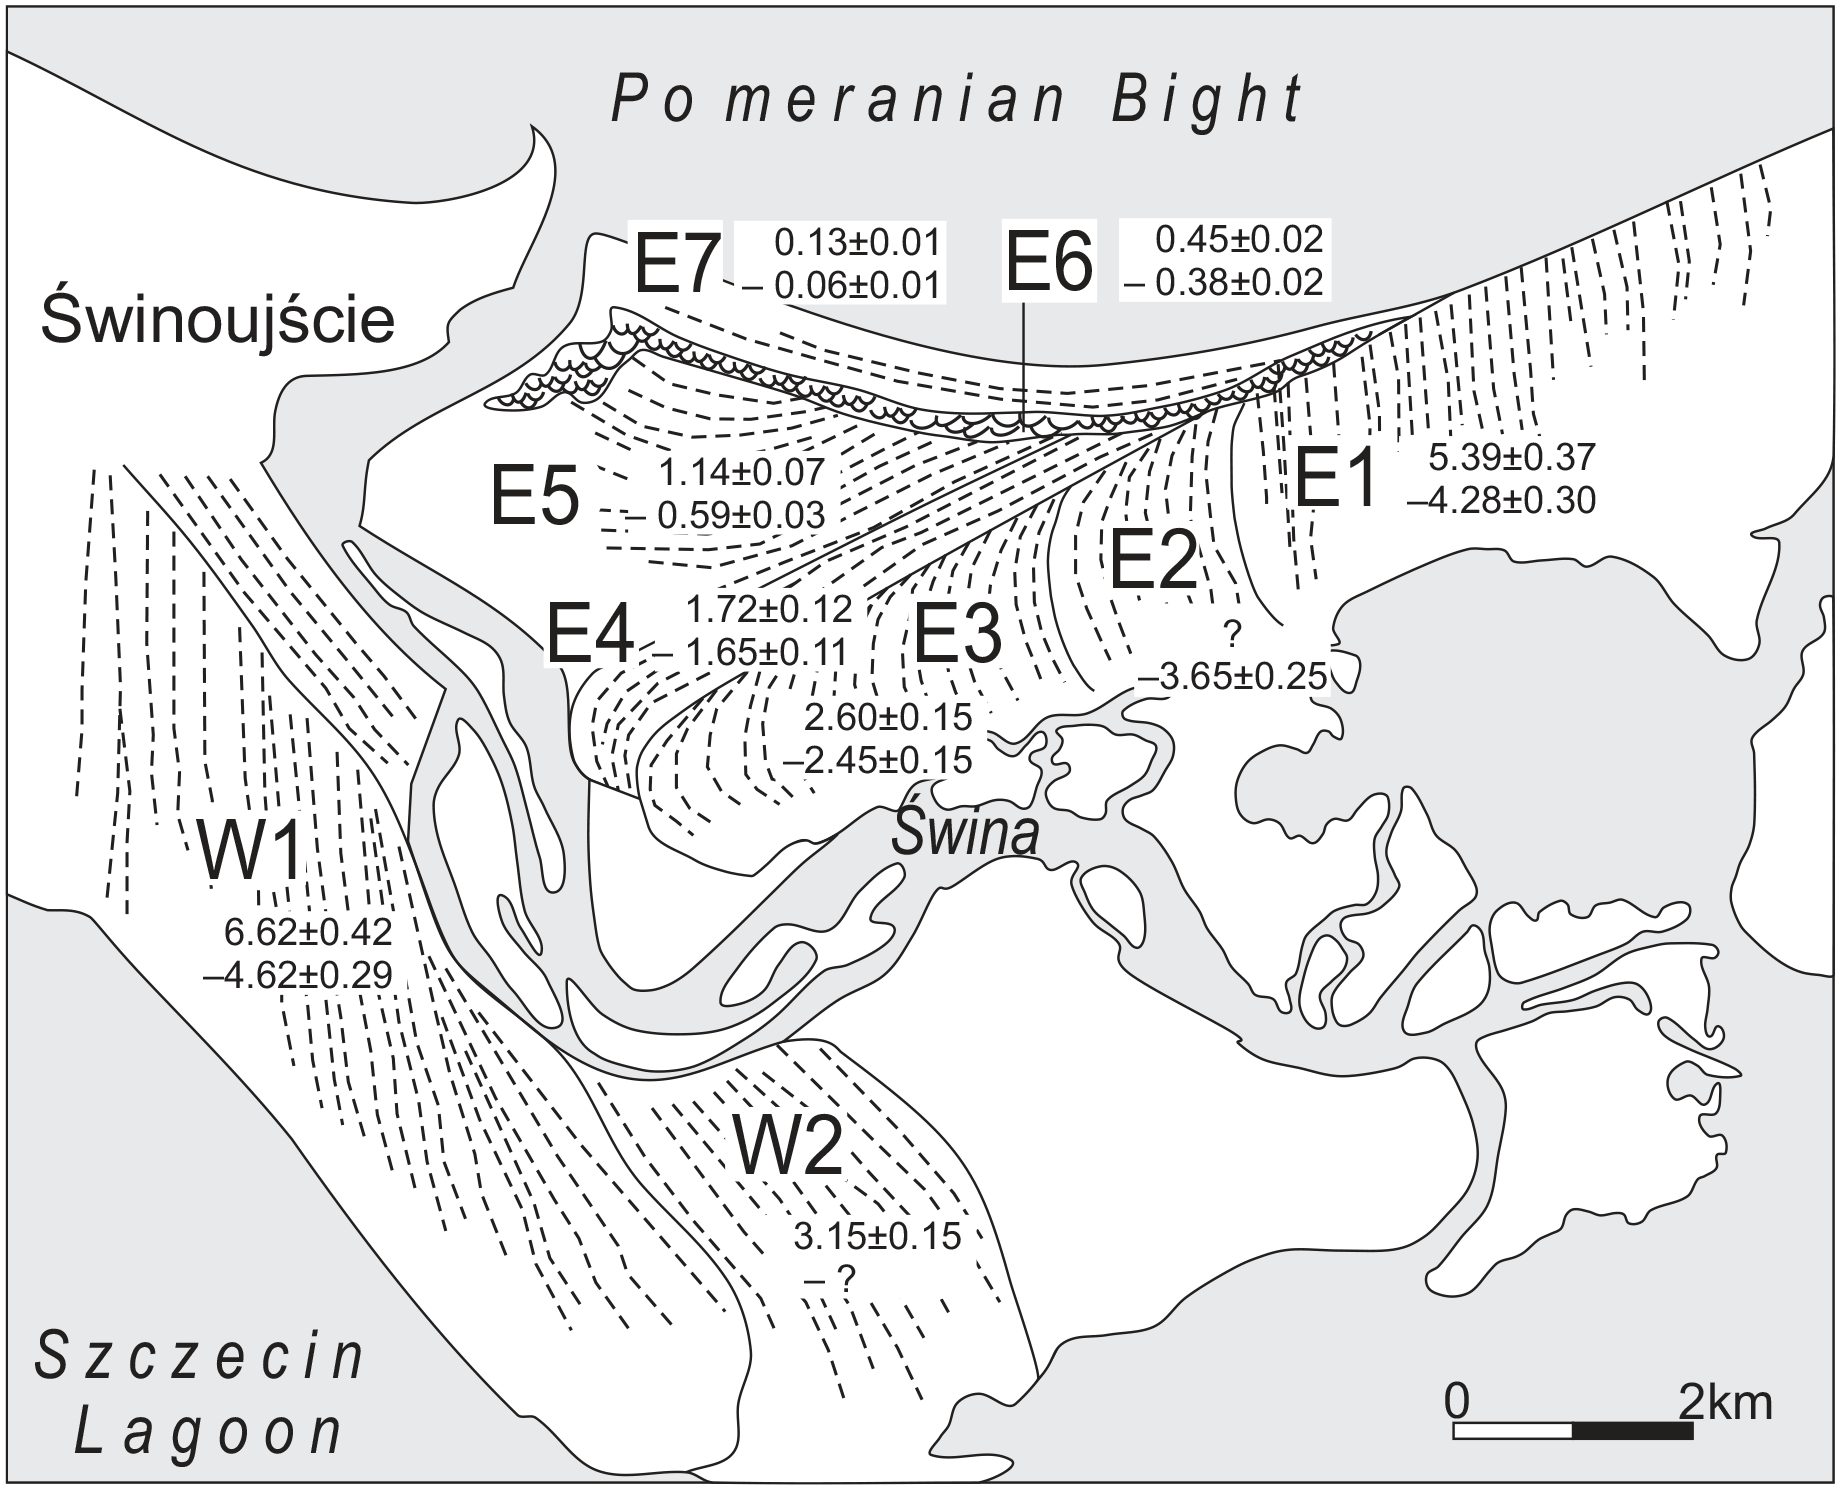
Foredune units of the Świna Gate strandplain (for position see Figure 1a). Minimum and maximum ages are given according to Reimann et al. (2011). Except of the built-up area of Świnoujście, units without marked beach ridges or dunes belong to back-barrier or back-delta areas which were not investigated.
In both areas, rivers (Świna and Peene) controlled the infill into the accommodation space (at least temporarily). The Pleistocene uplands surrounding the lowlands are located at a distance of c. 18 km at the SGS but only 1.5 km (between the Neuendorf and Bannemin uplands) and 11.5 km (between the Zinnowitz and Peenemünde uplands) at the PZS. While the SGS gains sediments from rich source areas in the west and east, the PZS receives sand from source areas in the east only (cf. net sediment transport directions in Figure 1). Here, due to topographic shielding, there is no significant longshore current from the west and the low Peenemünde upland is insubstantial as a source.
From area and mean height of the two plains, we estimate that the sediment volume in the Świna Gate exceeds two- or threefold the volume accommodated in the PZS. The age data also show that the sediment volume supplied recently by the source areas is much greater in the SGS, where the progradation rate during the past 450 years amounts to 2 m a−1 which is the fourfold of the rate observed for the PZS. A detailed comparison will show that the nearby beach ridge plains differ in their evolution despite the same rsl history. For this we use the morphological units of the SGS as described and dated by Reimann et al. (2011, Figure 7 therein) with the exception that we subdivide the `brown dune I’ spit into three units (E1–E3) instead of two. For simplicity, we rename the units as depicted in Figure 6 and show the periods of their deposition.
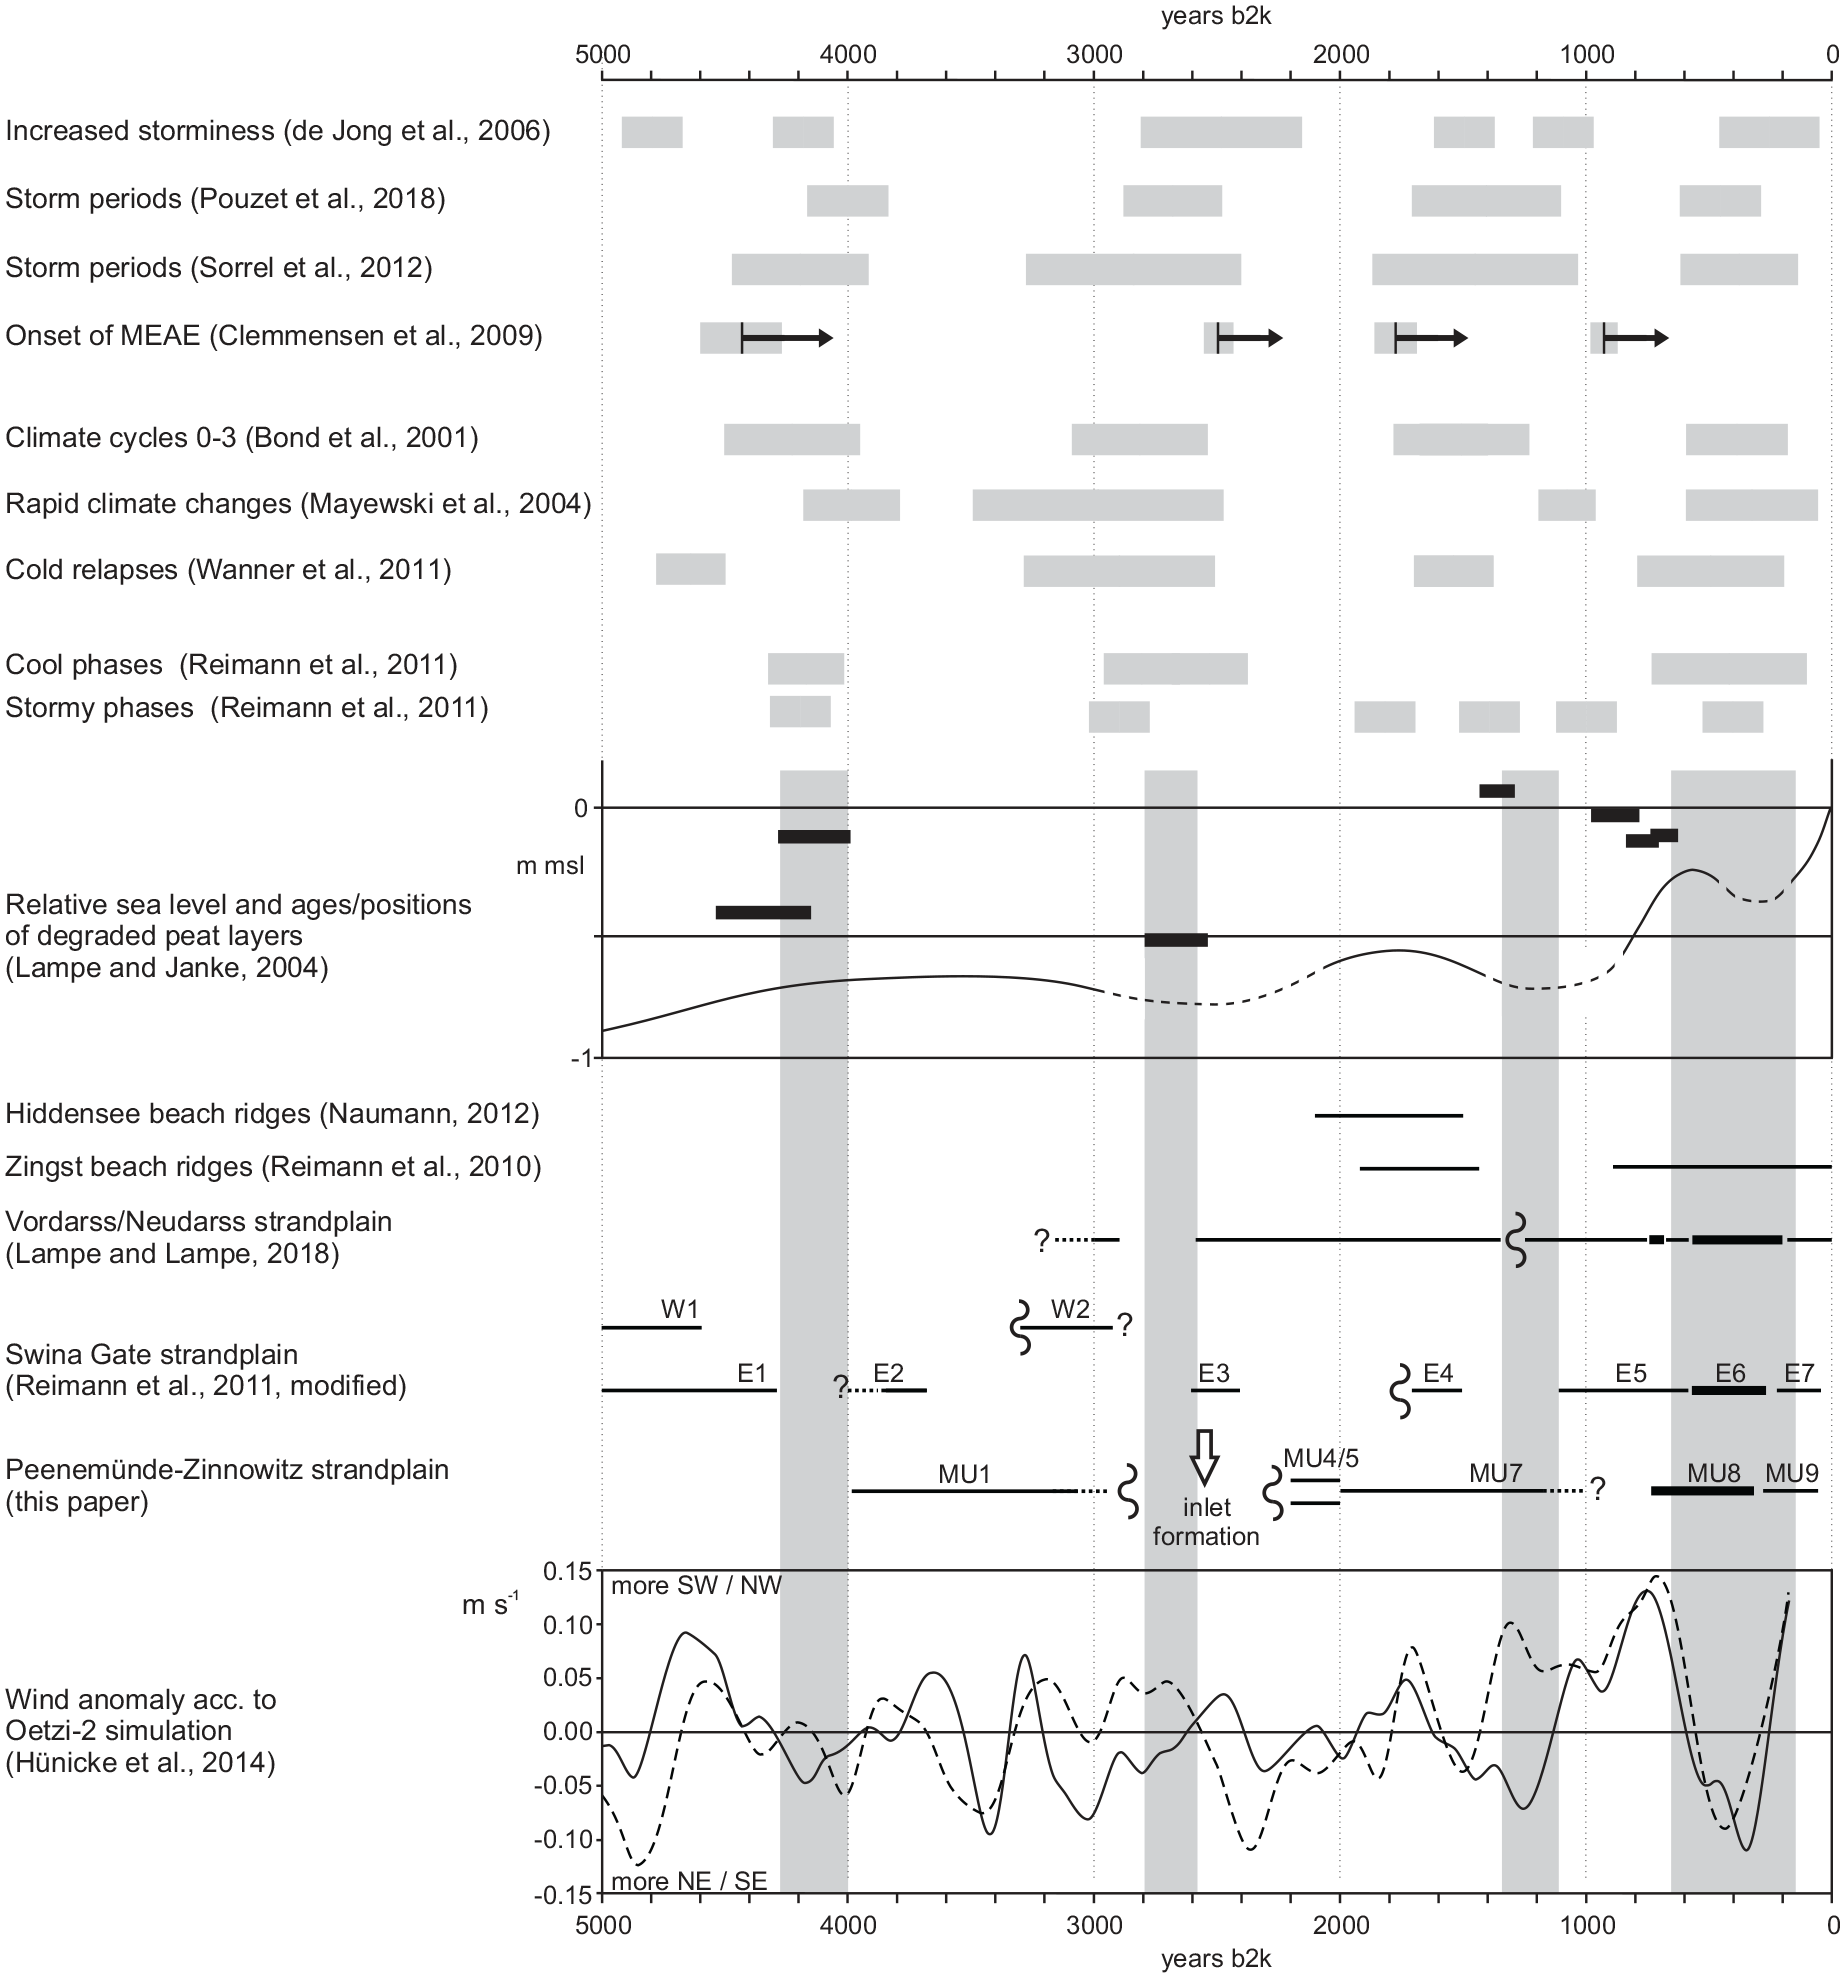
Ages of the morphological units of the Peenemünde-Zinnowitz strandplain (cf. Figure 2) in comparison with morphological units from the Świna Gate strandplain (Reimann et al., 2011, cf. Figure 6), beach-ridge or foredune complexes from the Vordarss and Neudarss strandplain (Lampe and Lampe, 2018), the Zingst peninsula (Reimann et al., 2010), and Hiddensee island (Naumann, 2012), for the locations see Figure 1b. Bold lines indicate periods with accumulation of higher or transgressive dune complexes; vertical wavy lines mark erosion and the related hiatus. Vertical grey shaded bars indicate phases of barrier progradation decline or erosion in correlation with cool and stormy periods. Two regional environmental parameters are displayed: the relative sea-level (reconstructed from West Pomeranian coastal mires, Lampe and Janke, 2004, cf. Figure 4) including ages/positions of degraded peat layers and the anomalies of wind components (solid line: SW–NE component, dashed line: NW–SE component, calculated from the Oetzi-2 data set (Hünicke et al., 2014) and smoothed using a Gaussian filter with a bandwidth of 60 years). Northern hemispheric cool or stormy periods and the respective periods identified in the Świna Gate strandplain by Reimann et al. (2011) are shown for comparison. MEAE = Major eolian activity event (Clemmensen et al., 2009); shown is only the onset (with uncertainty), the termination is not dated.
The evolution of the plains started at quite different times. In the SGS the oldest ridges reveal an age of c. 6.6 ka b2k (W1, Figure 6), a time when many beach ridge plains in tectonically stable regions started to develop worldwide (Scheffers et al., 2011). Thus, the onset of beach ridge deposition happened more than 1 ka after the significant lowering of the sea-level rise rate at 7.8 ka b2k. Apparently, the intermediate time was necessary for a sufficient fill of the inundated depression, as there was plenty of space in the very wide SGS depression where beach ridges could develop (W1, E1), sheltered from the ancient Świna river.
It seems that about 4.3 ka b2k the growth in the W1 and E1 units interrupted or at least strongly lowered (Reimann et al. 2011). Also Clemmensen et al. (2012) reported an interruption in beach ridge progradation at about 4.3 ka b2k from Anholt/Denmark. The investigators concluded a marked sea-level fall between 4.3 and 3.6 ka b2k, which is not apparent from the sea-level curves used here. Lampe and Janke (2004) investigated coastal mires with black layers of degraded peat, which are assumed to predate or coincide with slight sea-level falls (cf. Freund et al., 2004). Radiocarbon data of the oldest black layer found at two sites reveal ages of 4.27–3.99 ka b2k and 4.56–4.14 ka b2k (Figures 4 and 7), but due to vague evidence this layer was related rather to drought. However, if a sea-level variation was the cause for the degradation, it was probably of minor extent and possibly connected to the 4.2 ka climatic event (Bradley and Bakke, 2019; Walker et al. 2019).
About 4 ka b2k, in the PZS, the MU1 spit system started to grow, and about 3 ka b2k the depression between the Zinnowitz and the Peenemünde upland closed except for a narrow inlet in the north (Figures 2 and 5b). In the SGS, the onset of the E2 deposition is unknown due to lacking data but can be estimated at about 4 ka b2k. The W2 ridges accumulated since at least 3.15 ka b2k, thereby eroding the necks of the oldest W1 ridges (Figure 6). All these processes can be related to an increased sea level.
The subsequent period is in both plains characterized by erosion or at least strong reduction in spit growth. Between 3.1 and 2.3 ka b2k in the PZS the MU1 necks completely eroded and the MU6 inlet developed. In the SGS, at the boundary between E2 and E3, a hiatus can be identified between 3.6 and 2.6 ka b2k (not described by Reimann et al., 2011). We deduce that after 3 ka b2k the deposition in both strandplains interrupted for several centuries. This period can be related to a significant cooling event lasting from about 2.8 to 2.6 ka b2k. It has also been recorded by the wide-spread occurrence of a recurrence surface in Swedish bog deposits (Granlund, 1932), in raised bog deposits in the Netherlands (Van Geel et al., 1996) or as a degraded peat horizon in West Pomeranian back-barrier areas (Lampe and Janke, 1994, see Figure 4). In Jutland a major eolian activity event started, pointing to wetter, cooler and windier climate (Clemmensen et al., 2009). At the Neudarss strandplain, the period between 2.9 and 2.6 ka b2k correlates with the successive closure of an inlet prior to the beginning of a rapid progradation (Lampe and Lampe, 2018). The marked climatic change was described as the Homeric Minimum (Martin-Puertas et al., 2012) and related to a grand solar minimum, but deteriorated climate is known from an even longer period (Mayewski et al., 2004; Sorrel et al., 2012; Figure 7).
In the PZS, the erosional period terminated around 2.3–2 ka b2k, when the MU4 and MU5 spit systems were built and the remaining inlet channel between the two systems was closed. In the SGS, the E3 unit seems to have started to grow already at c. 2.6 ka b2k. The elongating E3 system caused the westward shift of the Świna and the partial erosion of the W2 unit (Figure 6). After 2 ka b2k the progradation started in both plains (MU7 in PZS and E4 in SGS), probably fostered by a sea-level rise induced by the Roman Warm Period (RWP, c. 2.25–1.7 ka b2k). A higher sea level can be inferred also from other areas in the vicinity (marked in Figure 1). Reimann et al. (2010) and Naumann (2012) reported OSL data from beach ridges on the Zingst peninsula (1.9–1.45 ka b2k) and Hiddensee island (2.08–1.71 ka b2k), which, according to the geomorphological position, are among the oldest on these Late-Holocene spit systems. The first ridges of the Neudarss strandplain accumulated 2.6–2.3 ka b2k (Lampe and Lampe, 2018).
In the PZS, the deposition of MU7 seemingly did not interrupt until 1.25 ka b2k and the progradation rate between #6 and #9 varies only slightly. Meanwhile, in the SGS, the unit E4 deposited, from which two datings show ages of 1.72 ± 0.12 and 1.65 ± 0.11 ka b2k. The oldest sample from the subsequent E5, although closely located to E4, was dated 1.14 ± 0.07 ka b2k only (Figure 6), wherefore an interruption of the deposition process is suspected. If this was the case, the hiatus can be related to the Dark Ages Cold Period (DACP, c. 1.6–1.2 ka b2k, Helama et al., 2017) and the nearly synchronous sea-level lowering (Figure 4). However, due to unfavorable sampling positions, the ages may not properly reflect onset and termination of this period. The time gap might therefore be (much) smaller. For comparison, during the DACP, the progradation rate at the Neudarss strandplain lowered significantly but did not come to halt (Lampe and Lampe, 2018). On Hiddensee and the Zingst peninsula the beach ridge growth apparently stopped after 1.4 ka b2k, but this might be a sampling effect, because only few data exist from these areas. We conclude that during the DACP the impact of climate deterioration was probably less than during the other cool periods mentioned.
The onset of the renewed sea-level rise after the DACP, known as the Late Subatlantic Transgression (LSAT, Lampe et al., 2005), is dated to 1.3–1.2 ka b2k (Figure 4) and is morphologically traceable by erosional features in many barriers along the southwestern Baltic coast. We assume that a higher sea level during the Medieval Climate Anomaly (c. 1.05–0.75 ka b2k, Mann et al., 2009) caused the subsequent increase of progradation. In the SGS, unit E5 represents this period. In the PZS, no sediment was yet identified which deposited soon after 1.2 ka b2k, but younger MU8 dunes may overlay some of it.
In both plains, the subsequent units (MU8 and E6) are characterized by exceptionally high and irregularly shaped dunes, which at least in parts transgressed over older ridges. Such transgressive dunes appear in many regions along the West European coasts and are mainly related to the LIA (in Central Europe mostly dated to 0.55–0.15 ka b2k). Surprisingly, in the PZS the oldest transgressive dune sediments have an age of c. 0.72 ka b2k, but this particular dating might be overestimated (Table 1). At the Neudarss, the oldest of the more piled up dunes date to c. 0.7 ka b2k. Clemmensen et al. (2009) found an onset of major eolian activity in Denmark even at 0.93 ± 0.04 ka b2k. We suspect that the climate deterioration that eventually led to the LIA began c. 0.75 ka b2k (cf. Neukom et al., 2014; PAGES 2k Network, 2013). The next younger transgressive dune belts of the Neudarss were dated to 0.55–0.4 ka b2k and 0.35–0.2 ka b2k, which are correlated with different cold and windy phases of the LIA (Lampe and Lampe, 2018). Datings of transgressive dunes from the SGS yielded ages of 0.45, 0.39, and 0.38 ka b2k, from the PZS there is a further dating to 0.46 ka b2k. From Skagen dunes, Clemmensen et al. (2015) describe a subdivision of the LIA into two stormy phases with a relatively calm phase in between (cf. Hass, 1996). This matches the finding from the Neudarss and the PZS. Also the SGS shows two belts of transgressive dunes (Osadczuk, 2002), but they were not dated.
After the LIA period, regularly shaped transverse foredunes accumulated again in both plains: MU9 in the PZS and E7 in the SGS, with sample ages of 0.2 ka b2k and 0.13 ka b2k, respectively. They represent the ongoing, but declining progradation, which toward modern times is increasingly altered by coastal protection measures.
Conclusion
The new datings gathered for the PZS generally confirm the Baltic barrier evolution model described by Hoffmann and Lampe (2007) but adjustments of the temporal placement of the different evolutionary phases are necessary with regard to the local sea-level curve. The first phase (8.5–7.5 ka b2k) is defined by a rapid sea-level rise, which, according to the proposed curve, reached about 7.5 mm a−1. The resulting morphological processes were landscape inundation, the development of small and instable coastal landforms as well as mud accumulation in the drowned depressions between the headlands. In the second phase (7.5–c. 6.3 ka b2k, the termination is rather gradual), the sea-level rise rate lowered substantially to c. 1.5 mm a−1. This transitional stage is mainly characterized by the filling of the depressions with sandy material and the development of first stable landforms at the end of the period. The third phase (c. 6.3–1.2 ka b2k) is defined by a nearly stable sea level. At the beginning, the infill just mentioned was completed and spits with wind-flats on the backside elongated very fast. The rate at which the depressions filled depended on the inherited relief and the rate of sediment inflow. Therefore, the time at which subaerial landforms first appeared can regionally vary! Subsequently, the barrier system became progradational. Although during this long period the mean rise rate reached only about 0.3 mm a−1, several minor climate-induced sea-level fluctuations of no more than about one to two decimeters caused distinct variations in the morphological evolution. The fourth phase started about 1.2 ka b2k, when the rise rate increased again with the onset of the LSAT. Because the new sea-level rise was interrupted by the LIA, the mean rate amounts to 0.6 mm a−1 but reached around 1 mm a−1 after the LIA and will exceed this value in the future (Stigge, 2003). At the beginning, the higher sediment supply due to increased feeder cliff erosion fostered a renewed progradation, while on the sediment-starved back-barriers peat accumulation started. In the recent past, coastal dynamics has become increasingly influenced by erosive processes. On the SW Baltic coast, about 70% of the strandplains’ shorelines are currently undergoing erosion (Schwarzer, 2003).
By comparing known climate periods with the Oetzi-2 wind simulation, the local sea-level curve as well as the morphological evolution of the PZS and other strandplains in the surroundings (Figure 7) the following can be concluded: (i) Cool periods are mostly stormier and (ii), in the SW Baltic Sea area, they are characterized by a greater proportion of winds from the NE sector. Further, (iii) they immediately follow or coincide with periods in which peat decomposed in coastal mires. The associated black layers occur just below hiatuses in the peat columns and indicate a subsequent lower sea level or drought. Also, (iv) cool periods are found to correlate with phases of decreasing or interrupted barrier growth, while warmer periods, although they may start with erosional gaps, are characterized by subsequent increased progradation. The greater sediment supply necessary for this requires stronger erosion at the cliffs and, thus, points to a higher sea level during warm periods, which is in consistency with the proposed curve. (v) At the investigated strandplains, the progradation rates during the past 200 years are significantly lower than during all other periods with increased sea-level rise. The growing accommodation space can possibly no longer be filled with sediment sufficiently fast. Thus, there appears to be a critical point in the (regional) rise rate – probably close to the recently observed 1 mm a−1 – beyond which progradation declines again. A greater rise rate could even lead to partial erosion and inlet formation. This means that the correlation between rising sea level and increased shoreline progradation is limited. Furthermore, since the progradation rate depends also on the submarine relief, the efficiency of the longshore transport as well as the material and volume of the feeder cliffs, a uniform response of coastal barriers to sea-level change is to be expected chiefly in a regional context. Finally, (vi) transgressive dunes are found to be related to areas and periods of low progradation. Such areas may occur locally in the scope of inlets (cf. MU4 and MU5, Figure 2) where currents cause frequent changes in the relief and prevent shoreline advance as well as the associated windshield. Regionally more significant are periods of climate deterioration, which furthermore destabilize vegetation and amplify eolian activity. The only period during the last 5000 years from which several generations of transgressive dunes are documented along the southwest Baltic coast is the LIA. In addition, there are some indications that the increased eolian activity started already about 0.75 ka b2k.
Supplemental Material
sj-pdf-1-hol-10.1177_0959683620981703 – Supplemental material for The role of sea-level changes in the evolution of coastal barriers – An example from the southwestern Baltic Sea
Supplemental material, sj-pdf-1-hol-10.1177_0959683620981703 for The role of sea-level changes in the evolution of coastal barriers – An example from the southwestern Baltic Sea by Reinhard Lampe and Matthias Lampe in The Holocene
Supplemental Material
sj-pdf-2-hol-10.1177_0959683620981703 – Supplemental material for The role of sea-level changes in the evolution of coastal barriers – An example from the southwestern Baltic Sea
Supplemental material, sj-pdf-2-hol-10.1177_0959683620981703 for The role of sea-level changes in the evolution of coastal barriers – An example from the southwestern Baltic Sea by Reinhard Lampe and Matthias Lampe in The Holocene
Footnotes
Acknowledgements
The authors thank B. Hünicke for sharing the Oetzi 2 data set, J. Hartleib for providing the DEM and acknowledge the support of H. Rother and M. Kenzler throughout the OSL measurements. This study became possible through a grant of the EU program EFRE for the installation of an OSL lab at the University of Greifswald. We gratefully acknowledge the comments of two anonymous reviewers which helped to improve the paper.
Funding
The author(s) received no financial support for the research, authorship, and/or publication of this article.
Supplemental material
Supplemental material for this article is available online.
References
Supplementary Material
Please find the following supplemental material available below.
For Open Access articles published under a Creative Commons License, all supplemental material carries the same license as the article it is associated with.
For non-Open Access articles published, all supplemental material carries a non-exclusive license, and permission requests for re-use of supplemental material or any part of supplemental material shall be sent directly to the copyright owner as specified in the copyright notice associated with the article.