
Abstract
The Mt. Kilimanjaro region is known for its long history of intensive agriculture, but the temporal extent of human activity and its impact on the regional ecosystem are not well known. In this study, climate-human-landscape interactions during the past ~2200 years were examined using climate and vegetation proxies extracted from the continuous and high-resolution sediment record of Lake Chala. Ancient-to-modern regional human activity is documented against a backdrop of long-term vegetation dynamics in the low-elevation savanna woodland southeast of Mt. Kilimanjaro and riparian forest within Chala crater. During prolonged dry periods (~1170–1300 CE), succulent dry crater forest expanded relative to the moist lakeshore forest. The savanna landscape surrounding Chala crater was relatively stable through time, except that savanna grasses were stimulated by higher precipitation, consistent with the fuel-limited fire regime evidenced in the charcoal record. Expansion of subalpine ericaceous vegetation and a general decline in Afromontane forest taxa on Mt. Kilimanjaro after 550 CE may reflect a lowering of its upper forest line. The earliest robust signature of human influence on regional vegetation involves an increase in ruderal (weedy) plant taxa around 1100 CE, possibly associated with the development of Chagga homegardens and associated agroforestry in the submontane forest zone. A first hint of cereal agriculture (likely sorghum) is observed around 1550 CE, followed by a more robust signature from 1780 CE onwards which likely reflects the start of lowland irrigation agriculture. From 1780 CE we also find the first undisputed appearance of maize, introduced to East Africa about a century earlier.
Keywords
Introduction
The foothills and sub-montane forest zone of Mt. Kilimanjaro, between 1100 and 2100 m above sea level (asl), have long been identified as an area of intensive agriculture in East Africa (Stump and Tagseth, 2009), with a long history of human occupation and farming surrounded by a ‘sea’ of lowland savanna relatively untouched by agricultural activity. Although different pastoralist groups have inhabited or migrated through these lowlands over the centuries, undoubtedly it is the Chagga people who have had the most pronounced impact on the Mt. Kilimanjaro landscape (Stump and Tagseth, 2009). Utilizing the plentiful water supply coming from higher up the mountain and an intricate irrigation scheme to distribute it effectively, the Chagga people inhabiting this region practice a traditional form of agroforestry which relies on the cultivation of banana, coffee and cereals in settlements known as homegardens. The start of Chagga society and irrigation agriculture on Mt. Kilimanjaro is still uncertain: it has been estimated to date back at least 400 years (Masao, 1974), but archaeological surveys and charcoal dated to ca 250 CE (1σ range: 110 BCE–650 CE) found in association with pottery (Odner, 1971) indicate that people first arrived at Mt. Kilimanjaro possibly in the early first millennium CE and eventually occupied a substantial part of its southern slopes (Odner, 1971; Tagseth, 2008a, 2008b; Stump and Tagseth, 2009). The Chagga and their predecessors appear to have maintained high population densities (Tagseth, 2008a) for centuries in a tropical environment with substantial climate variability at decadal and longer time scales (e.g., Buckles et al., 2016; Tierney et al., 2013; Wolff et al., 2011). Presumably, the Mt. Kilimanjaro irrigation scheme, which altogether consists of more than 1000 furrows with lengths of up to 30 km (Stump and Tagseth, 2009), allowed intensive agriculture by creating a safeguard against drought-related water shortages, and provided a means of support to large numbers of people. During and after the colonial era, the population of Kilimanjaro district increased rapidly, from ca 50,000 in 1899 to 500,000 in 1967 (Odner, 1971) and 1.6 million in 2012 (National Bureau of Statistics, 2013), and local irrigation techniques have continued to develop throughout this time by incorporating modern techniques to ensure farmer access to stream water (de Bont et al., 2019). The history of human occupation on Mt. Kilimanjaro in previous centuries remains vague, however, with historians drawing their information from indigenous oral histories and accounts of early European travellers, but lacking the evidence required to bridge the gap between 19th century historical reports and earlier archaeological evidence (Stump and Tagseth, 2009).
In the southeastern foothills of Mt. Kilimanjaro, close to where this history has played out, lies Lake Chala, a relatively large and deep crater lake with a long and continuous sediment archive (Moernaut et al., 2010; Verschuren et al., 2013). The sediment record of Lake Chala has been studied intensively, yielding detailed palaeoclimate and palaeo-environmental data spanning the last 25,000 years (e.g., Barker et al., 2011; Meyer et al., 2020; Nelson et al., 2012; Sinninghe Damsté et al., 2011, 2012; Tierney et al., 2011; van Geel et al., 2011; Verschuren et al., 2009). The influence of ancient and historical human habitation in the Mt. Kilimanjaro area on the region’s vegetation had not been examined to date. van Geel et al. (2011) published an exploratory account of the 25,000-year pollen record of Lake Chala only for the purpose of explaining the stratigraphic distribution of non-pollen palynomorphs (NPPs) in relation to past climate change. The abundance of dung fungal spores (in particular Sporormiella) recovered in that study showed little variation over the past 25,000 years. In any case their stratigraphic distribution is not expected to provide much insight in the historical presence of domesticated herbivores in the wider landscape, because in contrast to the pollen of vascular plants the source area of most fungal spore types recovered from lake sediments is limited to land areas draining towards the lake (van Geel and Aptroot, 2006; van Geel et al., 2011), and because the steep-sided inner slopes of Chala crater (Figure 1b and c) preclude permanent habitation and any human activity besides fishing, small-game hunting and fruit collecting even today.
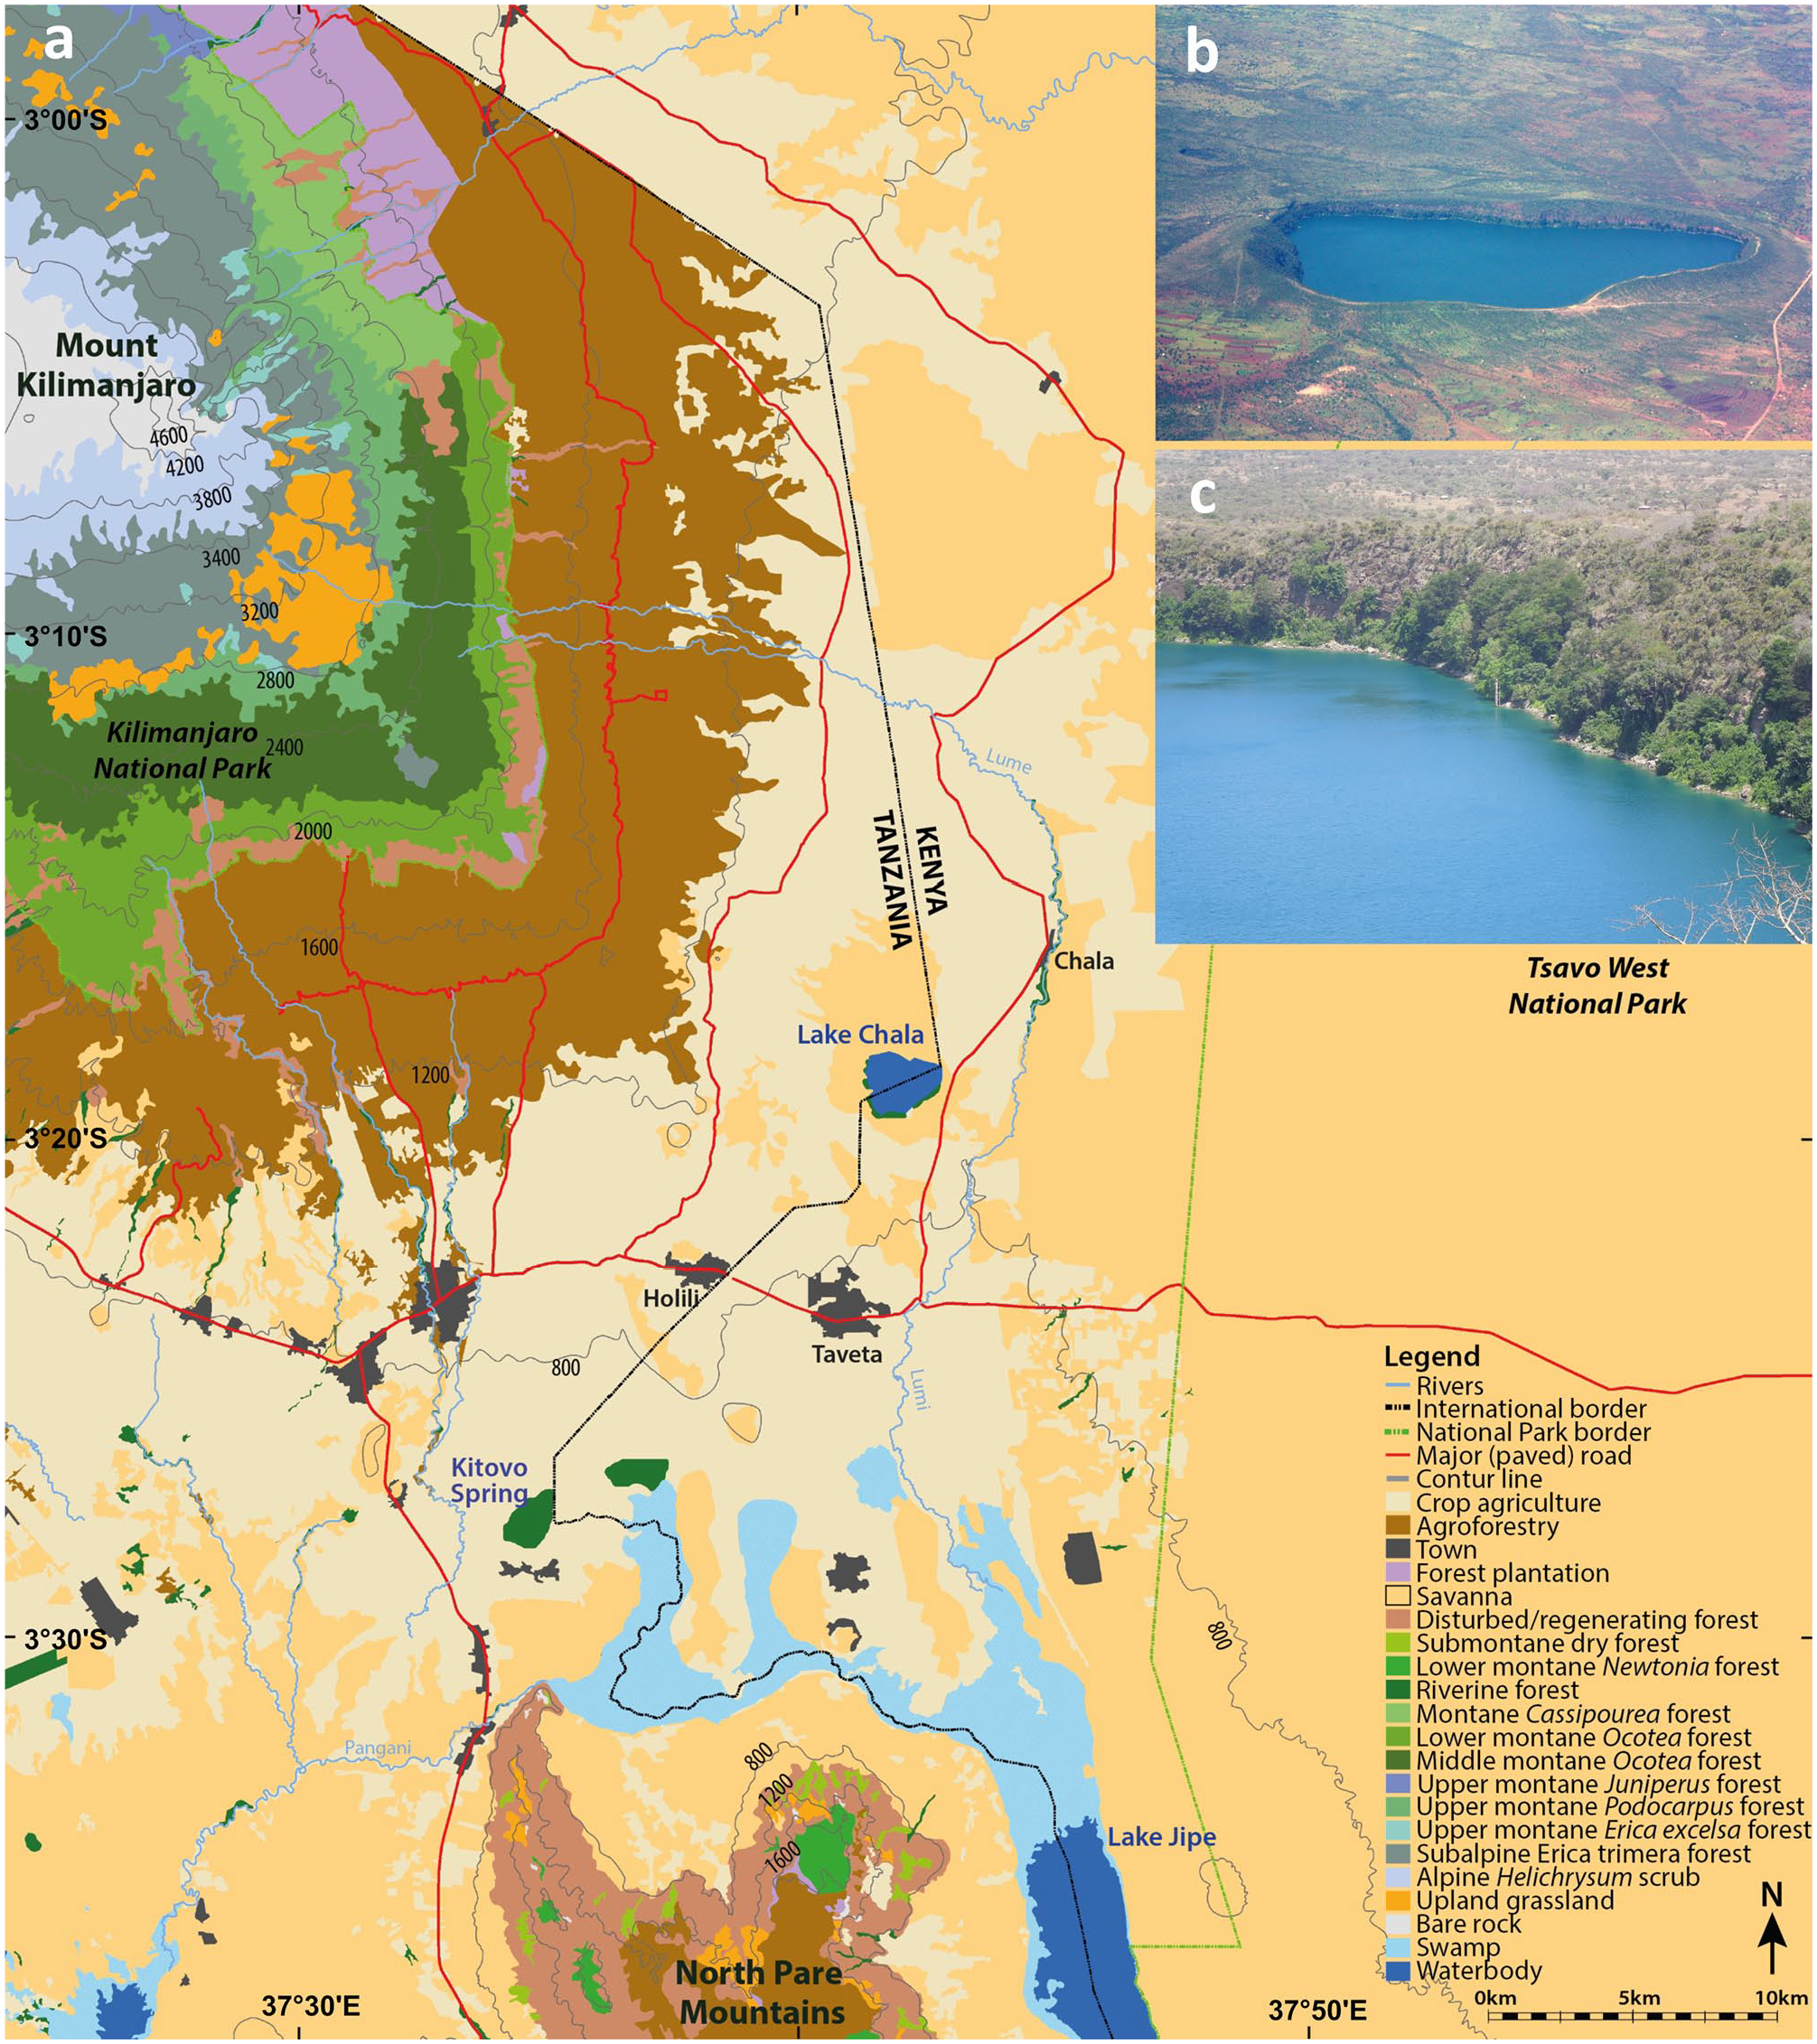
Regional setting: (a) Location of Lake Chala in relation to the major vegetation zones in the surrounding East African lowlands and on the slopes of Mt. Kilimanjaro (modified from Hemp, 2006b). (b) Aerial view of Lake Chala within its steep-sided crater basin, and of the surrounding vegetation in a partly cultural landscape, viewed from the south (photo credit: Wikimedia Commons). (c) Close-up view of steep inner slopes in the north-eastern corner of Chala crater, showing the rocky shoreline rimmed by moist evergreen forest and succulent dry forest above it (photo credit: Dirk Verschuren).
This study involves the first detailed reconstruction of past climate-human-landscape interaction in the Mt. Kilimanjaro area, based on analysis of pollen assemblages in the last ~2200 years of the Lake Chala sediment record, and their integration with independent reconstructions of regional hydroclimate variability (Buckles et al., 2016; Wolff et al., 2011) and fire prevalence (Nelson et al., 2012). Assessing the record of past vegetation change in direct conjunction with highly-resolved time series of these environmental variables is key to elucidate the complex history of temporally dynamic East African landscapes and the people occupying them (Colombaroli et al., 2014, 2018; van der Plas et al., 2019).
Regional setting
Geography and climate
Lake Chala (3°19′S, 37°42′E) is a permanently stratified (meromictic) crater lake filling a volcanic caldera on the southeastern flank of Mt. Kilimanjaro (Figure 1a). The crater rim reaches 50 to 180 m above the lake surface situated at ~880 m asl, and encloses a narrow terrestrial catchment of 1.43 km2 surrounding 4.5 km2 of open water (Figure 1b). The depth of the lake varies seasonally and inter-annually (between 91 m and 94 m during the period 2006–2016), but this has little influence on its surface area because of the steep-sided crater slopes. Twice-yearly passage of the tropical rain belt (Nicholson, 2018) creates a bi-modal annual precipitation regime, with southeasterly monsoon winds bringing the ‘long rains’ from March to May and northeasterly monsoon winds the ‘short rains’ from October to December. With a mean annual precipitation of 740 mm year−1 (1979–2019; GPCP Precipitation data provided by the NOAA/OAR/ESRL PSL, Boulder, Colorado, USA, at https://psl.noaa.gov/; Adler et al., 2003) and evaporation reaching ca 1735 mm year−1 (Payne, 1970), the lake has a negative local water balance and must be maintained by substantial sub-surface inflows. These originate from precipitation falling at the transition between the montane forest and subalpine zones (Bodé et al., 2020). Lake Chala and the surrounding low-elevation landscape experiences a tropical semi-arid climate, with major inter-annual rainfall variability linked to the El Niño Southern Oscillation (ENSO) resulting in excessive rain and flooding during El Niño years and droughts in La Niña years (Goddard and Graham, 1999).
Modern-day vegetation
The vegetation of Mt. Kilimanjaro’s southern and eastern slopes consists of several distinct vegetation zones along a 5000-m altitudinal gradient (Figure 1a). In the colline savanna zone directly surrounding the mountain (700–1100 m asl), the vegetation is nowadays largely converted into agricultural land, especially maize (Zea mays) fields. The lower part of the submontane and lower montane zone (1100–2100 m asl), up to 1700 m asl, is now also a predominantly cultural landscape characterized by the homegardens, a traditional multi-layered agroforestry system where the Chagga people grow mixed cultures of banana, coffee and vegetables interspersed with shading trees and irrigated by a network of furrows (Fernandes et al., 1984; Hemp, 2006b). Besides the homegardens, this zone has grass meadows and commercial coffee plantations. Remnants of submontane dry forest with Newtonia buchananii only occur in steep-sided valleys. Above 1700 m asl the vegetation consists of heavily disturbed lower montane Agauria-Ocotea forest, despite being situated within the national park boundary. In the middle montane zone (2100–2800 m asl) Ocotea usambarensis dominates the tree layer together with Xymalos monospora, Ilex mitis and the tree fern Cyathea manniana. The forests of Mt. Kilimanjaro are unique among the high-mountain areas of East Africa for their lack of a bamboo zone (Hedberg, 1955; Hemp, 2006b; Moreau, 1944). The upper montane zone (2800–3200 m asl) consists of Podocarpus latifolius forest with Schefflera volkensii and Hagenia abyssinica. Large areas of Podocarpus forest were affected by repeated fire events during the past 50 years, replacing the Podocarpus forest with mono-dominant stands of Erica excelsa (Hemp, 2005, 2009; Hemp and Beck, 2001). Above the upper limit of closed forest, nowadays located between 2700 and 3200 m, the subalpine zone is covered mainly by ericaceous bush (Erica spp., Stoebe kilimanjarica and Euryops dacrydiodes) because recurring fires impede forest regeneration. Remnant stands of Erica trimera forest represent the original upper forest line at 4000 m asl, the highest-elevation forest of Africa (Hemp, 2006a). In the alpine zone between 4000 and 4700 m Helichrysum scrub vegetation and grasses prevail. The nival zone above 4700 m asl is largely bare of vegetation.
Within the steep-sided Chala crater, various types of relatively pristine woodland and forest vegetation occur (De Wispelaere et al., 2017; Griepentrog et al., 2019; Hemp, 2006b). The rocky lakeshore is encircled by evergreen forest with Ficus sycomorus, Lepisanthes senegalensis, Sideroxylon sp., Sorindeia madagascariensis and Trichilia emetica as common trees, interrupted by stretches of shoreline formed by near-vertical rock walls plunging into the lake (Figure 1c). Higher up, the crater slopes are covered by dry forest vegetation with succulent trees and shrubs (Euphorbia bussei, E. quinquecostata, E. tirucalli and Aloe baluensis), deciduous trees such as Commiphora baluensis, Boswellia neglecta, Albizia zimmermannii and Haplocoelum foliolosum, and a partly dense shrub layer consisting of Acalypha fruticosa, Grewia tephrodermis, Maerua sp., Thylachium africanum and various species of Combretum (Griepentrog et al., 2019; Hemp, 2006b). The steep inner crater walls prevent significant human activity inside Chala crater except fishing, which has kept the crater’s local vegetation relatively untouched. However, in recent years parts of the dry crater forest have been destroyed by fires set by alcohol distillers occupying shallow caves surrounding the lake. The crater rim and the more gently sloping outer slopes are covered by open savanna woodland (‘Obstgartensteppe’; Volkens, 1897), a highly diverse plant community of Acacia (but note that African acacias are now assigned to Vachellia and Senegalia; Boatwright et al., 2014), Acalypha, Combretum, Grewia, Rhus, Lannea, Terminalia, Vepris and Ximenia trees and shrubs interspersed by grassland with dominant grasses Themeda triandra and Enteropogon macrostylus (De Wispelaere et al., 2017) complemented by Bothriochloa insculpta, Eragrostis superba, Cyperus niveus and Indigofera volkensii (A. Hemp, personal observation). Similar plant communities still occur on some of the dry volcanic vents dotting the colline zone of Mt. Kilimanjaro, but elsewhere most of this type of vegetation has been converted to agricultural fields (Figure 1). As a result, except for a sanctuary on the Tanzania side of Chala crater, it is nowadays nearly completely surrounded by agricultural land (Hemp et al. 2017; Figure 1b). Here, maize, finger millet (Eleusine coracana), sorghum (Sorghum bicolor), ground nut (Arachis hypogaea), beans (Phaseolus vulgaris) and sunflower (Helianthus annuus) are grown (Hemp, 2006c; Soini, 2005).
Materials and methods
Composition and chronology of the sediment record
Between 1999 and 2005 several sediment cores have been retrieved from a mid-lake location in Lake Chala (Verschuren et al., 2009). This study concerns a composite, 214-cm long sediment sequence mainly consisting of mini-Kullenberg core CH03-2K collected in 2003, supplemented by a short section of UWITEC hammer-driven piston core CH05-3P-I and gravity core CH05-1G, both collected in 2005. Finely laminated sediments throughout this sequence (mostly varved; Wolff et al., 2011) allowed precise cross-correlation between the overlapping core sections. The chronology of this sediment record was determined by accelerator mass spectroscopy (AMS) 14C dating on 45 samples of bulk organic carbon, combined with 210Pb-dating of gravity core CH99-1G from the same location and corrected for an old-carbon age offset of ~250 years determined by paired AMS 14C dating on grass charcoal (Blaauw et al., 2011). The resulting age model (Buckles et al., 2016) covers the period between 2150 cal yr BP (200 BCE) and the present (2005 CE) with little age uncertainty and tight correspondence with an independent chronology based on varve counting (Wolff et al., 2011). For technical details of the age model we refer to Blaauw et al. (2011) and Buckles et al. (2016).
Pollen analysis
Sixty-four samples of 1 ml volume were extracted for pollen analysis at 4 cm intervals along the core, producing an average temporal resolution of ca 40 years between data points throughout this ~2200-year reconstruction. Pollen preparation was done at the IBED laboratory of the University of Amsterdam following standard procedures (Faegri and Iversen, 1964), including pre-treatment with sodium pyrophosphate, acetolysis and heavy liquid separation with bromoform; we refer to van Geel et al. (2011) for further details. Pollen identification was performed with reference to the photo library of the African Pollen Database (Vincens et al., 2007) and pollen atlases by Bonnefille and Riollet (1980) and Schüler and Hemp (2016). A pollen sum of at least 600 grains was aimed for, with an average of 928 (range 300–1537) and only two samples falling far short (with pollen sums of 300 and 372 at 18 and 158 cm core depth, respectively). The pollen sum defined in this study excludes only the aquatic (Nymphaea, Polygonum) and wetland taxa (Cyperaceae, Typha). In this steep-sided crater lake with rocky shores all-around (Figure 1b), habitat for rooted aquatic macrophytes is virtually lacking. Therefore, pollen of these vegetation elements likely originates from shallow lakes and wetlands located outside of Chala crater but within the larger pollen-source area, such as around Lake Jipe (Figure 1a). Cyperaceae pollen can also originate from fully terrestrial sedges in the savanna grasslands surrounding Chala crater, or strips of riverine forest in the colline and submontane zones of Mt. Kilimanjaro (Hemp, 2006b), but in the specific setting of Lake Chala these pollen sources can be considered to be of lesser importance. Pollen was grouped in different vegetation types with reference to the modern-day plant associations occurring within and outside Chala crater and along the altitudinal gradient on Mt. Kilimanjaro. In particular, following Schüler et al. (in preparation) we define a site-specific vegetation type named ‘Crater vegetation’ which includes all tree, shrub and herb taxa which are common inside the crater and likely provide a large part of the pollen supply to Lake Chala sediments (See Supplementary Information for a full list of identified taxa and their assigned biome).
Pollen indicators of human activity
Since pollen grains of cultivated grasses (‘cereals’) are quite rare, at each depth interval (64 in total) additional counting of Poaceae pollen grains was done to determine with greater certainty the presence and frequency of cereal grains. Following Colombaroli et al. (2018), Poaceae pollen grains were divided in three categories: wild type (grains <60 µm), cereals (grains 60–85 µm) and maize (grains >85 µm). Using the ratios between these categories, pollen counts for cereals and maize were then recalculated with reference to the Poaceae count in the initial pollen sum. Significant size overlap between East African wild-type and cereal grasses (Hamilton, 1972) precluded our use of the traditional size boundary of >40–45 µm to discriminate cereals from wild-type grasses (e.g., Beug, 2004; Joly et al., 2007). Our size boundary for ‘large’ grass pollen is more conservative, to minimize the number of wild-type grass pollen included in our cereal category. To further strengthen our inference of cereal grains being present, we calculated the fraction of Poaceae 60–85 µm (maize is excluded from this tally because it is easily recognized based on size) relative to the total Poaceae percent abundance in the pollen sum, and compared this with the record-wide mean value (van der Plas et al., 2019). Sampling intervals with a fraction of Poaceae 60–85 µm significantly above that mean value were interpreted as more likely containing true cereal pollen. Conversely, samples with a fraction of Poaceae 60–85 µm near the mean value were interpreted as containing only wild-type grass pollen (including some large ones), although the presence of cereals in such samples cannot be excluded with certainty. Given that these results are based on measuring 1000 Poaceae grains per sampling interval, this data can be considered to represent a conservative technique for inferring the presence of cereal farming within the pollen-source area during the corresponding time interval, as far as this can feasibly be achieved through pollen analysis. This approach implies that percent-abundance values for the ‘Cultivar’ vegetation component cited in text and figures must be considered maximum values, since they unavoidably include a sizable fraction of large wild-type grass pollen. Moreover, previous studies of African cereal pollen (Bonnefille and Riollet, 1980; Hamilton, 1972) have indicated that pollen grains from finger millet cannot be distinguished from wild-type grasses based on size alone. Therefore, our Poaceae 60–85 µm category likely includes only sorghum (Sorghum bicolor), at least in the portion of our pollen record representing pre-colonial time (i.e., pre-1880 CE).
Statistical analysis of the pollen assemblages
Constrained incremental sum-of-squares cluster analysis (CONISS; Grimm, 1987) was used to determine the stratigraphic boundaries between successive pollen zones, using only taxa comprised in the terrestrial pollen sum. Changes in percent pollen abundance through time were plotted using TILIA 2.0.41 (Grimm, 2015). To extract underlying changes in pollen assemblage, indirect gradient analysis was performed. Since the overall variability of our data fit a linear rather than a unimodal model, principal component analysis (PCA) was preferred over detrended correspondence analysis (DCA; DCA axis 1 <1.5 SD; Ter Braak and Prentice, 1988). Percentage data were log transformed to handle extreme outliers. All gradient analyses were performed using Canoco 5 (Ter Braak, 1988).
Macrocharcoal data and origin
Data on the influx of macrocharcoal particles (here, >180 µm) to the centrally located coring site in Lake Chala were obtained from Nelson et al. (2012). Consisting almost exclusively of charred grass cuticle, these particles likely derive from biomass burning within a radius of 0–5 km from the lakeshore (Duffin et al., 2008; Peters and Higuera, 2007), although macrocharcoal particles have been observed to travel still greater distances (e.g., Adolf et al., 2018; Tinner et al., 2006). The recurrence frequency of savanna fires in eastern equatorial Africa commonly ranges from 5 to 10 years (Archibald et al., 2010), but higher burning frequencies can occur (Hempson et al., 2018). Contiguously sampled at 1-cm increments (representing on average 11 years of deposition) this macrocharcoal record does not reflect individual fire events, but rather inter-annual to decade-scale variation in fire prevalence. Fire prevalence is driven by fuel availability, moisture, vegetation type and frequency of ignition (Whitlock and Larsen, 2002; Whitlock et al., 2010). Considering the regional distribution of vegetation types (Figure 1a), the Chala macrocharcoal influx record is mainly a proxy for changes in the frequency of savanna fires in the vicinity of the lake.
Results
Zonation and description of pollen spectra
Stratigraphically-constrained clustering (CONISS) of pollen assemblages recovered from the 64 depth intervals analysed allowed discrimination of four pollen zones in the 2200-year long pollen record of Lake Chala, three of which can each be divided in two subzones (Table 1; Figure 2). Below we describe the pollen spectra characterizing each zone and subzone, highlighting the most important temporal patterns in the abundance of pertinent taxa.
Timing of key transitions in the Chala pollen stratigraphy.
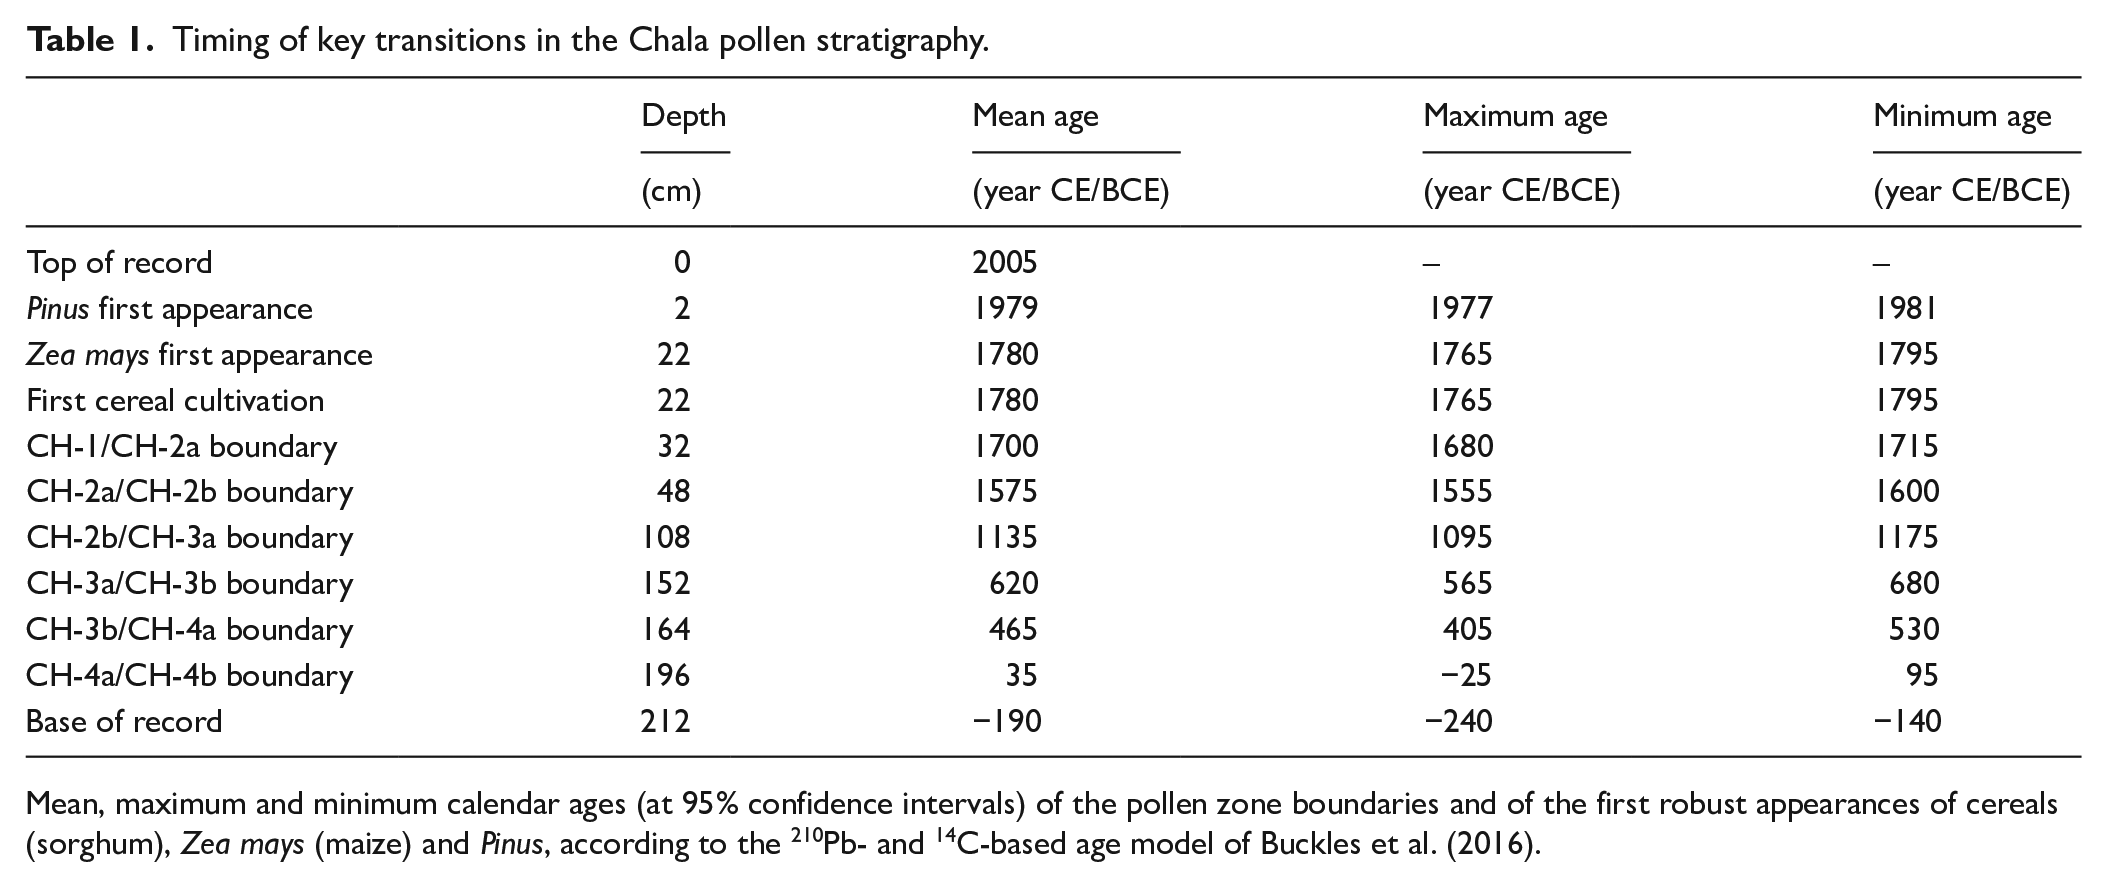
Mean, maximum and minimum calendar ages (at 95% confidence intervals) of the pollen zone boundaries and of the first robust appearances of cereals (sorghum), Zea mays (maize) and Pinus, according to the 210Pb- and 14C-based age model of Buckles et al. (2016).
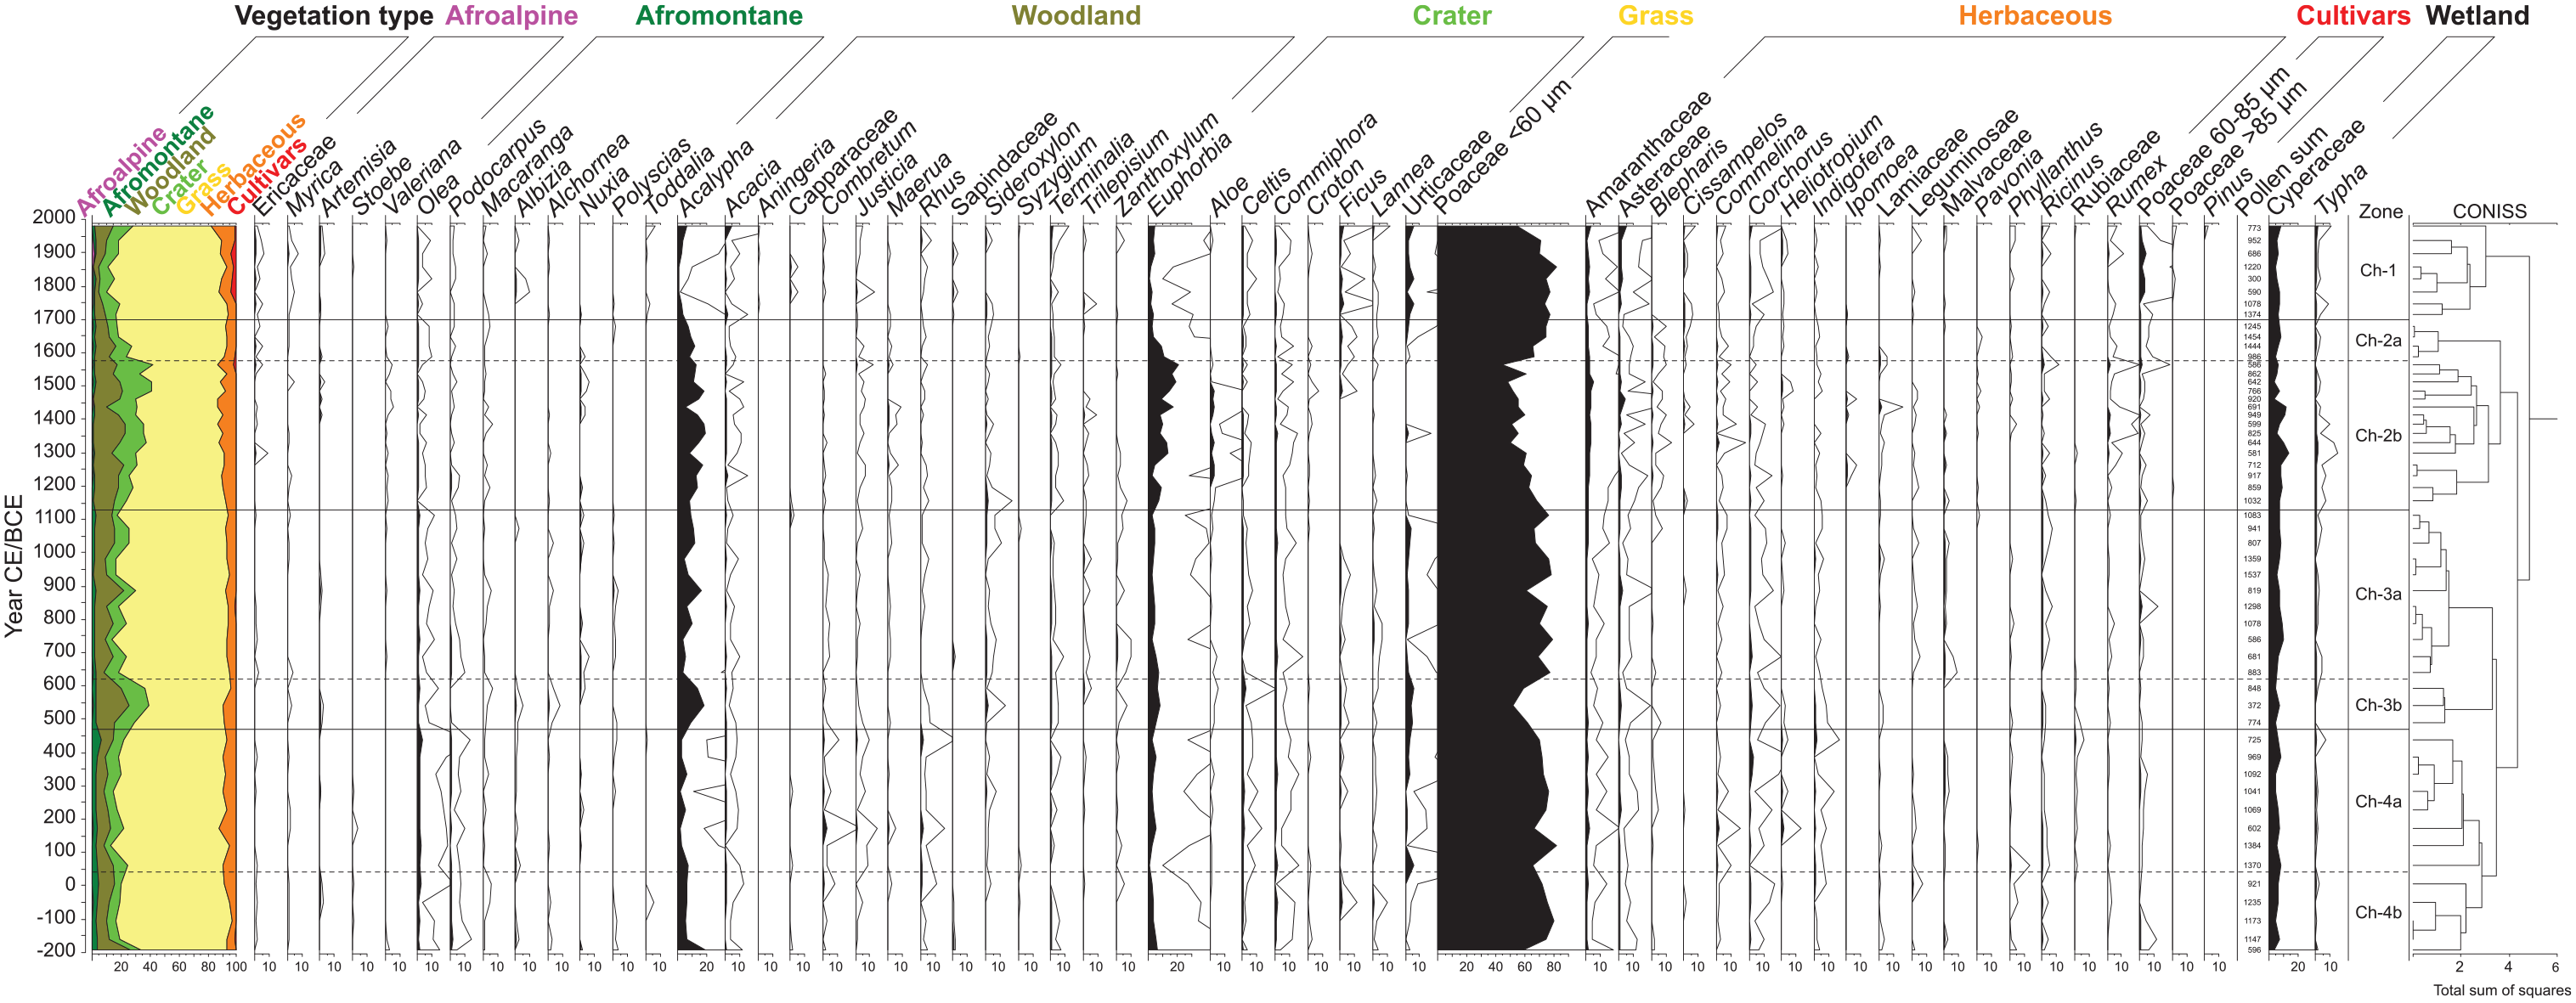
Pollen stratigraphy of Lake Chala. Stratigraphic distribution of selected pollen taxa (taxa >1% of the terrestrial pollen sum, excluding taxa found in only one interval) in relation to sediment age (Buckles et al., 2016) and pollen-based stratigraphic zonation (CONISS; Grimm, 1987). Taxon abundance is presented as percentage of the terrestrial pollen sum (black curves; 10 × exaggeration in white), with taxa grouped per vegetation type and summary diagram on the left.
Zone CH-4 (13 samples, 214–166 cm core depth, ca 190 BCE–470 CE)
CONISS recognizes two subzones –CH-4a and CH-4b– with the transition (at 196 cm, dated to ca 50 CE) mainly due to elevated percentages of Acalypha in CH-4b and of a number of other woodland taxa (Cordia, Maerua, Sideroxylon, Trilepisium, Zanthoxylum) in CH-4a. The Poaceae (grass) fraction is high throughout zone CH-4 (range 60%–82%, mean 73%) with lowest values at the base of the sequence. Ericaceous (0%–0.5%, mean 0.3%) and Afromontane (2%–6%, mean 3%) components are limited. Mt. Kilimanjaro’s subalpine zone is represented by sporadic occurrences of Ericaceae, Artemisia and Stoebe; and the most prominent Afromontane forest taxa are Olea and Podocarpus. The variable, but generally more prominent component of woodland trees and shrubs (5%–22%, mean 9%) is dominated by Acalypha, Combretum, Rhus and Justicia with Acacia, Sideroxylon and Terminalia all contributing. In comparison, the contribution of woody plants growing inside the crater is relatively modest (4%–11%, mean 7%), and consists mainly of Euphorbia, with Celtis and Commiphora as other important taxa. The herbaceous fraction (3%–12%, mean 7%) represents the herbs growing in open vegetation both inside and outside the crater, and mainly consists of Amaranthaceae, Asteraceae, Commelina, Corchorus, Indigofera and Ricinus. Fairly substantial amounts of Poaceae 60–85 µm (1% of the pollen sum) are found at the very base of the sequence, declining shortly above it but almost continuously present throughout zone CH-4.
Zone CH-3 (14 samples, 162–110 cm core depth, ca 470–1130 CE)
CONISS again suggests recognition of two subzones, with the transition at 152 cm core depth dated to ca 1130 CE, mainly on account of the substantial peak in Acalypha concurrent with a decrease of Poaceae and Olea. The most notable trend in CH-3b is the strong reduction in Poaceae to a minimum of 52% dated to ca 540 CE (range 52%–62%, mean 58%). However, in CH-3a it increases again to values similar to zone CH-4 (61%–79%, mean 73%). The Afromontane component is strongly reduced (1%–3%, mean 2%), due to the absence of Podocarpus and decrease of Olea in CH-3b. In the woodland component (5%–23%, mean 13%) we see a substantial peak in Acalypha in CH-3b, after which its percentage returns to previous levels with a slight increase towards the top of CH-3a. Rhus, Combretum and Justicia decline throughout the zone, while Sideroxylon and Zanthoxylum increase. Taxa of crater vegetation (4%–17%, mean 9%) show relatively stable percentages, with a small increase of Aloe in CH-3b, followed by a decrease in Celtis at the CH-3b/CH-3a boundary (ca 640 CE). The herbaceous component (4%–9%, mean 6%) is relatively stable compared to CH-4, as are the cultivars (0%–1.2%, mean 0.2%).
Zone CH-2 (19 samples, 106–34 cm core depth, ca 1130–1700 CE)
Two subzones are suggested, with the transition at 48 cm core depth dated to ca 1575 CE. The Poaceae fraction declines gradually from the base to the top of CH-2b (45%–68%, mean 57%). The ericaceous component increases to a mean level well above that in CH-4 (0%–1%, mean 0.5%) with pollen of Ericaceae increasing half-way up CH-2b and continuously present in CH-2a. The Afromontane component, in contrast, continues to decline compared to zones CH-4 and CH-3 albeit slightly (0.3%–1.7%, mean 1.0%). The woodland fraction increases slightly in CH-2b (to 9%–22%, mean 17%) mainly on account of Acalypha. There is a concurrent increase of crater vegetation taxa in CH-2b (7%–25%, mean 15%), mostly due to Euphorbia and Aloe. The ensuing decline in both Euphorbia and Aloe, as well as Acalypha, starting ca 1575 CE contributes to the recognition of subzones CH-2a and CH-2b. This transition to CH-2a is further characterized by a strong recovery of Poaceae to the values of ca 70% that are common in zones CH-4 and CH-3a. Ficus and the Urticaceae are largely absent from CH-2b but return just before the transition to CH-2a. Substantial changes also occur in the herbaceous fraction (6%–14%, mean 9%), and these partly drive the zonation within this zone. Amaranthaceae increases in CH-2b, as do Blepharis and Rumex. The cultivar component increases in CH-2a (0.5%–0.9%, mean 0.7%), due to sustained higher percentages of Poaceae 60–85 µm. A single Poaceae grain >85 µm was found in the lower part of this zone, but is disregarded as maize because this interval is dated to well before the documented introduction of maize in East Africa (McCann, 2005).
Zone CH-1 (eight samples, 30–2 cm core depth, ca 1700–2005 CE)
For the first ca 200 years covered by this pollen zone, the grass fraction retains percentages as high as at the top of CH-2a (54%–82%, mean 72%). Total influx from the ericaceous component increases to 0.3% to 1.6% (mean 0.8%), with Myrica increasing and Ericaceae continuing at the same level as in the previous zone. The Afromontane component remains largely the same (0.8%–2%, mean 1.2%) with rare taxa Albizia and Toddalia appearing while Nuxia disappears. In the woodland component (3%–13%, mean 6%) some rare taxa return as well after a long absence, or appear for the first time such as Aningeria and Capparaceae. Acalypha declines to its lowest recorded level, before a slight recovery towards the youngest interval. Both Acacia and Terminalia increase in the youngest interval, which dates to the last decade before 2005. Within the crater vegetation component (6%–14%, mean 9%), Euphorbia further decreases to a record-wide minimum in a section dated to the 19th century, and hardly recovers later on, while Urticaceae continue the increase started in CH-2a. Within the herbaceous fraction (5%–16%, mean 8%) Amaranthaceae, Asteraceae and Corchorus remain stable, whereas Blepharis disappears. The cultivar component (0.3%–4.2%, mean 2.7%) includes increasing numbers of Poaceae grains 60–85 µm. Poaceae grains >85 µm appear at the base of CH-1 and become continuously present. Low numbers of Pinus pollen are found at the top of this zone, in sediments dated to 1979 CE.
Trends in vegetation associations through time
PCA ordination biplots show the first two dimensions of the relative positions of the 47 most diagnostic or relevant pollen taxa in multivariate space (Figure 3a), as well as comprehensive changes in the terrestrial vegetation surrounding Lake Chala over time (Figure 3b). Together, these two dimensions account for 37% of the total observed variation in pollen assemblages. Cultivated taxa Poaceae 60–85 µm and Poaceae >85 µm, which evidently increase their prominence towards the top of the record, are situated in the upper-right quadrant of the ordination. Of these, Poaceae 60–85 µm stands out by its high PCA2 score. Poaceae >85 µm clusters together with a diverse group of taxa including Ericaceae and Myrica from the Afroalpine component, the Afromontane tree Albizia, the crater forest tree Ficus, the woodland taxa Aningeria, Acacia and Capparaceae; and herbaceous Asteraceae. Pollen taxa mostly reaching their highest percent abundances in the lower, older part of the record cluster together in the lower-right quadrant, i.e. on the positive side of PCA1 and the negative side of PCA2. Among these, Poaceae plot closely to the Urticaceae, and at some distance from all other taxa. The Afromontane tree Podocarpus, the crater forest tree Celtis, the woodland tree Syzygium, and the herbs Corchorus, Phyllanthus and Rubiaceae cluster nearby, all with modestly negative PCA2 scores. Further down the negative side of PCA2 we find the Afromontane taxa Olea and Alchornea; the woodland taxa Combretum, Rhus, Sideroxylon and Xanthoxylum; and herbaceous Indigofera, Abutilon and other undifferentiated Malvaceae. Acalypha is plotted by itself at markedly negative values for both axes (lower-left quadrant), suggesting a strongly individualistic response to environmental change. Crater vegetation taxa, such as Euphorbia, Aloe and Croton are associated with woodland trees Maerua and Terminalia as well as the herbs Blepharis, Lamiaceae and Commelina, Afromontane tree Nuxia and with the subalpine, herbaceous Valeriana, in a cluster in the upper-left quadrant with negative PCA1 and modestly positive PCA2 scores. The herbs Amaranthaceae and Rumex have more strongly positive PCA2 scores.
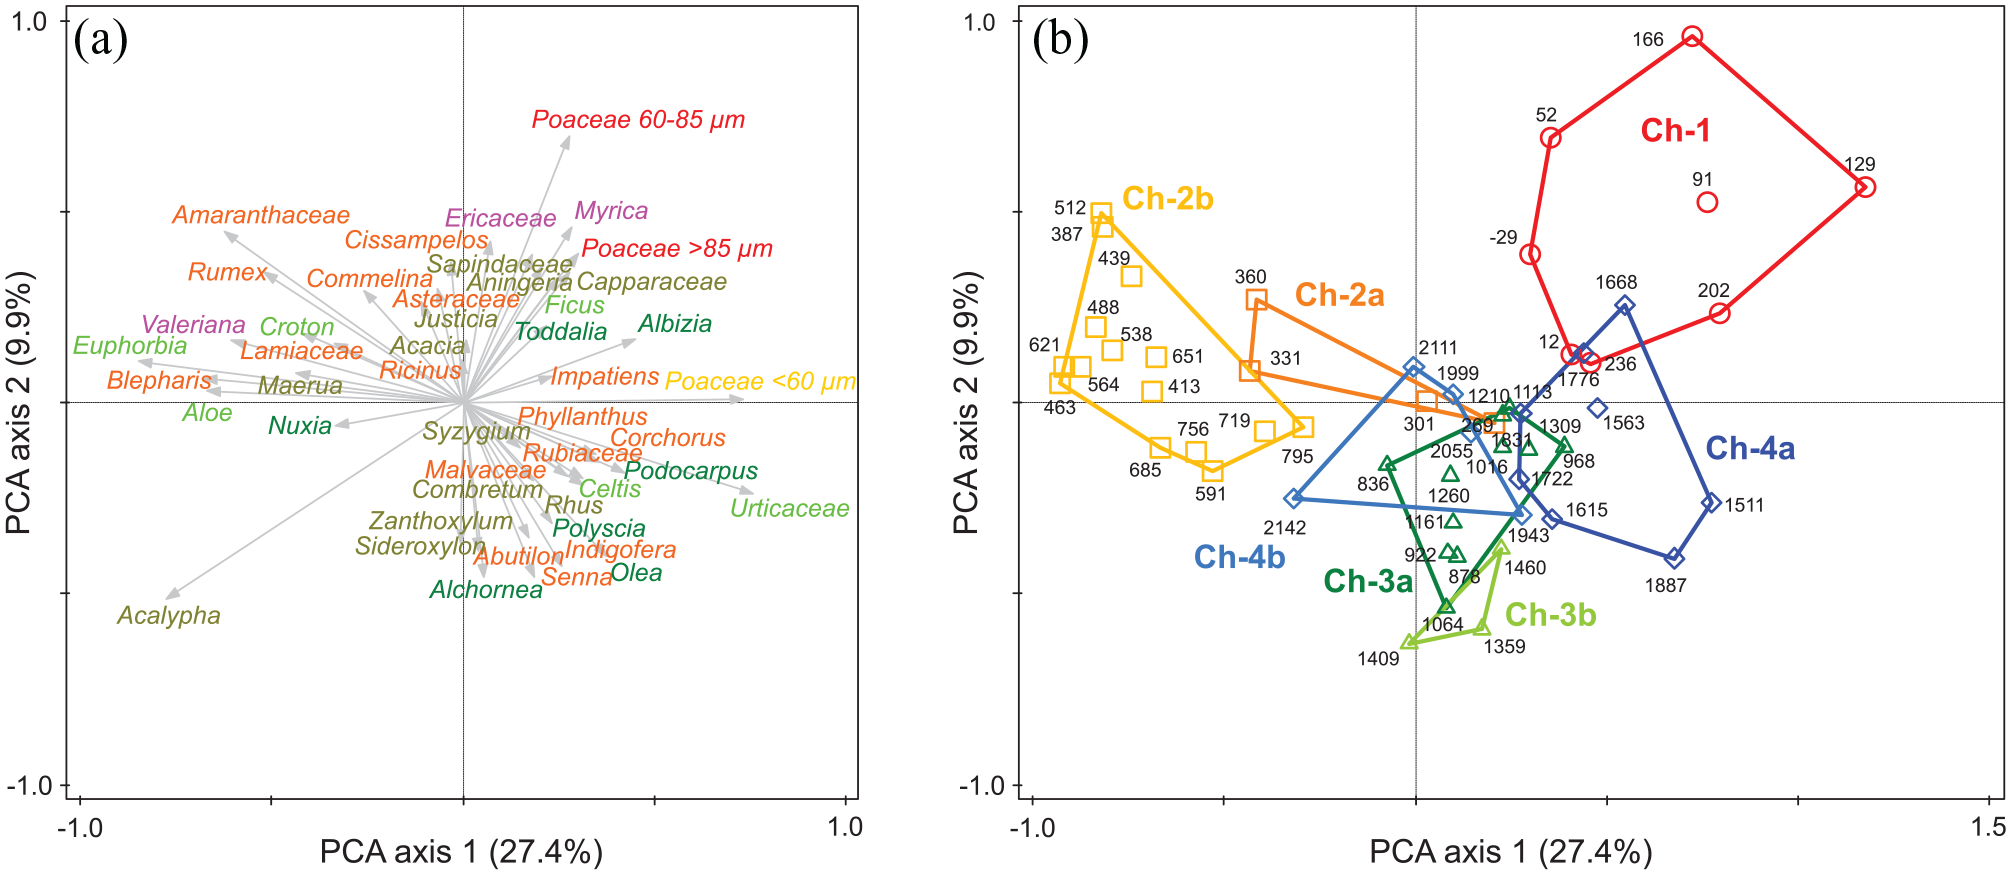
Principal Component Analysis (PCA) of the temporal distribution of pollen taxa and assemblages: (a) Species plot with colour coding according to vegetation type, as in Figure 2. (b) Pollen-assemblage plot with sample intervals labelled by age (year CE/BCE), and grouped per pollen zone using coloured polygons.
Overall, variation along the PCA1 axis appears to trace the expansion or reduction of dry forest, both inside the crater and on the outer crater slopes, relative to the ‘Obstgartensteppe’ woodland on top of the crater rim and in the open grassy habitat of the surrounding savanna. Axis PCA2 tracks the human influence on the landscape, with the three cultivar taxa Poaceae 60–85 µm and Poaceae >85 µm as major elements. Many ruderal plants that are associated with the Chagga homegardens and other disturbed or fallow land (Amaranthaceae, Asteraceae, Capparaceae, Commelina, Rumex) also have high scores along PCA2 albeit with more widely varying PCA1 scores. Accordingly, the temporal evolution of pollen assemblages (Figure 3b) starts out in the second PCA quadrant, with relatively modest shifts between more wooded (subzones CH-4b, CH-3b and CH-3a) and more open grassy vegetation (CH-4a). After ca 1130 CE, the assemblage shifts first towards the fourth quadrant (CH-2b), and then towards the first quadrant from ca 1575 CE onwards (CH-2a). After ca 1700 CE, all pollen spectra fall squarely within the first quadrant (CH-1).
Reference frame of hydroclimatic variability and fire regimes
Overall positive correlation (r = 0.39, p < 0.001, n = 208) between charcoal influx (Nelson et al., 2012) and variability in local rainfall as inferred from the branched and isoprenoid tetraether (BIT) index of Lake Chala sediments (Buckles et al., 2016; see also van Bree, 2019) over the past ~2200 years (Figure 4) suggests that grasslands in the Chala region are subject to a fuel-limited regime of biomass burning. This means that fire is an inherent aspect of the region’s vegetation dynamics but that scarce biomass build-up during episodes with drier climatic conditions hampers fire propagation (Nelson et al., 2012). The most prominent peak in charcoal influx (17.6 m−2 yr−1) occurs around 550 CE during a temporary downturn in reconstructed rainfall interrupting a longer-term trend towards wetter conditions. Notably, this charcoal peak coincides with a strong increase in Acalypha, and to a lesser extent of Euphorbia and Asteraceae. Higher and more variable charcoal influx values between 650 and 950 CE broadly coincide with higher inferred precipitation. Poaceae abundance is high during this period of drier conditions, implying more extensive grass cover and/or greater above-ground biomass producing more fuel. The drier period that followed, lasting from 1150 to 1550 CE, coincides with reduced influx and variability of charcoal, and lower Poaceae abundances. The ensuing wetter conditions from 1550 to 1700 CE see a return to higher charcoal influx, albeit with an apparent delay in time, and strong increase in Poaceae abundance in step with the charcoal influx. Finally, the prominent negative BIT excursion dated to 1780–1820 CE (Buckles et al., 2016), which represents a known period of extreme regional aridity (Bessems et al., 2008; Nash et al., 2016), again coincides with a minimum in charcoal influx. However, Poaceae percent abundance, and thus inferred grass cover, remained high during this period.
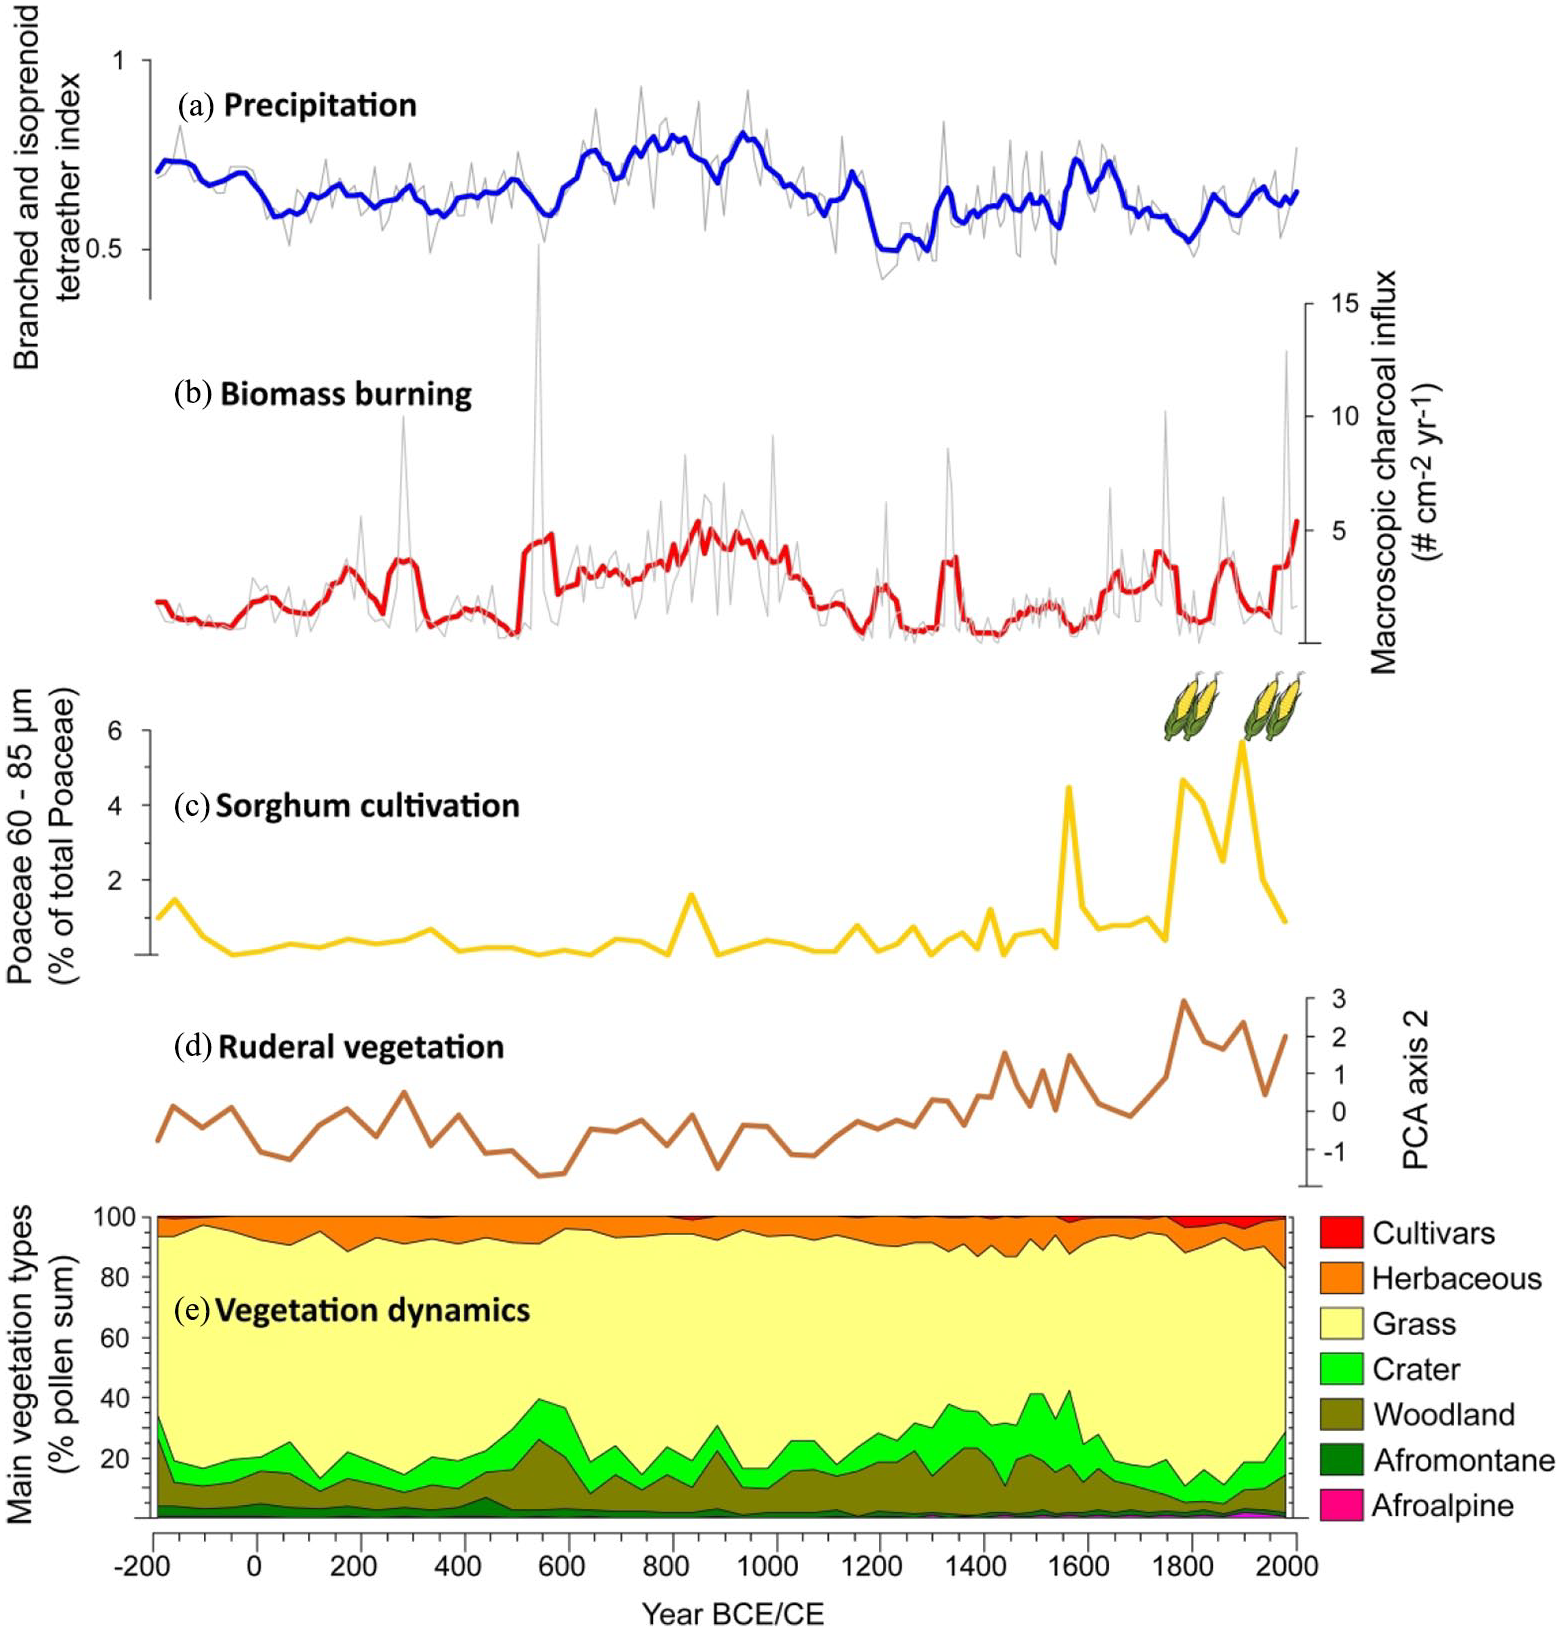
Synthesis of proxy data from the 2200-year Chala sediment record: (a) Temporal variation in regional precipitation based on the branched and isoprenoid tetraether (BIT) index of bacterial lipids, with thin grey line representing the raw data and thick blue line a 5-pt average (Buckles et al., 2016). (b) Variation in biomass burning based on the influx of charcoal >180 μm, with thin grey line representing the raw data and thick red line a 5-pt average (Nelson et al., 2012). (c) Occurrence of sorghum cultivation based on the percentage of Poaceae pollen grains 60-85 μm, with the presence of maize (Poaceae pollen > 85 μm) indicated qualitatively as pictograms. (d) Relative abundance of ruderal plant taxa as represented by the PCA2 score of the pollen assemblages. (e) summary diagram of temporal variation in the regional composition of terrestrial vegetation, as in Figure 2.
Discussion
Long-term vegetation dynamics: Local crater vegetation
Expansion of forest inside the crater occurred mostly during drier periods (Figure 4) and was mainly driven by Euphorbia, a prominent element in the dry forest covering the middle and upper inner crater walls (Figure 1c), with the equally drought-adapted succulent Aloe also playing an important role. A first, rather brief and modest expansion occurred around 550 CE, and a second longer period of expansion started around 1170 CE during a shift towards very dry conditions. This expanded forest persisted under the modestly wetter conditions after 1300 CE, but was strongly reduced in the period 1575–1700 CE when peak BIT-index values infer a very wet climate. As this partly succulent dry crater forest is well-adapted to drought, it coped better than more moisture-dependent plant communities such as the savanna grasslands outside the crater, and thus contributed a larger share to the total pollen influx. In contrast, the currently common lakeshore forest tree Ficus was largely absent from 1050 to 1500 CE (Figure 2), largely coeval with the driest recorded period (1170–1300 CE; Figure 4). The largely simultaneous absence of Urticaceae, which today are locally well represented by the understory tree Obetia radula (A. Hemp, personal observation) suggests that the canopies of both the moist lakeshore forest and dry forest above it were more open at this time, and thus that the apparent expansion of the latter was at least partly due to reduced pollen influx from all other vegetation types. From 1700 CE onwards the Urticaceae again increased in abundance together with the lakeshore forest trees Celtis and Ficus (Figure 2), suggesting that both the moist lake-side forest and the dry crater-wall forest developed more closed canopies at this time.
Long-term vegetation dynamics: Extra-local and regional vegetation
Because the vegetation growing within Chala crater is species-rich, with many pollen taxa representing plant species occurring both locally and in the wider region, separating the responses of local and regional vegetation to climatic drivers is challenging, as has also been noted at other East African sites (Githumbi et al., 2018; Schüler et al., 2012, 2014). Here, Acalypha is one of the more responsive taxa in the pollen diagram: it occupies a special position in the PCA species plot (Figure 3a) and its temporal trends contribute significantly to the pollen zonation (Figure 2). Its occurrence both in the colline forest and woodland on the outer crater slopes (De Wispelaere et al., 2017) as in the dry forest inside the crater (A. Hemp, personal observation) renders interpretation of its temporal dynamics in the pollen record anything but straightforward. The fact that the temporal trends in Acalypha broadly follow those of Euphorbia would seem to indicate that a substantial part of Acalypha pollen in our record originated from inner crater forest, and yet in the PCA Acalypha does not group together with Euphorbia or other crater forest taxa (Figure 3a). Considering that woody plants in the savanna woodland surrounding Chala crater likely respond to climate change in similar fashion as the dry crater forest, the majority of Acalypha pollen may well originate outside of the crater. With most savanna woodland in the region now converted to cropland (Figure 1) it is highly plausible that Acalypha was much more widespread in the past. Based on these arguments, Acalypha is here included in the woodland component of the pollen assemblage. As a consequence, major changes in the woodland component through time are driven by Acalypha, which experienced three distinct phases of expansion in the last 2200 years: briefly around 190 BCE and 500–600 CE, and longer in the period 1200–1560 CE concurrent with the apparent expansion of dry crater forest (Figure 2). The only other significant shift within the woodland component occurred around 550 CE when Rhus, Combretum and Justicia declined while Sideroxylon, Zanthoxylum and Trilepisium, three elements of relatively moist woodland and riverine forest, increased (Figure 2). The short-lived episode of peak biomass burning (perhaps an exceptionally strong fire event in the near vicinity of Chala crater) documented around this time (Figure 4) may have played a role in this apparent reorganization of the plant community representing wooded savanna in the Chala area. Indeed, these taxa remain important woodland elements throughout the ensuing wetter period and even under drier conditions until ca 1200 CE.
Afromontane forest elements together represent only ca 4% of the terrestrial pollen influx to Lake Chala, indicating that higher-elevation vegetation on Mt. Kilimanjaro, starting ca 10 km from the lake (Figure 1), is largely located outside of the pollen source area. The greatest dynamic shift recorded in the Afromontane component occurs around ca 500 CE, when Podocarpus and Olea, important elements of respectively upper montane and submontane forest, declined to the short-lived benefit of Macaranga, Alchornea and, a little later, Nuxia, all elements of lower/middle montane Ocotea forest. Especially Macaranga is known to thrive in disturbed forest settings (Whitmore, 2008), but considering its short-lived nature we refrain from attributing it to human activity. Pinpointing a natural cause for this event is also difficult because its timing with climate variability is off: it happened well before the above-mentioned peak fire event as well as a shift to higher BIT values around ca 650 CE (Figure 4). In the subalpine zone of Mt. Kilimanjaro, increased burning prevents regeneration of Podocarpus forest and promotes the establishment of Erica woodland (Hemp, 2005). However, if such increased burning did occur, the wind-blown charcoal it would have generated is not expected to have been registered at Lake Chala ca 30 km away, particularly as the dominant wind direction in the region is mainly from the east (north-easterly in January, south-easterly in August: Meyer et al., 2020). Ericaceous vegetation increased substantially much later than the Podocarpus decline, starting around ca 1300 CE with a notable increase in Ericaceae and followed by increases of Artemisia and Myrica from ca 1400 CE and 1700 CE respectively, seemingly indicating further increase of Afroalpine vegetation on Mt. Kilimanjaro. Despite the overall low pollen abundances of all taxa involved, Ericaceae did become more abundant after the Podocarpus decline, lending some support to the hypothesis of mutual exclusion (Hemp and Beck, 2001) and indicating that the lowering of the upper forest boundary (previously at 4000 m asl, currently at 3200 m asl; Hemp and Beck, 2001) which started about 900 years ago (based on our Ericaceae percent abundance) stabilized by ca 1550 CE. The palaeoecological study higher up on Mt. Kilimanjaro by Schüler et al. (2012) shows comparable increases in ericaceous vegetation broadly around the same time.
History of human activity
It is generally difficult to trace the history of crop cultivation in tropical African palaeo-contexts because most African cultivated plant taxa either produce little to no pollen (e.g., banana, beans, coffee: Free, 1993; Simmonds, 1953) or have pollen that is difficult to distinguish from wild-type pollen of the same family (e.g., sunflower: Beug, 2004). However, in this particular region of East Africa we can trace the historical development of the Chagga homegardens and irrigated fields through the pollen grains of ruderal plant taxa benefiting from the vegetation disturbance caused by crop cultivation. Major herbaceous pollen taxa recovered in the Lake Chala record (Amaranthaceae, Asteraceae, Malvaceae, Commelina, Impatiens, Phyllanthus and Ricinus) all include ruderal species documented to occur in the Chagga homegardens (Hemp, 2006c). In addition, the partial tree canopy characteristic of Mt. Kilimanjaro homegardens is formed by remnants of the original submontane Croton-Calodendrum forest, including Albizia schimperiana, Cordia africana and the liana Toddalia asiatica, today supplemented by cultivated Cupressus lusitanica and Syzygium cumini. Although many of the indigenous taxa are not exclusive to the cultural landscape, changes in their abundance through time may nevertheless be indicative of the historically expanding vegetation alteration by human activity on Mt. Kilimanjaro. Thus, variation in pollen-assemblage composition along PCA2 (Figure 3b), which involves several of the above-mentioned ruderal taxa (Figure 3a), is interpreted to reflect the intensity of human influence on regional vegetation, which becomes increasingly important from ca 1100 CE onwards.
There are also known or presumed ruderal taxa that do not fit this general pattern. The Malvaceae, for example, align more with vegetation composition during the earlier part of the record (i.e., 200 BCE to 1100 CE) and Phyllanthus and Ricinus have almost completely neutral PCA scores (Figure 3a). However, these taxa occur in a broader context than cultural landscapes alone. The Malvaceae include many herb species found in dry savannah or in submontane and riverine forests, vegetation types which are now regionally scarce in their natural condition. Phyllanthus is an important understory herb in open submontane forest and adjacent wooded grasslands, and hence not solely indicative of anthropogenic disturbance. Syzygium pollen can represent several species among which S. cumini is cultivated in the homegardens, but others such as S. guineense grow in submontane and riverine forest, as well as in lower and middle montane forest higher up the mountain. Given the overall rarity of its pollen in our record, we refrain from inferring conclusions about the most probable source area. Albizia, today mostly associated with the homegarden tree canopy, are remnants of the original submontane forest (Hemp, 2006c). In the Chala record, Albizia is more or less continuously present until 600 CE, and then falls absent until its reappearance in the late 18th century CE. This pattern may signify an initial natural decline associated with the broader climate-driven changes in vegetation around this time, followed by an increase facilitated by trees being ‘conserved’ in the homegardens. Finally, the recovered Euphorbia pollen most likely derives from the crater forest species (E. bussei, E. quinquecostata, E. tirucalli) rather than from E. heterophylla, which occurs as ruderal trees in the homegardens.
Overall, our evidence suggests that human modification of the landscape surrounding Lake Chala, at a scale sufficient to create detectable changes in its pollen assemblages, started around 1100 CE through permanent settlements in mid-elevation areas of Mt. Kilimanjaro formerly occupied by submontane forest. Using the PCA2 scores as proxy for this human activity, its intensity and/or areal distribution appears to have shifted to higher level a first time between ca 1420 and 1570 CE; and after a possible downturn in the 17th century CE, a second time in the 18th century CE to reach its maximum by ca 1780 CE (Figure 4), that is about 240 years ago.
The only direct evidence of plant cultivation in the Chala record are pollen from the exotic timber tree Pinus and the two classes of large Poaceae pollen grains (60–85 µm and >85 µm). Pinus is first encountered in sediments dated to ca 1979 CE and likely originated from timber plantations located on the northern slope of Mt. Kilimanjaro (Hemp, 2006b). Poaceae pollen in the 60–85 µm size category are present without interruption throughout our ~2200-year record. Percent abundance is low and relatively stable throughout, except during a sustained increase from ca 1550 to 1780 CE and an even larger increase from ca 1780 CE to the present. Probability analysis allows partial attribution of these Poaceae 60–85 µm grains to cereals. As the overall scarcity of large Poaceae grains creates a fair amount of stochasticity, percent abundances of the 60–85 µm fraction show a weak positive, but not statistically significant, correlation with the corresponding percent abundance of all Poaceae pollen in the pollen sum (r = 0.15, p = 0.28, n = 54; Figure 5). Because the latter is proportional to the number of grass pollen grains encountered while achieving that pollen sum, this indicates that the large majority of Poaceae 60–85 µm grains are large wild-type grains (van der Plas et al., 2019). Looking at selected intervals, only samples from after ca 1780 CE contain a fraction of 60–85 µm grains situated well above the regression line (Figure 5), as well as a single interval centred on 1560 CE. Only in the case of the period from ca 1780 to present, the mean value of its Poaceae 60–85 µm fraction is also significantly positioned above the corresponding regression value (p = 0.03). Elevated fractional abundances of Poaceae 60–85 µm at ca 160 BCE, 840 CE and 1590–1715 CE are less remarkable because they coincide with (very) high total Poaceae percentages and thus more likely derive from wild-type grasses. Therefore, evidence for ancient cereal cultivation –likely of sorghum– within the Lake Chala pollen-source area is only robust for the period since ca 1780 CE (Figure 2) (95% age-model confidence interval 1765–1795 CE, Table 1). Notably, within sampling resolution of our study this ~250-year period corresponds exactly with the period since when human activity in the submontane forest area has reached its maximum, near-modern level (Figure 4).
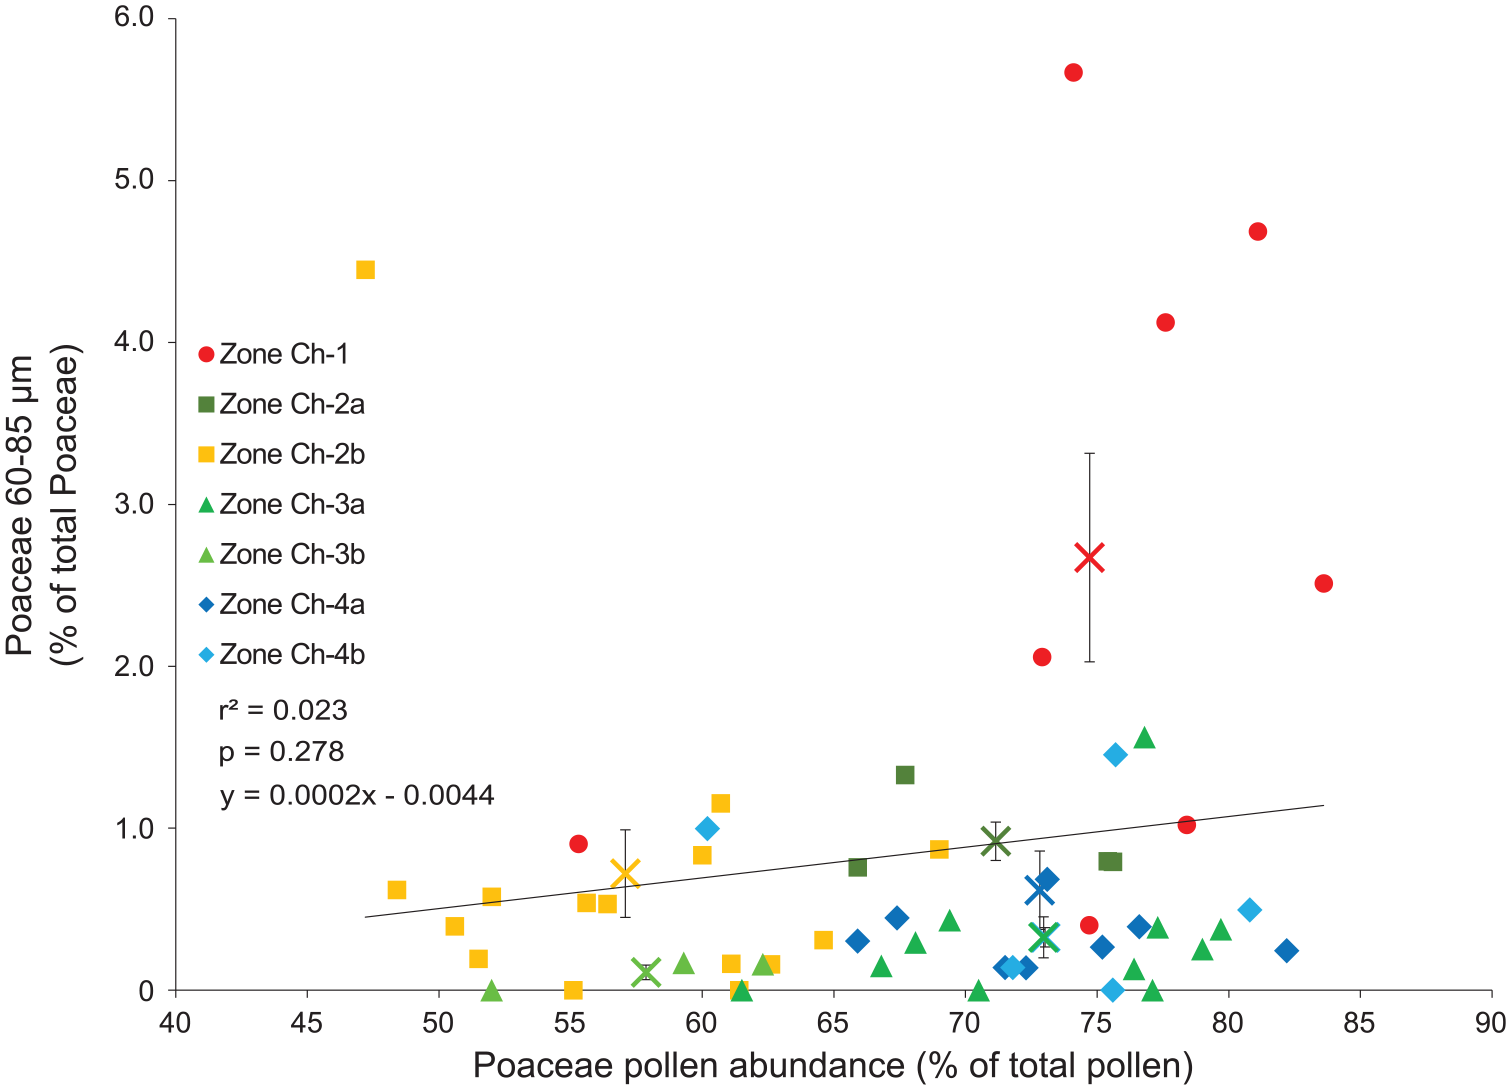
Discrimination of cereal grains from wild-type grass pollen. Fraction of Poaceae pollen grains in the size range 60-85 μm versus the total percent abundance of Poaceae pollen in each sampling interval (n = 64), color-coded per pollen zone as in Figure 3b. Also shown are the linear regression for all samples (black line), and the average values (±SE) of each pollen zone (coloured crosses).
Very large Poaceae grains (>85 µm) attributable with certainty to maize appear in the late 18th century, with two grains recovered from a depth interval dated to ca. 1780 CE (Figure 2) (95% age-model confidence interval 1765–1795 CE, Table 1). Maize was first introduced to East Africa in the 16th century by Portuguese settlers and grown mainly along the so-called Swahili coast (McCann, 2005). When in the early 19th century the East African ivory trade opened up and large trade caravans started to move into the continental interior, maize cultivation moved with them as food staple for the caravans’ porters (e.g., Farler, 1882; Miracle, 1965; Rockel, 1997; Sheriff, 1987). According to historical evidence, maize was introduced to the Mt. Kilimanjaro region at that time, as one major trade route passed through the location of present-day Taveta (Rockel, 1997; Sheriff, 1987; Wimmelbücker, 2002). The first certified appearance of maize in the Chala pollen record actually pre-dates this historical information by half-a-century. In a pollen record from the South Pare mountains ca 110 km to the south of Chala maize first appears in sediments dating to ca 1740 CE (Finch et al., 2017); and in a pollen record from Amboseli to the north of Mt. Kilimanjaro it is found from around ca 1840 CE (Githumbi et al., 2018). However, the much larger age uncertainty on the pollen-inferred timing of maize appearance in those two records (95% confidence intervals are on the order of 150–200 years) than is the case for the Chala record (30 years) precludes attaching much significance to the temporal sequence of those dates. Based on our well-constrained data, it appears probable that cultivation of maize was happening in certain regions away from the Indian Ocean coast already during the late 18th century.
A palaeoecological perspective on the history of human settlement on Mt. Kilimanjaro
The available archaeological data from Mt. Kilimanjaro are too limited to establish continuous or recurrent occupation by any one group of people; and assumptions on the subsistence strategies of these communities based on those of people known from similar archaeological artefacts elsewhere is to be avoided (Stump and Tagseth, 2009). Therefore, the archaeological evidence remains largely moot on the pre-19th century history of human settlement on Mt. Kilimanjaro. Other sources provide indirect information on the length of that history. Based on genetic variation among banana cultivars, the cultivation of banana on Mt. Kilimanjaro has been estimated to go back at least 1000 years (De Langhe et al., 1994). Our best estimate of ca 1100 CE for the onset of agroforestry on Mt. Kilimanjaro, based on the concerted increase of pollen from ruderal plant taxa in the submontane forest zone, certainly is broadly consistent with these genetic data. Cereal cultivation on the lower slopes of Mt. Kilimanjaro has been supported by irrigation since at least the second half of the 19th century (Grove, 1993). Our pollen data push back the starting date of cereal cultivation itself at least to the mid-18th century, and possibly to the mid-16th century. We emphasize that these are minimum ages, dependent as they are on the sensitivity of our pollen proxy to pick up evidence of cultivation. In this context, it must be noted that the Lake Chala sediment archive is remote from the core area of historical human activity, not only in distance (8–15 km from the modern-day homegarden area; Figure 1) but also by its pollen assemblages being influenced by an atypically large contribution from (relatively pristine) crater vegetation.
On the other hand, the striking temporal congruence between the earliest robust evidence for cereal cultivation and the most prominent increase in agroforestry activity (Figure 4), does suggest that the two signatures are causally related. We surmise that expansion of cereal cultivation, perhaps spurred on by the local development of irrigation agriculture (cf. below), may have stimulated population growth and, in turn, more intensive or more widely distributed agroforestry activity higher up the mountain slope. Despite relatively young minimum age of cereal cultivation in the Mt. Kilimanjaro area supported by our data, on balance it appears fair to suggest that it likely developed in conjunction with the local homegarden agroforestry system, and by the same Chagga agriculturalists, already about 1000 years ago. There is no concrete evidence about which specific cereal these farmers may have cultivated. Citing Phillipson (1977), Russell et al. (2014) mention millet and sorghum as part of the Early Iron Age Industrial Complex, but make no reference to the evidence on which this assignment is based. As pollen of finger millet is indistinguishable from wild-type grass pollen based on size (Hamilton, 1972), our data most likely reflect the local cultivation of sorghum.
Finally, it is tempting to hypothesize that the introduction and/or expansion of irrigated agriculture on the southern slopes of Mt. Kilimanjaro may have been connected to long-term variability in regional precipitation. In particular, effort to develop effective irrigation infrastructure (Lang and Stump, 2017) may have been spurred on by the long-term drying trend between ca 1650 and 1820 CE (Buckles et al., 2016; Figure 4). By similar reasoning also the initial settlement of farmers in this mountainous area with guaranteed rainfall about 1000 years ago may have been stimulated by the prolonged regional drying trend between ca 1000 and 1300 CE (Figure 4). Although suggestive, in our view the temporal link between key changes in the Chala pollen record and the hydroclimate proxy record is not strong enough to claim a direct causal relationship at this time.
Conclusion
Climate change in the Mt. Kilimanjaro region of eastern equatorial Africa during the past 2200 years has clearly affected plant associations inside Chala crater, with expansion of succulent dry forest (exemplified by Euphorbia) relative to moist shoreline forest (exemplified by Ficus) during episodes of reduced moisture availability. Climate variability appears to have had only limited influence on vegetation distribution in the wider area around Chala crater, including the southeastern slope of Mt. Kilimanjaro. However, a straightforward signature of such influence may be difficult to detect because of the large local contribution of terrestrial pollen, and because changes in montane forest and subalpine vegetation are muted by the distance of these biomes from the site of pollen deposition (>15 km and >25 km, respectively). In contrast with what is typically observed in East African vegetation reconstructions, which most often involve sites located in or near the forest-grassland ecotone (e.g., Colombaroli et al. 2018; Ssemmanda et al. 2014; van der Plas et al. 2019), the relationship between the percent abundance of Poaceae pollen and independently reconstructed rainfall is (weakly) positive rather than negative. Although statistical significance is lacking, this trend is consistent with the finding that biomass burning in the Chala region is fuel-limited (Nelson et al., 2012), with (modestly) wetter climatic conditions leading to more vigorous growth of savanna grasses, and consequently greater grass pollen production. Our data also indicate that in the course of the last millennium subalpine ericaceous vegetation has expanded relative to upper montane Podocarpus forest, implying a downward shift of Mt. Kilimanjaro’s upper forest line.
Anthropogenic influence on the region’s landscape can be detected from ca 1100 CE onwards, in the form of increasing abundances of ruderal plant taxa in the submontane forest zone of Mt. Kilimanjaro currently associated with the traditional Chagga homegarden agroforestry system. Around ca 1550 CE the first hint of crop agriculture appears with cereal pollen grains becoming more abundant, but initially its proxy signature is still within the range of natural dynamics. Cereal grains (likely of sorghum) are unambiguously present from ca 1780 CE onwards, possibly reflecting the start of intensive irrigation agriculture downslope from the Chagga homegardens, which reached their near-modern-day extent around the same time. Maize makes its first appearance in the pollen record around the same time and remained an important food crop to the present-day.
Supplemental Material
sj-pdf-1-hol-10.1177_0959683620981694 – Supplemental material for Climate-human-landscape interaction in the eastern foothills of Mt. Kilimanjaro (equatorial East Africa) during the last two millennia
Supplemental material, sj-pdf-1-hol-10.1177_0959683620981694 for Climate-human-landscape interaction in the eastern foothills of Mt. Kilimanjaro (equatorial East Africa) during the last two millennia by Geert W van der Plas, Stephen M Rucina, Andreas Hemp, Robert A Marchant, Henry Hooghiemstra, Lisa Schüler and Dirk Verschuren in The Holocene
Footnotes
Funding
The author(s) disclosed receipt of the following financial support for the research, authorship, and/or publication of this article: This research was conducted as part of the Marie Curie Initial Training Network ‘Resilience in East African Landscapes’ supported by the European Commission’s 7th Framework Programme (Grant no. 606879) awarded to Paul Lane (Uppsala University) and DV. The Lake Chala sediment sequence was collected with support from the Research Foundation Flanders (FWO-Vlaanderen) and under permit 13/001/11C of the Kenyan Ministry of Education, Science and Technology to DV.
Supplemental material
Supplemental material for this article is available online.
References
Supplementary Material
Please find the following supplemental material available below.
For Open Access articles published under a Creative Commons License, all supplemental material carries the same license as the article it is associated with.
For non-Open Access articles published, all supplemental material carries a non-exclusive license, and permission requests for re-use of supplemental material or any part of supplemental material shall be sent directly to the copyright owner as specified in the copyright notice associated with the article.