
Abstract
To improve knowledge of marine-terminating glaciers in western Greenland, marine sediment cores from the Ata Sund fjord system, hosting two outlet glaciers, Eqip Sermia and Kangilerngata Sermia, were investigated. The main objective was to reconstruct glacial activity and paleoceanographic conditions during the past 600 years. Ice-rafted debris (IRD) was quantified by wet-sieving sediment samples and by using a computed tomography scan. Variability in relative bottom water temperatures in the fjord was reconstructed using foraminiferal analysis. On the basis of this, three periods of distinct glacial regimes were identified: Period 1 (1380–1810 CE), which covers the culmination of the Little Ice Age (LIA) and is interpreted as having advanced glaciers with high IRD content. Period 2 (1810–1920 CE), the end of the LIA, which was characterised by a lowering of the glaciers’ calving flux in response to climate cooling. During Period 3 (1920–2014 CE), both glaciers retreated substantially to their present-day extent. The bottom water temperature started to decrease just before Period 2 and remained relatively low until just before the end of Period 3. This is interpreted as a local response to increased glacial meltwater input. Our study was compared with a study in Disko Bay, nearby Jakobshavn Glacier and the result shows that both of these Greenlandic marine-terminating glaciers are responding to large-scale climate change. However, the specific imprint on the glaciers and the different fjord waters in front of them result in contrasting glacial responses and sediment archives in their respective fjords.
Keywords
Introduction
Meltwater from Greenland’s outlet glaciers contributes to global sea level rise (Church et al., 2011; IPCC, 2013), and the increased freshwater input to the North Atlantic may affect circulation in the sub-polar gyre (Bamber et al., 2012; Fichefet et al., 2003). Models of future sea level rise require a detailed understanding of the causes behind the retreat of marine-terminating glaciers in Greenland, as well as their links with climate change (Straneo et al., 2013). It has been shown that the warming of the ocean around Greenland is playing an important role in the current destabilisation of marine-terminating glaciers (Straneo and Heimbach, 2013; Vieli and Nick, 2011). Despite low temperatures, ocean waters can cause submarine melting at the glacier front, which may affect grounding-line stability as well as calving activity (Rignot et al., 2010). Higher regional ocean and air temperatures lead to increased submarine melting. Combined with surface runoff, these parameters may trigger phases of glacier retreat/advance (Catania et al., 2018). The dynamic behaviour of an outlet glacier front and how it responds to climate change are also strongly influenced by its bed slope and the fjord’s topography – as, for example, given by grounding thresholds and overdeepenings (Meier and Post, 1987; Vieli et al., 2001).
Sedimentary infill in Greenland’s fjords is mainly composed of meltwater plume deposits, ice rafted debris and turbidites with the magnitudes varying both within and between fjords (Smith and Andrews, 2000; Ó Cofaigh and Dowdeswell, 2001). Ice-rafted debris (IRD), is commonly used to reconstruct glacier behaviour (Andresen et al., 2012). Initially, IRD was sampled from deep sea cores in the North Atlantic Ocean and used as a proxy to reconstruct oceanographic and glaciological conditions during the Marine Isotope Stages 1 to 5 (Bramlette and Bradley, 1940; Ruddiman, 1977). During the late 1980s, IRD was combined with foraminifera studies to understand the dynamics of Heinrich events, characterised by massive iceberg calving of the Laurentide Ice Sheet (Andrews, 2000; Broecker et al., 1992; Heinrich, 1988). Over the last decade, IRD has been used to reconstruct past ice sheets and especially outlet glacier calving activity (or flux) into fjords (Andresen et al., 2012, 2017; Vermassen et al., 2019b; Wangner et al., 2018). In theory, IRD content in glacial fjord systems can be controlled by the amount of sediments trapped and transported by the ice during calving, changes in location of the calving margin, variability in iceberg production and how fast the icebergs melt during their transport through the fjord system (Andrews, 2000; Dyke et al., 2017). For instance, high IRD content can reflect the frequency of iceberg calving events and the retreat of the glacier and/or shortening of the iceberg transport route and time before passing over the coring site (Andresen et al., 2012). Sea ice and ice mélange can block calving activity and hinder the transport of icebergs towards a coring site (Amundson et al., 2010; Andresen et al., 2012; Reeh et al., 2001). Changes to glacier configuration may also influence the amount of IRD deposited. For instance, glaciers incorporate sediment when in contact with its bed and therefore icebergs from calving glaciers contain sediment. Icebergs from floating glacier tongues are distinctly deprived from sediment since the glacial ice has not been in contact with the bed and also experience melt from beneath (Andresen et al., 2017; Wangner et al., 2018). They can however still gain sediments from supraglacial sources and debris transported through the glacier ice.
The glaciers, Eqip and Kangilerngata Sermia, are two marine-terminating outlet glaciers that flow into Ata Sund, north of Ilulissat in western Greenland. Due to convenient access to the Greenland ice sheet at Eqip Sermia, a century-long historical record of front margin positions exists at this glacier. Lüthi et al. (2016) reviewed Eqip Sermia’s history and reconstructed velocity and geometry changes for the past 100 years. The record of front terminus changes of Kangilerngata Sermia extends back to 1957 (Bauer, 1968; Carbonnell and Bauer, 1968). It shows an almost time-synchronous retreat behaviour as the neighbouring Eqip Sermia and a very similar pattern as many glaciers in western Greenland, with an accelerated retreat during recent decades (Catania et al., 2018).
Even though the climate forcing is uniform across west Greenland, the outlet glaciers there seem to respond differently on decadal time scales (Kelley et al., 2012, 2018). This is due to individual differences of the respective glacial system, specifically ice velocity and internal ice dynamics (Kelley et al., 2018; Nye, 1960). Some glaciers are still advancing towards its Little Ice Age (LIA) maximum extent, for example, Nordenskiöld Gletscher (ca. 70 km south of Jakobshavn Glacier; 173 m yr−1; Rignot and Mouginot, 2012). Jakobshavn Glacier, the fastest flowing glacier in the world (17,100 m yr−1; Joughin et al., 2014), reached its LIA maximum already at 1850 CE (Weidick, 1968). Several glaciers reached their LIA maximum extent between these dates (Håkansson et al., 2014; Kelley et al., 2018).
The purpose of this study was to reconstruct variability in the outlet glaciers in Ata Sund beyond the instrumental time scale extending back several hundreds of years and to investigate if there is a link between longer term glacier variability and oceanographic and climate changes. Here we present a record of IRD based on two marine sediment cores from the Ata Sund fjord system, 20 km from Eqip Sermia’s terminus. The study was based on measurements of grain size combined with X-ray computed tomography (CT) image analysis. We used the IRD record to investigate changes in glacier dynamics extending back 600 years. The LIA is generally considered to have occurred between 1300 and 1900 CE (Kjeldsen et al., 2015; Ljungqvist, 2010; Mann et al., 2009; Paasche and Bakke, 2010) but the LIA has been shown to be locally constrained and the timing of LIA vary across Greenland (Neukom et al., 2019). We define the LIA as spanning from 1300 to 1920 CE, marked by the moraine limit of the historical maximum glacier extent dated to 1920 CE in Ata Sund (Lüthi et al., 2016). Thus, our study covered most of the LIA as well as the transition into the 20th century. To investigate whether the reconstructed calving activity is linked with oceanographic changes, we further reconstructed a time series of relative variability of bottom water temperatures in Ata Sund. The relative bottom water temperature record was based on foraminifera assemblage analysis of the radiocarbon-dated sediment cores. Finally, we discuss our findings in relation to other proxy records of past climate in the region and compare our datasets both to instrumental and observational records.
Study site
Geographical setting
Ata Sund is a fjord system, north of Ilulissat, connected to the northeast part of Disko Bay (Figure 1a) in western Greenland. Today, Disko Bay is characterised by a low Arctic maritime climate with an average annual air temperature of −3.9°C over the past 30 years (measured at Ilulissat, Figure 1b) (Cappelen, 2017). Dense sea ice and/or ice mélange cover the bay from January to March/April, with the transition to open waters starting in March and completing in June (Buch, 2000; Laidre and Heide-Jørgensen, 2012). The bay’s bathymetry varies between 300 and 500 m, but the maximum depth is up to 990 m (Krawczyk et al., 2013). Water masses in Disko Bay originate from the West Greenland Current (WGC), which consists of water from the East Greenland Current (EGC) and the Irminger Current (IC) (Figure 1a) (Straneo et al., 2012). The EGC is a surface current (upper 200 m) bearing cold and low saline water from the Arctic. The IC consists of warm and saline Atlantic water (AW) originating at lower latitudes. These two water masses gradually mix while traveling north along the west coast of Greenland and form the WGC. In Disko Bay, the WGC is a bottom current (below 150 m) with temperatures between 3°C and 4°C and a salinity greater than 34.3 practical salinity units (PSU) (Krawczyk et al., 2013; Lloyd, 2006a; Perner et al., 2011).
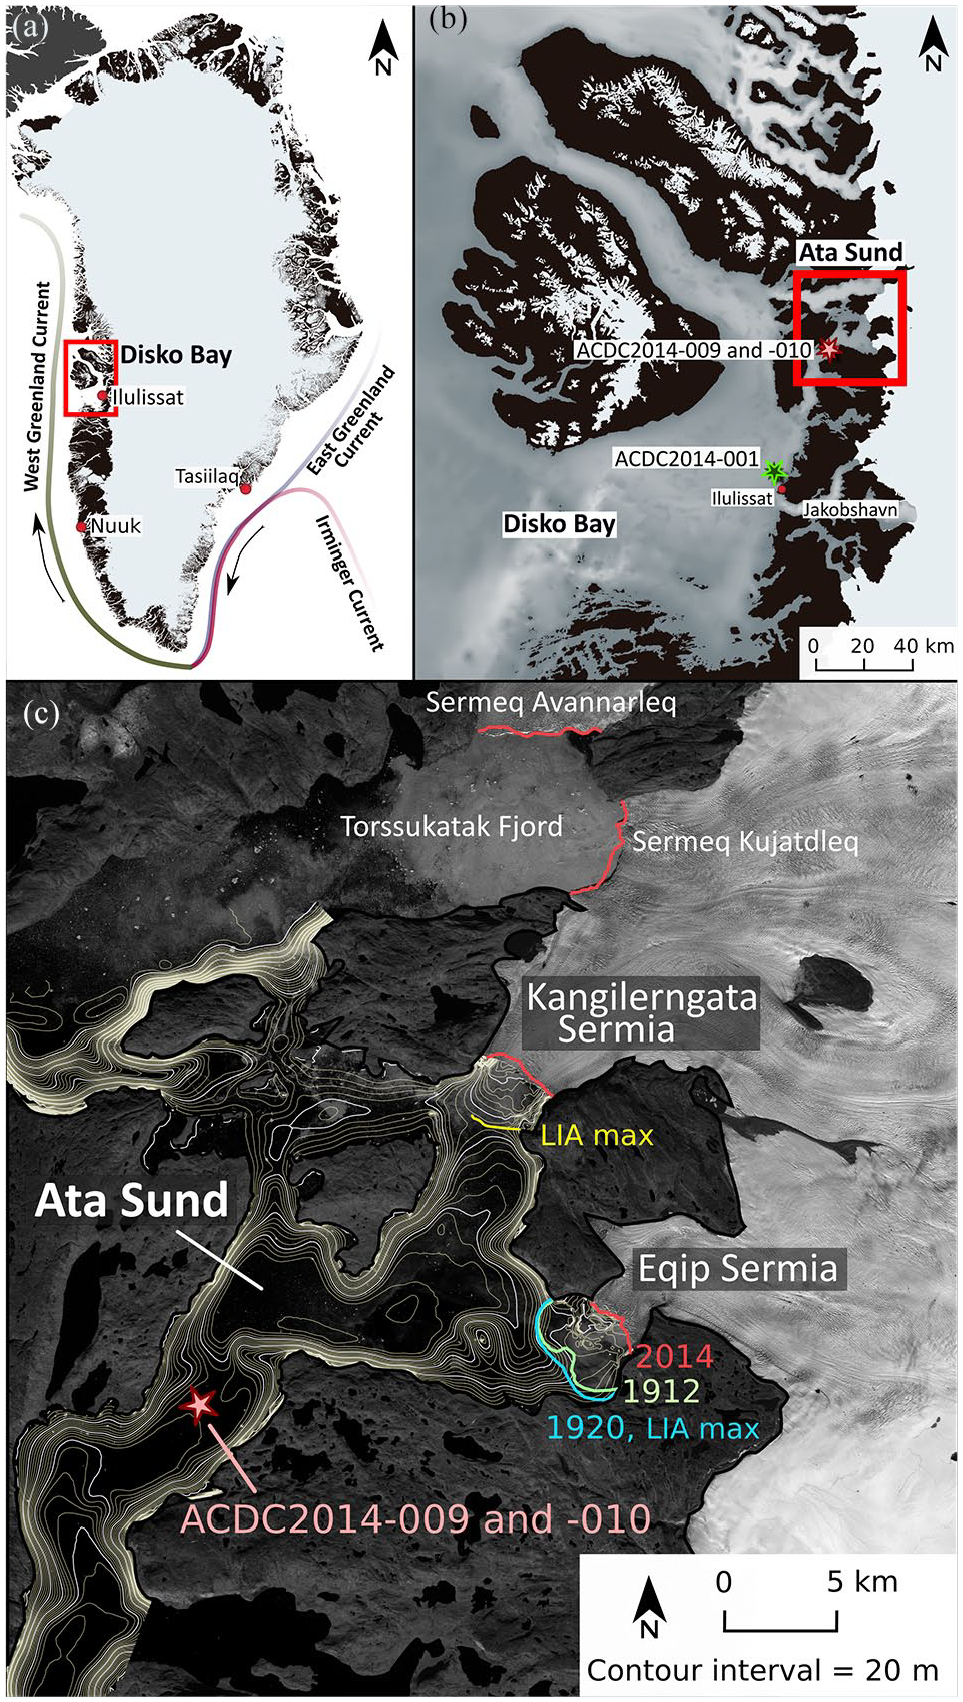
(a) Map of Greenland (Morlighem et al., 2017) and relevant ocean currents (Straneo et al., 2012). The red box is the location of Disko Bay. (b) Disko Bay and core sites in Ata Sund (ACDC2014-009 and 010) and Jakobshavn (ACDC2014-001) (Wangner et al., 2018). The red box is the location of Ata Sund. (c) Close-up map of the study area, the Ata Sund fjord system. The yellow contour lines (Morlighem et al., 2017) lie every 20 m, with marked white lines every 100 m. The red star is the core location of ACDC2014-009 and ACDC2014-010. The bright blue line in front of Eqip Sermia shows its historical moraine limit (termed ‘1920, LIA max’) which is equivalent with the latest maximum extent in 1920; the bright green line shows the extent in 1912; and the red lines show the glacial extent of all glaciers in the year 2014 (Lüthi and Vieli, 2015). The thick yellow line show the suggested latest maximum extent (termed ‘LIA max’) of Kangilerngata Sermia based on the historical moraine limit from bathymetry records in front of the glacier (Morlighem et al., 2017; Rignot et al., 2015).
Ata Sund is oriented in a northeast-southwest direction with a water depth ranging between 20 and 500 m (Figure 1b). The fjord arm connected to Disko Bay has a mean water depth ranging from 300 to 500 m with steep fjord sides (Figure 1b). In the proglacial areas as well as areas in proximity to the Ata Sund islands, the bathymetry is shallow, 20 to 100 m (Lüthi et al., 2016; Morlighem et al., 2017; Rignot et al., 2016). At the end of August 2014, Beaird et al. (2015) measured a sea temperature proxy (noble gases) on a line from the most northern glacier in the fjord (Kangilerngata Sermia) to 60 km south, towards Disko Bay. They observed three main water masses in Ata Sund, which they defined as AW, Polar Water (PW) and Warm Polar Water (WPW). AW (ca 2°C) lies below 200 m in depth and correlates with the WGC in Disko Bay. It does not reach glacial fronts due to sills and shallow bathymetry (Lüthi et al., 2016; Rignot et al., 2016). AW is covered by PW (approximately 1°C) that is present in front of the glacier between 80 and 200 m in depth. Towards the end of the summer season in 2014, WPW (2°C–4°C) caps the PW from approximately 10 km from the glacial front and out into Disko Bay. WPW is seasonally warmed up, but repeated measurements at the beginning of the summer season in 2015, 2016 and 2018 show substantially colder conditions (well below 2°C; A. Vieli, unpublished data, 9 October 2019). Additionally, there is a cold top surface layer (ca 0.5°C) due to the cooling effect of surface meltwater and melting icebergs delivered by the two outlet glaciers (Beaird et al., 2015; Desloges et al., 2002).
Ata Sund is connected to the Torssukatak Fjord, which is located north of Ata Sund, through a shallow threshold with several small islands. Torssukatak holds two marine-terminating outlet glaciers, Sermeq Avannarleq and Sermeq Kujalleq (An et al., 2018). The number of icebergs passing between the fjords is not known, but the depth in the area is rather shallow (<100 m), preventing larger icebergs from crossing. Satellite images (USGS, 2018) indicate that ice passes between the fjords today, but it is difficult to distinguish possible icebergs from sea ice.
Marine-terminating glaciers Eqip Sermia and Kangilerngata Sermia
The marine-terminating glacier Eqip Sermia has been studied since 1912 and therefore has one of the longest records of front positions and flow speed measurements from Greenland (Lüthi et al., 2016) with close to decadal resolution. The glacier drains an area of 1260 km2 with a flow velocity at the glacial terminus of 2 to 3 m d−1 (equals 730–1096 m yr−1), which has been relatively constant throughout the last century. Based on recent data, Eqip Sermia’s estimated ice flux is roughly 1.5 km3 yr−1, which is double the estimation from 1968 (Carbonnell and Bauer, 1968; Catania et al., 2018). The LIA maximum glacier extent (1920 CE) was located at a sill, 4 km beyond the modern front position (Figure 1b) (Desloges et al., 2002). After 1920, Eqip Sermia continuously retreated for about two decades. Between 1960 and 1990, the glacier advanced slightly before stagnating and then slowly retreated for a decade. Since the year 2000 and to the present day, the glacier has retreated rapidly. In 2009 the flow velocity had increased to 10 m d−1. The seabed by the glacial front is characterised by undulating sediment packages up to 60 m thick that is heavily marked by iceberg scouring (Desloges et al., 2002). The water depth by the glacial front varies between 20 and 100 m.
Kangilerngata Sermia drains a larger area (7940 km2) and also flows faster (1530 m yr−1) than Eqip Sermia (Morlighem et al., 2017). The ice flux is larger for Kangilerngata Sermia (2.4 km3 a−1) and, compared to its neighbour, this glacier calves close to the double amount of ice (Carbonnell and Bauer, 1968; Catania et al., 2018; Lüthi et al., 2016). The seabed in front of the glacier terminus has a U-valley shape with a maximum depth of 380 m and the recently deglaciated seabed is marked by 15 m-high and 200 m-wide drumlins and glacial lineations (Rignot et al., 2015). Similarly with Eqip Sermia, a sill is present 3 km from Kangilerngata Sermia’s front at approximately 160 m in depth (Rignot et al., 2015).
Methods
Sediment core analysis
Two sediment cores, ACDC2014-009 (110 cm long) and ACDC2014-010 (89 cm long), were retrieved from a water depth of 280 m (69N 45.513/50W 44.996) from R/V Porsild, on 31 August 2014, using a Rumohr corer with 2-m core liners. The cores were retrieved at the same location directly after each other. The distance to the glacier fronts was approximately 20 km. The cores were photographed using a YXLON smart 160 E/0.4 system (120 s, 3 mA, 90 KV) at the National Museum of Denmark, Copenhagen. The 40 cm-long images were merged to create one combined image of the cores. CT scans and X-ray images have been increasingly utilised to characterise and estimate volume, density and grain counts in sediment cores, both manually and automatically (e.g. Andrews et al., 1997; Fouinat et al., 2017; Røthe et al., 2018; Tanaka et al., 2011). Compared to the sieving method for quantifying IRD, CT scans offer higher efficiency and have the additional advantage of being a non-destructive method. Therefore, a high-resolution CT scan of one-half of the ACDC2014-009 split core was undertaken using a ProCon Alpha Core CT scanner (Tube voltage 110 kV, current 800 mA, exposure time 250 ms) at EARTHLAB, University of Bergen. The scan was done in a continuous helix motion to produce 16-bit (65,536 grey values) 3D imagery with 53 µm voxel size (volume pixel). We applied ring artefact and median filters and reconstructed IRD with bins of 2 by 2 voxels to reduce the computational demand. Grey scale values in the subsequent figures (Figure 2a: I–III in ‘Results’ section) reflect relative density differences in the samples, as the photoelectric effect is negligible for voltages above 100 kV (Wellington and Vinegar, 1987). To visualise the CT X-ray imagery, we used Avizo Fire software. The watershed segmentation tool in Avizo Fire was used to isolate high-density particles with a diameter larger than 150 µm, and the number of these particles per 1 cm slice per depth in the core was used as a measure to quantify IRD.
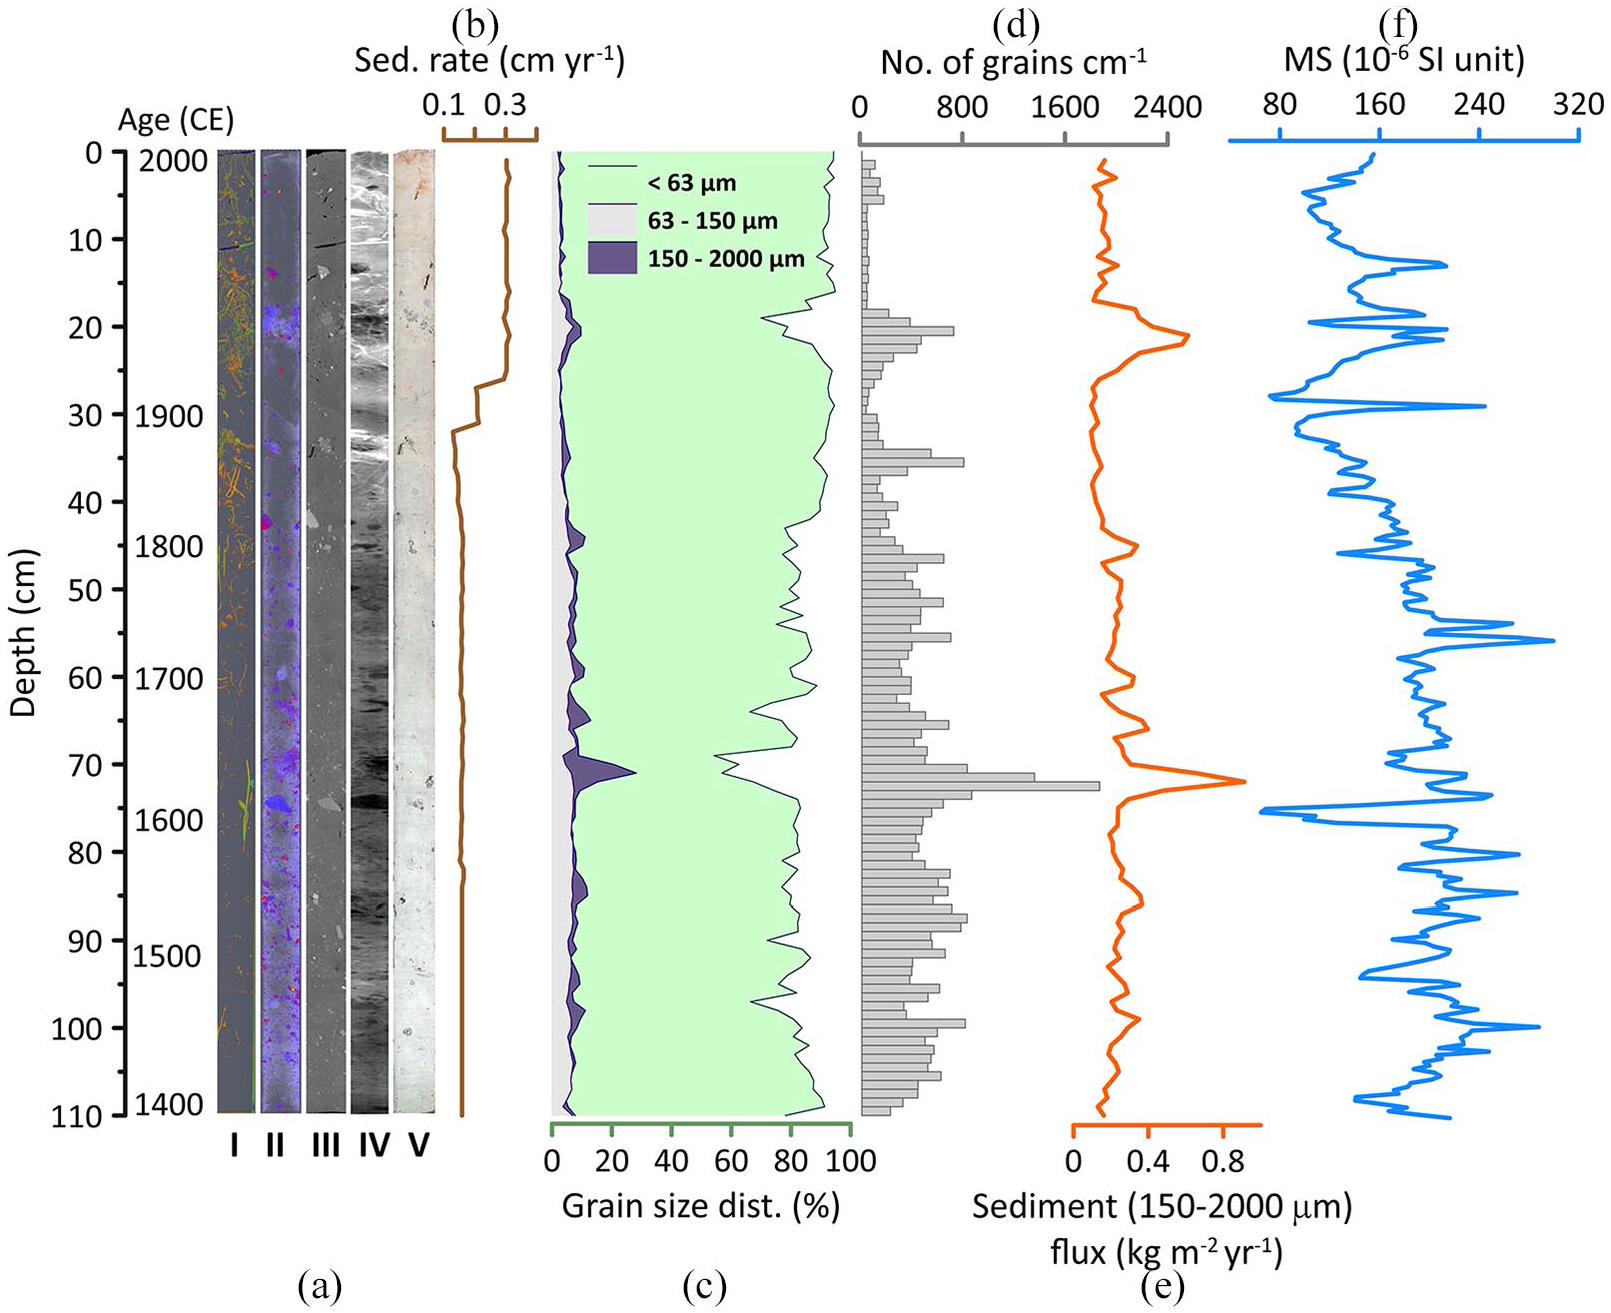
Core ACDC2014-009. (a) I: Low-density CT image. Red and yellow colours showing low-density components of the sediment core (bioturbation and eelgrass). II: High-density CT image, where blue and purple colours show high-density components in the sediment core (IRD). III: High-resolution 2D slice CT X-ray image of the core. IV: Low-resolution conventional X-ray image. V: Surface image (RGB). (b) Sedimentation rate in cm per year. (c) Grain-size distribution (%) of the wet sieving dataset. (d) Histogram of the number of grains (cm−1) computed from the CT dataset. (e) Sediment flux (F) of the coarse sand fraction (kg m−2yr−1). (f) Magnetic susceptibility in SI unit 10−6.
Magnetic susceptibility (MS) at 1-mm intervals were measured on the split core surface with a Bartington MS2E point sensor and low-resolution X-ray images taken using an Itrax Core Scanner at the Natural History Museum of Denmark.
Samples for water content and grain-size analysis were subsampled every 1 cm continuously in both ACDC2014-009 and ACDC2014-010. Each aliquot was first weighed, then freeze-dried, and then weighed again in order to calculate the percentage of water content. The samples were rewetted in distilled water using a shaking table overnight before being manually wet-sieved through 63- and 150-µm meshes. All sample fractions were dried at 50°C. Grains larger than 2 mm were manually separated from the >150-µm fraction to avoid a disproportional impact of larger grains. The data are reported as weight percentages.
Sediment fluxes (F, kg m−2 yr−1) were calculated using equation (1) (modified from Wangner et al., 2018), where S is the sedimentation rate (m yr−1), W is the water content in percent, P is the percent of the sample fraction and d is the density of quartz (2700 kg m−3):

Foraminiferal analysis was conducted on 12 samples from core ACDC2014-009. One-cm slices were wet-sieved through a 63- and 500-µm mesh and then stored in a solution of distilled water, ethanol and sodium bicarbonate to avoid carbonate dissolution (targeted pH ca 8). Calcareous tests were identified and counted on a picking tray. The results were plotted using the C2 software (Juggins, 2007).
Chronology
Both sediment cores (ACDC2014-009 and ACDC2014-010) were dated using the decrease of excess 210Pb (210Pbxs) in the upper 50 cm of the sediments and supplemented with radiocarbon (14C) dates of marine eelgrass (Zostera marina), further down-core. Lead measurements were performed at the University of Bordeaux (France) using a low-background, well-type gamma detector. In total, five samples were submitted for radiocarbon analysis. Four samples were sent to the Radiocarbon Laboratory at the Department of Geology at Lund University, Sweden, and one was sent to Beta Analytic, Miami, USA (Table 2 in ‘Results’ section).
The age-depth model was established using the Bacon software by Blaauw and Christen (2011). The radiocarbon dates were calibrated using the Marine 13 calibration curve (Reimer et al., 2013). We used a Delta R of 56 ± 49, which equals the average Delta R of the three closest locations to the core site found in the marine database (Olsson, 1980). The model was run without lower-depth constraints and thus extended down to the lowermost radiocarbon dates at 88 cm on ACDC2014-009 and 73 cm on ACDC2014-010. To obtain ages below these depths, the ages were linearly extrapolated to the end using a manually calculated mean sedimentation rate (cm yr−1) between the radiocarbon dates for each core, respectively. The sedimentation rate for each depth was calculated by finding the slope for each point of the age-depth model (Figure 5a and b).
Results
Core description, core scanning and X-ray imaging
The colour of the sediment at the top parts of the cores has a predominantly light olive tone (Munsell colour code: 5Y 6/2), gradually shifting to a more greyish tone (Munsell colour code: 5Y 6/1) towards the bottom. No sedimentological structures are visible on the surface of the cores. However, the CT scan of core ACDC2014-009 (Figure 2a: I–III) reveals a large number of discrete high-density particles unevenly distributed throughout the core with a higher abundance below 30 cm (Figure 2a). We quantified these grains and reported the number of grains larger than 150 µm per 1 cm in depth in the cores (Figure 2d). Quantification of grains based on the CT imagery showed that the top 30 cm contain a lower amount (0–200 cm3) of grains except for a 3 cm-wide layer between 19 and 22 cm where the number of grains reaches 800 cm3. There is also a distinct 0 to 100 cm3 section between 5 and 19 cm. At about 30 cm, there is a gradual transition towards larger and variable grain number between 400 and 800 cm3 (Figure 2d). Two large grains (ca. 2 cm) were visually identified at 42 and 75 cm in depth on the CT scan (Figure 2a: II). In the upper part of the core, where the grain pattern is less prominent, the low-density filter (Figure 2a: I) revealed tube-like structures, which were interpreted as trace fossils indicating bioturbation, and elongated macrofossils, which were interpreted as Zostera marina. Thus, downwards, the occurrence of grains increases, whereas the bioturbation decreases. Zostera marina is present throughout the whole core. The trend in the MS profile broadly follows the number of IRD, with increasing values from the top to the bottom in both cores (Figures 2f and 3e).
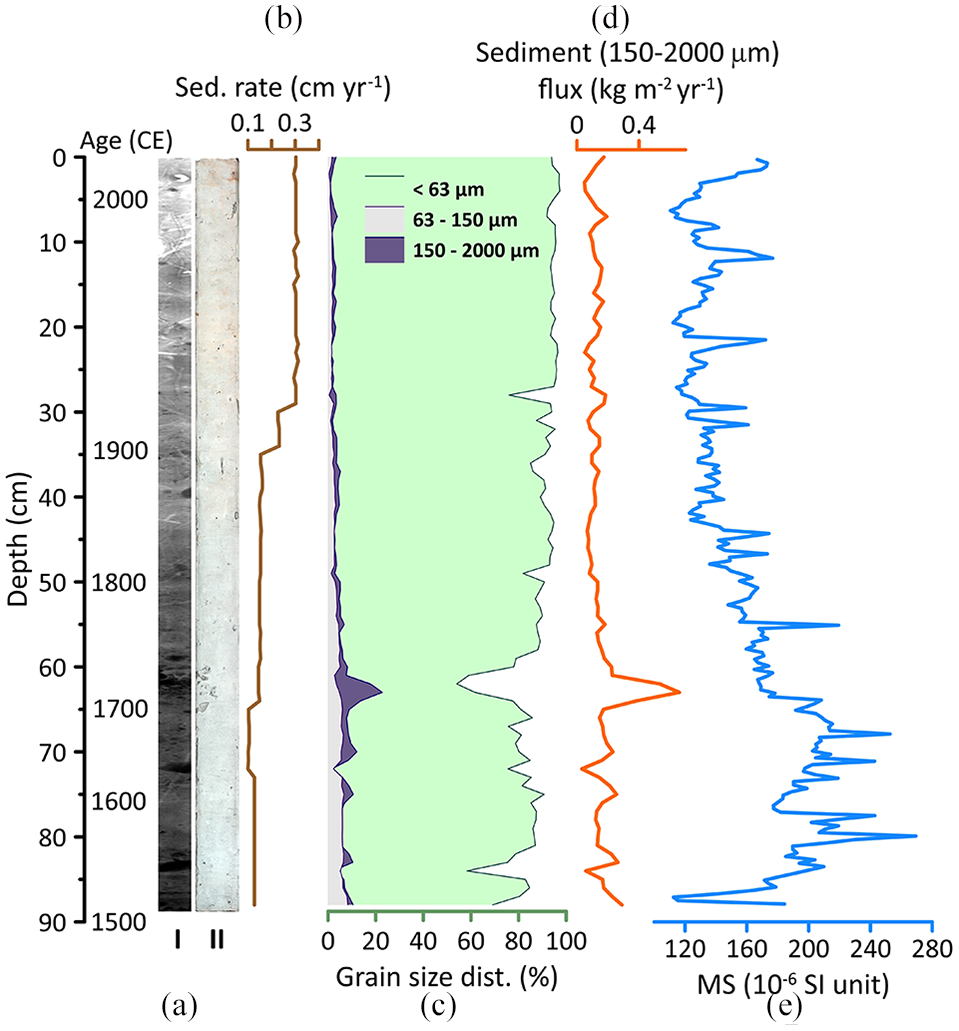
Core ACDC2014-010. (a) I: Low-resolution conventional X-ray image. II: Surface image (RBG). (b) Sedimentation rate in cm per year. (c) Grain-size distribution (%; a wet sieving dataset). (d) Sediment flux (F) of the coarse sand fraction (kg m−2yr−1). (e) Magnetic susceptibility in SI unit 10−6.
Grain-size distribution
Figures 2c and 3c visualise grain-size percentages of ACDC2014-009 and ACDC2014-010, respectively. The two cores consist of a compact matrix of mostly clay and silt (Figures 2a: V and 3a: II). The weight percentage of the fine sand fraction (63–150 µm) is 2% to 3% between 0 and 32 cm in ACDC2014-009 and 1% to 3% between 0 and 52 cm in ACDC2014-010. The percentages increase downwards in both cores to 6% to 8%. The coarse sand fraction, 150 to 2000 µm, shows a similar trend as the fine sand fraction, but with slightly higher values and more prominent maxima. The <63-µm fraction varies between 55% and 97% in both cores. F, the calculated sediment fluxes, follow the grain-size trend, with increased deposition of grains during time periods with high F. The F of the coarse sand fraction is visualised in Figures 2e and 3d for the cores, respectively.
Foraminiferal analysis
We identified 30 species of benthic foraminifera in core ACDC2014-009, 17 calcareous and 13 agglutinated. Figure 4 presents all species reaching more than 2% of the total assemblage. It is highly dominated by Stainforthia feylingi, comprising up to 74% of the total assemblage with concentrations of 167 test per gram. The samples between 10 and 43 cm show lower ratios of S. feylingi, with agglutinated species Spiroplectammina biformis, Textulario torquata and Cuneata arctica being the most abundant. Elphidium clavatum is prominent from 24 cm and below, with its highest percentage at 94 cm (30%). The percentage of calcareous versus agglutinated species mostly follows the abundance of S. feylingi, due to its dominant quantities. Between 10 and 43 cm, we found more agglutinated species, whereas in the top part (0–10 cm) and the lower part (43–110 cm) of the core, calcareous species dominate.
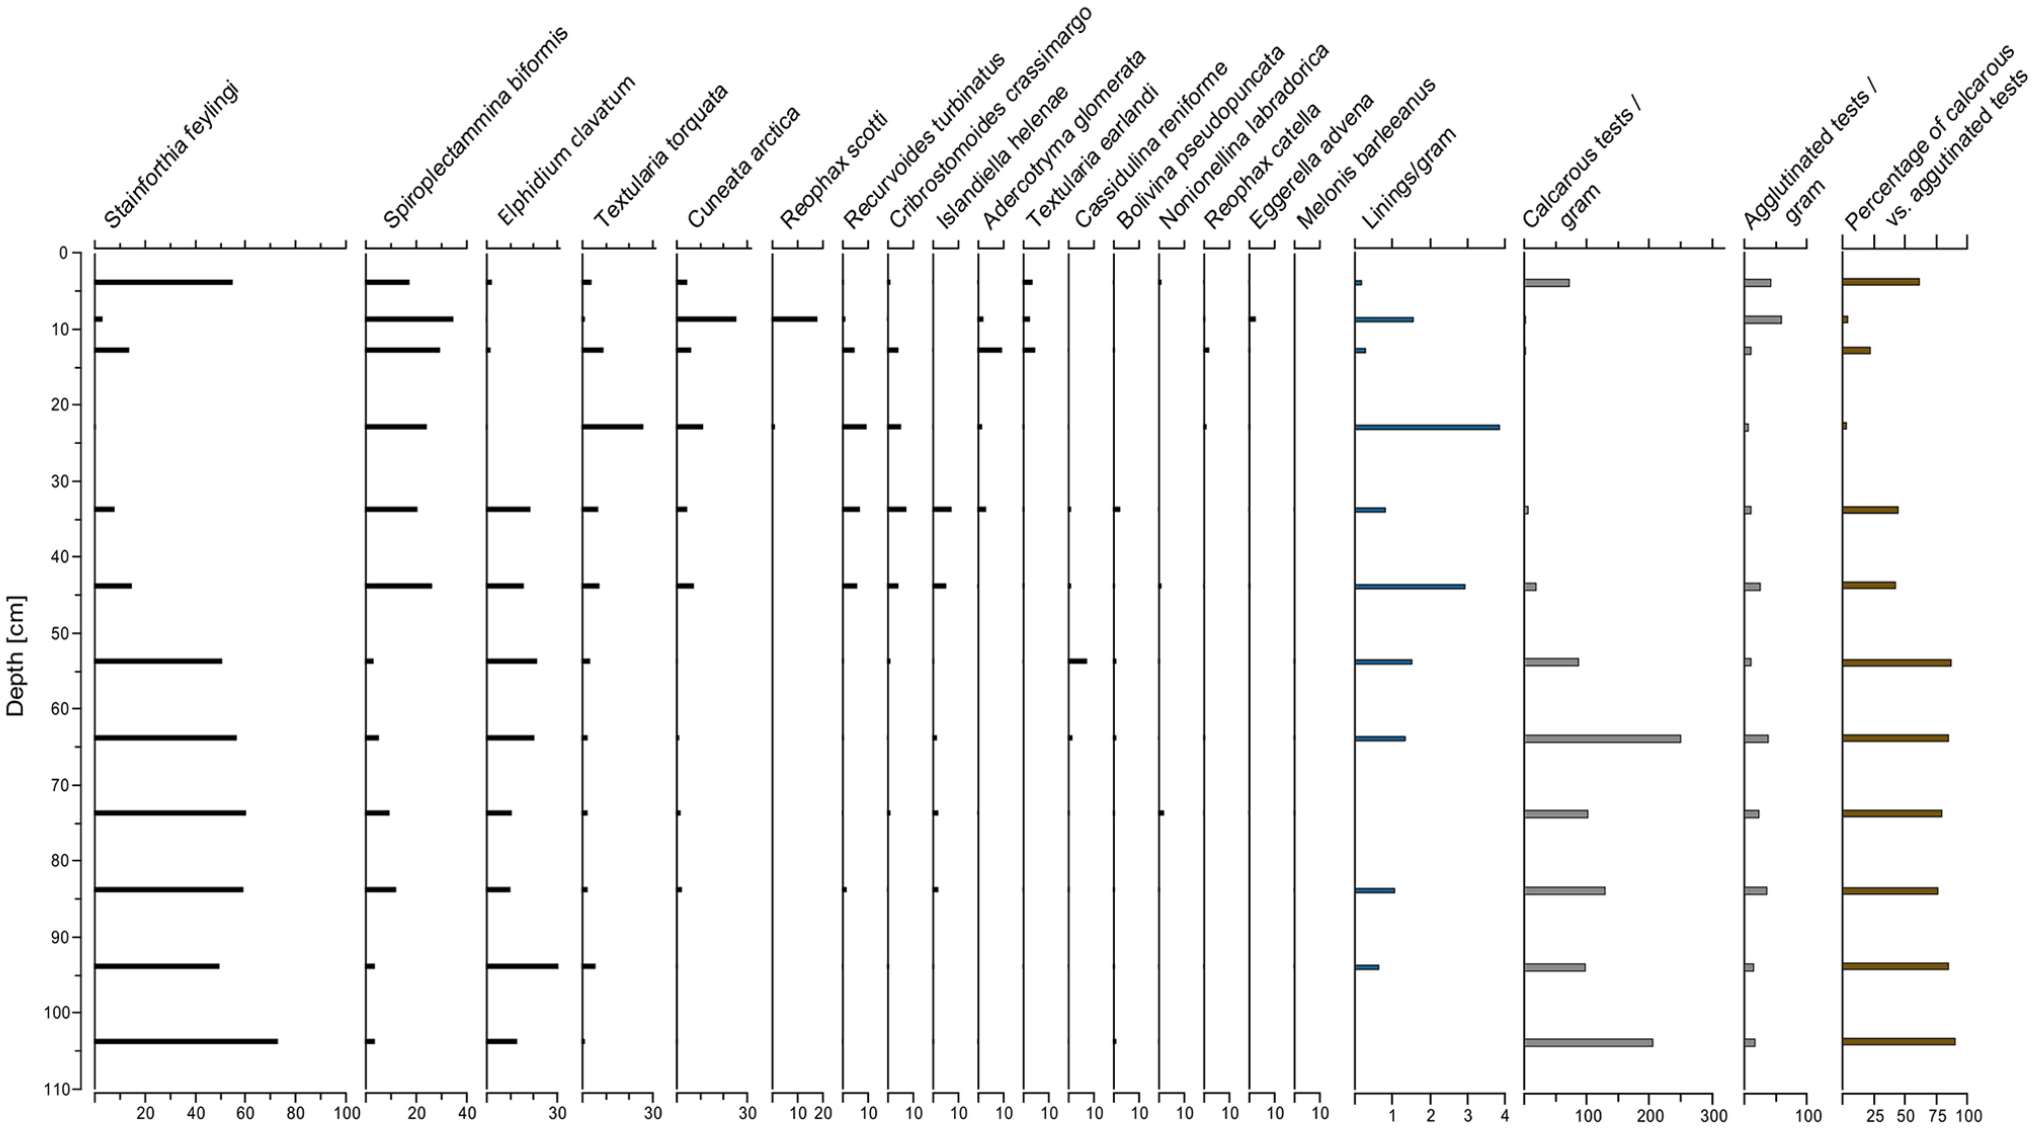
Foraminiferal assemblage analysis of core ACDC2014-009. Species are shown as percentages of the total assemblage. Linings and amount of test are shown as amount per gram.
Age-depth model
A comparison of the unsupported lead (210Pbxs) profiles shows an offset between the two cores (Figure 5d). The offset indicates that core ACDC2014-009 has lost the upper 3 cm of its sediments. This probably occurred during coring or when sealing the cores with foam, since the cores were taken directly after each other, at the same coordinates, and have similar lithology. Based on the 3-cm offset, the 210Pb ages from the two cores were combined to gain an age record starting at 0 cm. Hence, when running the full age-model (Figure 5a–c) as described in the ‘Methods’ section for each core, we used the individual radiocarbon ages (Table 1) but also the combined 210Pb date sequence. The cores’ individual 210Pb ages are shown in Table 2. One 14C-sample (LUS 12982) from ACDC2014-009 at 81 cm in depth was excluded from the model since it yielded a modern age, contradicting the other radiocarbon samples as well as the 210Pb profile.
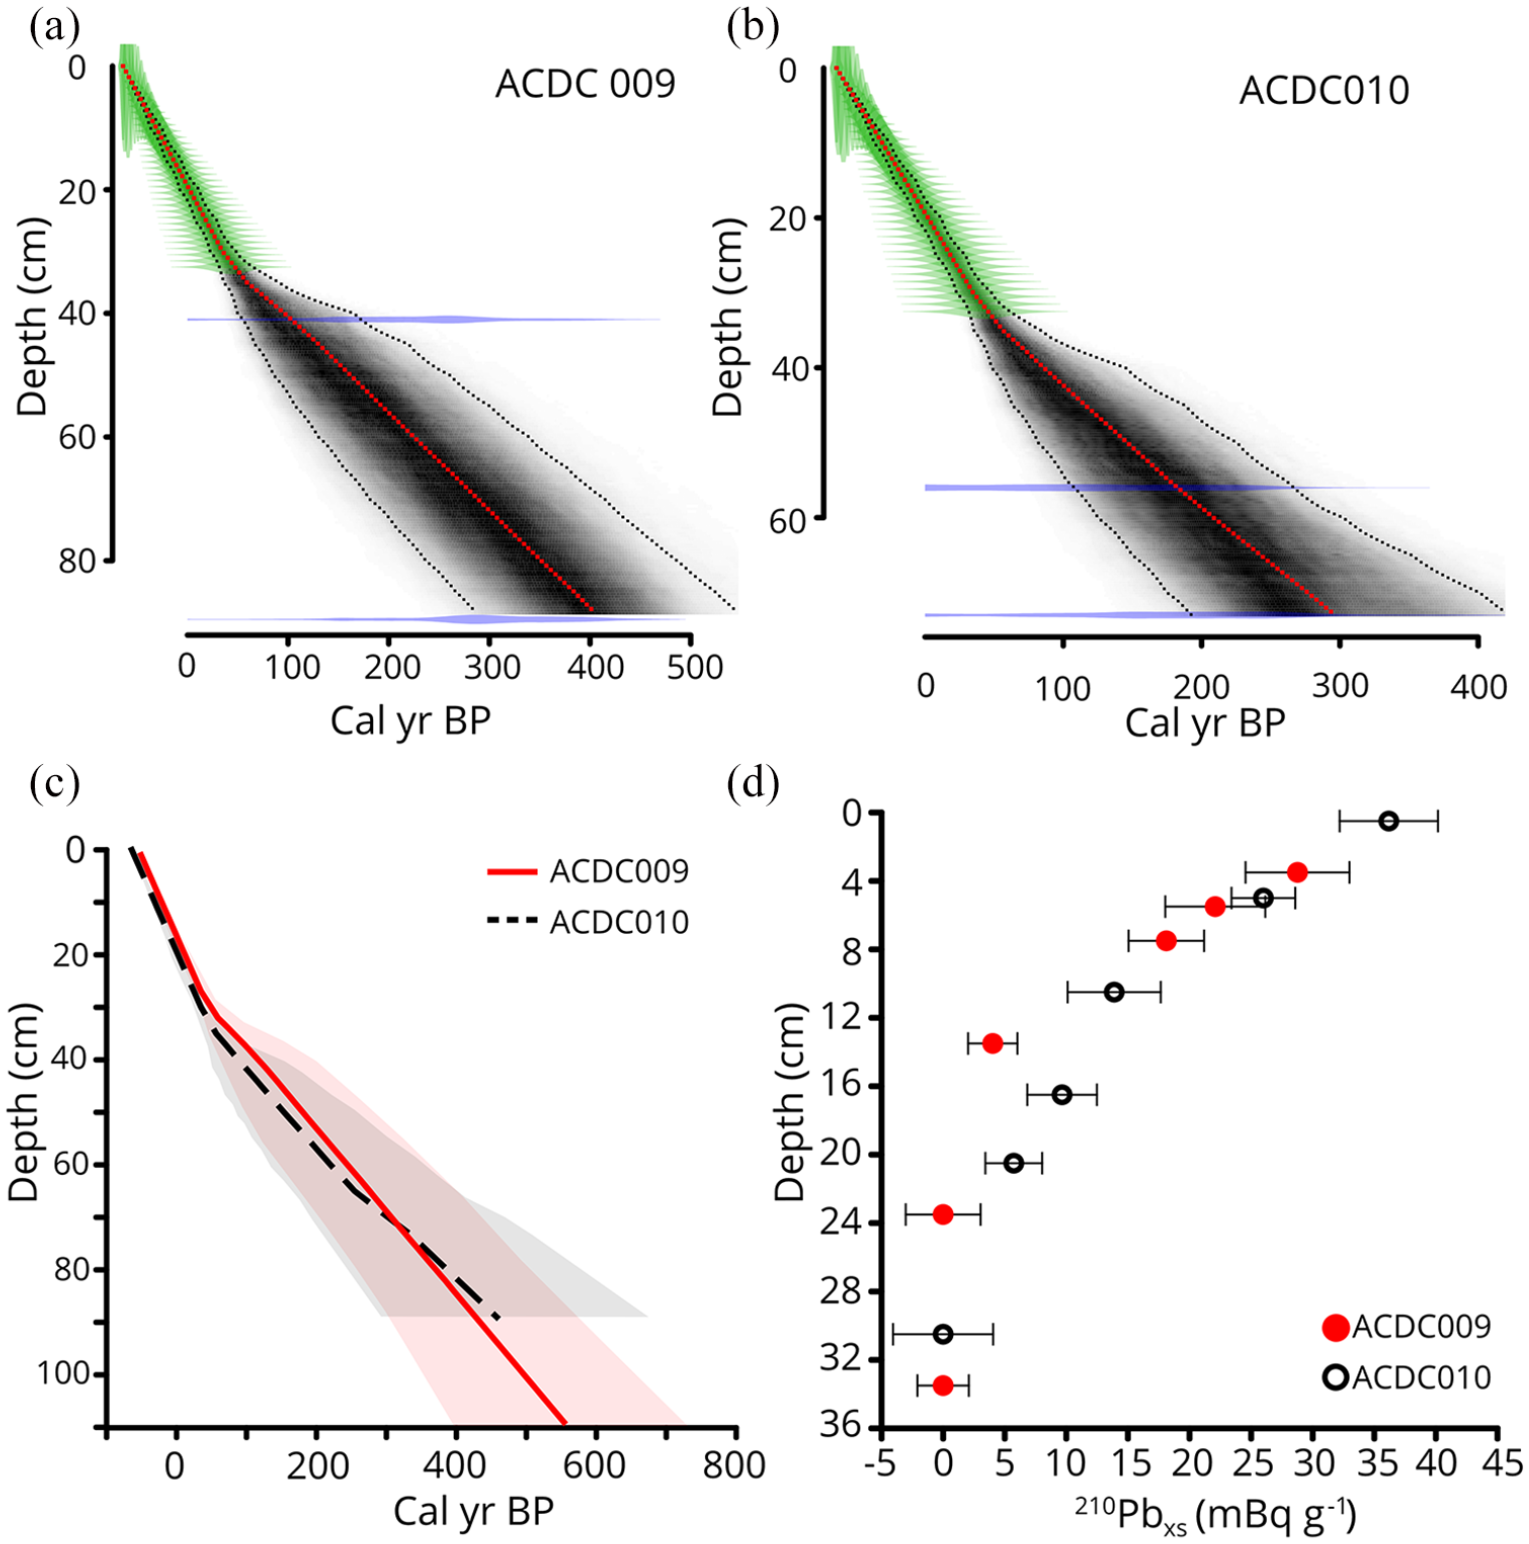
Age-model result from the Bacon software run in R with default settings except for those (calibration curve and Delta R) described in the ‘Methods’ section (Blaauw and Christen, 2011). (a) and (b) are core ACDC2014-009 and core ACDC2014-010, respectively. Green marks: 210Pb ages; blue marks: 14C ages; grey area: 14C ages uncertain; red line: mean age. (c) Both cores, including the manual extrapolation below the oldest 14C age. (d) 210Pbxs activities with depth for the top of both cores. ACDC2014-009 is plotted with a 3-cm offset in depth.
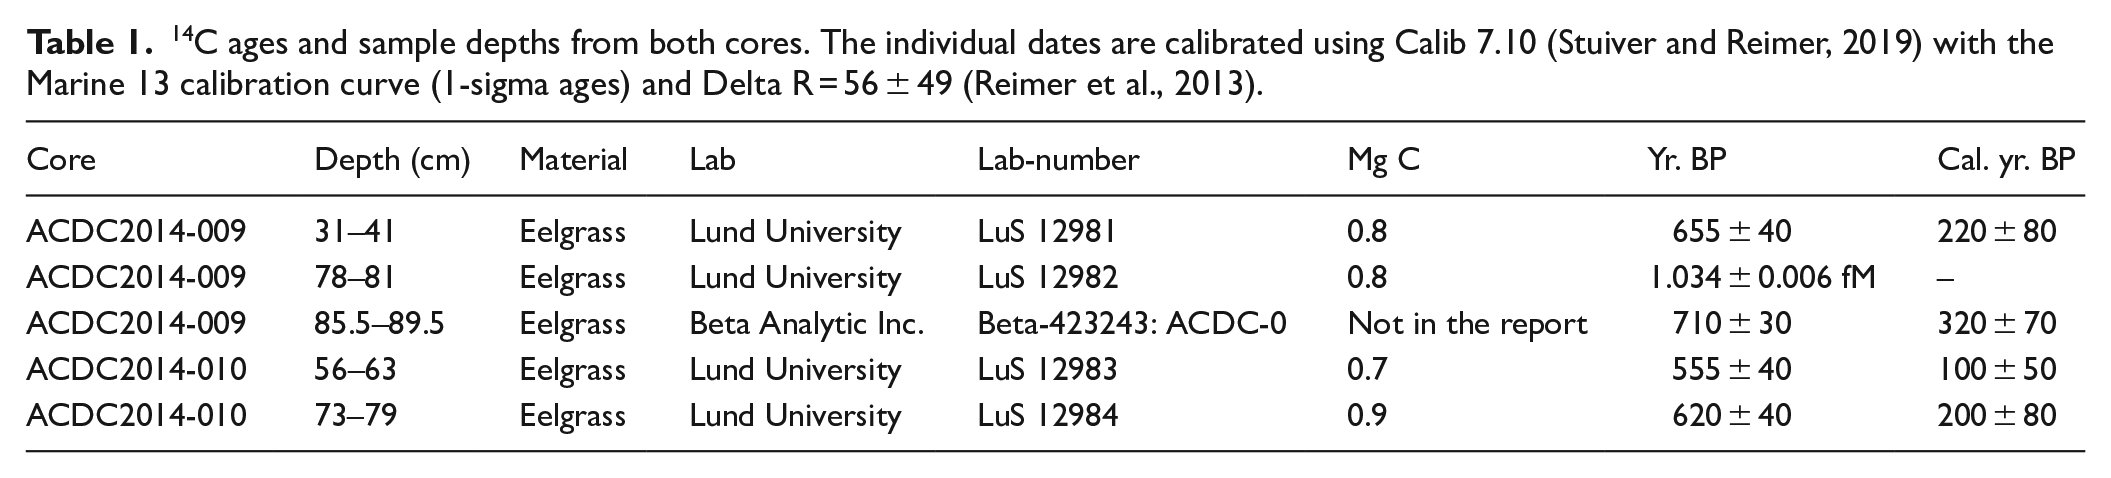
14C ages and sample depths from both cores. The individual dates are calibrated using Calib 7.10 (Stuiver and Reimer, 2019) with the Marine 13 calibration curve (1-sigma ages) and Delta R = 56 ± 49 (Reimer et al., 2013).
210Pb ages before 2014, with depth in cores ACDC2014-009 and ACDC2014-010.
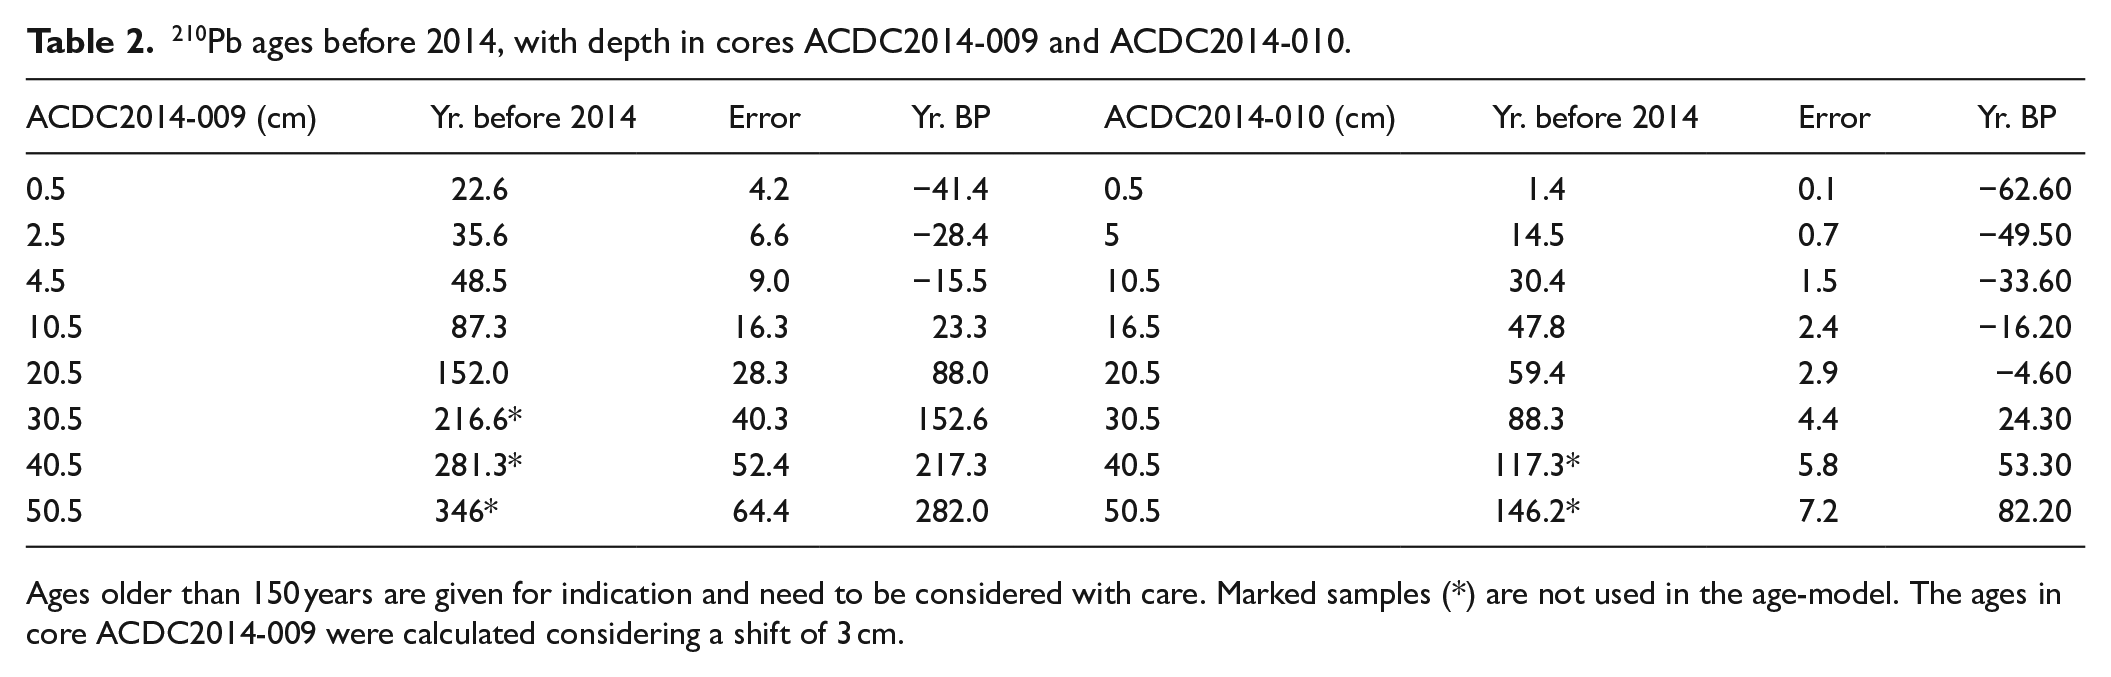
Ages older than 150 years are given for indication and need to be considered with care. Marked samples (*) are not used in the age-model. The ages in core ACDC2014-009 were calculated considering a shift of 3 cm.
Discussion
Combining CT scanning with wet sieving to quantify IRD
To investigate the variability of IRD concentrations in the sediment cores from Ata Sund, we focussed on the coarse sand fraction (150–2000 µm) and used its calculated F (further called IRD flux). This fraction, coarse sand, is likely too heavy to be carried within a glacier meltwater plume but is frequently transported within icebergs (Ó Cofaigh and Dowdeswell, 2001). While the trend over the full time period is the same in all fractions of the dataset, the fluctuations of the amplitudes is most evident in the coarser fraction (Figures 2c and 3c). No grading or sorting sequences indicating turbidites or other density flows are evident in the CT imagery or grain-size distribution data of any of the sediment cores. Additionally, the location of the core site is 2 km away from the steep shores on either side of the fjord (Figure 1b). Hence, we excluded non-glacial mass wasting and debris flows as potential sediment sources and concluded that the coarse sand deposition was confined to iceberg transport in the Ata Sund fjord system. In a nearby study by Desloges et al. (2002), 3 km from the ice margin of Eqip Sermia, a sediment core indicated a sedimentation rate of 0.6 cm per year. The sedimentation rate found in the ACDC2014-009 and ACDC2014-010 cores was approximately 1/3 of this (0.1–0.3 cm yr−1). This illustrates a sedimentation rate decrease with increased distance from the glacier front.
To support the wet-sieved IRD dataset from ACDC2014-009, we used a CT scanner to identify and quantify grains based on their high density. The number of grains >150 µm show the same trend (R = 0.6, p < 0.001) as the IRD flux calculated from the wet sieved grain sizes (Figure 6a and b). The large local maxima of IRD of the two datasets follow each other as well as the periods with lower IRD present. This indicates that the segmentation of high-density grains from the matrix was successful and that the number of grains above 150 µm can indeed be used to quantify IRD content in the sediment sequence. This approach takes all high-density grains above 150 µm into account when calculating the number of grains (IRD) for a sample, and it thus provides a more robust measure of IRD than a wet-sieved fraction interval, in our case 150 to 2000 µm, which excludes grains above 2000 µm. This may also explain the slight offset when comparing the CT dataset (number of grains cm−1) to the dataset based on wet sieving (IRD flux) (Figure 6). The IRD minima in core ACDC2014-009 are not as prominent in the CT dataset as in the wet-sieved dataset, and the wet-sieved IRD records do not display marked changes after 2000 CE; however, the CT-based IRD record shows an overall increase after the mid-1980s CE. This may indicate that the CT dataset has a higher sensitivity than the wet sieving dataset that also excludes clasts.
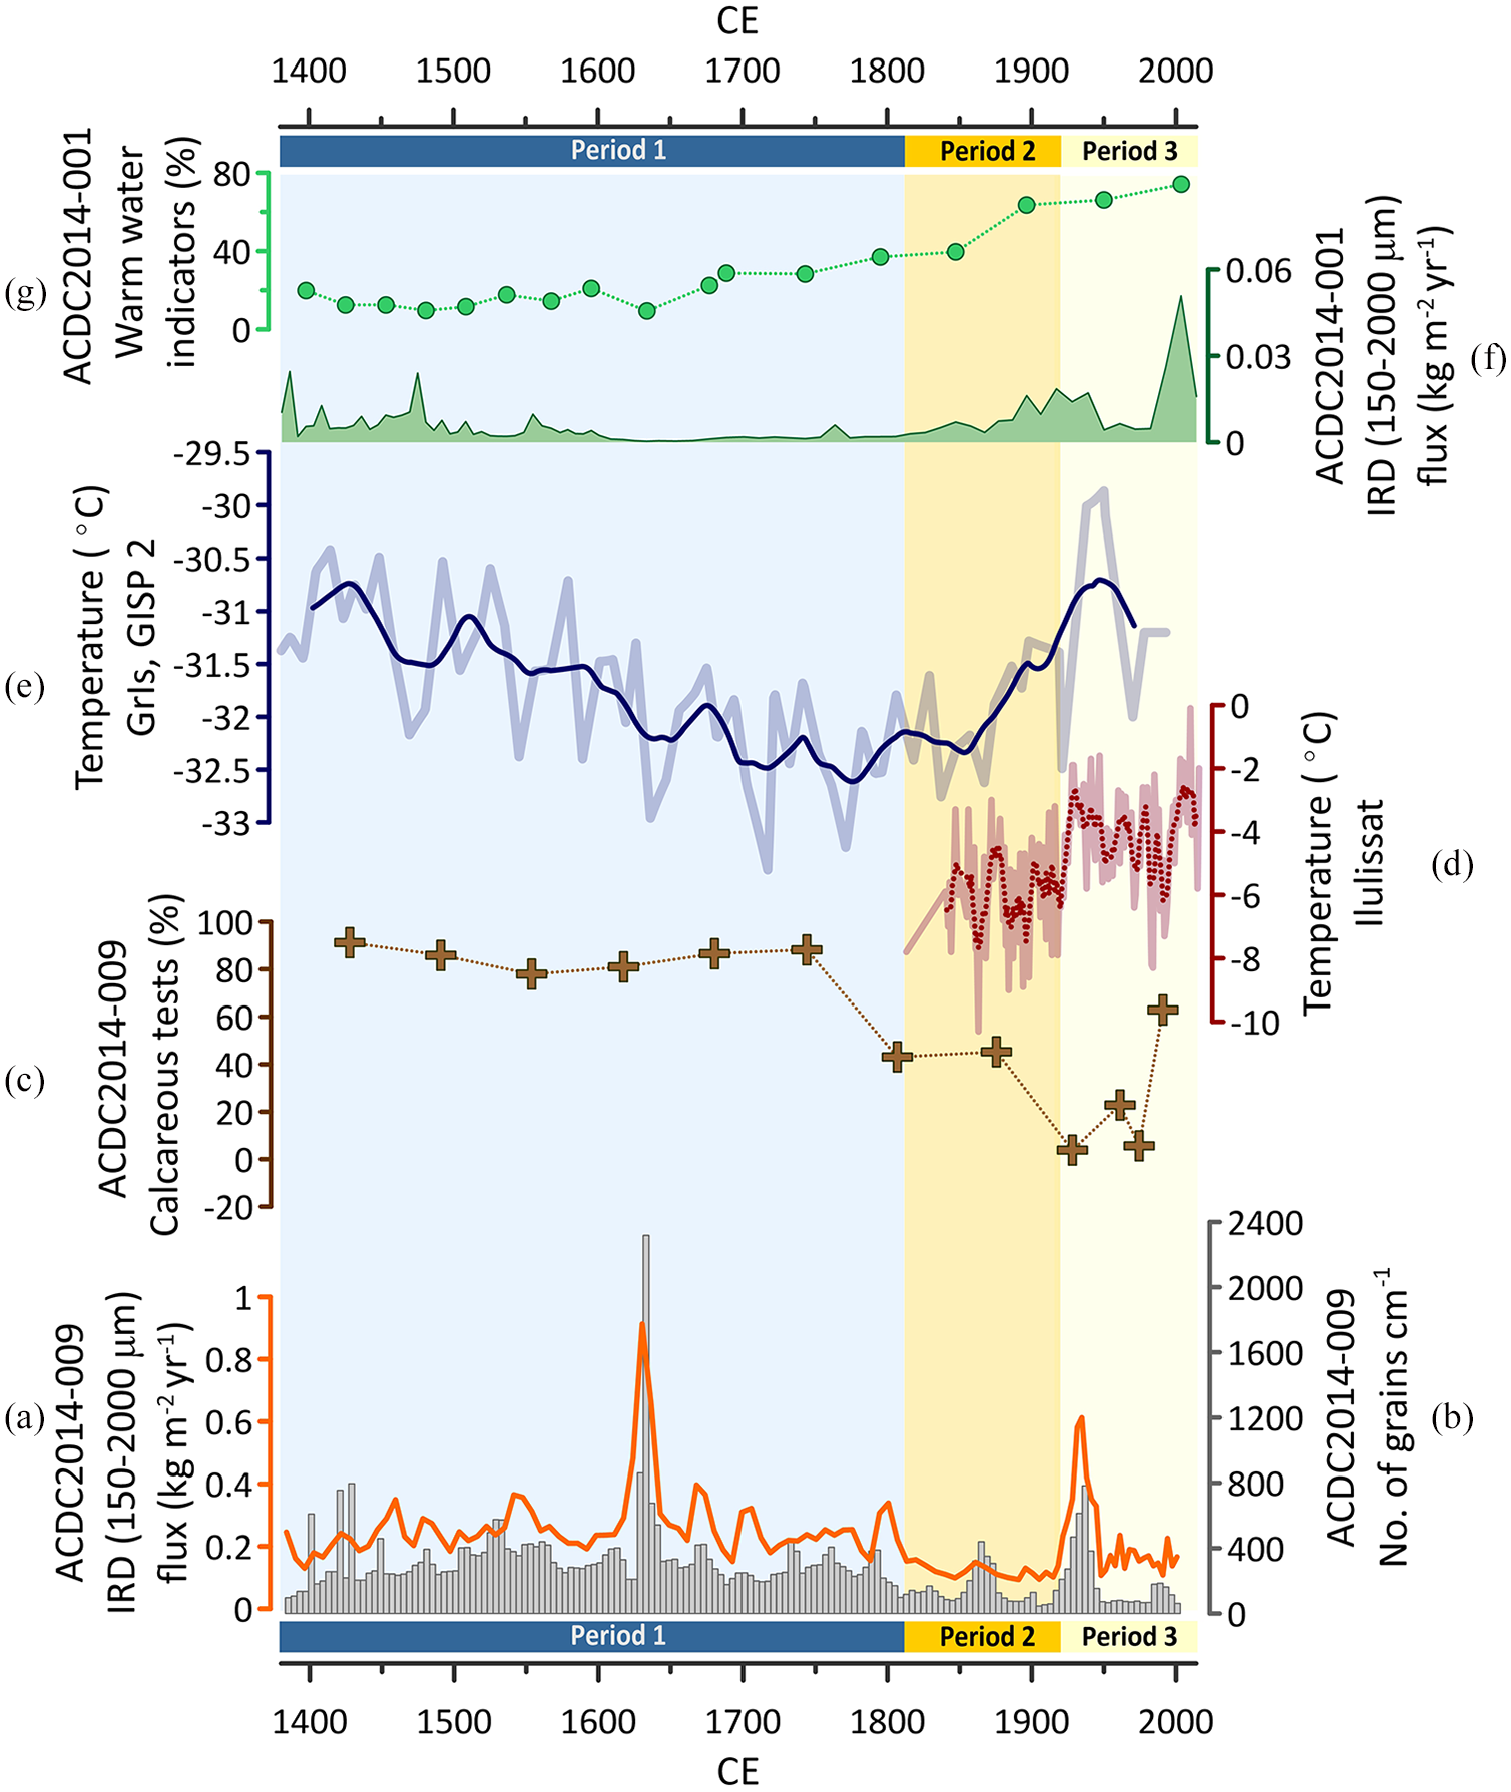
(a) IRD flux (kg m−2yr−1; wet sieving dataset) of core ACDC2014-009. (b) Number of grains cm−1 (CT dataset) in 4-year bins. (c) Calcareous tests of core ACDC2014-009. (d) Mean air temperature from Ilulissat with a 5-year running average (Cappelen, 2017). (e) Mean air temperature reconstructed from GISP2 on the Greenland ice sheet with a 45-year running average (Kobashi et al., 2011). (f) IRD flux (kg m−2yr−1) of core ACDC2014-001 from Jakobshavn (Wangner et al., 2018). (g) Warm water indicators from core ACDC2014-001 from Jakobshavn (Wangner et al., 2018).
In general, both cores show the same trend in IRD content, even though their individual peaks are not directly synchronous (Figure 7). The reason for the offset between the largest peaks in each core may be stochastic variability in IRD deposition, implying that the peaks are not recording the same events (Vermassen et al., 2019b). Alternatively, the peaks may be recording the same large iceberg rafting events, with the peak offset resulting from chronological uncertainties. For instance, there is an 80-year difference between the peak in ACDC2014-009 at 1630 CE and the corresponding peak in ACDC2014-010 at 1710 CE (Figure 7). The age-model has error ranges of ±120 and ±115 years for the respective depths (72 and 63 cm). Given these uncertainties in timing of the short-lived marked peaks, the IRD reconstruction is restricted to unravelling major trends.
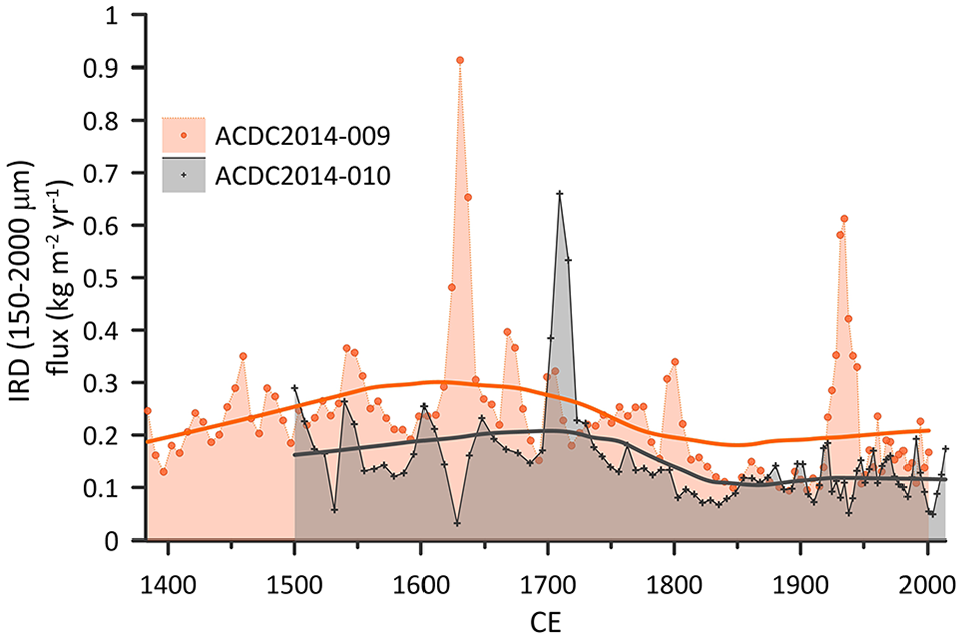
IRD flux (kg m−2yr−1) of ACDC2014-009 and ACDC2014-010. The fitted curves are a LOESS (locally estimated scatterplot smoothing) with 200 points, linear degree and a Gaussian span of 0.5 made in the Grapher software. The dots/crosses for respective cores indicate sample intervals of IRD.
Based on similar changes to the major trends of IRD flux in both cores, we divided the 600-year time series into three different periods (Figure 6). The earliest period from 1380 to 1810 CE (Period 1) showed the highest IRD flux (0–0.9 kg m−2 yr−1). Period 2, 1810 to 1920 CE, displayed low and more stable values of IRD (0.05–0.2 kg m−2 yr−1). The youngest period (Period 3) occurred between 1920 and 2014 CE. During this period, the IRD flux increased modestly and displayed higher variability compared to Period 2.
Tracing IRD to icebergs from Eqip Sermia and Kangilerngata Sermia
Satellite images of the 1980s and 1990s show sea ice and ice mélange covering Ata Sund during the winter months (USGS, 2018) with the potential to reduce the calving – and hence iceberg flux – from the glaciers (Amundson et al., 2010; Reeh et al., 2001). In the spring, sea ice seems to be prone to start breaking up north of the larger island in Ata Sund (close to Kangilerngata Sermia) and east of our core site. This would mean that Eqip Sermia is protected by sea ice and ice mélange during a longer time period each winter compared to Kangilerngata Sermia and the rest of the fjord. Icebergs calve from both Eqip and Kangilerngata Sermia and travel out of the fjord in all directions in Ata Sund when no sea ice or ice mélange is present. This is indicated when studying Landsat satellite images (USGS, 2018) from ice-free periods. Therefore, we interpret the origin of the IRD material found in the ACDC2014-009 and ACDC2014-010 cores to stem from these two glaciers. We cannot exclude IRD input from Torssukatak Fjord in the north or from Disko Bay south of Ata Sund. However, based on the shallow bathymetry between Ata Sund and Torssukatak Fjord (<100 m), sills close to Disko Bay and subject to prevailing ocean currents, it is most likely that Eqip Sermia and Kangilerngata Sermia are the main contributing glaciers of IRD at the core location. Kangilerngata Sermia presently produces almost twice as many icebergs as Eqip Sermia, therefore it is expected that this glacier has contributed more sediment to the core site.
Variability in WGC inflow to Ata Sund over the past 600 years
The vast majority of foraminiferal species identified within core ACDC2014-009 are cold and arctic water indicators (Lloyd et al., 2011). The species A. glomerata (Lloyd, 2006a; Lloyd et al., 2011; Perner et al., 2013a; Sheldon et al., 2016; Wangner et al., 2018), C. reniforme (Jennings et al., 2017; Lloyd et al., 2011; Perner et al., 2013a) and N. labradorica (Lloyd, 2006b; Wangner et al., 2018) are particularly related to the influence of AW in the WGC. In our dataset, they show overall low percentages with single values up to 10%. This leads to difficulties in calculating a robust ratio between warm- and cold-water indicators over time. Instead, the ratio between calcareous and agglutinated species in the sediment is used as an indicator of water properties. Colder arctic water usually dissolves more CO2, leading to an increase in carbonic acid (Lloyd et al., 2007; Vermassen et al., 2019a). Furthermore, the presence of sea ice can lead to the formation of CO2-rich brine waters and reduced bottom water ventilation (less O2), thereby causing corrosive bottom waters (Lloyd et al., 2007; Seidenkrantz et al., 2013). Calcareous foraminifera tests are usually more sensitive to corrosive bottom waters during the calcification process, but also for the post-mortem dissolution of tests.
From the beginning of the record in 1400 CE to ca. 1800 CE, high percentages of calcareous species indicate less corrosive Atlantic bottom waters. In previous literature S. feylingi has been associated with colder artic water (Lloyd, 2006b; Lloyd et al., 2011; Perner et al., 2011, 2013b; Wangner et al., 2018), but also as an indicator for high productivity, meltwater production and well stratified waters (Jennings et al., 2017; Sheldon et al., 2016). The dominant abundance of S. feylingi therefore might be indicative of generally cold conditions with high meltwater rates leading to increased stratification and nutrient supply in the fjord.
Between ca. 1800 and 1900 CE, the total amount of tests found in the sediment decreases dramatically and the assemblage changes to a predominantly agglutinated regime. On the other hand, the amounts of linings per gram of sediment increases, indicative of an increased dissolution of tests. Increased inflow of colder and more corrosive arctic waters, the increased formation of sea ice and a decreased meltwater input, might have let to these conditions.
At the end of the 20th century, the ratio of calcareous tests increases again to 60%, indicating a stronger AW component in the WGC. The long-term trends in the percentage of calcareous foraminifera and IRD are similar (Figure 6) and are characterised by decreased values in calcareous foraminifera and IRD after 1800 CE. The concurrent decrease in IRD and calcareous foraminifera during the nineteenth century indicates a strong impact of cold waters at the core site and an enhanced formation of sea ice in Ata Sund.
Considering that the bottom water temperature is a relative measure and the dataset does not give any information prior to 1380 CE, the temperature could have been relatively low during the time covered by this sediment core in comparison with the Medieval Climate Anomaly (800–1300 CE) (Ljungqvist, 2010), which was characterised by a relatively warm WGC in Disko Bay (Andresen et al., 2011; Perner et al., 2011; Wangner et al., 2018). Between 1800 and 1900 CE temperatures reached minimum values, leading to increased formation of sea ice, decreasing meltwater production and decreased nutrient supply.
Linking glacier changes with climate variability during the LIA
Our dataset covers most of the LIA (Period 1 and Period 2) and the start of the 20th century (Period 3). The oceanographic conditions in Disko Bay were characterised by cooling of the WGC during the LIA (Andresen et al., 2011; Perner et al., 2011; Wangner et al., 2018) and by the expansion of sea ice (Allan et al., 2018; Andresen et al., 2011; Kolling et al., 2018; Lloyd et al., 2007; Moros et al., 2006, 2016; Ribeiro et al., 2012; Seidenkrantz et al., 2008), thus reflecting the northern hemisphere cold spell prevalent at this time (Mann et al., 1999).
The high amount of IRD in the Ata Sund cores (Figure 6) from 1380 to 1810 CE (Period 1) may reflect that the Eqip Sermia and Kangilerngata Sermia glaciers were relatively advanced during the LIA. A shorter distance at this time between glacier margins and the core site, would allow the icebergs to retain more debris before transiting the core site. However, with between 3- and 4-km advanced glacial fronts during the LIA (Lüthi et al., 2016), the glaciers covered only 20% more of the total (approximate) 20-km distance between the present glacier margin position and the core site. This suggests that a longer glacier snout is not the only explanation for high amounts of IRD during Period 1. The fronts, especially of Eqip Sermia, were much wider when advanced during the LIA (Lüthi et al., 2016). A wider calving front would have resulted in more ice in contact with the glacial bed than today and consequently producing more sediment-rich icebergs. Combined, these effects could allow for more debris to be retained in and transported with the icebergs across the site. A larger front of Kangilerngata Sermia during the LIA would produce a more direct flow of icebergs towards the southwest (and northwest) due to the location of the large island and the topography in front of the glacier (Figure 1c). Finally, it may also be suggested that as the glacier moved behind a LIA moraine the icebergs were more prone to be trapped explaining a post-LIA decrease in IRD deposition at the core site.
A marine sediment core from Disko Bay (ACDC2014-001) (Figure 1b) suggested, on the basis of a very low IRD content, that Jakobshavn Glacier had a floating ice tongue from 1500 CE until the late 19th century (Wangner et al., 2018). This interpretation was made under the assumption that icebergs breaking of floating ice tongues contain almost no basal debris. This interpretation suggests that cold periods can result in glacier configurations that either decrease IRD deposition (glacier tongue) or increase IRD deposition (advanced nearby glacier with short iceberg travel distance) emphasising cautiously IRD record interpretation.
Shallow bathymetry by Eqip Sermia and formations (drumlins and glacial lineations) on the bed in front of Kangilerngata Sermia indicate that both glaciers were grounded during the time period covered by the two cores – 1400 CE to the present (Lüthi et al., 2016; Rignot et al., 2016) – and support the idea that high IRD during Period 1 was related to an advanced glacier position. At the end of Period 1, around 1800 CE, when the glaciers were advanced, their release of meltwater into the fjord would have pushed the WPW observed by Beaird et al. (2015) further out in Ata Sund, away from the core location. The colder PW would take up more space, as well as the cold surface top layer, and could explain the lowering of the bottom water temperature in Ata Sund as indicated by the decrease in calcareous tests in the foraminiferal analysis (Figure 6c).
During 1810 to 1920 CE (Period 2), environmental conditions changed in Ata Sund. IRD deposition and bottom water temperatures decreased, while the air temperature (according to the GISP2 ice core; Kobashi et al., 2011) slowly started to increase (Figure 6). This increase is also apparent in the annual average air temperature record (Figure 8e) from Ilulissat (Figure 1b) approximately 60 km south of the core site (Cappelen, 2017). The increasing air temperatures would increase glacial runoff and result in a colder surface layer in the fjord (Rignot et al., 2010). We suggest that the observed reduction in IRD at this stage indicates that the marine-terminating glaciers experienced a reduced calving rate due to a retreat of WPW, resulting in colder bottom water temperatures and potentially also a colder surface layer from meltwater. Lower ocean temperatures would, in addition, create more sea ice and ice mélange, preventing calving and icebergs from reaching the core site 20 km from the glacier front. Moreover, cold surface water would allow icebergs to retain IRD rather than deposit it.
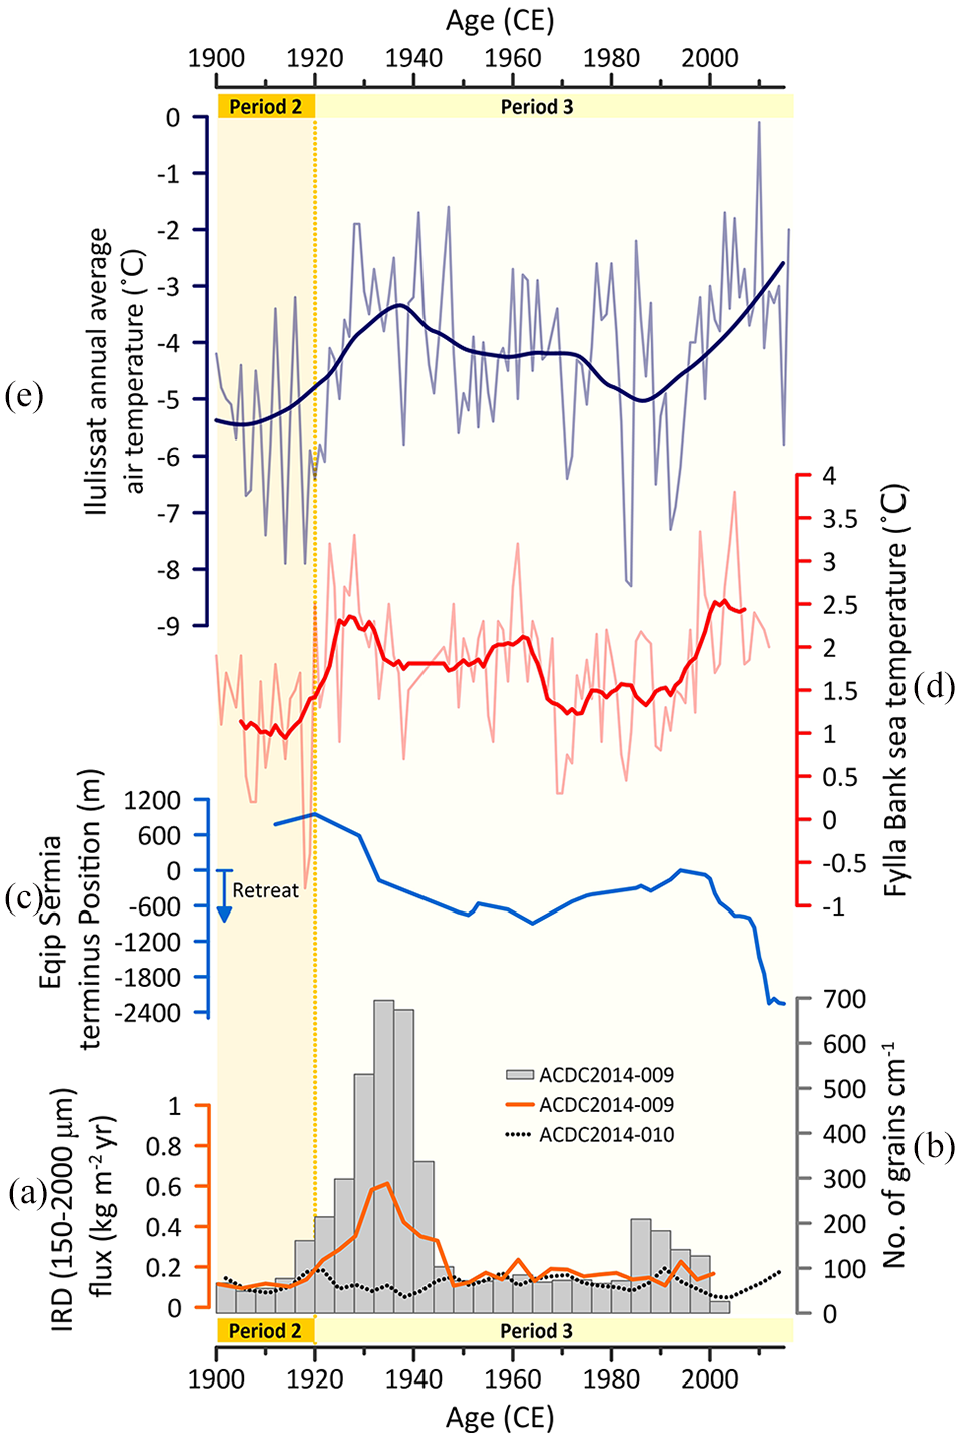
(a) Twentieth-century IRD flux (kg m−2yr−1; wet sieving dataset) of cores ACDC2014-009 and ACDC2014-010 from Ata Sund. (b) Number of grains cm−1 (CT dataset) in 4-year bins. (c) Retreat of Eqip Sermia since 1912 CE (Lüthi et al., 2016). (d) Fylla Bank sea temperatures (Smed, 1978, updated in Ribergaard, 2013; Ribergaard et al., 2008). (e) Annual average air temperature of Ilulissat (Cappelen, 2017).
The cooling of the bottom water temperatures in Ata Sund during the final stage of the LIA contrasts with the foraminifera-based WGC reconstruction from Disko Bay relatively close to Ata Sund (Figure 1b). This reconstruction shows that the LIA cooling of the WGC at this location culminated between 1400 and 1650 CE and was followed by warming during the final stage of the LIA (Wangner et al., 2018) (Figure 6). This suggests that, locally, glacial meltwater production can influence bottom water temperature. Moreover, WPW could be hindered, that is, trapped in Disko Bay due to the sill at the entrance of Ata Sund.
Twentieth-century climate and glacial changes
Observations and previous studies show that the 1920 to 2014 CE (Period 3) period was marked by the rapid retreat of both Eqip Sermia and Kangilerngata Sermia (Catania et al., 2018; Lüthi et al., 2016). Both glaciers have retreated several km until present, with synchronous retreat patterns occurring at least during the past three decades (Catania et al., 2018). Specifically, observational data from Eqip Sermia show that after 1920 there was a period of retreat (over 1.3 km) until 1960 CE. Eqip Sermia made a small advance until 1990 and then remained stable until the early 2000s, around which time the current, ongoing rapid retreat started (Figure 8) (Lüthi et al., 2016). Although IRD increased slightly during the 20th century, the values do not match the high values recorded during Period 1. As was also discussed previously this indicates that as the glaciers retreat further inland and their distance to the core location increases. Hence, the glaciers decrease in size and may have produced fewer icebergs, explaining the lower IRD deposition at the core site. Moreover, the lower IRD deposition may also be due to icebergs ultimately grounding on newly uncovered, shallower ocean floor in front of the glacier margin. It has also recently been shown that Eqip Sermia has changed its calving style, producing smaller icebergs, in the last decade (Walter et al., 2019). Smaller icebergs, as compared to larger icebergs, melt away faster. This means they may have melted away during transport and never reach the core site to deposit debris.
The majority of Greenland’s glaciers underwent a marked retreat in the 1930s to 1940s from their advanced position during the LIA (Bjørk et al., 2012; Kjær et al., 2012). This retreat is reflected in increased iceberg calving resulting in increased IRD deposition in fjords around Greenland, notably Sermilik Fjord by Helheim Glacier in southeastern Greenland (Andresen et al., 2012), Upernavik Fjord in northwestern Greenland (Vermassen et al., 2019b) and Disko Bay by Jakobshavn Glacier (Wangner et al., 2018). Similarly, in Ata Sund, the ACDC2014-009 core records a marked peak in IRD around 1930 CE, at a magnitude similar to that of a peak that occurred during the 17th century. In core ACDC2014-010, a minor maximum was observed (Figure 7). The sediment layer representing the peak found in ACDC2014-009 was not graded and thus not interpreted as deposited by an overturning iceberg, turbidite or debris flow event. Considering that Eqip Sermia reached its LIA maximum glacier extent in 1920 CE (Desloges et al., 2002; Lüthi et al., 2016), the peak in IRD at this time may be linked to substantial calving activity during the retreat from the advanced position in 1920 CE (Figure 8). Indeed, Eqip Sermia advanced 400 m from the time of the first observation in 1912 to 1920 CE (Lüthi et al., 2016).
The early 20th century Greenland glacier retreat occurred synchronously with increased air temperature in the northern hemisphere and above the Greenland ice sheet (Kobashi et al., 2011) (Figure 6). A synchronous increase in WGC temperature was also found by Fylla Bank, which is located in southwest Greenland outside of Nuuk (Figure 1a) (Smed, 1978, updated in Ribergaard, 2013; Ribergaard et al., 2008), and in proxy reconstructions from sediment cores from Disko Bay (Lloyd et al., 2011), Upernavik Fjord (Vermassen et al., 2019b) and Sermilik Fjord (Andresen et al., 2014). This suggests an overall marked climatic warming around Greenland, one which influenced glacier retreat and resulted in increased IRD deposition.
However, climatic warming in the 20th century contrasts with the lowest bottom water temperatures in Ata Sund recorded at this time. At the start of Period 3, the glaciers were retreating rapidly, and we suggest that this occurred as a response to the increased air temperature and to the warming of the northern hemisphere in general. Since a retreat would result in calving and meltwater inflow to the fjord, this would at first decrease the sea temperature and push WPW and potentially also AW out towards Disko Bay. Consequently, sea and bottom water temperatures would increase as the glaciers’ meltwater input started to reduce in response to the glaciers’ reduced size as well as to decreased sea ice presence. The last data point of calcareous tests (%) in Period 3 may indicate a rapid increase in relative bottom water temperatures. Although speculative, this could mark the reappearance of WPW and AW by the core location, water masses which are presently observed in the region (Beaird et al., 2015) and which may be linked with the rapid glacial retreat after the 1980s. This retreat is clearly visible in the CT-based IRD record (Figure 8b) and concurs with a rapid increase in Fylla Bank sea temperatures between 1980 and 2000 CE, supporting the notion that climate warming in the northern hemisphere caused glacier retreat and an increase in IRD flux. A similar trend to that which occurred in the Fylla Bank record can be seen in the annual air temperature record from Ilulissat (Figure 8e). The pattern of rapidly increasing temperatures before glacial advance followed by rapid glacial retreat is also evident before the peak in 1930 CE. Comparing the IRD peak event in 1930 to 1980 CE, the 1980 CE event record a smaller amount of IRD and have a smaller glacial advance than the 1930 CE event. This may be due to that the glacier had already retreated before the event in 1980 CE occurred.
Conclusion
A record of iceberg rafting in the Ata Sund fjord system, in western Greenland, from 1400 to 2014 CE has been presented together with a reconstruction of relative variability in bottom water temperatures. The records are based on grain-size variability and IRD (sediment) fluxes from two sediment cores as well as from foraminiferal assemblage variations from one sediment core. Part of the interpretation was based on the use of high-resolution CT scanning for identifying IRD. Compared to the sieving method for quantifying IRD, CT scans offer higher sensitivity, higher resolution and efficiency, and they have the additional advantage of being a non-destructive method.
Based on IRD variability between 1380 and 2014 CE, the dataset was divided into three distinctive periods. Period 1, from 1380 to 1810 CE, corresponds to the local culmination of the LIA with advanced glaciers and relatively high calving rates. Period 2, from 1810 to 1920 CE (the end of the LIA), comprises a glacial standstill and low iceberg production, and thus low IRD flux. The increase in calcite dissolution and the low amount of foraminifera in the sediment indicates an increase of Artic water influence in Ata Sund. Concurrently, bottom water temperatures would decrease. This was possibly initiated by the high amount of meltwater and calving occurring in Period 1 as well as by the abundance of sea ice and ice mélange during the cold winter seasons of the culminating LIA. Period 3, lasting from 1920 to 2014 CE, was marked by glacial retreat according to previous observations of glacier front positions. Yet, we do not observe a marked increase in IRD at the core site, except for a minor increase around 1930, in response to this known longer term retreat. We hypothesise that the increased distance from the glaciers to the core location combined with a possible change in iceberg trajectories may be responsible for this pattern. Additionally, reduced glacier size would mean less ice in contact with the glacial bed and a possible change in calving style. The high retreat caused a high inflow of meltwater that may have pushed the warmer water masses out of Ata Sund. As the retreat stabilised and the glaciers reduced in size at the end of Period 3, the warmer water masses could re-enter the fjord and allow for sea and bottom water temperatures to increase.
Results from Ata Sund show that the interpretation of IRD records requires a consideration of the physical processes involved in glacier and fjord settings. The variability of IRD depends on multiple factors, such as calving flux and iceberg type, iceberg travel distance, sea ice, water column stratification, melting time of icebergs (sea and air temperature), bathymetry and fjord width. Therefore, such factors should be considered when interpreting IRD variability in sediment cores. Indeed, interpretations from Ata Sund indicate that a relative increase in IRD can imply both glacial advance (increased IRD in response to advanced LIA margin) and glacial retreat (increased IRD in response to retreat of the 1930s glacier margin).
Footnotes
Funding
The author(s) disclosed receipt of the following financial support for the research, authorship and/or publication of this article: This work was supported by the VILLUM Foundation, which funded the project, ‘Past and future dynamics of the Greenland ice sheet: What is the ocean hiding?’ (grant no. 10100), and by the National Infrastructure EARTHLAB (NRC 226171) at the University of Bergen. We thank the crew – Eric, Otto and Pavia of the R/V Porsild – as well as the scientists – Kerim Nisanglociu, Rebecca Jackson, Nick Beaird and Fiamma Straneo – who participated in the ACDC 2014 summer school to retrieve the sediment cores. Thank you to Martin Miles for his valuable input on the interpretation, and to Florian Fiebig for language improvement and writing skill development.