
Abstract
Wildfire is a ubiquitous disturbance agent in subalpine forests in western North America. Lodgepole pine (Pinus contorta var. latifolia), a dominant tree species in these forests, is largely resilient to high-severity fires, but this resilience may be compromised under future scenarios of altered climate and fire activity. We investigated fire occurrence and post-fire vegetation change in a lodgepole pine forest over the past 2500 years to understand ecosystem responses to variability in wildfire and climate. We reconstructed vegetation composition from pollen preserved in a sediment core from Chickaree Lake, Colorado, USA (1.5-ha lake), in Rocky Mountain National Park, and compared vegetation change to an existing fire history record. Pollen samples (n = 52) were analyzed to characterize millennial-scale and short-term (decadal-scale) changes in vegetation associated with multiple high-severity fire events. Pollen assemblages were dominated by Pinus throughout the record, reflecting the persistence of lodgepole pine. Wildfires resulted in significant declines in Pinus pollen percentages, but pollen assemblages returned to pre-fire conditions after 18 fire events, within c.75 years. The primary broad-scale change was an increase in Picea, Artemisia, Rosaceae, and Arceuthobium pollen types, around 1155 calibrated years before present. The timing of this change is coincident with changes in regional pollen records, and a shift toward wetter winter conditions identified from regional paleoclimate records. Our results indicate the overall stability of vegetation in Rocky Mountain lodgepole pine forests during climate changes and repeated high-severity fires. Contemporary deviations from this pattern of resilience could indicate future recovery challenges in these ecosystems.
Introduction
Wildfire is a ubiquitous disturbance agent in lodgepole pine (Pinus contorta var. latifolia) forests of western North America, where fire regimes are characterized by infrequent, stand-replacing events with average return intervals typically greater than a century (Baker, 2009; Veblen et al., 1991; Whitlock et al., 2003). Over the past several decades, many of these forests have experienced an increase in wildfire frequency due to increasingly warm, dry conditions and subsequently high fuel aridity (Abatzoglou and Williams, 2016; Dennison et al., 2014; Westerling, 2016). These same warm, dry climate conditions are also making it more stressful for post-fire tree establishment and survival in subalpine forest (Andrus et al., 2018; Harvey et al., 2016; Stevens-Rumann et al., 2018).
Together, recent changes in fire activity and climate may be eroding the longstanding resilience that subalpine forests have shown to high-severity fire (Dunnette et al., 2014; Minckley et al., 2012), through reduced post-fire seed availability, lower nutrient availability, and lower establishment and survival rates of conifer seedlings (Andrus et al., 2018; Dale et al., 2001; Hansen and Turner, 2019; Turner et al., 2019). Such changes could reflect an emergence of new post-fire vegetation trajectories, suggesting altered vegetation composition, including potential forest loss (Davis et al., 2018; Hansen et al., 2018; Johnstone et al., 2016). While much is understood about how lodgepole pine forests respond to disturbances from studying contemporary landscapes (e.g. Kashian et al., 2013; Romme et al., 2011; Turner et al., 2016) it is unclear if and how these dynamics vary with changing climate and fire activity. Post-fire vegetation change after recent wildfires in subalpine forests, for example, will ultimately take decades to unfold, making it difficult to distinguish, at least in the short-term, slower-than-average post-fire recovery from true post-fire vegetation transformations (Davis et al., 2019).
One approach to understanding the long-term interactions among climate, fire, and vegetation change is to use paleoecological records from lacustrine sediments (Heinselman and Wright, 1973; Whitlock et al., 2010; Whitlock and Bartlein, 2003). Lacustrine sediment cores contain evidence of both past fire events and vegetation in the form of microscopic charcoal fragments and fossilized pollen grains (Bennett and Willis, 2001; Birks et al., 2012; Brunelle and Whitlock, 2003; Whitlock and Larsen, 2001). When paired with radiocarbon-derived age chronologies, lacustrine sediment cores can be used to reconstruct long-term variation in both vegetation and fire over periods of changing climate. Paleoecological reconstructions in the Rocky Mountains have characterized the dynamics of vegetation communities (Anderson et al., 2015; Calder and Shuman, 2017; Jiménez-Moreno et al., 2011), quantified past fire regimes (e.g. Briles et al., 2012; Calder et al., 2015; Carter et al., 2017; Higuera et al., 2014; Millspaugh et al., 2000; Whitlock et al., 2011) assessed the impacts of fire on biogeochemical cycling (Dunnette et al., 2014; Leys et al., 2016; McLauchlan et al., 2014), and captured long-term changes in vegetation following glacial retreat (Brunelle et al., 2005; Lynch, 1996; MacDonald et al., 1991; Minckley et al., 2012). However, due in part to effort required to produce high-resolution pollen records, less is known about the decadal- to centennial-scale relationships between fire and vegetation in subalpine forests, particularly across periods of late-Holocene climate change (but see Minckley et al., 2011; Minckley and Long, 2016; Stegner et al., 2019).
The purpose of this study is to assess the cumulative and repeated effects of wildfire on subalpine forest vegetation over the past 2500 years, a period spanning well-documented millennial-scale changes in paleoclimate. This work adds to an existing high-resolution fire history record based on charcoal accumulation (1 sample per 4 year) and a low-resolution vegetation history record based on pollen composition (1 sample per century) from Chickaree Lake (Dunnette et al., 2014), located in a subalpine forest watershed in Rocky Mountain National Park, Colorado, USA. We developed a high-resolution pollen record (1 sample per 50 years) to address new questions focused on understanding post-fire successional-scale vegetation changes over decades and long-term millennial-scale vegetation change. Specifically, we address two main objectives: (1) to characterize post-fire, decadal-scale vegetation change after repeated fire events; and (2) to characterize millennial-scale changes in forest composition over the past 2500 year and compare the timing of these changes to existing paleoclimate reconstructions.
Study area
Chickaree Lake is located west of the Continental Divide in Rocky Mountain National Park, Colorado, USA, at 40.3342°N, 105.8411°W (Figure 1). The lake is 2,830 m above sea level and surrounded by an even-aged stand of lodgepole pine (Pinus contorta var. latifolia Douglas ex Loudon) dating to a 1782 CE (common era) stand-replacing fire (Sibold et al., 2007). Less dominant conifers include Engelmann spruce (Picea engelmannii Parry ex Engelm.) and subalpine fir (Abies lasiocarpa (Hook.) Nutt.) at higher elevations with a mixed understory including Canada buffaloberry (Sheperdia canadensis), rose (Rosaceae), and sagebrush (Artemisia). Chickaree Lake is a small (1.5 ha), deep (7.9 m) lake in a ~31-ha watershed with an ephemeral inlet and outlet. The well-drained sandy soils surrounding the lake are derived from granite, gneiss, and schist and are covered by a thin duff/litter layer (US Department of Agriculture NRCS Soil Survey Staff, 2006). The fire regime over the past several centuries near Chickaree Lake is characterized by infrequent high-severity crown fires (e.g. mean return intervals of 100–300 year), associated with severe seasonal drought (Sibold et al., 2006). The climate in nearby Grand Lake (8 km from the lake) is continental, with average January and July temperatures of −8.5 °C and 14 °C, and the average total annual precipitation is 482 mm, with an average annual snowfall of 3503 mm (Western Regional Climate Center 1940–2016 observations).
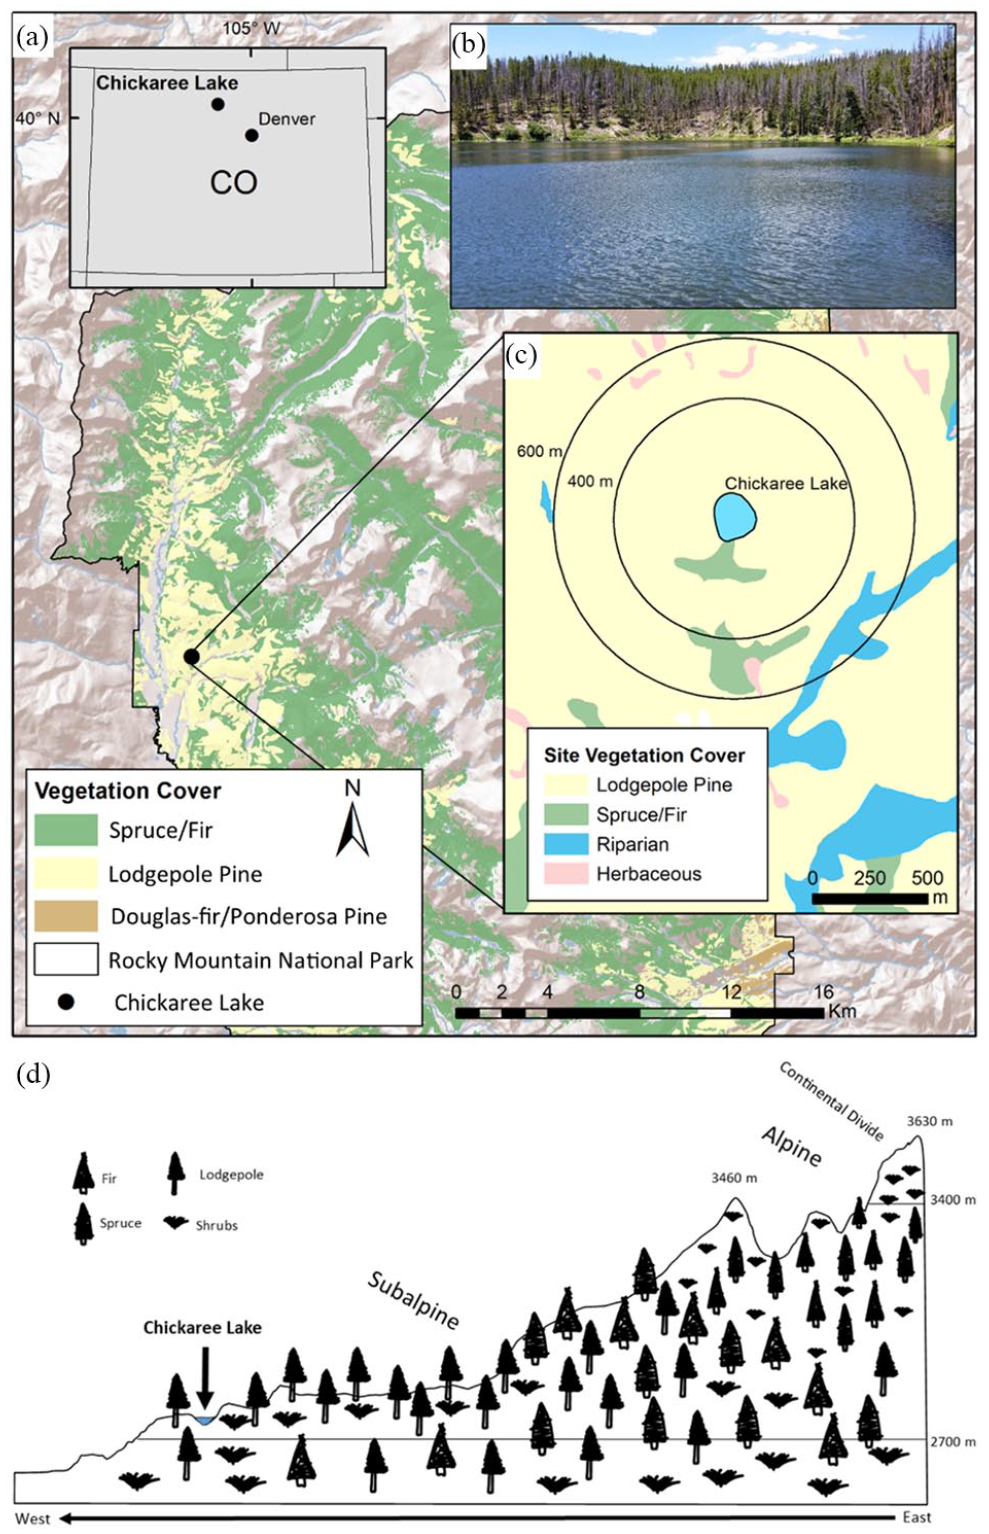
(a) Site map of Chickaree Lake in Rocky Mountain National Park, USA. (b) Site photograph of Chickaree Lake. (c) Circular buffers around the lake perimeter indicate distances of 400 m and 600 m, which roughly correspond to pollen source areas in this landscape (Sugita, 1994). (d) Vegetation community diagram of Chickaree Lake. Map data source: Rocky Mountain National Park and the U.S. Bureau of Reclamation Remote Sensing and Geographic Information Group (USBR/RSGIG). Vegetation diagram produced following data from Peet 1981 and Rocky Mountain National Park vegetation GIS dataset.
This study focuses on vegetation change over the past 2500 years, a period characterized by two centennial-scale variations in climate observed in continental paleoclimate records: the Medieval Climate Anomaly (MCA) from ~700 to 1000 years BP when Northern Hemisphere temperatures were commonly higher than the average of the past 2000 year, and the Little Ice Age (LIA) when climates shifted toward lower temperatures from ~650 to 250 cal year BP (Mann et al., 2009; Trouet et al., 2013). However, these events were not uniformly expressed across all regions; for example, the LIA may be better characterized in the Colorado Rockies as a period of wet hydroclimatic conditions rather than large temperature anomalies (Cook et al., 2004; Neukom et al., 2019; Schoennagel et al., 2005; Viau et al., 2012). The period from 2500 year BP to present also captures multiple fire events previously documented in the charcoal record (Dunnette et al., 2014).
Methods
Existing data from Chickaree Lake
This study adds to previous work from Chickaree Lake published by Dunnette et al. (2014) which included a high-resolution record of fire history (i.e. 4 year per sample on average, with continuous sampling for charcoal). Dunnette et al. (2014) also includes a lower resolution record of vegetation change based on fossil pollen, with discontinuous sampling at intervals ranging from 20 to 275 year. The Chickaree Lake record is based on two parallel, overlapping sediment cores that were collected from 7.9-m water depth in August 2006 (top sediments, collected with a polycarbonate tube) and August 2010 (lower sediments, collected with a modified Livingstone piston corer; (Wright et al., 1984)). The record extends back to 6200 calibrated years before present (hereafter “cal year BP”) and has a high sedimentation rate, averaging 0.15 cm/year. The well-established chronology is based on 25 14C dates and 13 210Pb measurements (Dunnette et al., 2014), although here we only utilize the past 2500 year of the record. The high sedimentation rate and small surface area of Chickaree Lake make it an ideal lake to resolve local changes in vegetation composition (e.g. within <1-km radius) over successional time scales (Fall, 1992; Sugita, 1994).
Charcoal data and fire history
Full details of charcoal analyses are described by Dunnette et al. (2014) and summarized briefly here. Sediment subsamples of 1.5–3 cm3 were prepared for charcoal analysis at contiguous 0.5-cm intervals. Charcoal particles were counted under a microscope and converted to charcoal accumulation rates (CHAR) based on the chronology. The CHAR data were then analyzed using CharAnalysis (Higuera et al., 2009) to identify peaks in charcoal, which were interpreted as fire events. Magnetic susceptibility (MS) was used as a proxy for erosion in lake catchments and was measured for each contiguous sample using a Bartington MS3 meter and MS2E core logging sensor (Bartington Instruments, Oxford, UK). The MS record was analyzed in a similar fashion as the CHAR record to identify statistically distinct peaks in MS, which were interpreted as erosion events. Dunnette et al. (2014) use the CHAR and MS data to define two types of fire events: “high-severity catchment fires,” CHAR peaks that occurred within 10–20 year of a MS peak; and “lower severity/extra-local fires,” all other CHAR peaks, not coinciding with a MS peak. The distinction reflects both on the spatial location of fire and the potential severity of past fires, which cannot be disentangled based on CHAR and MS records alone. Importantly, Dunnette et al. (2014) interpret all fire events as likely being stand-replacing, crown fires, such that “lower severity” does not imply “low severity” surface fire; thus, even “lower severity/extra-local fires” are expected to have killed a majority of trees within the pollen source area of the lake.
Over the past 2500 year, four high-severity catchment fires and 14 lower severity/extra-local fires were identified in the Chickaree Lake charcoal record (Dunnette et al., 2014). The most recent charcoal peak occurred c. 161 cal year BP, approximately coincident with the 1782 CE (i.e. 7 year after) stand-replacing fire identified through dendrochronology (Sibold et al., 2007).
Pollen analysis
Dunnette et al. (2014) analyzed pollen composition in 1 cm3 subsamples taken at an average of 12-cm intervals (~94 years between consecutive samples) for the upper 360 cm of the core, which covers the date range of this study. We increased the temporal resolution for the past 2500 years by adding 23 new samples which increased the sampling resolution to an average of 7-cm intervals (~50 years between consecutive samples). The archived wet sediment (1 cm3) was processed through acid digestion following standard methods modified from Faegri and Iversen (1975). A known marker of Lycopodium spores was added to each sample to act as an exotic tracer to calculate pollen concentrations. Pollen residue was suspended in silicon oil, and pollen grains were identified at 400 x magnification to a terrestrial pollen sum of 256–432 (average 318). Pollen grains were identified to the lowest taxonomic level possible using existing pollen keys (Kapp, 1969; McAndrews et al., 1973). Pinus pollen was often too degraded to differentiate between haploxylon and diploxylon types, so all Pinus pollen grains and pairs of Pinus bladders were combined and classified as “Pinus undifferentiated.” Since the lake is surrounded by lodgepole pine today, which is diploxylon type, and almost all Pinus pollen grains identifiable to the subgenus level were diploxylon (i.e. 98%), we assume that the vast majority of Pinus pollen is diploxylon type.
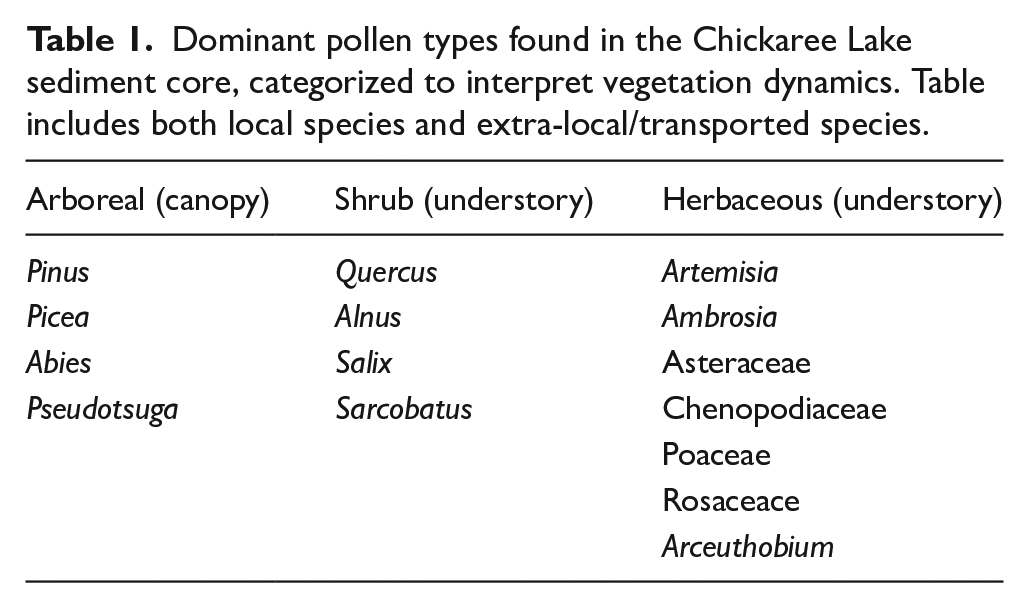
Pollen counts were converted to percentages by dividing the raw counts of individual pollen types by the sum of the counts of terrestrial pollen in each sample, excluding unknown, indeterminate, and wetland pollen types. To aid in interpretation of vegetation community response to wildfire, both local and extra-local pollen taxa were binned into three categories: arboreal (canopy), shrub (understory), and herbaceous (understory) (Table 1). The distinction between arboreal and shrub species is based on their functional roles within a lodgepole pine ecosystem: generally, if a plant species is small (<15 DBH), and woody, it was classified as a shrub. Arceuthobium, a mistletoe species that targets lodgepole pine, was classified as herbaceous/understory because while it does affect lodgepole pine health and is found in the canopy, it is ecologically classified as a perennial herbaceous species (Hawksworth and Johnson, 1989; Hawksworth and Wiens, 1994). Pollen assemblages were summarized using the most abundant taxa within the record, defined as pollen types that occurred in 40% of the samples (i.e. 21 of 52 samples) and had an abundance of >1% in any given sample. The threshold of inclusion was reduced from the standard 5% to 1% abundance per sample to include rare taxa, as Pinus is a prolific producer of pollen and its high abundances can mask shifts in minor taxa (Fall, 1992; Higuera et al., 2014; Minckley et al., 2008).
Dominant pollen types found in the Chickaree Lake sediment core, categorized to interpret vegetation dynamics. Table includes both local species and extra-local/transported species.
Statistical analysis of pollen data
We analyzed the pollen data to characterize changes over two time scales. First, millennial-scale changes in pollen assemblages were characterized and then later compared to existing paleoclimate records. Second, short-term, decadal-scale changes in pollen assemblages and select taxa were analyzed specifically in relation to fire events, with the goal of quantifying fire-related vegetation change.
To characterize millennial-scale dynamics in vegetation composition, we used stratigraphically constrained cluster analysis and non-metric multidimensional scaling (NMDS) to identify distinct changes in pollen composition. A stratigraphically constrained cluster zone analysis was conducted using CONISS (Grimm, 1987), based on the pollen types that occurred in 40% of the samples (i.e. 21 of 52 samples) and had an abundance of >1% in any given sample and was carried out through the rioja package (Juggins, 2015) in the R programming platform. This analysis is based on the squared chord distance dissimilarity measure, a common distance metric used when working with pollen data (Gavin et al., 2003; Overpeck et al., 1985; Seddon et al., 2015). The number of optimal zones to include was identified through the use of a broken-stick model, which is used to test the significance of each stratigraphically constrained cluster analysis split (Seppä and Bennett, 2003). The resulting zonation was used to describe the dominant long-term (centennial to millennial) patterns in the pollen data.
We complemented the stratigraphically constrained cluster CONISS analysis by using NMDS to reduce the dimensionality of the dataset to aid us in interpreting vegetation change (Legendre and Birks, 2012). This analysis was carried out using the vegan package in R (Oksanen et al., 2018); prior to analysis, distances were derived using the Bray-Curtis measure, consistent with methods used by Crausbay et al. (2017). Shrub pollen types from lower elevations with long ranges of transport (i.e. Sarcobatus, Quercus, Salix) (Lynch, 1996) were excluded from analysis. Dimensions were added only if they reduced the final “stress” (goodness-of-fit) by 5% or more and the analysis was fit to k=2 axes. The relationship between the pollen abundance of individual taxa and the NMDS axis scores was quantified through Pearson correlations (p-value <0.5), and only taxa with r > 0.3 for either the first or second axis were presented in ordination space. To compare the NMDS scores of pollen samples to fire activity, we conducted significance tests by using a bootstrapping permutational multivariate analysis of variance test (perMANOVA) (Anderson, 2017) from the vegan package in R (Oksanen et al., 2018). This test used the post-fire and non-fire pollen sample classification and the time-since-fire to determine if there was a significant influence of time-since-fire on sample scores in NMDS space. Time series of the NMDS axis 1 and 2 were also displayed to aid in the interpretation of the pollen assemblages.
To characterize fire-related changes in the pollen record, we classified all samples into two categories, based on their relationship to identified fire events. Pollen samples were classified as “post-fire” if they came from a sample that was within the range of 10 year prior to an identified charcoal peak to 75 year following the identified charcoal peak. The 10-year window preceding charcoal peaks was used to account for possible mixing of the charcoal peak itself, acknowledging that there can be a lag between fire event and the associated charcoal peak. Pollen samples were classified as “non-fire” if they were outside of the temporal window. The 75-year post-fire buffer accounts for post-fire successional recovery, as seen in the biogeochemical proxies at Chickaree Lake (e.g. %C, %N, δ15N) (Dunnette et al., 2014).
To address decadal-scale changes in pollen, we quantified post-fire vegetation changes using pollen ratios and a rate-of-change analysis. To interpret post-fire shifts in vegetation composition, we used two ratios that reflect impacts of fire on the relative abundance of overstory and understory vegetation. We use the ratio of arboreal to non-arboreal pollen grains (AP:NAP) to represent the ratio of overstory to understory taxa contributing to a pollen sample, calculated as [a - b] / [a + b], where a is the sum of arboreal pollen taxa counts (summarized as “canopy” in Table 1) and b is the sum of non-arboreal pollen taxa counts (summarized as “understory” in Table 1). It is expected that understory species increase more quickly after fire, such that, as found in other studies in the region, a post-fire sample might have higher ratios of understory to overstory pollen. Higher ratios indicate higher abundances of overstory species, including Pinus, Picea, and Abies, which we interpret as indicative of forest dominance around Chickaree Lake. The ratio of conifer pollen to local understory pollen (conifer:LNAP) has also be useful in subalpine forests to offer insight about local-scale disturbance dynamics (Calder et al., 2019; Lynch, 1996). For example, it is expected that after a fire, conifer pollen would decrease and allow for increases in pollen production from local understory components. The conifer:LNAP ratio was calculated using the same approach above, where a is the sum of Pinus, Picea, and Abies pollen grains and b is the sum of Artemisia, Asteraceae, Chenopodiaceae, Poaceae, and Rosaceae pollen grains. Higher values indicate higher amounts of arboreal pollen. In addition to these two pollen ratios, we also analyzed pollen percentages of Pinus and Artemisia, individually, to offer insight into taxon-specific changes. Using the two pollen ratios and the two taxon-specific percentages, we statistically compared all post-fire samples to all non-fire samples using a non-parametric ANOVA, which assesses difference in median values among fire and non-fire samples.
To quantify the rate of community compositional change following fire events, we used a rate-of-change analysis that called on the full pollen assemblage. Specifically, we used Bray-Curtis distance measure to calculate the dissimilarity between all adjacent pollen samples. The resulting value was then divided by the time between samples (year) and multiplied by 100 to obtain percent change per year, following methods outlined in Crausbay et al. (2017). To assess if rate-of-change values differed with time-since-fire, we used a Kruskal–Wallis test to compare the median rate-of-change values within three time-since-fire bins: 0–75 year post-fire, 75–150 year post-fire, and >150 year post-fire. While the 95% confidence intervals around the age of any single sample averages 109 years over the past 2500 years, these time-since-fire bins are based on the relative position of each sample, after each charcoal peak. Thus, while the assumption that each sample represents an increasing time-since-fire is robust, the time boundaries of bins themselves are approximate.
Finally, we compared the Chickaree Lake pollen record to regional climate reconstructions to evaluate the influence of millennial-scale climate changes on the vegetation and fire activity. Because pollen-based paleoclimate reconstructions from the region did not show evidence of changes in mean annual or seasonal temperature over the past 2000 year (Parish et al., 2020), we focused on precipitation-based paleoclimate reconstructions. We visually compared the millennial-scale changes in pollen observed at Chickaree Lake, as captured by NMDS axis 1, to lake level, δ18O, and pollen-based precipitation reconstructions from other studies within the region (Anderson et al., 2015; Parish et al., 2020; Shuman et al., 2009). The lake level reconstructions we reference were used to capture variations in moisture and were derived from ground penetrating radar soundings from near-shore sediments (Shuman et al., 2009). The δ18O records referenced in this study were derived by measuring carbonate oxygen isotope abundances in lake sediments. These isotopes can be used to trace water source and the seasonality of precipitation (Anderson, 2011). The pollen-based precipitation reconstructions were done using the modern analog technique which compares modern pollen datasets with fossil pollen datasets and uses the present day climate associated with modern pollen assemblages to infer past climate (Minckley et al., 2008). By using multiple proxies for precipitation, this study will be able to place the Chickaree Lake reconstruction within the regional context of hydrological studies from within the Rocky Mountain region.
Results
Pollen abundance and cluster zone analysis
Overall, 31 pollen types were identified over the past 2500 year in the Chickaree Lake record, with 14 types having a maximum abundance >1% and occurring in more than half of the samples (Figure 2). Dominant pollen types include Pinus (mean = 75%, range: 46%-88%), Picea (mean = 4% range: 0%-13%), Artemisia (mean = 10% range: 3%-24%) and Chenopodiaceae (mean = 3% range: 0.3%-9%). Several less dominant but ecologically significant pollen types include Arceuthobium (mean = 0.4% range: 0%-1.6%), Rosaceae (mean = 0.3% range: 0%-2%), and Poaceae (mean= 0.8% range: 0%-3%).
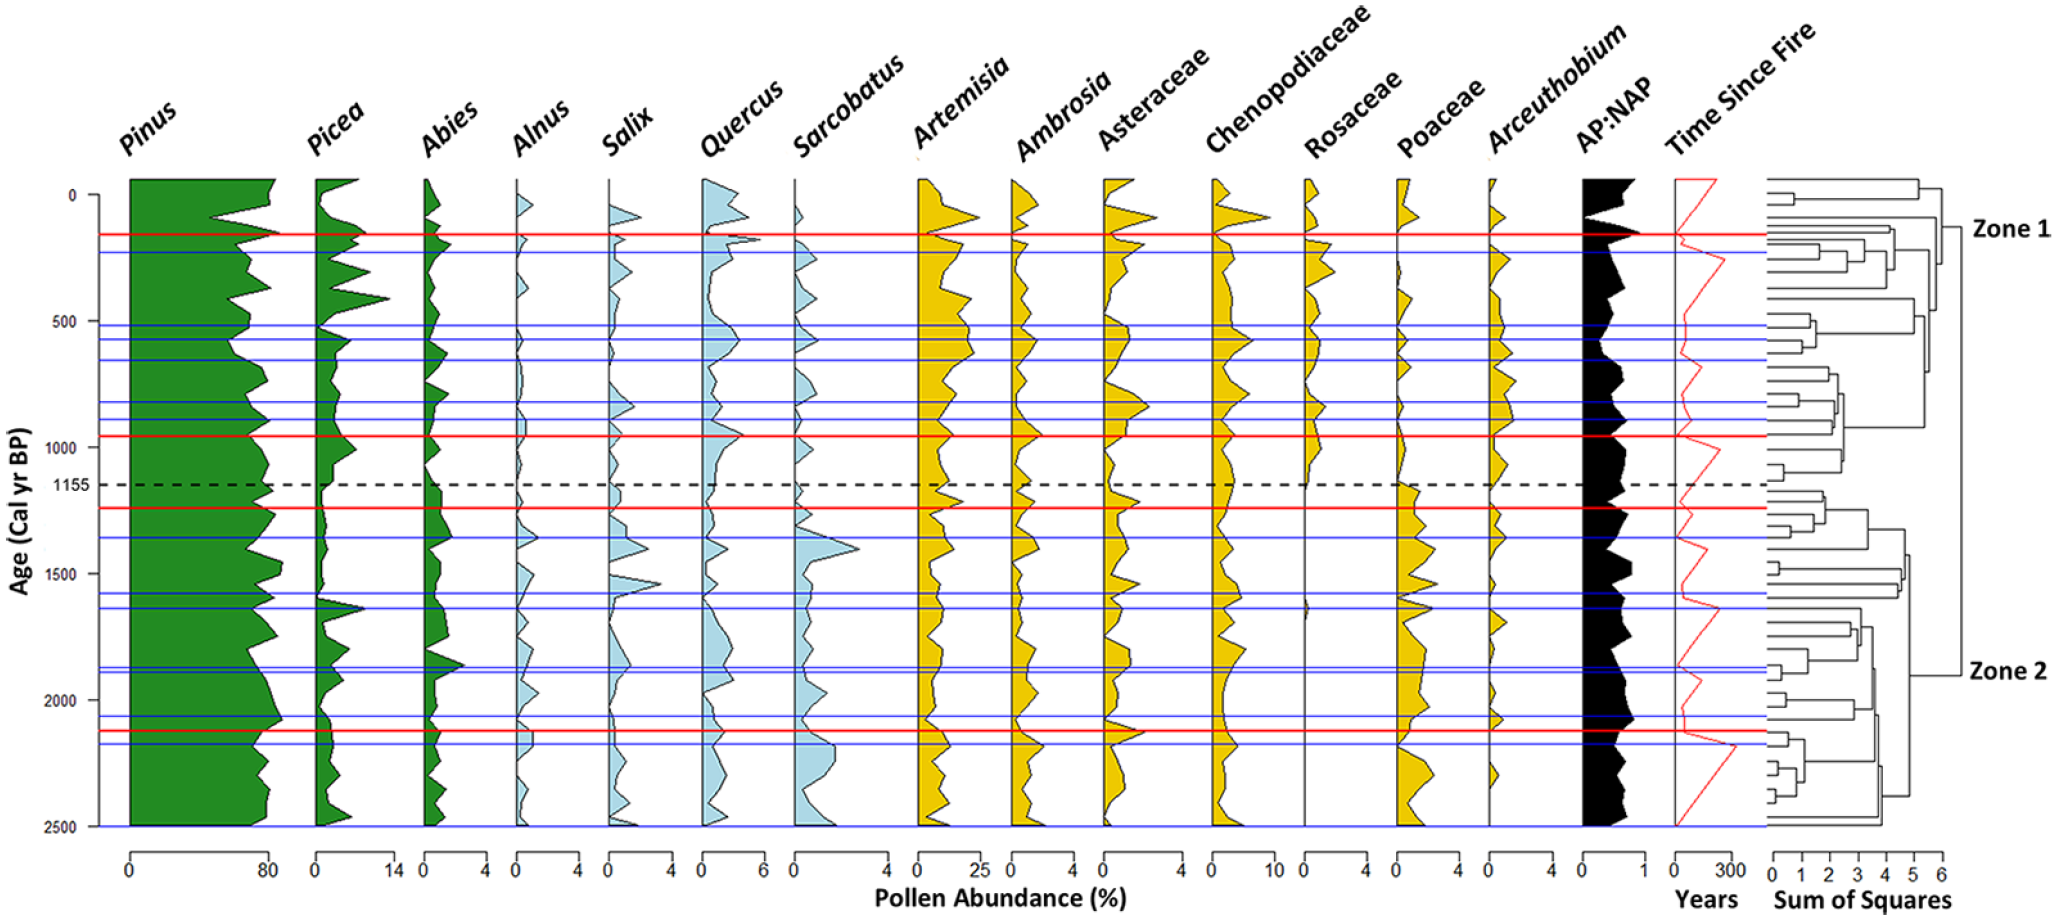
Stratigraphic diagram of selected pollen types at Chickaree Lake, Colorado, USA. CONISS dendrogram included to right of plot with zone break delineated by a dashed black line. High-severity fire events are depicted by red lines, and lower severity/extra-local fire events are indicated by blue lines (from Dunnette et al., 2014). The green pollen taxa are arboreal species, the blue pollen taxa are shrub/understory species and the yellow pollen taxa are non-arboreal species.
Two distinct pollen zones were identified through the stratigraphically constrained cluster analysis: Zone 2 from 2500 to 1155 cal year BP, and Zone 1 from 1155 cal year BP to present (Figure 2). Zone 2 is characterized by higher percentages (relative to Zone 1) of Pinus (mean = 77% max = 88%), Poaceae (mean = 1% max = 3%), Abies (mean = 1% max = 3%), Ambrosia (mean = 1% max = 2%), Alnus (mean = 1% max = 1%), and Sarcobatus (mean = 1% max = 3%) pollen. Zone 1 (1155 cal year BP to present) was characterized by higher Rosaceae pollen (mean = 1% max = 2%) and Arceuthobium (mean = 1% max = 2%) pollen percentages than in Zone 2. Picea (mean = 5% max = 13%), Asteraceae (mean = 1% max = 3%), and Artemisia (mean = 13% max = 24%) was also higher in Zone 1, relative to Zone 2. Notably, mean Pinus abundance decreased to 71%, and the lowest Pinus abundance for the entirety of the record was observed in this zone, after the most recent high-severity catchment fire in 1782 CE. Lower-elevation and extra-local pollen types, including Salix, Sarcobatus, and Quercus, also decreased in Zone 1.
Fire frequency was similar between the two zones. Ten fire events occurred in Zone 2, including two high-severity catchment fires, and eight fire events occurred in Zone 1, including two high-severity catchment fires. The mean (standard deviation) fire return interval (FRI) for all fires for Zones 2 and 1 was 141 (106) and 135 (100) year, respectively. Individual FRIs ranged from 15 to 331 year in Zone 2, and from 52 to 291 year in Zone 1.
Ordination
The NMDS analysis converged after 20 restarts and resulted in a final stress value of 0.19 (Figure 3). NMDS Axis 1 scores were positively correlated (p-value <0.1) with Pinus (r = 0.56) and negatively correlated (p-value <0.1) with Artemisia (r = −0.57), Rosaceae (r = −0.71), Asteraceae (r = −0.39), and Arceuthobium (r = -0.70). NMDS Axis 2 scores were positively correlated (p-value <0.1) with Alnus (r = 0.59) and Ambrosia (r = 0.49) and negatively correlated (p-values <0.5) with Poaceae (r = -0.31) and Picea (r = −0.33).
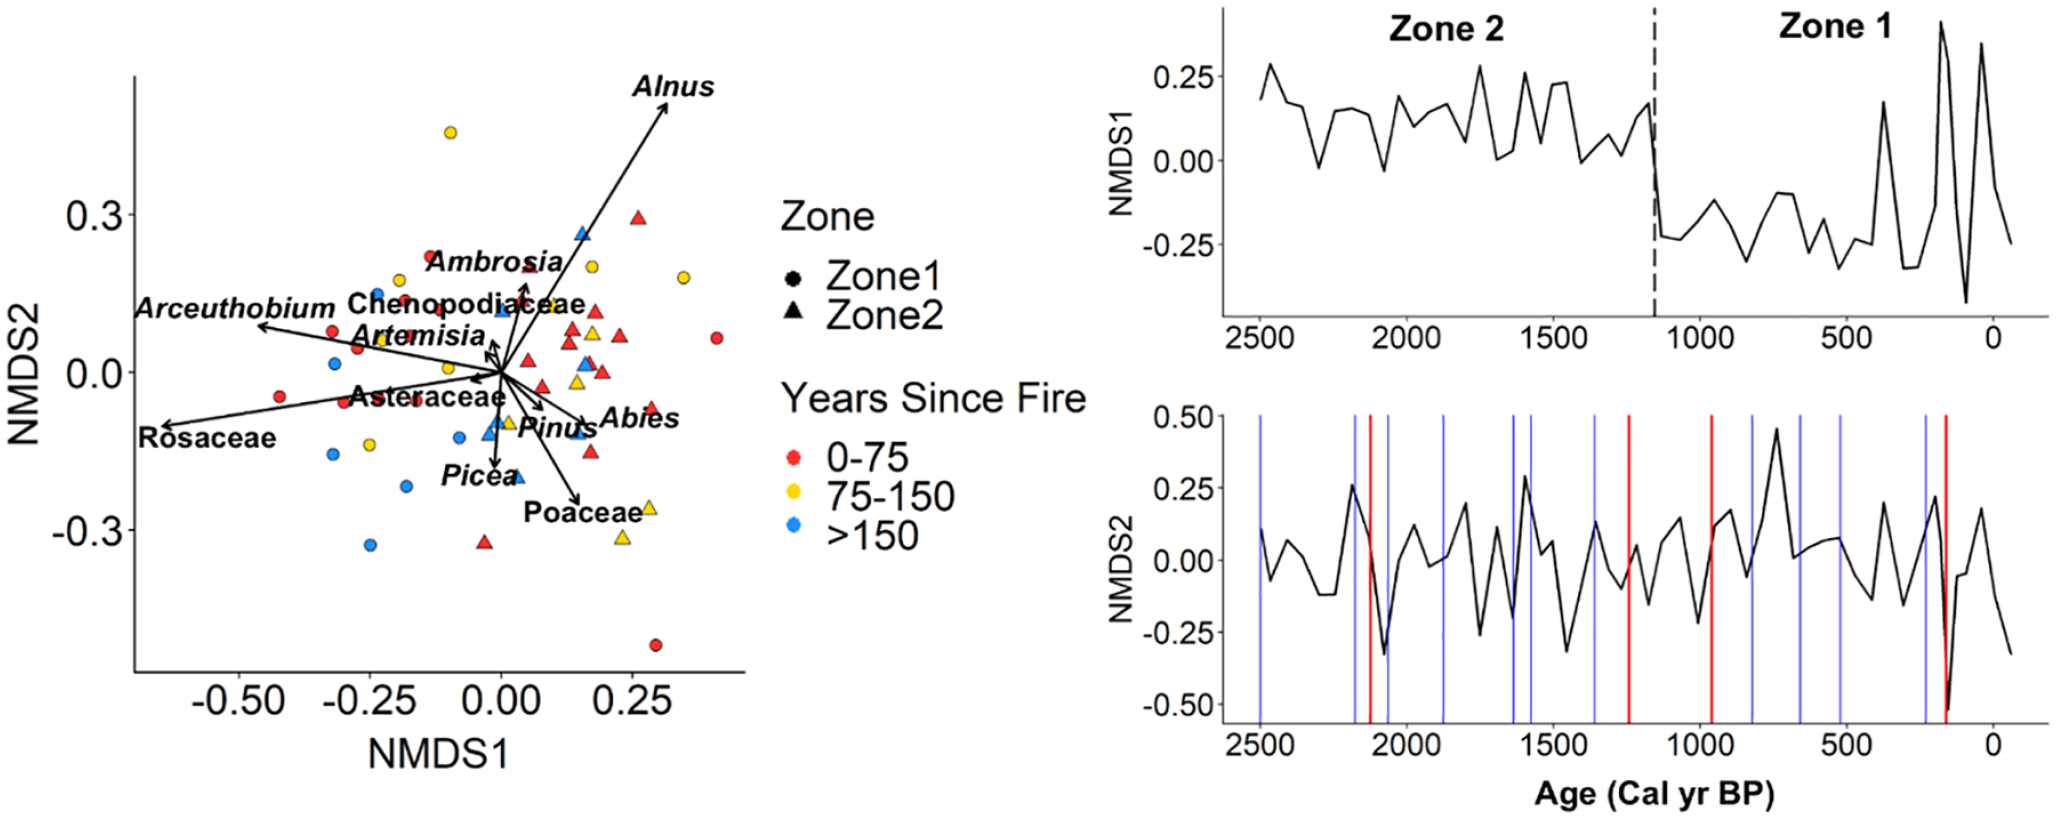
Non-metric multidimensional scaling (NMDS) ordination of Chickaree pollen percent data of selected taxa. Zone breaks from CONISS are denoted by symbol shape, and time-since-fire values are denoted by symbol color. Right panels show NMDS Axis 1 and 2 as time series, with the zone break from CONISS indicated by a dashed black line, and fire events denoted in red (high-severity catchment fires) and blue (lower severity/extra-local fires) (from Dunnette et al., 2014).
The time series of NMDS Axis 1 was characterized by the same changes that define the zone break identified through the stratigraphically constrained cluster analysis CONISS. NMDS Axis 2 further reveals fire-related changes in pollen assemblages. Fourteen of twenty-six samples from 0 to 75 year following fire plotted toward the positive values of NMDS Axis 2 and eight of the thirteen samples that were greater than 150 year post-fire plotted toward negative values on NMDS Axis 2.When comparing the time-since-fire to NMDS 2 scores, there appears to be variability in where values plotted in the two-dimensional space. We thus interpret NMDS Axis 2 as reflecting the variability of post-fire vegetation change. The perMANOVA results indicate significant differences between the fire and non-fire samples (p = 0.046), while time-since-fire had no significant influence on pollen in NMDS space (p = 0.090).
Pollen ratios
In total, 26 pollen samples were classified “fire” samples, and 26 pollen samples were classified as non-fire samples. The average time lag between a charcoal peak and fire-related pollen sample was 32 year (range: –6 to 67 year). Pollen assemblages varied significantly between fire and non-fire samples (Figure 4). Fire samples had lower AP:NAP ratios compared to non-fire samples (median ratio = 0.53 vs. 0.63 p = 0.032), and significantly lower conifer:LNAP ratios compared to non-fire samples (median ratio = 0.63 vs. 0.72 p = 0.041). Fire samples also had lower amounts of Pinus pollen compared to non-fire samples (median = 72% vs 77%, p = 0.054), and higher amounts of Artemisia pollen compared to non-fire samples (median = 12% vs 9%, p = 0.094).
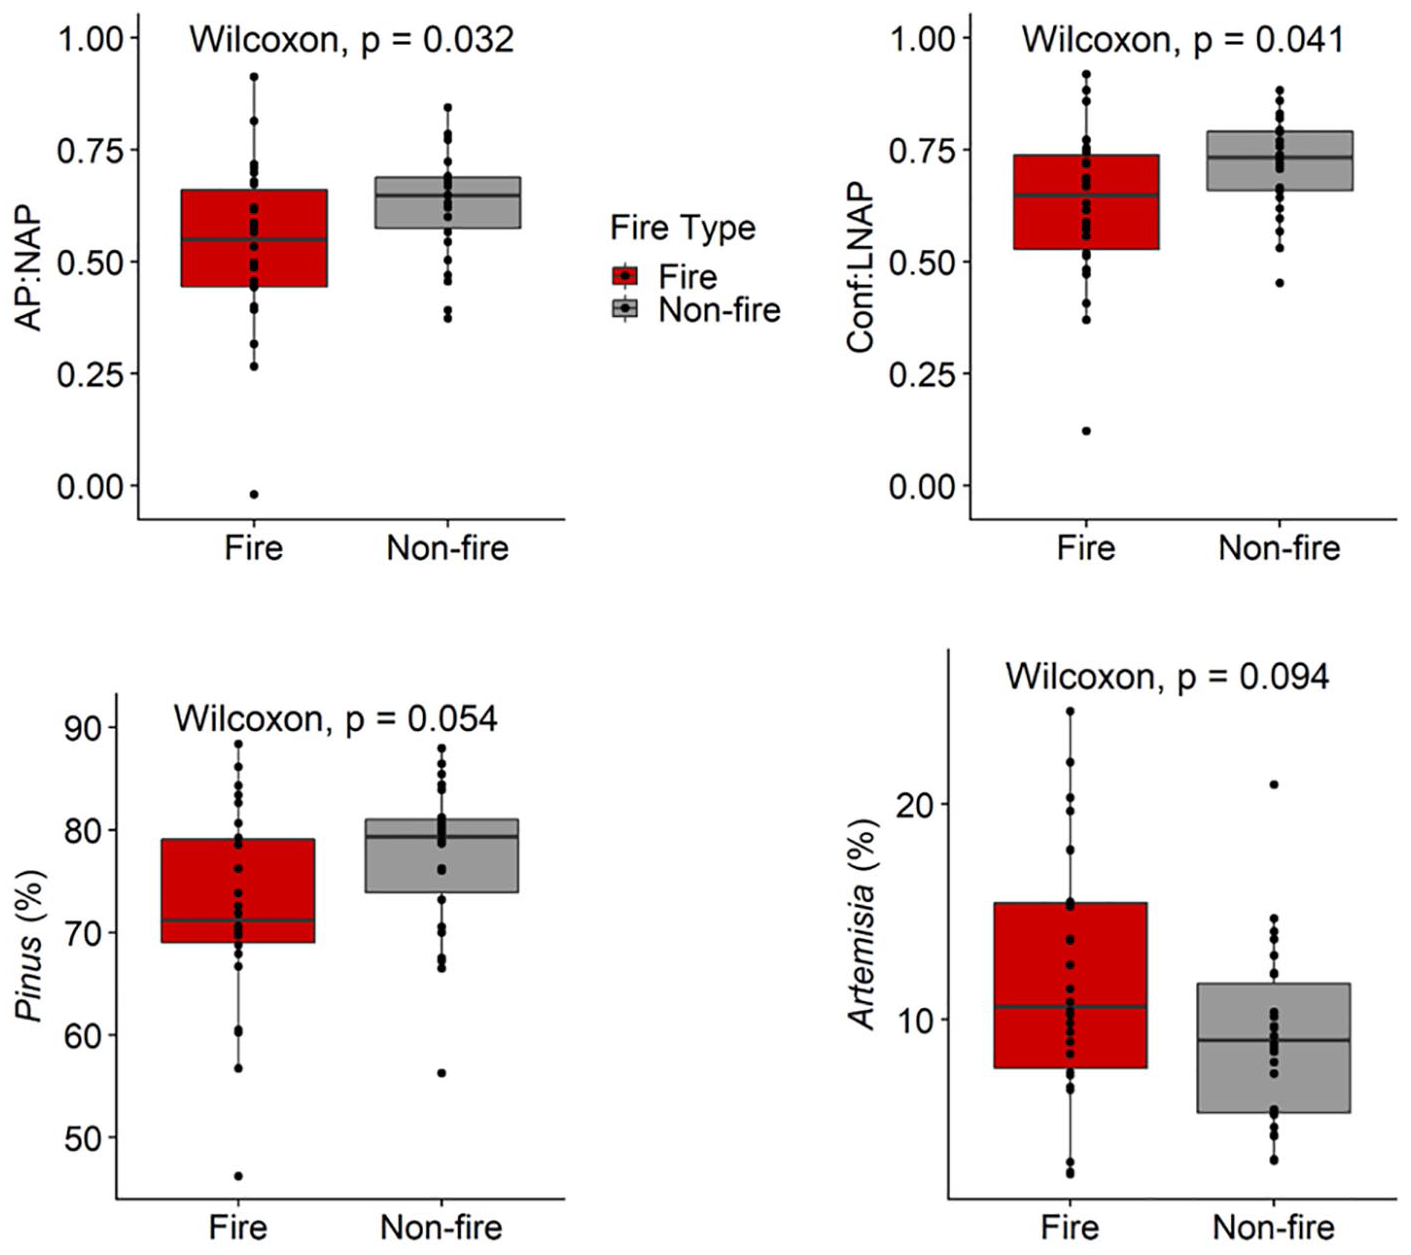
Boxplots of selected pollen ratios and percentages of selected pollen types. AP:NAP compares arboreal pollen taxa to non-arboreal pollen taxa while Conf:LNAP compares all conifers to localized non-arboreal pollen types. Boxes indicate the 25th, 50th (horizontal line), and 75th percentiles, while lines span to the 10th and 90th percentiles. Individual samples are shown by dots. Red indicates post-fire pollen samples (n = 26) and gray indicates samples not associated with fire events (n = 26, range). A Wilcoxon rank-sum test was used to compare median values between fire and non-fire samples, with the associated p-values reported.
Pollen rate-of-change
The rate-of-change time series captured the variability in pollen assemblages over the past 2500 year, with a median value of 27% change per year (Figure 5). The rate-of-change in pollen assemblages increased above this median value after some, but not all fire events. The highest rate-of-change value of 88% was observed at 94 cal year BP, which notably follows the 1782 CE stand-replacing fire. Rate-of-change values did not differ significantly among the three time-since-fire bins (p = 0.09). The maximum rate-of-change values did decline, however, with time-since-fire: samples from 0–150 year after fire events had a range of 6–88% change while samples greater than 150 year after fires had rates of change ranging from 8 to 20%.
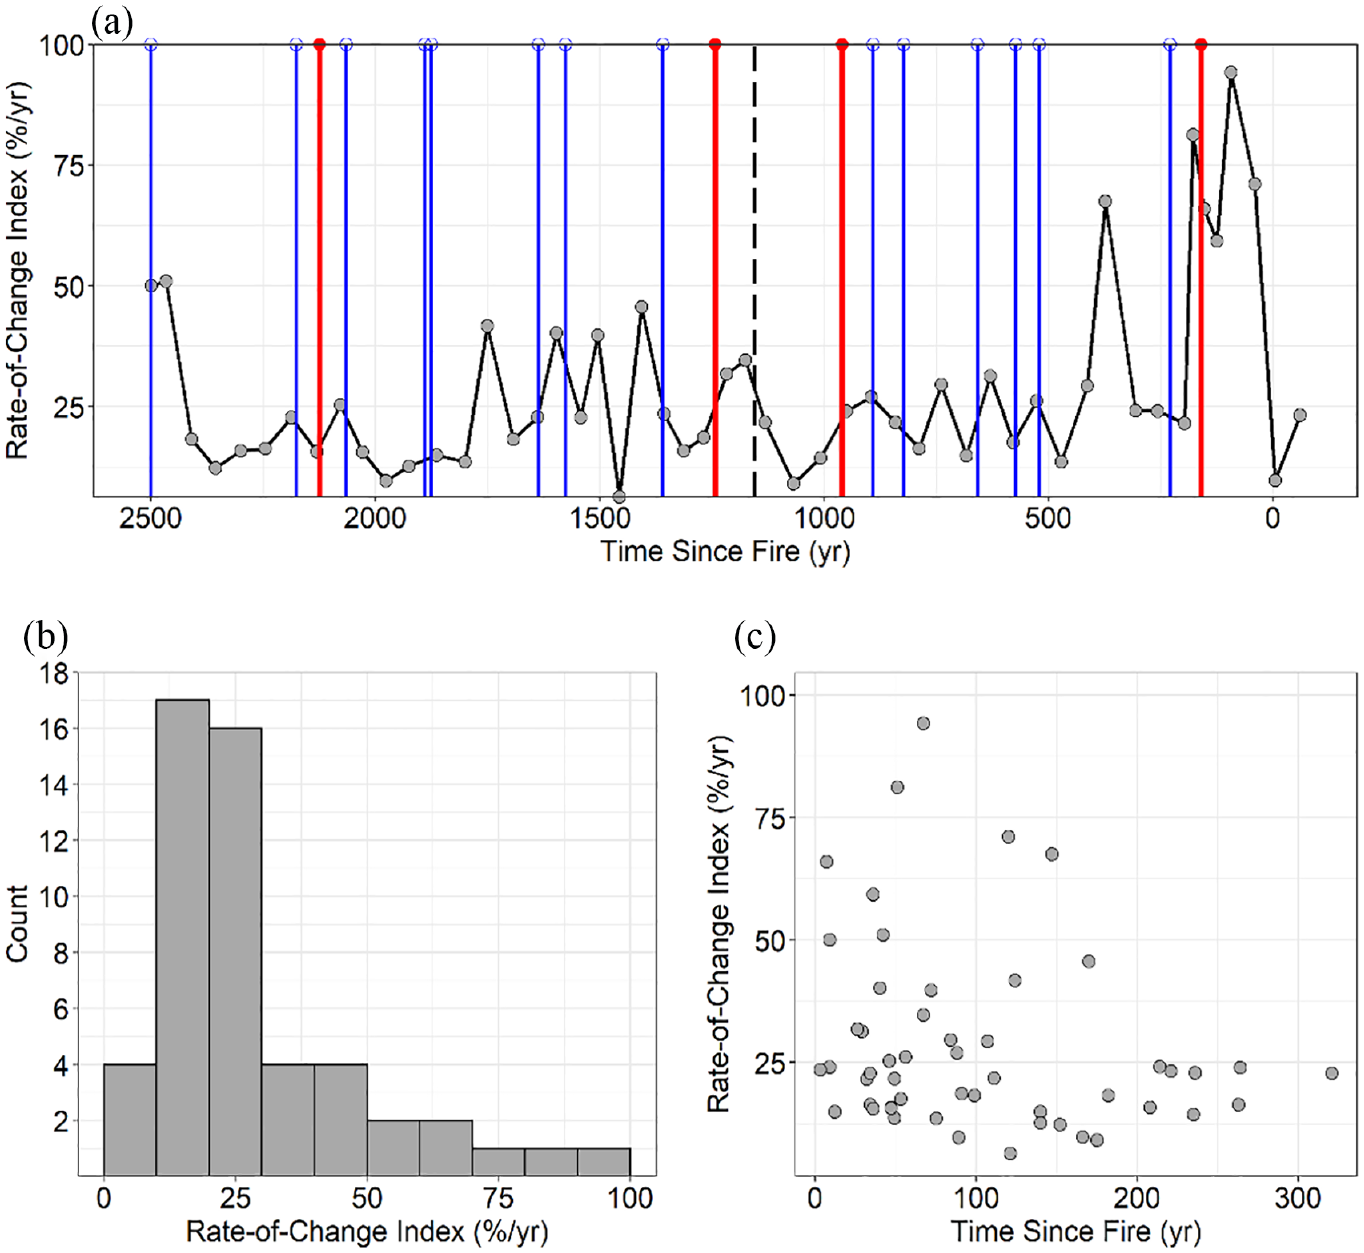
Rate-of-change analysis using squared chord distance measures between consecutive pollen assemblages. (a) Rate-of-change over the 2500 year record. Lines indicate charcoal-inferred fire events. Closed red circles with red lines indicate high-severity catchment fires and open blue circles with blue lines indicate lower severity/extra-local fires (from Dunnette et al., 2014).The black dashed line represents the zone break. (b) Distribution of rate-of-change values. (c) Rate-of-change as a function of time-since-fire values, for each pollen sample.
Discussion
Millennial-scale fire and vegetation dynamics
Pinus was the dominant pollen type throughout the past 2500 years, indicating the consistent presence of lodgepole pine forest around Chickaree Lake. Significant changes in non-arboreal pollen types, however, indicate that there were important millennial-scale changes in understory vegetation composition. The changes in the understory composition were most pronounced c. 1155 cal year BP, when Artemisia, Arceuthobium, and Rosaceae pollen percentages all increased (Figure 2–3). These increases likely reflect a greater local abundance of these understory taxa, but they may also reflect a decrease in tree and canopy density. For example, increased Picea pollen at this time, which is currently in low abundance immediately surrounding Chickaree Lake, could reflect more extra-local Picea pollen deposition, consistent with a decrease in local Pinus pollen deposition. This change could be interpreted as a decrease in forest canopy density as the thinning of the overstory pine coverage can allow for increases in extra-local pollen sources like Picea from differing elevations.
The changes in pollen assemblages highlighted through the stratigraphically constrained cluster analysis pollen zonation and NMDS time series are strikingly similar to the changes in fossil pollen assemblages from subalpine forests in the Park Range of Colorado, ~100 km west (Calder et al., 2019; Calder and Shuman, 2017). These similarities suggest a coherent regional change in vegetation assemblages, which appear to have happened rapidly ca. 1100 cal year BP. Whereas the vegetation change at ca. 1100 cal year BP was characterized by an increase in Picea pollen percentages at Chickaree Lake (Figure 2), higher-elevation sites in the Park Range record a decline in Picea pollen at this same time (Calder and Shuman, 2017). These differences may reflect the different subalpine forest types between these regions, and specifically locally dominant tree taxa. Forests around Chickaree Lake (elevation 2830 m) have been consistently dominated by lodgepole pine, while forests in the Park Range were comprised of mixed lodgepole pine and aspen stands at low elevations and spruce-fir stands, including open “ribbon” forests, at high elevations (elevation range 2000–3700 m). Artemisia pollen percentages and other understory pollen types increased at both Chickaree Lake and in the Park Range at ~1100 cal year BP; while Artemisia may be present locally at Chickaree Lake, it is also abundant at lower elevations, making it possible that its increase represents an increase in extra-local pollen, consistent with the interpretation of a reduction in forest density across both study regions (Figure 2) (Calder et al., 2019). In order for Artemisia and extra-local pollen types to increase within the Chickaree pollen record, local sources of pollen must be reduced. Since Artemisia is an extra-local understory species, it can be interpreted that the forest density surrounding Chickaree Lake decreased and thinned to allow for external sources of pollen to appear within the lake catchment pollen record.
Decadal-scale post-fire vegetation change
Fire events significantly impacted vegetation and pollen assemblages, highlighted by significant differences in pollen ratios and taxa between fire-related and non-fire-related samples (Figure 4). In lodgepole pine forests, post-fire vegetation recovery is characterized by the rapid establishment of both lodgepole pine and understory species (Baker, 2009; Peet, 2000). Early in post-fire recovery, pollen assemblages should have higher pollen percentages from understory taxa, as lodgepole pine establish and reach reproductive maturity within 5–15 years after post-fire establishment (Turner et al., 2007). This is consistent with the pattern observed at Chickaree Lake, where post-fire samples had significantly lower arboreal:non-arboreal pollen ratios and lower Pinus pollen percentages compared with non-fire samples. Artemisia pollen was also higher in post-fire samples compared to non-fire samples, which could reflect increased local abundance of Artemisia (including A. frigida and A. scopulorum) in post-fire landscapes around Chickaree Lake (Knight et al., 2014), or increased Artemisia from extra-local, lower-elevation sources (Minckley and Shriver, 2011). Generally, when fires occurred at Chickaree Lake, arboreal pollen abundance (dominated by Pinus and other conifers) was reduced. These changes in pollen assemblages after fires were rapid, and more so than during other periods in the record. For example, the highest rate-of-change values (between any two adjacent samples) occurred between samples that were c. 50–150 year after fires, with lower rate-of-change values in samples >150 year after fires (Figure 5). The high rates of change up to a century after individual fire events highlight the long-lasting impacts of wildfires on forest vegetation dynamics (Johnstone et al., 2016).
Climate influence on vegetation dynamics
We interpret the millennial-scale change in vegetation recorded in the pollen record of Chickaree Lake as a response to changes in total annual precipitation or precipitation seasonality. We base the interpretation on two points. First, wildfire frequency at the site did not differ significantly between the two pollen zones; variability in the timing of fire at this single site thus likely reflects mainly stochastic processes (Calder et al., 2014; Gavin et al., 2006) which suggests that fire is not a driver of vegetation change. This does not preclude the importance of climate in driving fire activity at larger landscape to regional scales, as documented in several fire history studies in Western North America (Calder et al., 2015; Kelly et al., 2013; Marlon et al., 2012; Schoennagel et al., 2004, 2007; Sibold and Veblen, 2006; Whitlock et al., 2003). Second, pollen-based temperature reconstructions from the Park Range of northern Colorado do not appear to have the signature of either the high temperatures of the Medieval Climate Anomaly or the low temperatures of the Little Ice Age (Parish et al., 2020), thus making temperature an unlikely driver of the changes observed in this record. Previous work has also shown that the spatial variations in these climatic changes may not have included the temperature anomalies seen elsewhere to southwestern North America and the southern Rocky Mountains (Neukom et al., 2019; Viau et al., 2012). Instead, multiple lines of evidence indicate a shift from dry to wet conditions over the past 2000 year, particularly in the winter months.
The shift toward increased winter precipitation or snow at approximately 1000 cal year BP has been inferred from various precipitation proxies from the central Colorado Rocky Mountain region. Lower δ18O values and increases in lake level from about 1155 cal year BP to present have been observed at sites within 150 km of Chickaree Lake (Figure 6) (Anderson, 2011; Shuman et al., 2009). The fossil pollen assemblages from the nearby Park Range also have been used to quantify a significant increase in winter precipitation, even though they indicate no significant changes in temperature or summer precipitation (Figure 6) (Parish et al., 2020). The timing of the inferred increase in winter precipitation is coincident with the zone break in the Chickaree pollen record at 1155 cal year BP.
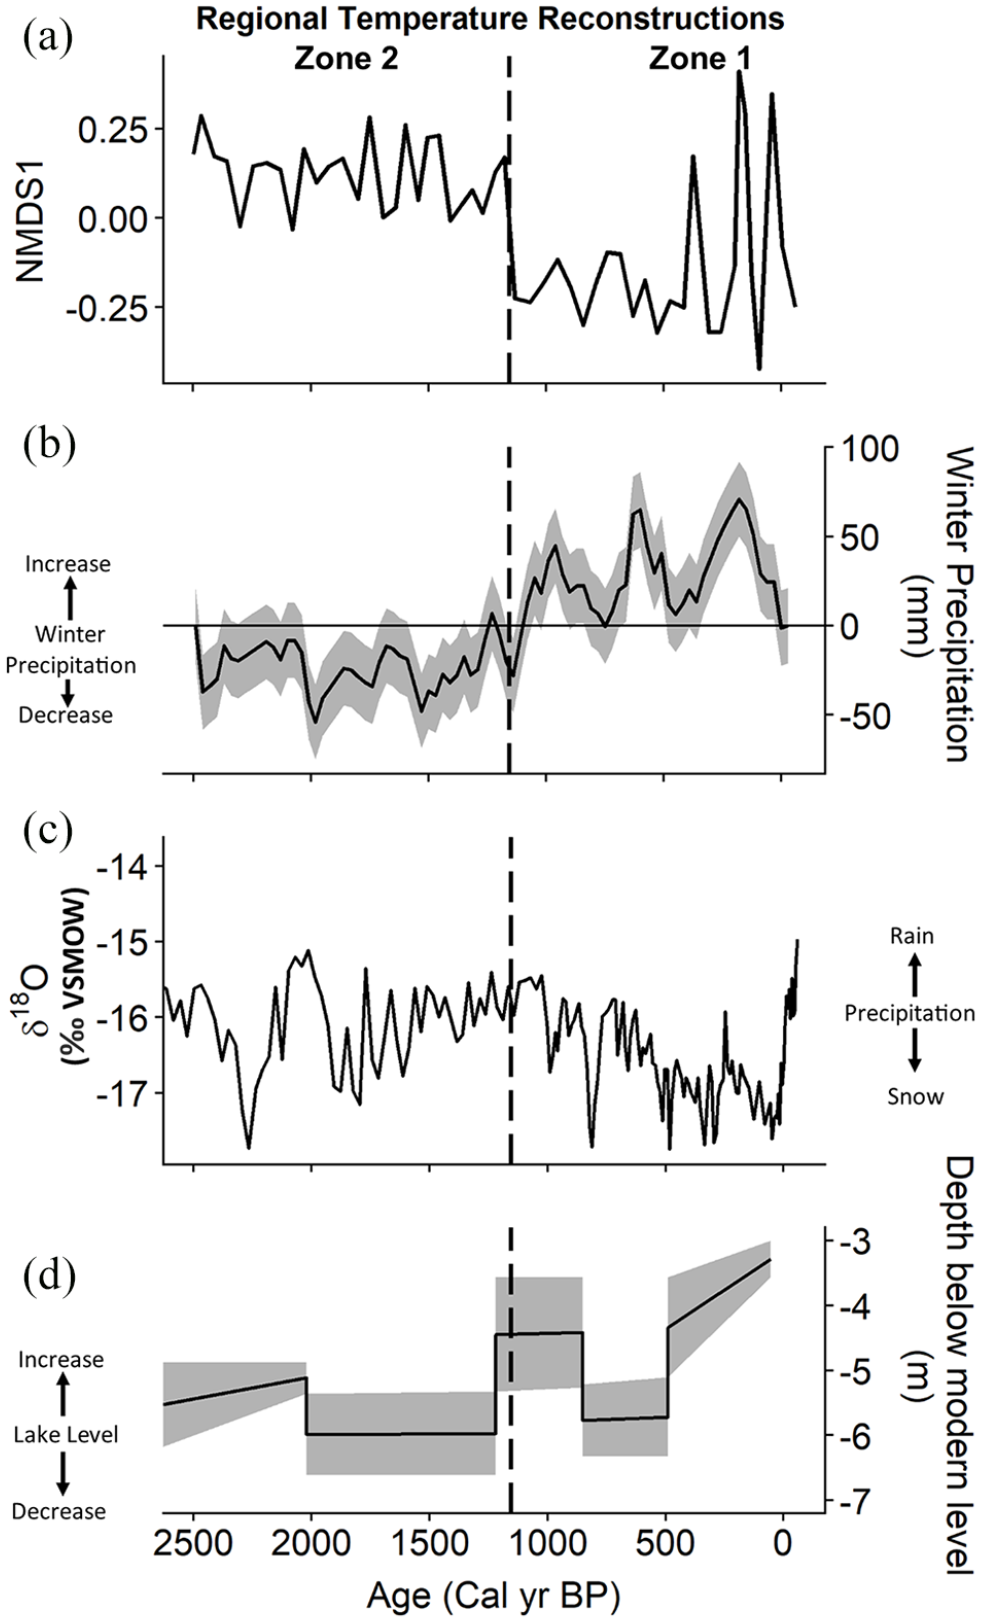
Chickaree Lake vegetation change compared to regional paleoclimate records. (a) Chickaree Lake pollen assemblages, as summarized NMDS Axis1, (b) Park Range winter precipitation records, based on modern analog technique applied to modern and fossil pollen assemblages (Parish et al. 2020), (c) Bison Lake calcite δ18O (‰VSMOW) (Anderson et al., 2015), and (d) Hidden Lake water level reconstructed through Ground Penetrating Radar (Shuman et al., 2009). All sites are in Colorado, USA.
The regional increase in winter precipitation over the past 1155 year offers insight toward past influences of climate on vegetation change in the Rocky Mountain region (Anderson, 2012). Localized-impacts of broader scale climate controls on vegetation vary based on topographic position and spatial orientation on the landscape, but the regional extent of the fossil pollen changes across northern Colorado (i.e. at Chickaree and the Park Range lakes) indicates that broad-scale climate dynamics were likely involved. Likewise, simulations and syntheses of the paleoclimates of the past 2000 year attribute the increasingly wet conditions toward present as the result of the direct and indirect influences of insolation and volcanic forcing on broad-scale atmospheric circulation (Landrum et al., 2013; Rodysill et al., 2018; Shuman et al., 2018).
Winter precipitation was likely an important driver of vegetation change because it determines snowpack development in subalpine forests, which in turn is crucial in determining the timing and duration of the growing season (Gergel et al., 2017). Winter precipitation changes may be important at Chickaree because an increased snowpack that persisted later into the spring would shorten the growing season and thus limit forest growth. The shift from pollen Zone 2 to Zone 1 reflects this pattern, as there was a reduction in the ratio of arboreal pollen to non-arboreal pollen, consistent with a decrease in forest density. Increased snowpack, and more moisture from longer snow melt, could have also facilitated the increased abundance of Picea pollen in Zone 1 compared to Zone 2, by increasing soil moisture longer into the growing season, although this interpretation is confounded in part by the possibility of greater regional input of Picea pollen.
Given the apparent sensitivity of vegetation to the past changes in winter precipitation, we should expect ecological changes in Colorado’s subalpine forests as future climate changes to increasingly warm, dry conditions, with reduced snowpack, and overall drier growing seasons (Littell et al., 2018; McKenzie and Littell, 2017; Moritz et al., 2012; Westerling et al., 2011). While lodgepole pine forests have been resilient to high-severity fires and past climate change, changing interactions between fire and climate could have subsequent impacts on vegetation and the ability for these systems to continue to persist in the warmer, drier climate scenarios predicted for the future (Littell et al., 2018; McKenzie and Littell, 2017; Moritz et al., 2012; Westerling et al., 2011).
Conclusion
Few paleoecological studies have focused exclusively on reconstructing fire and vegetation relationships (Crausbay et al., 2017; Minckley et al., 2012; Minckley and Shriver, 2011), and even fewer have focused on creating high temporal resolution reconstructions of vegetation over the past 3000 years (Calder et al., 2017, 2019; Stegner et al., 2019), but these type of paleoenvironmental reconstructions are necessary to assess the resiliency of regions increasingly threatened by changes to coupled interactions between wildfire and climate (Calder et al., 2019). This study at Chickaree Lake provided the unique opportunity to investigate paleoecological vegetation dynamics on both millennial and decadal time scales. Pinus was the dominant species over the past 2500 years at Chickaree Lake, which is consistent with other studies at subalpine sites within the region (Dunnette et al., 2014; Minckley et al., 2012). While the dominance of pine throughout the record signifies resilience to both repeated wildfires and changes in climate setting, understory species offered insight toward the influence of these drivers on forest density and understory structure.
Over the past 2500 years, increased winter precipitation was an important driver of the vegetation changes at Chickaree Lake, characterized by an increase in mesophilic taxa (e.g. Picea, Rosaceae) and a likely decrease in forest density, c. 1155 cal year BP. The timing of this change is coherent with changes documented at other sites in the Colorado Rockies, suggesting that it was ultimately climate-driven, despite the consistent occurrence of high-severity fires. While high-severity fires were associated with significant, decadal-scale changes in pollen assemblages, the return to pre-fire assemblages indicates an overall resilience in forest composition to fire activity. Unlike other regions in the Rocky Mountains (Calder et al., 2017, 2019; Calder and Shuman, 2019), we found no evidence that high-severity fires initiated broad-scale changes in vegetation at Chickaree Lake; in contrast, the history at Chickaree Lake is more consistent with other lodgepole pine dominated watersheds in the region (Minckley et al., 2012; Minckley and Shriver, 2011). This resilience of lodgepole forests to high-severity fires depends on post-fire seed sources, seedling establishment, and survival, which may be increasingly compromised under warmer, drier conditions in recent and upcoming decades (Andrus et al., 2018; Hansen et al., 2018; Hansen and Turner, 2019; Harvey et al., 2016; Stevens-Rumann et al., 2018). Such a loss of resilience to the combined impacts of climate change and fire activity would represent a significant departure from the range of variability reconstructed over the past several millennia.
Footnotes
Acknowledgements
We thank Erin Herring for pollen preparation and Vania Stefanova for help with pollen identification, and previous researchers who helped develop the Chickaree Lake pollen and charcoal records. Funding for this study was provided by National Science Foundation grants DEB-1655179 to KKM, 1655121 to PEH, and 1655189 to BNS. We thank D. McWethy, G. Carter, and the National Park Service for logistical support and field assistance. This manuscript was improved by comments from Dr. Shawn Hutchinson, Dr. Arnaud Temme, and the Big Burns project team. Pollen data presented in this manuscript are publicly available via the Neotoma Database or upon request to the corresponding author.
Funding
The author(s) received the following financial support for the research, authorship, and/or publication of this article: Funding for this study was provided by National Science Foundation grants DEB-1655179 to KKM, 1655121 to PEH, and 1655189 to BNS.