
Abstract
Intensification of anthropogenic activities and related processes have altered the morphology of modern deltaic systems. As a result, mapping of geomorphic features, such as paleochannels, using recently acquired digital elevation data has become increasingly difficult. Using the Nile River and delta as a test site, we developed and applied procedures to map the distribution of paleochannels that existed throughout the Holocene. A high-resolution digital elevation model (DEM) derived from an early, detailed topographic sheet collection was used to minimize the impact of recent man-made topographic artifacts. The DEM-inferred paleochannel distribution was verified using direct and indirect subsurface data. Using our adopted methodology, we identified 76 main and subsidiary paleochannels with a total length exceeding (by >500 km) previously mapped paleochannels. The overwhelming majority (>80%) of the reported historical and archeological sites (29 sites) in the Nile Delta were found to be proximal (<2.5 km) to the identified paleochannels, an observation that is not obvious in any of the previous paleochannel delineations. These observations suggest that the delineated paleochannel distribution of the Nile Delta can be a useful guide for locating ancient cities currently obscured by man-made structures or buried under thick Holocene deposits. Moreover, it can potentially enhance our understanding of the geological and archeological history of the Nile Delta and has societal benefits as these channels could act as preferred pathways for groundwater flow. The advocated methods can be readily applied to river deltas worldwide where high-resolution elevation datasets acquired before the onset of heavy anthropogenic activities are available.
Introduction
Modern riverine systems are products of complex interactions of drainage basins with fluvial processes, tectonic activities, and climatic fluctuations (e.g. sea-level change) during the Quaternary (Blum and Törnqvist, 2000; Mertes and Dunne, 2007). Most of these processes and interactions in major riverine systems have resulted in the formation of modern deltas during the Holocene. The morphology of these deltaic systems has undergone large-scale changes owing to both natural and anthropogenic processes (Gupta, 2008). The Nile Delta of Egypt (Figure 1), the study area, provides opportunities to examine the interplay of these processes by examining the lateral and spatial variations of its sedimentary record (Frihy et al., 1991) and paleochannel distribution (Frihy et al., 1991; Stanley et al., 2004). It is believed that the regional tectonic activities during the oligo-Miocene were responsible for the opening of the Red Sea and the canyon occupied by ancestors of the Nile (Abd-Allah et al., 2012), and that the delta is located on a passive continental margin that developed in response to the separation of the Afro-Arabian plate from the Eurasian plate (Sarhan, 2015). The stratigraphic successions of the delta reflect the combined effects of ancestral fluvial systems of the Nile, tectonic extensions, and changes in the Mediterranean water levels (Stanley and Warne, 1998).
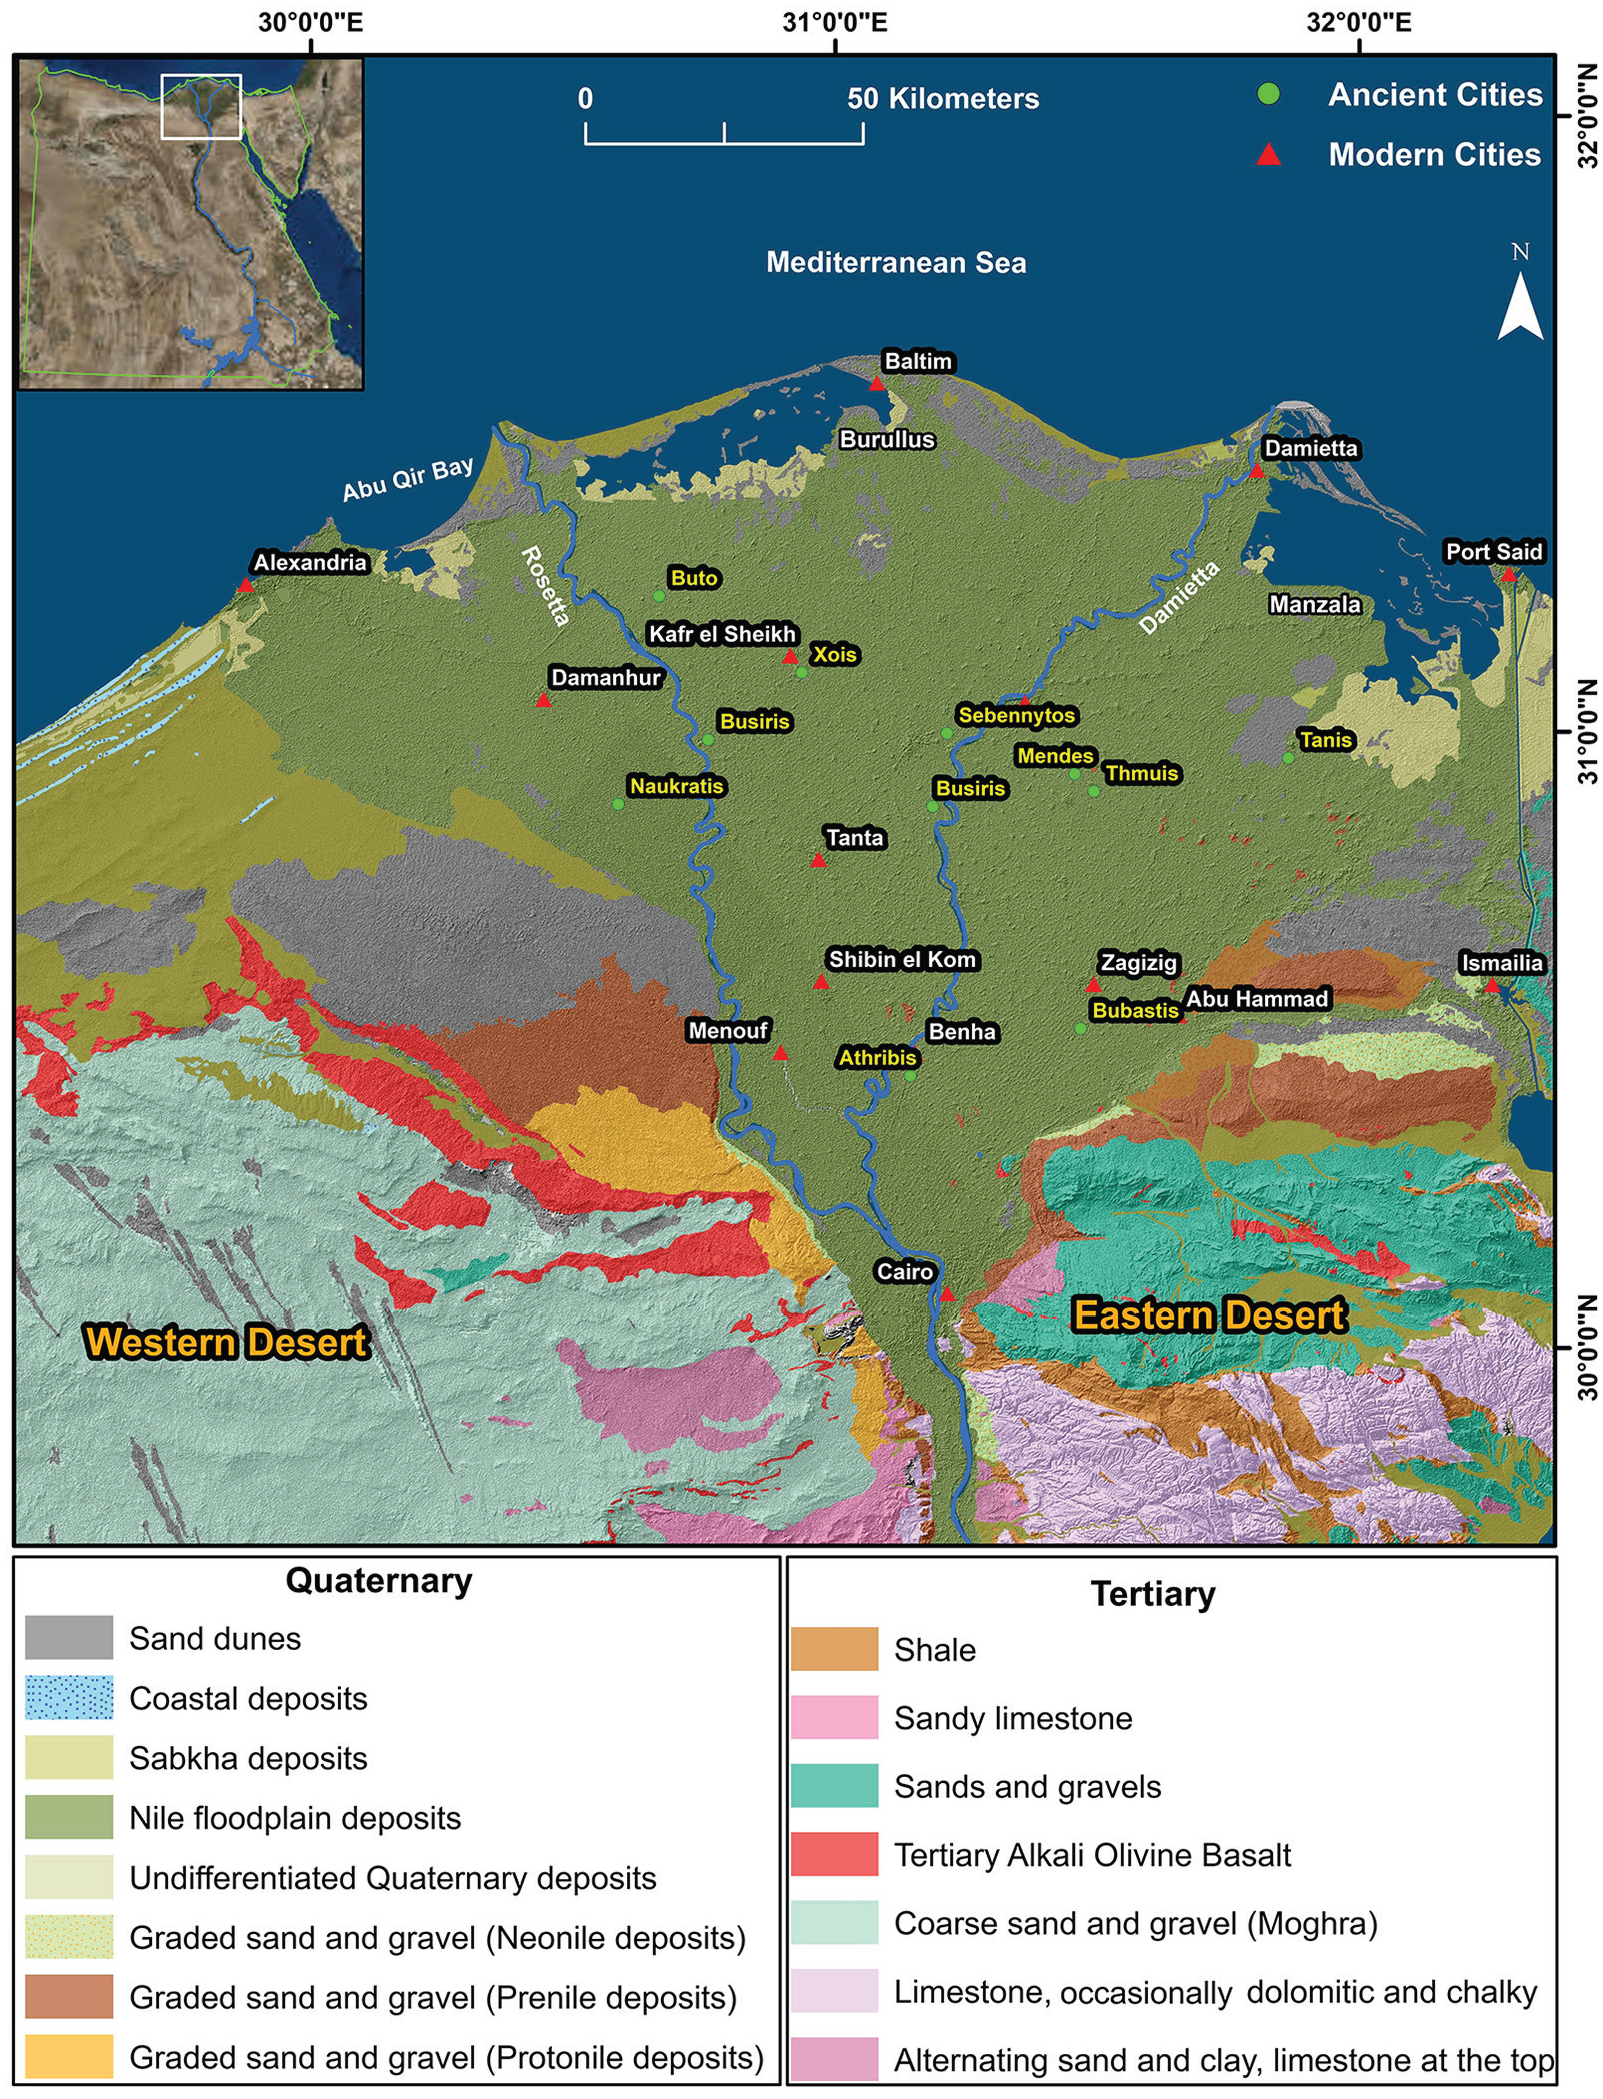
Geologic map for the Nile Delta and surroundings (modified from El Bastawesy et al., 2017) showing the distribution of the Quaternary sediments within the Nile Delta and older Tertiary deposits on its peripherals in the Eastern and Western deserts. Also shown are the two currently active branches (Rosetta and Damietta) of the Nile River (blue lines), the current major cities (red triangles), and ancient cities (green circles; Angelopoulos, 2003; Blouin, 2014). Inset shows the location of the Nile Delta (outlined by the white box) within Egypt.
The Nile system witnessed five evolutionary phases (Said, 1993): Eonile (Miocene), Paleonile (Pliocene), Protonile (Early Pleistocene), Prenile (Middle Pleistocene), and Neonile (Holocene). The latter two phases are responsible for the current morphology and spatial distribution of sediments that make up the modern Nile Delta (Said, 1993). During the Prenile phase, the Nile River established a connection with the Ethiopian highlands, and thick (700 m) sequences composed of sands and gravels of the Mit Ghamr formation were deposited (Rizzini et al., 1978; Said, 1981; Zalat, 1995). The Neonile phase established additional perennial connections with the upstream areas, a connection that introduced extensive silt and clay deposits of the Bilqas Formation across the entire Nile Delta landscape (Abd-Allah et al., 2012; Said, 1981). The surficial geology of the Nile Delta and surroundings is shown in Figure 1. The topography of the Nile Delta is dominated by flat terrain that gently slopes northward toward the Mediterranean coast with a maximum relief variation of 18 m (Embabi, 2004; Gebremichael et al., 2018).
The presence of as many as nine branches of the Nile River during the early Holocene has been described in several historical documents including Herodotus (484–425 BC), Strabo (63 BC), Ptolemy (AD 90–168), Serapion (AD 350), and El Idrisi (AD 1099–1154). These include the Canopic, Rosetta, Saitic, Sebennitic, Damietta, Mendesian, Tanitic, and Pelusiac branches (Stanley and Clemente, 2014; Toussoun, 1926). With the exception of the Damietta and Rosetta branches (Figure 1), all of the Neonile branches dried up due to one or more of the following factors: decline in river discharge, silting up by west-to-east longshore currents at river outlets, sea-level changes, and river diversions caused by tectonic or anthropogenic activities (Said, 1981, 1993; Sestini, 1989; Stanley and Jorstad, 2006; Stanley and Warne, 1993; Stevaux and Souza, 2004; Torab, 1998). During middle to late Holocene, a combination of reduced precipitation rains along the Nile corridor and reduced river flow as a result of weakening of the Ethiopian monsoon triggered expansion of human settlement and activity in the Nile Delta (Marriner et al., 2013). The elevated overbanks (levees) of the Nile River paleochannels became the main settlement locations throughout the channel’s lifespan or period of operation because of their proximity to the Nile River branches (for irrigation) and for flood protection due to their elevations (El Gamili et al., 2001; Hassan, 1997; Trampier et al., 2013). Similar population settlement trends have also been noted on the levees of the Song Hong Delta in northern Vietnam (Funabiki et al., 2012). Thus, by mapping the distribution of the Nile Delta paleochannels, one can potentially identify the locations of earlier settlements.
While this is probably viable for mapping ancient cities along the inland paleochannels of the Nile Delta, it might not be the case for those cities that were constructed at the terminus of the paleochannels, where the channels discharge into the Mediterranean Sea. Those cities were built on thick recent sediments that typically experience the highest subsidence rates (Becker and Sultan, 2009; Gebremichael et al., 2018), and as such, they are subject to complete inundation by sea-water and total destruction (Stanley et al., 2004). For example, the recently discovered Eastern Canopus city at the terminus of the Canopic paleochannel was found beneath 5–7 meters of water in Abu Qir Bay (Figure 1) in the northwestern Nile Delta (Stanley et al., 2004).
Combinations of historical (and prehistorical) information, geophysical methods, sediment core data, elevation data, and optical and radar remote sensing data and techniques have been used to map paleochannels in both deltaic and non-deltaic settings. Barnhardt and Sherrod (2006) carried out ground-penetrating radar (GPR) surveys in conjunction with bathymetric data and sediment core data analyses to delineate 8- to 11-m-deep and 80-m-wide buried traces of the Nisqually River in western Washington. Using satellite imagery, aerial photography, and a digital elevation model (DEM), Cox et al. (2014) mapped relic meander bends of the Pliocene Mississippi River paleochannels in the Lower Mississippi Valley. Similarly, Blumberg et al. (2004) used visible and infrared (IR) data, Synthetic Aperture Radar (SAR) data, and GPR to detect exposed and buried channels in the Western Negev, Israel. Contrasts in reflectance and backscatter properties denoting the presence of vegetation over water-bearing buried channels, and its absence away from the channels, were used to map paleochannel networks (Blumberg et al., 2004). Satellite-based (e.g. Shuttle Radar Topography Mission (SRTM) data) and/or airborne light detection and ranging (LiDAR) topographic data have been widely used to map morphologic features including paleochannels on local, regional, and global scales (e.g. Bhattacharyya et al., 2015; Ninfo et al., 2016). For example, high-resolution LiDAR DEM data with a spatial resolution of 1 m or less, and vertical accuracy of 0.15–0.25 m (Liu et al., 2015; Reutebuch et al., 2003), were successfully used to delineate paleochannels within the Welsh River catchment (Jones et al., 2007).
The above-mentioned techniques, while successful in many areas worldwide, do not represent adequate and/or practical solutions for mapping the Nile Delta’s paleochannels. The application of ground-based survey techniques over the entire Nile Delta is costly and labor-intensive given the large areal extent of the study area and the limited spatial applications of these techniques. Detecting paleochannels by mapping the density of the vegetation biomass through the analysis of visible and IR optical imagery will probably be ineffective in mapping the Nile Delta’s paleochannels given the dense vegetative cover across the entire delta. The shallow groundwater levels and soil moisture conditions in the delta limit the penetration capability of the SAR sensors, and our ability to apply these techniques for mapping the subsurface. To date, no LiDAR data have been generated for the Nile Delta. Coarse spatial resolution (1–3 arcseconds) and low absolute and relative elevation accuracies of SRTM DEMs have put into question the effectiveness of these products for mapping paleochannels (De Fátima Rossetti, 2010). Furthermore, because the SRTM DEMs were acquired through a C-band radar sensor, its capability to penetrate the densely vegetated cover in the delta and map the elevation of the land surface beneath can be limited (O’Loughlin et al., 2016). In addition to the inherent limitation of the above-described datasets and methods for mapping paleochannels, landscape changes due to anthropogenic processes have further complicated the delineation of the paleochannels using the above-described datasets and methods. For example, Orengo and Petrie (2017) mapped extensive (>8000 km long) paleochannel networks near a core area for the Bronze Age Indus Civilization (northwest India) using large collection (28 years) of Landsat 5 data; however, large-scale anthropogenic landscape modifications mainly by agricultural activities posed serious challenges to their mapping efforts (Orengo and Petrie, 2017). In the case of the Nile Delta, none of the above-mentioned datasets and approaches were developed prior to the sixties of the 20th century, a period that signaled the onset of extensive modifications to the Nile Delta landscape following the construction of the Aswan High Dam. Thus, the application of any of these datasets and methodologies will not entirely capture many of the geomorphologic features which are indicative of paleochannel distribution, and which were modified by earlier anthropogenic activities.
To date, the spatial distribution of the paleochannel networks of the Nile Delta has not been fully delineated. Previous research focused largely on the delineation of some seven to nine historical channels narrated and documented by pioneer historians and voyagers. These attempts (e.g. Ball, 1939; El Gamili et al., 2001; El Gamili and Shaaban, 1988; El Mahmoudi and Gabr, 2008; Quintanar et al., 2013; Sneh and Weissbrod, 1973; Stanley and Jorstad, 2006) utilized optical and radar remote sensing, geophysical surveys, and drill core sample analyses to identify segments of the historically cited paleochannels. In this study, we attempt to undertake the following tasks: (1) provide methodologies and procedures developed to extract the spatial distribution of paleochannels from detailed (1:25,000) topographic maps produced in the 1940s, (2) test the validity of the extracted paleochannel network using one-dimensional (1D) and two-dimensional (2D) geophysical survey analysis and drill core and borehole data, and (3) discuss the significance of our findings, and the potential applications and limitations for mapping paleochannels in deltas elsewhere.
Data and methods
We developed a conceptual model to describe the geomorphological and compositional characteristics of paleochannels based on observations extracted from the active Nile River channels. We then used these characteristics to map the distribution of the paleochannels, and finally validated the inferred paleochannel distribution using sediment core and geophysical data.
Conceptual model
Basin flooding irrigation was applied across the entire delta up to the late 1960s, when the Aswan High Dam was constructed. Since then, seasonal flooding events have been controlled and basin flooding irrigation has been abandoned (El-Gamal, 2000). Prior to the erection of the Aswan High Dam, excess Nile River waters during the flood seasons overflowed the channel banks and deposited much of their sediment load near and beyond the banks. This was especially true for the coarser grain particles that deposited in the channel bed and on the river banks, whereas the finer sediment loads were carried by the overflowing waters away from the channels and deposited in the floodplains surrounding, or distant from, the river banks. In such settings, the grain size distribution of sediments within the river beds and on the river banks are largely dominated by coarser-grained sediments (sands and silty sands), whereas those within floodplains are largely composed of fine-grained silts and clays (Stanley and Jorstad, 2006; Thonon et al., 2007). With recurring River Nile floods, coarser-grained sediments accumulate and build up in the river bed and on the river banks to form natural levees that stand higher than the surroundings (Said, 1993). El Bastawesy et al. (2017) noted that the current and defunct Nile River distributaries are standing higher (by ~4 m) than their surroundings and attributed this to the differences in the hydrological and sedimentological characteristics of the sediments making up the rivers and the surrounding floodplains.
The approach: Tracing paleochannels and validation
Paleochannel extraction using DEM
We applied procedures and datasets developed by El Bastawesy et al. (2017) to map the distribution of paleochannels across the entire Nile Delta and surroundings. They delineated the defunct Nile River distributaries, the Saitic and Sebennitic, and found a good correspondence between the inferred and documented (Baynes, 1888) distribution of the paleochannels.
We mapped the spatial distribution of paleochannels in the entire Nile Delta from 195 high-resolution (1:25,000 scale; 0.50 m contour interval; 0.10 m spot height interval) topographic sheets (Egyptian Surveying Authority (ESA), 1946). The older maps were favored over the recently generated topographic sheets and DEMs since the older maps are not affected by the accelerated anthropogenically induced changes in the Nile Delta landscape following the construction of the Aswan High Dam. One of these changes is related to the significant reduction in sediment flux distribution under controlled flow rate (Syvitski et al., 2009). The individual maps were scanned, georeferenced using a unified projection (UTM zone 36) and WGS 1984 datum, and mosaicked to generate a topographic map for the entire delta. The elevation contours and spot heights were digitized from the topographic maps and a DEM (10 m spatial resolution) was extracted using nearest neighbor spatial interpolation functions in ArcGIS platform (Figure 2).
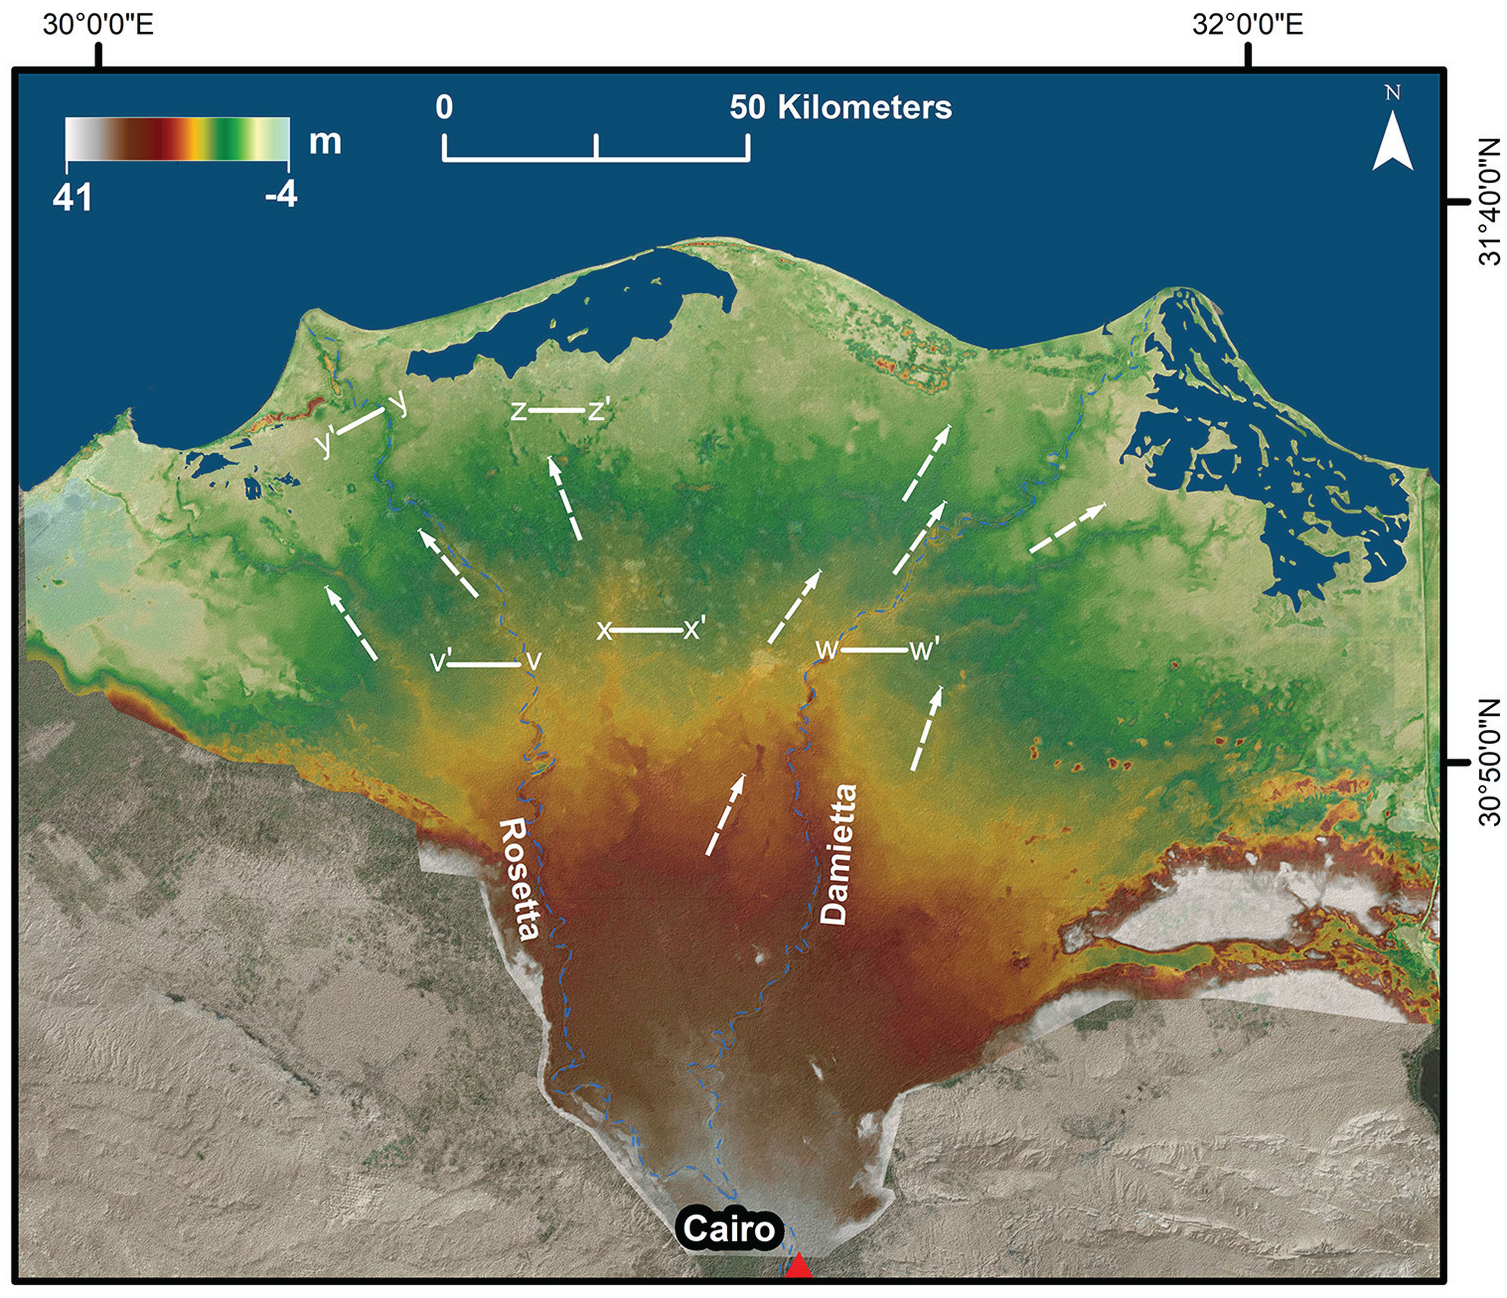
Color-coded DEM extracted from mosaicked, high-resolution, topographic sheets (195 sheets). The white arrows show the orientation and distribution of a few of the elevated banks flanking the paleochannels.
The paleochannels were extracted by creating an ‘inverted DEM’. Using the ArcGIS hydrology analysis tool, the distribution of the elevated banks flanking the paleochannels on the original DEM, now valleys on the reciprocal product, was extracted from the inverted DEM product. In this procedure, depression-free surfaces are generated followed by identification of the flow direction and flow accumulation patterns. Finally, the stream network is extracted and converted to feature class from the raster product.
The validity and accuracy of this approach was tested against the historical records for the distribution of paleochannels (section ‘Paleochannel distribution from DEM’), subsurface data (core samples) from 10 wells (section ‘The MEDIBA database’), and geophysical investigations (section ‘Geophysical investigations’). The relationship between the inferred paleochannels and current irrigation canals in the Nile Delta was also investigated.
Core sample analysis
The validity and accuracy of the paleochannel extraction exercise using high-resolution DEM was tested using stratigraphic analyses of 10 core sample records from the Mediterranean Basin (MEDIBA) program (Stanley et al., 1996). The examined wells used for this investigation are shown in red squares in Figure 3a. In this analyses, the lithological and grain size distribution of the core samples that lie on, or in the immediate surrounding of, the DEM-inferred paleochannels was investigated to observe the pattern as well as the spatial variation of the lithological and grain size distribution within the paleochannels (banks) and floodplains to further validate the accuracy of the paleochannel delineation approach. A lithological cross-section was constructed using core samples located proximal to the delineated paleochannels to demonstrate the relationship between lithology and spatial distribution of the paleochannels (Figure 4).
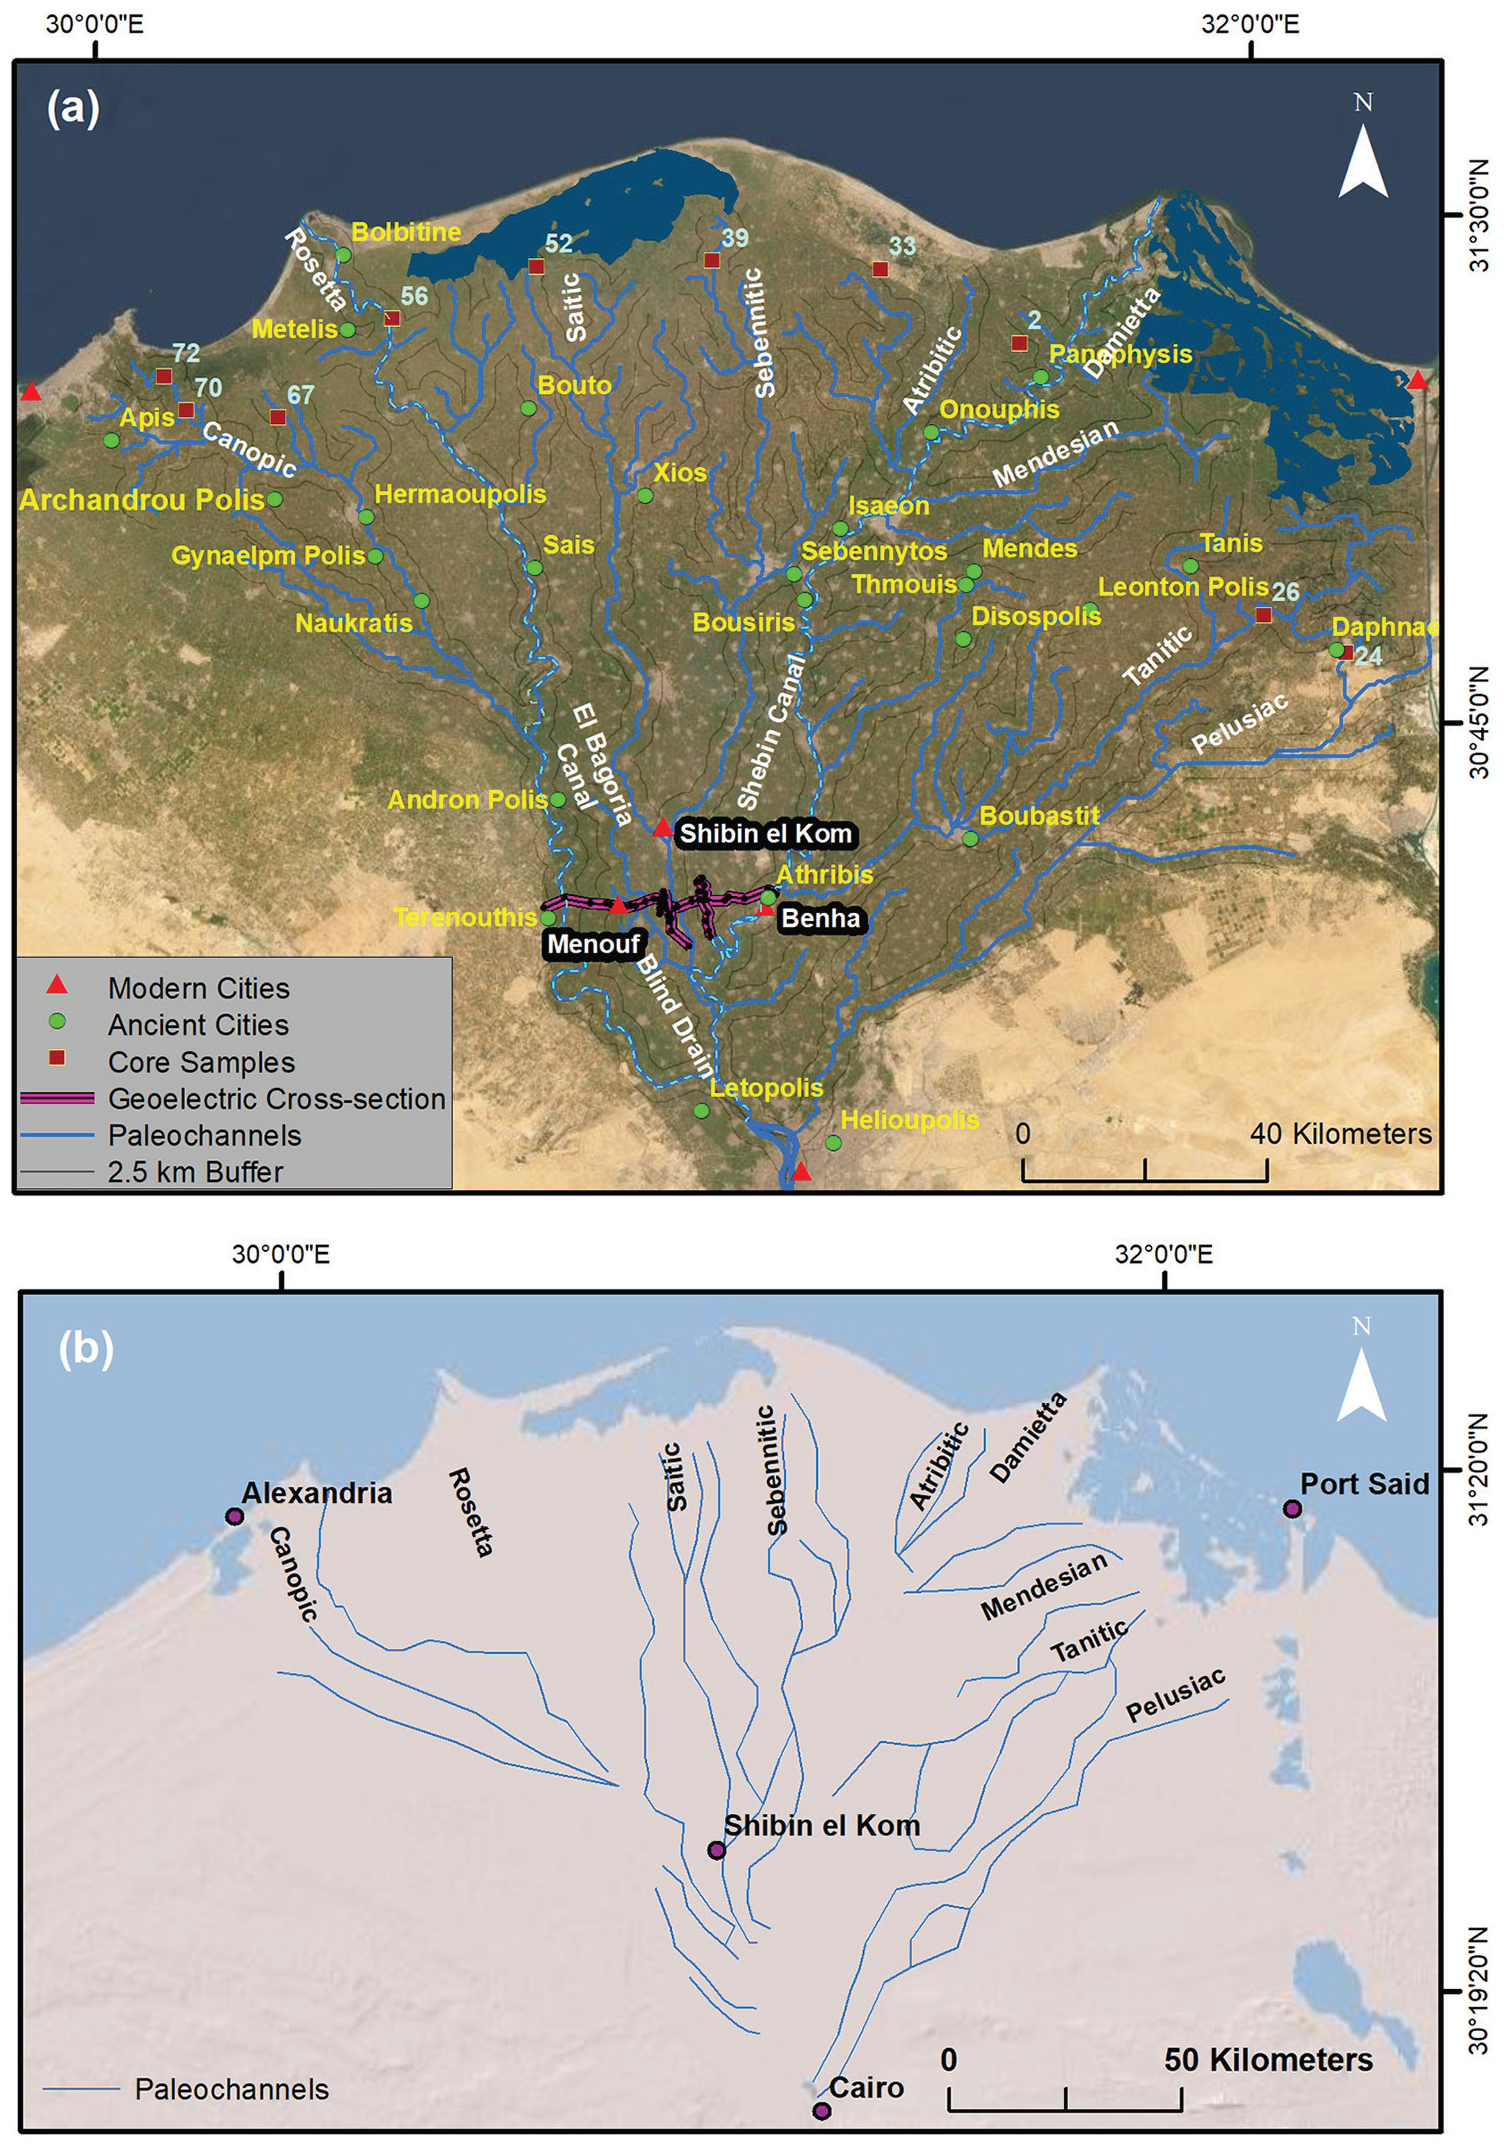
(a) Paleochannel distribution extracted from the generated DEM. Also shown are locations of boreholes used in the core sample analysis, the geophysical profiles and DCR survey points, the ancient and modern cities (Angelopoulos, 2003; Blouin, 2014), and the currently active branches of the Nile River – Rosetta and Damietta (dotted light blue line). (b) Paleochannel distribution extracted from historical records (Ross et al., 1978; Stanley and Clemente, 2014; Wright and Coleman, 1973).
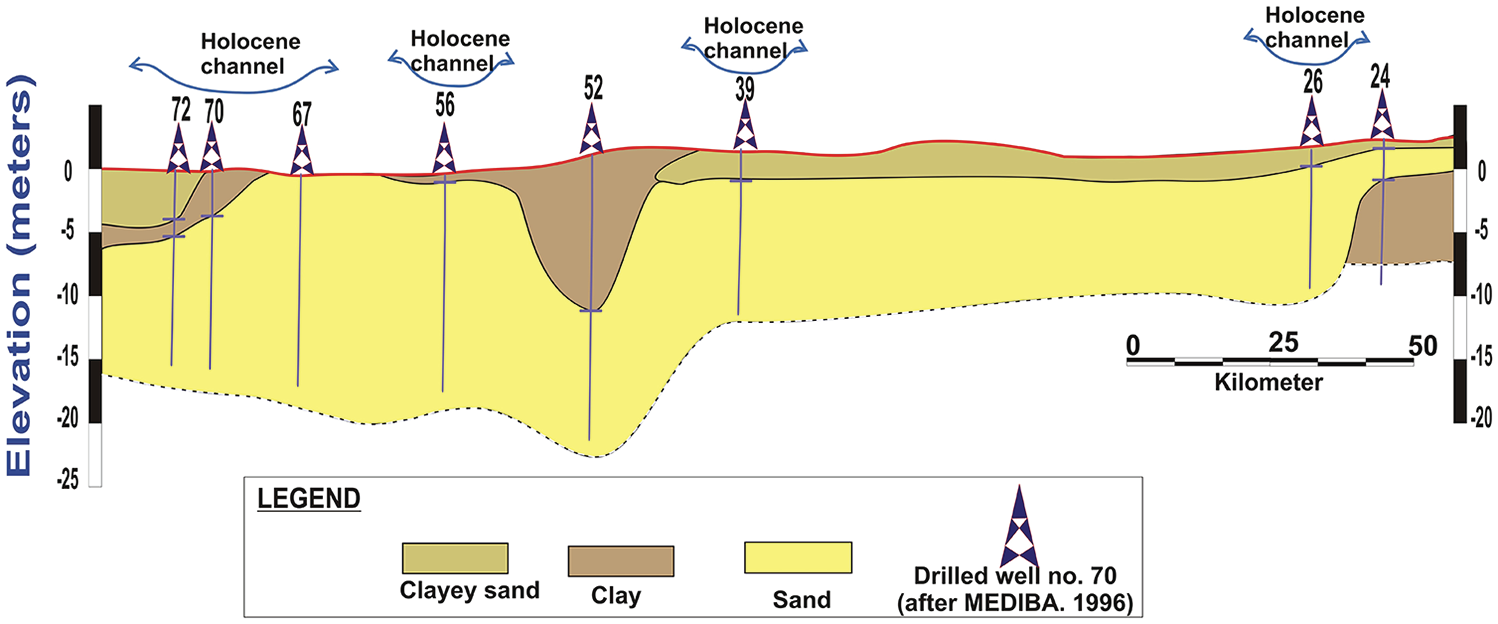
Schematic east-west oriented lithological cross-section (late Pleistocene and Holocene) of core samples (from the MEDIBA database) located proximal to the DEM-delineated paleochannels (Figure 3a).
Geophysical surveys
We applied the direct current resistivity (DCR) measurements to depict the subsurface geology and ultimately detect, delineate, and validate the paleochannels extracted using the high-resolution DEM. Geophysical investigations were carried out in the southern parts of the delta given that detailed subsurface information is available for the northern portion of the delta (Stanley et al., 1996), but not for the south.
The 1D DCR sounding measurements were first carried out along east-west and north-south profiles perpendicular to three of the delineated paleochannels and the current active Rosetta and Damietta branches, at times paralleling irrigation canals and drains (Figures 3a and 5). Forty-seven DCR sounding measurements were obtained with 300 m maximum half-electrode spacing (AB/2) using a Schlumberger array (Figures 3a and 5). The Rosetta and Damietta were included (survey points 34 to 35 for Rosetta branch and 22, 29, and 30 for the Damietta branch; Figure 5) to identify the electrical response of the current channels and surroundings and thereafter investigate the presence of a similar response over the DEM-delineated paleochannels. Data from nearby boreholes were used for calibration purposes. Because the results of DCR sounding interpretations can only be applied to the immediate surroundings of the sounding points, 2D resistivity sections were derived from 1D DCR inversions, and 2D electrical resistivity tomography (2D-ERT) surveys were also carried out (Figures 3a and 5).
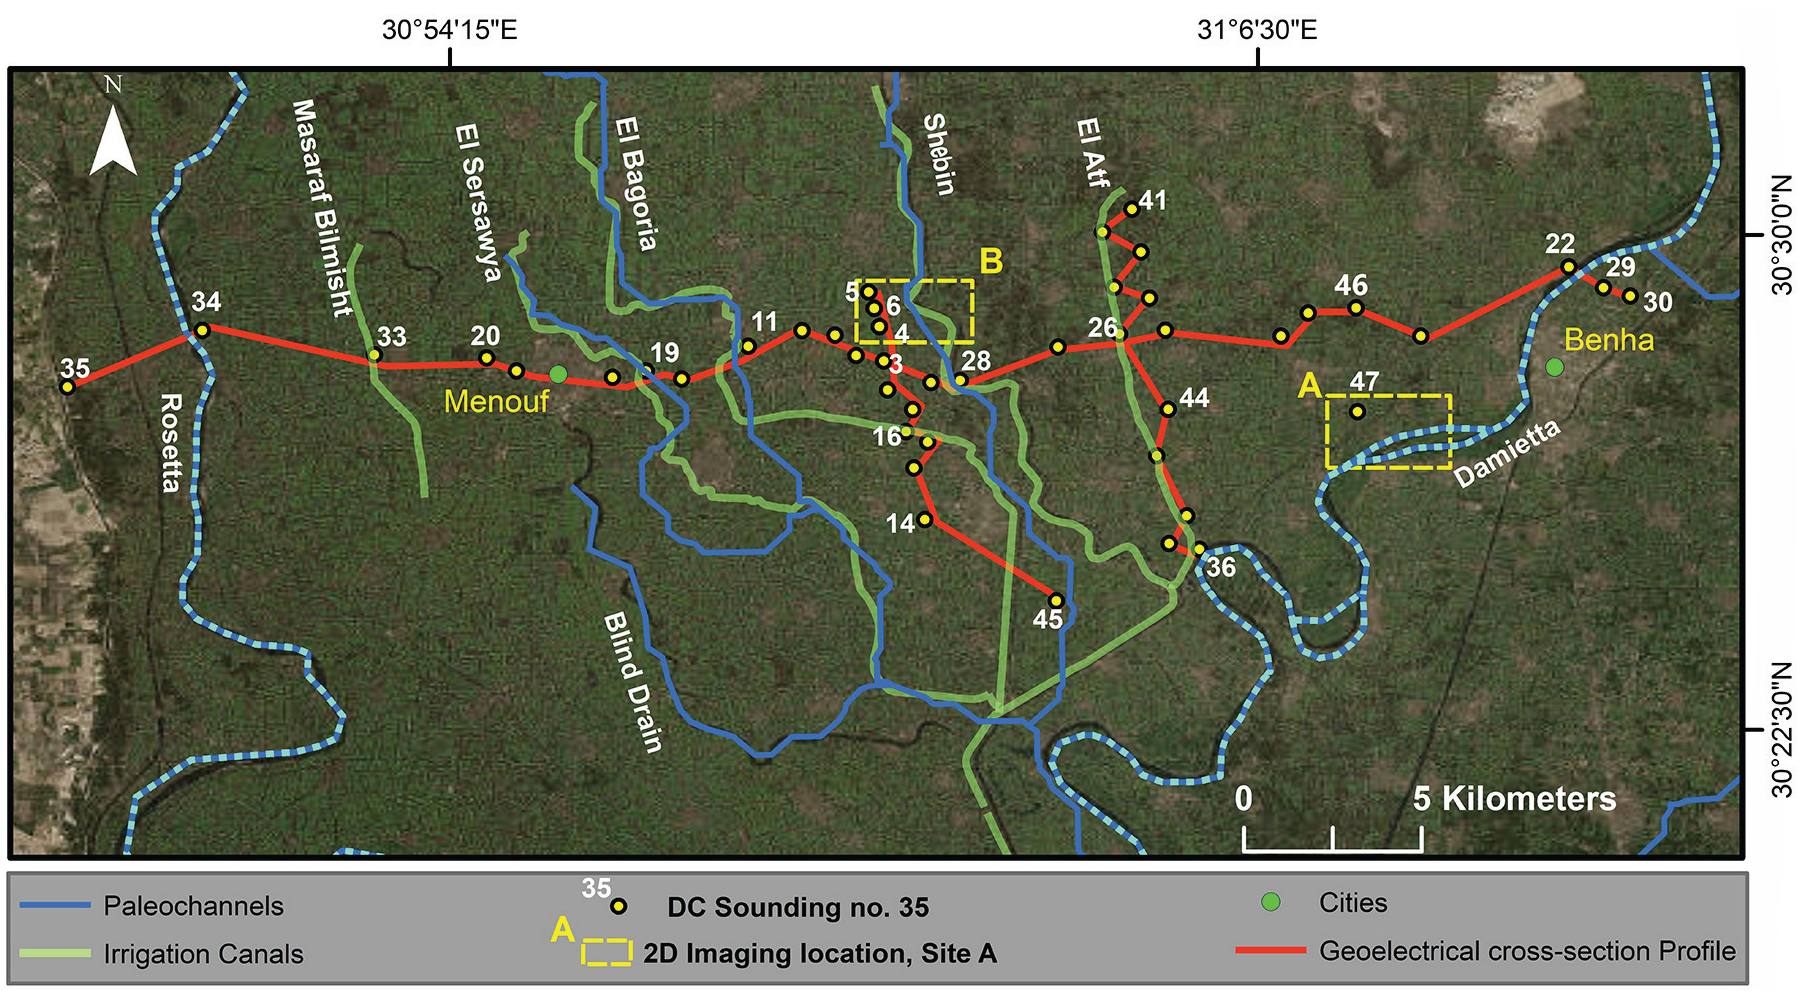
Location map for the geophysical profiles (DCR soundings and ERTs) intersecting the Rosetta and Damietta branches (dotted light blue line), current irrigation canals, and three of the DEM-delineated paleochannels. The yellow dotted boxes outline the areas where the ERT surveys were carried out.
An IRIS Syscal R2 instrument was used for carrying out the DCR measurements. The precise locations and elevations of the DCR survey points were acquired using a hand-held GPS unit. The apparent resistivity readings from the DCR soundings were processed and inverted using IPI2Win software (Bobachev, 2002). Data processing included rejection of data readings showing abrupt resistivity changes (compared with surrounding points). The inversion process was carried out using a 1D linear filtering (i.e. forward modeling) and damped least-squares (Levenberg–Marquardt) algorithm. Then, the inversion results of the conventional inversion method and borehole data were considered to adapt the search space of genetic algorithms (GAs), that is, non-conventional inversion method. Figure 6 shows the calibration example between the interpreted resistivity layers of the selected DCR sounding No. 28 (for location, see Figures 3a and 5) applying GA (Başokur et al., 2007) and the corresponding borehole data. Here, the population size and the generation numbers were 50 (Figure 6). The other DCR soundings were inverted using GA applying the same number of population and generations.
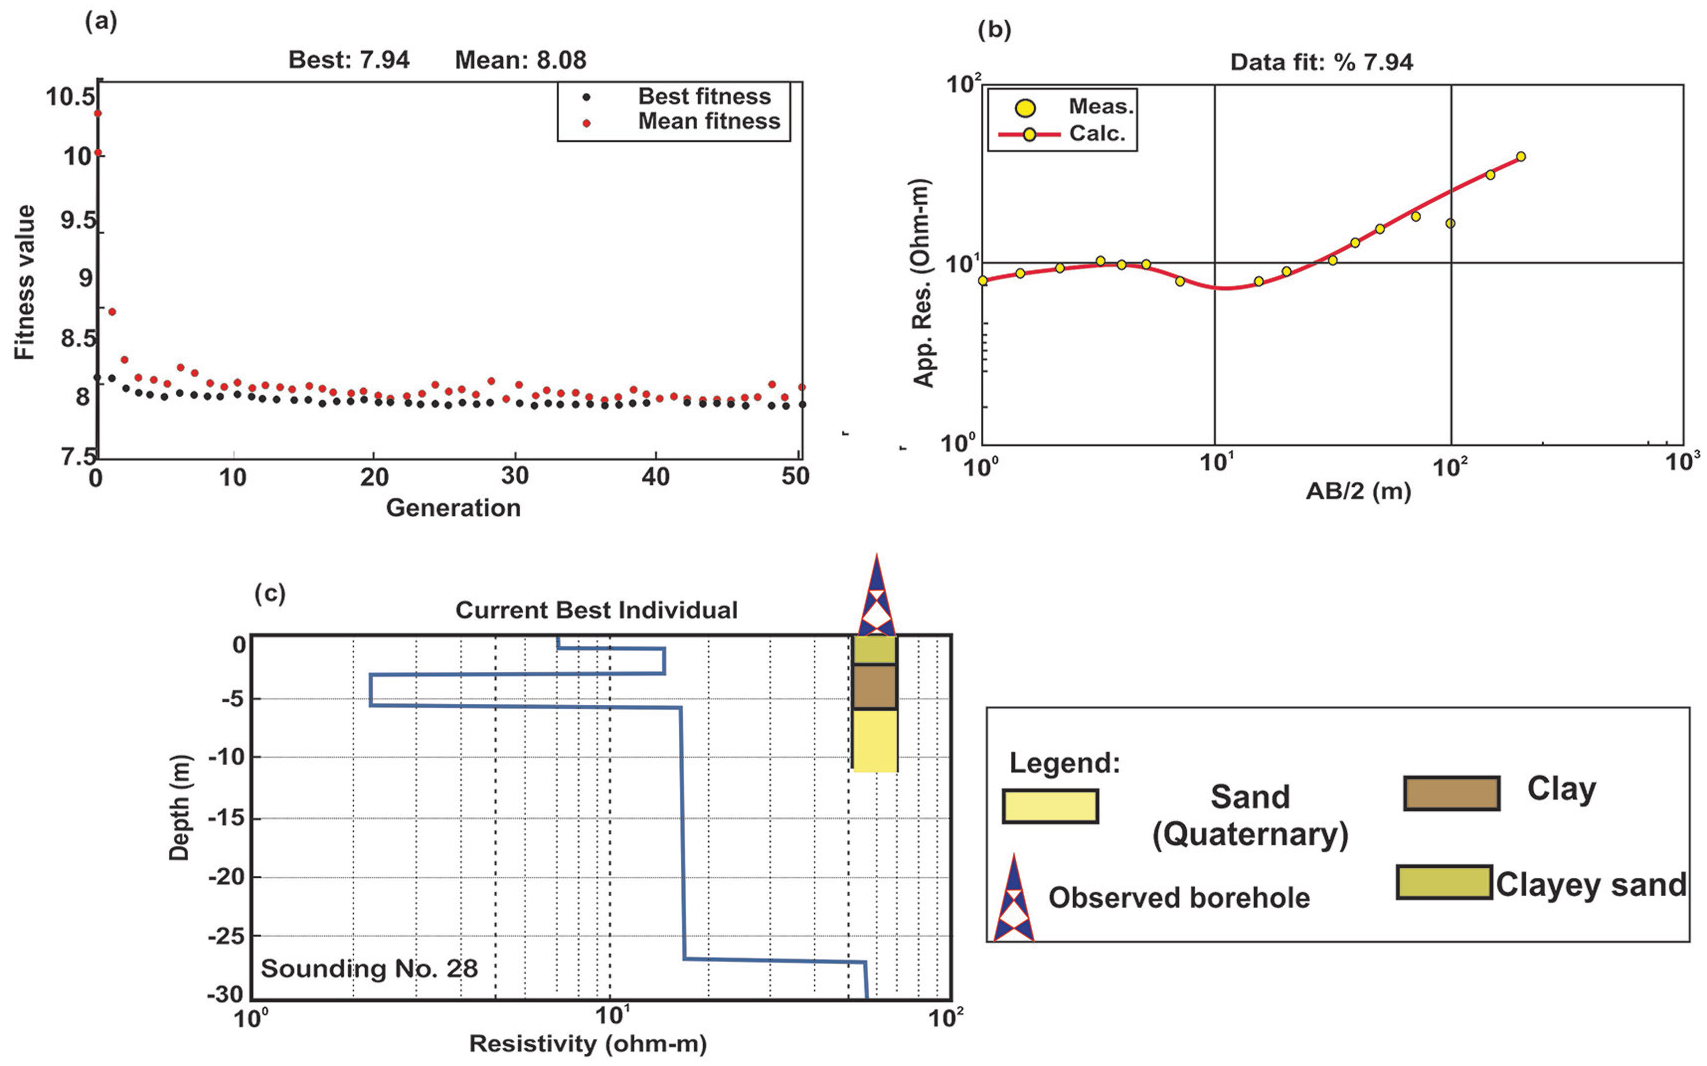
Inversion results of DCR No. 28 (for location see Figure 5) applying GA: (a) Mean and best misfit variation versus generation; (b) the measured and calculated resistivity data comparison at the best misfit value; and (c) a comparison between the model response applying GA and the observed borehole data.
DCR sounding measurements and analyses were further supplemented with 2D-ERT investigations that were carried out along six profiles over two sites (sites A and B; Figure 5) with an electrode spacing of 5 m using the Wenner–Beta (WB) array configuration. The 2D-ERTs were conducted as combined dataset from overlapping profiles at areas A and B. For example, site B (Figure 5) comprises four 2D-ERTs, each of which was 145 m long. As with the 1D survey, we tested the validity of our ERT analysis on the Damietta branch (site A; Figure 5) and investigated the presence of similar electrical resistivity responses over the DEM-delineated paleochannel overlapping with an active irrigation canal. The 2D-ERT data were processed and inverted using the Boundless Electrical Resistivity Tomography software package (Günther and Rücker, 2015).
Results
This section is divided into two subsections. First, the results of the paleochannel mapping exercise using high-resolution DEM data are discussed followed by a subsection dedicated to discussing validation methods and datasets used to support and validate the reliability of the paleochannel delineation procedure. Explicit validation methods and datasets and their overall significance in complementing the paleochannel delineation exercise in the study area are discussed in depth in this section.
Paleochannel distribution from DEM
The DEM-generated channel network shows elevation differences between the Nile Delta floodplains and what is presumed to be the remnants, or currently active branches, of the Nile River. For example, differences of up to 3.80 m are observed between the banks and floodplains of the Rosetta (elevation: v: 6.30 m; v′: 3.20 m; Figure 2) and Damietta (elevation: w: 6.50 m; w′: 2.70 m; Figure 2) branches in the upstream areas. This is also true for the paleochannels. Differences of up to 1.68 m are observed between the banks and the floodplain of the Saitic paleochannel (elevation: x: 5.68 m; x′: 4 m; Figure 2). These differences in elevation decrease downstream. This is to be expected given that the sediment load and the grain size of the transported particles decrease downstream. For example, the difference in elevation between the bank and floodplains for the upstream Rosetta branch (Figure 2; points v–v′) decreases from 3.80 to 1.20 m between points y and y′ downstream, and a similar drop is observed along the Saitic paleochannel (Figure 2: difference in elevation: x–x′: 1.68 m; z–z′: 0.90 m).
We mapped all of the nine historically documented paleochannels (Canopic, Bolbitinic/Rosetta, Saitic, Sebennitic, Atribitic, Bucolic/Damietta, Mendesian, Tanitic, and Pelusiac; Figure 3a, b) and our DEM-based distribution matched the overall distribution described in historical records (Ross et al., 1978; Stanley and Clemente, 2014; Wright and Coleman, 1973). Earlier maps derived from different sources that depict the distribution of paleochannels in the Nile Delta (Figure 3b) were coarse and lack the detail presented in our distribution (Figure 3a). Our distribution reveals an elaborate and extensive network of channels that were not represented in the earlier attempts. For instance, the Canopic branch is mapped as a single river branch with no subsidiary branches splitting off from the main distributary line in earlier studies (Ross et al., 1978; Stanley and Clemente, 2014; Wright and Coleman, 1973; Figure 3b). However, we mapped eight sub-branches of the main Canopic paleochannel (Figure 3a). Similarly, we mapped previously unidentified sub-branches for the Rosetta (4), Saitic (2), Sebennitic (6), Damietta (5), Mendesian (2), Tanitic (10), and Pelusiac (9) paleochannels (Figure 3a, b). Overall, we identified 76 main and subsidiary paleochannel branches with a total length of over 500 km that were not previously reported in the historical records. Moreover, we mapped the precise location, distribution, and morphology of the aforementioned Nile River branches. The majority of the previous studies relied on historical documents that provided approximate locations of the main paleochannels and did not adequately map the networks associated with these main channels.
As outlined earlier, the accuracy and reliability of tracing the spatial distribution of paleochannels in the Nile Delta using the DEM were validated using available subsurface data from the MEDIBA program (Stanley et al., 1996) in the northern delta, and observations from geophysical profiles that were conducted near Menouf and Benha cities in the southern delta (Figures 3a and 5). The analyses and interpretations derived from these datasets and methods are discussed in the following sections.
Validation of DEM-derived paleochannels
The MEDIBA database
Detailed analysis of the lithological content of the core samples recovered from drill holes on, or close to (<2 km), the DEM-delineated paleochannels shows that the identified channels cut through areas dominated by sandy and silty/clayey facies, while the surrounding floodplain deposits are notably of higher clay thickness. Samples from core sites proximal to the DEM-based paleochannels (sites S24, S26, S39, S52, S56, S67, S70, and S72; Figures 3a and 4) show lithological and grain size patterns similar to those of riverine or near-riverine deposits (sand, silty/clayey sand). On the contrary, the sediment composition of the core samples collected from the floodplains and distant from the paleochannels (sites S2 and S33; Figures 3a and 4) are good indicators of the lithological and grain size makeup of floodplain deposits (silt, silt/mud, and clay).
Samples from core sites S67, S70, and S72 are associated with what has been historically identified as the Canopic branch (Figure 3a, b) (El Fattah and Frihy, 1988; Ross et al., 1978; Wright and Coleman, 1973). The lithological composition of these cores is largely dominated by Holocene sand and silty/clayey sand layers (ratio against clay S67: 90%; S70: 93%; S72: 83%) followed by thick Pleistocene sand deposits. Core from site S39 lies on the Sebennitic branch and comprises a thin Holocene sand and silty/clayey sand-dominated layer (sand and silty/clayey sand fraction: 71%) overlying a thick (14.40 m) sand-dominated layer of late Pleistocene age. Core site S24 (sand and silty/clayey sand ratio against clay: 73%) and S26 (sand and silty/clayey sand ratio against clay: 75%) lie on the Pelusiac and Tanitic branches, respectively, and show similar stratigraphic succession patterns to the above-described core samples from locations proximal to the delineated paleochannels (Figures 3a and 4).
Geophysical investigations
The 1D DCR inversion results
Three geoelectrical cross-sections were constructed using available borehole and geophysical datasets. Borehole data were used to assign resistivity values to the intercepted lithologic units. The soundings were used to generate three stitched east-west (Figure 7) and north-south (Figure 8) trending geoelectrical cross-sections and were calibrated against data from seven boreholes. The figures also show elevation profiles for each of the cross-sections (Figures 7 and 8). Although a maximum half-electrode spacing of 300 m was used for the measured DCR soundings, the inspection of the constructed geoelectrical cross-sections (Figures 7 and 8) show that the maximum depth of the Holocene layers does not exceed 30 m. Underlying the Holocene deposits lies a thick (>100 m on the central and southern parts of Nile Delta) Quaternary aquifer (sand and gravel) as observed in this study as well as earlier studies (e.g. El Haddad, 2002).
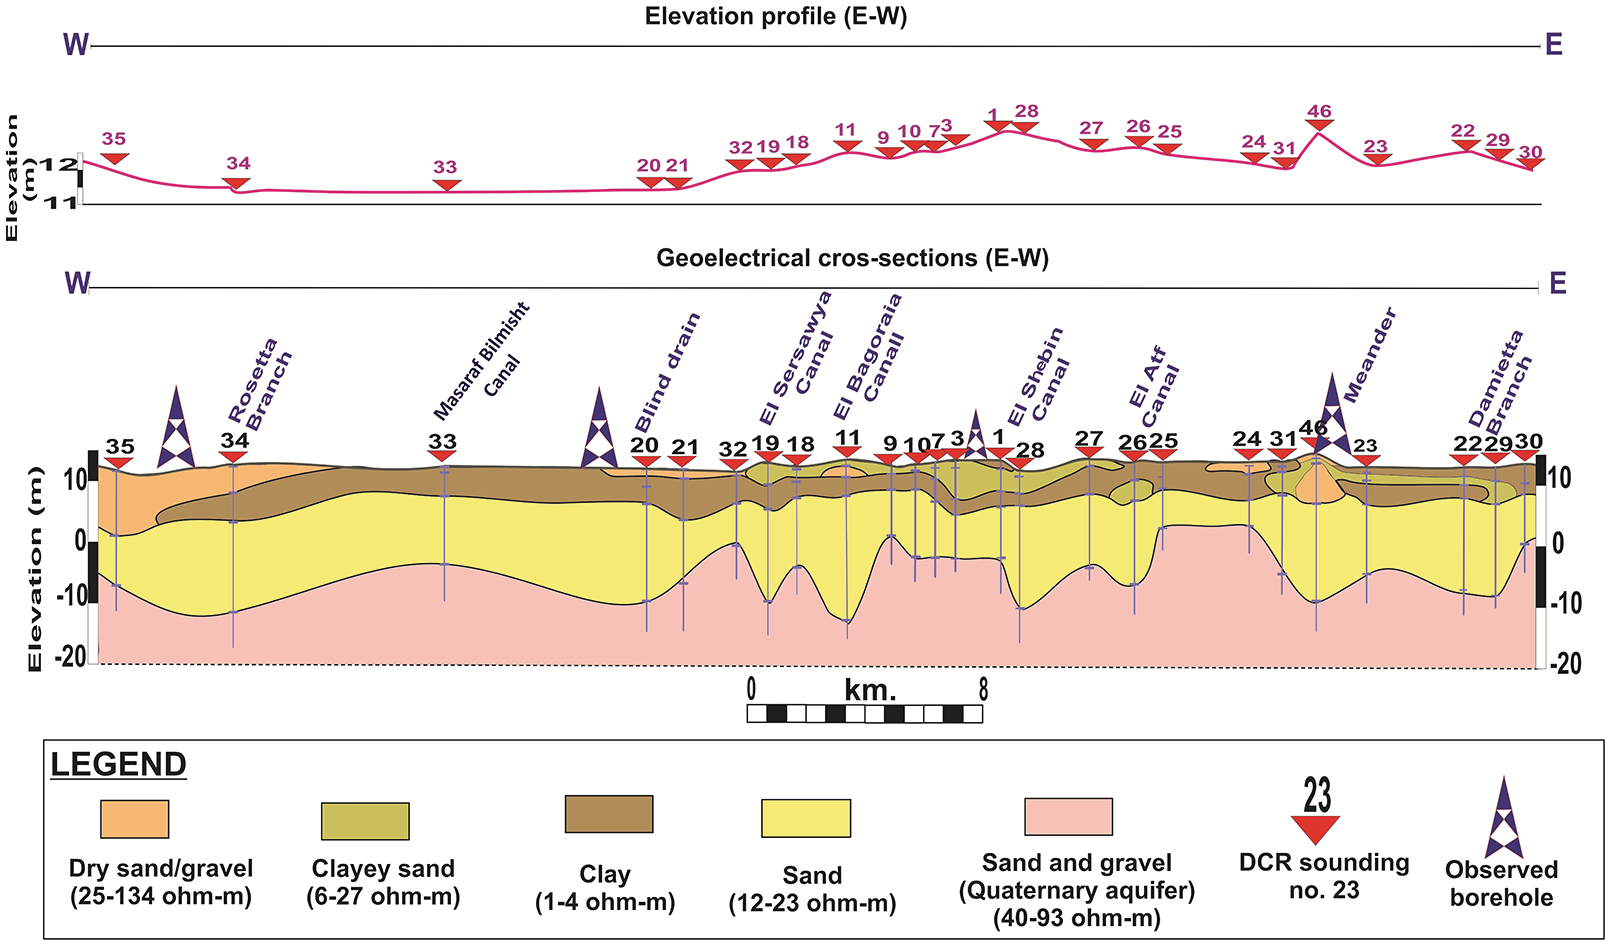
East-west trending elevation profile (top) and stitched resistivity cross-section (bottom). For location, see Figures 3a and 5.
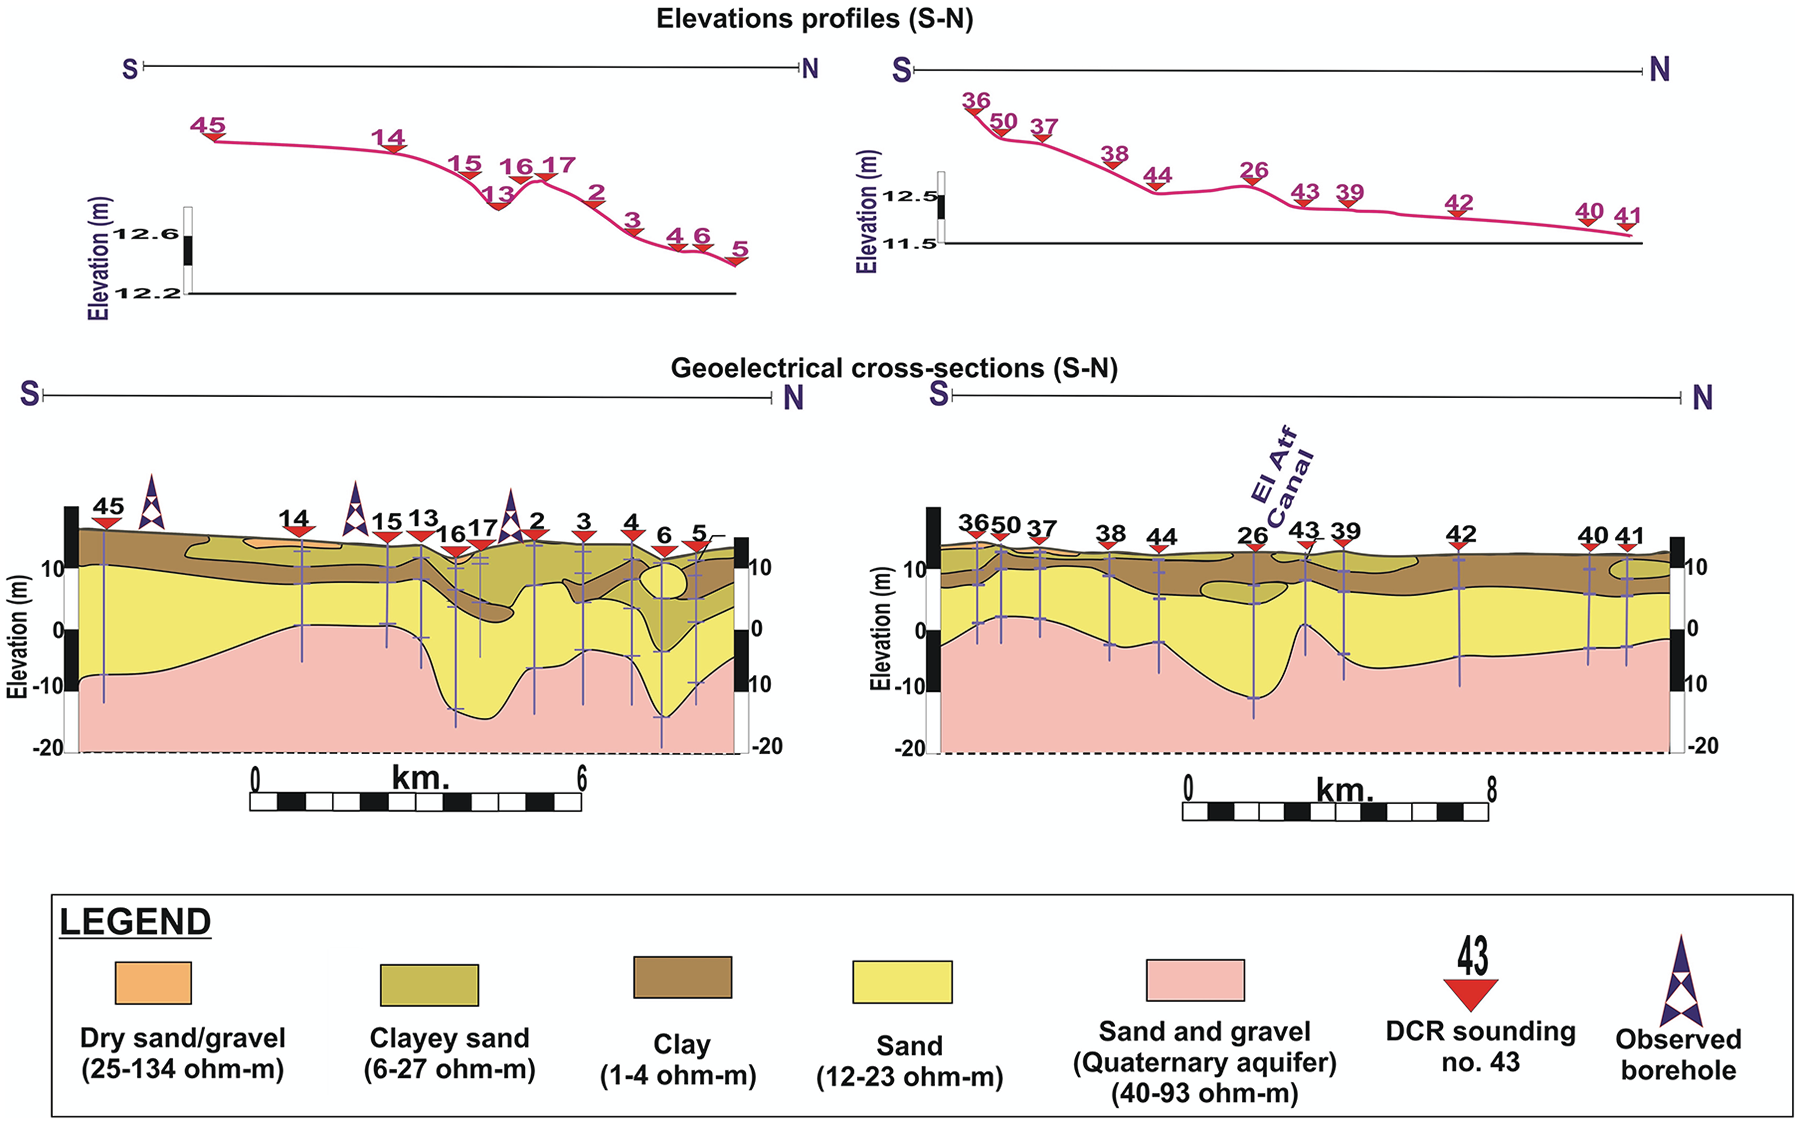
North-south trending elevation profiles (top) and stitched resistivity cross-sections (bottom). For location, see Figures 3a and 5.
As most paleochannels are typically formed of coarse-grained and non-saturated fluvial sediments, they exhibit low electrical conductivity (i.e. high resistivity), whereas finer-grained sediments (e.g. silt and clay) show high electric conductance (low resistivity) (Baines et al., 2002; Sandberg et al., 2001). The constructed geoelectrical cross-sections show three main geoelectrical layers. The topmost layer yields a wide range of resistivity values (1–134 Ω m) and is a heterogeneous layer of variable amounts of clay, silt, and gravel. The second geoelectrical layer is a medium resistivity (12–23 Ω m) unit that corresponds to the upper Quaternary sand aquifer (Rizzini et al., 1978), and the third is a high resistivity layer (>40 Ω m) of the main Quaternary sand and gravel aquifer (Rizzini et al., 1978). Figures 7 and 8 show the following: (1) the depth to the third geoelectrical layer is irregular and deepens under the channel-like features (e.g. Rosetta, Damietta, El Bagoria, and El Atf; Figures 7 and 8) and (2) ancient and contemporary channels are characterized by topographic high expressions.
The 2D-ERT survey results
Although the DCR soundings gave a general overview of the subsurface lateral heterogeneities, the interpretation of these soundings can only be applied to the immediate vicinity of the soundings. The 2D-ERTs were carried out at two sites (A and B, Figure 5) to observe and map the near-surface Quaternary deposits (unconsolidated Holocene and upper Pleistocene Nile Delta deposits) and to characterize the observed lateral changes within the first geoelectrical layer and close to the paleo- and contemporary channels of Nile Delta. Moreover, the 2D-ERTs at the two sites (A and B, Figure 5) were used to verify the observed shallow near-surface features (i.e. sandy channel-like features, Figures 7 and 8), on the constructed geoelectrical cross-sections at soundings No. 46 and 6 (Figures 7 and 8).
Figure 9 shows the 2D-ERT of joint data inversion of P1 and P2 profiles at site A (for location, see Figure 5). These 2D profiles were measured parallel to the Damietta branch and Shebin canal (Figure 9a). Three main geoelectrical layers were observed: an upper low resistivity clay layer that is dissected by a medium resistivity fine sand layer in a channel-like setting. The geoelectric layers were calibrated against borehole data (Figure 9b). The data and interpretations for the 1D DCR of sounding No. 47 and 6 and for the 2D-ERTs at sites A and B are consistent with near-surface distribution of a (slightly saturated) sandy layer (Figures 9b and 10b) that is here interpreted to be deposited by an ancient meander. Moreover, the resistivity values derived through both 1D DCR sounding and 2D-ERT surveys are within a very comparable range. For instance, the 1D DCR-derived resistivity values for the sandy layer at sounding No. 6 (Figure 8) are nearly congruent with the analysis result of the overlapping 2D-ERT at the same location (Figure 10b).
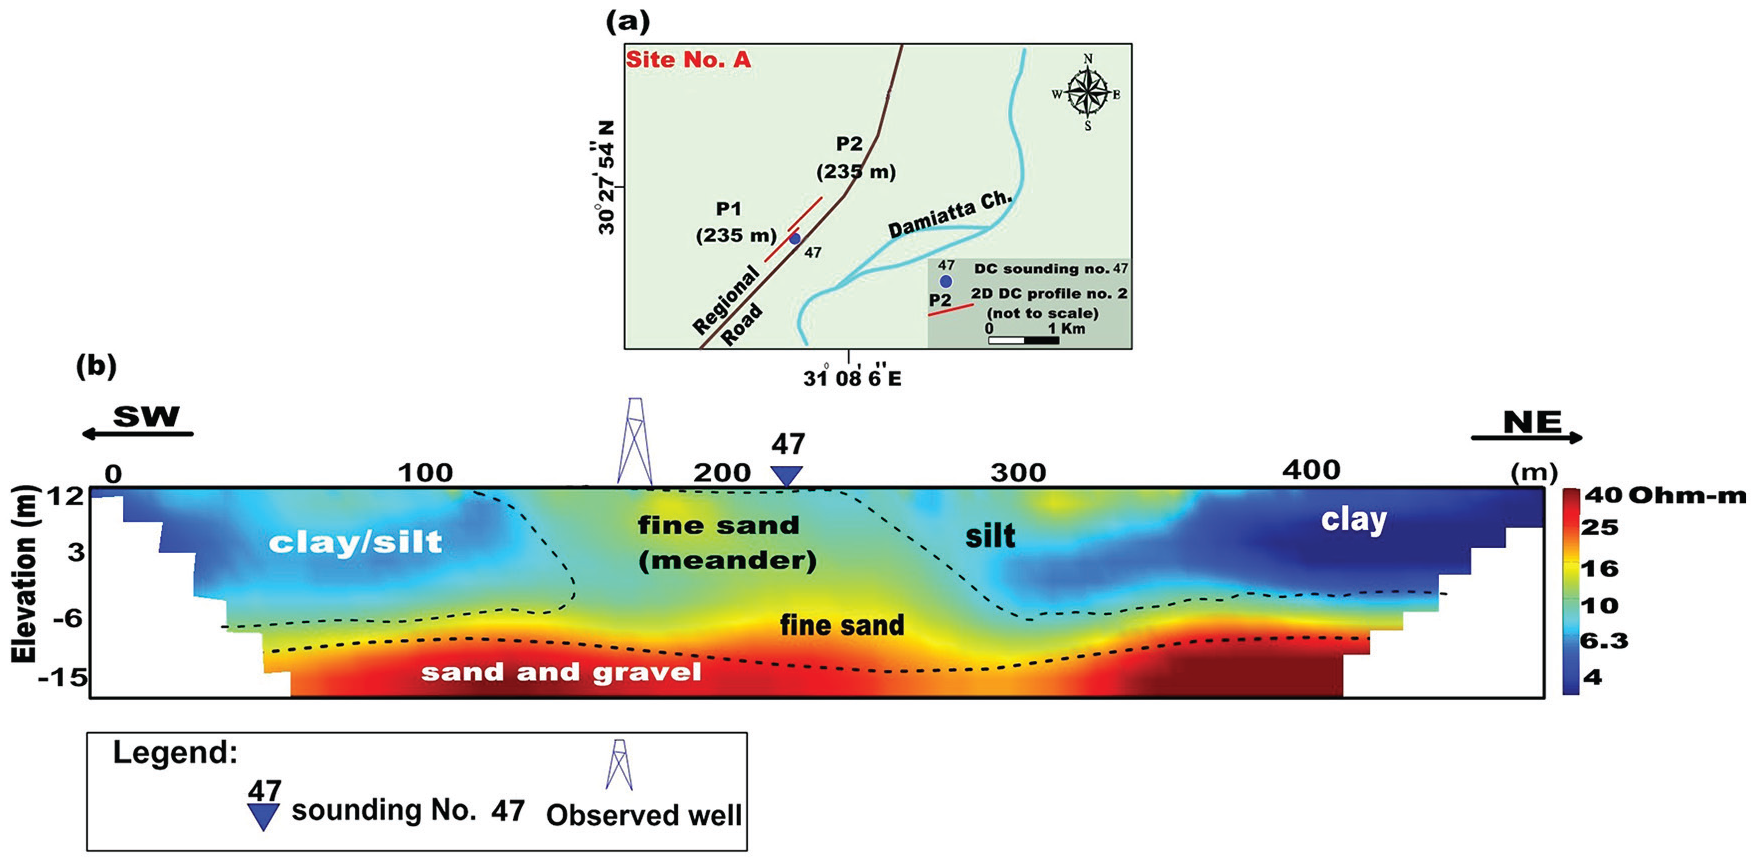
(a) Location of 2D-ERTs (P1 and P2) at site A (for location, see Figure 5) and (b) 2D joint inversion of P1 and P2 Wenner–Beta datasets.
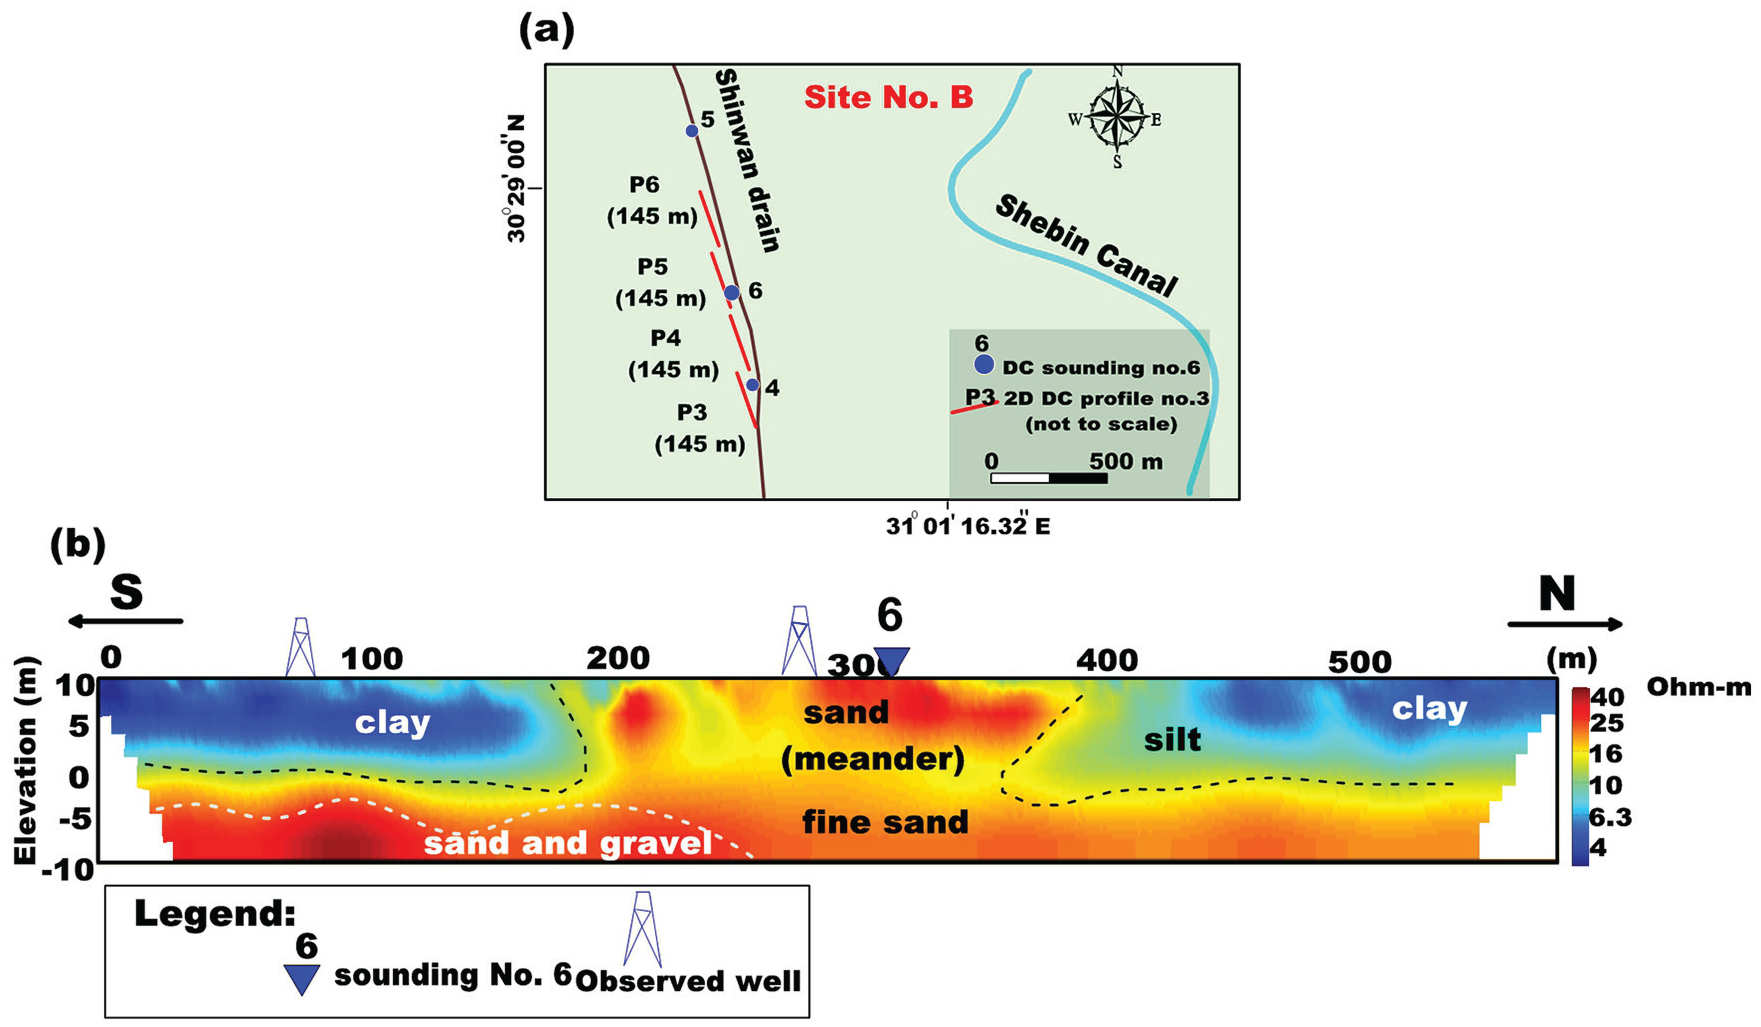
(a) Location of 2D-ERTs (P3, P4, P5, and P6) at site B (for location, see Figure 5) and (b) 2D joint inversion of P3, P4, P5, and P6 Wenner–Beta datasets.
The uppermost layer of the constructed geoelectrical cross-sections displays significant lateral heterogeneity as shown by the range of resistivity values (Figures 7 and 8). Moreover, the constructed geoelectrical cross-sections showed that the resistivity range of sandy meanders and surrounding sediments of silt/fine sand is in the same order. However, the detailed lateral imaging capability of the 2D-ERTs allowed to distinctively map the extent and morphology of the meanders (Figures 9b and 10b).
At site B (for location, see Figure 5), four ERTs (P3, P4, P5, and P6) were measured (Figure 10a) parallel to one of the delineated paleochannels (parallel to the Shebin canal) and a joint dataset inversion was conducted (Figure 10b). The calibrated (against borehole data) 2D-ERT shows three main geoelectrical layers: a low (top unit), medium (middle unit), and high resistivity (bottom unit) layers (Figure 10b). The central part of the profile shows medium to high resistivity values (~200–300 Ω m) for the fine sand to gravelly sand, which is here interpreted to be deposited by an ancient meander. This setting is similar to that observed at site A, that is, a channel-like feature cutting the low resistivity (<10 Ω m) clay and silt layer.
Discussion and conclusion
Mapping paleochannels from elevation data preceding intense anthropogenic activity: Comparison with other methods and datasets
We developed and applied a straightforward early topographic map–derived DEM-based method to map the spatial distribution of the ancient branches of the Nile River. The DEM-based paleochannel distribution was verified against historical records, core data, and geophysical observations. The adopted approach is novel in three main ways: (1) it can be readily applied to deltaic and non-deltaic setting, where intense anthropogenic processes have highly modified the surface morphology, rendering the applications of other traditional paleochannel mapping techniques unsatisfactory, (2) it is robust and cost-effective compared with traditional subsurface investigation techniques (e.g. near-surface geophysics, drilling), and (3) it allows detailed and accurate mapping of paleochannel networks across an entire delta with the same observational parameters. Comparisons are provided below to demonstrate the novelty of our approach compared with earlier and alternative paleochannel mapping techniques.
All in all, we identified 76 main and subsidiary paleochannels with a total length exceeding (by >500 km) previously mapped paleochannels. Earlier attempts were largely conducted by geophysical methods, were guided by historical records, and their applications were constrained by their limited capabilities to cover large areas. Even when applied to small areas, many of the geophysical methods did not fully capture the spatial heterogeneity within investigated areas perhaps because of the data interpolations carried out to fill the gap between neighboring measurements. Using geoelectric resistivity surveys, El Gamili et al. (2001) mapped the Sebennitic and Bucolic branches near Samannud area in the Nile Delta and noted that Sebennitic branch bifurcates into two branches 5 km north of Samannud. Our analysis of the same area revealed similar results (Sebennitic branch branches into two distributaries 9 km north of Samannud), but unlike their analysis, we identified a major Sebennitic branch near Mahala city that flows up to the current Burrulus Lake (Figure 3a).
LiDAR DEM data are considered as one of the best datasets for mapping geomorphological temporal and spatial variations given its high spatial resolution (James et al., 2012; Ninfo et al., 2016). As stated earlier, these data are unavailable for the Nile Delta and even if it was, it would probably not have been the optimum choice given that the deployment of these sensors and acquisition of LiDAR data started in the past two decades. Thus, the LiDAR DEM-generated paleochannel distribution for the Nile Delta would have been affected by the anthropogenic activities that followed the construction of the Aswan High Dam and continued up to the time the LiDAR data were acquired. Berendsen and Volleberg (2007) stated that newer elevation products such as LiDAR data might not show the ‘natural’ geomorphological features in a given area due to intense human interference that modified the landscape. Moreover, LiDAR DEM data-based interpretations in the absence of other direct or indirect methods and datasets might be erroneous, and integrating such data with other datasets is highly imperative to produce accurate interpretations that reflect actual surface conditions (Berendsen and Volleberg 2007). Fortunately, detailed topographic sheets were generated for the Nile Delta in the 1940s from which high-resolution digital mosaics (spatial resolution: 10 m; vertical resolution: 0.50 m) were extracted. The latter DEM and the DEM-derived paleochannels reflect a pristine landscape that was not affected by the intense anthropogenic contributions following the construction of the Aswan High Dam. Although not shown, the paleochannels derived from the 2000s SRTM and the recent TanDEM-X DEMs (spatial resolution: 30 and 12 m, respectively) did not reveal the entire distribution of paleochannels that were extracted from the 1940s data. Stanley and Jorstad (2006) traced a single 36 km long meandering relict of the Canopic channel in the north-west Nile Delta (west of Idku lagoon and extending to the western part of the Abu Qir Bay (Figure 1)) using SRTM DEM. Our analysis using the adopted technique and data within the same geographic boundary, on the contrary, revealed more than 65 km long major and subsidiary branches of the Canopic branch.
Optimum conditions for the application of the advocated methodology and possible limitations
The success of the advocated technique in identifying the distribution of paleochannels in deltas worldwide will depend on two major factors. First, the preservation of the topographic expression of the paleochannels, namely, the elevated banks compared with surrounding floodplains at the time of data acquisition. Both natural (e.g. erosion by aeolian and fluvial systems) and anthropogenic (e.g. surface leveling, soil excavation) factors can modify the original topography. In the case of the Nile Delta, these landscape modifications include, but are not limited to, replacing the flood irrigation system by organized irrigation, reclamation of desert lands adjacent to the delta, and expansion of the irrigation and drainage networks. Second, the availability of DEMs with high spatial and vertical resolution for the extraction of detailed paleochannel distribution is a factor. The higher the spatial and vertical resolution of the DEM, the more precise and detailed the extracted distribution. Early topographic datasets acquired prior to the onset of the period of massive anthropogenic-induced modifications have been instrumental in investigating geomorphologic changes in numerous fluvial systems worldwide but the quality and confidence in the historic topographic data could limit their applications in geomorphologic analyses and interpretations (James et al., 2012). For regions such as the Nile Delta where decades of intense natural and anthropogenic processes have altered the morphology of the surface, the accuracy of registering and comparing early produced maps with modern cartographic products based on ground control points (GCPs) has been one key limitation of the approach. Inconsistencies in regard to absence/presence of enough well-defined points that serve as GCPs (in the early maps), as well as the modification of these features due to man-made and natural processes, have been accredited for partly affecting the reliability of the approach (James et al., 2012). In this particular study, the spatial distribution and morphology of most of the elevation benchmarks that were used to register and compare the early produced maps with modern cartographic products of the Nile Delta did not change significantly over time. Gebremichael et al. (2018) compared elevation values of 50 benchmarks with known elevations from the early topographic maps with the recently produced TerraSAR-X add-on for Digital Elevation Measurement (TanDEM-X) and observed a good correlation (R2 = 0.99) between the two datasets.
Potential archeological, geomorphological, and societal implications
Deciphering the evolution of deltas through time has significant geological, archeological, and societal ramifications. The DEM-based paleochannel distribution can potentially assist in developing a better understanding of the evolution of deltas’ landscape and their occupants through time. The former (evolution of the Nile Delta’s landscape) could be addressed by examining the DEM-based paleochannel distribution together with the ages and facies of the paleochannel sediments. The latter (evolution of the Nile Delta’s occupants) can be achieved by guiding archeologists to the archeological urban sites. It is likely that ancient urban developments in the Nile Delta were concentrated along these paleochannels. We tested this assertion through spatial correlation of the distribution of the DEM-derived paleochannels with that of the ancient cities (29 cities in total) within the confines of the study area (Angelopoulos, 2003; Blouin, 2014). A linear buffer distance (radius) was set at 500 m, 1.5 km, and 2.5 km intervals to observe the proximity of the delineated paleochannels to the nearest ancient city. A buffer distance analysis using 500 m radius from the identified paleochannels intersected 10 cities (34.5% of the total number of cities), a 1.5 km radius intersected 19 cities (65.6%), and a 2.5 km radius revealed that 83% of the ancient cities were found within 2.5 km distance from the delineated paleochannels (Figure 3a). These observations suggest that the delineated paleochannel distribution can be a useful guide for locating ancient cities currently obscured by man-made structures or buried under thick Holocene deposits.
By mapping the distribution of paleochannels in the Nile Delta, it is also possible to map the location and extension of the preferred pathways for groundwater flow given their general makeup of coarse sediments (sand and silt) compared with their surrounding floodplains that are generally composed of silt and clay. The identification of these preferred pathways for groundwater flow could be useful in identifying potential areas for agricultural development in areas surrounding these paleochannels, especially those surrounding paleochannels at the fringes of the Nile Delta in the Eastern and Western Deserts.
One of the findings of this research is the observed close association between the identified natural channels and the contemporaneous irrigation and drainage networks of the Nile Delta. The geophysical investigations undertaken paralleling and crossing some of the irrigation canals (e.g. El Bagoria and Shebin in Figures 7 and 10) have shown that some of these canals have lithological and morphological properties that are typically associated with riverine channels suggesting that some of these canals are relicts of the ancient Nile River distributaries.
From geomorphological stand-point, it is apparent from the stitched geophysical profiles (Figures 7 and 8) that the subsurface geometry of some of the delineated paleochannels can be described as having narrow valley and steep bank morphology. This might possibly be due to a short duration but rapid fluvial incision rates within the valleys during the late Holocene, but contrary to the channels with wider beds and gentler slopes that might have developed under gentle incision rates over a long period of time (Davis, 1913), these channels might have gone defunct earlier than the neighboring channels. For instance, the subsurface of the DEM-traced and geophysically validated paleochannel tract that overlaps with the current El Sersawya irrigation canal (Figure 7) depicts a narrow bed and steep bank morphology with a thin sand layer. This is in contrast to wider channel beds, gentle slope banks, and thicker sand layers noted on the mapped paleochannels that partly correspond to the modern irrigation canals of El Bagoria and El Shebin (Figures 3a and 7). In contrast to the two major branches of the Nile River, Damietta and Rosetta, the paleochannel branch that partly overlaps with the El Shebin canal, and forms the root for the historically documented Saitic branch, has narrow channel bed and slightly steeper banks (Figures 3a and 7). Using the notion stated earlier, we can deduce that the Saitic branch developed later than the two main branches of the Nile River and dried up relatively earlier. Reconstructed flow regimes of the Nile River from historical documents (Strabo and Serapion – Said, 1981) supports our analysis. But, it is also important to mention here that chronology of the identified paleochannels in this research requires further direct and/or proxy data to be fully reconstructed.
We suggest that the methodologies developed here for mapping the Nile River paleochannels can be readily applied to deltas worldwide, where high-resolution elevation datasets acquired before the onset of heavy anthropogenic activities are available.
Footnotes
Authors’ Note
The opinions, findings, conclusions, or recommendations expressed in this manuscript are those of the authors alone and do not necessarily reflect the views of the funding or administering agencies.
Funding
The author(s) disclosed receipt of the following financial support for the research, authorship, and/or publication of this article: This research was supported by the US–Egypt Science and Technology (S&T) Joint Fund from the US Agency for International Development and administered by the National Science Foundation (Award Number: 1103843 to Western Michigan University).