
Abstract
Iberia is predicted under future warming scenarios to be increasingly impacted by drought. While it is known that this region has experienced multiple intervals of enhanced aridity over the Holocene, additional hydroclimate-sensitive records from Iberia are necessary to place current and future drying into a broader perspective. Toward that end, we present a multi-proxy composite record from six well-dated and overlapping speleothems from Buraca Gloriosa (BG) cave, located in western Portugal. The coherence between the six stalagmites in this composite stalagmite record illustrates that climate (not in-cave processes) impacts speleothem isotopic values. This record provides the first high-resolution, precisely dated, terrestrial record of Holocene hydroclimate from west-central Iberia. The BG record reveals that aridity in western Portugal increased secularly from 9.0 ka BP to present, as evidenced by rising values of both carbon (δ13C) and oxygen (δ18O) stable isotope values. This trend tracks the decrease in Northern Hemisphere summer insolation and parallels Iberian margin sea surface temperatures (SST). The increased aridity over the Holocene is consistent with changes in Hadley Circulation and a southward migration of the Intertropical Convergence Zone (ITCZ). Centennial-scale shifts in hydroclimate are coincident with changes in total solar irradiance (TSI) after 4 ka BP. Several major drying events are evident, the most prominent of which was centered around 4.2 ka BP, a feature also noted in other Iberian climate records and coinciding with well-documented regional cultural shifts. Substantially, wetter conditions occurred from 0.8 ka BP to 0.15 ka BP, including much of the ‘Little Ice Age’. This was followed by increasing aridity toward present day. This composite stalagmite proxy record complements oceanic records from coastal Iberia, lacustrine records from inland Iberia, and speleothem records from both northern and southern Spain and depicts the spatial and temporal variability in hydroclimate in Iberia.
Introduction
Climate models pinpoint the Mediterranean region, including the Iberian Peninsula, as an area sensitive to drying conditions under future warming scenarios (Giorgi and Lionello, 2008). The Iberian Peninsula is a region where hydroclimatic variability has played a central role during its history of human occupation (Mejías Moreno et al., 2014; Morellón et al., 2018), and thus understanding the timing, nature, and drivers of past rainfall dynamics is of utmost importance. In order to better contextualize the evolution of hydroclimate variability (Figure 1a), high-resolution, hydroclimate-sensitive records are needed from an array of terrestrial locations in Iberia.
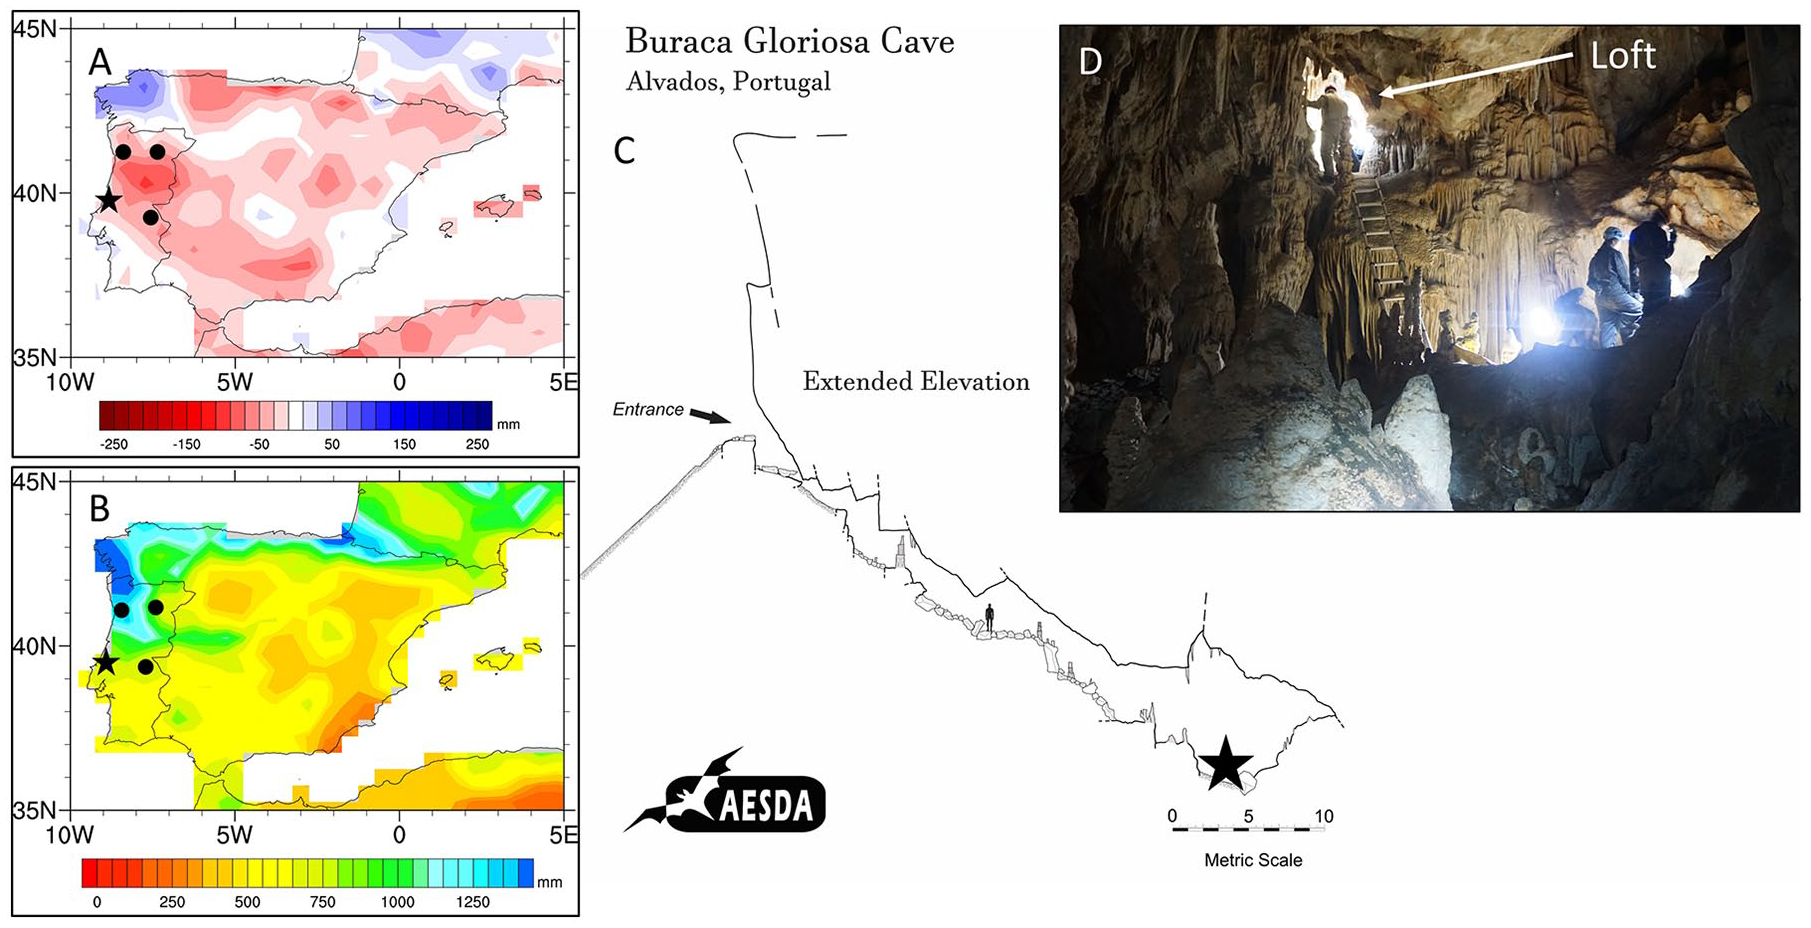
(a) Annual precipitation anomalies (mm) for 1981–2013 relative to 1901–2013 mean. (b) Average annual precipitation (mm) of the Iberian Peninsula (1901–2013 CE; GPCC v. 7; Schneider et al., 2014b). For (a) and (b), the star indicates location of Buraca Gloriosa (BG) cave and circles indicate locations of the three GNIP sites used for comparison. (c) Map of Buraca Gloriosa cave modified from Associação de Estudos Subterrâneos e Defensa do Ambiente (AESDA). Star indicates location of stalagmites used in this study. (d) Interior of BG, showing loft area (upper left) where several stalagmites were collected.
The Iberian Peninsula is located at the atmospheric boundary between African aridity and the temperate and rainy climate of central Europe, and, as such, is ideally suited to investigate the timing and amplitude of hydrologic changes as well as the forcing mechanisms modulating them (Giorgi and Lionello, 2008; Morellón et al., 2018; Walczak et al., 2015). Of particular importance to Portuguese hydroclimate is the Azores High, which marks the southern node of the North Atlantic Oscillation (NAO) dipole. The NAO is strongly associated with interannual climate variability across Iberia and much of western Europe (Hurrell, 1995; Trigo et al., 2002; Trouet et al., 2009; van Loon and Rogers, 1978) and is quantified by an index calculated using the differences in sea level air pressure between Iceland and Lisbon (or the Azores) (Barnston and Livezey, 1987). A positive (negative) NAO index represents a steeper (gentler) pressure gradient between Iceland and Lisbon, and the relative strength and position of the Azores High impacts the location of storm tracks (Barnston and Livezey, 1987). During positive NAO conditions (NAO+), storms are steered north of Iberia (decreasing rainfall in Iberia) while during negative NAO conditions (NAO−), storms travel across Iberia and the rest of southern Europe, increasing precipitation to these regions (Barnston and Livezey, 1987). Thus, small shifts in atmospheric circulation patterns related to subtropical (Azores) high pressure dynamics can cause substantial shifts in the regional climate mean state (Giorgi and Lionello, 2008). However, our collective understanding of the evolution of the NAO system over the entire Holocene is lacking, although several studies have offered important insights at various times during the Holocene (e.g. Faust et al., 2016; Lehner et al., 2012; Mauri et al., 2014; Olsen et al., 2012; Ortega et al., 2015; Trouet et al., 2009; Wassenburg et al., 2016).
Past hydroclimate variability in Iberia has been linked to the Azores High (Trigo and DaCamara, 2000) and climate models suggest future variability will be closely connected to it as well (Seidel et al., 2008). Shifts in the strength and/or location of the subtropical high may occur in response to future warming (Li et al., 2012), and longer term climate changes in Iberia through the Holocene reflect large-scale Northern Hemisphere and North Atlantic processes, including possible expansion, contraction or displacement of the Hadley Circulation (e.g. Karnauskas and Ummenhofer, 2014; Seidel et al., 2008). Furthermore, changes in insolation in the Northern Hemisphere have been linked to weakening East Asian (Wang et al., 2005) and Indian (Fleitmann et al., 2003, 2007) monsoon systems over the Holocene and occur simultaneously with a southward displacement of the Intertropical Convergence Zone (ITCZ) (e.g. Haug et al., 2001). Such a shift in the ITCZ is intricately linked to Hadley Circulation dynamics including the mean latitude of the descending branch, of which the Azores High is a part (Kang and Lu, 2012; Wassenburg et al., 2016).
Centennial-scale variability seen in Mediterranean records (e.g. Ait Brahim et al., 2018) (and in other subtropical regions) has been attributed to, among other drivers, changes in total solar irradiance (TSI; W/m2). Increased TSI correlates with enhanced monsoonal activity in monsoonal regions of the Northern Hemisphere such as Taiwan (Li et al., 2015). In northeastern Italy, spectral analysis of stalagmites confirms solar influence on the stable isotope values from Grotta di Ernesto (Scholz et al., 2012). In Iberia, centennial-scale changes in TSI could modulate the intensity of the hydrologic cycle (e.g. Allan et al., 2018) and potentially influence the NAO system (see Wassenburg et al., 2016). Under this scenario, reduced TSI could trigger a weaker NAO dipole, thereby, increasing precipitation in Iberia (Ait Brahim et al., 2018). However, the relationship between the spatiotemporal variability in Iberian hydroclimate with solar variability is not well characterized in the Holocene.
Despite the more than two dozen published paleohydrologic records from Iberia that span a majority of the Holocene, our understanding of spatial and temporal changes in regional hydroclimate remains incomplete. These sites include alpine lakes (e.g. Jambrina-Enríquez et al., 2014; Pla-Rabes and Catalan, 2005, 2011; Sánchez-López et al., 2016), Iberian margin sediments (e.g. Sánchez Goñi et al., 2008), and speleothems (e.g. Martín-Chivelet et al., 2011; Smith et al., 2016; Stoll et al., 2013). Records are more developed in northern (e.g. Moreno et al., 2017; Railsback et al., 2011; Stoll et al., 2013) and southern Iberia (e.g. Chabaud et al., 2014; Fletcher et al., 2007; Walczak et al., 2015), while regions that are underrepresented include western and central sections of the peninsula. The temporal resolution of many of these individual records is variable and often coarse (>100-year resolution).
Several of these studies have divided Iberian Holocene climate into three intervals: an early-Holocene humid period (11.5–7.0 ka), a mid Holocene characterized by increased climatic variability (7.0–5.5 ka BP), and a late-Holocene period of aridification (since ~5.5 ka BP) (Jalut et al., 2009). More recently, Walker et al. (2012) outlined more formal divisions of the Holocene into early (11.7–8.2 ka BP), middle (8.2–4.2 ka BP) and late Holocene (4.2 ka BP to present), and it is these subdivisions that will be used in this study. The climatic changes of the early, middle, and late Holocene are not temporally consistent across the Iberian Peninsula (Walczak et al., 2015), however. Regional differences correspond to latitude, topography, and proximity to the ocean and also likely reflect sensitivity to Azores High dynamics (Walczak et al., 2015).
In order to address the limited representation of hydroclimate records in west-central Portugal, we present here a reconstruction of hydroclimate using δ13C and δ18O values from six well-dated and (partially) overlapping speleothems since approximately 9.0 ka BP from Buraca Gloriosa (BG). Stalagmite chronologies were developed using U-Th dating and the composite isotopic time series was derived from these dates and intra-site correlation age modeling (iscam; Fohlmeister, 2012). The aims of this study are to (1) establish a robust, high-resolution composite isotope record of Holocene hydroclimate from this region, (2) identify in this record, periods of enhanced aridity or humidity, and (3) use these data to evaluate drivers of regional hydroclimate variability at millennial and centennial-scales.
Field site and methods
Cave setting and local climate
Six stalagmites were collected from BG (39°32′N, 08°47′W; 420 m a.s.l.), a cave in west-central Portugal near the town of Alvados, 30 km from the Atlantic Ocean (Figure 1). The region surrounding BG is characterized by warm and dry summers and cool and wet winters typical of the Mediterranean climate. Most rainfall occurs in the winter season and shoulder months, with greater than 85% of yearly precipitation falling between October and April in Leiria, a meteorological station less than 30 km from BG.
The cave is ~35 m long (Figure 1) and hosted by Middle Jurassic limestone in the Estremadura Limestone Massif, a topographically distinct region in central Portugal (Rodrigues and Fonseca, 2010). Access is gained through a single, small (~0.5 m2) entrance formed at the top of a collapse at the base of an overhang approximately 30 m from the hilltop (Figure 1). BG is well-decorated with numerous inactive stalagmites and only a few active growth sites. Vegetation above the cave is composed of shrubs, small trees, and mosses with thin (0–10 cm), highly organic soil. Previous work by Denniston et al. (2018) provides additional details regarding isotopic values of dripwater, host rock, glass slide-grown calcite, and vegetation and soil above the cave, and together, these data suggest that stalagmites crystallized near isotopic equilibrium with dripwater. The six stalagmites were collected at the bottom of the cave, ~30 m from the cave entrance (Figure 1). Three stalagmites (BG063 (29.5 cm), BG121A (23.0 cm), and BG121B (16.4 cm)) had grown on the cave floor at the base of the loft and three others (BG136 (43.7 cm), BG135 (51.4 cm), BG134 (9.2 cm)) grew in a loft area ~4 m above the floor (Figure S1A and B, available online). Two stalagmites, BG136 and BG134, were actively growing when collected.
Environmental monitoring
Temperature (T), relative humidity (RH), and barometric pressure (P) inside BG were measured every 2 hours from August 2013 until January 2019 using HOBO U23 (T/RH) and U20 (P/T) loggers. Temperature and RH were also measured every 2 hours over this monitoring period just outside the cave entrance. Drip rates were monitored in BG using Stalagmate acoustic drip counters (Collister and Mattey, 2008), with drips integrated into 30-minute intervals since June 2014. We rely as well on Global Network of Isotopes in Precipitation (GNIP; IAEA/WMO, 2019) data from Porto (41°08′N, 08°36′W), Vila Real (41°19′N, 07°44′W), and Portalegre (39°17′N, 07°25′W). Isotopes of monthly averaged precipitation were measured for 21 years at Porto (1988–2004, 2014–2017), 17 years at Portalegre (1988–2004), and for 4 years at Vila Real (1988–1991) (IAEA/WMO, 2019).
Uranium-series dating and construction of the composite isotopic record
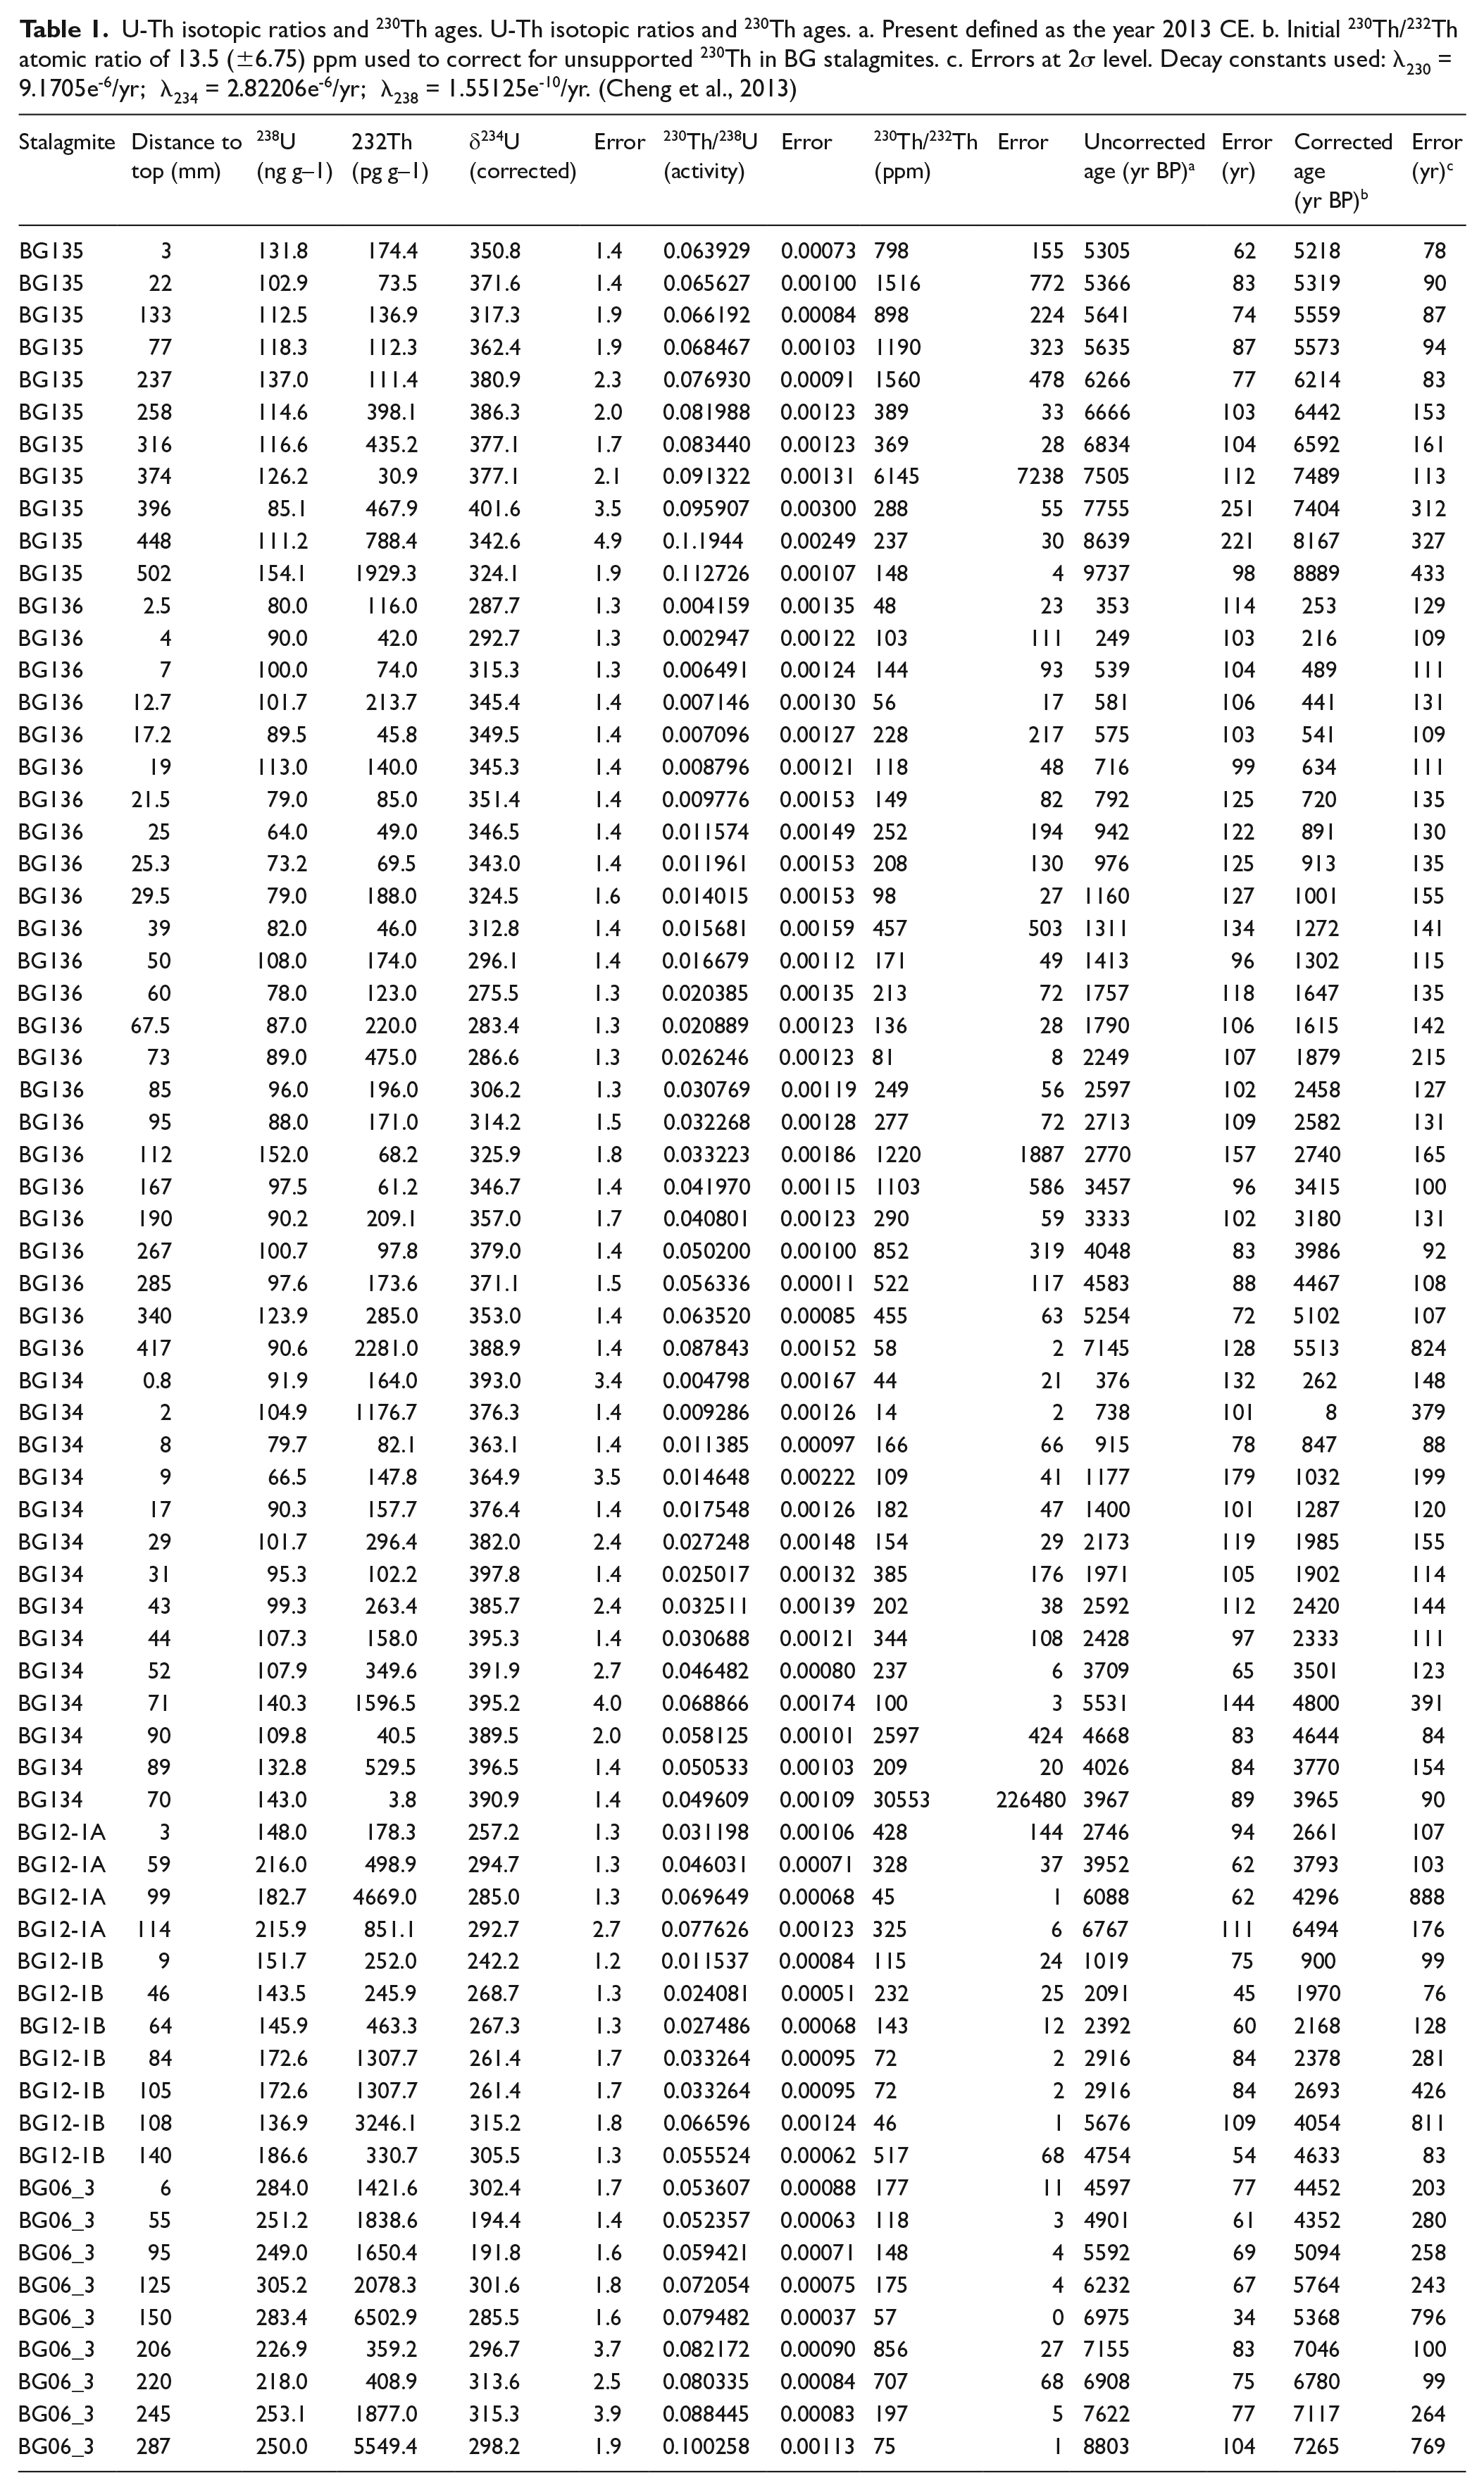
A total of 69 238U-234U-230Th dates were used to construct individual age-depth models for the six stalagmites. The dates were obtained at the University of New Mexico Radiogenic Isotope Laboratory using analytical methods of Asmerom et al. (2010). Approximately, 100–200 mg of calcite were milled from the central growth axis of select intervals of the stalagmites and these powders were weighed, dissolved with 15N nitric acid, spiked with a mixed 229Th-233U-236U tracer, and processed in a Class 100 clean lab. After chemical separations, U and Th fractions were dissolved in 400μL of 3% nitric acid and analyzed using a Thermo Neptune MC-ICP-MS. All isotopes were measured in Faraday cups except for two (234U and 230Th), which were measured in the secondary electron multiplier (SEM). Ages are reported with two sigma (2σ) errors. A 230Th/232Th ratio of 13.5 ppm (±50%) was obtained from BG drip water (Denniston et al., 2018), and this value was used to correct for unsupported 230Th.
Hiatuses in stalagmite records, which are not always readily identifiable under visible inspection, complicate age models and thus precise integration of apparently coeval time series. StalAge (Scholz and Hoffman, 2011) utilizes a multiple step approach where major outliers are identified, then minor outliers and age inversions are identified, and, finally the age model and 95% confidence windows are created using Monte Carlo simulations. StalAge creates the age model and uncertainty by fitting straight lines to subsets of the age data. Constructing Proxy Records from Age Models (COPRA) also uses Monte Carlo simulations to determine the final age models and 95% confidence windows but uses piecewise cubic Hermite interpolation. StalAge and COPRA were both used to develop initial age models for the individual stalagmites and to test for hiatuses long enough relative to U-Th age uncertainties to pose problems for our age models (Figure 2). StalAge did not identify any hiatuses, even though visual evidence for an interruption in growth paired with abrupt changes in isotope values on one stalagmite suggested otherwise. COPRA identified this one hiatus in BG136 as a short hiatus that was previously identified by isotope values and visual evidence. We interpret these results to indicate that this and other potential hiatuses were short relative to the age uncertainties derived from U-Th methods (which generally ranged from 50–150 years, 2σ). Thus, hiatuses were not included in the generation of the composite age model.
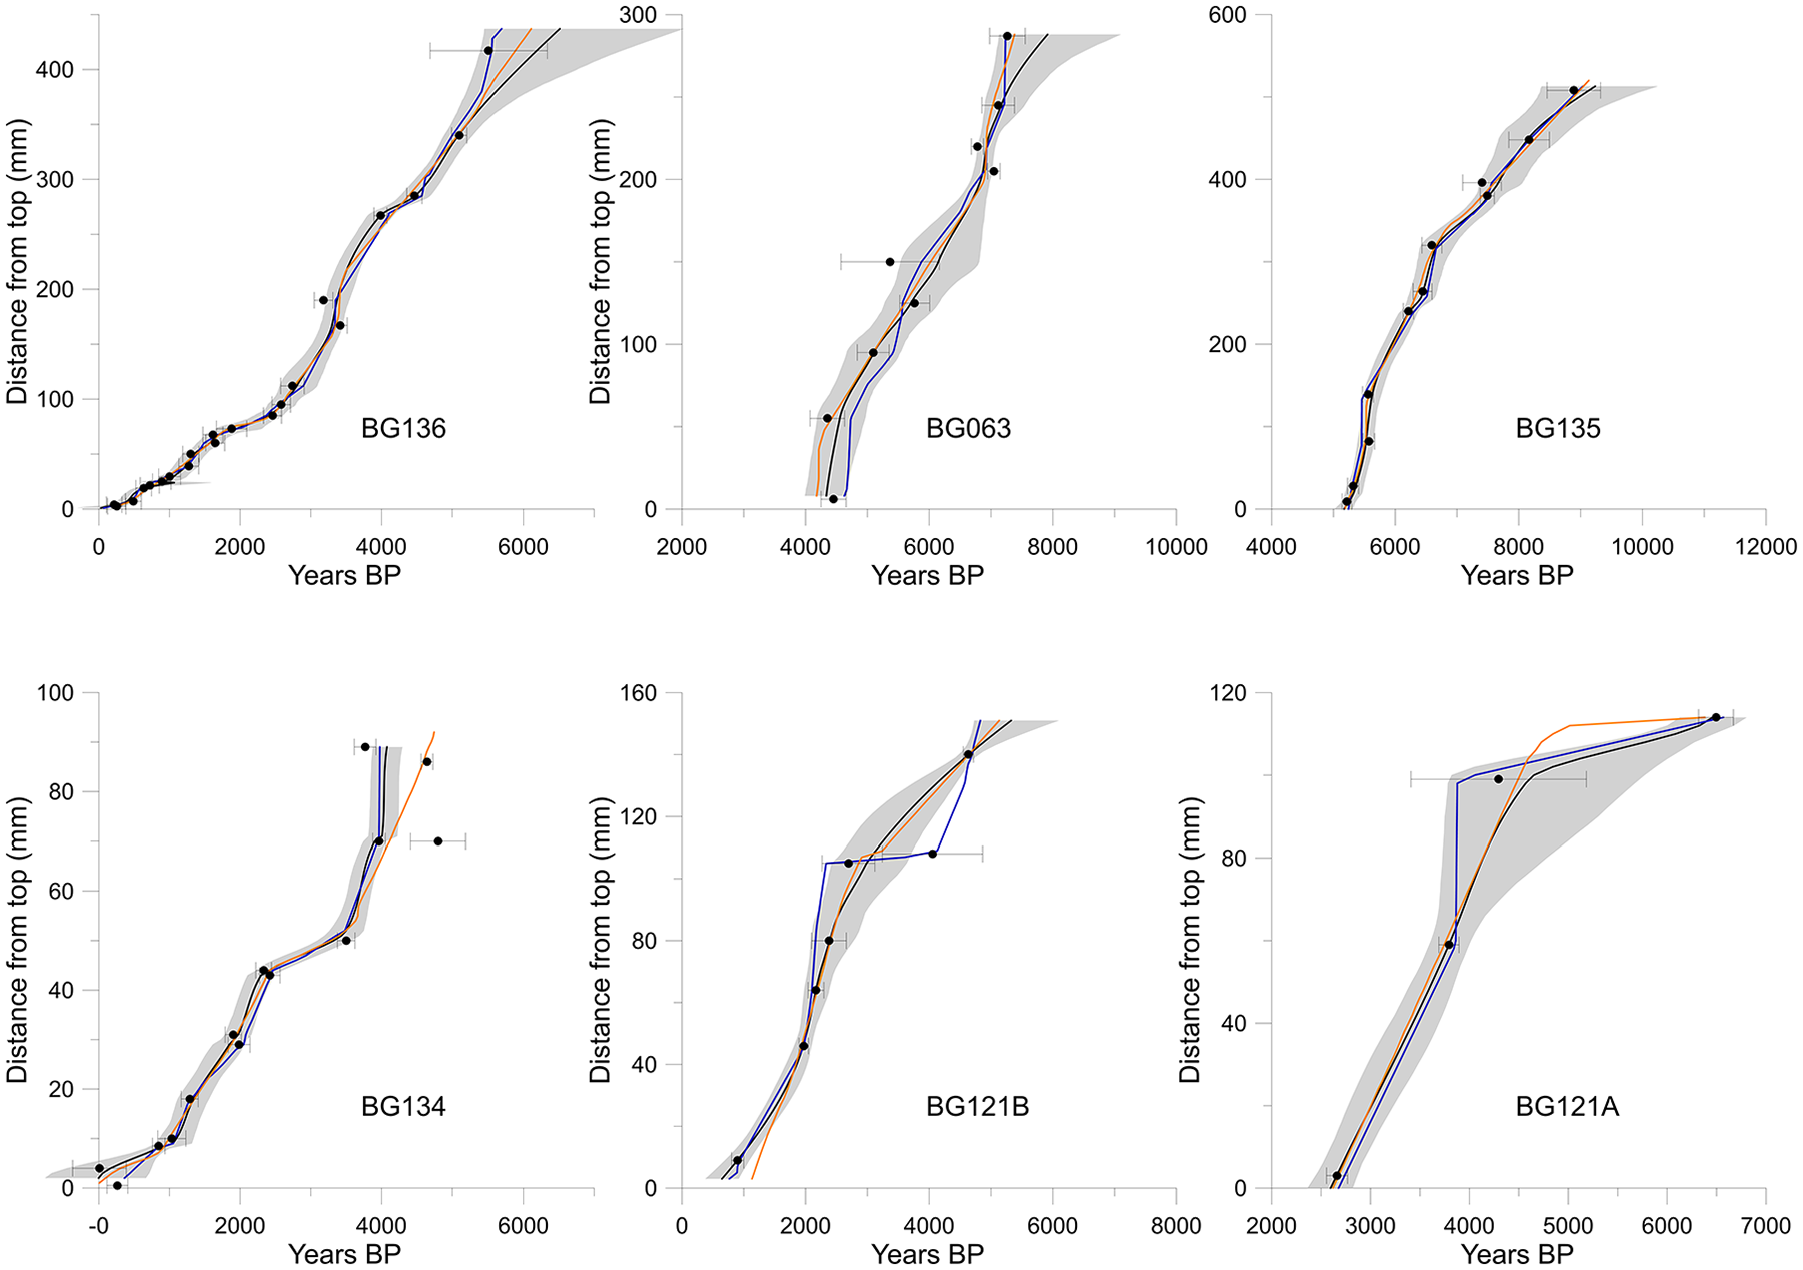
StalAge-derived, COPRA-derived, and iscam-derived age models for individual stalagmites from Buraca Gloriosa. Black lines represent COPRA, blue represents iscam, and orange represents StalAge. Black circle are U-Th dates with 2σ errors. Gray shading indicates the 95% confidence interval from COPRA. See Table 1 for specific ages and isotopic ratios. For interpretation of the references to color in this figure legend, the reader is referred to the web version of this article.
Stable isotope time series from individual stalagmites were integrated into a single composite record using intra-site correlation age modeling (iscam; Figure 3 and Figure S2, available online; Fohlmeister, 2012). This method considers the highest correlation between two or more individual records within allowable age uncertainties using a point-wise linear interpolation between adjacent U-Th dates. This novel approach to developing age models determines the best correlation using a Monte Carlo approach (3000 simulations with a 30-year smoothing) and then calculates the most probable age model based on the calculated correlation coefficients (Griffiths et al., 2016). Significance levels were calculated, used 1000 pairs of artificially simulated first-order autoregressive time series (AR1). An age model for each stalagmite was derived using iscam and actual values of both δ13C and δ18O were fit to their respective age models to develop both individual and composite isotope records (Figure 3). Using iscam to combine these six stalagmite records offers many advantages including a reduction of age uncertainty, an objective method for linking proxies from multiple samples, and a quantitative determination of whether the isotope records have a common signal within age uncertainties (Griffiths et al., 2016). The age model that produced the highest coherence was selected for this analysis and is presented in Figure 3. Since iscam uses all of the original values and places them onto the newly created age model, the composite record is not an average value. This accounts for uncertainty in the isotope values created by combining multiple records, which may or may not have isotopic offsets from one another. However, an additional uncertainty was calculated and plotted with the composite record (gray shading Figure 3) in order to account for merging multiple stalagmites together. This uncertainty was based on 2σ of isotopic value (both stable carbon and oxygen) whenever two or more stalagmite were present by binning all values in 100-year intervals. In addition, analytical uncertainty (2σ) was also included and propagated with the above uncertainty as random errors throughout the record. Whenever replication was not possible, this average uncertainty across the record was added to the single isotope time series (Figure 3).
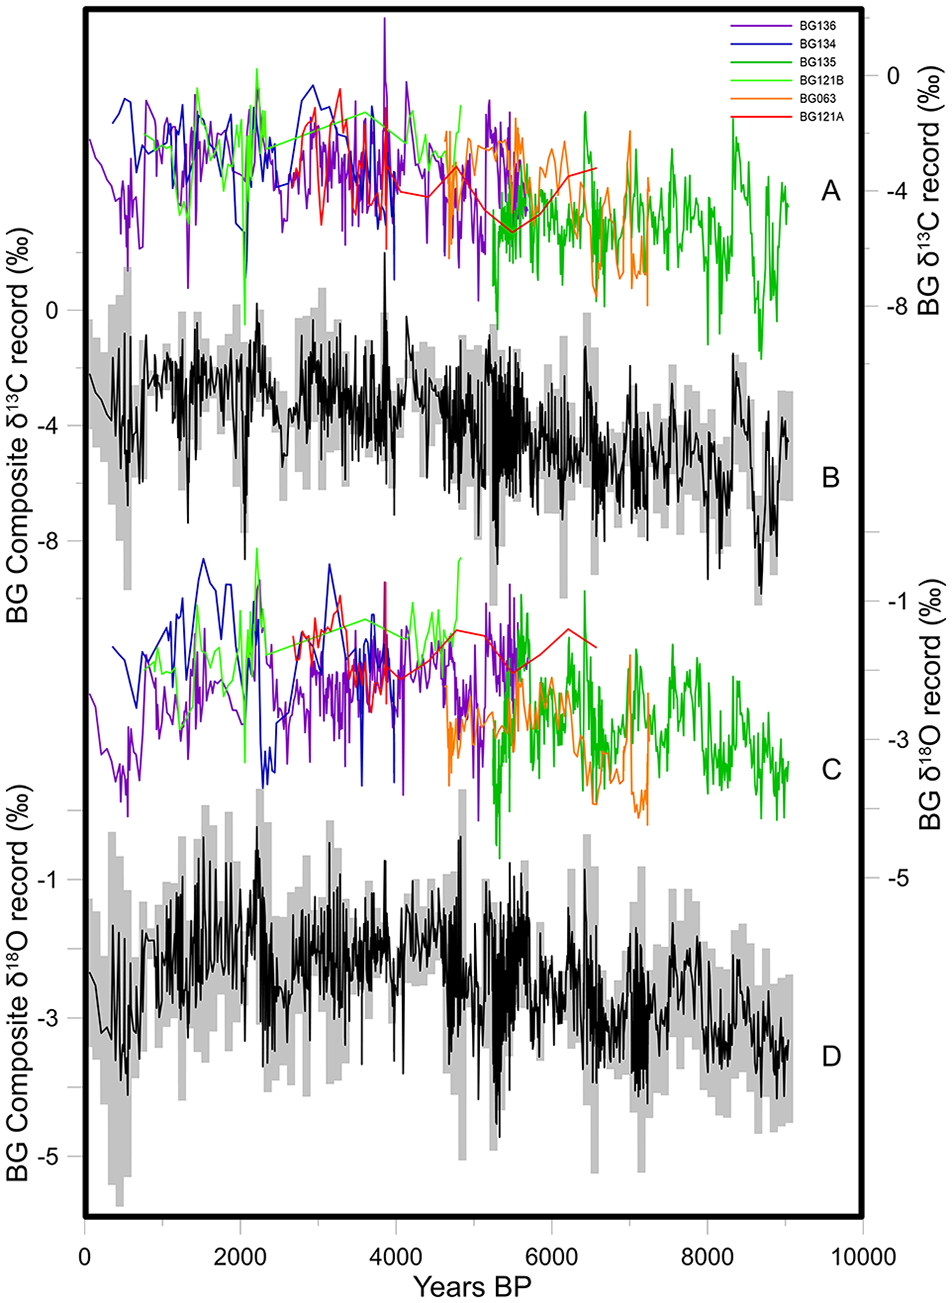
(a) δ13C record from individual stalagmites (colored). (b) δ13C composite record from BG (black). (c) δ18O record from individual stalagmites (colored). (d) δ18O composite record from BG (black). Gray uncertainty clouds (b, d) represent the combined and propagated 2σ analytical uncertainty and the uncertainty from combining stalagmites in 100-year bins (see text for details). For single stalagmite series, the average and propagated 2σ uncertainty from the replicated series was plotted. For interpretation of the references to color in this figure legend, the reader is referred to the web version of this article.
Carbon and oxygen isotopes
More than 1300 stable isotope samples (about 200µg) were milled along the central growth axis of each stalagmite using a handheld dental drill with 0.1 mm bit every 1 mm for three stalagmites (BG134, BG135, BG136) and every 2 mm for the remaining three stalagmites. Powders were transferred to reaction vessels, flushed with ultrapure helium, digested using >100% H3PO4 and allowed to equilibrate overnight at 34°C before being analyzed. Isotopic ratios on samples from BG134, BG135, BG136, BG121A, and BG121B were measured using a GasBench II with a CombiPal autosampler coupled to a Thermo Finnigan Delta Plus XL mass spectrometer at Iowa State University. Internal and external standards (NBS-18 and NBS-19) were run with the samples to ensure reproducibility with one standard used for every five samples. Oxygen and carbon isotope ratios are presented in per mil (‰) relative to the Vienna Pee Dee Belemnite carbonate scale (VPDB) with an average precision for both δ13C and δ18O of better than ±0.2‰ (2σ). Isotopic ratios for BG063 were measured at the University of Michigan following a similar protocol noted earlier and using a Thermo Scientific MAT253 paired with a Kiel carbonate device with precision better than ±0.2‰ (2σ).
Statistical treatments
Simple linear regression and Pearson’s correlation coefficients and associated p-values were used to determine if any significant relationships were present (degrees of freedom = n−2, significant at p < 0.05). In addition, all errors are reported at two standard deviations (2σ) including U-Th dating uncertainties. Whenever binning was used (effectively smoothing data), the degrees of freedom were adjusted accordingly.
Reanalysis products
A series of monthly, global-gridded observational and reanalysis products were used to assess 20th century climatic conditions across Iberia and the broader North Atlantic region. The datasets included precipitation at 0.5° horizontal resolution from the Global Precipitation Climatology Centre (GPCC; version 7; 1901–2013; Schneider et al., 2017); sea level pressure (SLP), zonal and meridional winds at 2.5° horizontal resolution from the Twentieth Century Reanalysis (20CR; 1851–2014; Compo et al., 2011). Analyses focused on the wintertime (December–March) climatic conditions during the period 1981–2013, relative to the long-term mean wintertime climate for the 20th century (i.e. 1901–1980).
Results
Environmental monitoring
Continuous environmental monitoring over the past 6 years has shown that conditions in BG are stable and highly suitable for paleoclimate work. The mean temperature in BG cave is 14.3 ± 0.2°C and relative humidity remains at or near 100% year-round. Three winters during the monitoring period have experienced minor ventilation events that impacted humidity (Figure S3, available online). Dripwater monitoring reveals that drip rates respond to both individual precipitation events and seasonal cycles (wet winters and dry summer, Figure S3, available online). These data suggest that seasonal fluctuations in precipitation are transmitted through the karst system in relatively short periods (days to months).
Uranium-series dating and composite record
U-Th dating of BG stalagmites reveals growth over much of the Holocene (Table 1), with each stalagmite spanning >2.6 kyr from 9.0 ka to present. The average deposition rates are BG136 (77μm/yr), BG134 (24μm/yr), BG135 (136μm/yr), BG063 (106μm/yr), BG121A (29μm/yr), and BG121B (36μm/yr). Growth rates slowed over the Holocene, and, as a result, each stable isotope sample incorporates more time in the late Holocene than in previous millennia (Figure S4, available online). Several stalagmites had minor age reversals but, with two exceptions, all dates were within the COPRA 95% confidence windows (Figure 2). These two dates were still used as input into iscam and were used in the generation of the BG composite isotope records.
U-Th isotopic ratios and 230Th ages. U-Th isotopic ratios and 230Th ages. a. Present defined as the year 2013 CE. b. Initial 230Th/232Th atomic ratio of 13.5 (±6.75) ppm used to correct for unsupported 230Th in BG stalagmites. c. Errors at 2σ level. Decay constants used: λ230 = 9.1705e−6/yr; λ234 = 2.82206e−6/yr; λ238 = 1.55125e−10/yr. (Cheng et al., 2013)
Carbon and oxygen isotopes
The oxygen and carbon isotopic time series derived for each of these six speleothems exhibit a high degree of covariance and share similar ranges for both δ13C and δ18O values during periods of overlap (Figure 3). Composite records of carbon and oxygen isotopic analyses are shown in Figure 4. The average temporal resolution for δ18O and δ13C from the BG composite record is 6.9 years and varied from over 74 years for the most recent data to seasonal at several intervals during the mid Holocene (although iscam cannot resolve annual resolution in these samples; Figure S4, available online).
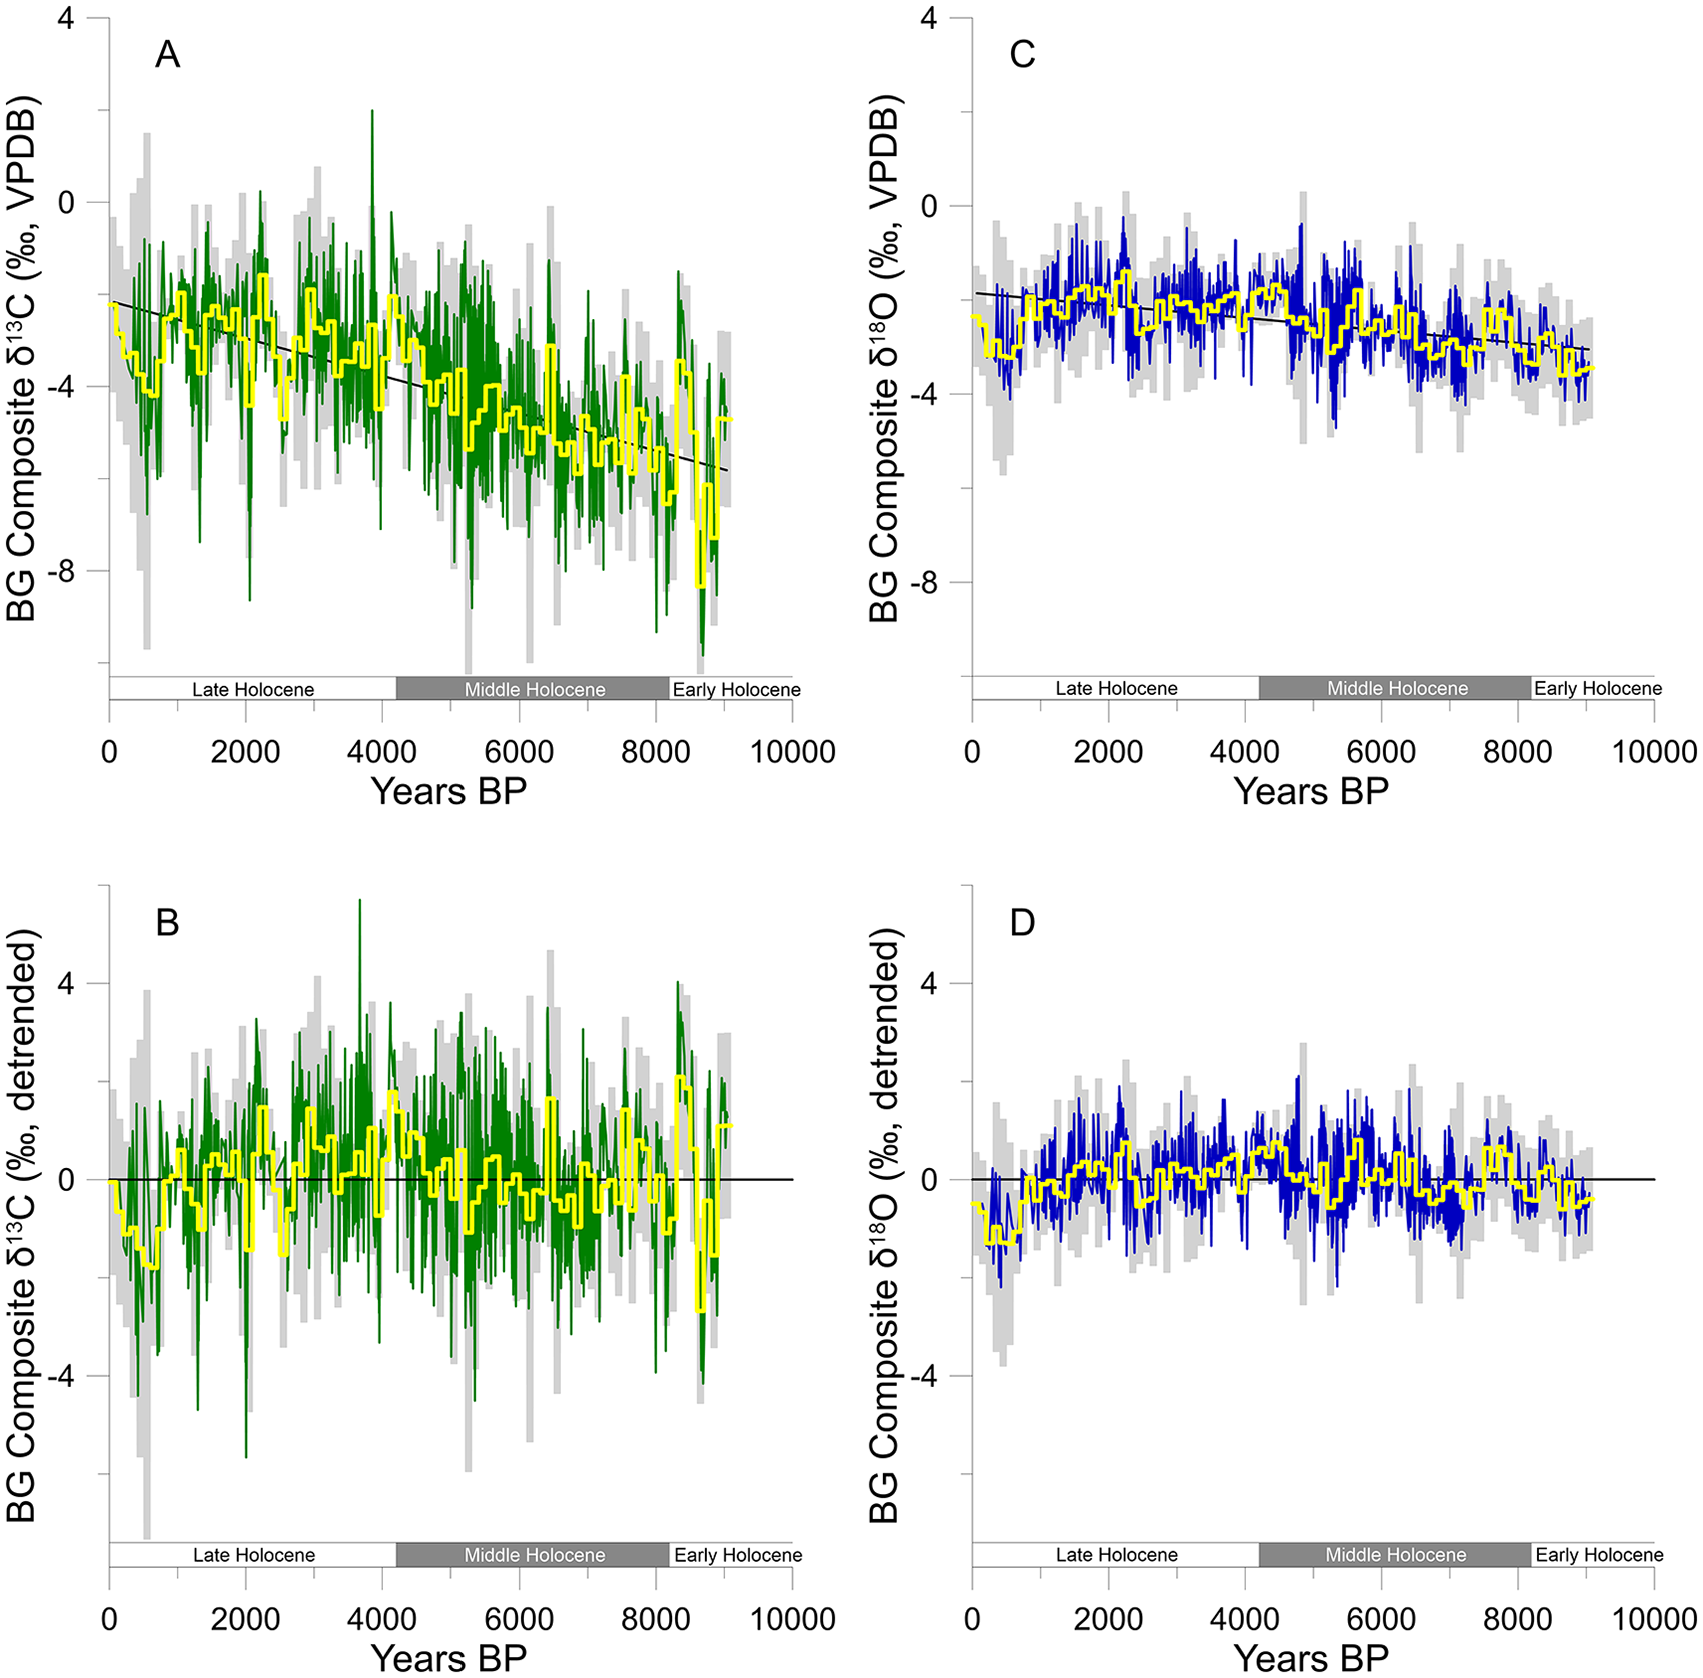
(a) BG composite δ13C record. (b) Detrended BG δ13C composite record. (c) BG composite δ18O record. (d) Detrended BG δ18O composite record. In (a) and (c), the yellow line indicates 100-year average of isotopes and the black line is the linear trend. Oxygen and carbon isotopes are presented on the same scale to illustrate relative variability. Gray shading represents the same uncertainty as Figure 3. For interpretation of the references to color in this figure legend, the reader is referred to the web version of this article.
The average (not detrended) δ13C and δ18O values based on the entire isotopic series from the composite record over the past 9.0 ka are −4.1 ± 1.6‰ and −2.5 ± 0.7‰ (VPDB), respectively. Variability is noteworthy across the Holocene with the lowest 100-year average value for δ13C (−8.3‰) occurring from 8.7–8.6 ka BP and the highest 100-year average value for δ13C (−1.6‰) occurring 2.3–2.2 ka BP (Figure 4). Results are similar with respect to oxygen isotopes with the lowest 100-year running average for δ18O (−3.3‰) occurring from 8.7–8.6 ka BP and the highest 100-year average for δ18O (−1.4‰) occurring at 2.3–2.2 ka BP. The respective ranges in δ13C (–9.8 to +3.3‰) and δ18O values (–4.7 to +0.7‰) are large.
Average isotopic values vary between the early, middle, and late Holocene with the δ13C and δ18O values increasing secularly throughout the rest of the Holocene, with an average increase of 0.4‰ per 1000 years for carbon and 0.1‰ per 1000 years for oxygen. Respective average δ13C and δ18O values for the early Holocene are −5.5‰ and −3.2‰, for the middle Holocene are −4.6‰ and −2.6‰, and late Holocene are −3.1‰ and −2.2‰.
BG stalagmite carbon and oxygen isotopes are highly correlated (R2 = 0.52 for the BG composite record; p-value < 0.001). Correlation values between δ13C and δ18O for each stalagmite are BG136 (R2 = 0.34, p-value < 0.001), BG135 (R2 = 0.36, p-value < 0.001), BG134 (R2 = 0.49, p-value < 0.001), BG121B (R2 = 0.58, p-value < 0.001), BG063 (R2 = 0.73, p-value < 0.001), and BG121A (R2 = 0.26, p-value < 0.001). All correlations (R2 values) between isotopes within each stalagmite are ⩾0.26 and are statistically significant.
In order to consider centennial-scale variability, we detrended both isotopic time series using a linear growth model (black line in Figure 4 plots (a) and (c)). In addition, both isotopic time series were detrended using a z-score of the best-fit polynomial describing the insolation curve (Figure S5, available online). As there was not a substantial difference between the two detrending results, the simplest approach was used. Figures 4b and d present the δ13C and δ18O BG composite residuals and reveal several wet/dry periods. Five time periods of interest have been identified and include 8.8–8.0 ka BP, 7.5–5.3 ka BP, 4.4–3.7 ka BP, 3.3–1.4 ka BP, and 0.8–0.15 ka BP, each of which is addressed in the following section.
Discussion
Environmental/climatic interpretation of BG carbon and oxygen isotopes
Stable carbon isotopes
Interpreting isotopic shifts in BG stalagmites requires an understanding of the biogeochemical systems at work in and above the cave. Changes in δ13C values reflect shifts in relative inputs from the two endmembers in the system: CO2 derived from the atmosphere and the vegetation/soil above the cave as well as bicarbonate derived from bedrock carbonate (e.g. Li et al., 2014). The isotopic signatures of these endmembers at BG are distinct (bedrock average value = +3 ± 1‰, soil/vegetation average value = −28 ± 1‰; Denniston et al., 2018). Speleothem δ13C values because of vegetation/soil input reflect the type (C3 or C4) and density of vegetation over the cave. Based on analysis of pollen co-deposited with marine sediments on the Iberian margin, pronounced changes in vegetation type (C3/C4 ratios) are not apparent over the last glacial cycle (including the Holocene) in western Portugal (d’Errico and Sánchez Goñi, 2003; Desprat et al., 2006; Margari et al., 2014; Sánchez Goñi et al., 2008, 2013; Tzedakis et al., 2004) and thus are not considered as likely to have influenced the δ13C values of BG stalagmites. The role of bedrock values on stalagmite δ13C values is influenced by the amount of time the percolating waters interact with the bedrock (rapid infiltration can reduce dissolution of bedrock carbonate) as well as secondary effects resulting from prior calcite precipitation (PCP; Baker et al., 1997). In broad terms, wetter conditions likely favor increased vegetation density and thus higher soil CO2 production, reduced infiltration times, and decreased PCP, thereby resulting in lower stalagmite δ13C values.
Oxygen isotopes
Interpretation of δ18O variability in BG may be more complex than carbon isotopic variability. Rainwater δ18O values are controlled primarily by atmospheric temperature and precipitation amount (Lachniet, 2009), although moisture source differences play a role. The air temperature-δ18Orain relationship averages +0.18‰/°C for the three closest GNIP sites – Porto, Vila Real, and Portalegre (Figure S6, available online) – and as such is nearly identical but opposite in sign to the calcite-water temperature dependence of oxygen isotope fractionation (−0.2‰/°C; Kim and O’Neil, 1997). Amount effects on oxygen isotopes in precipitation at these three GNIP locations average −3.9‰/100 mm precipitation, although this is tied to the area’s strong seasonality of rainfall. Changes in contributions from spring/autumn precipitation could have a marked effect on mean annual rainwater δ18O values and are the subject of ongoing analysis. Considering these factors, we argue that the dominant influence on δ18O of precipitation over decadal- to centennial-scales at this location is likely to be weighted precipitation amount (Denniston et al., 2018) which is biased to the cool season at this location. For example, a recent study by Baker et al. (2019) considered the dominant impact on speleothem δ18O values based on mean annual temperature (MAT) of a given region. The mean temperature inside BG is 14.3°C and the MAT outside of the cave is similar, which would suggest that drip water (and hence, cave speleothems) is controlled by recharge-weighted δ18O. Similar findings throughout the Mediterranean have been previously described whereby precipitation amount is seemingly the most important factor impacting the δ18O values of precipitation (e.g. Bard et al., 2002; Isola et al., 2019). Therefore, as is the case with δ13C values, higher (lower) δ18O values are considered an indication of more arid (more humid) climate near BG.
Relationship between carbon and oxygen isotopes
As noted earlier, BG stalagmite carbon and oxygen isotopes are highly correlated during the Holocene (R2 = 0.52 for the BG composite record; p-value < 0.001). Such correlations are potentially an important factor to consider when assessing whether stalagmites crystallized under equilibrium conditions. Two lines of evidence argue for a climatic control of both δ13C and δ18O values in BG stalagmites. First, as reported by Denniston et al. (2018), oxygen isotopic compositions of plate grown calcite (as well as recently deposited stalagmite calcite) are within error of the predicted equilibrium value based on observed cave temperatures and drip water δ18O values. Second, the high degree of coherence between coeval stalagmites suggests stalagmites were not meaningfully impacted by secondary processes such as evaporation or kinetic effects. However, some authors (e.g. Daëron et al., 2019; Deininger et al., 2012) have argued that most calcitic materials, including speleothems, are precipitation out of isotopic equilibrium. Because we do not have paleo drip water, it is difficult to fully assess whether or not the BG stalagmites represent equilibrium precipitation continuously throughout the Holocene. Perhaps, the most important aspect of this discussion is whether or not speleothems from a particular karst environment are most influenced by in-cave processes or climate. In the case of the BG isotope series, the strong coherence (similar isotopic values and variability through time) from coeval stalagmites suggests that these six stalagmites are most representative of climate rather than in-cave processes. Furthermore, we have developed a mechanistic framework for why δ13C and δ18O values at this site would covary as a function of precipitation amount and cool season recharge (e.g. Baker et al., 2019) and the associated impacts on vegetation and, thereby, soil CO2. In years with high recharge (associated with increased precipitation) in the cool season, weighted δ18O precipitation values would be relatively low, which would be reflected in lower δ18O stalagmite values. Furthermore, with increased precipitation, vegetation density would increase compared with relatively dry years. This would increase soil respiration rates and thus act to lower soil δ13C DIC values, which would ultimately decrease stalagmite δ13C values. The opposite would be true in relatively dry years, which would cause isotope values in the stalagmites to increase.
Millennial-scale hydroclimate variability during the Holocene and potential mechanisms
We attribute the secular increase in oxygen and carbon isotopes, and, hence, aridity from 9.0 ka BP to the present in west-central Portugal to precession-driven decreases in Northern Hemisphere summer insolation (Figure 5; Lorenz et al., 2006), that in turn resulted in a general cooling throughout much of the Northern Hemisphere (Wanner et al., 2011). In response, the ITCZ was displaced southward as the Holocene progressed and the Northern Hemisphere summer monsoon systems weakened (Fleitmann et al., 2003, 2007; Wanner et al., 2011). This reduction in Northern Hemisphere summer insolation and related hydroclimatic impacts have been observed in proxy records throughout the Northern Hemisphere (e.g. lake levels in northern Africa, DeMenocal and Tierney, 2012; speleothems from Southeast Asia, Wang et al., 2005; sediment records in the Cariaco Basin, Haug et al., 2001) and decreasing insolation is proposed as a mechanism for Holocene changes in the subtropical high by Walczak et al. (2015). The ITCZ and Azores High form the ascending and descending limbs of the Hadley Circulation, respectively (Figure 6). As ITCZ strength and location impact strength and location of the Azores High, it is also likely that the mean position of the Azores High system may have been more northerly in the early Holocene compared with the late Holocene (modern day configuration depicted in Figure 6). If correct, the expectation would be for enhanced steering of storm tracks during the early Holocene, and thus enhanced rainfall, across Iberia. At the same time, the descending limb of the Hadley Circulation would also have been positioned north of its current location, also contributing to a wetter climate. However, as the ITCZ migrated southward over the Holocene (Haug et al., 2001), the mean position of the Azores High (and the associated Hadley Circulation) would have approached its current configuration (Figure 6), giving way to relatively dry conditions. Although, the potential impacts of ITCZ dynamics and Hadley Circulation make dynamical sense and are supported in the literature (e.g. Green et al., 2017; Schneider et al., 2014a), climate model simulations (e.g. Wassenburg et al., 2016) would substantially strengthen these arguments. Despite any limitations of our current study, it is most likely that the mean position of the Azores High was non-stationary over the Holocene. If the Azores High system exhibited substantial non-stationary behavior during the Holocene (e.g. Repschläger et al., 2017), this would have also impacted the state of the NAO (e.g. Ait Brahim et al., 2019; Wassenburg et al., 2016).
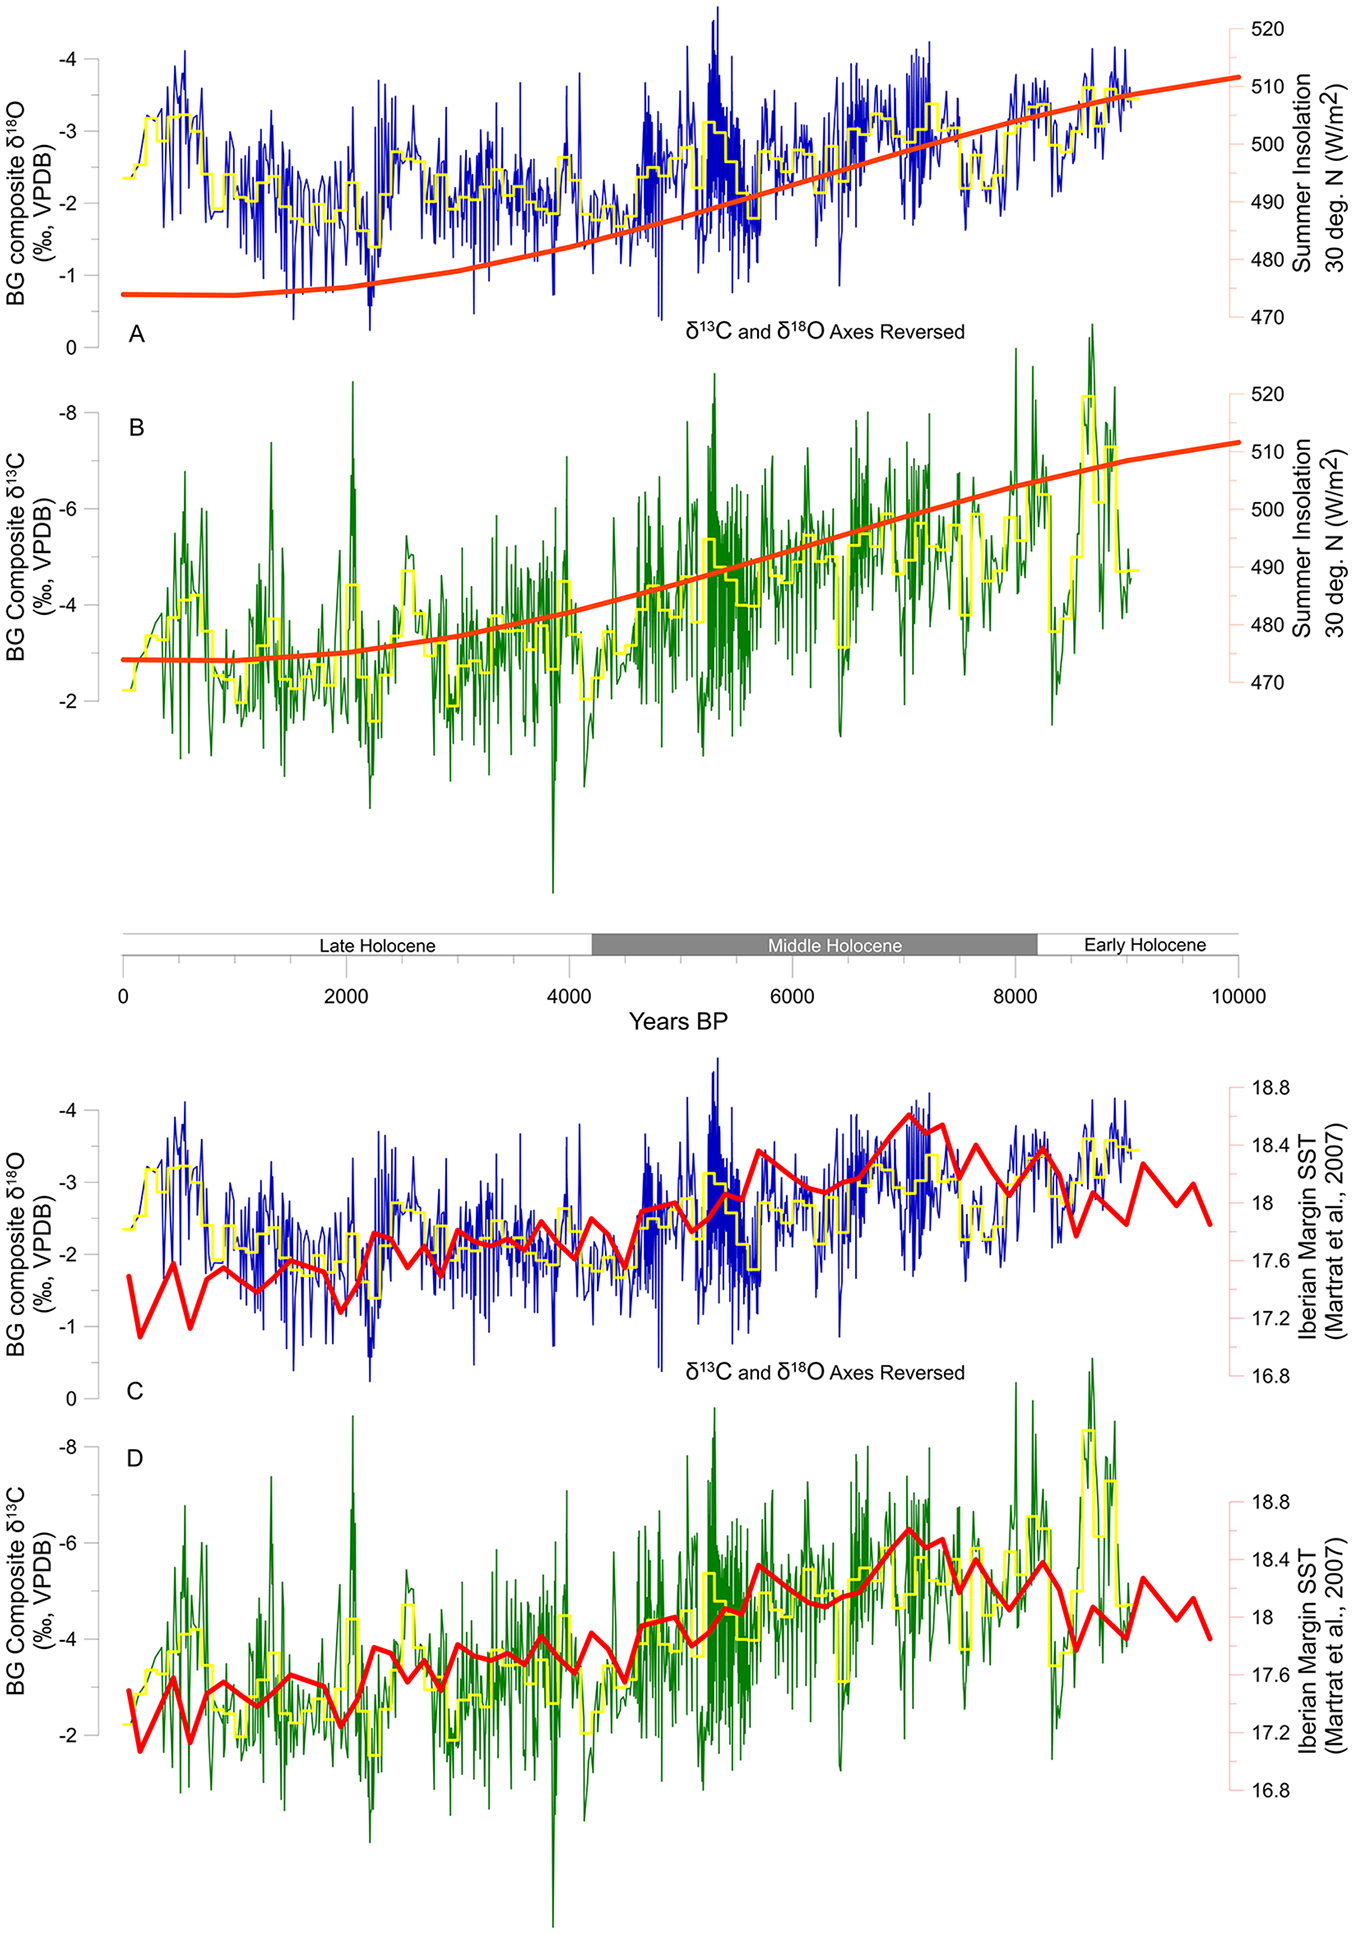
Comparison of BG composite δ13C (green) and δ18O (blue) with global and regional records. Yellow represents 100-year average of isotopes. (a) and (b) Summer Insolation at 30°N (orange, Berger and Loutre, 1991). (c) and (d) Iberian margin SST (red, Martrat et al., 2007). Note axes are reversed for BG composite isotope records. For interpretation of the references to color in this figure legend, the reader is referred to the web version of this article.
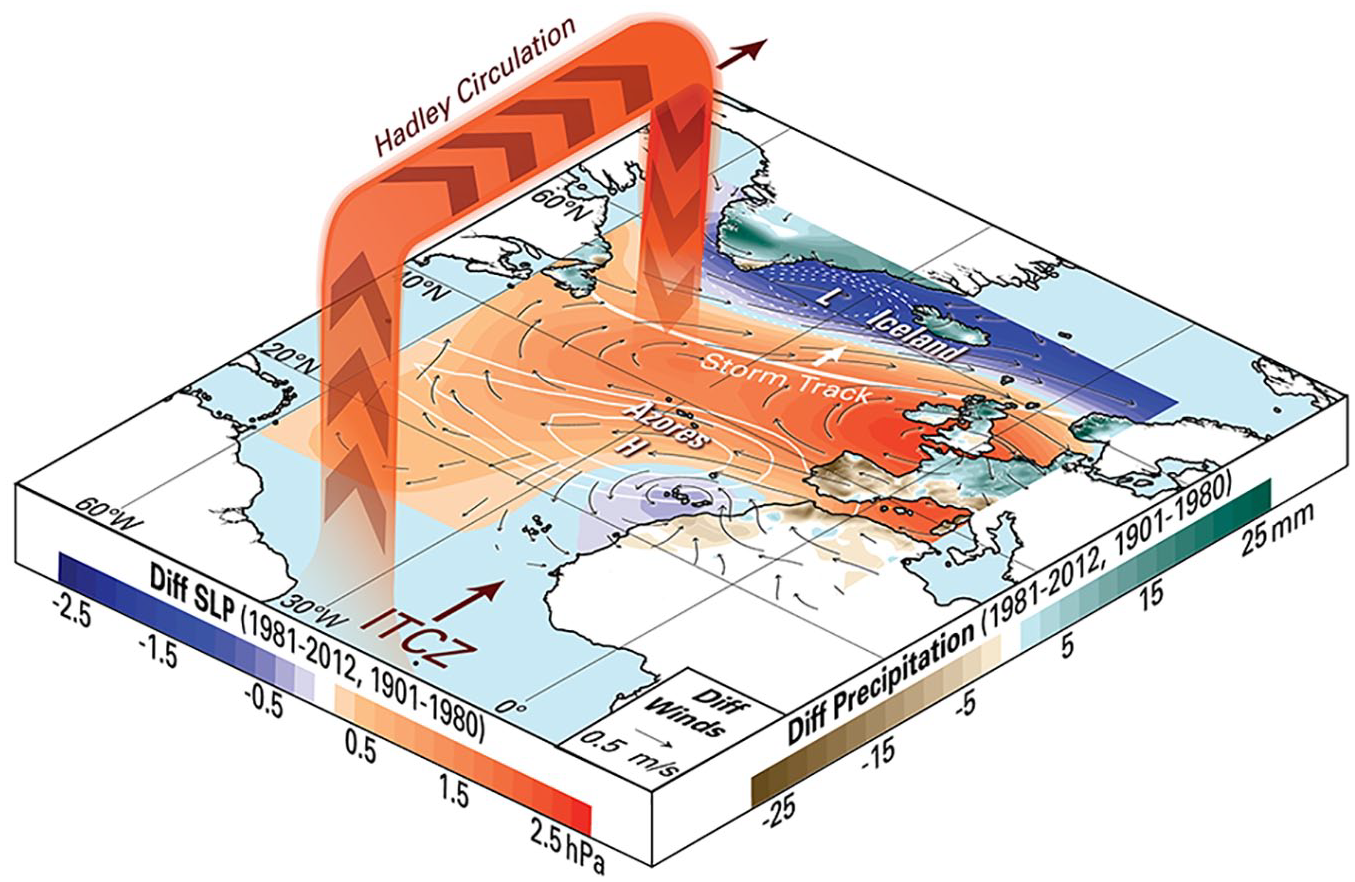
Schematic depicting connections between Azores High, Hadley Circulation, and ITCZ. Star indicates location of BG cave. Red (blue) shading over ocean indicates sea level pressure increase (decrease) during recent decades compared with the 20th century long-term mean (white contours). Green (brown) shading over land indicates increase (decrease) in precipitation, and arrows indicate changes in surface winds. All analyses focused on the wintertime (December–March) climatic conditions during the period 1981–2013, relative to the long-term mean wintertime climate for the 20th century (i.e. 1901–1980). For interpretation of the references to color in this figure legend, the reader is referred to the web version of this article.
Over orbital and millennial time scales, hydroclimate in west-central Portugal has generally tracked North Atlantic SST variability (Sánchez Goñi et al., 2008, 2013, 2016), and these changes have been preserved within BG stalagmites (Denniston et al., 2018) with warmer (cooler) Atlantic SSTs corresponding to more humid (drier) conditions at BG. Coherent changes between North Atlantic SSTs and western Iberia climate have also been documented for the Holocene (Boessenkool et al., 2001; Desprat et al., 2003; Pyrina et al., 2019). Martrat et al. (2007) indicate that following an abrupt warming following deglaciation after 20 ka BP, a more gradual warming of Iberian SSTs occurred until 7 ka BP after which they have gradually decreased until present day (Figure 5). The BG record reveals a similar trend after 7 ka BP with increasing values of carbon and oxygen isotopes indicating drying conditions associated with decreasing Atlantic SSTs. Prior to 7 ka BP, the coherence between BG oxygen isotopes and Iberian SSTs is not as prominent.
The isotope series from BG appears to be highly coupled with the Iberian margin SST temperature record during the middle Holocene. When SST and δ13C values are each binned into 300-year intervals, they show stronger coherence during the middle Holocene (R2 = 0.53; p-value < 0.05) and little correspondence in the late Holocene (R2 = 0.021; p-value = 0.62) as the system appears to decouple in modern times. The correlations with oxygen isotopes are similar (middle Holocene: R2 = 0.42, p-value < 0.05; late Holocene: R2 = 0.25, p-value = 0.065), with only the middle Holocene being statistically significant. The recent decoupling may also simply represent an artifact of sampling resolution (Figure 5; SST average resolution = 162 years vs 6.9 years average resolution for BG isotopes), which drastically changes because of slower growth rates in the stalagmites in recent centuries, and/or combined errors within the age models.
In addition, the trends in the BG composite record are generally coherent with trends from a reconstruction of the position of the Azores Front (Repschläger et al., 2017), as indicated by G. ruber w. abundance, especially during the middle Holocene (Figure S7, available online). When the BG composite δ13C values and Azores Front reconstruction data are binned into 200-year intervals, there is moderate correlation during the middle Holocene that is statistically significant (R2 = 0.22; p-value < 0.05). During the early Holocene, the correlations are stronger but not statistically significant (early Holocene: R2 = 0.27; p-value = 0.48) and during the late Holocene, the correlations are weaker and not statistically significant (R2 = 0.11; p-value = 0.17) but do not consider age uncertainties in the Azores Front record. Higher abundances of G. ruber w. are associated with a more northerly position of the Azores Front and positive NAO-like conditions. Conversely, lower abundances of G. ruber w. are associated with a more southerly Azores Front and negative NAO-like conditions (Repschläger et al., 2017).
Centennial-scale hydroclimate variability during the Holocene and influence of solar variability
To illustrate centennial-scale variability, the BG detrended composite carbon and oxygen isotope records are shown in Figure 4b and d after the removal of the long-term trend likely related to millennial-scale/orbitally driven variability. We then compared, the detrended BG record with TSI, a measure of changing solar luminosity as measured by 10Be and 14C activity in ice cores and tree rings (Figure S8, available online) (Steinhilber et al., 2012). TSI variability has been shown to cause changes in climate and has been recorded in other stalagmite records in the Mediterranean region. The stalagmites from two caves in northern Morocco demonstrate that lower δ18O values in the stalagmites are observed during well-known solar minima periods (Ait Brahim et al., 2018) and higher δ18O values are associated with solar maxima. Spectral analysis of stalagmites from northeastern Italy confirms solar influence on the stable isotope values from Grotta di Ernesto (Scholz et al., 2012). A recent modeling study over the last millennium from Pyrina et al. (2019) suggests that there is a tendency toward blocking-like patterns over mid-latitudes during high TSI periods which would lead to increase aridity over Iberia. The residuals from the detrended BG records and the TSI time series were placed into identical 100-year bins in order to compare their variability for the early, middle, and late Holocene (Figure S8, available online). Correlations between TSI and δ18O for the entire Holocene are relatively weak R2 = 0.14 (p-value < 0.05) and between TSI and δ13C are R2 = 0.02 (p-value = 0.11) (Figure S8, available online). For the early Holocene, TSI is inversely related to carbon and oxygen variability (Figure S8, available online). However, these relationships are more robust in the late Holocene for both carbon and oxygen isotopes with TSI (shared variance is between 20% and 36%) than for the other Holocene intervals (Figure S8, available online). Some of the lack of coherence is likely because of uncertainties in the BG composite age model that exist in the early Holocene (Figure S9, available online) and the short length of the early-Holocene BG composite record. To better test this coherence, the record with larger errors (BG composite δ13C record) was tuned to match the record with smaller errors (the TSI record) by aligning the two records with iscam. Although, the result has no physical meaning, the experiment allows us to test the whether the BG composite δ13C record is dominantly controlled by TSI. Although the correlations did not substantially improve by this tuning, some of the maxima and minima values in our isotope records now more closely match solar minima and maxima (Figure S8, available online).
In the BG composite record, periods of decreased (increased) TSI correspond with wetter (drier) conditions, indicated by decreased (increased) δ13C and δ18O values (Figure S8, available online). The lowest sustained values in δ13C and δ18O, interpreted as the wettest interval in the BG composite records, occurred from 0.8 ka BP to 0.15 ka BP. That 550-year period, which corresponds to the Wolf, Spörer, Maunder, and Dalton solar minima and the lowest TSI in recent millennia (PAGES 2k Consortium, 2013), is interpreted from our data to have been characterized by above-average rainfall, followed by a drying pattern since the late 19th century. Another notable feature of the comparison of TSI and δ13C and δ18O records include persistently reduced rainfall from 5.3 ka BP to 3.7 ka BP corresponding to a time period of sustained above-average TSI values (Figure S8, available online).
Spatial variability in Iberian hydroclimate during the Holocene
Although, the Holocene is a relatively stable climate period in relation to past glacial/interglacial variability (e.g. Wanner et al., 2008), several rapid regional to global-scale climatic events have been detected (e.g. the 8.2 ka and 4.2 ka events; Mayewski et al., 2004; Wanner et al., 2008, 2011). However, regional records from Iberia and nearby locations may elicit a more specific characterization of centennial-scale climate variability over the Holocene. Over this time, hydroclimate in Iberia has been attributed to water availability and precipitation dynamics recorded in geographically diverse natural archives including stalagmites (growth rates, δ13C, δ18O, CT scan for density, and Mg/Ca; Moreno et al., 2017; Smith et al., 2016; Spötl et al., 2010; Walczak et al., 2015), lake and marine sediment cores (Chabaud et al., 2014; Pérez-Sanz et al., 2013; Sadori et al., 2011; Schirrmacher et al., 2019; Vegas et al., 2010), lake levels (Moreno et al., 2008), and vegetation distribution/pollen records (Fletcher et al., 2007; Jalut et al., 2009). These reconstructions are predominantly from northern and southern Iberia and are more scarce from western and central Iberia. The detrended δ13C and δ18O BG composite records are used to compare climate in western Portugal to arid and humid intervals from the rest of Iberia (Figure 7) and are discussed below.
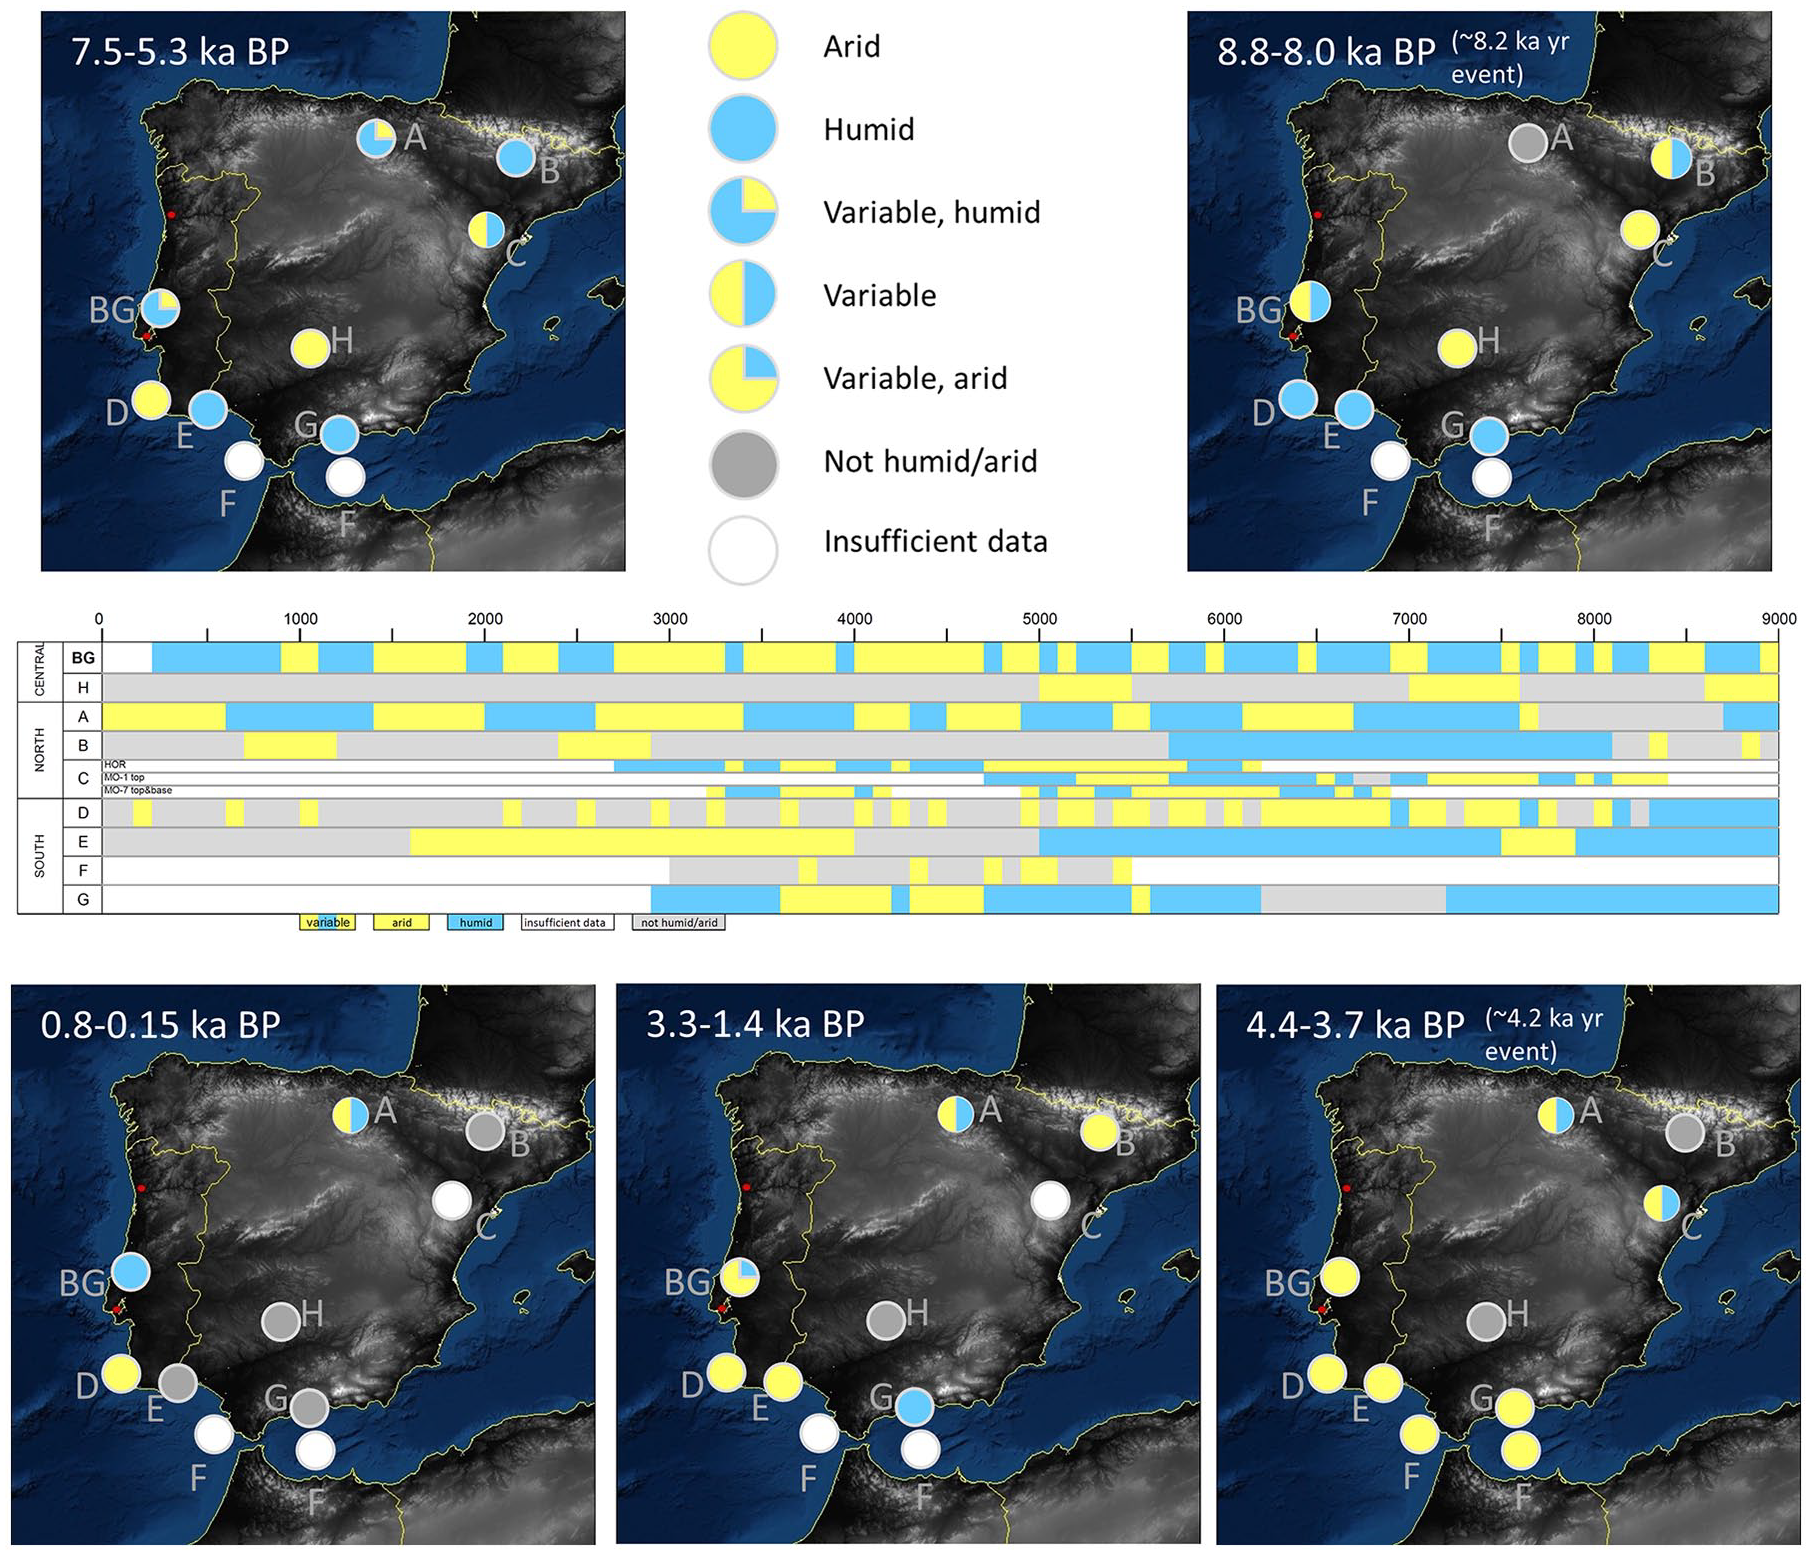
Center time series–Iberian records spanning the Holocene. Records include (A) Smith et al. (2016) – stalagmite δ18O; (B) Pérez-Sanz et al. (2013) – lake record; (C) Moreno et al. (2017) – three stalagmites δ13C and Mg/Ca; (D) Chabaud et al. (2014) – marine core; (E) Fletcher et al. (2007) – pollen record; (F) Schirrmacher et al. (2019) – marine cores; (G) Walczak et al. (2015) stalagmite CT scanning using <2000 HU for arid and >2000 HU for humid intervals; (H) Vegas et al. (2010) – lake record. Authors’ interpretation of wet/humid intervals (records B, E, F, H) or z-scores of data to determine arid/humid intervals in each record (records A, C, D, and BG). Maps indicate spatial variability during 8.2 ka event, 7.5–5.7 ka BP time period, 4.2 ka event, 3.3–1.4 ka BP, and 0.8–0.15 ka BP.
Centennial-scale changes during the early Holocene (11.7–8.2 ka BP)
The BG record does not represent the entirety of the early Holocene; however, the isotope data presented here indicate a highly variable hydroclimate. In particular, centered at 8.4 ka BP carbon isotopes and to a lesser extent, oxygen isotopes indicate rapidly drying conditions. Given the uncertainties in the age model, this excursion may be associated with the 8.2 ka event, which apparently caused widespread drying in Europe and cool SSTs in the North Atlantic (Alley et al., 1997). Numerous paleohydroclimatic proxies from across Iberia delineate the early Holocene as a period of enhanced rainfall relative to the present. These include speleothems from northwestern Spain with enhanced growth rates from 9–6 ka BP (Stoll et al., 2013), δ13C and Mg/Ca ratios from northeast Iberian caves that reveal particularly wet conditions from 11.7–8.5 ka BP (Moreno et al., 2017). Similarly, rainfall increasing until 8.8 ka (and again after 7.7 ka BP) is documented by stalagmites in northern Spain (Smith et al., 2016) (Figure 7). And lacustrine, speleothem, and pollen records from several sites across Iberia indicate an increase in moisture from 10–8 ka (Morellón et al., 2018). Walczak et al. (2015) used high-resolution CT scanning to examine density as a water-excess proxy (Figure 7) and found evidence for an early–middle-Holocene humid period spanning 9.3–7.2 ka BP in southern Iberia. This early Holocene humid period presents itself through expanded Mediterranean forest growth between 9.6–8.1 ka BP (Chabaud et al., 2014). And finally, pollen species from an estuary in the Algarve region of southern Portugal indicate warm, moist climate from 9.0–5.0 ka BP (Fletcher et al., 2007). Conversely, a lacustrine record from Fuentillejo maar-lake in the Central Spanish Volcanic Field of Campo de Calatrava (Figure 7; Vegas et al., 2010) indicates an arid and colder phase in the record from 9.2–8.6 ka BP.
Although records of the NAO system are rare during this interval, Wassenburg et al. (2016) suggest a reorganization of the NAO-like system related to the demise of the Laurentide ice sheet and reduced freshwater input into the North Atlantic. Furthermore, based on precipitation-sensitive speleothem records from northwest Africa and western Germany, as well as modeling output, these authors report relatively wet conditions around 9 ka BP at both locations. However, in recent times, these two locations are generally out of phase in terms of precipitation associated with the NAO (Wassenburg et al., 2016), further supporting a different NAO-like configuration in the early Holocene. Based on a reconstruction by Repschläger et al. (2017), the Azores Front was in a northerly location, from approximately 9–7 ka BP (Figure S7, available online), and this finding is confirmed with the speleothem data of Ait Brahim et al. (2019). If the mean position of the Azores High (and the NAO-like dipole) was more northerly in the early Holocene, it would explain in part why the early Holocene is relatively wet in comparison to the middle and late Holocene (Figure 6). This potential configuration is also consistent with a more northerly position of the ITCZ in the early Holocene (e.g. Haug et al., 2001) which would be associated with a more northerly Hadley cell and Azores High.
Centennial-scale changes during the middle Holocene (8.2–4.2 ka BP)
Our results indicated that middle-Holocene hydroclimate was marked by variable conditions. Increased effective precipitation at BG, indicated by lower stalagmite δ13C values, is evident from 7.5–7.1, 6.9–6.5, 6.4–6.0, and 5.5–5.2 ka BP at BG with drier intervals in between these wetter intervals. Following ~5.0 ka, conditions in western Iberia appear to have transitioned to a markedly more arid climate regime (Figure 7). The most sustained arid interval over the past 9.0 kyr at BG lasted from 5.2–3.4 ka BP (spanning parts of the middle and late Holocene).
Northern Iberia records generally indicate drier conditions in the middle Holocene compared with the early Holocene though the regional records are not strongly coherent (Figure 7). The speleothem growth rate record of Stoll et al. (2013) notes that most of the 21 stalagmites analyzed from caves in northwestern Spain experienced hiatuses between 5.3 ka and 4.1 ka, likely because of an increase in regional aridity. Reduced rainfall marks a lake sediment record from Basa de la Mora after 5.7 ka BP (Pérez-Sanz et al., 2013). And δ13C and Mg/Ca ratios in stalagmites from caves in northeastern Spain indicate dry conditions for much of 8.5–4.8 ka (Moreno et al., 2017; Figure 7).
Conditions in southern Iberia generally match those from the north during this interval (Fletcher et al., 2007; Walczak et al., 2015). Analysis of pollen deposited on the Iberian margin indicates substantially drier middle-Holocene conditions as recorded by an abrupt decrease in Mediterranean forest percentage after ~8.2 ka BP (Figure 7; Chabaud et al., 2014). A recent study from sediment cores in southern Iberia indicates six distinct aridity peaks, all since 5.5 ka BP (Schirrmacher et al., 2019).
Central Iberia is a region with few complete Holocene climate records. One of these is a lacustrine record from Fuentillejo maar-lake in the Central Spanish Volcanic Field of Campo de Calatrava (Figure 7; Vegas et al., 2010). Arid and colder phases in the record occur from 7.5–7.0 ka BP and 5.5–5.0 ka BP and suggest that hydrology in this record is controlled by changes in atmospheric and ocean systems over the past 50 ka (Figure 7). The Fuentillejo maar-lake record is one of the closest Holocene Iberian climate records to BG yet the arid intervals in each of these records are not coherent. This record is ~500 km from BG and at an elevation approximately three times that of BG. It is also much further from the Atlantic Ocean and from the center of influence of the NAO and Azores High systems. These factors likely contribute to the lack of coherence between the BG and Fuentillejo maar-lake records over the last 9.0 kyr. Based on a negative SST trend in the northeastern Atlantic and the western Mediterranean Sea, coupled with a positive trend in the western subtropical Atlantic and northern Red Sea, Wanner et al. (2008) suggest that the NAO was largely in a positive mode in the middle Holocene (approx. 6–5 ka BP) and shifted to a negative mode in the late Holocene (after ~5 ka BP). Modeling work by Gladstone et al. (2005) corroborate this finding and also suggest a positive NAO mean state during the middle Holocene. Mauri et al. (2014) found that the middle Holocene was characterized by conditions similar to those during present-day positive NAO indices. Moreover, the study by Repschläger et al. (2017) indicates that the Azores Front was in a northerly position during the middle Holocene, with an abrupt change to a more southerly location at 4 ka BP. Generally speaking, increased aridity in Iberia during the middle Holocene is consistent with the expected impacts of a persistent and/or frequent NAO positive state.
Within the Iberian Peninsula, including at our location in western Portugal, there are indications of severe aridification centered around 4.2 ka BP. According to Mejías-Moreno et al. (2014), around this time, motilla-type settlements were constructed near La Mancha, Spain. These motillas allowed for collection of groundwater during this extreme dry event and were abandoned about 1000 years later, when wetter conditions were in place. The time period around 4.2 ka BP marks the transition to the Neoglacial period (Wanner et al., 2011) and this cooling period is related to aridity in central North America (Booth et al., 2005) and collapses of other cultures such as the old Akkadian culture (Weiss et al., 1993) in Mesopotamia, ancient Chinese (An et al., 2005), and Egyptian cultures (Stanley et al., 2003). The arid interval in BG lasting from 5.2 ka BP to 3.4 ka BP encompasses this time of cultural shifts in Iberia and other parts of the world and suggests that this may have been a regional-scale event with droughts causing population shifts. Furthermore, the pervasiveness of the 4.2 ka climate anomaly in Europe (e.g. Bini et al., 2019; Isola et al., 2019; Schirrmacher et al., 2019) suggests a common forcing. Based on our study, increased TSI values and likely NAO positive conditions (e.g. Gladstone et al., 2005; Repschläger et al., 2017) during this interval are coincident with increased aridity throughout the region and are likely forcings for this event.
Centennial-scale changes during the late Holocene (4.2 ka to present)
The record from BG shows dry conditions at the start of the late Holocene and variable, but slightly wetter, conditions following the aridity peak prior to 4.0 ka BP (Figure 7). The lake sediment record of Pérez-Sanz et al. (2013) from the central southern Pyrenees indicates generally dry conditions after 5.7 ka BP with two distinct arid intervals in the record at 2.9–2.4 ka BP and at 1.2–0.7 ka BP, the latter associated with the Medieval Climate Anomaly (MCA). The Walczak et al. (2015) stalagmite density record indicates dry conditions at the start of the late Holocene (Figure 7) and precipitation increasing through the end of the record ~3.0 ka BP.
The MCA in the BG composite record is a shorter arid interval than the arid interval at the start of the late Holocene and the following time period, the ‘Little Ice Age’ (LIA), is the most persistent wet interval in the BG detrended record since 9.0 ka BP. The time period following medieval times in the BG record is noteworthy because of the persistence of lower oxygen and carbon isotope values. These low values (Figure 7) are indicating that this time period (0.8–0.15 cal. yr BP) was relatively wetter in western Iberia. In the past 150 years, carbon and oxygen isotopes indicate a trend toward drying conditions. As depicted in Figure 6, this increased aridity is consistent with a minor northward migration of the Azores High and Hadley Circulation. In addition, the recent trend suggests that the ITCZ is also slightly northward compared with the LIA configuration. These associated northward shifts in the Azores High, Hadley Circulation, and the ITCZ are not associated with insolation changes (Berger and Loutre, 1991), rather they are most likely attributed to regional warming associated with increased greenhouse gas forcing (Bindoff et al., 2013; Hu et al., 2018; Hu and Fu, 2007).
Sánchez-López et al. (2016) compiled records from northern, central, and southern Iberia during the last 2500 years to examine changes in hydroclimate (i.e. warm/cool and wet/dry conditions) in the region. The results vary and imply that regional differences in hydroclimate have occurred over this time period. North-south and west-east humidity gradients exist during the early portions of the 2500-year compilation. For example, the time period 2.3–1.6 ka BP indicates humid conditions in southern Iberia as shown in Alboran Sea (Martín-Puertas et al., 2010), West Algerian-Balearic Sea (Nieto-Moreno et al., 2011), and Laguna de Rio Seco records (Jiménez-Espejo et al., 2014), varied conditions in central Iberia (e.g. Moreno et al., 2008; Sánchez-López et al., 2016), and arid conditions in several northern Iberia records (e.g. Jambrina-Enríquez et al., 2014; Morellón et al., 2009, 2011). Spatially homogeneous conditions existed during the MCA (1.1–0.7 ka BP) and LIA (0.7–0.15 ka BP) (Sánchez-López et al., 2016) with the MCA characterized by warm and/or dry conditions in most records and the LIA characterized by humid and/or cool conditions. These spatially homogeneous conditions during the MCA and LIA are generally also seen in the BG composite record.
Globally recognized late-Holocene cold lapses exist and likely resulted in changes in hydroclimate conditions for parts of Iberia. According to Wanner et al. (2015), these cold lapses were the result of two or more factors – slowly decreasing orbitally driven insolation overlaid with the influences of volcanic eruptions and solar irradiance variability. Internal modes of climate variability (such as the NAO) influence climate and weather in this region today and were possibly important factors impacting climate throughout the late Holocene as well. Understanding NAO-like variability in the past (e.g. Cook et al., 2019; Faust et al., 2016; Lehner et al., 2012; Olsen et al., 2012; Ortega et al., 2015; Trouet et al., 2009) is important for understanding its present and future behavior. In the Iberian region, some of the climatic changes in recent millennia have coincided with large-scale North Atlantic processes and/or the Hadley Circulation (Luterbacher et al., 2012; Moreno et al., 2011, 2012) as well as regional modes of climate variability such as the East Atlantic and Scandinavian modes that directly impact hydroclimate (Hernández et al., 2015; Sánchez-López et al., 2016). Moreover, several recent studies (Baker et al., 2015; Olsen et al., 2012; Trouet et al., 2012) have offered insight into the dynamics of the NAO in recent millennia; however, several unresolved issues remain. For example, if the NAO system was locked into a positive state for most or all of the MCA (c.f. Trouet et al., 2009), then dry conditions should have dominated the region at the southern node of the NAO. However, at least three studies from Spain (Martín-Chivelet et al., 2011) and Morocco (Ait Brahim et al., 2017; Wassenburg et al., 2013) provide evidence of substantial wet intervals within the MCA, and modeling studies have not been able to replicate an entrenched positive NAO mode during this time (Lehner et al., 2012; Ortega et al., 2015). Sediments from a Norwegian fjord reveal a rapid shift in precipitation around 700 yr BP consistent with NAO negative conditions (Faust et al., 2016), however, this shift is about two centuries earlier than the changes noted by Trouet et al. (2009). Our isotope data are consistent with a frequent NAO negative mode for much of the LIA, which would have caused relatively wet conditions at our study site. Thus, it appears that some of the regional hydroclimate variability at the MCA/LIA transition may have resulted from a southward shift in the Azores High system rather than a weakening of this high pressure system alone (see Wassenburg et al., 2016). Although the persistence (duration and strength) and mean location of the Azores High largely control the hydroclimate of the Iberian Peninsula by influencing storm tracks, the dynamics of this pressure system, like the NAO, are poorly constrained through space and time (Iqbal et al., 2013; Karnauskas and Ummenhofer, 2014; Wallace and Hobbs, 2006). Thus, additional work to constrain the Azores High system and the NAO through time is critically needed.
Conclusions and Implications
The six stalagmites presented here document significant changes during the Holocene from west-central Portugal. Carbon and oxygen isotopes from the composite record of six stalagmites from BG record hydroclimate variability in western Portugal. The long-term trend in carbon and oxygen isotopic variability suggests drier conditions in the middle to late Holocene in Portugal as evidenced by increasing δ13C and δ18O values throughout the time period 9.0 ka to present. This trend mimics the long-term trend of decreasing values in summer insolation and decreases in Iberian margin SST over this time.
Spatial and temporal variability in Iberia is substantial over the Holocene. Although geographically small, the Iberian Peninsula encompasses varied topography, temperature, and precipitation patterns. Many high-resolution records from around Iberia are necessary for full understanding of past and future hydroclimate variability. This composite stalagmite record demonstrates that substantial hydroclimate variability has existed in west-central Iberia. Superimposed on the long-term insolation-driven climate trend, the stalagmite climate record from BG shows significant short-term shifts from wet to dry conditions over the Holocene. Study of these records allows for a better understanding of the important millennial-scale and centennial-scale drivers of climate in this region – insolation, Atlantic SSTs, TSI, and atmospheric variability, including the NAO. In addition, long-term changes in the composite isotope records are consistent with a southward displacement of the ITCZ during the Holocene and likely reflect changes to the configuration of Hadley Circulation. The origins of this short-term variability in the record from BG, as suggested by correlation with other regional records, may be most strongly related to the strength and/or position of the Azores High and centennial-scale shifts in TSI, especially in the late Holocene.
Despite the progress made in this study, there still exists a need for more highly resolved records of the Holocene from the Iberian Peninsula to achieve a better understanding of spatial and temporal hydroclimate variability. Records from diverse geographic regions and from different paleoclimate archives will help to understand past hydroclimate variability in the face of current and predicted future regional drying.
Supplemental Material
Thatcher_et_al_Supplemental_File1 – Supplemental material for Hydroclimate variability from western Iberia (Portugal) during the Holocene: Insights from a composite stalagmite isotope record
Supplemental material, Thatcher_et_al_Supplemental_File1 for Hydroclimate variability from western Iberia (Portugal) during the Holocene: Insights from a composite stalagmite isotope record by Diana L Thatcher, Alan D Wanamaker, Rhawn F Denniston, Yemane Asmerom, Victor J Polyak, Daniel Fullick, Caroline C Ummenhofer, David P Gillikin and Jonathan A Haws in The Holocene
Footnotes
Acknowledgements
We thank Dr. Maria Sánchez Goñi for sharing marine core MD95-2042 data and Dr. Ana Moreno for sharing stalagmite data from Molinos and Ejulve caves. Alaina Chormann, Hannah Thatcher, and Jayna Wanamaker assisted with field work at BG. Use of the following datasets is gratefully acknowledged: Global Precipitation Climatology Center data by the German Weather Service (DWD) accessed through http://gpcc.dwd.de; 20th Century Reanalysis provided by NOAA/OAR/ESRL PSD, Boulder, Colorado, through their website http://www.cdc.noaa.gov, and supported by the U.S. Department of Energy, Office of Science Innovative and Novel Computational Impact on Theory and Experiment program, and Office of Biological and Environmental Research, and by the NOAA Climate Program Office. Thanks to Natalie Renier (WHOI Graphics) for help with the design of ![]() . We thank two anonymous reviewers for their thoughtful comments which substantially improved this paper. Stable and U-series isotope data are available at the NOAA National Centers for Environmental Information website.
. We thank two anonymous reviewers for their thoughtful comments which substantially improved this paper. Stable and U-series isotope data are available at the NOAA National Centers for Environmental Information website.
Authors’ note
Stalagmites were sampled in conjunction with the Instituto de Gestão do Património Arquitectónico e Arqueológico (IGESPAR) and Associação de Estudos Subterrâneos e Defensa do Ambiente (AESDA), which created the map of Buraca Gloriosa.
Funding
The author(s) disclosed receipt of the following financial support for the research, authorship, and/or publication of this article: This work was supported, in part, by the US National Science Foundation (Grants: #1804528 to ADW; #1804635 to RD; #1804132 to CCU; #1806025 to YA and VP; #1805163 to DPG; BCS-0455145, BCS-0612923, and BCS-1118155 to JAH).
Supplemental material
Supplemental material for this article is available online.
References
Supplementary Material
Please find the following supplemental material available below.
For Open Access articles published under a Creative Commons License, all supplemental material carries the same license as the article it is associated with.
For non-Open Access articles published, all supplemental material carries a non-exclusive license, and permission requests for re-use of supplemental material or any part of supplemental material shall be sent directly to the copyright owner as specified in the copyright notice associated with the article.