
Abstract
This paper aims at reconstructing the population dynamics during the Neolithic and Bronze Age, c. 4500–500 cal. BC, in north-western Central Europe. The approach is based on the assumption that increased population density is positively linked with human activity and human impact on the environment, respectively. Therefore, we use archaeological 14C dates and palaeoenvironmental data from northern Germany and south-western Denmark to construct and compare independent proxies of human activity. The latter involves relative quantification of human impact based on pollen analysis and soil erosion history inferred from summarizing of dated colluvial layers. Concurring patterns of changes in human activity are frequently recorded on a multi-centennial scale. Whereas such multi-proxy patterns are interpreted to indicate relative population changes, divergent patterns are discussed in the context of proxy-related uncertainties and potential biases. Patterns of temporal distribution of increasing and decreasing human activity are understood as ‘boom and bust’ phases in population density/size. Based on the comparison of the three proxies, we identify five phases of growing (boom) and four phases of decreasing (bust) population. The boom phases date to ca. 4000–3500, 3000–2900, 2200–2100, 1450–1300 and 1000–750 cal. BC. The bust phases to ca. 3200–3000, 2400–2300, 1650–1500 and 1200–1100 cal. BC.
Keywords
Introduction
Population dynamics are regarded as crucial for understanding social change and cultural organization in prehistoric societies (e.g. Shennan, 2013). However, comparatively little archaeological estimates are available for central and northern prehistoric Europe (Müller, 2013, 2016; Müller and Diachenko, 2019; Zimmermann et al., 2009). This might reflect challenges of absolute demographic reconstructions in the archaeological context which, especially on a larger regional spatial scale, is often hampered by limited and/or small data sets. In recent years, the sum calibration of radiocarbon dates became increasingly popular as indirect proxies for relative population changes (Downey et al., 2014; Hinz et al., 2012a; Riede, 2009; Shennan et al., 2013). As rightly suggested by critical evaluations of this method, however, the results should be interpreted in the context of a multi-proxy approach to investigate potential biases (e.g. Contreras and Meadows, 2014; Crombé and Robinson, 2014).
A relationship of human activity and population density, however, can also be assumed for palaeoenvironmental data, for example, human impact on vegetation or soil erosion (cf. Lechterbeck et al., 2014). Therefore, these can provide additional indirect proxies for population dynamics. In prehistoric sedentary societies the population density of an area can be regarded to be correlated with the area used for agricultural activities (Zimmermann et al., 2004). Disentangling human–environmental interaction, however, is a challenging task, and before thinking about quantitative causal connections and detailed explanation models, there is the need to define and sharpen our proxies. Are the proxies comparable at the same temporal and spatial scales? Are our proxies equally sensitive enough to record all potential developments? And what are the systematic and methodological uncertainties and biases involved?
In this article, we compare different independent proxies for human activity on a landscape scale from northern central Europe, that is, northern Germany and southern Jutland, Denmark, in order to estimate the relative population dynamics during the Neolithic and Bronze Age. Besides summarizing archaeological 14C dates, this involves the relative quantification of human impact from pollen analysis using multivariate statistics and soil erosion history from records of colluvial layers.
All our proxies relate to the estimation of human impact on the natural environment, be it with respect to the degree of landscape openness, soil erosion or the deposition of radiometric dateable artefacts and structures, and to the following assumption: the higher the population density in an area, the stronger the degree of human impact. Pollen data have generally the best temporal resolution and can be used to identify even short-term multi-decadal changes, as it comprises regularly sub-sampled time series records with high dating quality. However, as a single pollen profile reflects a combination of (extra-) local and regional signals, rather local developments might influence the signal of one site. This means that developments only recorded at one site have to be interpreted with care regarding their larger spatial significance. The two other proxies are based on summarizing data sets of single dated events or structures and, therefore, can only provide a diachronic perspective on a larger spatial scale, that is, regional to over-regional. In both the cases, the results might be strongly influenced by dating uncertainties and research intensity for certain time periods. Furthermore, and especially when the number of events is low, the question of representativeness of the data set has to be considered.
Moreover, the postulated relationship of human impact and population density can also be influenced by qualitative changes in terms of anthropogenic activities. For example, it has to be considered that extensive and intensive land-use strategies might differ with respect to the traceable human impact on different environmental archives. In addition, technological innovations can result in a sudden change of such a relationship. Therefore, our data from palaeoenvironmental archives only provide indirect proxies for relative population changes, and have to be discussed against archaeological evidence with respect to qualitative changes in land-use strategies. We are aware that it often remains difficult to evaluate the level of proxy-related uncertainty, because of various potential biases (i.e. other non-population size-related factors influencing the estimation) and spatial and temporal fuzziness. Nevertheless, the combined interpretation of multiple, independently constructed proxies allows the identification of demographic patterns with much greater confidence than a single method.
Materials and methods
Palynology
Multivariate ordination techniques within palaeoecology can be used in order to identify important gradients within the data sets (Bennett and Hicks, 2005; Birks et al., 1988; Feeser et al., 2012; Fyfe and Woodbridge, 2012; Hinz et al., 2012a; Lechterbeck et al., 2009). Here we use a principal component analysis (PCA) as preliminary runs revealed a clear separation of woodland taxa and light demanding taxa, including the main palynological anthropogenic indicators (cf. Behre, 1981) on the first axis. As closed mixed oak forests can be assumed to be the zonal natural climax vegetation of our study area (cf. Nelle and Dörfler, 2008), increased landscape openness is interpreted to reflect human impact on the natural vegetation.
Multiple PCA runs on varying time windows were carried out as fundamental qualitative changes in land-use practices and/or invasion of new plant species may change the relationship of pollen taxa with respect to the main gradient, which in turn would hamper the diachronic interpretation in terms of relative human impact dynamics. These analyses indicated a rather stable relationship during the time period of ca. 4000–700 cal. BC and therefore support our approach of using the PCA results as quantitative proxy for human impact during the Neolithic and Bronze Age period (see Supplemental Material 1, available online).
The pollen data used for this study relate to two lakes with annually laminated sediments from Northern Germany, Lake Belau and Lake Woserin (Table 1, Figure 1). Previous studies focusing on the Neolithic period already revealed concurrent synchronous patterns reflecting over-regional trends and events (Dörfler et al., 2012; Feeser and Dörfler, 2015; Feeser et al., 2016).
Overview of sites used for palynological reconstruction of population changes.
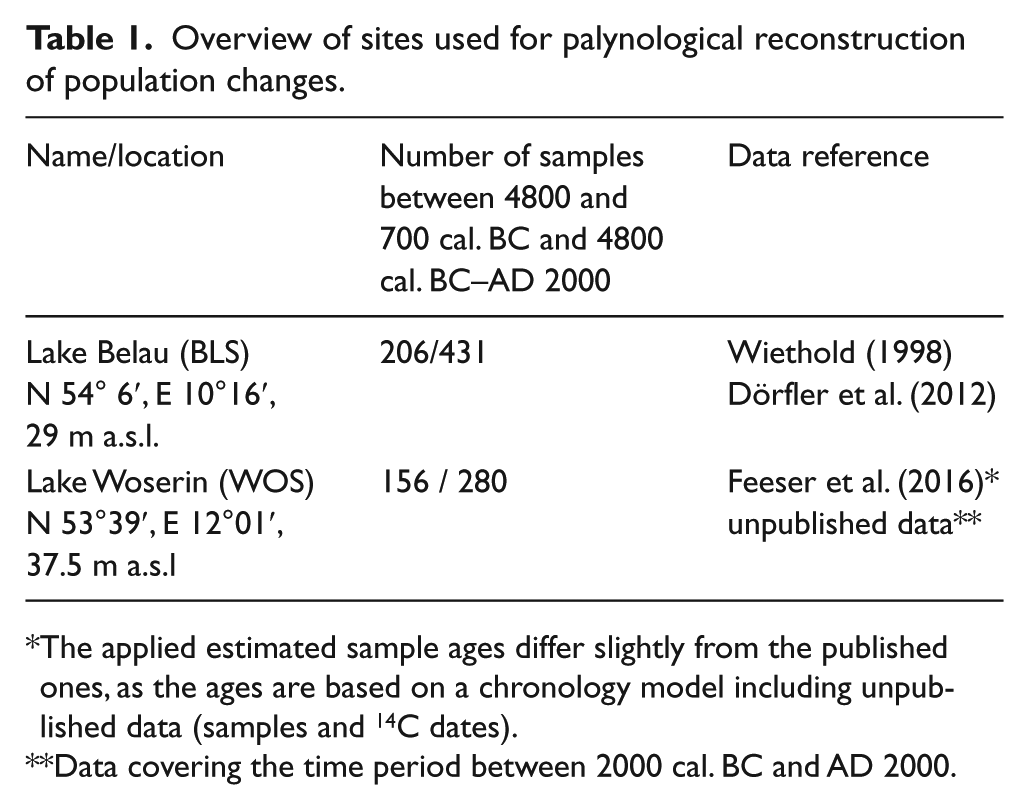
The applied estimated sample ages differ slightly from the published ones, as the ages are based on a chronology model including unpublished data (samples and 14C dates).
Data covering the time period between 2000 cal. BC and AD 2000.
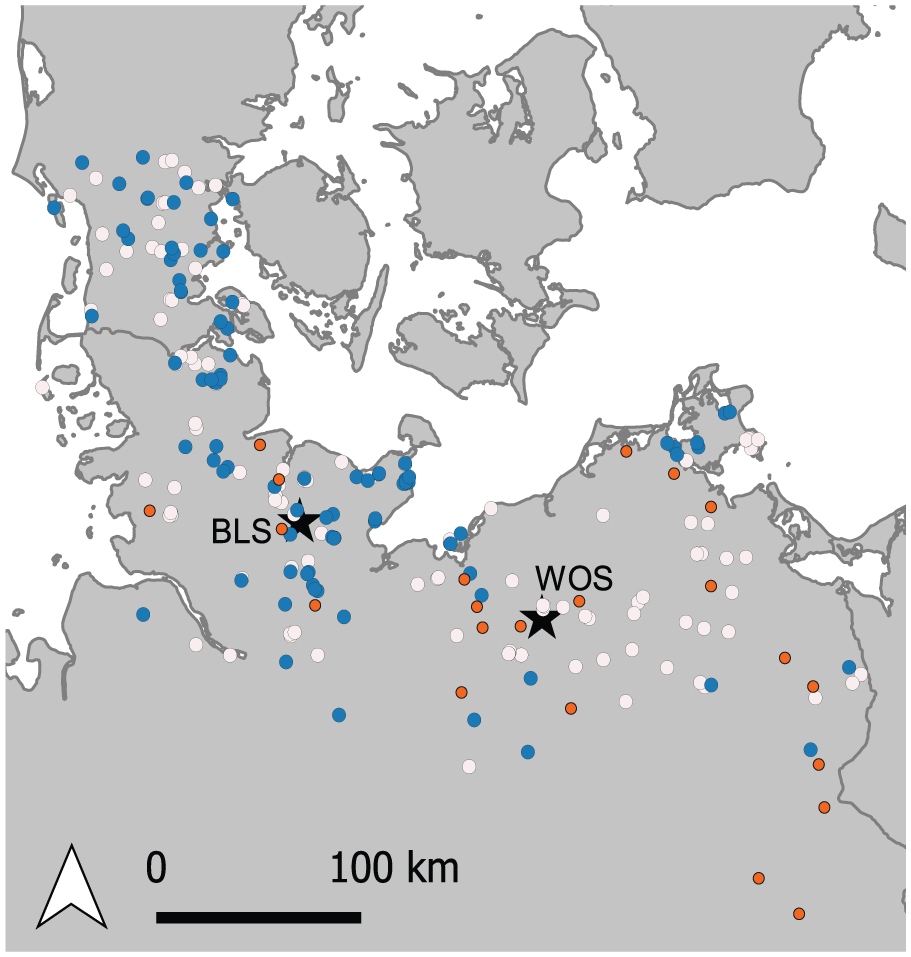
Map with pollen sites (stars; BLS: Lake Belau; WOS: Lake Woserin), sites of colluvial layers (orange) and distribution of 14C dates (blue: from settlement context; white: all other contexts) used in this study.
Pollen percentage data, based on a pollen sum of all terrestrial taxa from the two sites were combined in a single data set. Only terrestrial pollen taxa with a frequency of >50% in the combined data set and if present with an average abundance >1% were selected in order to reduce noise by rare types. In addition, Pteridium spores (98% frequency), Cereal-type pollen excl. Secale (45% frequency) and Secale (<1% frequency) were included as important anthropogenic indicators (Behre, 1981).
In order to down weigh the dominance of numerically abundant pollen taxa in the PCA, we scaled each taxon’s relative pollen percentages by subtracting the mean and division by its standard deviation (i.e. z-scores standardization).
The analyses were carried out using R 3.5.0 and RStudio (version 1.1.453).
Geoarchaeology/soil erosion record
The compiled soil erosion records can be displayed in the form of simple histograms for different regions (Dreibrodt et al., 2010), or edited by statistical methods like probability distribution if only comparable types of data are considered (Hoffmann et al., 2008; Lang, 2003). When data of very different age precision are compared, a rather simple aoristic approach might be applied (Mischka, 2004; Ratcliffe, 2000; Ratcliffe and McCullagh, 1998). Although such compilations reflect to a certain degree the research history, they give an idea about the soil erosion intensity, age and duration of human impact on the landscape, in particular when a large number of erosion records is considered.
For this article, dates of colluvial layers deposited in the interval between 4500 and 500 cal. BC in the young moraine area of Northern Germany (Schleswig-Holstein, Mecklenburg-Vorpommern, Brandenburg) have been compiled. The data set consists of records published in Dreibrodt et al. (2010); a few records were added (Kappler et al., 2018; Landesamt für Kultur und Denkmalpflege Mecklenburg-Vorpommern, 2017; Müller, 1997).
In total, 40 colluvial layers from 28 sites dated to 4500–500 cal. BC are presently known from the study area (Figure 1) and were taken into consideration for this study (14 dated via embedded artefacts, 24 via radiocarbon dating, 2 via luminescence dating (OSL)). Only 14 of the 40 dated layers are directly connected to archaeological excavations. Thus, a strong bias because of a research focus is regarded to be unlikely.
We applied two different methods to summarize the data. The first approach is based on a stacking of age ranges generally similar to the approach used by Dreibrodt et al. (2010) (two sigma for calibrated radiocarbon ages, one sigma for luminescence ages, the length of a respective archaeological cultural phase in the case of dating via embedded artefacts). In this case, however, the reciprocal value of the age range in years was used as stack value for each colluvial layer. This results in a stronger weighting towards more precisely dated layers and helps to partly overcome difficulties like radiocarbon calibration plateaus.
For the second approach, we used the KDE_Model algorithm as implemented within Oxcal 4.3 (Bronk Ramsey, 2009, 2017) with standard settings in order to estimate the underlying density of erosion events.
Archaeological 14C dates
For our analysis, we compiled a data set of 1439 radiocarbon dates from 173 archaeological sites of the late Mesolithic to Bronze Age periods, falling within the range of 8000–2500 uncal. BP from the RADON (Hinz et al., 2012b) and RADON-B database (Kneisel et al., 2013) from northern Germany and Southern Jutland, Denmark. This included 816 radiocarbon dates from 83 settlement sites (Figure 1).
In order to summarize the 14C data sets, we applied two different approaches, summing of calibrated date distributions and Kernel density estimations.
Summed calibrated date probability distributions (SCDPD) were calculated using R 3.5.1 and the rcarbon package 1.2.0 (Bevan et al., 2018). We used the binsense function (h = 0–1000 in steps of 100) to produce Bin Sensitivity Plots. The bin sensitivity approach allows to evaluate the potential biases of research foci on single sites, which could result in an overrepresentation of a site due to an unusually high number of radiocarbon dates. Hereby, radiocarbon dates are grouped for individual sites with a varying degree of binning depending on the so-called h value. The higher the h value the stronger the binning, that is, less groups of radiocarbon dates for a site are allowed. All results have been smoothed using a 100-year moving average.
As an alternative to the SCDPD, we applied kernel density estimation (KDE) using a script by McLaughlin (2018). This method has been recently suggested as an alternative for SCDPD for estimating the underlying distribution of discrete events (cf. also Bronk Ramsey, 2017). The KDE was run with default settings, that is, using a Gaussian kernel and a bandwidth of 30 years.
Results
Palynology
The result of the PCA spanning the pollen data between 4800 and 700 cal. BC shows that 29.23% of the variability in the data set is explained by the first axis (2nd axis accounts for 11.61 %, Figure 2). Taxa with high scores on the first axis include besides wild grass-type, classical anthropogenic indicators, for example, Rumex acetosa-type, Artemisa and Plantago lanceolata-type, whereas negative scores are generally attributed to arboreal taxa of the so-called ‘mixed oak forest’.
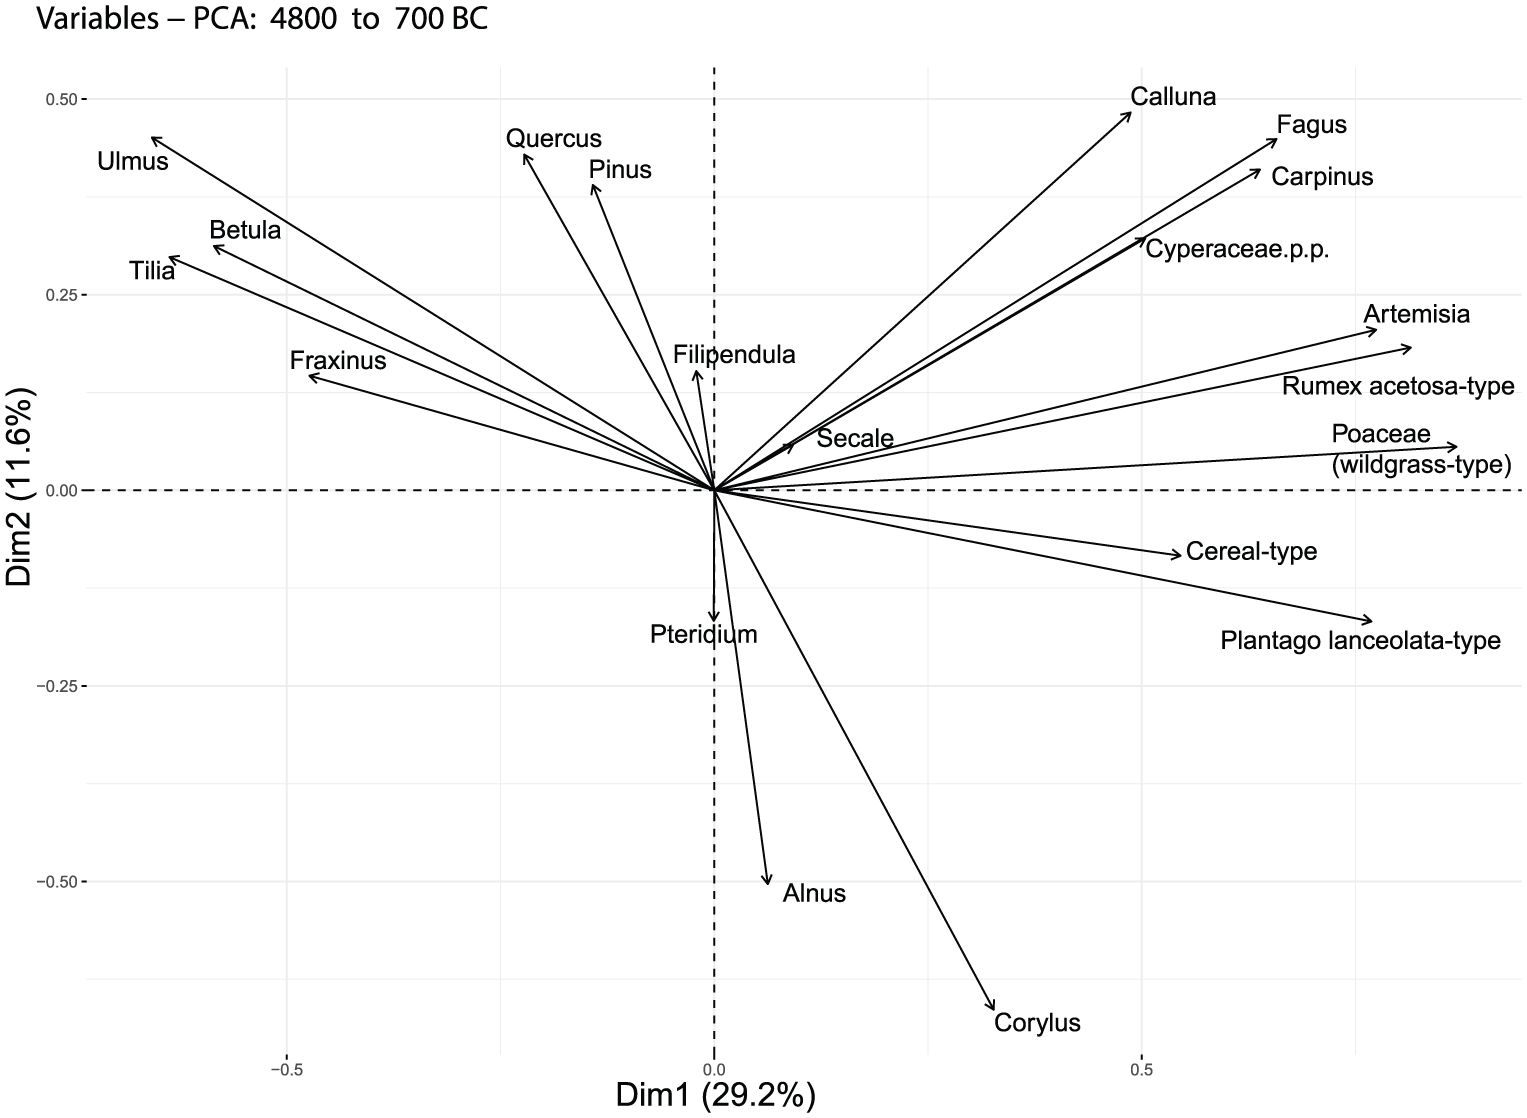
PCA ordination plot of taxa scores for data set spanning 4800–700 cal. BC. The first axis (Dim1) mainly separates taxa of the Atlantic mixed oak forest (left) from non-arboreal pollen taxa (right).
The spectra scores plotted for each site on an age scale (Figure 3) are interpreted as regional proxies for human environmental impact. Generally, the curves for both the sites show very similar developments, which are regarded to indicate common over-regional signals of human impact change. Main differences are only obvious between ca. 3500 and 3100 cal. BC, probably indicating diverging regional developments (see Discussion). In order to create an over-regional summary curve (black line in Figure 3), a 100-year running mean for every 50 years was applied to the spectra score record of each site. Subsequently, averages for each 100-year time windows were calculated using the running mean data from both the sites.
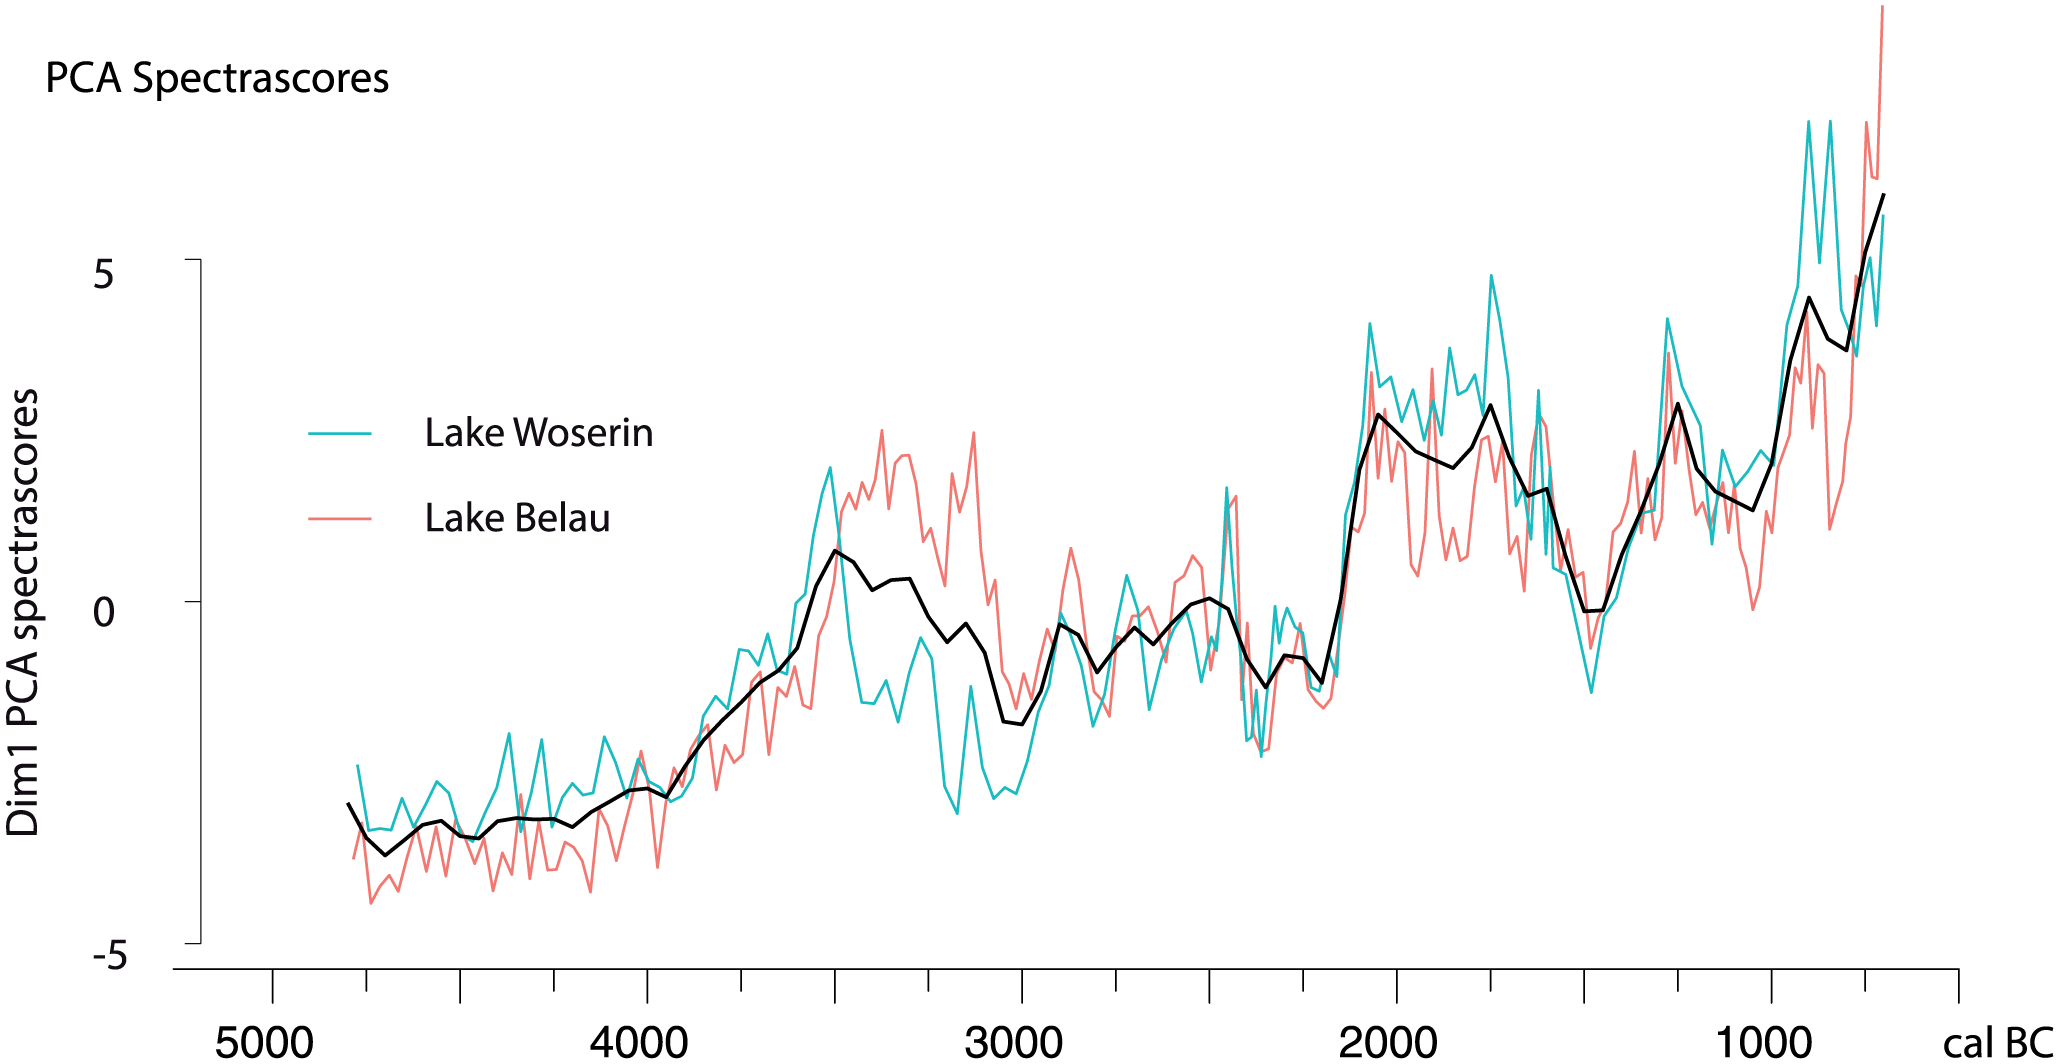
PCA Spectra scores for Lake Woserin (WOS) and Lake Belau (BLS). Black curve gives smoothed average values (see text for details).
The palynological proxy, therefore, suggests five distinct phases of over-regional increasing human impact between ca. 4000 and 3500, 3000 and 2900, 2200 and 2100, 1500 and 1250, and 1000 and 900 cal. BC and four of decreasing human impact during ca. 3300–3100, 2400–2300, 1650–1500 and 1200–1100 cal. BC.
Geoarchaeology/colluvial record
The results of the two approaches to summarize age estimates from colluvial layers from Northern Central Europe are shown in Figure 4. Both the graphs generally reveal similar patterns of changing soil erosion intensity on a centennial to multi-centennial scale. A first distinct increase in soil erosion activity can be observed between 4000 and 3700 cal. BC. Until ca. 3200 cal. BC, soil erosion evidence generally remains on a rather high level before it decreases sharply. Between ca. 3000 and 2250 cal. BC, evidence for soil erosion is generally low, with somewhat higher values after ca. 2500 cal. BC. A short minimum is recorded at around 2250 cal. BC. This is followed by a second distinct phase of increasing soil erosion between ca. 2200 and 1800 cal. BC. At ca. 1700 cal. BC the erosion record declines sharply, which leads into a pronounced minimum centred at around ca. 1500 cal. BC. A third phase of distinct increased evidence of soil erosion is indicated for the time between ca. 1300 and 1150 cal. BC, after which generally elevated erosion levels remain until ca. 1000 cal. BC. A subsequent lull centred at around ca. 900 cal. BC is followed by the maximum values between 800 and 700 cal. BC.
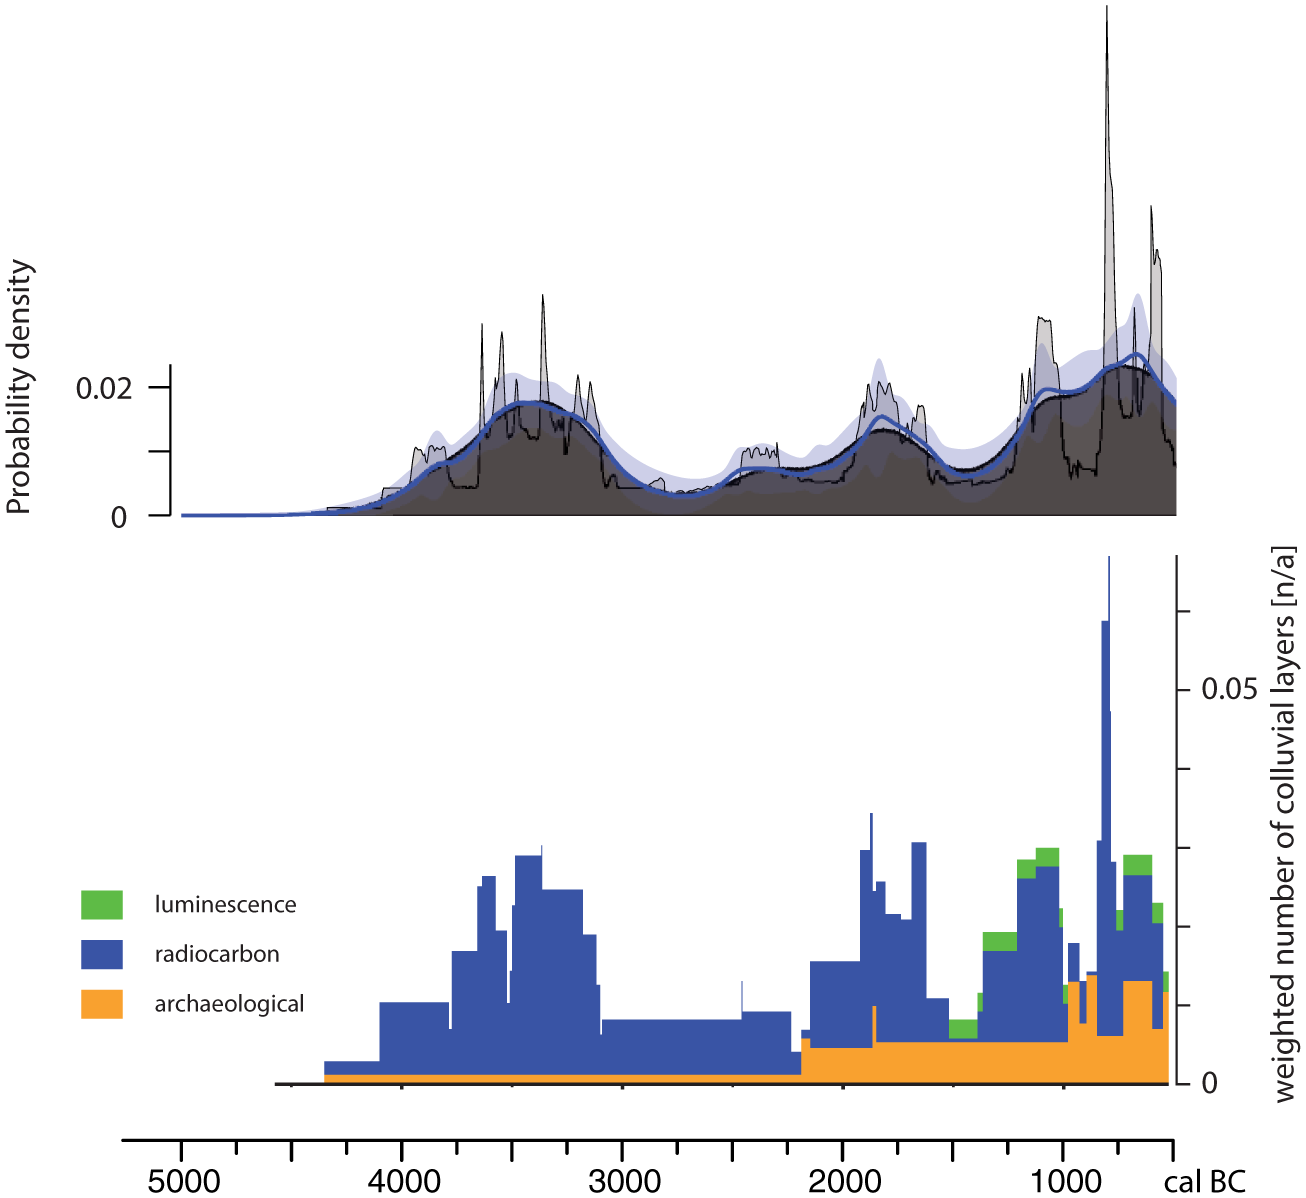
Soil erosion record, based on OxCal KDE_Model (Top: dark grey distribution is the sampled KDE estimated distribution, the blue line and lighter blue band show the mean one sigma for snapshots of the KDE distributions generated during the model process; the light grey distribution shows the summed dating probability distribution) and weighed stacked colluvial layer record (Bottom: underlying dating methods indicated by colours).
Archaeological 14C dates
Figure 5 shows the SCDPD Bin Sensitivity Plots (normalized SPD) and the KDE plots (MCdensity) for dates relating to settlement sites (top) and dates from all archaeological features (bottom). A comparison of the KDE curves and SCDPD curves for unbinned data (i.e. h = 0) reveals good agreement of both the approaches in terms of signals on a centennial to multi-centennial scale. This suggests that corresponding fluctuations in the SCDPD curves do not reflect merely methodological artefacts because of the shape of the calibration curve. The results of the Bin Sensitivity Plots, however, suggest that systematic biases because of research-related sampling intensity or changes in settlement and burial practices have to be considered. The former is the case for two time windows for which the SCDPD values decrease distinctly with an increasing degree of binning, that is, for the time spans between 4500 and 4250 and 1500 and 1250 cal. BC.
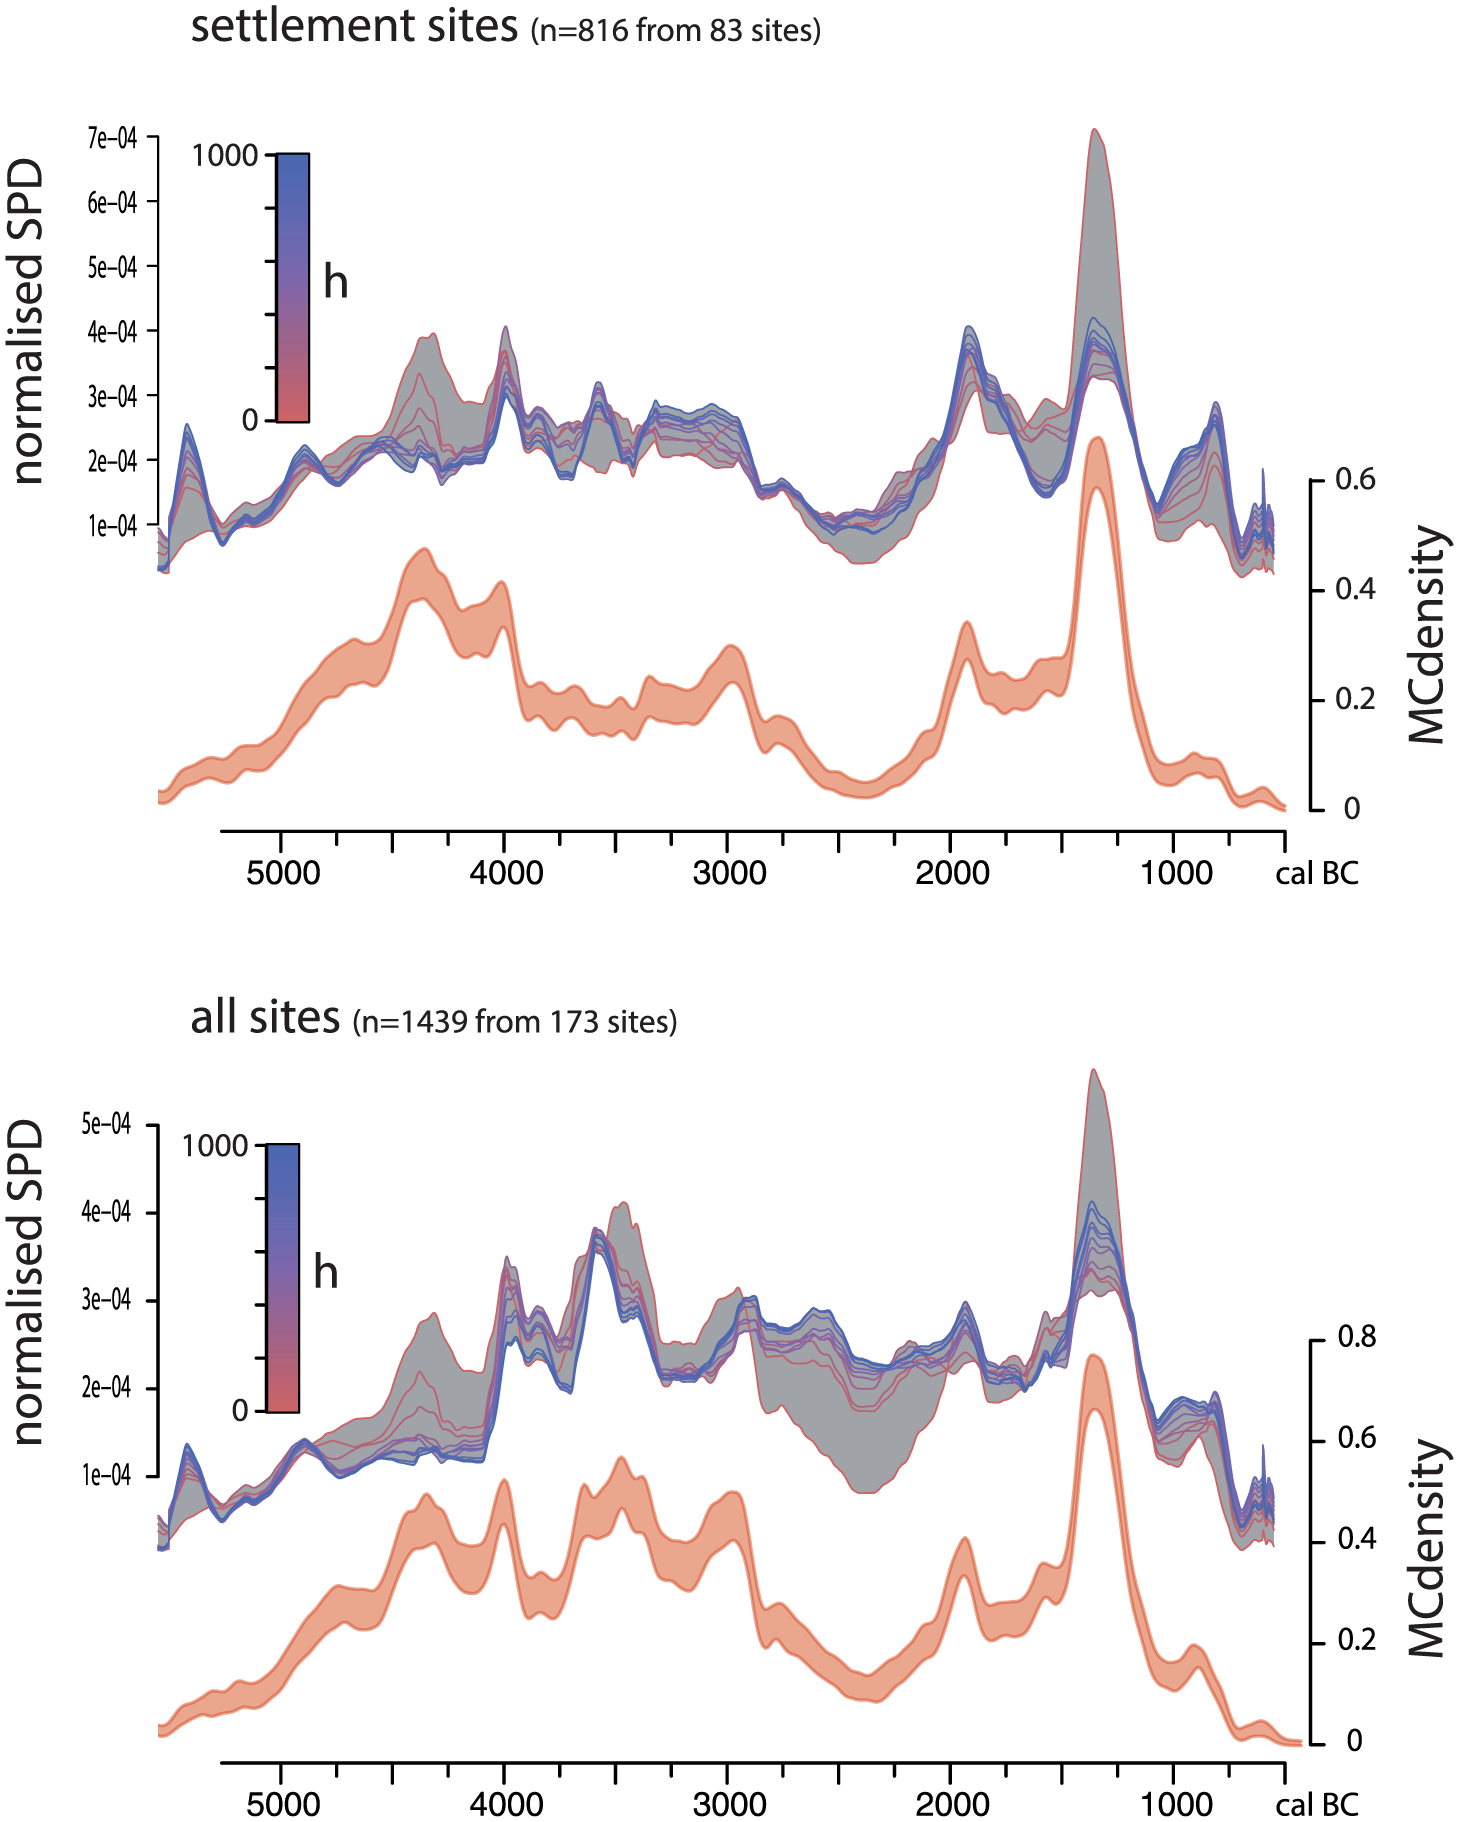
Bin sensitivity plots based on summed calibrated date probability distributions (SPD) using different degrees of binning on-site level (h = 0 no binning; h = 1000 high binning) and Kernel density plots (KDE) of available radiocarbon dates from the settlement context (settlement sites) and all archaeological contexts (all sites).
The first time window relates to the time of the Mesolithic–Neolithic transition, a period which generally gets a lot of research attention, including increased dating efforts as the exact timing is of particular interest (Bonsall et al., 2002; Hartz, 2000; Hartz et al., 2008; Scharl, 2004; Whitehouse et al., 2014). Also in our study area, there has been a research focus on this transition during the past decades, which might explain the overrepresentation of 14C dates from settlement sites for the late Mesolithic and earliest Neolithic periods (Hartz, 1997, 2000; Hartz et al., 2008; Hartz and Lübke, 2005).
The second time window (1500–1250 cal. BC) relates to the end of the Older Bronze Age, an archaeological period which also gained a lot of research attention with respect to settlement structures during the past decades (e.g. Bech and Haack Olsen, 2013; Meier, 2013). Also, in this case, the strong decrease in SCDPD values in the context of site-related binning indicates higher dating effort on certain settlement sites. In this case, however, a peak in the SCDPD values remains even with the maximum binning, indicating a robust signal despite a certain degree of research bias.
In two cases, divergent patterns in the SCDPD results could indicate bias because of changing settlement patterns and burial practices.
Between ca. 3300 and 2900 cal. BC the SCDPD curves for settlement dates show higher values, whereas the curves for all sites show a distinct lull at around 3250 cal. BC before increasing again at around 3000 cal. BC. During this time, the settlement structure changed from single farmsteads during the Early Neolithic to larger settlements or villages in the Middle Neolithic period (Brozio, 2015; Hage, 2016) and it seems probable that these larger sites are easier to find and therefore chances for being excavated and researched are generally higher. However, as most of these settlements are located in the western half of the study area and in the context of the overall results of this study, this settlement peak might also reflect a regional phenomenon, that is, being not representative for the whole study area (see section ‘Discussion’).
During 3000–2200 cal. BC the SCDPD curves for the settlement dates as well as the unbinned curve for dates from all archaeological sites show a clear longer lasting lull. In the case of the later data set, however, the lull disappears with increased binning. As this period coincides with cultural transformations, that is, the beginning and end of the Single Grave Culture phenomenon, it is likely that a change in settlement practices could explain the scarce settlement evidence for this period. If dates from burials are included and site-related research bias is reduced by binning, a somewhat different development is observed. In this case, SCDPD values remain on a somewhat elevated level until ca. 2500 cal. BC before they decline leading to a lesser pronounced lull centred at around 2300 cal. BC.
Despite these differences, a number of similar trends can be described for SCDPD curves. This includes peaks or elevated values at around ca. 4000, 3600, 2950, 1900, 1300 and 800 cal. BC and lulls at around ca. 3750, 2400, 1500 and 1100 cal. BC, respectively.
Discussion
In the following, we compare the different independent proxies for human activity in order to estimate the relative population dynamics for north-western Central Europe. This approach is based on the assumption that, generally, increased population density is positively linked with human activity and human impact on the environment, respectively. We hereby concentrate on the identification of phases of major population growth (boom) and decline (bust). A boom is therefore not equivalent to a peak or a maximum, and a bust not to a lull or a minimum in our records, but rather defined by a distinct increase or decrease, respectively. As population growth in closed populations is generally linked with lower mortality rates and/or increased reproduction, these phases could indicate potential periods of social and economic wealth in pre-industrial times, whereas declining populations could indicate deficits and stress, respectively.
Relative population dynamics in north-western Central Europe
Generally, we can observe a good agreement between the different proxies for human activity. This is particularly true in the case of the palynological and binned SCDPD record for dates from all archaeological sites, which share similar events on centennial to multi-centennial scale (Figure 6). The palynological and soil erosion record show a good general agreement on a multi-centennial scale and on the overall long-term trend. Based on the comparison of the three proxies, we define five distinct phases of growing (boom) and decreasing (bust) population in north-western Central Europe, respectively (Figure 6 green and red vertical bars). These phases are defined by similar synchronous trends in at least two proxies.
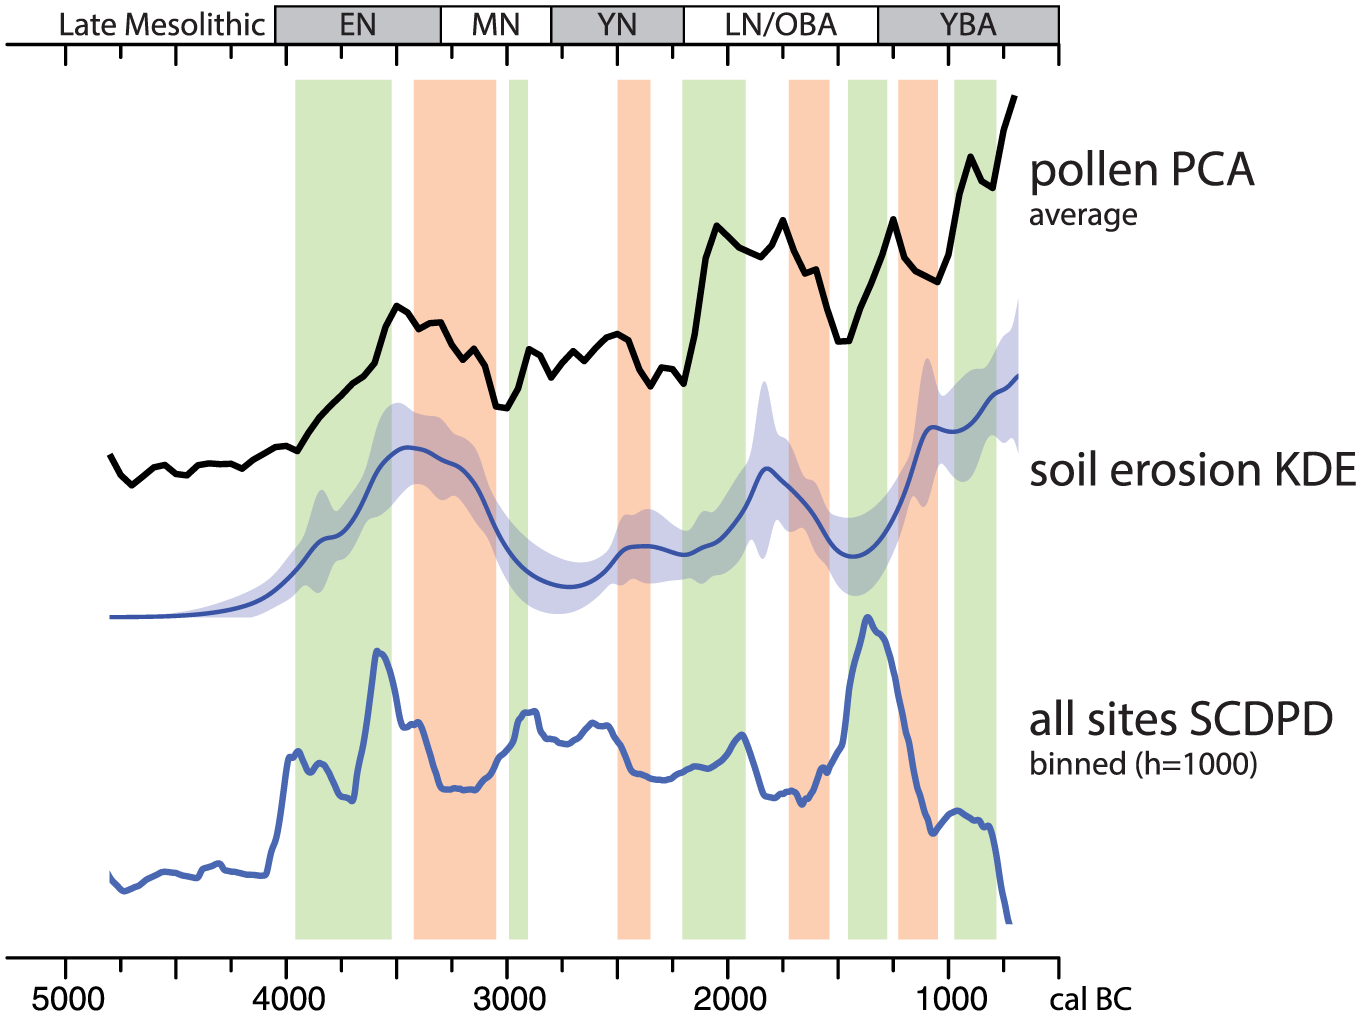
Comparison of the results of different selected proxies. Top: average PCA Spectra. Middle: KDE_Model of colluvial layer record. Bottom: Summed calibrated date probability distributions (SPD) of binned (h = 1000) archaeological radiocarbon dates from all contexts.
Vertical bars indicate inferred phases of population growth (green) and decline (red). Archaeological periods indicated: Early Neolithic (EN); Middle Neolithic (MN); Younger Neolithic (YN); Late Neolithic (LN); Older Bronze Age (OBA); Younger Bronze Age (YBA) after Müller et al. (2012) and Kneisel et al. (2015). The first boom phase spans the time between c. 4000 and 3500 cal. BC and is clearly visible in the palynological and soil erosion records. In the case of records based on archaeological 14C dates, the binned SCDPD curve for all sites reflects best a comparable development. As only a low number of settlement sites are known for the Early Neolithic period for our study area, c. 4000–3300 cal. BC (archaeological phases are indicated in Figure 6 top), in contrast to the abundant megalithic tombs (Brozio et al., in press), this might explain the generally lower settlement SCDPD values for this period. Our results, however, are in agreement with other SCDPD analyses, which also give evidence for a widespread increase in population at around 4000 cal. BC in north-western Europe (Hinz et al., 2012a; Shennan et al., 2013). This first boom phase is associated with the appearance of the first Neolithic societies, that is, the Funnel Beaker groups, in our study area and the beginning of woodland pasture and cereal cultivation, respectively. This led to an opening of the forest and the creation of permanently open vegetation (Feeser and Dörfler, 2014; Feeser et al., 2012). The disturbance of the vegetation cover led to soil erosion and the formation of colluvial deposits as well as increased allochthonous input in lake systems (Dreibrodt and Wiethold, 2015). Further evidence for the strong impact of Funnel Beaker societies in northern German landscapes is given by the first land-use triggered formation of Podsols (FAO, 1998) on sandy sediments in the north-western part of our study area (Dörfler, 2005; Reiß et al., 2006, 2009). The inferred population growth in context of a change from hunter-gatherer to agricultural economies reflects a well-described phenomenon in anthropological studies, that is, the so-called Neolithic Demographic Transition (NDT; Bocquet-Appel, 2011; Downey et al., 2014; Müller, 2013). The NDT is interpreted to reflect increased fertility rates, which also in this case could explain the population boom.
The first bust phase, c. 3400–3100 cal. BC, is generally well recorded in all proxies (Figure 6). Only the settlement SCDPD record does not show a corresponding decrease but in fact elevated values between c. 3300 and 2900 cal. BC (cf. Figure 5). Most of the associated settlements sites, however, are located in the western half of the study area, that is, the Cimbrian peninsula. If we consider the regional pollen signal from this region (i.e. Lake Belau in Figure 3), the main decline in human impact is also recorded only after ca. 3100 cal. BC. This could point at regional differences of population dynamics within the study area. An earlier decrease of human impact in the eastern part of our study area, that is, Westmecklenburg, in comparison to the western area has already been described in a study comparing more pollen profiles from this region (Feeser and Dörfler, 2015). Similar evidence is provided by other SCDPDs studies for the Danish Isles and the surrounding mainland (Hinz et al., 2012a). Whereas the areas relating to the surrounding mainland, including Northern Jutland and Skane, show a decreasing trend from ca. 3500 cal. BC onwards, the data for the Danish isles indicate another phase of increased human activity between ca. 3300 and 3100 cal. BC. This pattern is comparable with the above-described regional differences in the palynological proxy in this study, that is, decreasing values shortly after 3500 cal. BC in the eastern part (Lake Woserin) in contrast to a short phase of higher human activity between ca. 3250 and 3100 cal. BC in the western part (Lake Belau). The peak in the SCDPD settlement curve could therefore correspond to the short phase of increased human activity between ca. 3250 and 3100 cal. BC restricted to the western part of the study area. On a larger spatial scale, this bust phase fits into the picture of a widespread population decline during the second half of the 4th millennium BC in the whole of north-western Europe, as indicated by other SCDPD analyses (Shennan et al., 2013) and palaeoenvironmental records (Berglund, 1969; Ghilardi and O’Connell, 2013; Göransson, 1987; Whitehouse et al., 2014).
The second boom between c. 3000 and 2900 cal. BC relates to increases in the palynological proxy and the binned all site SCDPD curve (Figure 6). From an archaeological point of view, this time reflects the transition from the Funnelbeaker to the Single Grave Culture. The emergence of this new cultural phenomenon is often regarded to have been associated with a shift in subsistence practices, that is, a shift from sedentary agricultural to mobile pastoral subsistence (Hinz, 2015; Hübner, 2005; Iversen, 2013; Sangmeister, 1972). Evidence of the formation of meadow soils between Middle Neolithic and Younger Bronze Age times in the region of Lake Belau (Dreibrodt and Wiethold, 2015) might indicate a less intensive or erosive form of land use than before. In fact, this could support the idea of increased importance of cattle breeding as grazing does not lead to a destruction of the permanent soil cover and thus would result in less detectable soil erosion. Although archaeobotanical evidence for our study region is too scarce for the Younger Neolithic to allow any detailed quantitative estimations regarding the importance of cereal cultivation (Brozio et al., in press; Kirleis et al., 2012; Kirleis and Fischer, 2014), it proves a continuation of cereal cultivation for the Younger Neolithic. Also for Denmark, Klassen (2005) refers to archaeobotanical and palynological evidence for cereal cultivation during this period. Furthermore, for at least some regions within our study area, there is palynological evidence for increased importance of cereal cultivation during the Young Neolithic in comparison to the Early Neolithic (Feeser et al., 2012). This, however, does not rule out an increased importance of pastoralism, as grazing on grasslands and extensive cereal cultivation are difficult to distinguish and to disentangle in the palynological record. Generally however, human impact on the environment and population levels, respectively, did not reach Funnelbeaker times maxima values during this boom phase at the beginning of the Younger Neolithic. The similar short-term synchronous developments in both the pollen profiles during 2800–2300 cal. BC could point to large-scale, over-regional uniform development during the Younger Neolithic in our study area (cf. also Feeser et al., 2016).
Between c. 2400 and 2300 cal. BC, the palynological proxy and the binned all site SCDPD curve show a similar distinct decrease (Figure 6), and we define a second bust phase accordingly. The soil erosion record, however, indicates elevated values at around this time but declines, although not very well defined, to a minimum at around 2200 cal. BC. Due to the generally low number of colluvial deposits recorded for the Younger Neolithic, this is not regarded to contradict our interpretation, as low sample sizes generally minimize the chances of identifying a robust pattern.
A strong increase in all the three proxies between 2200 and 2100 cal. BC defines our third boom phase (Figure 6). In archaeological terms, this boom phase is associated with the transition from the Younger Neolithic to the Late Neolithic (so-called Dagger groups) in the western part or the beginning of the early Bronze Age (Period I) in the eastern part of our study area. During this time, our study area became part of a supra-regional exchange network resulting in economic growth and wealth (Brozio et al., in press, but also e.g. Kühn, 1979; Vandkilde et al., 2017). This could have favoured population growth. Archaeobotanical investigations, however, also suggest an associated distinct widening in the cultivated crop species (Brozio et al., in press). Therefore, it has to be considered that the strong increase in our proxies could, at least partially, reflect an associated qualitative change in land use.
At around 1650 cal. BC, the palynological indicator for human impact declines sharply and reaches minimum values at around 1500 cal. BC. A similar pattern can be observed in the soil erosion record. Therefore, we identify another bust phase between 1650 and 1500 cal. BC. Minimum values at between 1600 and 1500 cal. BC are also reflected in the SCDPD records (Figure 5). A corresponding preceding decline is well reflected in the settlement SCDPD record. The all-site SCDPD curve, however, shows an earlier decline already at around 1800 cal. BC. Archaeological results indicate a transition from Neolithic to Bronze Age material culture during this bust phase (Kneisel et al., in press). Evidence for associated fundamental changes in land-use practices, however, is lacking. On a wider geographical scale, this bust phase is synchronous to a cultural and economic collapse further east to our study area in the area of the Únětice culture (Kneisel, 2013; Tisdell and Svizzero, 2018). As this collapse was probably also related to a decrease in the population (cf. Jahns et al., 2013; Jahns and Kirleis, 2013; Kneisel, 2013), this suggests a rather wide-scale population decline in northern Central Europe during the 16th century BC.
The following boom phase dating to ca. 1450–1300 cal. BC is defined by a distinct increase in all proxies (Figure 6). Also, from an archaeological point of view this phase can be described as a growth phase. Whereas qualitative changes in the socio-cultural sphere do have their origin in the former bust phase, it is the quantitative increase, for example, of larger barrows with rich grave goods, which are noteworthy (Kneisel et al., in press). Archaeobotanical results suggest that also land-use practices might have changed as indicated by a further diversification in the crop spectrum (Behre, 2008; Effenberger, 2018a, 2018b; Kneisel et al., 2015).
The bust phase at around 1250–1100 cal. BC is only reflected in the palynological and SCDPD proxies. The soil erosion records peak at around the same time, but show a minimum shortly afterwards between c. 1000 and 800 cal. BC. Considering the rather short-termed nature of these changes, it is possible that chronological uncertainties could explain the observed offset. In the sediments of Lake Belau, however, a slight increase in erosion is also suggested by geochemical analyses between ca. 1200 and 1000 cal. BC (Dreibrodt and Wiethold, 2015). Therefore, chronological uncertainties seem unlikely in this case as both the palynological and geochemical records are from the same lake sediment archive. A possible explanation for this divergent pattern could be an increased frequency of high-intensity precipitation events or a change in land-use practices favouring soil erosion. The establishment of Broomcorn Millet as full crop at around this time in Northern Germany (Filipović et al., 2018) could indicate such an associated change in land-use practices. However, as the authors state, this might be related to very local cultivation of Broomcorn millet, and further results are necessary to reconstruct when its cultivation was generally adopted across the wider region.
Between ca. 1000 and 750 cal. BC, the palynological and the soil erosion proxy show increasing values and define the last boom phase within the investigated time window. The SCDPD proxy, however, has, despite a minor peak at around c. 800 cal. BC, generally very low values. This might be explained by research bias. In case of the late Bronze Age, archaeologists tend not to use radiocarbon dating as this period at least partially falls within the Hallstatt plateau in the calibration curve. Geochemical lake sediment analyses from Lake Belau support increased human activity from the late 9th century BC onwards (Dreibrodt and Wiethold, 2015).
Comparison with quantitative palaeodemographic approaches
In the following, we compare our results with quantitative approaches for population reconstruction based on archaeological information. Most of such population estimates, however, are based on individual site analysis or provide estimates for larger scale regions but without diachronic perspective (e.g. Rassmann and Schafferer, 2012; Schiesberg, 2012). Only a few studies combine such evidence to reconstruct population dynamics on larger temporal and spatial scales for northern Central Europe (Müller, 2013, 2015, 2016, Müller and Diachenko, 2019; Zimmermann, 1996; Zimmermann et al., 2009). The studies by Zimmermann (1996) and Zimmermann et al. (2009), however, relate to southern Germany and are therefore not directly comparable with the results of the presented study in terms of spatial scale and cultural context. Müller and Diachenko (2019; see also Müller, 2013, 2015, 2016) present data for Central Europe and Southern Scandinavia. They report three main phases of population increase for agricultural societies dating to 5000–4000, 3500–3000 and 1000–500 cal. BC. Minima in population densities are reconstructed for around 3500 and 1500 cal. BC. The first phase of population increase is related to Linear Pottery (LBK) societies of southern Central Europe, that is, the region south of our study area. For the second phase, 3500 – 3000 cal. BC, an increase in the absolute population number is suggested (from ca. 1.25 to 2.5 person/sq km). Although our results suggest population growth at around 3000–2900 cal. BC, they do not support generally higher population levels during the Younger Neolithic compared with Early or Middle Neolithic maximum levels. This, on one hand, could be explained by the relative nature of our proxies and the fact that qualitative changes in land-use strategies can bias the reconstructed human impact on the environment or the relative population estimates, respectively. On the other hand, we might have to consider the different spatial and temporal scales of the analyses, which hamper a comparison. Compared with the study of Müller and Diachenko, our proxies do have a higher chronological resolution, that is, multi-decadal to centennial in contrast to multi-centennial. Considering that demographic processes usually operate at a centennial rather than at a millennial scale (cf. Shennan, 2013), which is well in agreement with the results of this study, it seems plausible that the temporal resolution of the archaeological proxies are at present too low to allow a more detailed comparison. Furthermore, the spatial scale of the two studies differs. Müller and Diachenko use data from a much wider area, including different cultural contexts. The palynological proxy in our study, however, indicates that population dynamics might have even differed on a comparatively small regional scale, e.g. between the western and eastern part of the study area during the Early and Middle Neolithic periods (see above).
For the Bronze Age, there is generally good agreement of the suggested population trends in both the studies. Müller and Diachenko (2019) indicate minimum population levels at around 1500 cal. BC, which fits well with the end of our bust phase from 1650 to 1500 cal. BC. For the times after 1500 cal. BC, Müller (2015) reports higher population numbers which also is in agreement with our result of generally increasing population levels during the Younger Bronze Age.
Based on the above comparison, we argue that further research is needed to obtain a better and more complete picture of the population dynamics in terms of the different spatial and temporal scales involved. On one hand, the presented multi-proxy approach could be extended to include data from other regions of mid-Central Europe. This would allow better comparison with the quantitative population reconstructions on a larger spatial scale. On the other hand, more archaeological case studies could increase the chronological resolution of the quantitative archaeological approaches. Furthermore, a combined analysis of absolute and relative reconstructions on comparative spatial scales could enable us, as already Müller (2013) pointed out, to reconstruct absolute population dynamics on a high temporal resolution, that is, by calibrating the relative estimates with independent absolute estimations.
Conclusion
The results of our study highlight the advantage of a multi-proxy approach to improve the quality of estimations of prehistoric population dynamics. Based on the comparison of the three independent proxies for human impact, we were able to identify five phases of over-regional population growth and four phases of decline in the study area. The boom phases date to c. 4000–3500, 3000–2900, 2200–2100, 1450–1300 and 1000–750 cal. BC. The bust phases to c. 3400–3100, 2400–2300, 1650–1500 and 1250–1100 cal. BC.
A comparison with the published absolute palaeodemographic reconstructions reveals not only agreeing patterns but also differences. We argue that besides general problems of proxy-related uncertainties, especially the issues of different temporal and spatial scales of the studies hamper a direct comparison. We therefore suggest that future research is needed to reach comparative spatial and temporal scales for relative and absolute population reconstruction.
Supplemental Material
Supplement_Material_1 – Supplemental material for Human impact and population dynamics in the Neolithic and Bronze Age: Multi-proxy evidence from north-western Central Europe
Supplemental material, Supplement_Material_1 for Human impact and population dynamics in the Neolithic and Bronze Age: Multi-proxy evidence from north-western Central Europe by Ingo Feeser, Walter Dörfler, Jutta Kneisel, Martin Hinz and Stefan Dreibrodt in The Holocene
Footnotes
Acknowledgements
The authors thank J. Wiethold from Institut national de recherches archéologiques préventives (Inrap), Metz, France, for providing pollen data for Lake Belau.
Funding
The research was conducted and financed in context of the Collaborative Research Centre 1266 ‘Scales of Transformation – Human –environmental interaction in prehistoric and archaic societies’ of the German Research foundation (DFG, German Research Foundation –project number 2901391021 – SFB 1266).
Supplemental Material
Supplemental material for this article is available online.
References
Supplementary Material
Please find the following supplemental material available below.
For Open Access articles published under a Creative Commons License, all supplemental material carries the same license as the article it is associated with.
For non-Open Access articles published, all supplemental material carries a non-exclusive license, and permission requests for re-use of supplemental material or any part of supplemental material shall be sent directly to the copyright owner as specified in the copyright notice associated with the article.