
Abstract
We investigated rock varnish formed on sandstone and petroglyphs in the Hima area, southwestern Saudi Arabia. To characterize the rock varnish, we made in-situ measurements by portable x-ray fluorescence (pXRF) and analyzed samples by femtosecond laser-ablation inductively coupled–plasma mass spectrometry (fs LA-ICP-MS). Detailed chemical analysis of the rock varnish samples and adjacent soil or aeolian dust yielded information about the varnish’s geochemical context and formation mechanism. Untypically low positive Ce anomalies in the rock varnish samples correlated with negative Ce anomalies in the dust, supporting the hypothesis that the dust is the source of the varnish material. To study the varnish development, we made use of the fact that engraving the petroglyphs exposes a fresh bare sandstone surface without varnish, on which varnish regrows subsequently. We determined by pXRF the areal density of manganese (Mn) and iron (Fe) that had been deposited as rock varnish since the creation of the rock art. The rates of Mn deposition in the newly formed varnish were then estimated by correlating the areal density of Mn in Ancient Arabian and Old Arabic inscriptions with their known age ranges. The observed deposition rates showed substantial variability resulting from differences in exposure conditions of the rock surface, but were in a range comparable with that of our previous measurements in northwestern Arabia. This variability could be reduced significantly by referencing the measurements to the intact varnish adjacent to the individual petroglyphs. This normalization provided a much clearer relationship between varnish deposition and age, and enabled tentative ages to be assigned to rock art motifs without previously known ages. These tentative ages spanned most of the Holocene period and were consistent with the culturally or ecologically derived ages of the animal and human figures depicted in the rock art and the styles of scripts used in different periods.
Introduction
Petroglyphs are images and symbols engraved into the surface layers of rock faces and boulders. They are found worldwide and provide unique and valuable information on humans and their environment, reaching from the pre-Neolithic period up to today (e.g. Francis and Loendorf, 2004; Guagnin et al., 2015, 2016, 2017; Heizer and Baumhoff, 1962; Khan, 2007; Olsen, 2013; Whitley, 2013a, 2013b). In Arabia, as in many other regions, petroglyphs were usually engraved into dark rock varnish coatings on sandstone surfaces, which – at least initially – provides a strong contrast to the exposed lighter rock and creates images with strong artistic impact (Khan, 2013; Olsen, 2013). From a geochemist’s perspective, the petroglyphs are of great interest because their creation produces a fresh rock surface for the redevelopment of the rock varnish. If the time of creation of the rock art is known or can at least be estimated, the rate of formation of the varnish can be derived from measurements of the amount of varnish formed on the petroglyphs. In Saudi Arabia, rock art has been created throughout the Holocene, providing an opportunity to study varnish formation across more than 10,000 years (Bednarik, 2017). Varnish formed in recent times, when climatic and environmental characteristics are well constrained, may provide clues on its mechanism of formation and the role of climatic variables, such as rainfall and exposure (Broecker and Liu, 2001; Dorn and Meek, 1995; Elvidge and Iverson, 1983; Goldsmith et al., 2012).
Rock varnish is a dark brown or black, manganese-rich, micrometer-thin coating that is frequently found on rock surfaces of various lithologies in arid and sub-arid environments around the globe. It often has a metallic luster and a layered or botryoidal internal structure (Dorn, 2007; Dorn and Oberlander, 1982; Engel and Sharp, 1958; Krinsley et al., 2013; Liu and Broecker, 2007; Macholdt et al., 2017b). The varnish consists of a matrix of poorly crystallized or nanocrystalline Mn and Fe oxides and hydroxides (~5–40%), in the following called oxyhydroxides, which cements clay and other detrital minerals (Bishop et al., 2002; Dorn, 2007; Dorn et al., 2013; Potter and Rossman, 1977, 1979). The resulting composite material can be quite resistant to erosion and weathering and thus stabilize the rock surfaces (Bishop et al., 2002; Dorn et al., 2013, 2017).
Based on its microstructure, chemical composition, growth rate, thickness, and growth environment, rock varnish can be subdivided into several categories (I-V) (Macholdt et al., 2017b). Arid environments, such as the Arabian desert region investigated here, typically contain Type I varnish, which is characterized by generally showing layered structure, high rare earth element (REE) and barium (Ba) enrichments, and EPR spectra consistent with birnessite as the dominant Mn mineral (Macholdt et al., 2017b). The thickness gain of Type I rock varnish has been estimated to be between <1 and 40 nm a–1 in a broad survey (Liu and Broecker, 2000) and about 1.2 nm a–1 on average in an area in northwestern Saudi Arabia (Macholdt et al., 2018). The maximum thickness of this varnish usually does not exceed 250 µm (Northup et al., 2010), but is commonly much less, typically in the range of about 50 µm (Dorn, 2007; Raymond et al., 1993). The thickest varnish tends to be found in small depressions on the surfaces of boulders, so-called microbasins (Liu and Broecker, 2000, 2007). On exposed surfaces, the maximum thickness of varnish appears to be limited by the interplay between varnish deposition and its removal by weathering and erosion (Bednarik, 2012; Bednarik and Khan, 2005).
While there is still an ongoing discussion about the details of the processes by which the rock varnish is formed, there is now broad consensus that the Mn and other enriched elements in the varnish matrix, as well as the embedded clay particles, originate from aeolian deposition, which in unpolluted regions is predominantly in the form of mineral dust (Bishop et al., 2002; Dorn, 2007; Dorn et al., 2013; Elvidge and Iverson, 1983; Fleisher et al., 1999; Goldsmith et al., 2014; Hodge et al., 2005; Nowinski et al., 2013; Perry and Adams, 1978; Potter and Rossman, 1977; Thiagarajan and Lee, 2004). Under the mildly acidic conditions of meteoric waters (rain, dew, etc.), the divalent Mn in the dust is mobilized into solution (Dorn, 2007; Goldsmith, 2011; Goldsmith et al., 2014; Jones, 1991; Perry et al., 2005; Thiagarajan and Lee, 2004). The dissolution of Fe and Mn is possibly facilitated by biogenic siderophores (Adams et al., 1992). The subsequent step, the oxidation and reprecipitation of Mn from solution, is the topic of intense discussion. At atmospheric oxygen concentrations and neutral to slightly alkaline pH, insoluble Mn4+ is the thermodynamically stable form, but the oxidation of Mn2+ to Mn4+ is kinetically a very slow process (Tebo et al., 2004). It can be accelerated either by inorganic catalysts, such as clay surfaces or iron oxides (Dorn, 2007; Garvie et al., 2008; Lan et al., 2017; Madden and Hochella, 2005), or through enzymatic catalysis by microorganisms, as discussed in detail by Dorn (2007). Some authors have suggested that abiotic processes are sufficient to explain the Mn oxidation and deposition (Collins and Buol, 1970; Elvidge and Iverson, 1983; Goldsmith et al., 2014; Perry et al., 2005; Thiagarajan and Lee, 2004). On the contrary, there is a large body of evidence that suggests an involvement of microorganisms (bacteria or fungi) in the oxidation and precipitation of Mn (Dorn et al., 2013; Gadd, 2017; Jones, 1991; Krinsley et al., 2012, 2017; Krumbein and Jens, 1981; Kuhlman et al., 2006, 2008; Laudermilk, 1931; Marnocha and Dixon, 2013; Wang et al., 2011). The lack of microfossils (Macholdt et al., 2015, 2017b) and of evidence for the presence of activated Mn-oxidizing enzymes in varnish (Lang-Yona et al., 2018) does not rule out a bacterial role in Mn precipitation, considering the length of time involved in its formation (Dorn and Krinsley, 2011; Krinsley et al., 2013).
After their initial precipitation, the Mn oxyhydroxides can be remobilized and redistributed in a series of diagenetic processes, which may remove identifiable microfossil structures, produce new microscale and nanoscale structures, and lead to the formation of different mineral phases from those precipitated originally (Dorn et al., 2013; Dorn and Krinsley, 2011; Garvie et al., 2008; Krinsley et al., 2012, 2013). Carbon-rich materials, such as fungal hyphae, bacteria, or biomass-burning aerosols, may act as reducing agents to facilitate the dissolution of the Mn oxyhydroxides (Garvie et al., 2008). Dust particles, which were leached but not incorporated into the matrix by agglutination, are removed by wind and water erosion (Dorn et al., 2013; Goldsmith et al., 2014; Otter et al., 2015; Thiagarajan and Lee, 2004).
Mn and Fe oxyhydroxides efficiently scavenge other leached elements from solution, such as transition and heavy metals (e.g. Co, Ni, and Pb) and REEs (Aaltonen et al., 2006; Dorn, 2007; Goldberg, 1954; Goldsmith et al., 2014; Koschinsky and Heine, 2017; Thiagarajan and Lee, 2004). The REEs, because of the unique character of cerium (Ce), are potentially useful as tracers for the reduction/oxidation transformations during the leaching and scavenging processes. Generally, the REEs all behave very similar because of their similar chemical characteristics, and thus, a fractionation between these elements requires specific physicochemical conditions. All REEs form trivalent ions (e.g. Ce3+), whereas only europium (Eu) and Ce have additional valences as Eu2+ and Ce4+. While mineral dust often shows a positive Eu anomaly, due to the incorporation of Eu2+ for Ca2+ in the common mineral plagioclase (feldspar), a Ce anomaly is very rare in geological materials and mostly associated with aqueous processes. However, since Mn oxyhydroxides are one of the strongest natural oxidizers known (Tebo et al., 2005), they are capable of oxidizing dissolved Ce3+ to Ce4+, which subsequently precipitates as CeO2(s) (Ohta and Kawabe, 2001) while a large share of the other REEs remains in solution. Hence, this process is capable to generate a fractionation, and a strong positive Ce anomaly is thus to be expected for an old Mn-rich material, such as rock varnish.
In archeology, there has been great interest in finding ways to date petroglyphs in order to gain an understanding of the chronology of rock art and writing, human migration behavior, and the authenticity of rock art (e.g. Bard, 1979; Bednarik, 2010, 2012; Dietzel et al., 2008; Dragovich, 2000; Guagnin et al., 2018; Whitley et al., 2017). Numerous attempts have been conducted to date petroglyphs by a variety of methods, including radiometric techniques, cation ratio changes, microlaminations, varnish thickness, colorimetric analysis, and so on (Bednarik, 2009, 2010; Bednarik and Khan, 2005; Francis et al., 1993; Liu and Broecker, 2013; Sowers, 2013; Whitley, 2012). In many cases, the results have been disappointing, as discussed in several reviews (Bednarik, 2010; Dorn, 2007; Sowers, 2013). In particular, direct dating of rock varnish by classical radiometric techniques has been mostly unsuccessful (Dragovich, 2000; Watchman, 2000).
Indirect dating of petroglyphs had been attempted by several techniques, with the first suggestions made as early as 1820, based on the color differences of Egyptian hieroglyphs of different ages (Belzoni, 1820). The use of varnish microlaminations has been shown to be successful in a number of environments (e.g. Dietzel et al., 2008; Liu, 2003; Liu and Broecker, 2013; Whitley et al., 2017). For our study, however, its use was excluded by the lack of a calibration set for Arabia, the relatively young age of most of the rock art in our study area (all our petroglyphs would be in the yellow Holocene layer; Liu, 2003), the absence of microbasins in the usually highly inclined or vertical rock art panels, and the need to avoid destructive sampling of the rock art. Another technique that has been applied successfully in some areas uses microerosion or weathering features (Bednarik, 2012, 2017; Bednarik and Khan, 2005), which, however, is also subject to some limitations, such as the availability of calibration sites, the presence of feldspar and quartz, and the assumption of a constant weathering environment (Bednarik, 2012). In our study, we are using two petroglyphs dated with this technique by Bednarik and Khan (2005) as reference for comparison with our measurements.
It has often been observed that the darkness of the varnish coatings increases with relative age, for example, on alluvial fans of different ages or on superimposed petroglyphs (e.g. Bednarik, 2009; Belzoni, 1820; Khan, 2007; Reneau, 1993; and references therein). For example, Bednarik and Khan (2017) used the degree of repatination on rock art at a site in Saudi Arabia to estimate a minimum age for some petroglyphs. Bednarik (2009) applied this concept in a quantitative way, using colorimetric measurements, and found ‘fairly good consistency when plotted by age’. Other studies have examined the amount of Mn accumulated on rock surfaces or the thickness of rock varnish as potential indicators of age (e.g. Liu and Broecker, 2000; Lytle et al., 2008; Reneau, 1993). Numerous authors have, however, cautioned against the uncritical use of this kind of approach, since the amount of varnish growth is dependent on several parameters, such as the exposure of the rock surface to dust; erosion by wind and water; the orientation and slope of the rock surface; the hardness, roughness, and texture of the rock underneath; and its initial iron content (e.g. Bednarik, 2010; Dorn, 2007; Dorn and Oberlander, 1981; Liu and Broecker, 2000; Reneau, 1993).
Bard (1979) investigated the possibility of using Mn concentrations in varnish scraped from petroglyphs and the Mn/Fe ratios in petroglyphs and control varnish surfaces as indicators of age. While he concluded that his work ‘… resulted in a relative dating system …’ and ‘… demonstrates that patination dating … appears quite feasible…’, it is quite clear from his study that this approach yielded only very rough estimates of relative ages of the rock art examined.
In our previous study, we examined the potential of using the amount of Mn and Fe that had grown back within petroglyphs in the Ha’il region of NW Saudi Arabia as an indicator of age, in combination with age estimates based on the cultural and ecological content of the images (Guagnin et al., 2016; Macholdt et al., 2018). This approach is distinct from that of Bard (1979), who used Mn concentrations or Mn/Fe ratios in the varnish, but analogous to that of Lytle et al. (2008) and McNeil (2010), who also measured Mn accumulation on petroglyphs by portable x-ray fluorescence (pXRF). A major advantage of this technique is that the measurements can be made in situ and do not require destructive sampling of the valuable rock art. Measurements on surfaces for which age ranges of inscriptions or petroglyphs were available provided us with estimates of the Mn accumulation rate. In agreement with previous studies, we found that the accumulation rates were highly variable, but we were able to reduce this variability significantly by normalizing the accumulation rate to the amount of Mn in intact varnish immediately adjacent to the petroglyphs. In turn, we used the so obtained normalized growth rate to assign a chronological context to petroglyphs that could not be dated before.
In this paper, we present the results of measurements on petroglyphs and intact adjacent rock varnish from the Hima region in southwestern Arabia, a region that is climatically and archeologically quite distinct from our previous study area in northwestern Arabia. Several samples of rock varnishes and adjacent mineral dust were returned to the laboratory and measured by femtosecond laser-ablation inductively coupled–plasma mass spectrometry (fs LA-ICP-MS) for comparison with our results from previously investigated rock varnish locations and from adjacently sampled airborne dust. From the in-situ measurements by pXRF, we derive estimates of the absolute and normalized Mn and Fe accumulation rates on the rock art and examine whether they can be used as an experimental technique for estimating the age of petroglyphs.
Material and methods
Study region, climate, and history
Our study area is located in the Hima district of southwestern Saudi Arabia, close to the village of Hima and about 100 km northeast of the city of Najran. The Najran region has a desert climate, in the class BWh (arid desert, low-latitude) according to the Köppen–Geiger climate classification, with an average annual temperature of 23.5°C and an average annual rainfall of 132 mm (https://en.climate-data.org/location/551706/). The rainfall has a maximum in March and a minor secondary maximum in August, reflecting the influence of the Indian Ocean monsoon (IOM). Paleoclimate studies have shown that Arabia underwent dramatic oscillations in wetness during the Pleistocene and Holocene (Lezine et al., 2007; Parker, 2010; Wilkinson, 2010). Most important in the present context are an extremely arid period during the last glacial maximum (LGM) until about 10–12 ka BP, followed by a humid phase in the early Holocene, from about 10 ka BP until about 5–6 ka BP, as a consequence of the northward migration of the IOM and the Indian Monsoon (Lezine et al., 2007). After about 6000 BP, a dry climate established itself, resembling the present day conditions (Garrard and Harvey, 1977; McClure, 1976; Parker, 2010; Rose and Usik, 2010, and references therein).
These climate changes had dramatic consequences for human occupation and paleoecology. The extremely dry climate during the LGM may have reduced or extinguished human populations, as sufficient game was not available (Uerpmann et al., 2010). When the climate improved in the early Holocene, hunters, and subsequently herders with domestic cattle, sheep, and goats, populated the region, as indicated by complementary data from faunal remains and rock art (Guagnin et al., 2016; McCorriston and Martin, 2010). During this period, the wild bovid species, aurochs (Bos primigenius), coexisted in the region with domestic cattle (Guagnin et al., 2016; McCorriston and Martin, 2010; Uerpmann et al., 2010, 2002). The onset of dry conditions around 6000 BP led to another gap in the archeological record of human activity (Uerpmann, 2002) and in rock art creation (Khan, 2007) between about 6000 and 5000 BP, as well as the disappearance of aurochs, which requires access to standing water every few days (McCorriston and Martin, 2010). Cattle became very restricted during the subsequent dry period, even though there is some evidence of the presence of cattle into the literate period, possibly due to a somewhat later shift to dry conditions in the south of Arabia (Bednarik and Khan, 2005; Parker et al., 2006; Robin, 2018). During the Bronze Age, starting ca. 5000 BP, a substantial human population existed in the Yemen highlands, south and west of Najran, with lesser extensions into the lowlands (McCorriston and Martin, 2010). The domestication of the camel around 3000 BP, coincident with the Bronze/Iron Age transition, facilitated both a herding economy and long-distance trade, and by about 2000 BP, a significant and wealthy population was present in southern Arabia (Uerpmann and Uerpmann, 2012).
In the Hima region, the archeological record begins in the Lower Paleolithic (Acheulean) and extends through the Neolithic and late Holocene (Al-Marih, 2012; Bednarik and Khan, 2005, 2017). The area lies at the intersection of major ancient trade routes, including the old spice road from Hadhramaut, and the historic ‘Road of the Elephant’ from Aden and Sana’a to Mecca (Al-Ghabban et al., 2012; Robin, 2015). These trade routes were main pathways for the incense trade, which flourished between 800 BCE and 600 CE. The Al-Ukhdud citadel in Najran was a major regional center on these routes from about 500 BCE–250 CE (Al-Marih, 2012). Early human occupation at Bi’r Hima, 80 km NNE of Najran, is documented by Middle Paleolithic tools and Neolithic hearths and dwellings (Al-Marih, 2012). The wells of Bi’r Hima are located on the caravan routes originating in Yemen and passing through Najran, before turning northward leading through the Najran desert (Olsen, 2013). In this area, the routes split into a western branch toward Egypt, the Levant, Greece, and Rome, and an eastern branch headed for the Persian Gulf and Mesopotamia (Macdonald, 2010) (for a map of the trade routes, see Al-Ghabban et al., 2012).
The Hima petroglyph area, in which our measurement sites are located (see maps in Figures S1 and S2 in the Supplemental material, available online), is at the interface between the Asir mountain range and the western boundary of the Rub’ al-Khali (Empty Quarter). Although many rock art sites are distributed in the region across a distance of about 130 km, the main concentration extends over an area of 55 km north to south, with the small settlement of Hima at its southern end (Bednarik, 2017). It includes the eastern mountains of the Jabal al-Qara massif and Jabal al-Kawkab, and extends north to the road east from Yadamah (Bednarik, 2017). Overall, the Hima area contains hundreds of sites, and the number of images and inscriptions is likely to be in the tens of thousands (Kabawi et al., 1996, and references therein). The study region will be called Hima in the following text, keeping in mind that many of the names of rock art sites in Saudi Arabia are inconsistent and polynomous (Aksoy, 2017). The Hima region is often also associated with the names Jabal al-Kawkab or Jabal al-Qara (Aksoy, 2017; Khan, 2007).
The rock art of the Hima region provides a historic record of the life, thoughts, and writings of people from various times, and this area includes among the most important ancient inscription and rock art sites (http://whc.unesco.org/en/tentativelists/6033/) (Bednarik, 2017; Robin, 2018). They contain a large variety of human and animal drawings as well as writings in Himaic (a regional variant of Thamudic), Ancient South Arabian (ASA; Sabaic and Himyaritic), and Arabic (Kufic) letters (Arbach et al., 2015; Grohmann, 1962; Robin, 2018; Robin et al., 2014; Robin and Gorea, 2016). The rock art and inscriptions in this region were first studied in 1936 by Harry St John Philby on his travel from Abha to Shabwa and Tarim in the Hadhramaut (Yemen) (Philby, 1938; Philby and Tritton, 1944). Numerous photographs were taken of the rock art in this region during the Philby-Ryckmans-Lippens expedition in 1951–1952 and formed the basis of the stylistic interpretations by Anati (1968a, 1968b, 1972, 1974), which have, however, been strongly criticized by Bednarik and Khan (2009) and Khan (1998). A large survey of the rock art in the region was conducted by the Deputy Ministry of Antiquities and Museums in 1979 and 1990 (Kabawi et al., 1996, and references therein). In recent years, the inscriptions and petroglyphs in the Hima area have been the subject of intensive studies by a French-Saudi project (Arbach et al., 2015; Robin, 2018; Robin et al., 2014; Robin and Gorea, 2016).
Sample material
Our specific study sites are spread over several tens of kilometers, and are situated on the northern and western flanks of the Jabal al-Qara mountains (see map in Supplemental material, available online). The outcrop rock material of all sites measured, thus the rock beneath the varnish crusts, are sandstones. The exact measurement site locations are ‘Ain Jamal’ (N18° 17.83′ E44° 30.9′), ‘MRY08’ (N18° 28.25′ E44° 30.65′), ‘MRY08B’ (N18° 27.85′ E44° 31.02′), ‘Wadi Tho’ur’ (N18° 27.68′ E44° 28.83′), ‘SR’ (N18° 25.5′ E44° 34.07′), ‘HIR’ (N18° 23.75′ E44° 33.82′), and ‘BR’ (N18° 26.14′ E44° 32.35′).
In addition to the in-situ measurements by pXRF, four sets of rock varnish samples and adjacent collected mineral dust were collected and analyzed in the laboratory. Three of the mineral dust samples represent pure windblown dust, since they were collected from shallow depressions on the top of large boulders, far enough above ground (2–10 m) to avoid direct redistribution from the soil surface. The sampling sites were varnish sample HI-AJ1 and soil/dust sample HI-AJ2 (N18° 17.83′ E44° 30.88′, ‘Ain Jamal’), varnish sample HI-MRY08A-4 and aeolian dust sample HI-MRY08A-3 (N18° 28.57′ E44° 30.37′, ‘MRY08’), varnish sample HI-TH6 and aeolian dust sample HI-TH7 (N18° 27.67′ E44° 28.82′, ‘Wadi Tho’ur’), and varnish sample HI-SR8 and aeolian dust sample HI-SR9 (N18° 25.5′ E44° 34.07′, ‘SR’). In addition, one sample was collected from inside a letter of a Himaic inscription at site SR (HI-SR8B), corresponding to pXRF measurements #1554/55.
Methods
pXRF
The pXRF instruments have been used in several studies to measure the composition of rock varnishes (Lytle et al., 2008; Macholdt et al., 2017a, 2018; McNeil, 2010; Nowinski et al., 2012). We used a Niton XL3 pXRF (Thermo Fisher Scientific) to investigate the chemical composition of the petroglyphs, the adjacent rock varnish, and the underlying sandstones in-situ and non-destructively. Measurements were conducted in the ‘mining’ mode, and the filter steps used were integrated for 20 s each. The instrument is equipped with an x-ray source with an energy of 50 keV, a silver anode, and has a spot size of 8 mm in diameter. For quality control, the reference materials TILL-4 and FeMnOx-1 (GeoReM database, version 25; http://georem.mpch-mainz.gwdg.de; Jochum et al., 2005) were measured before and after each XRF measurement sequence. A total of 283 measurements were conducted: 78 on intact varnish surfaces, 110 on petroglyphs, and the rest for ancillary purposes, for example, on bare sandstone. While the measurement results from the bare sandstones are valid as provided by the instrument in mass concentration units, the measurements of the rock varnishes had to be calibrated in units of areal density (µg cm–2) before further use. For this task, the calibration curve established for this purpose by Macholdt et al. (2017a) was used to convert the Mn concentration results into areal density values, DMn. To correct for the underlying sandstone element contribution, the Mn concentration of the unvarnished sandstone was determined by conducting a measurement on a nearby freshly exposed rock surface and subtracting this value from that measured on the varnished surface. The areal density of Fe (DFe) was calculated using the Mn calibration values and the Mn/Fe sensitivity ratio, and is thus semi-quantitative and reported in arbitrary units (a.u.). Since DMn and DFe varied substantially because of different growth and erosion conditions even within each panel location, we also calculated the ratio of the measurements on the petroglyph surface to that on immediately adjacent intact varnish, to obtain a normalized measure, called NMn and NFe (in percentage), which basically expresses the degree of revarnishing on the petroglyph surface relative to the surrounding intact varnish. The measurement and data reduction techniques used were identical to those in Macholdt et al. (2018) and are described in more detail there. All petroglyph measurement results are provided in Supplemental Appendix A, available online, and photographs of the measurement locations are shown in the Supplemental material, available online.
fs LA-ICP-MS
The fs LA-ICP-MS measurements were carried out at the Max Planck Institute for Chemistry (Mainz, Germany) using a ThermoFisher Element 2 single-collector sector-field ICP-mass spectrometer combined with an ESI 200-nm femtosecond laser ablation system, NWRFemto. Laser ablation was conducted in a New Wave Large Format Cell using a He atmosphere. Subsequent to the ablation, the He carrier gas was mixed with an Ar gas flow to transport the aerosols generated by ablation to the ICP-MS. All measurements were conducted in medium mass resolution mode (2000) with flat-top peaks. The rock varnish measurements were executed, after pre-ablation with 80 µm s–1 scan speed and a spot size of 65 µm, as in-situ line scans on the surfaces of unpolished thick sections with thicknesses of about 70–100 µm. Measurements with MnO2 mass fractions of <2% and areas where the sum of all major element oxides did not exceed 20% were rejected as contaminations from the underlying rock material or embedding resin. The reference glass GSE-1G (GeoReM database) was used for calibration. To normalize the data, the oxides of the major elements (Na2O, MgO, Al2O3, SiO2, P2O5, K2O, CaO, TiO2, MnO2, and Fe2O3) were assumed to add up to 98 mass-%. The operating parameters of the laser system during the measurements were as follows: spot size: 40 µm, pulse repetition rate: 50 Hz, energy density: 0.73 J cm–2, scan speed: 1 µm s–1, blank measurement 15 s, and washout time: 30 s. To measure the mineral dust samples, the dust was sieved with a polyamide monofilament net with a pore size of 50 µm (neoLab). The dust samples were divided into a fine fraction (<50 µm) and a coarse fraction (⩾50 µm), to allow direct comparison with the dataset of Otter et al. (2015). The coarse and fine fraction of all samples, a tape blank, and the powder reference materials BCR-2 and T1G (GeoReM database) were mounted on double-adhesive tape, which was attached to a pure Ir strip prior to measuring (Macholdt et al., 2014). Measurement parameters of the laser were as follows: spot size: 65 µm, pulse repetition rate: 50 Hz, energy density: 0.44 J cm–2, scan speed: 50 µm s–1, blank measurement: 15 s, and washout time: 30 s. Because of its high abundance in dust, Si was used as internal standard element. To allow comparison with the varnishes, a recalculation to 98 mass-% was subsequently applied to these results as well. Element data exceeding the median by 3 standard deviations (SD) were excluded to avoid overrepresentation of elements introduced by single mineral grains that are rare in the specific dust sample but high in specific elements, for example, zircon grains. Each dust sample fraction was measured five times as line scan with 13.5 mm length. Iridium was measured additionally to check the ablation depth. Of all measured elements, only Ca (0.2% by mass), Sr (7 µg g–1), Ba (10 µg g–1), and especially Zn (0.5% by mass) are present in measurable amounts within the tape. However, only the Zn content of the tape is high enough to influence the measurement outcome and contribute to the measurement result. Thus, Zn values are not listed in the results section for mineral dust. All rock varnish and mineral dust data are provided in Supplemental Appendices B and C, available online.
Results and discussion
Areal density of manganese and iron in the intact rock varnish
The Hima region dataset of surface densities, DFe versus DMn, of all measured petroglyphs and intact varnish surfaces is plotted in Figure 1a, together with the previously published dataset from the Ha’il region (Macholdt et al., 2018) for direct comparison. For the petroglyphs, the normalized values, NFe versus NMn, were plotted as well, in order to adjust for the variability of the growth conditions (Figure 1b). The average DMn of the intact varnish is 105 ± 55 µg cm–2 (1 SD, N = 78; 95% confidence interval = ±12 µg cm–2), which is about 33% less than that measured in the Ha’il region in NW Saudi Arabia in our previous study (156 ± 94 µg cm–2, N = 82; 95% CI = ±21 µg cm–2) (Macholdt et al., 2018). While there is considerable overlap, a t test shows this difference to be statistically highly significant (p < 0.0001). As there is no reason to assume a younger age of the varnish in the Hima region, this difference is likely because of different environmental factors, such as abrasion, dust availability, water abundance, and others. Rainfall amount, which has been suggested to be an important control on varnish deposition, is unlikely to be responsible for the difference in this case, as the Hima and Ha’il regions receive similar amounts of annual precipitation, and the relationship between Mn content and rainfall is too weak to expect a detectable influence (compare Figure 5 in Broecker and Liu, 2001). This is also consistent with the conclusions by Goldsmith et al. (2012), who found no clear correlation between Mn concentration in Holocene varnishes and rainfall amount in the arid Negev desert, and suggested that the number of days with rainfall or dew might be more important than the amount of rainfall. The Mn concentrations measured by ICP-MS in the varnish at Hima (5.0% as MnO) and Ha’il (6.9% as MnO) both fall near the low end of the range of values shown in Figure 5 of Broecker and Liu (2001), suggesting that varnish formation in both regions took place during relatively dry conditions. There are only few measurements of Mn areal density from other regions that our results can be compared with (McNeil, 2010; Reneau, 1993). Our DMn are somewhat higher than those measured on intact varnish on sandstones in Utah (24–87 µg cm–2) by a similar technique (McNeil, 2010). They are comparable with values measured on rocks from a piedmont in the Mojave Desert, where Reneau (1993) found median values of 104 µg cm–2 on mid- to late-Holocene surfaces, 130–220 µg cm–2 on early- to mid-Holocene surfaces, and 90–220 µg cm–2 on Pleistocene surfaces. This agreement has to be considered with caution, however, since Reneau’s measurements were from small clasts collected from the ground and selected for visually thick varnish, whereas we measured on highly inclined surfaces without explicit selection for thick varnish.
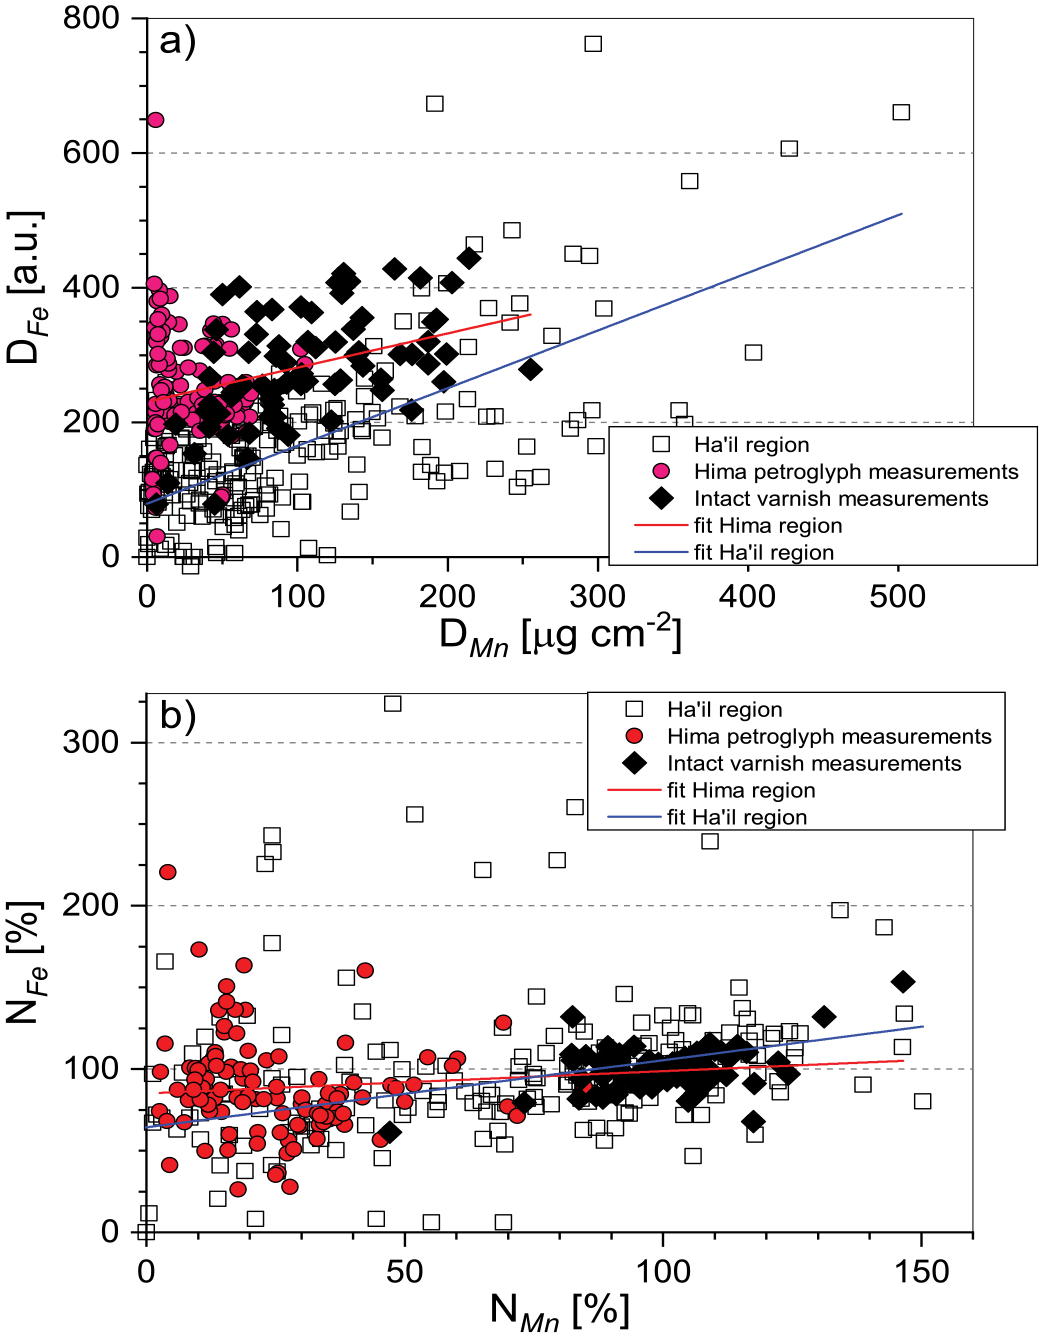
Iron versus manganese plots for all varnishes measured: (a) DFe versus DMn and (b) NFe versus NMn. Data from the previous study in the Ha’il region are plotted as empty squares, measurements from the Hima region as filled symbols, initial varnish as black diamonds, and petroglyphs as red circles. Linear fits are plotted in red for the Hima dataset and in blue for the dataset from the Ha’il region.
The mean Fe areal density of the Hima varnish is 330 ± 78 µg cm–2 (N = 78), compared with 185 ± 121 µg cm–2 (N = 78) in the Ha’il region of NW Saudi Arabia, corresponding to a lower Mn/Fe mass ratio of 0.32 ± 0.16 at Hima versus 0.91 ± 0.64 at Ha’il. These ratios fall in the range measured by other authors, for example, 0.22 ± 0.08 (California; Thiagarajan and Lee, 2004), 1.31 ± 0.23 (Negev; Goldsmith, 2011), and 0.09–0.24 (Mojave Desert; Bard, 1979). The relatively low Mn/Fe ratios (<1.0) in our Arabian varnishes are also consistent with their formation under relatively dry conditions (Broecker and Liu, 2001; Dorn and Oberlander, 1982; Liu, 2003; Liu et al., 2000). A plot of the Fe versus Mn surface densities (Figure 1a) and the corresponding regression analysis indicates a significant y-axis intercept for both regions. This intercept is four times higher at Hima (DFe = 259 ± 17) (±1 standard error (SE)) than in the Ha’il region (DFe = 65 ± 20). This finding is consistent with the observation of an Fe oxyhydroxide layer underneath the Mn-rich varnish, which we had described in our previous paper (Macholdt et al., 2018), and which could be visually detected also in the Hima region. It has been suggested that, because Fe is less soluble than Mn, an Fe deposit forms first on the rock surface (Elvidge and Iverson, 1983; Garvie et al., 2008). This Fe-rich layer may be capable of functioning as catalyst allowing an abiogenic Mn oxidation (Goldsmith et al., 2012; Macholdt et al., 2018). Alternatively, the Fe intercept may also be caused by an Fe-rich, Mn-poor layer at the surface of the rock varnish, as has been described from varnished early Holocene flint artifacts from the Negev (Goldsmith, 2011) and from rock varnish from the Mojave desert (e.g. Liu, 2003). This layer has been attributed to either climatic conditions (Liu, 2003) or the mechanism of varnish formation (Goldsmith, 2011). We intend to investigate this question further by microanalytical investigation of the varnish cross sections.
Rock varnish and mineral dust chemical composition
Rock varnish thick sections from four different locations in the Hima region were analyzed by fs LA-ICP-MS to obtain quantitative major and trace element mass fractions (Figure 2a and Supplemental Appendix B, available online). The mean mass percentages of Mn and Fe in the intact varnish samples are 3.9 ± 0.5% and 7.8 ± 1.3% (N = 4), respectively, and the mean Mn/Fe ratio is 0.50 ± 0.04. The somewhat higher Mn/Fe ratio from the ICP-MS measurements as compared with the pXRF data may be due to the small number of samples or some sampling bias favoring particularly dark samples when collecting samples for ICP-MS analysis. In the varnish sample from the Himaic petroglyph (HI-SR8B), the concentrations of Mn and Fe are 2.0% and 6.8%, respectively, consistent with the higher Fe/Mn ratio in younger varnish discussed above.
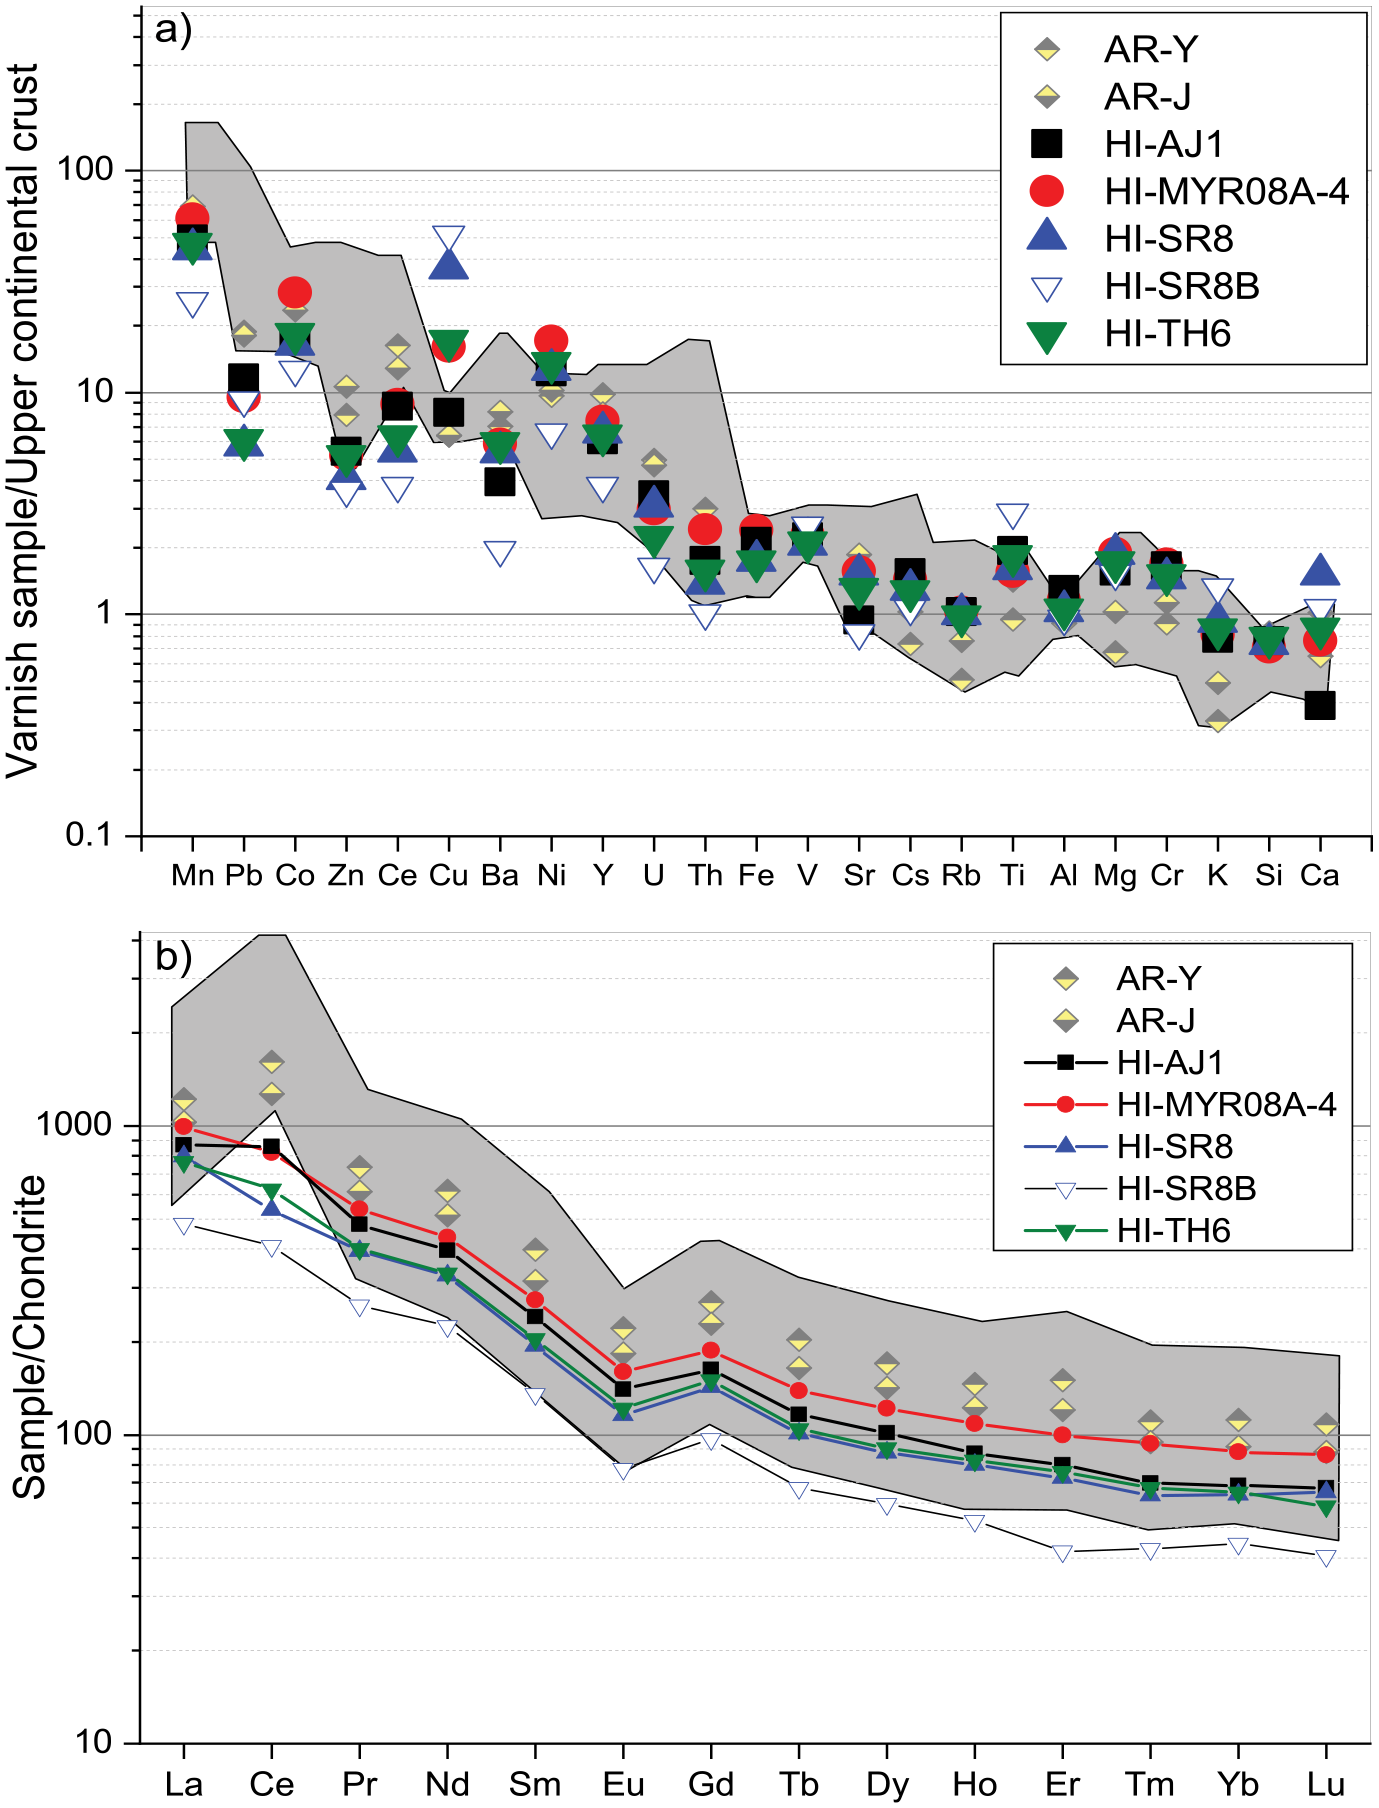
Element and rare earth enrichments in the Hima varnishes. The gray shaded area identifies the typical range for Type I varnish (arid desert environment varnish). The mass fractions of the elements from the Ha’il region (AR-Y being Yatib, AR-J being Jubbah) are plotted in yellow; these ranges and values are adapted from the dataset published in Macholdt et al. (2017b). In (a) the rock varnish LA-ICP-MS results are normalized to the UCC and in (b) to the composition of carbonaceous chondrites.
For further analysis, the data were normalized to an upper continental crust (UCC) composition (Rudnick and Gao, 2003), which is similar to that of average mineral dust, the assumed main source of the elements of varnish. For comparison, the range of typical, worldwide collected Type I varnish plots (gray shaded field) and the data obtained from varnish from NW Saudi Arabia (yellow/gray symbols) are additionally plotted in Figure 2. The element composition obtained from the Hima varnish agrees well with that of usual Type I varnish, and thus with typical varnish from arid desert environments (Macholdt et al., 2017b), even though the Pb and Ce amounts are relatively low and Cu quite high (Figure 2a). This supports the hypothesized trace metal enrichment mechanism through leaching of dust and scavenging by the Mn oxyhydroxides in the varnish (Dorn, 2007; Goldsmith et al., 2014; Thiagarajan and Lee, 2004). Furthermore, the general trend of the rock varnish REE patterns, as well as the absolute mass fractions of most REEs within the varnishes, fits quite well to the range typically observed for Type I varnishes (Figure 2b). However, the positive Ce anomaly at Hima is surprisingly low, or even non-existent, compared with the other varnishes analyzed both in our previous work and in the study by Thiagarajan and Lee (2004). This weak Ce anomaly is very untypical for Type I varnish, and was not observed in any of the other 36 samples from eight worldwide distributed localities, as represented by the gray-shaded range. The REE enrichment pattern in the Himaic petroglyph sample follows the same trend as in the intact varnishes, but is systematically lower, proportional to the lower Mn enrichment in this varnish.
The results of the mineral dust measurements are shown in Figure 3 and Supplemental Appendix C, available online. Again, the mineral dust data were normalized to the UCC (Figure 3a), and the REE content was normalized to a chondritic composition (Figure 3b–e) (Evensen et al., 1978). Since the fine fraction is considered to be the main source of the Mn-rich coating (because of its small grain sizes, the larger surface areas available for desorption processes, and the higher clay mineral fraction), this fraction was also plotted without the coarse fraction, and can be directly compared with that of the rock varnish collected next to it (Figure 3c). For comparison, the range of typical Type I varnish REE patterns plot (gray-shaded field) and the REE data obtained from varnish from NW Saudi Arabia (yellow/gray symbols) are plotted once again. Figure 3d and e show the REE patterns of rock varnish and dust, including their SDs, as stacked plots to facilitate comparison.
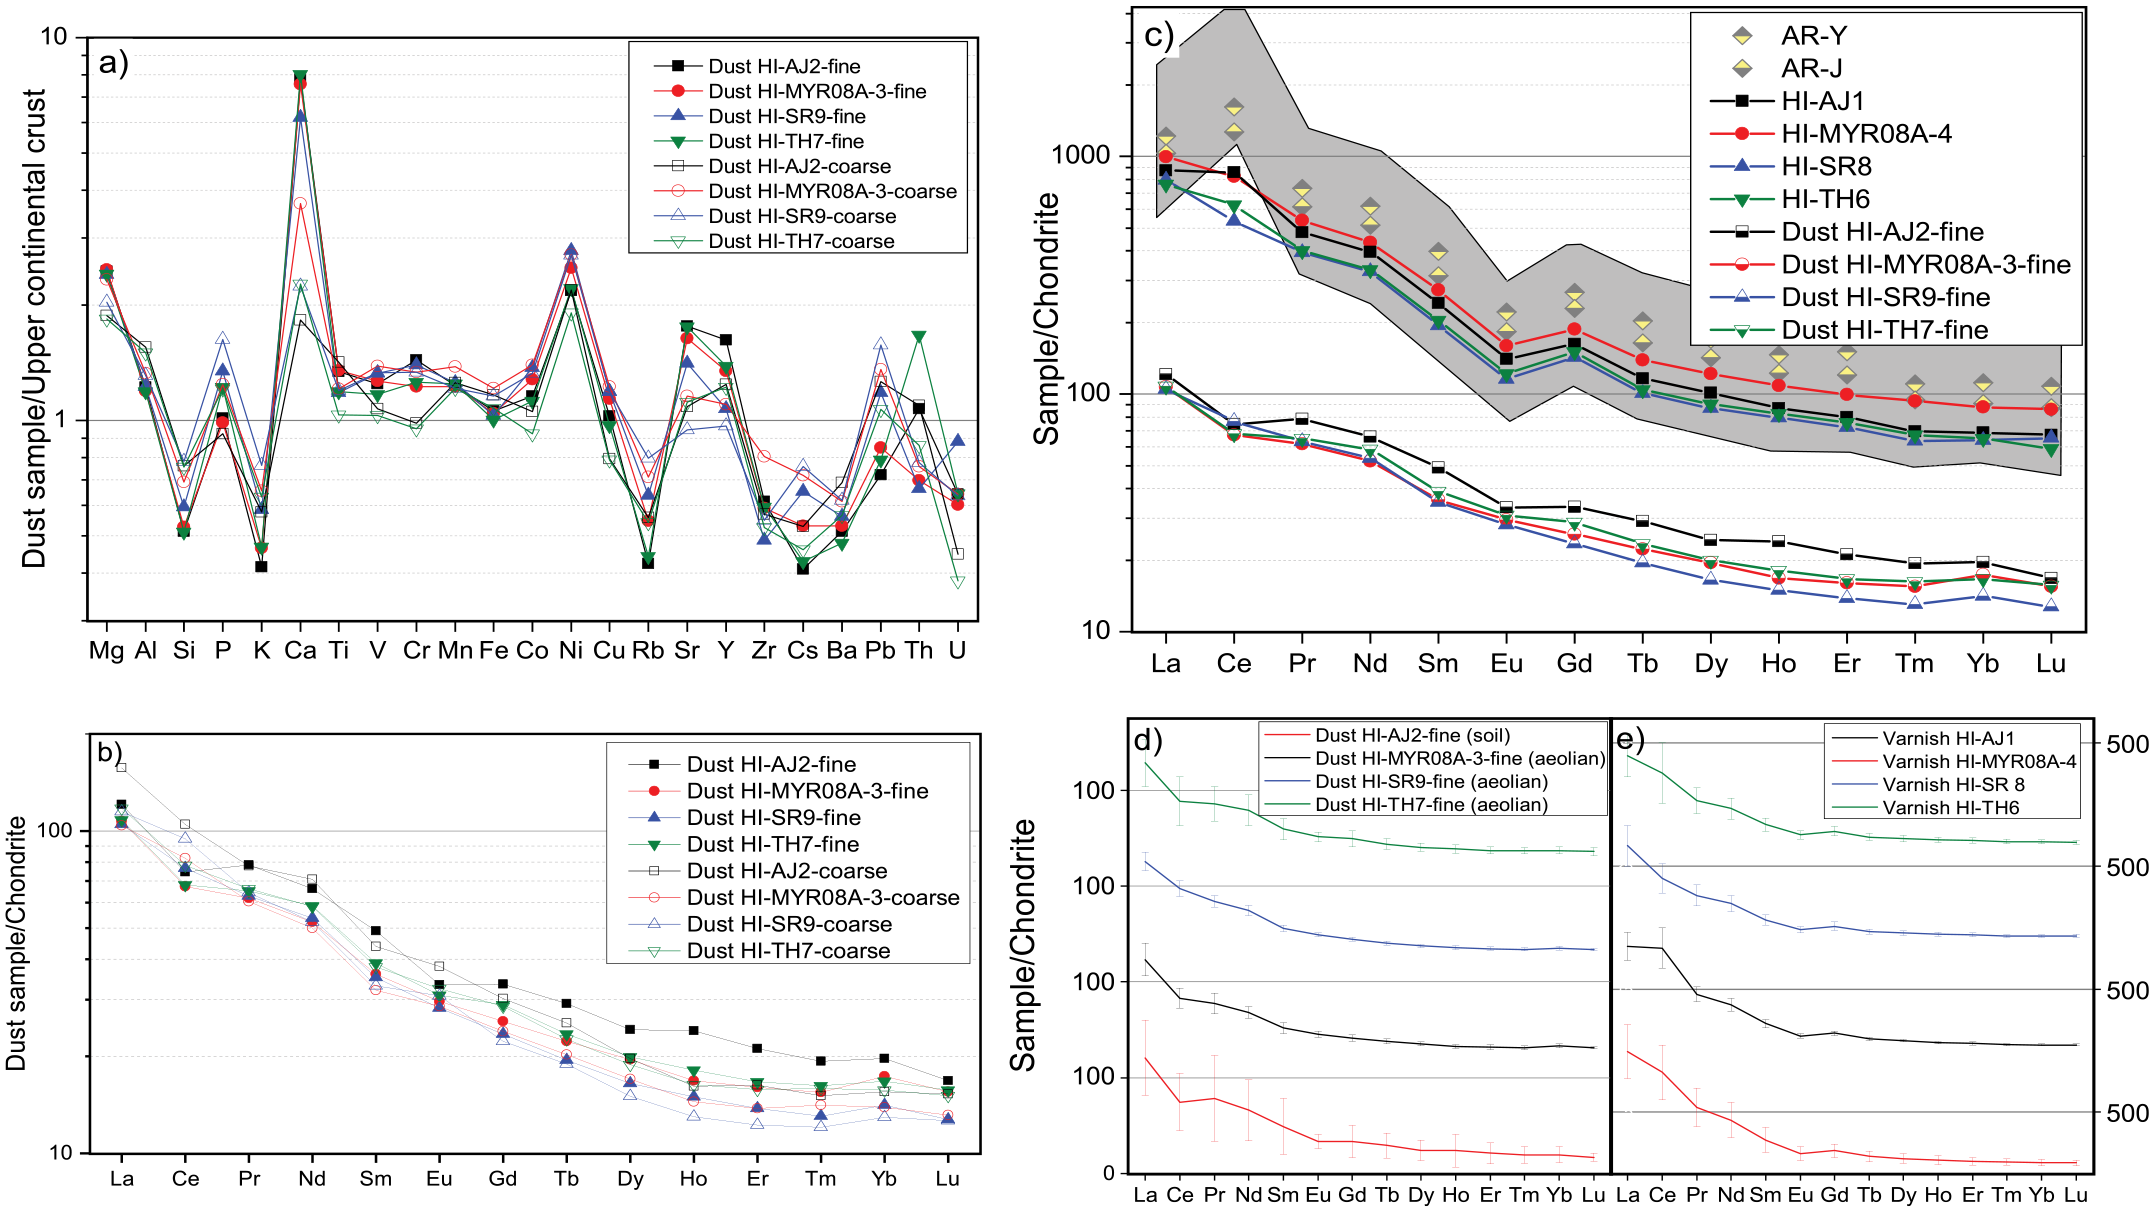
Mineral dust chemical composition data from four samples, as fine (
We observed no identifiable enrichment or depletion of the Mn and Fe mass fractions in the mineral dust compared with the average UCC composition (Figure 3a). No other surprising enrichments or depletions were observed for most other elements, such as the transition metals. A modest depletion in Si and the alkali elements are commonly found in aeolian dusts. However, the Ca value is very high for average mineral dust, with CaO mass fractions of 23–30 wt% in the fine and 7–14 wt% in the coarse fraction. The REE patterns normalized to a chondritic composition show an enrichment of light REEs (LREEs) over heavy REEs (HREEs) (Figure 3b); the fine and coarse dust fraction both follow the same trend and reveal similar ΣREE mass fractions values (ΣREE fine fraction: 130–150 µg g–1, ΣREE coarse fraction: 130–180 µg g–1). Nevertheless, plotting only the fine fraction, it becomes more obvious that this size fraction has negative Ce anomalies in almost all collected samples (Figure 3c and d), unlike the coarse fraction, independent of whether they were collected from the ground (soil sample HI-AJ2) or from elevated rock surfaces. From the eight localities, represented by the gray-shaded areas in Figures 2 and 3, four had also been investigated in combination with the adjacent collected mineral dust in Otter et al. (2015). In that study, all the varnishes had strong positive Ce anomalies and none of the dust samples revealed a negative Ce anomaly, making the negative Ce anomalies at Hima a highly unusual phenomenon.
Even though the aeolian mineral dust source of the region, and thus the likely ultimate source of the varnish material, should primarily be the adjacent Rub’ al-Khali desert (Notaro et al., 2013), the high share of CaO in our samples points toward a mixture with another Ca-rich source, since average Rub’ al-Khali dust has CaO contents of only about 0.4–2.3 wt% (unsorted grain sizes; sand dune samples; Moufti, 2013). Since CaO in high amounts is likely to be introduced in the form of carbonates, this dust fraction might have its origin in the Wadi Nisah and Wadi Hulwah carbonate areas, northeast of our sampling locations (Eltom et al., 2017). However, the negative Ce anomaly is unlikely to be introduced with the CaCO3 fraction, since the eligible carbonate sources in the Wadi Nisah and Wadi Hulwah areas have only very small negative Ce anomalies and also very low total REE contents (carbonate areas: 2–19 µg g–1; Hima region: 130–180 µg g–1) (Eltom et al., 2017). Furthermore, the sample with the strongest negative Ce anomaly is not identical with the sample with the highest CaO content. The stacked plots of the mineral dust REE patterns (Figure 3d) clearly show that the local soil sample (HI-AJ2) contains the strongest negative Ce anomaly, indicating that our ‘aeolian dust’ has a contribution from a third source, that is, the surrounding soil material. Since the ‘aeolian dust’ material was collected well above ground, some of it even on varnished surfaces, this mineral dust composition, a mixture of local soil and long-distance transported material from several origins, seems to be the true source providing the elements to the rock varnish coatings. Due to the low amount of initial Ce relative to La and Pr, the varnish derived from this dust source cannot develop a strong positive Ce anomaly (Figures 2b and 3e), as it would be usually expected. The extraordinary small Ce anomalies of the varnish samples (Figure 2b) can thus be explained by the negative Ce anomaly of the fine fraction dust source. This can be used as indirect evidence for a leaching and subsequent ion removal process from fine dust in the course of the varnish genesis.
Petroglyphs and inscriptions
Altogether, 110 measurements on different petroglyphs were made in the Hima region. The data are given in Supplemental Appendix A, available online, and the measurement locations are shown in the Supplemental material, available online. These petroglyphs comprise four different kinds of inscriptions, several types of animals, and different styles of humanoids, including humanoids with raised arms and weapons, Alia-style humanoids (Alia is used here as term for a female humanoid with open hair and raised arms, which has been interpreted differently by different authors; Macdonald, 2012), and riders on horseback.
Estimates of the absolute Mn and Fe accumulation rates
Estimating the accumulation rate of Mn on the petroglyph surfaces requires knowledge of the time at which they were created. This is a notoriously difficult problem in rock art research, as discussed in the introduction, because direct dating methods are not available and relative dating techniques have only provided rough age estimates. For this study, however, age references can be obtained from paleographic information on inscription styles and cultural information related to some of the depicted animals and humanoids.
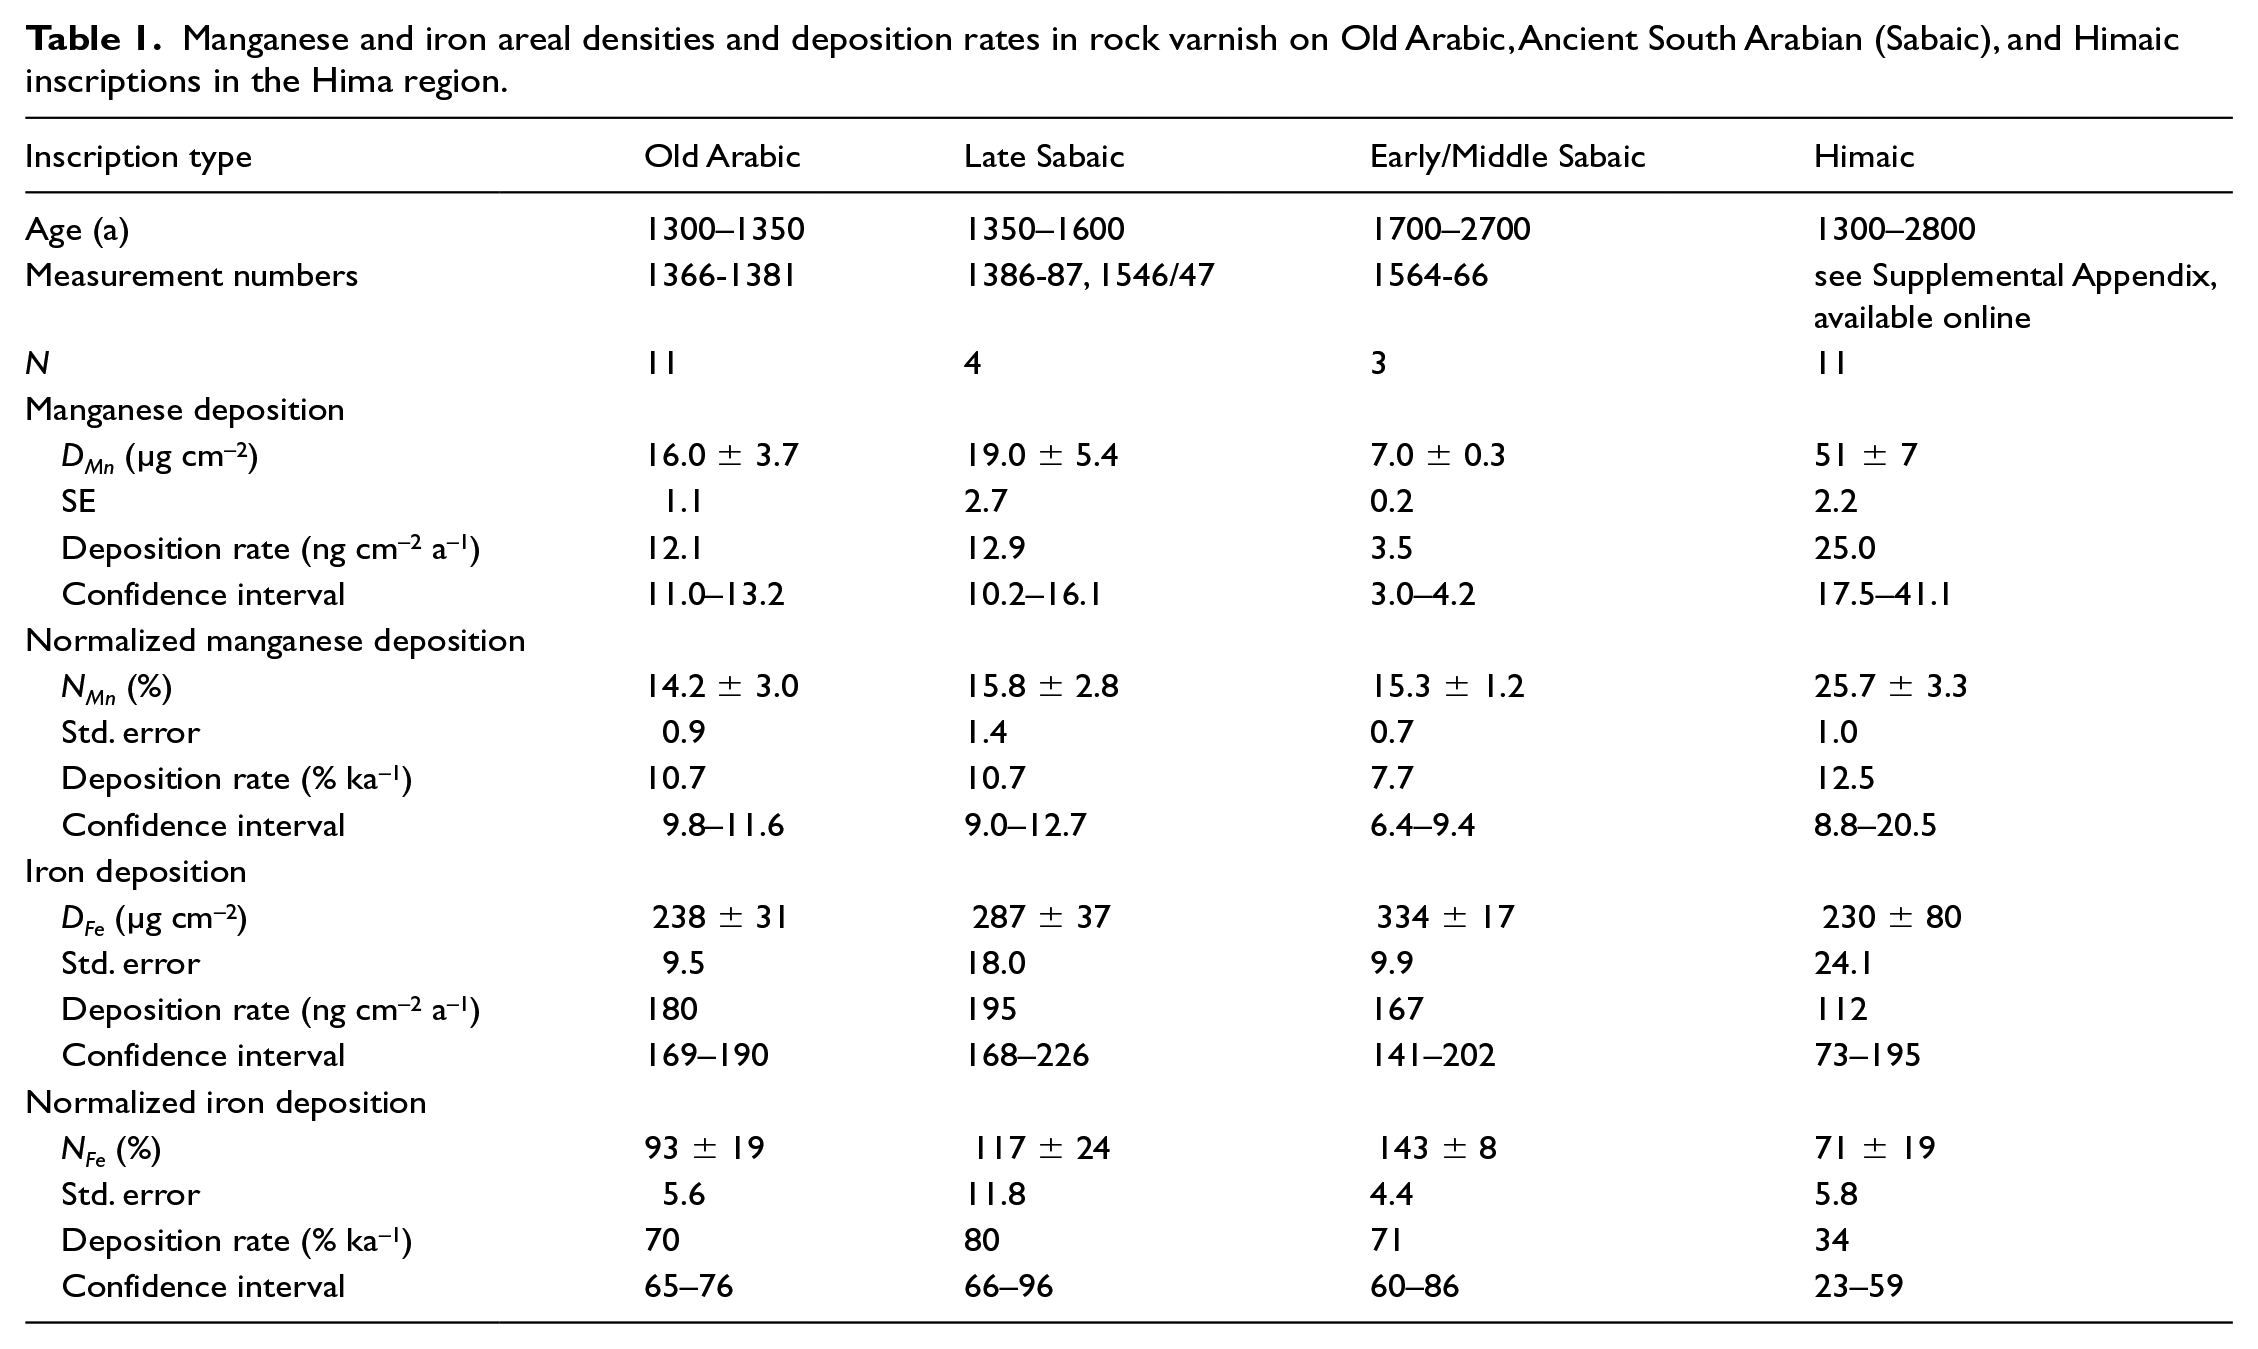
We used as one benchmark an Old Arabic (Kufic) inscription at Ain Jamal (#1366-1381, see Figure 6a, Table 1, and Supplemental material, available online). Arabic scripts came into use around 1600 BP (400 CE) (Beeston, 1981; Healey and Porter, 2003; Shah, 2008). This inscription was photographed during the Philby-Ryckmans-Lippens expedition and interpreted by Grohmann (1962; Photograph 41 L 5, Z 297), who dated it to 1300–1350 BP based on its style. It was subsequently used as a calibration point for the microerosion dating technique (Bednarik, 2017; Bednarik and Khan, 2005, 2009). Two other inscriptions represent the late Sabaic ductus (#1386/87 and #1546/47), which belongs to the ASA scripts (also called Old South Arabian, Sabaic, or Sabaean). These scripts began to be used around 3000 BP, but more frequently after 2800 BP, and their last documented use is in 1440 BP (Drewes et al., 2013; Jennings et al., 2013; Macdonald, 2010; Parr et al., 1978; Stein, 2013). The late Sabaic ductus has been dated to about 1600–1440 BP (Stein, 2013). The letter dhal in #1564-66 could be early or middle Sabaic, which were used around 2700–2300 and 2300–1700 BP, respectively. Several other measured inscriptions (#1513/14, #1525/27, #1554/55, and #1573–78) are in the Himaic script, a regional variant of the Thamudic scripts (Robin, 2018; Robin et al., 2014; Robin and Gorea, 2016). This script was used for an extended period between ca. 2800 and 1300 BP (750 BCE and 630 CE; Robin, 2018) and therefore does not allow an age assignment to a narrow period.
Manganese and iron areal densities and deposition rates in rock varnish on Old Arabic, Ancient South Arabian (Sabaic), and Himaic inscriptions in the Hima region.
Cultural or ecological information unfortunately provides even less precise age references. The distinct transition from a hunting to a cattle herding economy, which is prominent in the Ha’il region petroglyphs and represents the Neolithic transition in the humid period of the early Holocene, is not evident in the Hima region. Thus, the earliest reliable reference point in our region is the appearance of images of domesticated dromedaries (referred to as camels in the following text), which must postdate the domestication of the camel (3400–2900 BP; Magee, 2015; Uerpmann and Uerpmann, 2012). The horse was introduced to South Arabia around 2000 BP (Arbach et al., 2015; Robin, 2018; Robin and Gorea, 2016), providing an upper age limit for the images of riders on horseback. We will return to a discussion of the animal images in the next section.
Based on the Sabaic and early Arabic inscriptions, for which we have fairly good time constraints, we can derive an estimate of the average absolute Mn accumulation rate on petroglyphs over the past two millennia. For this calculation, we take the mean DMn measured on the inscriptions of a specific ductus and divide it by the upper and lower limits of the age estimate. To account for the uncertainty in DMn, we perform the same calculations with the upper and lower confidence limits of DMn obtained by adding or subtracting the SE of the DMn measurements. The estimates obtained by dividing (DMn + 1 SE) by the upper age limit and (DMn – 1 SE) by the lower age limit yield the confidence interval for the growth rate estimate. The overall average DMn growth rate is 13.4 ng cm–2 a–1, and the mean estimates for the different script types are between 3.5 and 25 ng cm–2 a–1, with the confidence intervals ranging from 3 to 41 ng cm–2 a–1 (Table 1). Obviously, this wide range reflects the high variability in varnish deposition rates also seen in previous studies. Unfortunately, there are only few published measurements that our data can be compared to. In our study from the Ha’il region, we had found an average Mn deposition rate of 17 ng cm–2 a–1 and a quartile range 2.1–31 ng cm–2 a–1 (Macholdt et al., 2018), in good agreement with the Hima results. Assuming an average Mn areal density of 150 µg cm–2 and an average age of 5000 a for the Holocene varnishes of Reneau (1993), one obtains an order-of-magnitude estimate of 30 ng cm–2 a–1 for the Mn deposition rate at his site in the Mojave desert – a reasonable agreement considering that Reneau specifically selected samples with visibly thick varnish.
To assess whether the dust deposition flux in Arabia is sufficient to support these Mn accumulation rates, we consider literature data on dust fluxes and Mn concentrations in dust. In the absence of direct dust flux measurements in Arabia, we use fluxes from global dust models and measurements in nearby regions. Three model estimates suggest dust fluxes of the order of 20–50 g m–2 a–1 in our region (Bergametti and Forêt, 2014; Jickells et al., 2005; Sudarchikova et al., 2015), and measurements in the Sinai indicated a flux of about 90 g m–2 a–1 (Ganor and Foner, 2001). Taking into account that only 10% of this dust is in the fine fraction, which is most likely the source of Mn for the varnish, adopting an intermediate value of 50 g m–2 a–1 for the dust flux, and a crustal average Mn concentration of 1000 ppm, we obtain a Mn flux of 0.5 µg cm–2 a–1. Therefore, only a small percentage (order of 3%) of the Mn in the dust needs to be dissolved and reprecipitated to account for the observed Mn accumulation rate in the varnish.
For comparison with published rates of varnish growth, we derive an estimate of the thickness growth from our Mn accumulation rates. Using the mean Mn accumulation rate of 13.4 ng cm–2 a–1, the Mn concentration of 3.9 mass-%, and a mean density of 2.67 g cm–3 for the varnish, we obtain a growth rate of 1.2 µm ka–1, in close agreement with our value of 1.3 µm ka–1 for the Ha’il region. This is at the low end of the range of varnish growth (<1–40 µm ka–1) compiled by Liu and Broecker (2000). However, the thickness measurements used by Liu and Broecker (2000) come from microbasins, typically on near-horizontal surfaces, thus representing the thickest varnish from a given site. In contrast, our growth rates represent decimeter-scale areal averages from highly inclined surfaces, and thus would be expected to be considerably lower.
Using the same approach as used above for Mn to estimate the Fe accumulation rate in the varnish, we obtain averages between 112 and 195 ng cm–2 a–1 for the different inscription types, and a range from 73 to 230 ng cm–2 a–1. These values are somewhat higher than those obtained in our previous study (quartile range = 57–95 ng cm–2 a–1). However, in view of the lack of a clear relationship between the Fe areal density and the age of petroglyphs, which we had also observed in our previous study, and the existence of the large DFe intercept at zero DMn discussed above, we feel that the Fe data cannot be interpreted in terms of a straightforward deposition rate and therefore focus the following discussion on the Mn accumulation.
Estimate of the normalized Mn accumulation rate
In our previous paper, we had introduced the concept of the normalized Mn accumulation rate, NMn, defined as the areal density of Mn on a petroglyph surface divided by that on an adjacent intact rock varnish surface, expressed in percentage. This can be considered as the regrowth or repatination percentage of the varnish following its creation by abrasion of the preexisting varnish to create the petroglyph. This approach has the advantage that it takes into account the variability of varnish thickness and growth on scales comparable with the distance between the measurement points on the petroglyph and the points on the adjacent intact varnish, usually a few or tens of centimeters, depending on the size of the petroglyph. Variability on the size scale of the petroglyph itself is taken into account by making multiple measurements within and adjacent to a given petroglyph, and variability on the microscale is averaged over by the spot size (8 mm) of the pXRF measurement.
We investigated the variability of measurements within a given petroglyph by two approaches. We made 10 measurements each on the Arabic inscription at Ain Jamal (#1366-81) with an average and SD of 14.2 ± 3.0% NMn and on the humanoid at Wadi Tho’ur with 35.1 ± 6.0% NMn. These results correspond to relative SDs of 21% and 17%, respectively. In a more comprehensive approach, to obtain a measure of the typical error of the measurements in the petroglyphs, we normalized all measurements to unity by dividing each individual measurement by the mean of the measurements in the same object (these values are plotted as black diamonds in Figure 1b). The SD of these 114 normalized values is 0.177, indicating a typical relative measurement error of 18% for single measurement, 13% for duplicate, and 10% for triplicate measurements.
Table 1 shows that the normalized Mn regrowth rates, obtained by dividing NMn by the age of the reference inscriptions, cluster much more tightly than the absolute Mn accumulation rates. The averages for the four inscription types range between 7.7 and 12.5% ka–1 with a mean value of 10.4% ka–1, and the extreme values of the confidence intervals range from 6.4 to 20.5% ka–1. Much of this spread is attributable to the age uncertainty of the Himaic inscriptions, and using the better defined Arabic and Sabaic inscriptions only, the range narrows to 6.4 from 12.7% ka–1. These values are remarkably similar to the rates (12 ± 3% ka–1) we obtained in our previous study from the Ha’il region, which were based on the much larger range of estimated petroglyph ages (reaching back to the Neolithic transition in the early Holocene) that were available for that region.
Measurements on petroglyphs
The Hima petroglyphs (plotted as red filled circles in Figure 1) all show significantly lower values than the surrounding intact varnish (i.e. NMn < 100%; black filled diamonds in Figure 1b), in contrast to those measured previously in the Ha’il region in NW Saudi Arabia (plotted as black empty squares in Figure 1b), where the Mn areal density in the oldest petroglyphs was indistinguishable from that of the intact surrounding varnish. This indicates that at Hima, not enough time has elapsed since the creation of the engravings for their surfaces to fully recover a varnish density comparable with the surrounding varnish. It also suggests that few if any Hima petroglyphs extend as far back in time as those in the Ha’il region, where the earliest rock art dates from the pre-Neolithic early Holocene (Guagnin et al., 2016; Jennings et al., 2014). In the following, we discuss the measurements made on the various petroglyph motifs and relate them to age estimates based on cultural and ecological considerations. Where we present age estimates based on the degree of revarnishing, we apply the Mn regrowth rate estimate of 10.4% ka–1, based on the inscription measurements discussed above. The statistical uncertainty for such an estimate is about 33%, based on a measurement error of 13% for duplicate measurements and an uncertainty of about 30% of the Mn accumulation rate. Since additional assumptions have to be made to derive an age from NMn measurements, for example, linear accumulation over the time interval under consideration (supported by our previous study in the Ha’il region), we emphasize that such age estimates must be considered experimental and are subject to a considerable degree of uncertainty.
The DMn and DFe values for individual petroglyphs, or groups showing similar motifs, are shown in Figure 4 and the corresponding NMn and NFe in Figure 5. The DMn values match reasonably well with the time periods indicated by the horizontal lines, which were obtained from time estimates of the transitions (onset of dry climate: 5500 BP, beginning of Himaic: 2800 BP, and Arabic writing: 1400 BP) and the Mn revarnishing rates of 13.4 ng cm–2 a–1 for DMn and 10.4% ka–1 for NMn. The transition from the Holocene wet period to a dry climate should be located at a DMn of about 74 µg cm–2 and an NMn of 57%. Almost all of the means and medians of our petroglyph data fall into the range expected after the onset of the dry climate and are roughly consistent with the culturally based age estimates. However, they show, as expected and previously found in Macholdt et al. (2018), a large scatter due to the locally different varnish thicknesses. This scatter is significantly reduced if the DMn and DFe are normalized to give NMn and NFe (Figure 5).
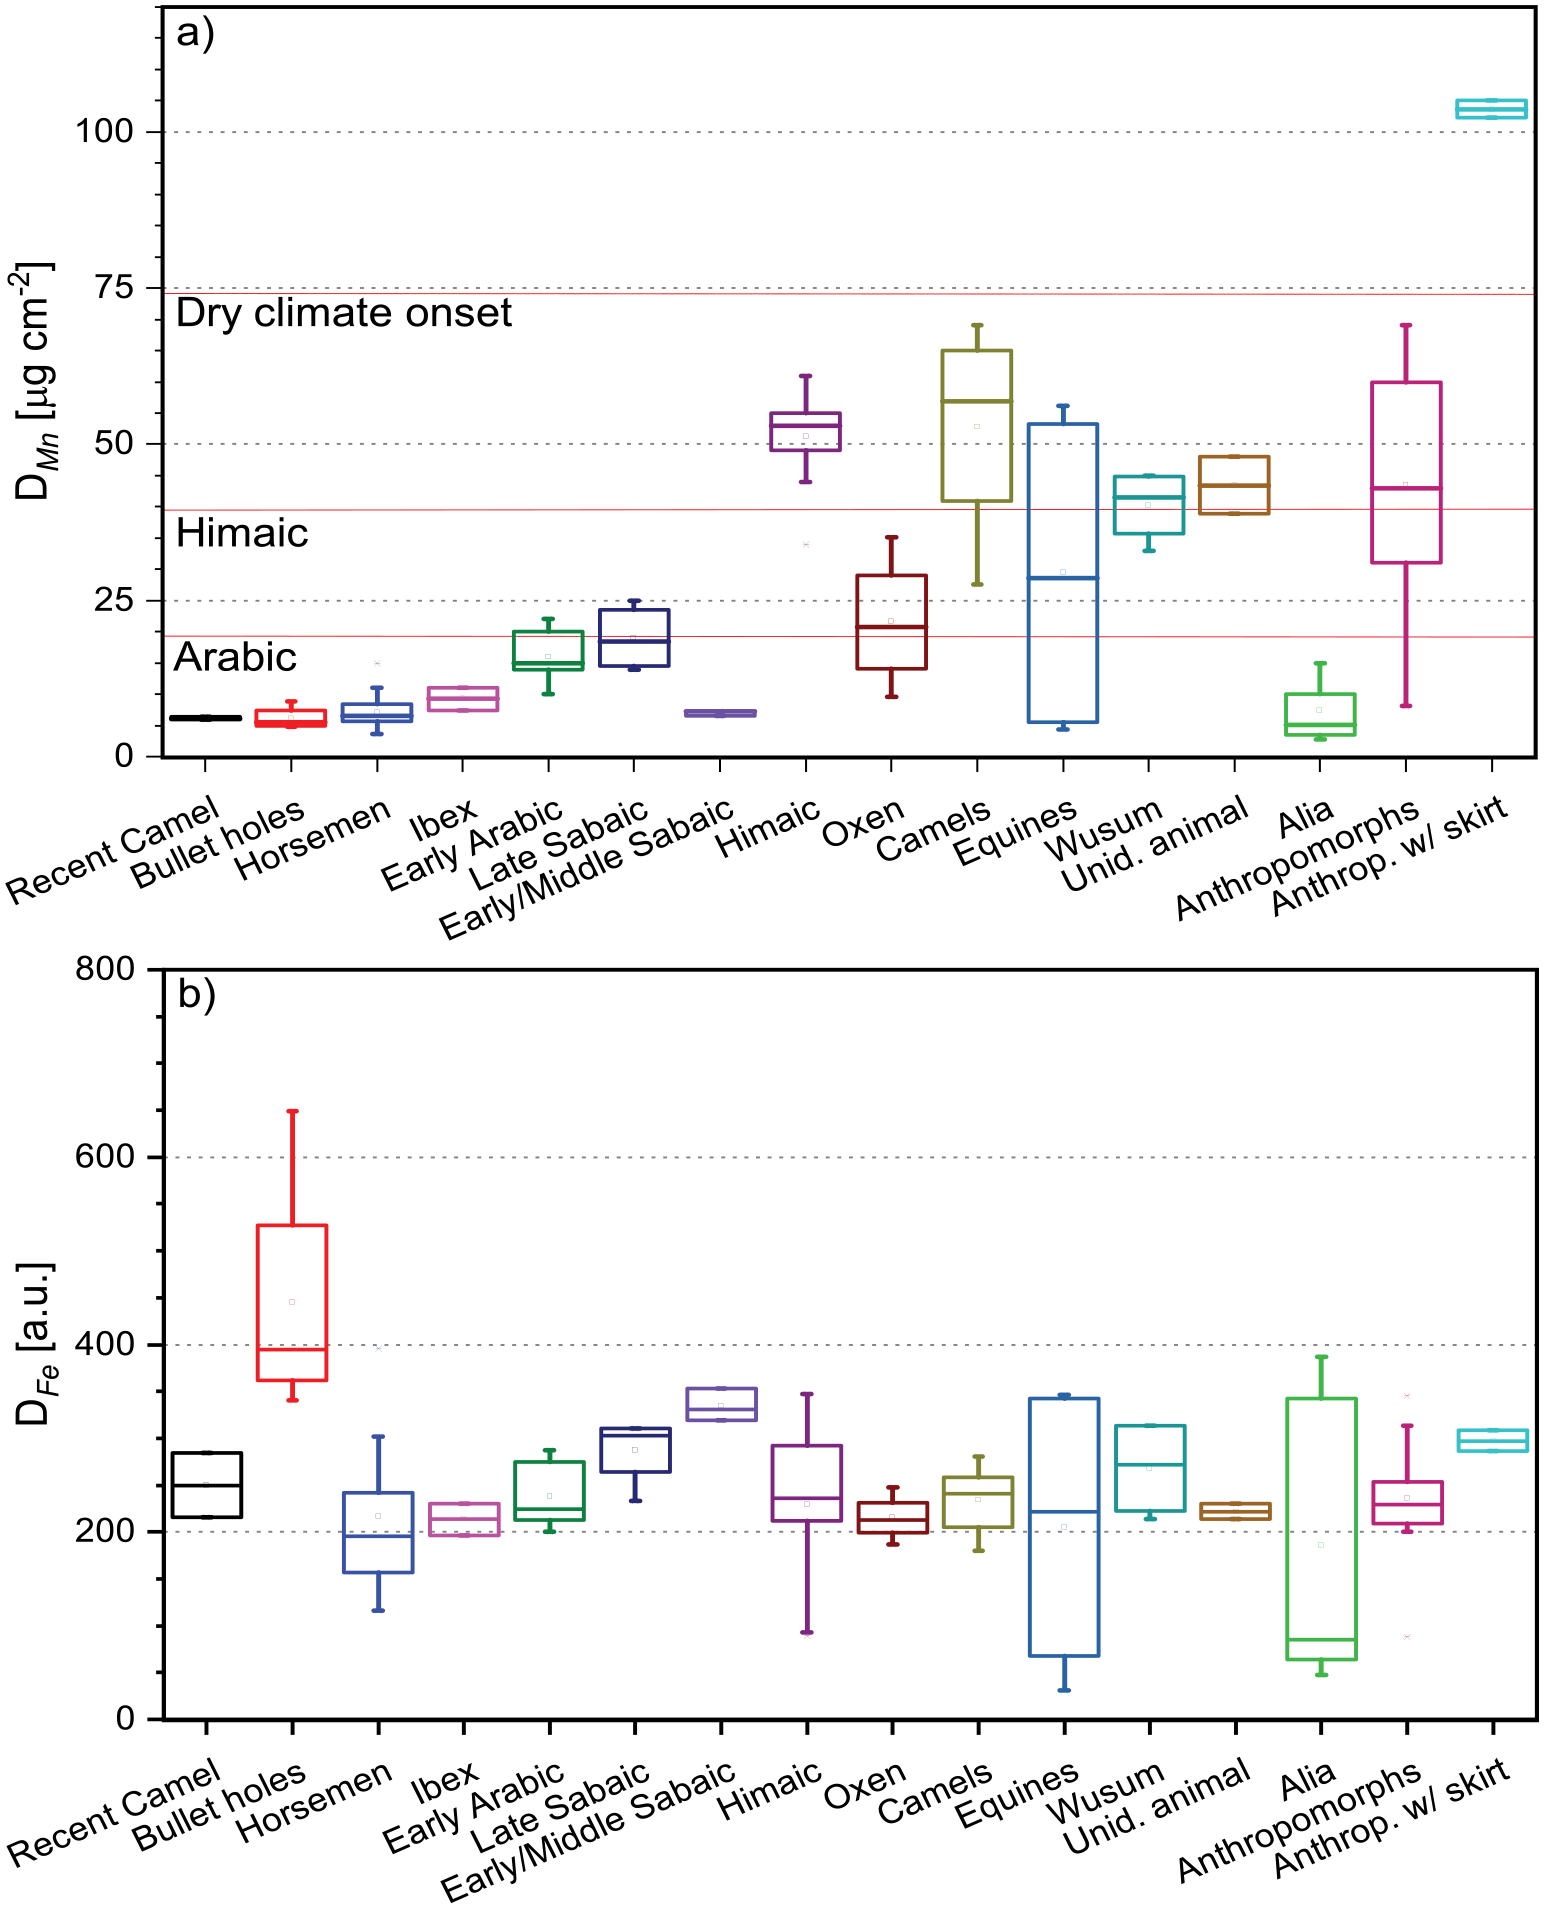
(a) DMn and (b) DFe for petroglyph groups showing similar motifs. The red lines in (a) are depicting the expected approximate DMn values for major transitions, based on the estimated Mn deposition rates (see text). The beginning of the Holocene wet period (expected at about 150 µg cm–2) is not shown, since none of the petroglyphs approach this value.
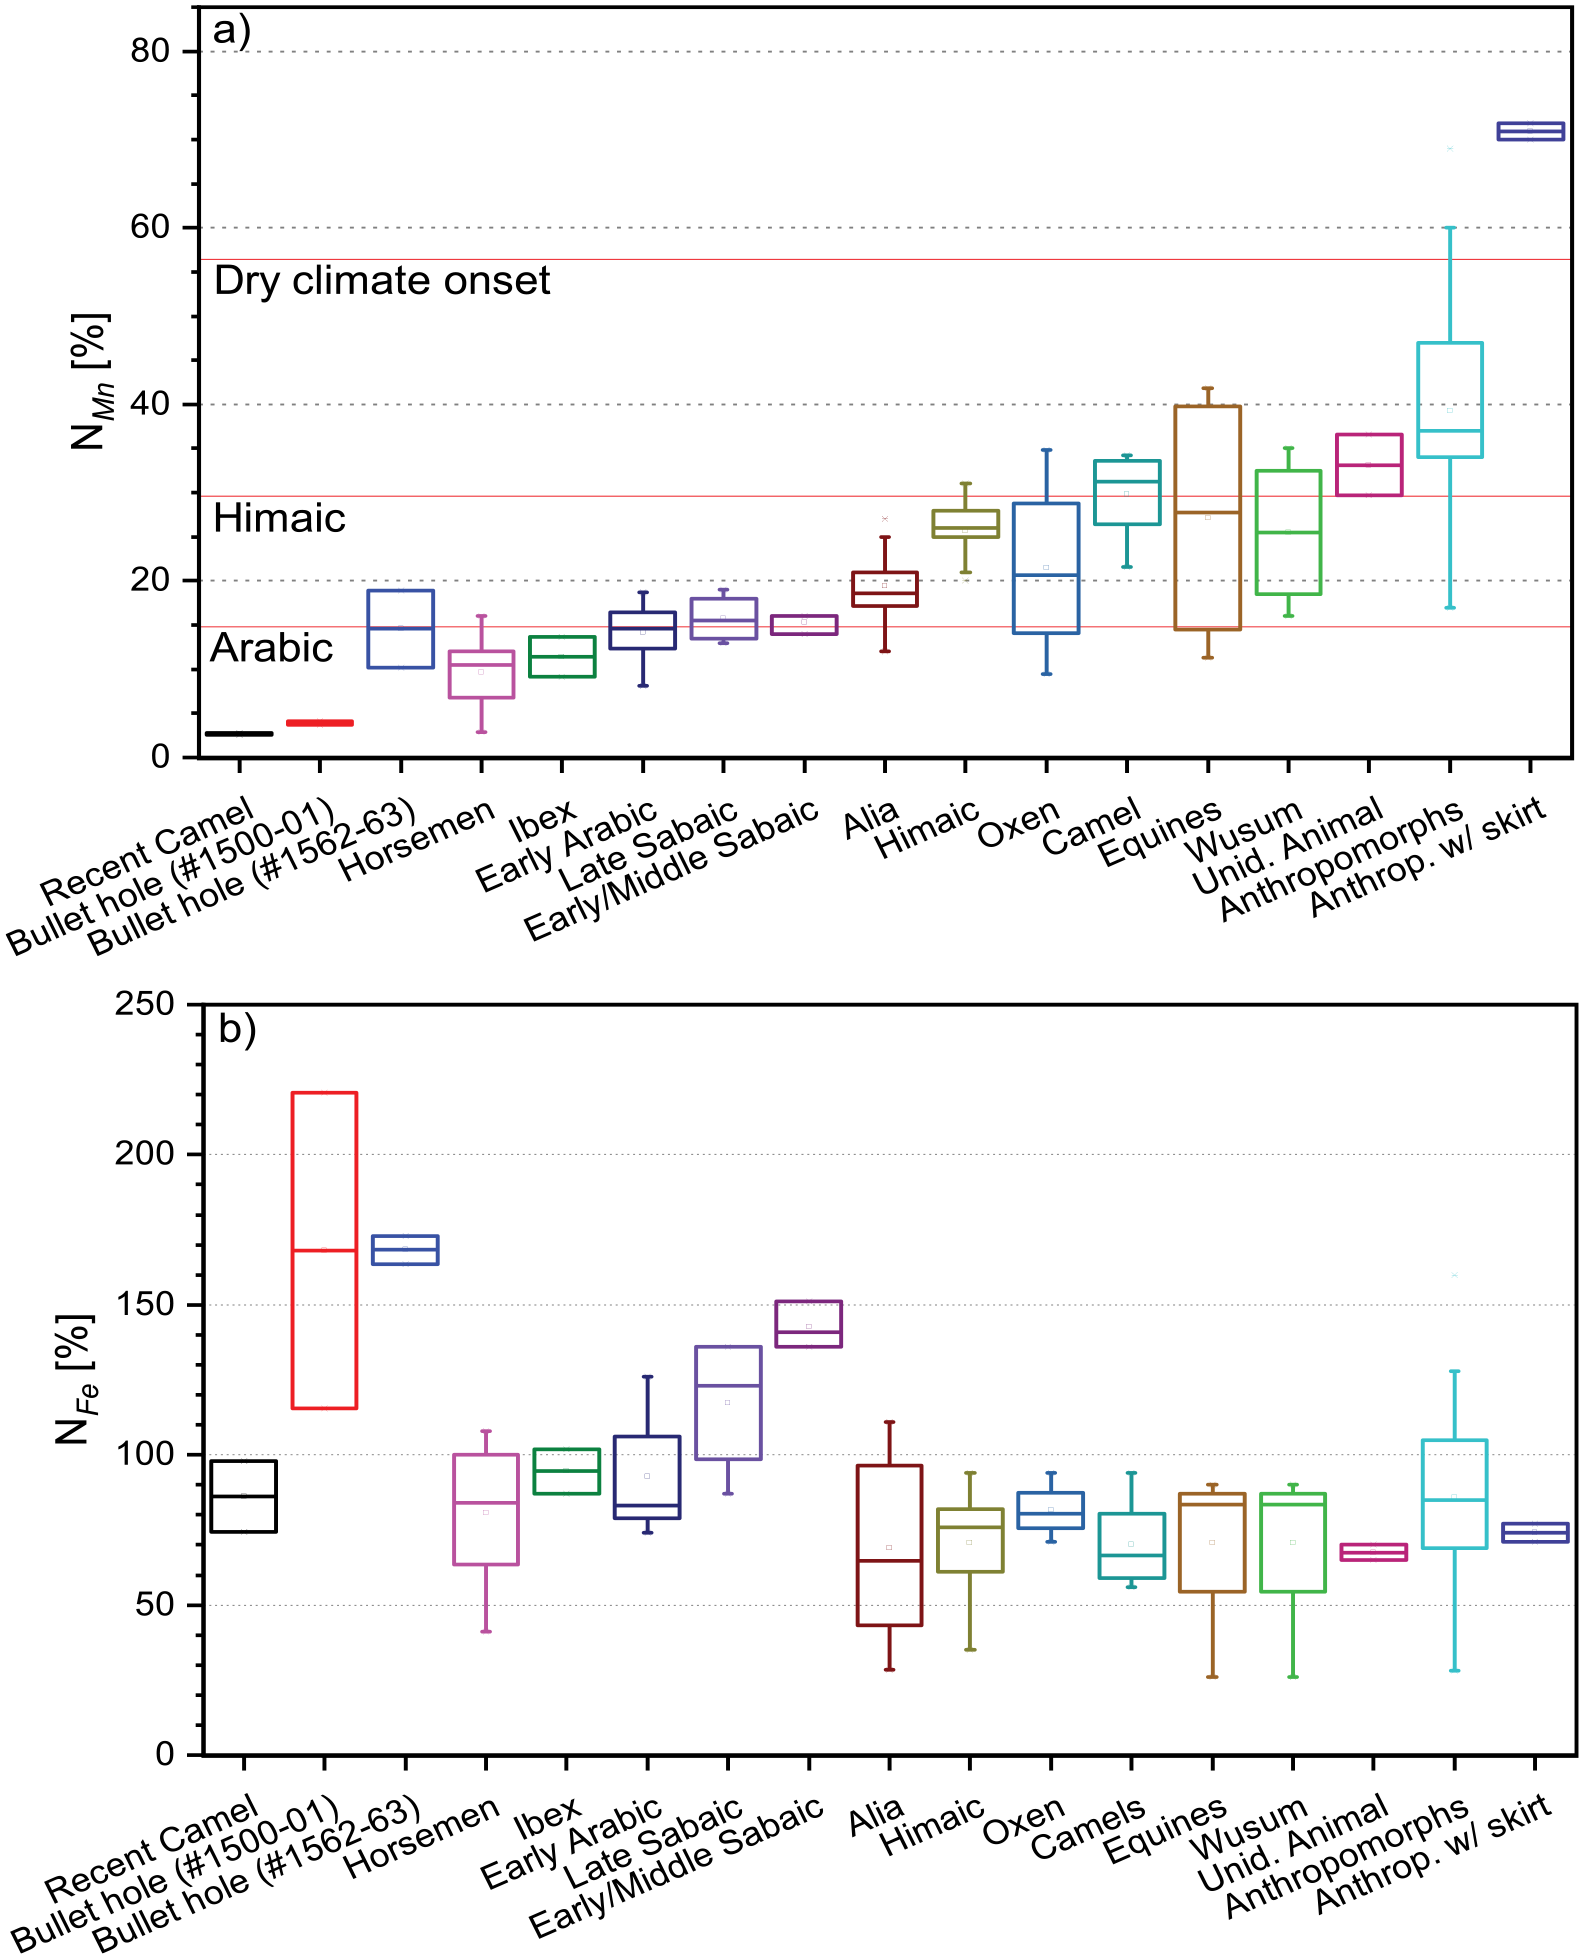
(a) NMn and (b) NFe values for petroglyph groups showing similar motifs. The red lines in (a) are depicting the approximately expected NMn values for major transitions, based on the estimated Mn revarnishing rates (see text). The onset of the Holocene wet period (expected at about 110%) is not shown, since none of the petroglyphs approach this value.
The NFe values of most engravings plot between 60% and 100% NFe, independent of their estimated age (Figure 5b). This suggests that the majority of the iron within the varnish is located in a thin layer below and/or on top of the crust, as discussed above. The average NFe values are quite similar between the Ha’il region (64 ± 7%) and the Hima region (85 ± 3%), as it can be expected if a higher Fe amount is needed to compensate for the lower Fe content within the sandstone for all varnished surfaces (Figure 1b). In the following, we will discuss the DMn data for the different petroglyph types in more detail.
Animals
Our measurements on animals in the Hima rock art included ibex, oxen, camels, equines, and one unidentifiable species. Horses were always associated with riders and thus will be treated together with the humanoid images.
Ibex have been hunted in Arabia throughout the time of human presence and are depicted frequently in the rock art (Arbach et al., 2015; Guagnin et al., 2016; Khan, 2007; Robin, 2018). At Hima, the large and fully revarnished ibex typical of the pre-Neolithic hunting scenes at Shuwaymis are absent. Ibex are frequently shown in hunting scenes at Hima, often being attacked by dogs, and lightly to moderately revarnished. This also applies to the single ibex image we measured (Site BR, #1631/32), whose NMn (11.6 ± 2.4%) is lower than all of the Sabaic and Kufic inscriptions and thus suggests an origin in the Islamic period. A mounted horseman with a spear (#1620/21) measured on the same panel has almost the same NMn (12 ± 1%).
Oxen were central to the herding economy in the Neolithic humid period from about 8500 to 6500 BP and are depicted prominently in the rock art from this period in Northern Arabia (Guagnin et al., 2015, 2016, 2017). They become rare in rock art after the onset of dry climate around 6000 BP, but still show up on stelae and some Nabatean petroglyphs in the Tabuk area (Khan, 2007). Inscriptions in Yemen mention wild bulls being hunted as late as the 3rd century CE in the mountain valleys, but the evidence from petroglyphs suggests that hunting of bovines in the desert margin lowlands did not extend into the literate period (Robin, 2018). At Hima, there are some oxen images that visually appear almost fully revarnished (e.g. Figure 8 in Robin, 2018); unfortunately, we were not able, for logistical reasons, to make measurements on these images. The only oxen image in our data set is from the same panel as the ibex and mounted riders mentioned above (Site BR, #1613-16). Its NMn of 22 ± 11% would be consistent with an age of about 2000 years.
Wild asses were domesticated around 6000 BP (Boivin et al., 2010), but inscriptions show that they were hunted in southern Arabia at least until the 6th century CE (Robin, 2018). In our data set, there is one image of a wild ass being pieced by a spear, with a relatively high degree of revarnishing (MRY08B, #1448/49; NMn = 40 ± 2%), suggesting an age of the order of 4 ka. The spear is held by a humanoid of the typed called ‘oval-headed people’ by Anati (1968b). Its NMn (38 ± 3%) is very similar to that of the wild ass and falls into the same range as that of these humanoids (see below), suggesting that hunter and prey are contemporary. The other image is from a very complex panel at Ain Jamal (#1405/06) and shows a much lower degree of revarnishing (14 ± 3%).
Camels have been documented in Arabia since about 5500 BP and were domesticated around the late Bronze Age, about 3000 BP (Khan, 2007; Uerpmann and Uerpmann, 2012). They are very prominent in the rock imagery after their domestication, reflecting their importance in the material culture of Arabia (Guagnin et al., 2015, 2016, 2017; Khan, 2017; Robin, 2018). Our data set comprises three camel images, which fall into a fairly narrow NMn range (#1508-10: 32 ± 3%; 1515-17: 28 ± 6%; 1624/25: 30 ± 4%), suggesting ages of around 3 ka. All three, from the Wadi Tho’ur and BR sites, are closely associated with human figures with a similar degree of revarnishing. An unidentifiable animal from the WT site has a similar degree of varnish regrowth (#1504/05: 34 ± 4%).
Humanoid figures
The human depictions in our data set can be broadly classified into three groups. The first typically shows human figures with raised arms, often holding weapons such as bows, arrows, or clubs. The legs are frequently shown side-on, with slightly bent knees. The second group comprises female figures often referred to as ‘Alia’, with raised arms and long, open, wavy hair. The third group consists of riders on horseback, often carrying long spears and swords and forming part of large battle scenes.
The humanoid figure with the highest degree of revarnishing (#1390/91 from A’in Jamal) is too indistinct to be classified, but may belong to the first group. Its NMn of 71% suggests an age of the order of 7 ka, which would make it one of the rare petroglyphs at Hima that were already engraved during the Holocene wet period. The other humanoids of the first group generally match the description of the ‘oval-headed people’ of Anati (1968b). Their NMn values span a wide range, from 22% to 62%, suggesting that they have been produced over a long span of time (2–6 ka BP), that is, reaching from the pre-literate to the early literate period. Khan (2007) had suggested an age of 2500–3500 BP, around the beginning of the iron age, for this style of humanoids at Hima, based on the weapons they are carrying. In some cases, they are superimposed on Himaic (i.e. post 3000 BP) inscriptions, thus implying an age consistent with the lowest repatination levels we measured (22% and 28%, corresponding to nominal ages of 2100 ± 700 a and 2700 ± 900 a, respectively).
Among the figures of this group, only one in our data set carries a sword, indicating that it must have been made after the beginning of the Bronze age, about 5000 BP. This figure is typical of the ‘oval-headed’ anthropomorphs, of which there are several more on the same panel (Figure 6b). This figure, #1477-1486 from Wadi Tho’ur (alternatively transcribed as Ta’ar), was investigated in some detail, because it had been previously dated using the microerosion technique by Bednarik and Khan (2005). These authors had obtained an age of 2360–1570 BP, while our measurements suggest an age around 3400 ± 1100 BP (consistent with a Bronze Age date), and thus point toward a slightly older age of this petroglyph. Given the uncertainties of both techniques, however, we cannot confidently assert that these ages are truly different. While the degree of revarnishing on this image is visually similar to Himaic writing on the same panel, its mean NMn (35.1 ± 3.0%) is somewhat greater than that of the measured Himaic inscriptions from the same panel (24.3% and 27.5%). One of the measured humanoids (upper right in Figure 6b; #1520/21) from this site is a female with wide hips and wavy hair, which is stylistically different from the Alia-type females discussed below. Its NMn (28 ± 1%) is significantly greater than that of the Alias, suggesting an earlier date for this figure.
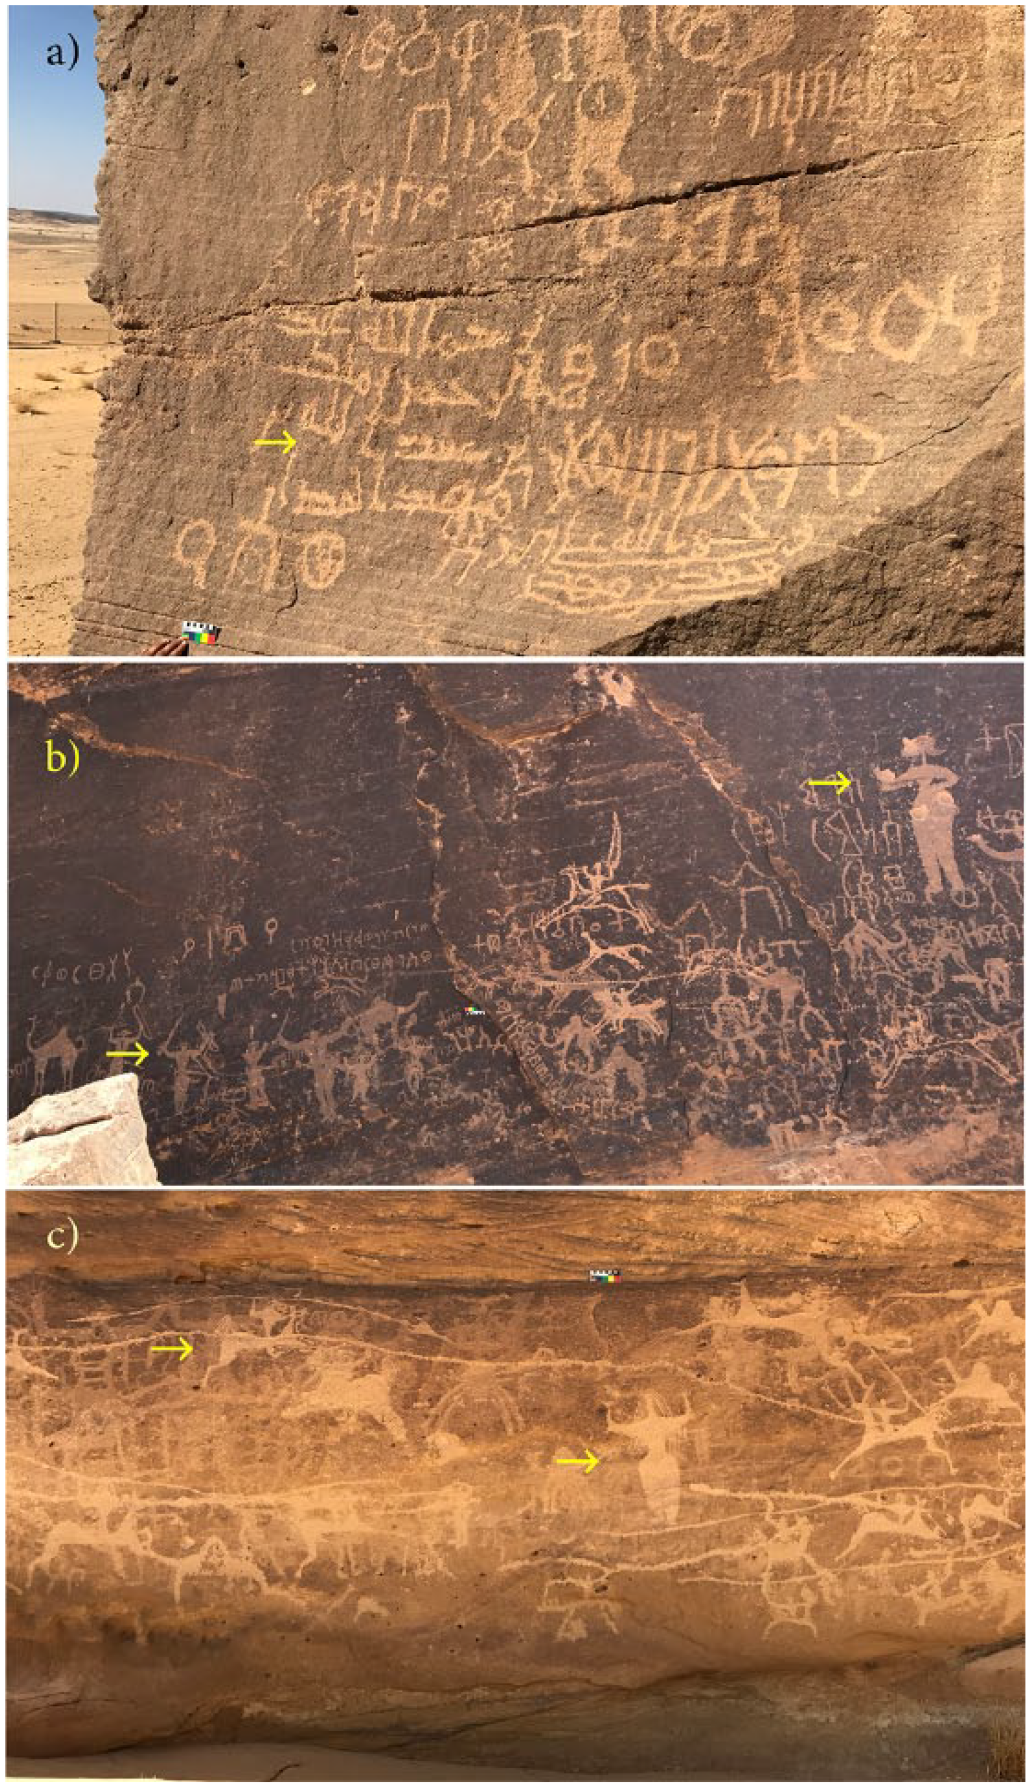
Examples of the inscriptions and petroglyphs from the Hima region. (a) Old Arabic, Sabaic, and Himaic inscriptions from the Ain Jamal site. The inscription marked by an arrow is the Arabic reference inscription (#1366-81). (b) Various types of humanoids from the Wadi Tho’ur site. The figure at the lower left is a humanoid with raised arms (#1477-86), the female figure at the top right (#1520/21) is of a style different from the Alia-type females. (c) Alia figures and warriors on horseback from the HIR site. Measurements were made on the Alia figure (#1592/92) and the horseman (#1602-04) marked with arrows.
In contrast to northern Arabia, where male figures predominate, females are prominently and frequently depicted in the South (Khan, 2007, 2013). Because of their striking appearance and high abundance in the Hima region, these ‘Alia-style’ female figures (Figure 6c) are of particular interest. They have been suggested to represent a female deity or dancers, but Macdonald (2012) proposed that they represent ‘cheerleaders’ encouraging warriors in fighting scenes. Some of these female figures are directly associated with Himaic writing (Robin, 2018). Based on their association with and occasional superimposition on Himaic writing, they must date from the literary period, and Khan (2013) had proposed ages in the range 2500–2000 BP. Our measurements on four Alia figures (#1419-21, #1437/38, #1583-85, #1589-92) give a range of 17%–21% NMn, suggesting ages around 2000 a BP, in agreement with an association with Himaic writings and previously published age estimates of around 2000–2500 (Arbach et al., 2015; Bednarik and Khan, 2005; Khan, 2013).
The human figures on horseback (e.g. see Figure 6c) show the lowest degree of revarnishing (NMn = 10.2 ± 3.5%, N = 7), and thus may represent the most recent rock art group (except for some very recent graffiti). Horses were present in Arabia since about 6000–5000 BP and were domesticated around 4000–3000 BP; their use became widespread around 2400 BP (Khan, 2007). In southern Arabia, however, horses were introduced only around 2000 BP and became common around the 4th century CE (Arbach et al., 2015; Olsen, 2013; Robin and Gorea, 2016). The horses in our images are shown in a galloping style, where the front and hind legs form an arch. This style has been attributed to the Islamic period (Robin, 2018), which is consistent with the average age of about 1000 a suggested by our measurements. Even though they are often on the same rock panels with Alia-type females, there is no overlap in the degree of revarnishing between the horseback riders and the Alias, arguing against the association between the Alias and these warriors suggested by Macdonald (2012). It is possible, however, that existing Alia images were intentionally integrated into the fighting scenes, but that this had not been their original meaning.
Wusum
Wusum (singular wasm) are markings indicating tribal affiliation or property, and each tribe in Arabia has its own wasm. They have been in continuous use for the marking of cattle, camels, and tribal boundaries for thousands of years (Bednarik and Khan, 2005; Khan, 2013; McCorriston and Martin, 2010) and may have derived from cattle markings that can be seen on petroglyphs made as early as 7000–5500 BP (Khan, 2007). We made measurements on two wusum (#1452/53 and #1523/24) which gave NMn of 18% and 32%, corresponding to nominal ages of 1700 and 3100 a, respectively, and consistent with the long use of this type of marking in Arabia.
Measurements on two bullet holes allow us to highlight some of the problems associated with deriving age estimates from the revarnishing measurements. Firearms were only introduced at the beginning of the 15th (Aksoy, 2017) to 16th century (Elgood, 1995; Guagnin et al., 2017) in Saudi Arabia, and therefore, only ages less than 600–700 years are to be expected for the bullet holes frequently seen on rock art panels. One of the bullet holes measured (#1500-01) shows a nominal age of 380 ± 120 BP, using the NMn growth rate. If we apply the mean DMn growth rate of 13.4 ng cm–2 a–1, we obtain a similar age (420 a), albeit with a larger and difficult-to-quantify uncertainty. In contrast, the other bullet hole (#1562-63) yields an obviously unreasonable NMn ‘age’ of 1400 a. Interestingly, if one calculates an ‘age’ using the DMn growth rate, one obtains a more reasonable value of about 500 a. First of all, the two measurements on this bullet hole varied by almost a factor of two (10% and 19% NMn), indicating that more measurements should have been made to detect a potential outlier. The second issue here is that the actual Mn areal densities at this site were rather low, even for the intact varnish, so that the measurement error becomes an issue, especially with recently bared surfaces. Third, there is the question whether the intact varnish surface used for the calculation of NMn is truly representative for the Mn accumulation rate on the regrowth surface. In the present case, the ‘initial varnish’ measured close to the bullet hole is located beneath a slight overhang, while the bullet hole is not sheltered. Furthermore, the difference in inclination between the rock face and the surfaces of the bullet hole may play a role, and the shattering of the rock by the bullet impact may also have altered the porosity of the sandstone. The DFe and NFe values of the bullet holes are also exceptionally high, indicating an unusual deposition environment. Finally, there is the possibility of a more rapid initial accumulation rate in the first few decades of revarnishing, which had already been suggested by the Mn values found on some 40–50 a old graffiti in our Ha’il study. A similar problem had been encountered by McNeil (2010), who measured Mn accumulation rates of 56–76 ng cm–2 a–1 on 40–50 a old graffiti in Utah. Using these high rates to estimate the ages of nearby petroglyphs yielded unreasonably low age values. Unfortunately, we did not have a chance to test this possibility at Hima as we did not find any suitable recent graffiti with dates. Relatively fast initial varnish formation had also been found in some experiments by Krumbein and Jens (1981) and in the upper few microns of varnish samples from New Mexico (Spilde et al., 2013). This phenomenon could introduce a bias toward older apparent ages in relatively young petroglyphs. More measurements on dated young varnish surfaces are needed to resolve this issue.
It follows from these considerations that Mn revarnishing measurements are not generally appropriate for deriving an ‘age’ for an individual petroglyph, but are more suitable for estimating an age range for a particular type of image or inscription, such as the ‘Alia’ figures or the mounted warriors. Also, it is important to obtain a sufficient number of replicate measurements on the petroglyph and intact varnish to avoid outliers. Finally, the most reliable measurements are obtained when the surrounding intact varnish has a relatively high and homogeneous Mn areal density.
Another important problem with applying the degree of revarnishing as an indication of age is not related to the measurement technique as such but to what activity the measured surface actually represents: the initial creation of the image or later reworking of that same image. There are frequent examples where an older image has been reworked at a later age (e.g. Francis and Loendorf, 2004; Guagnin et al., 2015; for examples from Hima, see Robin, 2018). The NMn measurement will then reflect the varnish regrowth since the time of reworking or, if the older varnish has not been fully removed during reworking, an intermediate amount of regrowth. Often, this issue can be avoided by inspecting the petroglyph visually for signs of reworking. In some cases, such as the lion of Shuwaymis, measurements on reworked surfaces and remnants of the original image can even be used to estimate the times of both the initial creation and of ancient reworking of an image (Macholdt et al., 2018).
Summary and conclusion
The mean Mn areal density, DMn, of the intact rock varnish in the Hima region is about one-third higher than what we had measured previously in the Ha’il region (Jubbah, Jabal Yatib, and Shuwaymis) in NW Saudi Arabia. The results from both regions fall into the same range as the densities measured on Holocene and Pleistocene rock surfaces in the Mojave Desert of California (Reneau, 1993). In contrast, the mean Fe areal density of the Hima varnish was almost twice that in the Ha’il region. A plot of the Fe versus Mn surface densities from the two regions reveals a significant Fe intercept at zero Mn. This intercept may represent an iron oxyhydroxide layer at the rock-varnish interface, which also has been visually observed in the field and which may function as catalyst promoting abiogenic Mn oxidation (Goldsmith et al., 2014; Macholdt et al., 2018). Further studies on this issue are underway.
Rock varnish samples from the Hima region were investigated by fs LA-ICP-MS, which confirmed that the varnish belongs to the group of Type I varnish (Macholdt et al., 2017b) typically found in arid desert environments. The relatively low Mn concentration and Mn/Fe ratio in our varnishes are also consistent with their formation under quite dry conditions (Broecker and Liu, 2001; Dorn and Oberlander, 1982; Liu, 2003; Liu et al., 2000). Aeolian mineral dust collected adjacent to the varnishes revealed negative Ce anomalies in the dust fine fraction, corresponding to untypically weak positive Ce anomalies in the rock varnishes from these locations. This observation is indirect evidence that the fine-grained mineral dust is the source of the rock varnish REE content, and thus presumably also the source of various other cations, particularly Mn, that were leached from the clay fraction.
In NW Saudi Arabia, we had found that an Fe-rich layer is present below the Mn-rich varnish. This initial coating was interpreted to act as a catalyst for Mn2+ oxidation to Mn4+, since the un-catalyzed oxidation of Mn is very slow, even in oxic environments. A similar Fe-rich layer was found below the petroglyphs in the Hima region, where the initial Fe accumulation before the first Mn oxidation appears to be even higher. One may speculate that the Fe-rich layer observed at the varnish-rock interface is the remnant of a Pleistocene Fe-crust. The hyper-arid conditions in Arabia during the Pleistocene may have prevented the formation of a Mn-oxide enriched varnish (Dorn et al., 2013; Dorn and Oberlander, 1982), while erosion may have removed Mn-rich varnishes from earlier periods. The present-day rock varnishes would then only have begun to form when semiarid to humid conditions developed in the early Holocene.
To estimate the Mn and Fe accumulation rates in the varnish of our study region, we used measurements of the Mn and Fe areal densities on inscription surfaces of known ages. We found Mn accumulation rates averaging 13.4 ng cm–2 a–1 and ranging between 3.5 and 25 ng cm–2 a–1. These rates were quite similar to those in our previously published study from NW Arabia, even though the sites are about 1100 km apart. They also fall into the same range as the Holocene Mn accumulation rates (9–40 ng cm–2 a–1) in desert varnish from the Mojave Desert, California, that can be calculated from measurements by Reneau (1993).
In order to mitigate the spatial variability in the Mn accumulation rate, we calculated a normalized rate or degree of varnish regrowth by dividing the varnish density in the petroglyphs by that in the adjacent intact varnish. This significantly reduces the variability of the measurements within the inscriptions of the same script type, and yields a mean value of 10.4% ka–1 (range = 6.4–12.7% ka–1) for the revarnishing rate. Based on this rate, we calculated nominal age estimates for the petroglyphs measured in our study region.
Overall, the petroglyphs in the Hima region show a lower degree of revarnishing than those in NW Saudi Arabia, and are thus likely confined to a younger age range. Only two humanoid images suggest an age reaching into the Holocene wet period. For most petroglyphs, the estimated ages are within the time spans expected based on cultural or ecological considerations. Most petroglyphs in the Hima region were engraved after the change from a wet to a dry climate, thus, when caravan routes started to cross the country, consistent with the fact that the site is located on an ancient caravan route. We agree with Bednarik (2017) and Robin and Gorea (2016) that a very large fraction of the petroglyph images stems from the literate period, including some of the oxen.
Many authors have cautioned against the use of varnish thickness as an age indicator (e.g. Bednarik, 2010; Dorn and Oberlander, 1981; Francis and Loendorf, 2004; Liu and Broecker, 2000; Robin, 2018). Yet, most of the same authors have used the relative level of revarnishing, observed visually or by optical measurement as a measure of relative age. And, indeed, on a given surface, there must be some relationship between the degree of varnish regrowth and age, because a petroglyph surface has by definition zero regrowth at the moment of its creation and will progress toward a varnish density similar to the surrounding intact varnish, given enough time. The main obstacle to using this regrowth as a measure of age is the variability of varnish development in space and time. In Table 2, we have summarized the numerous factors other than time, which can affect the rate of varnish formation and which should be considered when interpreting varnish thickness as an indicator of varnish age. We have shown that the use of reference measurements on adjacent intact varnish helps mitigate the problems caused by spatial variability. Such reference measurements must be made as close as possible to those inside the petroglyphs, not just on nearby rocks, as was done by Bard (1979). Essentially, this corresponds to a quantitative version of the commonly used visual estimate of relative varnish regrowth within a given panel. It is also analogous to the colorimetric technique described by Bednarik (2009), who found ‘… fairly good consistency [of his color index] when plotted by age, raising the possibility of using this method for dating petroglyphs…’. In-situ measurements by pXRF allow a large number of measurements, which is essential in view of the variability of the Mn areal density. Furthermore, measurements of the Mn areal density are more likely to produce a useful age estimate than the approach of Bard (1979), who measured the Mn/Fe ratio on varnish/rock samples or the Mn concentration in scraped varnish samples.
Factors other than time known to influence manganese regrowth on petroglyphs.
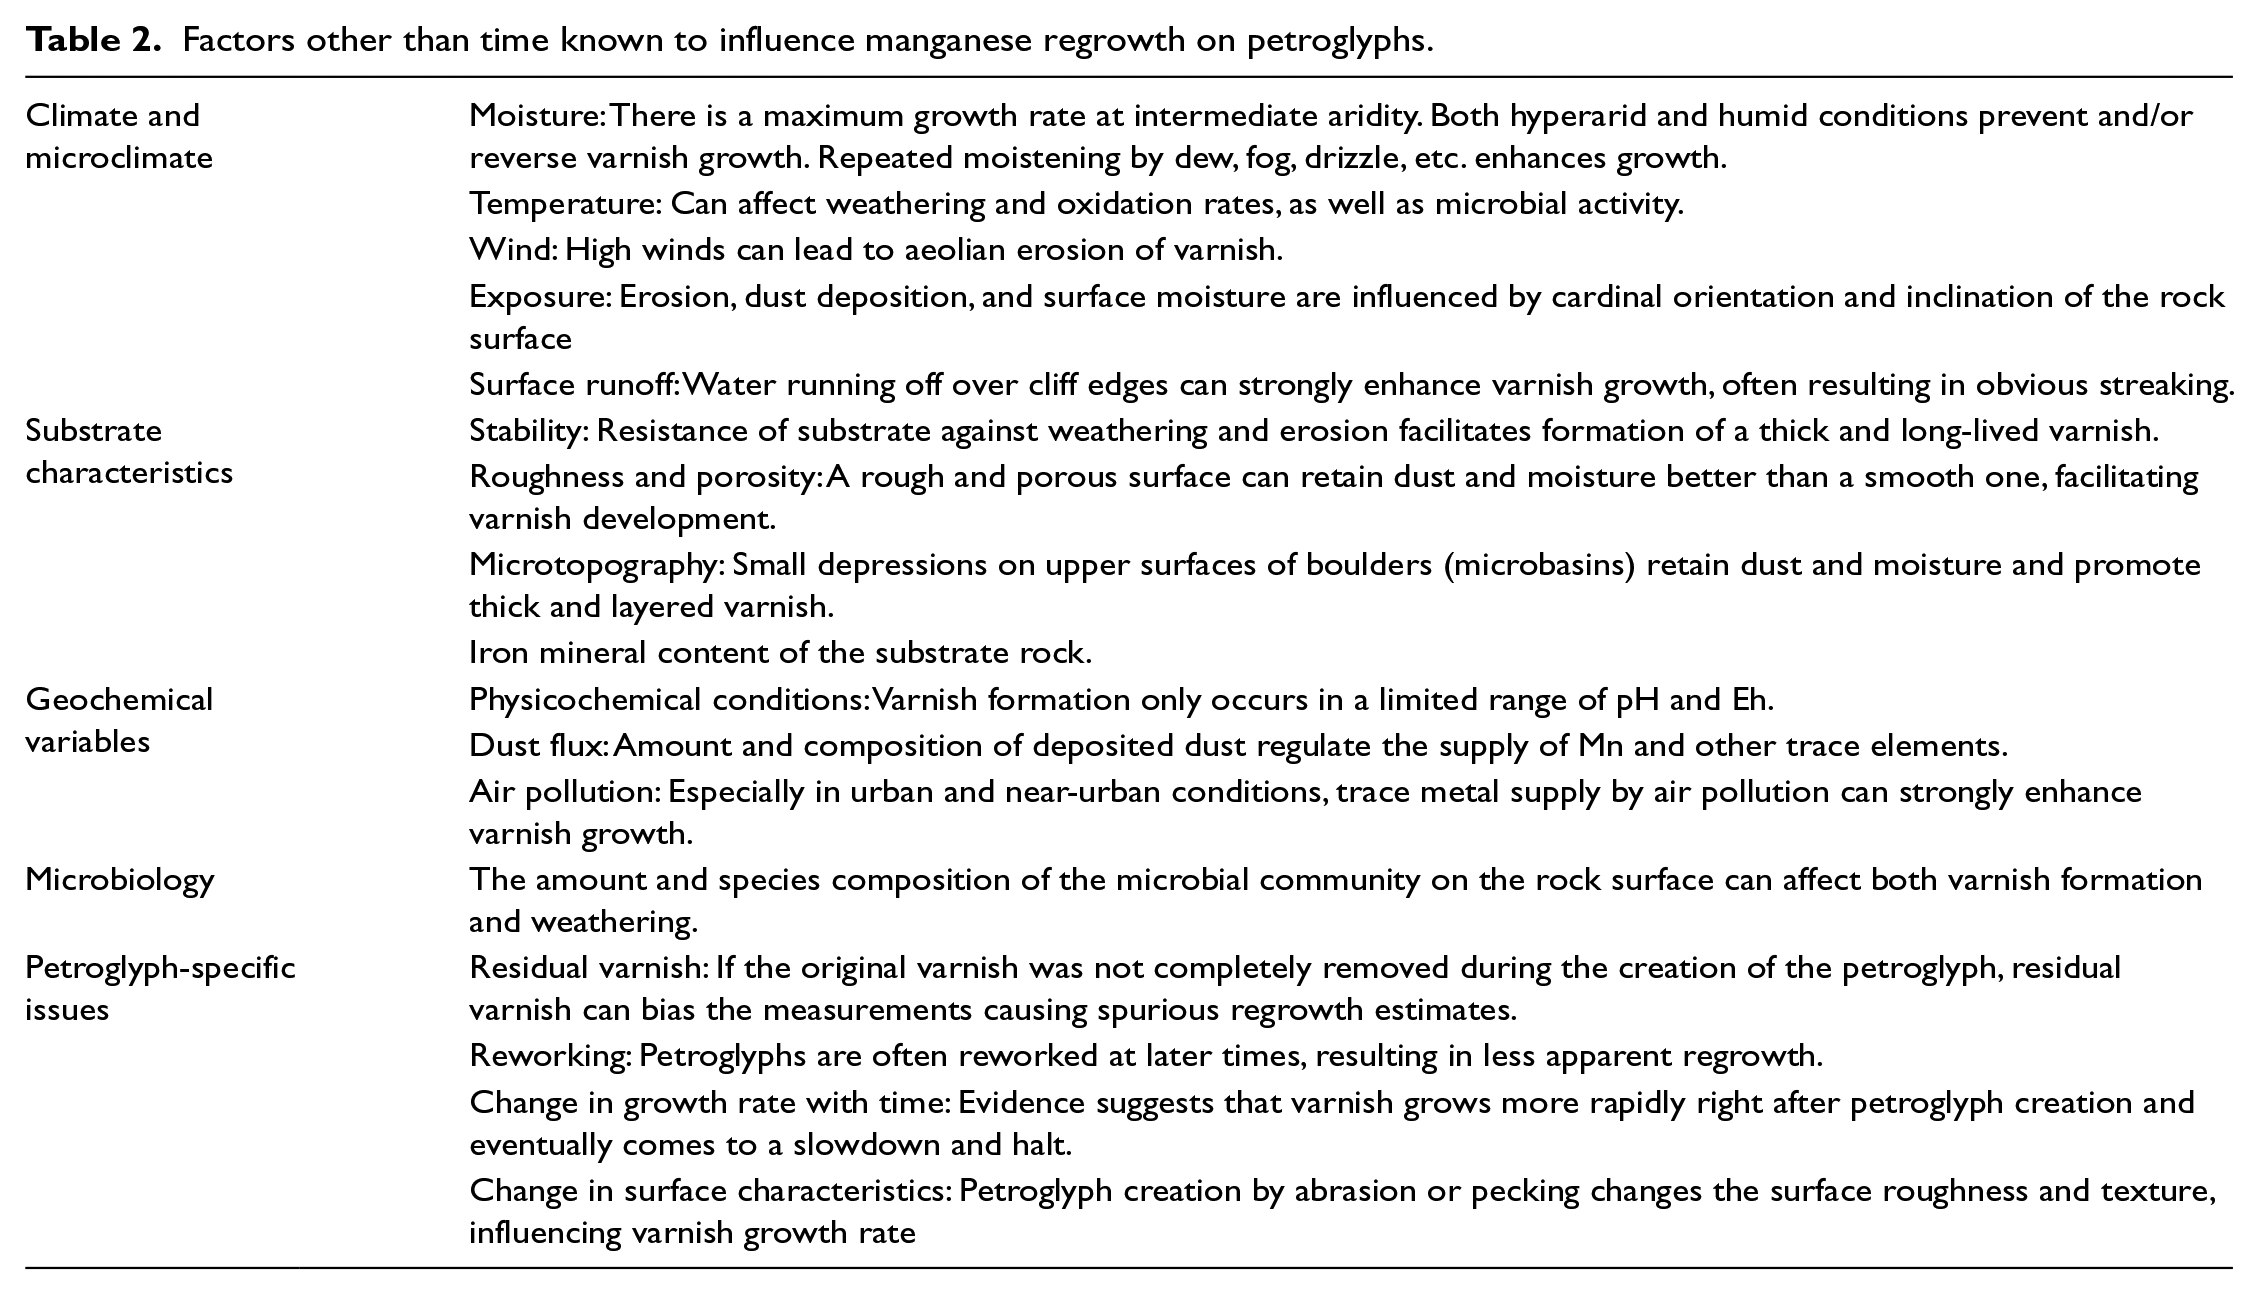
Temporal variations of the varnish growth rate are a further complication, as there is ample evidence that somewhat moister climates favor Mn deposition. On the contrary, in our study in the Ha’il area, where we measured on rock art that on cultural grounds could be dated as going back into the early Holocene, we did not see evidence for a detectable variability of the growth rate at the millennial scale. Obviously, at long end of the time scale to which our technique may be applicable, the clock will slow to a halt, as the varnish density in the petroglyphs approaches that of the surrounding intact varnish. At that point in time, the varnish reaches its maximum areal density when it either becomes detached from the rock surface by spallation (the ‘taphonomic limit’; Bednarik, 2012; Bednarik and Khan, 2005) or becomes limited by a balance between varnish formation and erosion. Bednarik and Khan (2005) estimated that this taphonomic limit is reached at about 8000 years on sandstone surfaces in Arabia, with variations depending on exposure, the local climate, and the quality of the sandstone. Our previous work in the Ha’il area suggested that this may occur somewhere at around 10,000–20,000 years of age. At the youngest end of the time scale, on the contrary, there is evidence for rapid initial varnish formation, which may bias age estimates of the order of a few centuries. Thus, a linear growth model is not likely to be applicable to very young and very old surfaces, and more measurements on dateable surfaces at either end of the age scale are needed to address these issues.
Where independently dated calibrations points are available, such as dated inscriptions or archeologically or culturally dateable petroglyphs, the indications of relative age obtained by the Mn areal density measurements can be turned into quantitative age estimates. At present, these estimates must be considered rough and experimental, and in view of the variability of varnish formation, we feel that our approach is not suitable to ‘date’ an individual petroglyph, but rather to establish a time frame for the age of a group or type of rock art. Nevertheless, in view of the scarce alternatives, we feel that it can serve as a useful addition to the toolkit of rock art studies. Importantly, the in-situ pXRF measurements do not require the collection of samples, which is generally not desirable and often even not permissible on the culturally valuable rock art.
Supplemental Material
Macholdt-HimaPetroglyphs-Suppl-2019_v8.2 – Supplemental material for Rock varnish on petroglyphs from the Hima region, southwestern Saudi Arabia: Chemical composition, growth rates, and tentative ages
Supplemental material, Macholdt-HimaPetroglyphs-Suppl-2019_v8.2 for Rock varnish on petroglyphs from the Hima region, southwestern Saudi Arabia: Chemical composition, growth rates, and tentative ages by Dorothea S Macholdt, Klaus Peter Jochum, Abdullah Al-Amri and Meinrat O Andreae in The Holocene
Footnotes
Acknowledgements
We thank Mohammed Al-Horaish for his help during the field measurements in Saudi Arabia. We acknowledge the permission by the Saudi Commission for Tourism and National Heritage to conduct the work at the field sites and their local staff, especially Saleh al-Marih and Saad Muhammad al-Fetaih, for help and support during our fieldwork. We also thank Antje Sorowka for the thick section preparation and Brigitte Stoll and Ulrike Weis for the support at the ICP-MS instrument. We are grateful to Peter Stein and Christian Robin for help with the interpretation of the ASA, Himaic, and Old Arabic scripts, and to R. Dorn and R. Bednarik for comments on earlier versions of this paper. This work was funded by the Max Planck Society of Germany and King Saud University, Saudi Arabia.
Funding
The author(s) received no financial support for the research, authorship, and/or publication of this article.
Supplemental material
Supplemental material for this article is available online.
References
Supplementary Material
Please find the following supplemental material available below.
For Open Access articles published under a Creative Commons License, all supplemental material carries the same license as the article it is associated with.
For non-Open Access articles published, all supplemental material carries a non-exclusive license, and permission requests for re-use of supplemental material or any part of supplemental material shall be sent directly to the copyright owner as specified in the copyright notice associated with the article.