
Abstract
This paper offers a comparative study of land use and demographic development in northern and southern Greece from the Neolithic to the Byzantine period. Results from summed probability densities (SPD) of archaeological radiocarbon dates and settlement numbers derived from archaeological site surveys are combined with results from cluster-based analysis of published pollen core assemblages to offer an integrated view of human pressure on the Greek landscape through time. We demonstrate that SPDs offer a useful approach to outline differences between regions and a useful complement to archaeological site surveys, evaluated here especially for the onset of the Neolithic and for the Final Neolithic (FN)/Early Bronze Age (EBA) transition. Pollen analysis highlight differences in vegetation between the two sub-regions, but also several parallel changes. The comparison of land cover dynamics between two sub-regions of Greece further demonstrates the significance of the bioclimatic conditions of core locations and that apparent oppositions between regions may in fact be two sides of the same coin in terms of socio-ecological trajectories. We also assess the balance between anthropogenic and climate-related impacts on vegetation and suggest that climatic variability was as an important factor for vegetation regrowth. Finally, our evidence suggests that the impact of humans on land cover is amplified from the Late Bronze Age (LBA) onwards as more extensive herding and agricultural practices are introduced.
Introduction
Changing human population levels exhibit a close connection with human impacts on the landscape (Ellis et al., 2013; Hughes et al., 2018; Kok et al., 2016). Despite this general relationship, societal trajectories are often complicated, non-linear and imprinted in the archaeological, historical and environmental record in diverse ways. In order to make better sense of socio-ecological trajectories, we advocate multi-proxy approaches and interdisciplinary communication (Izdebski et al., 2016). This paper offers a regional case study drawing upon three main datasets from mainland Greece: archaeological radiocarbon dates, published fossil pollen core assemblages and settlement evidence derived from archaeological field surveys (Figure 1). We use this information to compare and contrast the histories of northern and southern Greece, respectively, from the Neolithic to the Byzantine period (8650‒746 BP; Table 1; all dates given as BP represent calibrated calendar years before present, where ‘present’ is defined as AD 1950). The compilation and combined analysis of the radiocarbon dates is the first ever published for Greek material, and while palynology has a longer research history in the region, its scale of aggregation here is a further novel contribution. The compilation of settlement data from the Peloponnese and Macedonia also provides fresh insight both about the particularities of each sub-region and about consistencies visible across Greece as a whole.
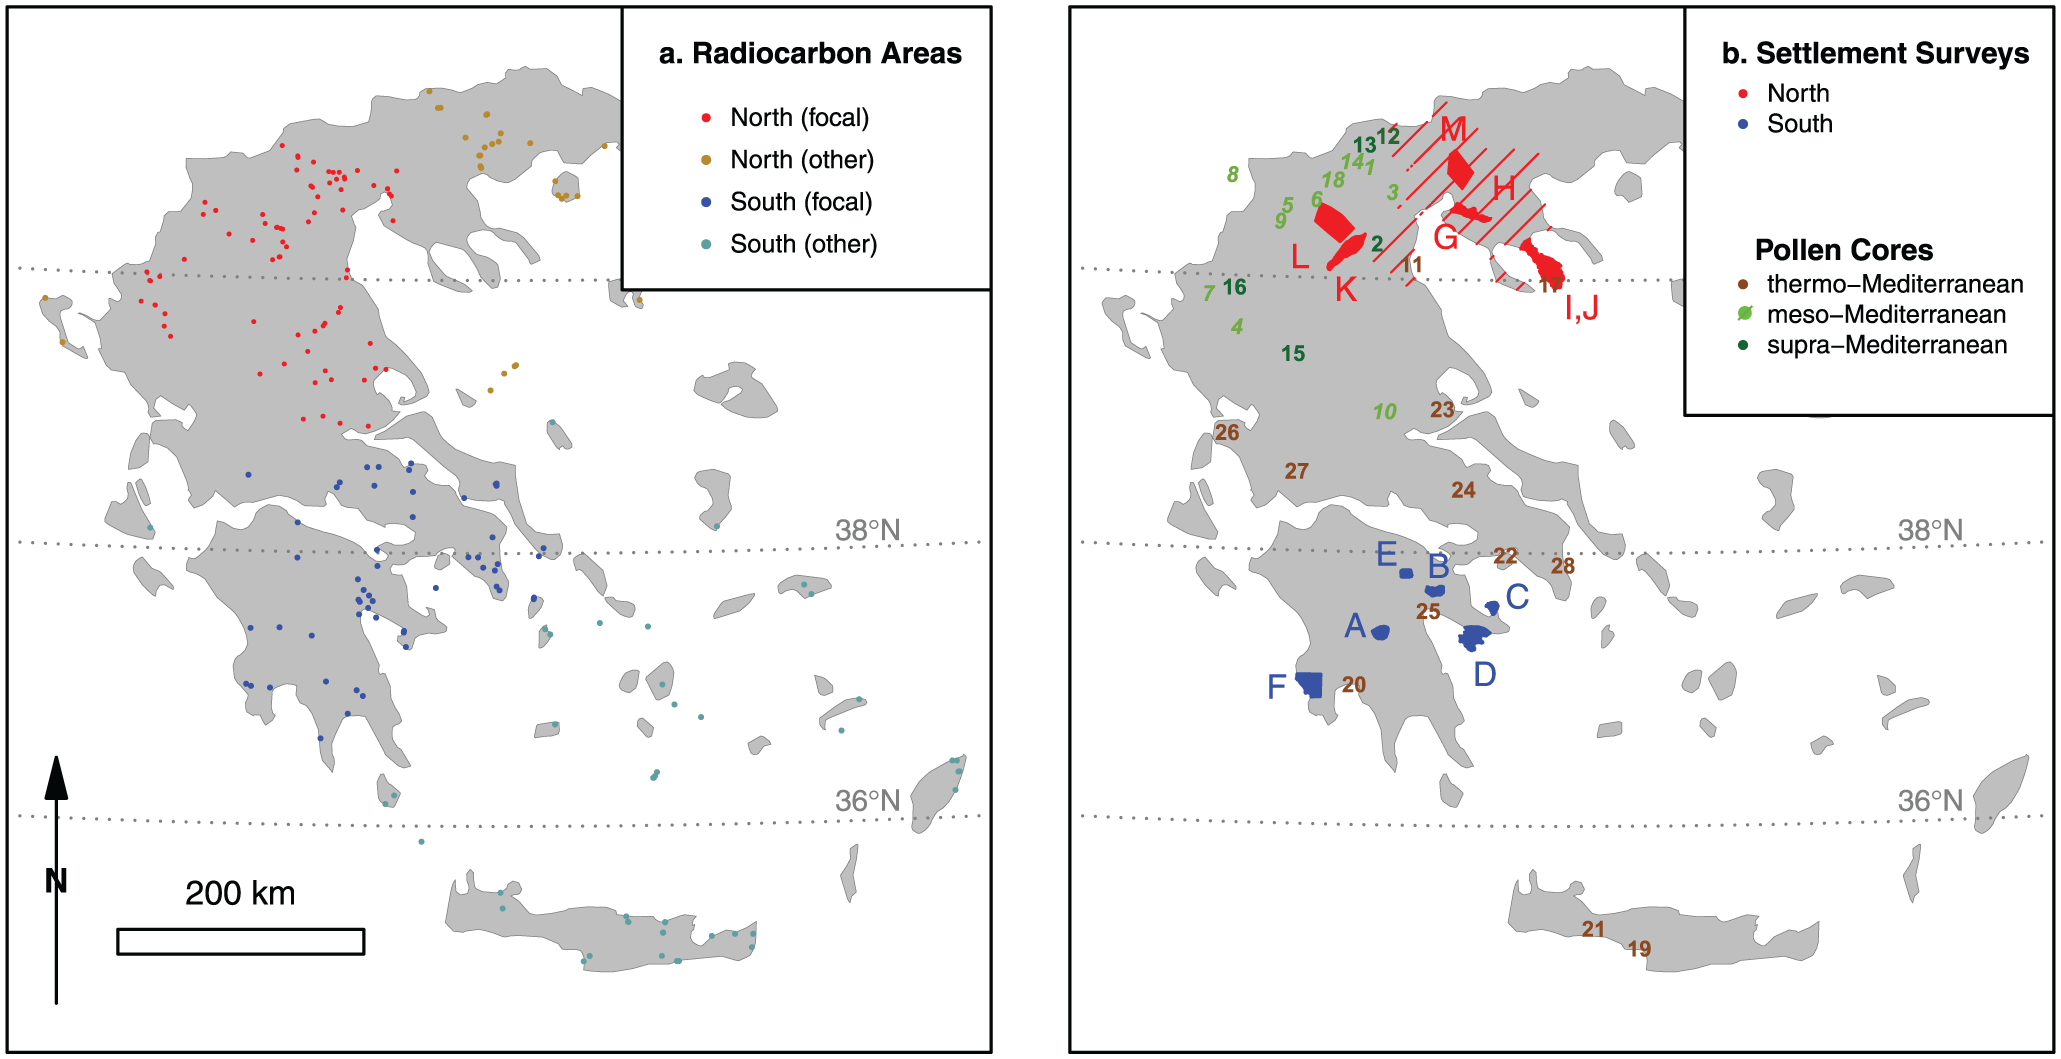
Distribution maps of (a) archaeological radiocarbon dates from Greece and (b) major settlement surveys, pollen surface samples and fossil cores sites. Pollen: (1) Edessa, (2) Flambouro-Pieria mountains, (3) Giannitsa, (4) Ioannina, (5) Kastoria, (6) Khimaditis, (7) Lake Gramousti, (8) Lake Maliq, (9) Lake Orestiás, (10) Lake Xinias, (11) Litochoro, (12) Mount Paiko, (13) Mount Voras, (14) Nisi Fen, (15) Pertouli, (16) Rezina marsh, (17) Tristinika, (18) Vegoritis, (19) Aghia Galini, (20) Akovitika, (21) Asi Gonia, (22) Elefsis, (23) Halos, (24) Kopais, (25) Lake Lerna, (26) Lake Voulkaria, (27) Trikhonis, (28) Vravron. Surveys: (A) Asea Valley, (B) Berbati-Limnes, (C) Methana, (D) Southern Argolid, (E) Phlious Valley, (F) Pylos region, (G) Anthemountas, (H) Central Macedonia, (I,J) Sithonia, (K) Aliakmon, (L) Kitrini Limni, Kozani, (M) Langadas. For further information and references, see Supplementary Tables 1-3.
Approximate absolute chronology used in the present paper for the study region as a whole, with the associated relative cultural phases and their abbreviations used in the text.
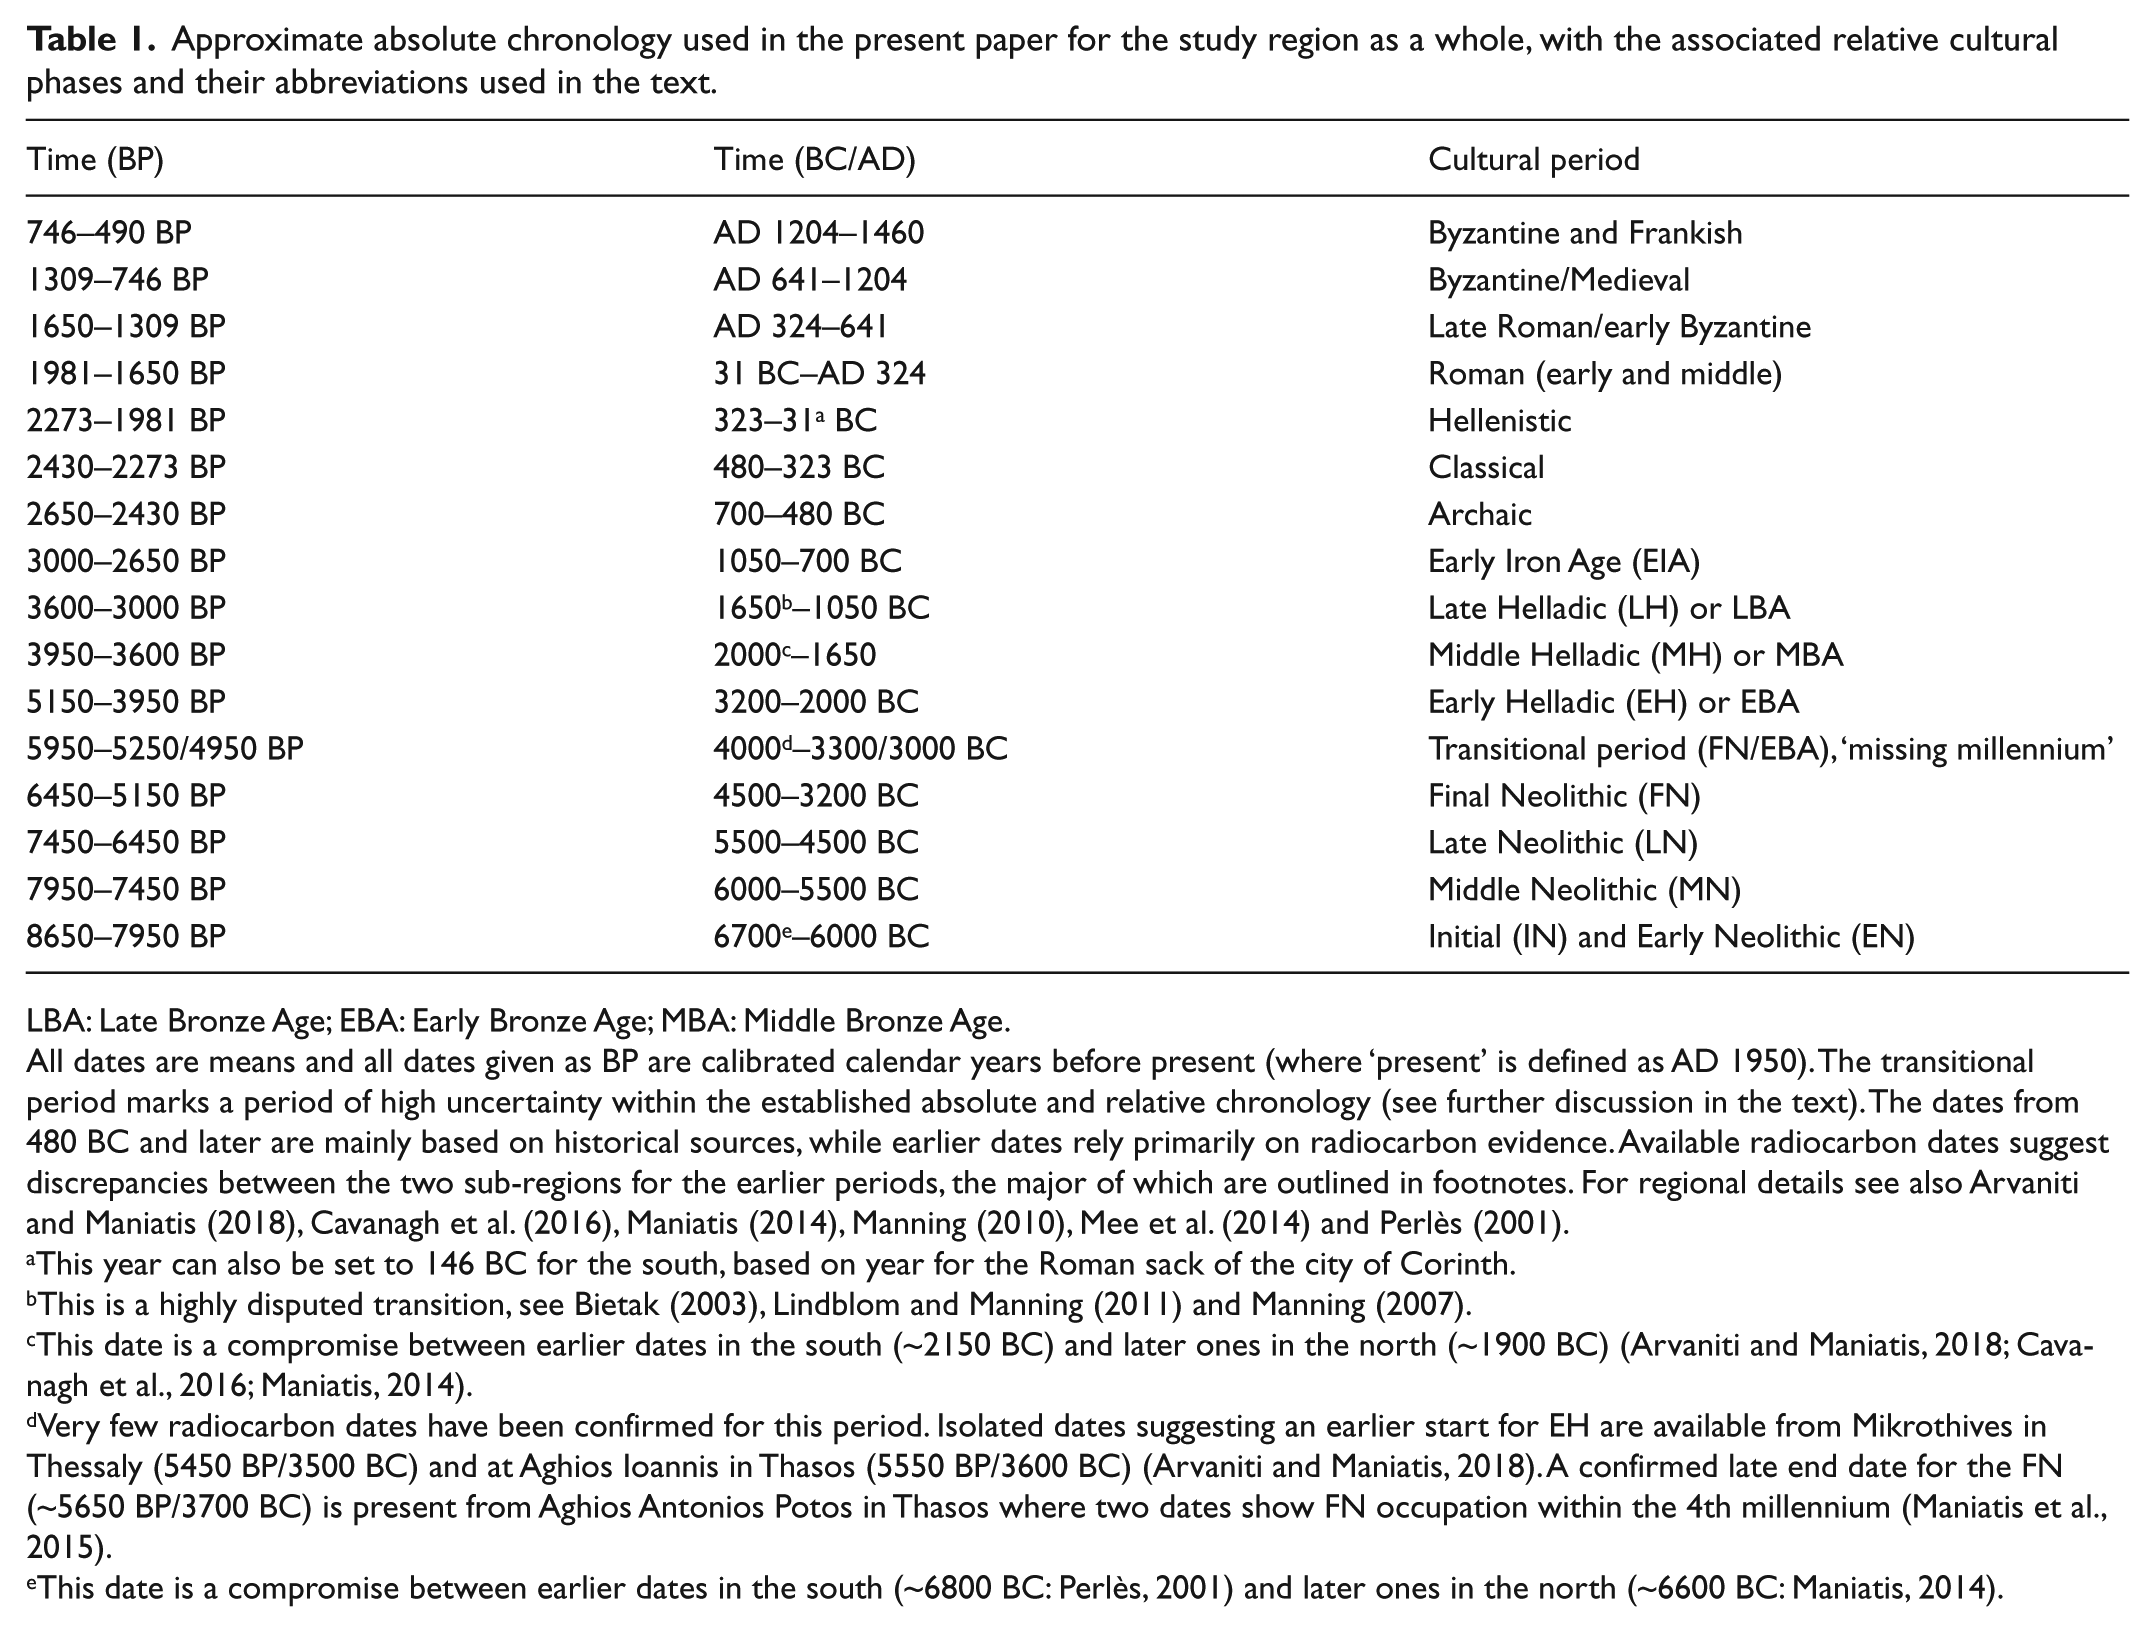
LBA: Late Bronze Age; EBA: Early Bronze Age; MBA: Middle Bronze Age.
All dates are means and all dates given as BP are calibrated calendar years before present (where ‘present’ is defined as AD 1950). The transitional period marks a period of high uncertainty within the established absolute and relative chronology (see further discussion in the text). The dates from 480 BC and later are mainly based on historical sources, while earlier dates rely primarily on radiocarbon evidence. Available radiocarbon dates suggest discrepancies between the two sub-regions for the earlier periods, the major of which are outlined in footnotes. For regional details see also Arvaniti and Maniatis (2018), Cavanagh et al. (2016), Maniatis (2014), Manning (2010), Mee et al. (2014) and Perlès (2001).
This year can also be set to 146 BC for the south, based on year for the Roman sack of the city of Corinth.
This is a highly disputed transition, see Bietak (2003), Lindblom and Manning (2011) and Manning (2007).
This date is a compromise between earlier dates in the south (~2150 BC) and later ones in the north (~1900 BC) (Arvaniti and Maniatis, 2018; Cavanagh et al., 2016; Maniatis, 2014).
Very few radiocarbon dates have been confirmed for this period. Isolated dates suggesting an earlier start for EH are available from Mikrothives in Thessaly (5450 BP/3500 BC) and at Aghios Ioannis in Thasos (5550 BP/3600 BC) (Arvaniti and Maniatis, 2018). A confirmed late end date for the FN (~5650 BP/3700 BC) is present from Aghios Antonios Potos in Thasos where two dates show FN occupation within the 4th millennium (Maniatis et al., 2015).
This date is a compromise between earlier dates in the south (~6800 BC: Perlès, 2001) and later ones in the north (~6600 BC: Maniatis, 2014).
Study areas
The climate of Greece exhibits transitional characteristics, with vegetation zone characteristics ranging from thermo-Mediterranean to meso-Mediterranean with even supra-Mediterranean (continental) conditions in some areas (Figure 1b; for a definition of the vegetation zones, see Luterbacher et al., 2012; Quézel and Médail, 2003), driven mainly by significant differences in the distribution of temperature and precipitation. The highly variable physiography of the Balkan peninsula adds further marked dissimilarities between not only the north and the south of Greece but also between the west and east coasts, or the plains and the mountains (Maheras and Anagnostopoulou, 2003; Xoplaki et al., 2000: 133–137). Precipitation primarily falls during winter and is mostly associated with eastward tracking cyclones. This eastward transport of moist air in combination with a north-south trending mountain range results in overall wetter conditions in western Greece and more arid conditions in eastern Greece. In addition, latitudinal differences lead to generally cooler conditions in the north versus the south.
For the present study, the northern sub-region covers primarily Thessaly as well as western and central Macedonia, and the southern sub-region is constituted by Boeotia, Attica and the Peloponnese. The division allows good overlap between available radiocarbon dates, pollen assemblages and site data and facilitates comparisons between datasets. Although no division is without grey-zones, this north-south division reflects general differences in bioclimatic conditions of the pollen cores (Figure 1b), a common division of archaeological and historical research and broad cultural-historical differences (e.g. Bintliff, 1997; Cline, 2010; Kotsakis, 2014). It would be useful to extend the geographical scope in the future, but Eastern Macedonia and Thrace as well as Crete and the Cycladic islands have not been considered as part of our core case studies because of data limitations, although they are incorporated as important supplementary reference points, especially for the radiocarbon densities.
Even with our chosen division into northern and southern Greek case studies, inevitably the narrative offered below must adopt a ‘broader brush’ than most archaeological and historical research in the region, both in terms of spatial and temporal resolution. Greece is a highly fragmented landscape that tends not to be suited to blanket analyses, with the effect that research is often compartmentalised into more detailed projects (e.g. Cline, 2010). Both of our chosen sub-regions lump a significant amount of variability, in terms of diverging societal trajectories as well as research emphasis. While the Neolithic ‘tell’ societies have been a long-standing focus in the archaeology and the environmental sciences of northern Greece (Glais et al., 2016; Karkanas et al., 2011; Kotsakis, 1999), studies of Neolithic southern Greece are few, by comparison, with those of the Bronze Age and especially the Late Bronze Age (LBA) societies standing out. These circumstances are to large part reflective of broader biases in archaeological visibility, that is, the prevalence of sites and their monumentality or the varying diagnosticity of material culture across the different regions and periods. Methodological differences between regions can also be noted, such as a generally greater prevalence of archaeobotanical and archaeozoological analyses in the north (especially over the last 20 years, for example, Nitsch et al., 2017; Valamoti, 2004), in contrast to the emphasis on intensive archaeological field surveys in the south (Alcock and Cherry, 2004). An important focus in the north has furthermore been on the social landscape of individual settlements (see reviews by Andreou, 2010; Kotsakis, 2014). In contrast, there has been a rising number of human–environmental analyses over the last 5–10 years in both sub-regions, constituting an expanding body of research into social-ecological trajectories across Greece (e.g. Izdebski et al., 2016; Lespez et al., 2016; Weiberg et al., 2016).
Material and methods
Radiocarbon summed probability distributions
Aggregate sets of radiocarbon dates have become an important, high temporal resolution proxy for changing levels of human activity over time, despite continuing fierce debate about the biases they might carry with them (Palmisano et al., 2017; Timpson et al., 2014). We have extracted lists of Greek dates from Reingruber and Thissen (2005), Weninger (2017: CALPAL), Hinz et al. (2012: RADON), Manning et al. (2015: EUROEVOL), Brami and Zanotti (2015), Centre de Datation par le Radio Carbone de Lyon (CDRC) (2016: Banadora), the 14SEA Project (Reingruber and Thissen, 2016) and the ORAU (2016) date lists. We have further used the original publications to find new dates or check, enhance and georeference those already listed by others. For this paper, we sum the radiocarbon probability distributions of individual dates and anticipate that higher sums will indicate, on average, more human activity (and hence by inference probably higher population) in a given period of time. Where there are higher levels of radiocarbon sampling for certain chronological phases and/or certain sites (e.g. because of biases in research interests), these can be addressed by grouping dates within a few years of each other (for this paper, those within 50 uncalibrated years of each other from the same site) and re-scaling the result by the number of dates (before summing for all sites). In our case, across all of Greece for instance, 2143 dates have been summed across 210 sites into 1074 site bins (Figure 1a and Supplementary Table 1, available online), excluding those dates that exhibit poorly understood reservoir effects (e.g. all shells) or that do not have plausible anthropogenic causes (e.g. most dates from environmental cores/profiles).
Following previous work (Weninger et al., 2015) demonstrating that normalised calibrated dates can produce abrupt, artificial peaks in SPDs at steep portions of the radiocarbon calibration curve (particularly late Pleistocene/earlier Holocene time series, for example, Roberts et al., 2018; note that throughout we have used IntCal13, Reimer et al., 2013), we have preferred to sum unnormalised distributions. In order to test these radiocarbon SPDs for meaningful departure from what we might expect by chance, the two complementary approaches are (a) to compare the observed SPD with conditional-random sets of hypothetical dates produced according to a theoretical null model of population change (Bevan and Crema, 2018: modelTest, ‘uncalsample’; for the original approach and slightly different implementations, see Shennan et al., 2013; Timpson et al., 2014) and (b) to compare the SPD of a sub-set of dated samples (e.g. from a geographical sub-region A) to a simulated set of random dates drawn either from a second sub-set or the entire parent set (e.g. either region B or all regions in the dataset, see Crema et al., 2016). In the first case, we fit a theoretical model of demographic change (exponential in this case, but alternatively logistic or uniform, for example) to the observed data on the calendar scale (adjusting for the assumption of a uniform distribution: Bevan and Crema, 2018: modelTest), then back-calibrate the expected population intensity before simulating a set of conventional radiocarbon ages (equal to the number of observed dates) proportional to the resulting per-14C year amplitude. These hypothetical samples are then calibrated and summed. The same process is repeated many times (e.g. 1000) to provide a global goodness-of-fit test and 95% critical envelope. In the second case, we hold constant the measured age of the observed samples, but simply shuffle the label identifying which geographic region the sample comes from.
Pollen assemblages and cluster analysis
The pollen count data used in this study were obtained from the European modern (Davis et al., 2013) and fossil pollen databases (European Pollen Database (EPD) version: October 2017: Leydet, 2007–2017). Descriptions of the methodological approaches developed and applied to the pollen datasets is provided by Woodbridge et al. (2018) and Fyfe et al. (2018). Pollen sequences with reliable chronologies (Giesecke et al., 2014) were selected for analysis. The pollen count data from each site were summed into 200-year time windows and analyses were applied to the entire Mediterranean region (Roberts et al., this volume) in order to identify key vegetation types. Analyses for a sub-set of 33 pollen assemblages are presented in this paper, divided into the north (21 sequences) and south sub-regions (12 sequences) across 28 sites (Figure 1b and Supplementary Table 2, available online).
An unsupervised data-driven approach was used to assign pollen samples to vegetation cluster groups based on the similarity of their taxa assemblages using Ward’s hierarchical agglomerative clustering method (Ward, 1963) within the rioja R package (Juggins, 2015) (see Woodbridge et al., 2018, for a detailed description of the cluster analysis approach developed). The frequent and abundant pollen taxa were identified within each cluster group based on the median and interquartile range (IQR) of each taxon. Interpretive name descriptors were given to each vegetation cluster (see Woodbridge et al., 2018, for a discussion of the assigning of name descriptors). Vegetation cluster group changes were calculated as an average for all sites in Greece and within each sub-region and plotted stratigraphically. Analyses comprise the average arboreal pollen sum (AP), a sum of tree crop indicators (OJC: Olea, Juglans, Castanea) (Mercuri et al., 2013a), calculation of an anthropogenic pollen index (API: Artemisia, Centaurea, Cichorieae and Plantago, cereals, Urtica and Trifolium type) (Mercuri et al., 2013b) and a sum of pastoral indicators (Asteroideae, Cichorieae, Cirsium-type, Galium-type, Ranunculaceae and Potentilla-type pollen) (adapted from Mazier et al., 2006). An additional, regionally adapted pollen disturbance index is used to explore pastoral activities in the Balkan peninsula (PDI: sum of Centaurea, Cichorieae, Plantago, Ranunculus acris type, Polygonum aviculare type, Sarcopoterium, Urtica dioica type and Pteridium) (Kouli, 2015). The taxon Oleaceae was grouped with Olea in the OJC index; within our dataset the few occurrences of Oleaceae are most likely to represent poorly preserved Olea, and other taxa in the Oleaceae family are routinely identified separately (e.g. Fraxinus, Phillyrea or Jasminum). From here onwards this group is referred to as Olea. Juglandinae is grouped with Juglans in the OJC index. Juglandinae in pollen records from Greece include some sporadic (six in-total) grains of Carya or Pterocarya encountered in two of the pollen records, and thus are considered to represent Juglans.
Compilations of archaeological site data
Archaeological site data were assembled for comparative purposes and to test samples to evaluate population reconstructions based on the SPD results. In order to accomplish a good overlap between all records, the samples were chosen from within the SPD focal regions, which also correlate with the pollen locations (Figure 1b). Therefore, although archaeological survey data are available from the Cyclades as well as from Crete, their inclusion is beyond the scope of the present study. Within the sub-regions, we have aimed for similar-size and geographically coherent test samples with information from other regions used to complement discussions. Site data for the south were collected from eight intensive archaeological surveys in the Peloponnese, totalling 598 sites (2558 site phases; Supplementary Table 3, available online). 1 Few intensive surveys have been conducted in the north and the archaeological dataset used for the sub-region is therefore a combination of moderately intensive and extremely extensive survey datasets, totalling 637 sites (1270 site phases; Supplementary Table 3, available online). Although the number of sites is almost equal, the number of site phases (i.e. with each chronological phase at a site counted as one site phase) make evident the lower resolution generally produced by the extensive, non-systematic survey method in Macedonia. These differences in resolution will inevitably effect the comparisons between the north and south and should therefore be kept in mind when interpreting the results.
For over a century, archaeological site surveys have provided significant new data on developing settlement structures. However, differences in field-based methods, ceramic visibility and site identification criteria can make comparisons between datasets and between periods complex and sometimes problematic (Alcock and Cherry, 2004; Bintliff and Sbonias, 1999; Palmisano et al., 2017). Major points of concern for the present paper are the level of certainty of the assignment of a site to a specific period, variation in site sizes across time, the contemporaneousness of sites assigned to a period of long duration (e.g. the EH II period: 4850‒4150 BP), and different chronological distinctions used by individual researchers. These issues are probably further exaggerated by the fact that most of the data for the south derive from fully published intensive surveys, while the Macedonian data derive to a large extent from non-systematic surveys, summarily or preliminarily published. In order to address these issues, we present three perspectives on the site data from the sub-region using methods presented in more detail by Palmisano et al. (2017). First, if we assign a relative confidence between 0 and 1 to each site expressing our confidence that it belongs to a particular period, we can calculate at least three different ‘counts’. This includes a maximal version ignoring any uncertainties in our dating and counting all possible sites, a minimal version counting only sites that definitely are in use, and a compromise approach that weights the count by a confidence value assigned to whether the site really has activity in that period. Second, information on site sizes are illustrated using the same three uncertainty levels. As a final guide, we calculate the aoristic sum of the overall site data in which each site’s contribution to the overall count is decided by the length of the timespan of the relative chronological period to which a site has been assigned.
Results
Radiocarbon
The SPD presented here is the first region-wide assessment assembled for Greece, although regional models for the north, south and the islands have been attempted (Arvaniti and Maniatis, 2018). A preliminary caveat to note is that, while the overall sample of archaeological radiocarbon dates is adequate for attempting the kind of population modelling offered here, it is by no means as substantial as the data available in other regions (e.g. north-west Europe: Bevan et al., 2017). There are also far fewer dates covering the period after about ~2500 BP, largely because there is no strong academic tradition of collecting radiocarbon dates to address Classical Greek to modern research questions. We therefore restrict our use of aggregated radiocarbon dates as a population proxy to the Mesolithic-EIA timespan and address trends in later periods via other means (primarily settlement surveys). The spatial distribution of the selected radiocarbon dates overlaps well with the two focal regions identified for pollen core characterization. Beyond this, we have included dates in Thrace and in the south Aegean, respectively, both for comparative purposes and to retain as large a sample as possible (Figure 1, especially the distinction between ‘focal’ dates that overlap with the pollen diagrams and ‘others’ beyond this area). It is worth noting that while there might be slight imbalances in the relative emphasis placed on sampling absolute dates for, say, 9000‒5000 BP versus 5000‒3000 BP in each sub-region, and also between sub-regions (cf. Arvaniti and Maniatis, 2018, and Supplementary Table 1, available online), overall the sample sizes are similar and cautious comparison remains useful.
Figure 2a presents the resulting summed probability distribution (SPD) of archaeological radiocarbon dates for both the north and south regions of mainland Greece with each date normalised prior to summation while Figure 2b provides the same result when dates are left unnormalised. Both approaches produce broadly similar results, although we hereafter focus on the latter for reasons noted above. Figure 2b also summarises the main chronological divisions used in Greece, as derived partly from radiocarbon dates and partly from relative dating of artefact types (especially pottery styles and lithic traditions) (Bintliff, 2012; Finné and Weiberg, 2018; Manning, 2010). As a first guide to where certain portions of the overall time series depart from baseline expectations, we have fitted an exponential model of population growth (Figure 2c), and simulated conditional random date sets from this model (with the same sample size as the observed data) to produce a 95% critical envelope, above or below which to assess deviations in the observed data.
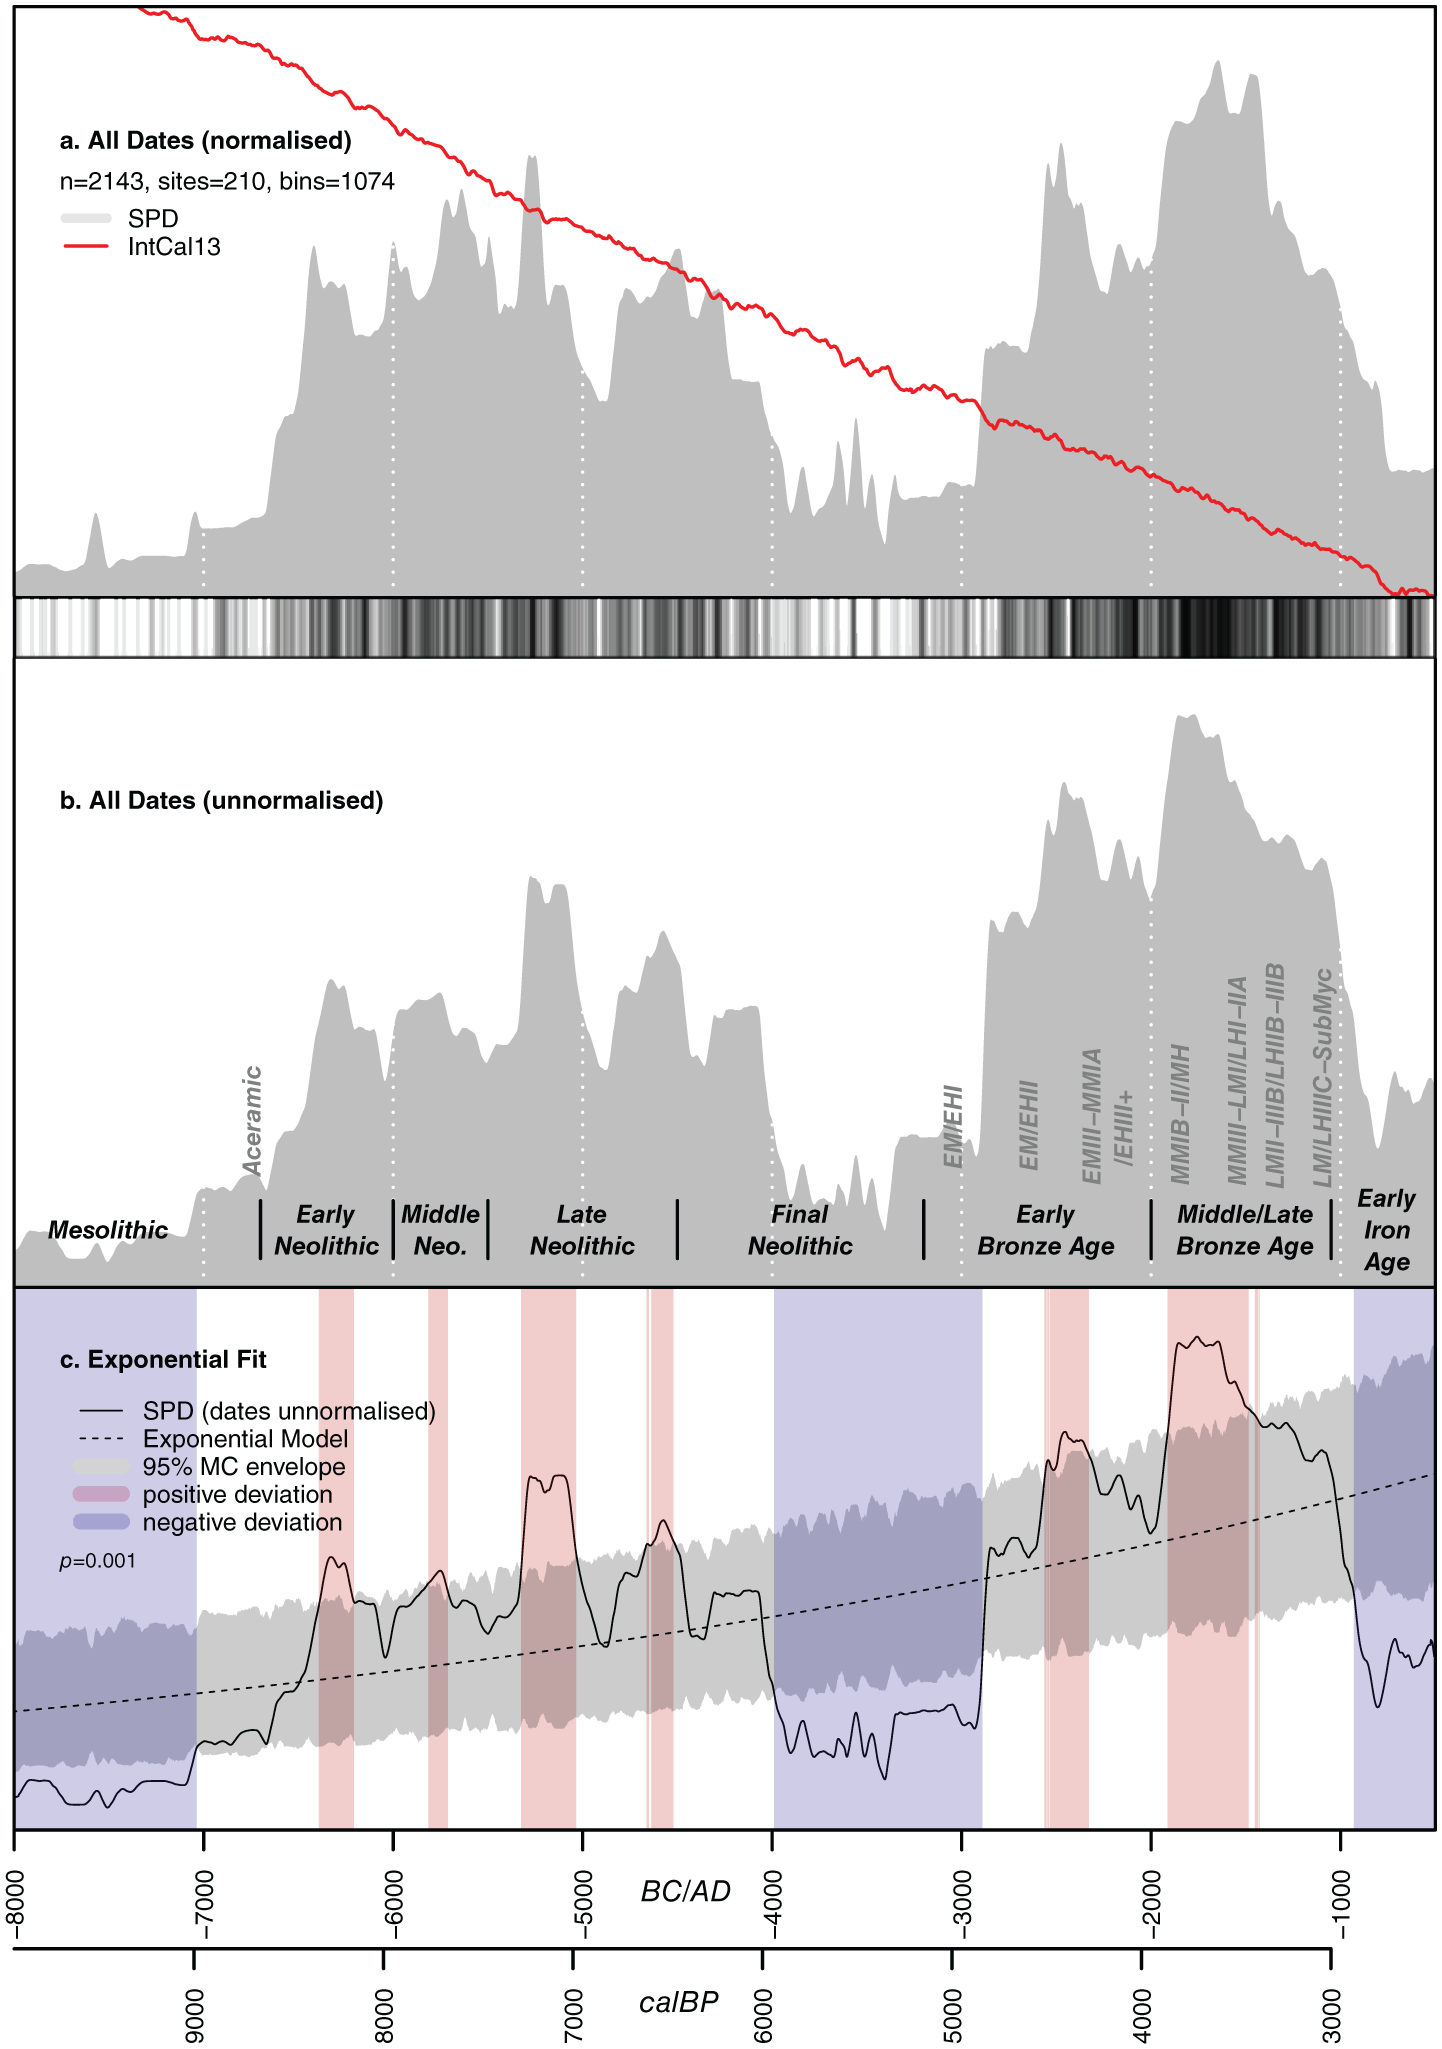
Overall patterns in archaeological radiocarbon as (a) a summed probability distribution of calibrated dates that have been normalised in the traditional way, (b) the distribution when dates are left unnormalised (with basic archaeological periodisation overlaid) and (c) a test of the distribution in (b) against a fitted exponential model of population growth (grey critical envelope based on 1000 Monte Carlo simulations). In between (a) and (b) are ‘barcodes’ plotting the estimated median date for each radiocarbon sample as a further way to visualise the relative intensity of dates through time.
What is striking is that the radiocarbon proxy broadly matches the narrative of cultural change traditionally offered for this region, with the Early Neolithic (EN) starting ~8750 BP but growing more substantial in character during the following centuries and then a plateau in growth by the Middle Neolithic (MN) period. The Late Neolithic (LN)‒Final Neolithic (FN) phase (aka Chalcolithic) in Greece spans a couple of millennia and suffers from many alternative chronological schemes (with regional variations, e.g. Nowicki, 2014; Tsirtsoni, 2016b), and the overall SPD suggests two or three distinct peak episodes within these later Neolithic phases and a decline during FN (see further below). An inferred boom in population sometime ~4750 BP makes archaeological sense in terms of observed moves in certain regions towards more complex cultural behaviour (e.g. EH II in the Peloponnese, Kampos/Keros-Syros in the Cyclades and early Minoan I late/early Minoan IIA in Crete, see, for example, Cline, 2010, for an overview). By approximately ~4350 BP, the time series suggests a downwards demographic trend again which is in line with wider Aegean and Eastern Mediterranean evidence for major disruption in the last centuries of the Early Bronze Age (EBA) (Dalfes et al., 1997; Jung et al., 2015; Maran, 1998; see also Arvaniti and Maniatis, 2018, for the possible differences regarding the timing of the EBA II/III and EBA/MBA transitions in the north, south and the Cyclades). During the Middle Bronze Age (MBA) and LBA (from ~4000 BP) we then see recovery followed by substantial inferred growth, consistent with the archaeological observation that this period saw the emergence of the first ‘Minoan’ palaces and more complex political formations on Crete (Whitelaw, 2012). An inferred decline phase at the very end of the Bronze Age is also consistent with existing archaeological interpretation of this period as being one of political and demographic collapse, followed by profound social transformation (Knapp and Manning, 2016).
While the current sample size prevents us from considering lots of small sub-regional patterns, further insight is possible if we simply split the radiocarbon data from north to south. Figure 3a shows the resulting SPD both for the northern focal region that overlaps with our selected pollen evidence, as well as the SPD produced from the slightly wider northern area shown in Figure 1. Both patterns are reassuringly similar. Figure 3b does the same for focal and wider southern regions, and here there is slightly more discrepancy particular in the second millennium BC, where the addition of Cretan and other southern Aegean dates suggests a much ‘sharper’ pattern – of two dramatic growth phases separated by a decline ~4200‒4000 BP – than when the Peloponnese focal region is treated alone.
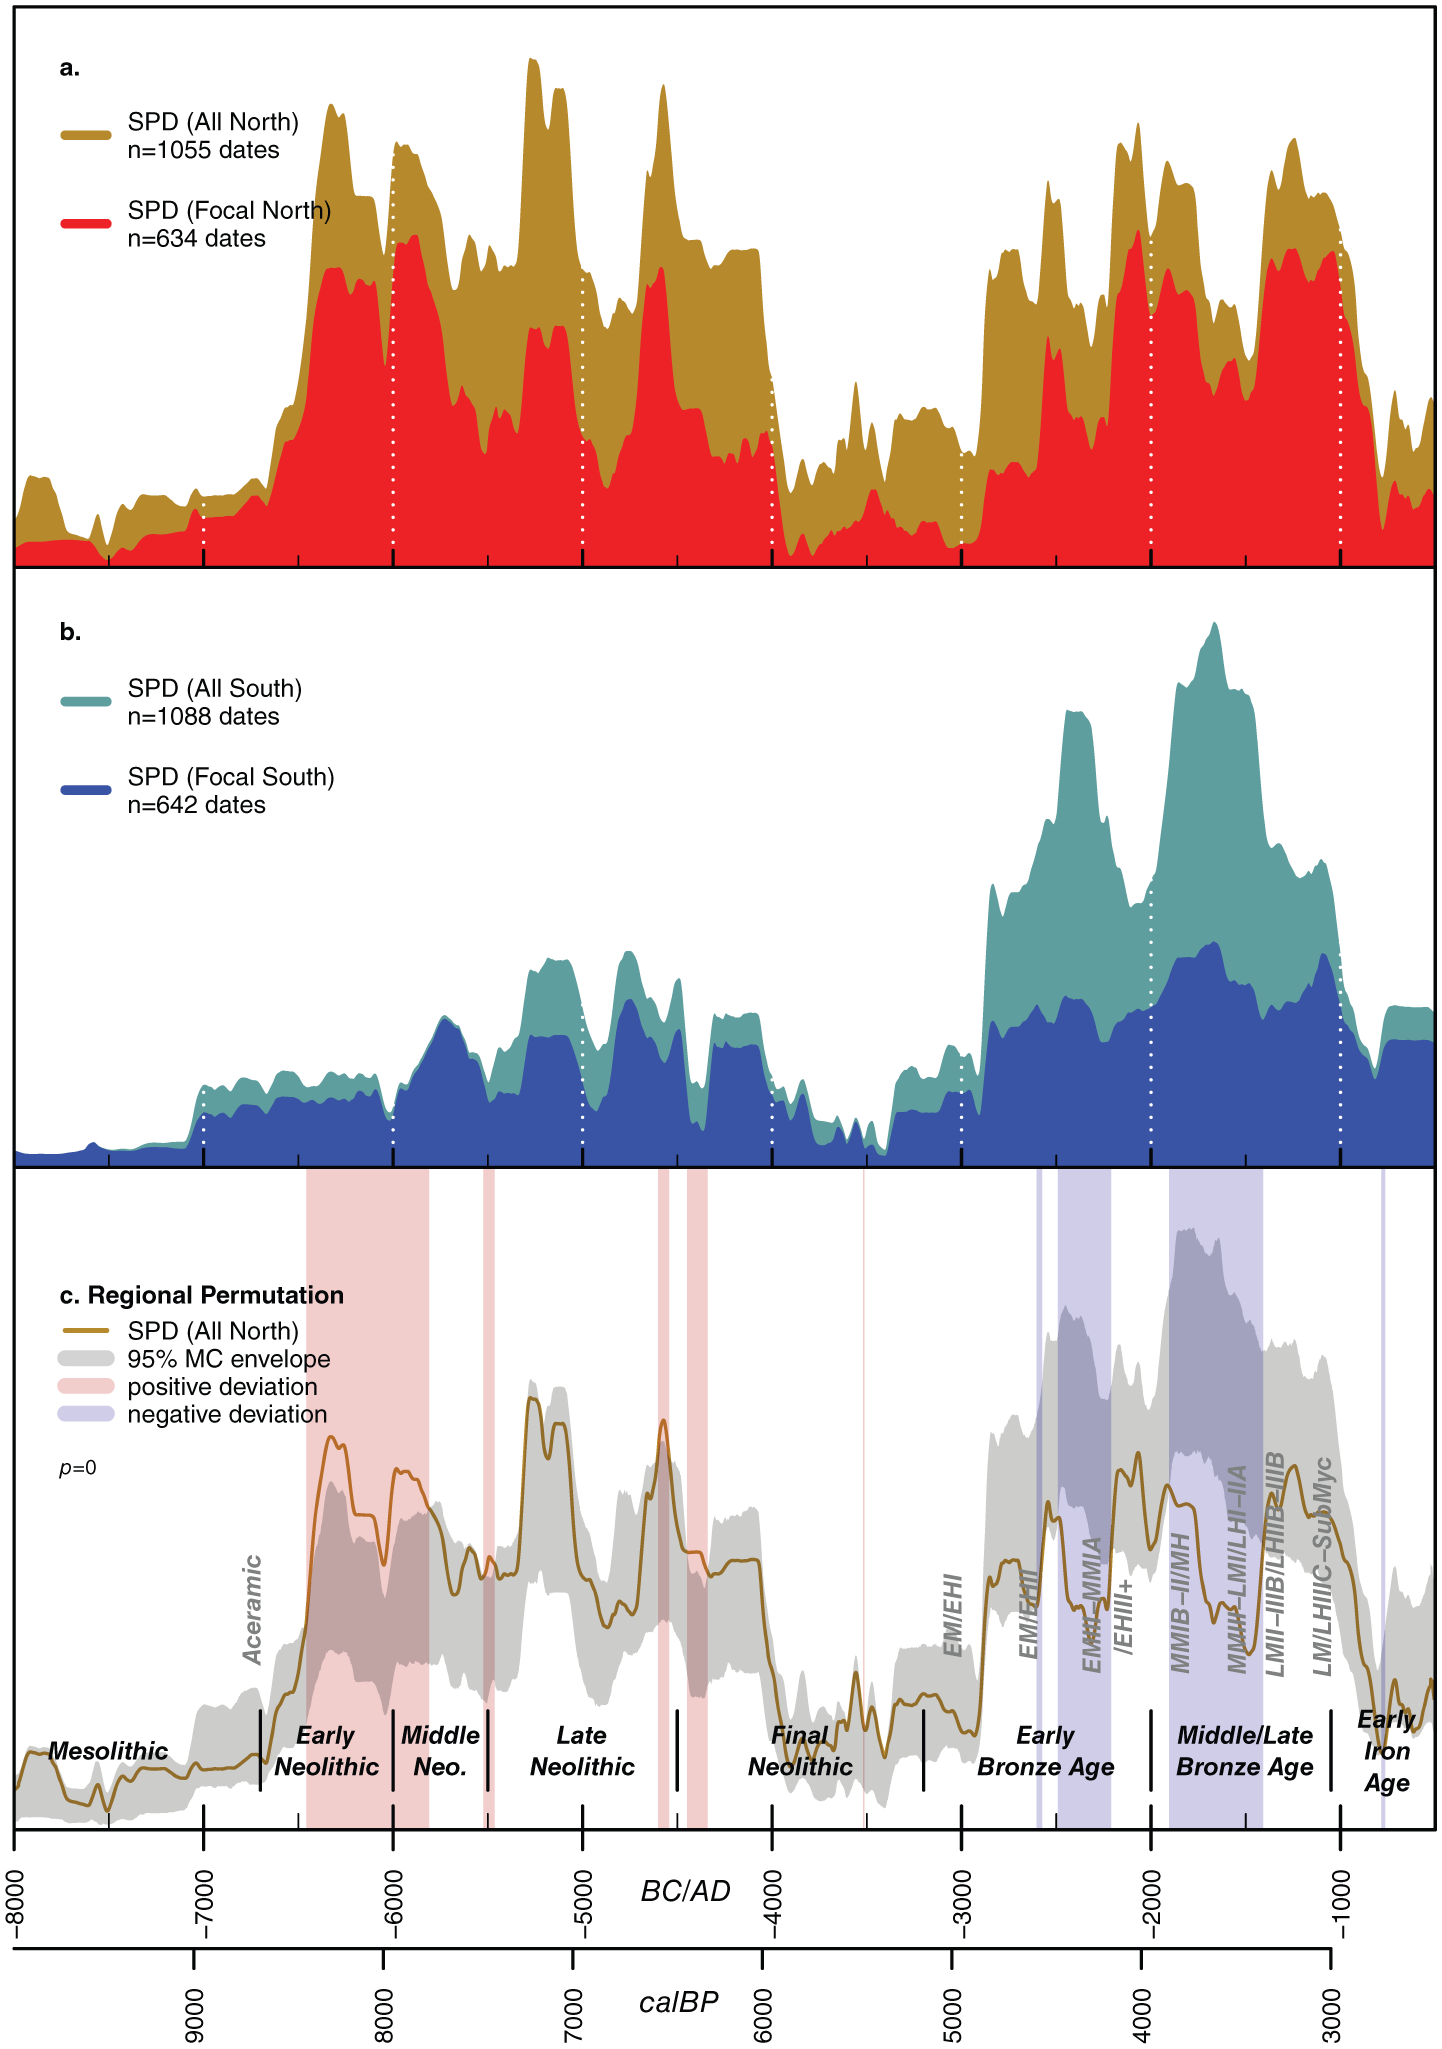
Regional radiocarbon trends for (a) northern Greece with both the focal region that most closely matches the pollen evidence and a wider region that maximises radiocarbon date sample size (both focal and other from figure 1), (b) southern Greece with the same split as (a) and (c) a permutation test (1000 runs) of the departure of the northern region from what we might expect by chance.
Figure 3c allows a more robust comparison of north and south by depicting the wider northern region and then the critical envelope produced by a permutation test of the region labels. Thus, when the brown line representing the observed SPD falls above the grey envelope it suggests the north is doing better demographically than the south, and more precisely, better than we would expect by chance all regions being equal. In contrast, where it drops below the grey envelope, the south can be suggested to be doing demographically better. The positive northern deviation 8450‒7750 BP corresponds very well to substantial tell formation during this EN phase across Thessaly especially (Reingruber et al., 2017). The negative deviations during late EH II (~4450–4250 BP) and MB II‒LB II (~3850–3350 BP), respectively, correspond to well-known rises in complexity that are far more visible in the south (see above). Both north and south are also consistent in exhibiting dips in inferred population 6000‒5000 BP and then again at ~3000 BP.
Site surveys
As a complement and/or corrective to radiocarbon evidence, a compilation of archaeological site datasets for Macedonia and the Peloponnese enables a quantitative comparison of the regional settlement trends at a scale not attempted before for Greece. Note, however, that these samples do not represent the entirety of settlement in these sub-regions and that variations within these sub-regions are likely to be non-trivial. It should also be kept in mind that although our time series changes abruptly in places, this is partly because of the periodisation used by archaeologists. This system of periodisation is both a practical convenience and a reflection of our ability to systematically find chronological patterns in assemblages of past material culture such as pottery and lithic traditions, which will inevitably give a picture of abruptness for demographic processes that in reality would have been more gradual or abrupt in ways that do not exactly match ceramic styles. As an initial view of the number of sites identified in the two sub-regions, Figures 4a and 5a give the raw count of recognised sites for the two regions. The comparison underlines the greater number of Neolithic and especially MN‒LN sites in Macedonia, compared with the Peloponnese, which is in line with the high SPD for the Neolithic north. The FN period constitutes a clear low point in Macedonia while showing a definite increase in sites in the Peloponnese. The EBA represents a high-point in terms of site number in both regions, on par with the LN in the north. After a subsequent drop in the late EBA in the south and with the onset of MBA in the north, site numbers increase again for the LBA. The trajectories of the two sub-regions diverge thereafter, with an immediate high for Macedonia in the LBA (from ~3600 BP), followed by more or less upheld site numbers during the EIA and historical periods. On the Peloponnese, instead, high site numbers in the LBA are followed by a low point in the EIA and a gradual build-up towards an overall apex in the Classical‒Hellenistic period. The summing up of total estimated site area for each year of the time series (Figures 4b and 5b) brings a slightly different picture and enables a discussion on the role of site nucleation during the same time periods, that is the addition of larger sites suggesting that more people congregated in these settlements. For the Peloponnese, the evidence especially points to the palatial Bronze Age and the period from the EIA (~2700 BP) onwards, while for Macedonia the greatest difference can be seen for the MN‒LN period (comparing the information in Figure 4a and b and Figure 5a and b). Although the latter could be used to pinpoint the large size of some tells and sites of the flat-extended type, it should also be remembered that size designations for Macedonia are less reliable and that flat extended sites may very well have been quite sparsely populated.
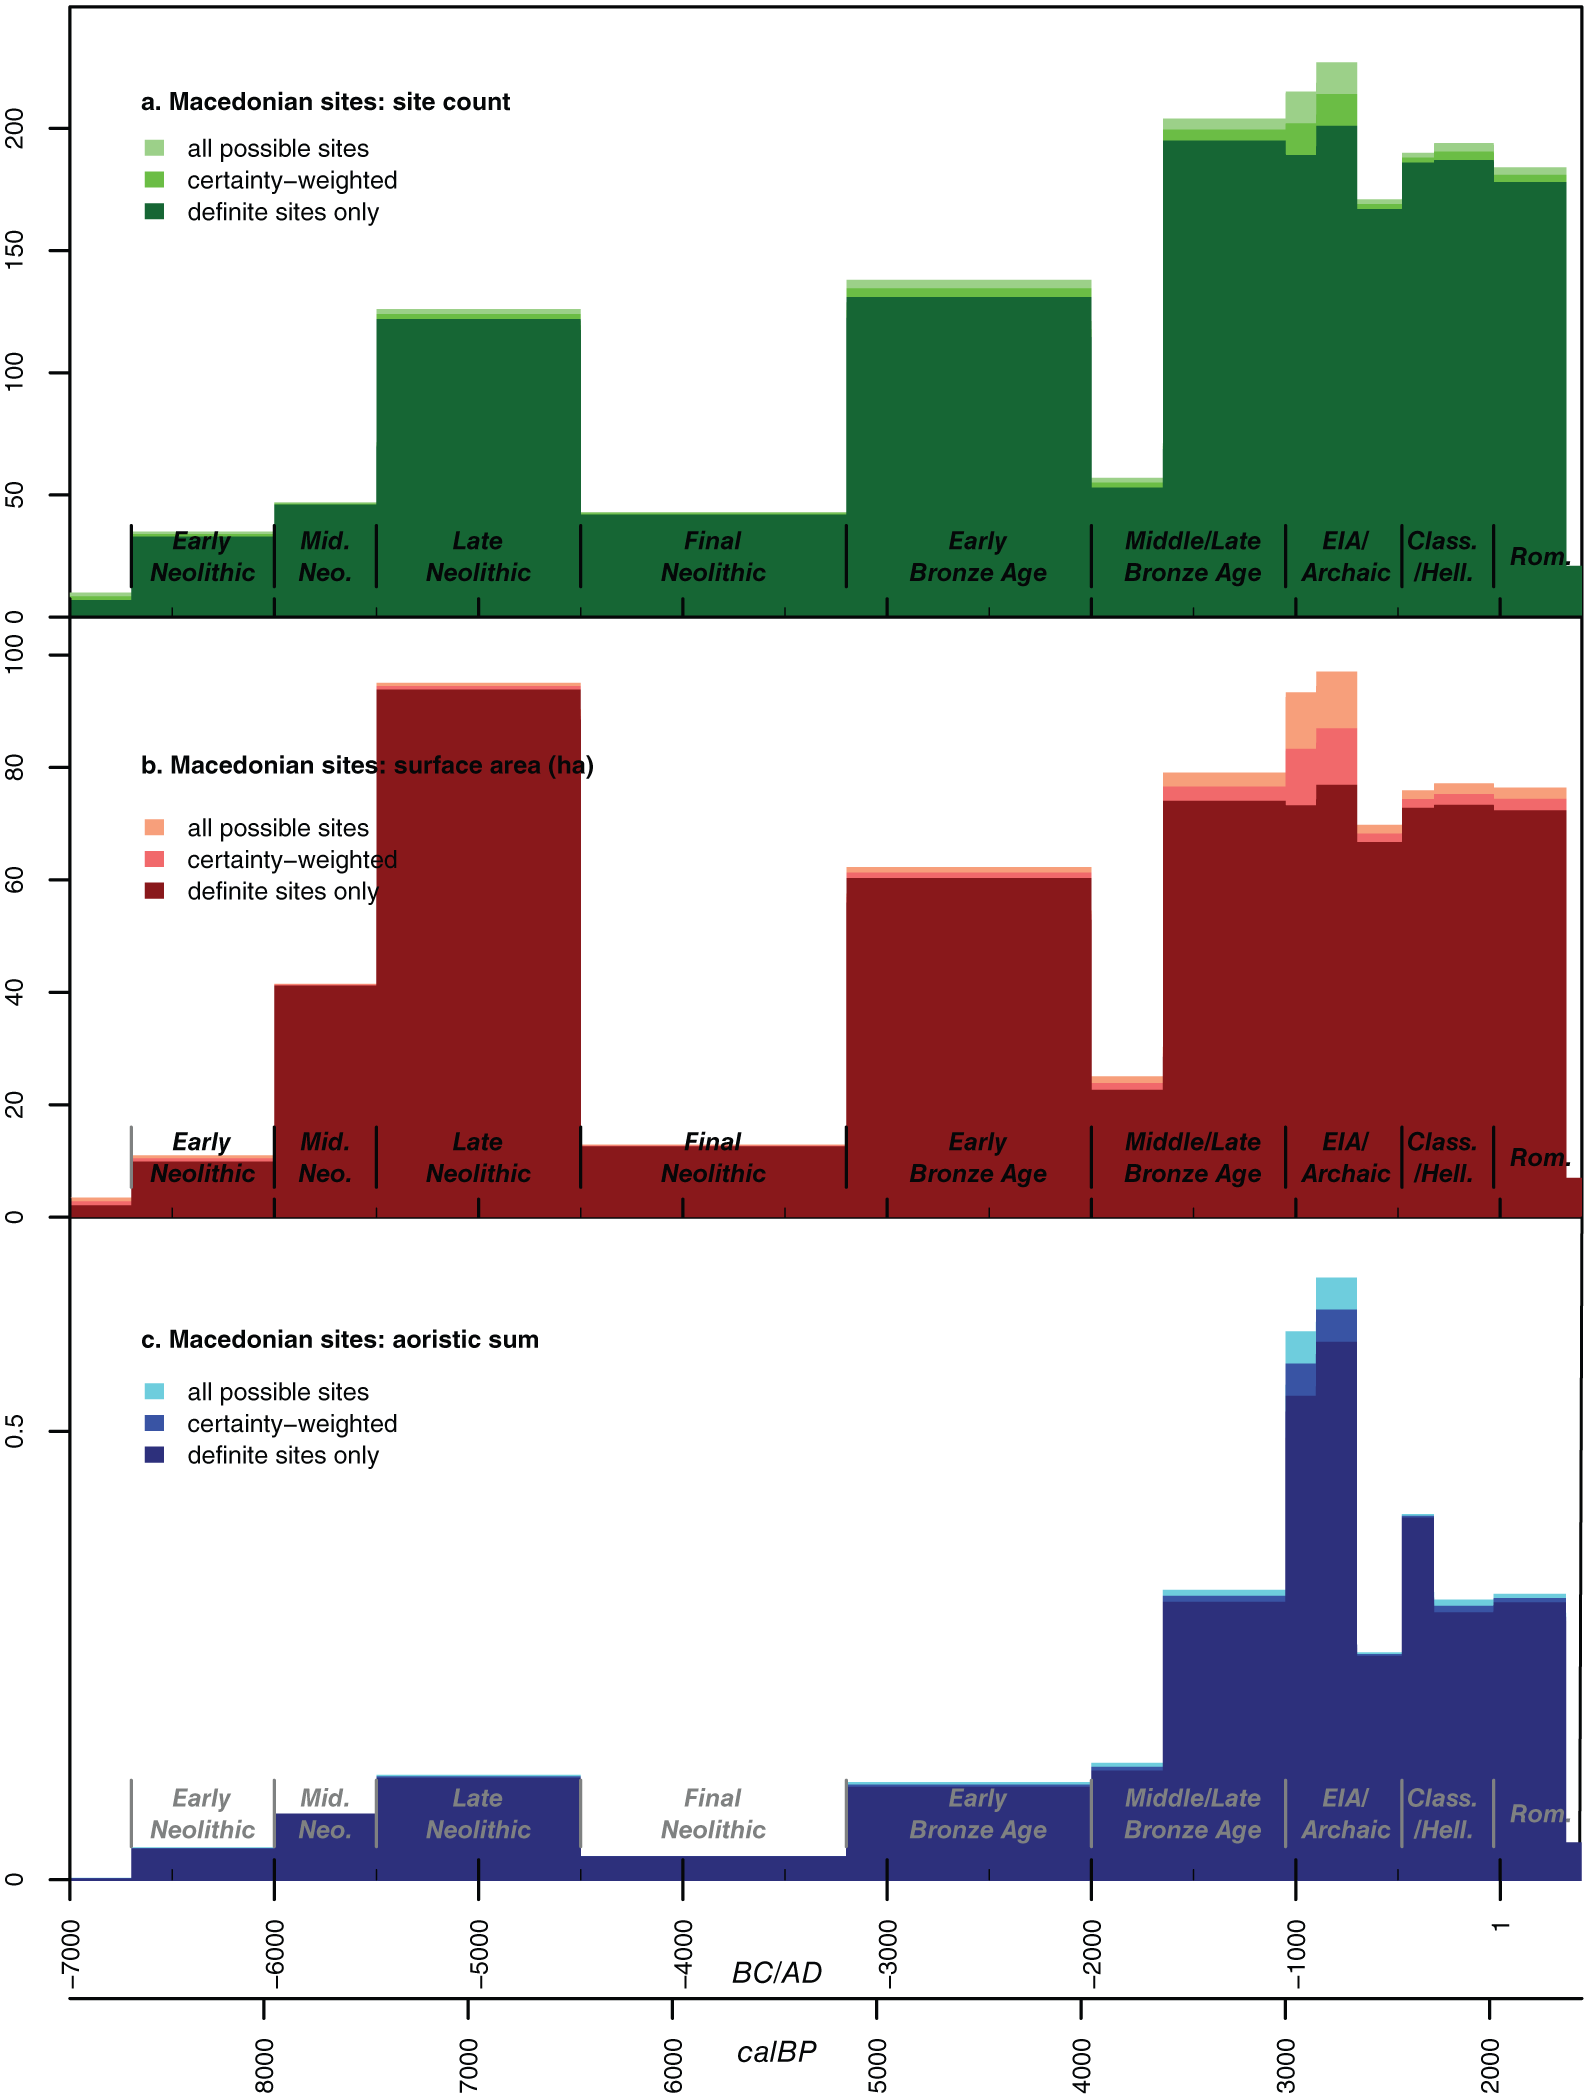
Approaches to estimating site intensity from survey data from Macedonia: (a) raw count of 1 if a site’s estimated date range covers a given year, (b) total surface area of sites whose estimated date ranges cover a given year, (c) aoristic sum of sites that might fall in a given year (the three colour codes indicate how the calculations change if we take optimistic, moderate and pessimistic assumptions about the certainty of site identification and dating).
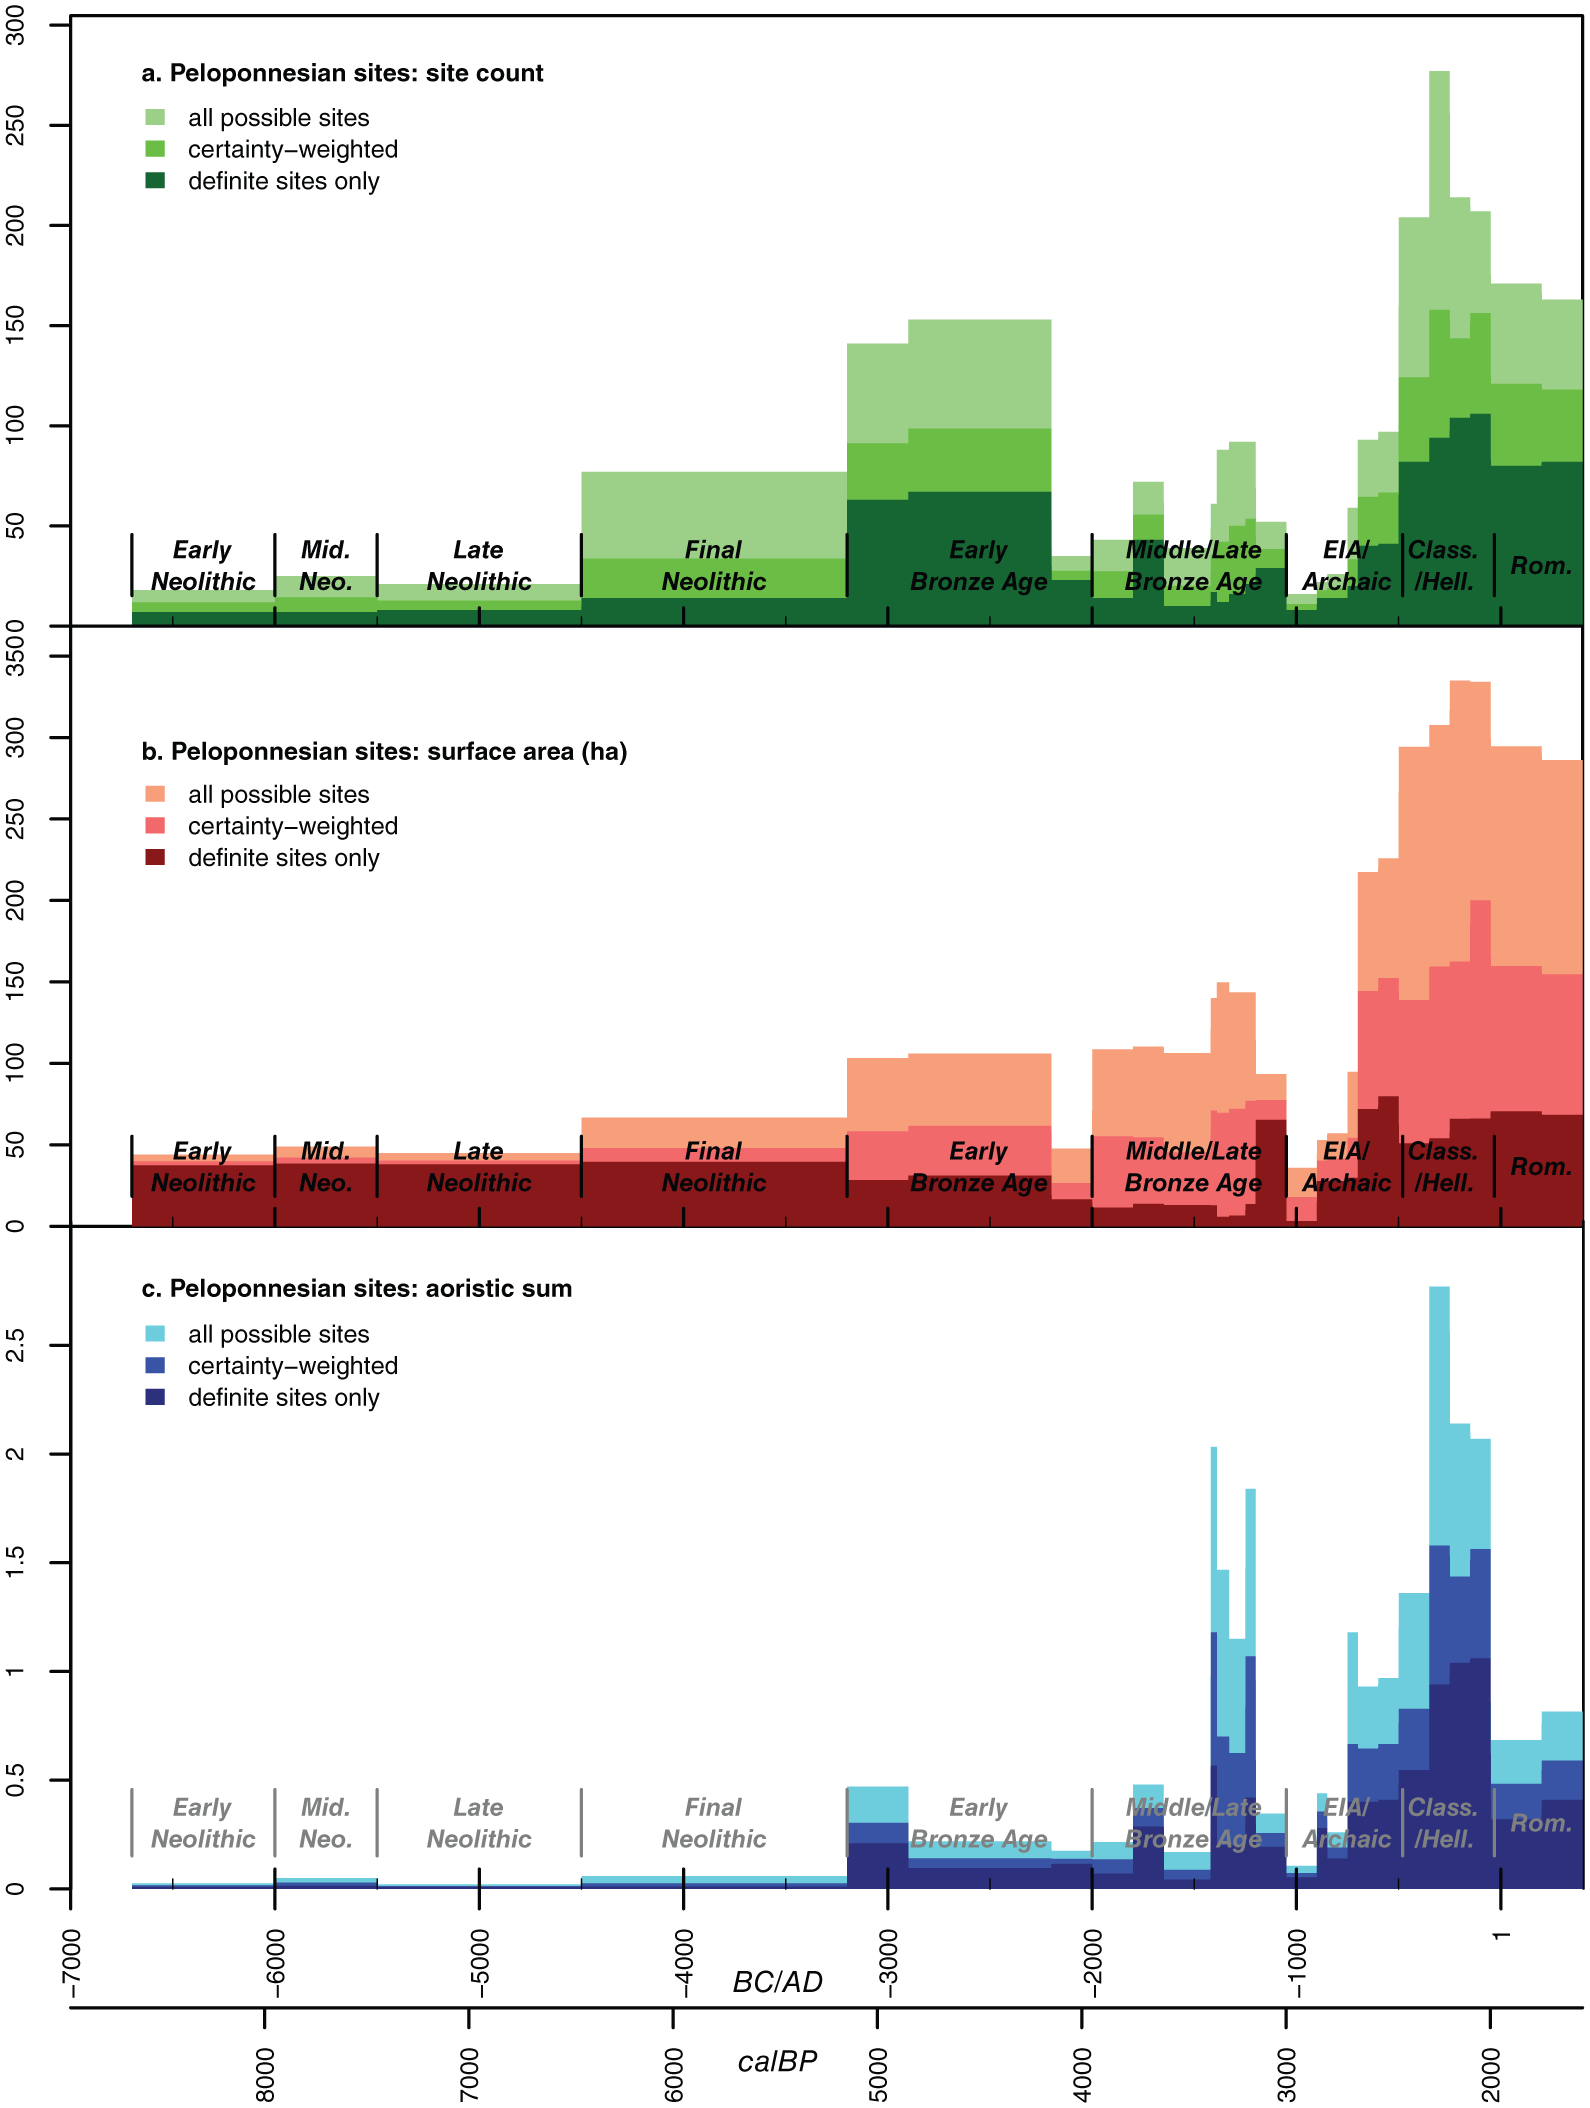
Approaches to estimating site intensity from survey data from the Peloponnese: (a) raw count of 1 if a site’s estimated date range covers a given year, (b) total surface area of sites whose estimated date ranges cover a given year, (c) aoristic sum of sites that might fall in a given year (the three colour codes indicate how the calculations change if we take optimistic, moderate and pessimistic assumptions about the certainty of site identification and dating).
An important note for Macedonia site numbers is also that many of the surveys focused on prehistory (see Supplementary Table 3, available online), suggesting that both size and the number of historical periods is underrepresented (cf. Andreou and Kotsakis, 1999). The aoristic approach is therefore a useful corrective as it down-weights periods where sites are only allocated to very long timespans (where we might suspect that in fact site durations were shorter but just hard to notice). A notable result in both regions is a much-reduced amplitude of sites for the Neolithic and the EBA where the chronological range for a given site can span more than a millennium (Table 1). Conversely, the aoristic sum shows significantly increased peaks during the Mycenaean palatial period (3350‒3150 BP) and Classical‒Hellenistic periods in the Peloponnese relative to the same periods in Figure 5a and b. However, since the aoristic method deflates (inflates) counts for periods with wide (narrow) date ranges, over-estimations are likely to occur, such as the peak in EIA Macedonia. The latter nevertheless serves to pinpoint that the EIA may have constituted less of a break in Macedonia than generally assumed for the Peloponnese (Koukouli-Chryssanthaki, 2014).
Pollen
A complex pattern of decreasing deciduous oak woods (cluster 6.1) does broadly correlate (negatively) with the rising population numbers inferred by the SPD and archaeological site data, signalling an opening of the oak wooded areas and hence a landscape increasingly affected by human activities. There are, however, substantial differences between the two sub-regions. Forested and wooded areas are more dominant and more diverse in the north (including, for example, alder woods, cluster 8.1, from ~5200 BP, not at all represented in the south). Deciduous oak parkland (cluster 6.2) is also more predominant in the north, while pasture/wetland (cluster 3.0) is ubiquitous in the south (Figure 6). Significant differences between the two sub-regions can also be found in all human indicator groups (OJC, API and PDI). The API indicator group for the north displays notably lower levels than in the south (Figure 7), apart from in the very earliest samples (consisting mostly of deciduous oak parklands, typical in northern Greece before the establishment of the deciduous oak woods, see, for example, Willis, 1994), as well as towards the present time. A trend of slowly increasing API levels from ~3500 BP can be noted in the north, which is in some sense paralleled in the south from ~4500 BP. Overall, however, records from the south display fluctuating but continuously high API levels. There is, however, a very distinct drop in all pollen indicator groups in the south between 2000 and 1000 BP. In the north, this occurs later and is mainly visible in OJC (especially Juglans) and only to a smaller degree in the PDI and API.
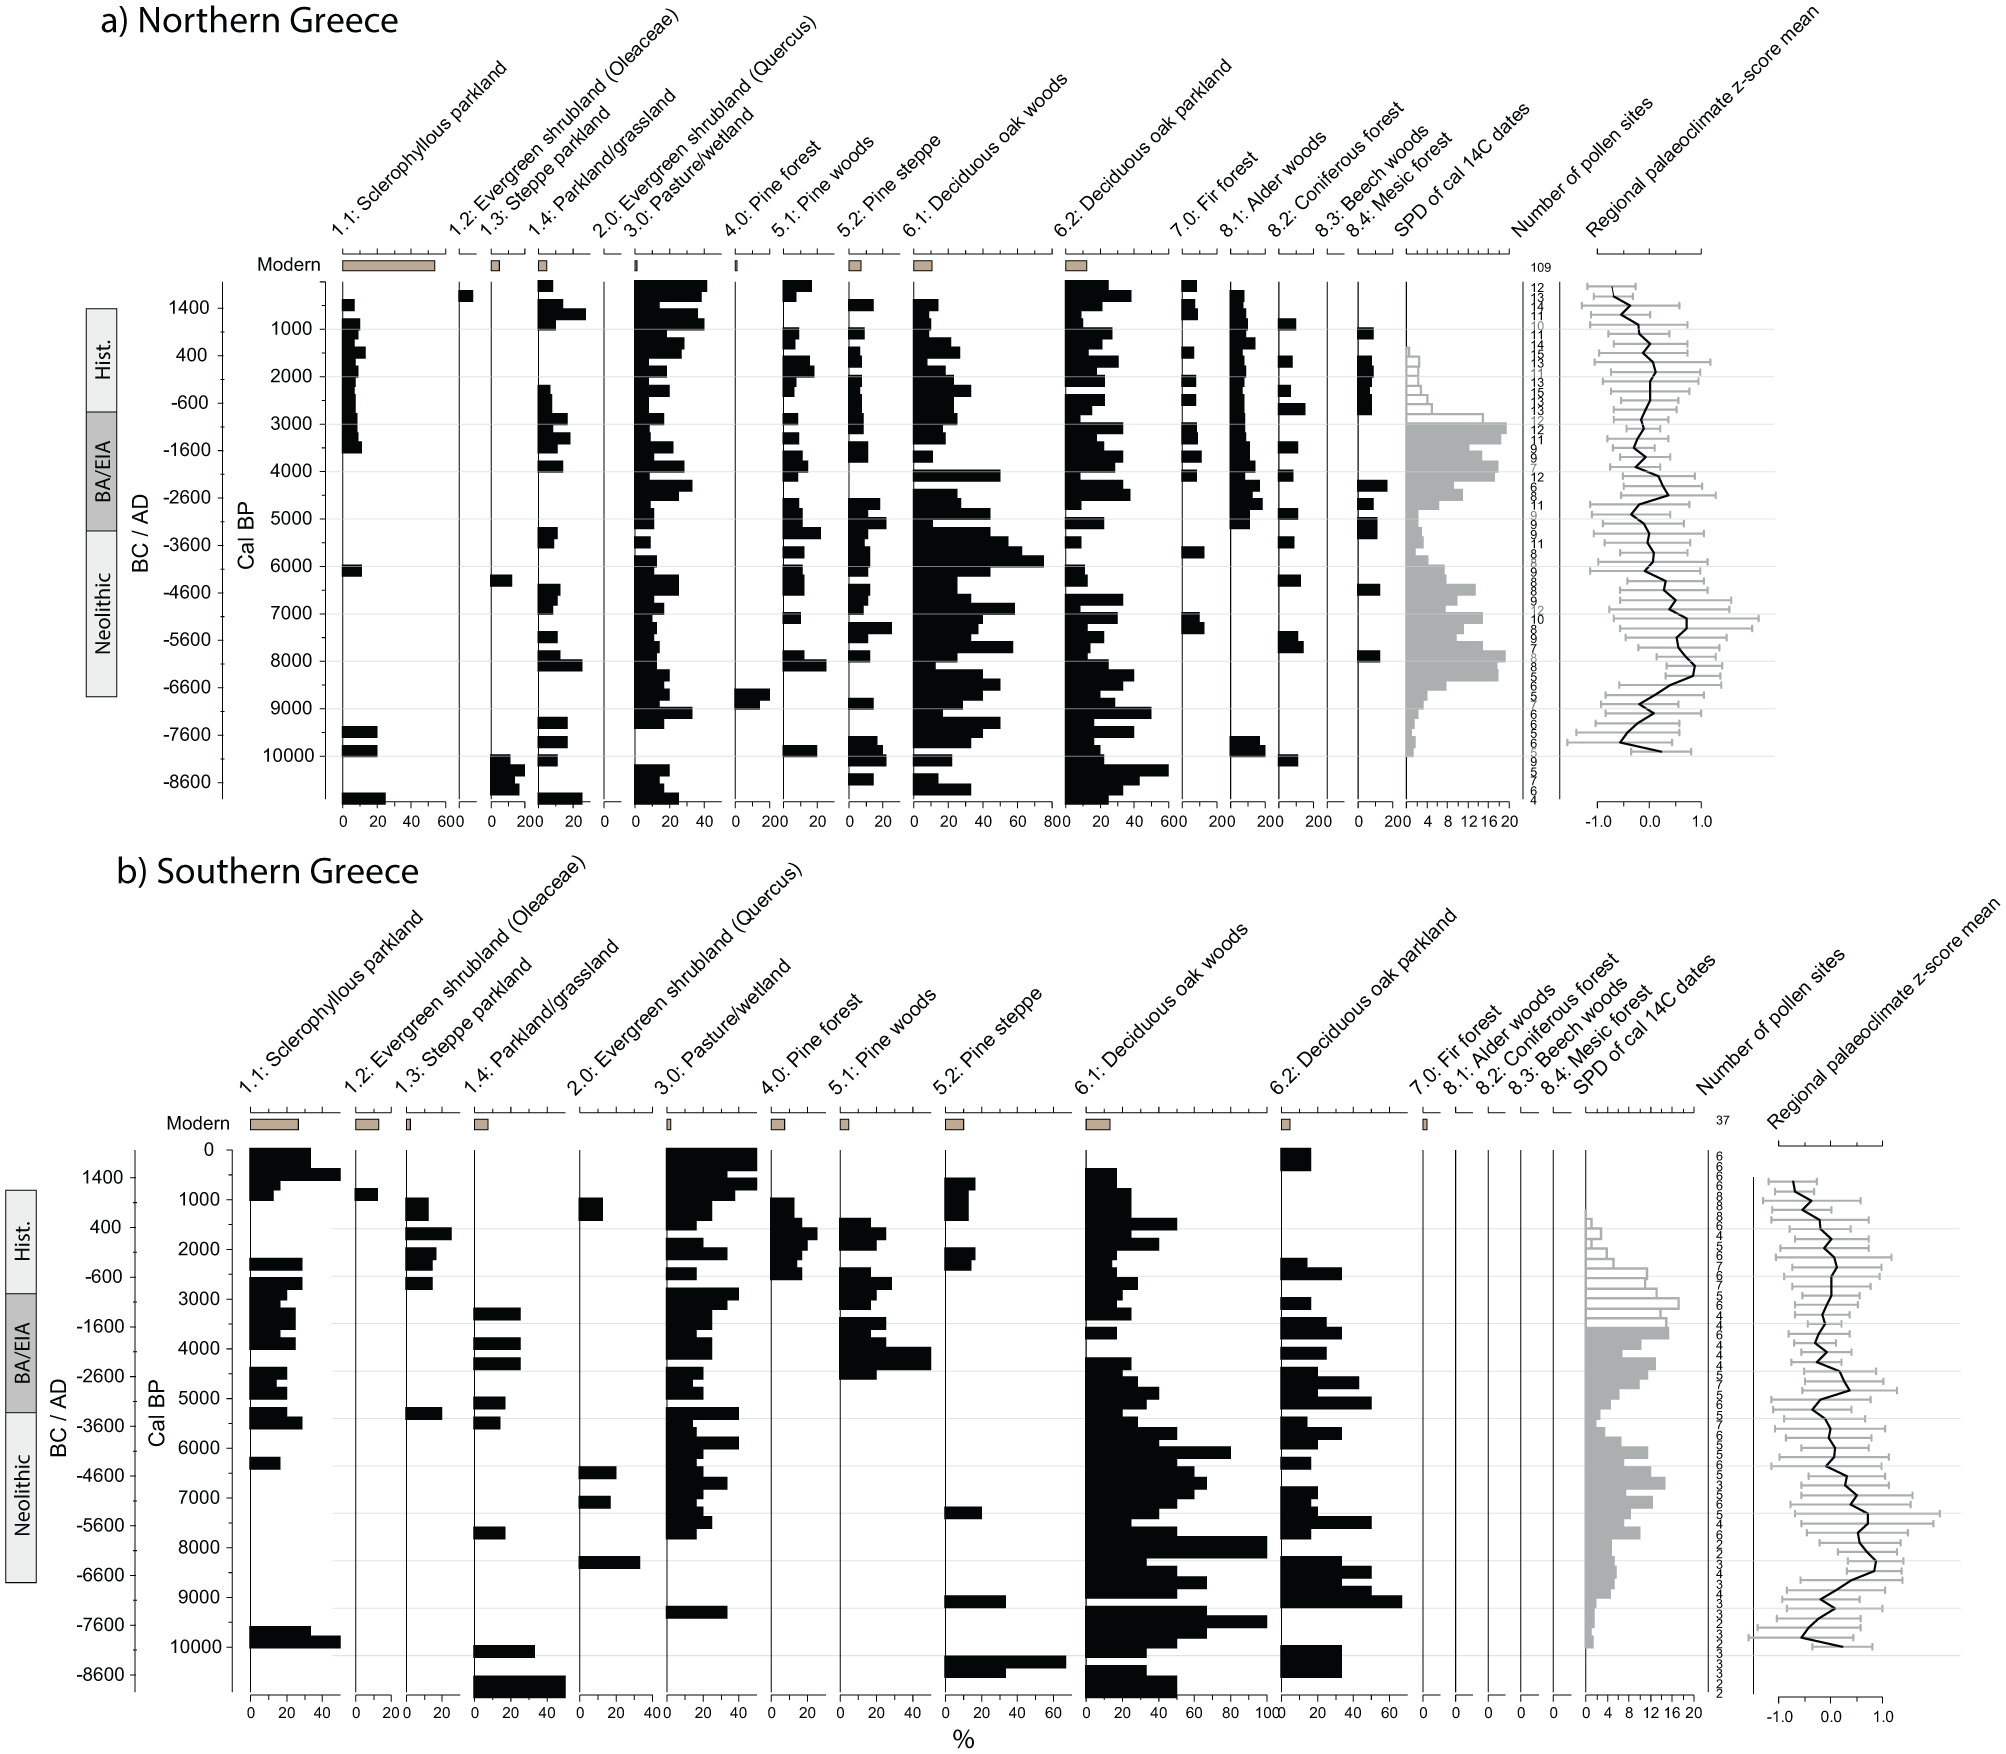
Cluster analysis of (a) northern Greece and (b) southern Greece. Pollen-inferred vegetation cluster groups presented as percentage of pollen samples (time windows) assigned to each vegetation cluster group, and archaeological datasets (11000 BP – modern). The grey area highlights a period of low pollen site numbers. Regional palaeoclimate z-score mean for the Balkans region, based on sites from both north and south. Positive (negative) values indicate wetter (drier) conditions (for details see Finné et al., this volume). Horizontal bars show one standard deviation. The relative chronology is generalised to fit both sub-regions (for details see Table 1).
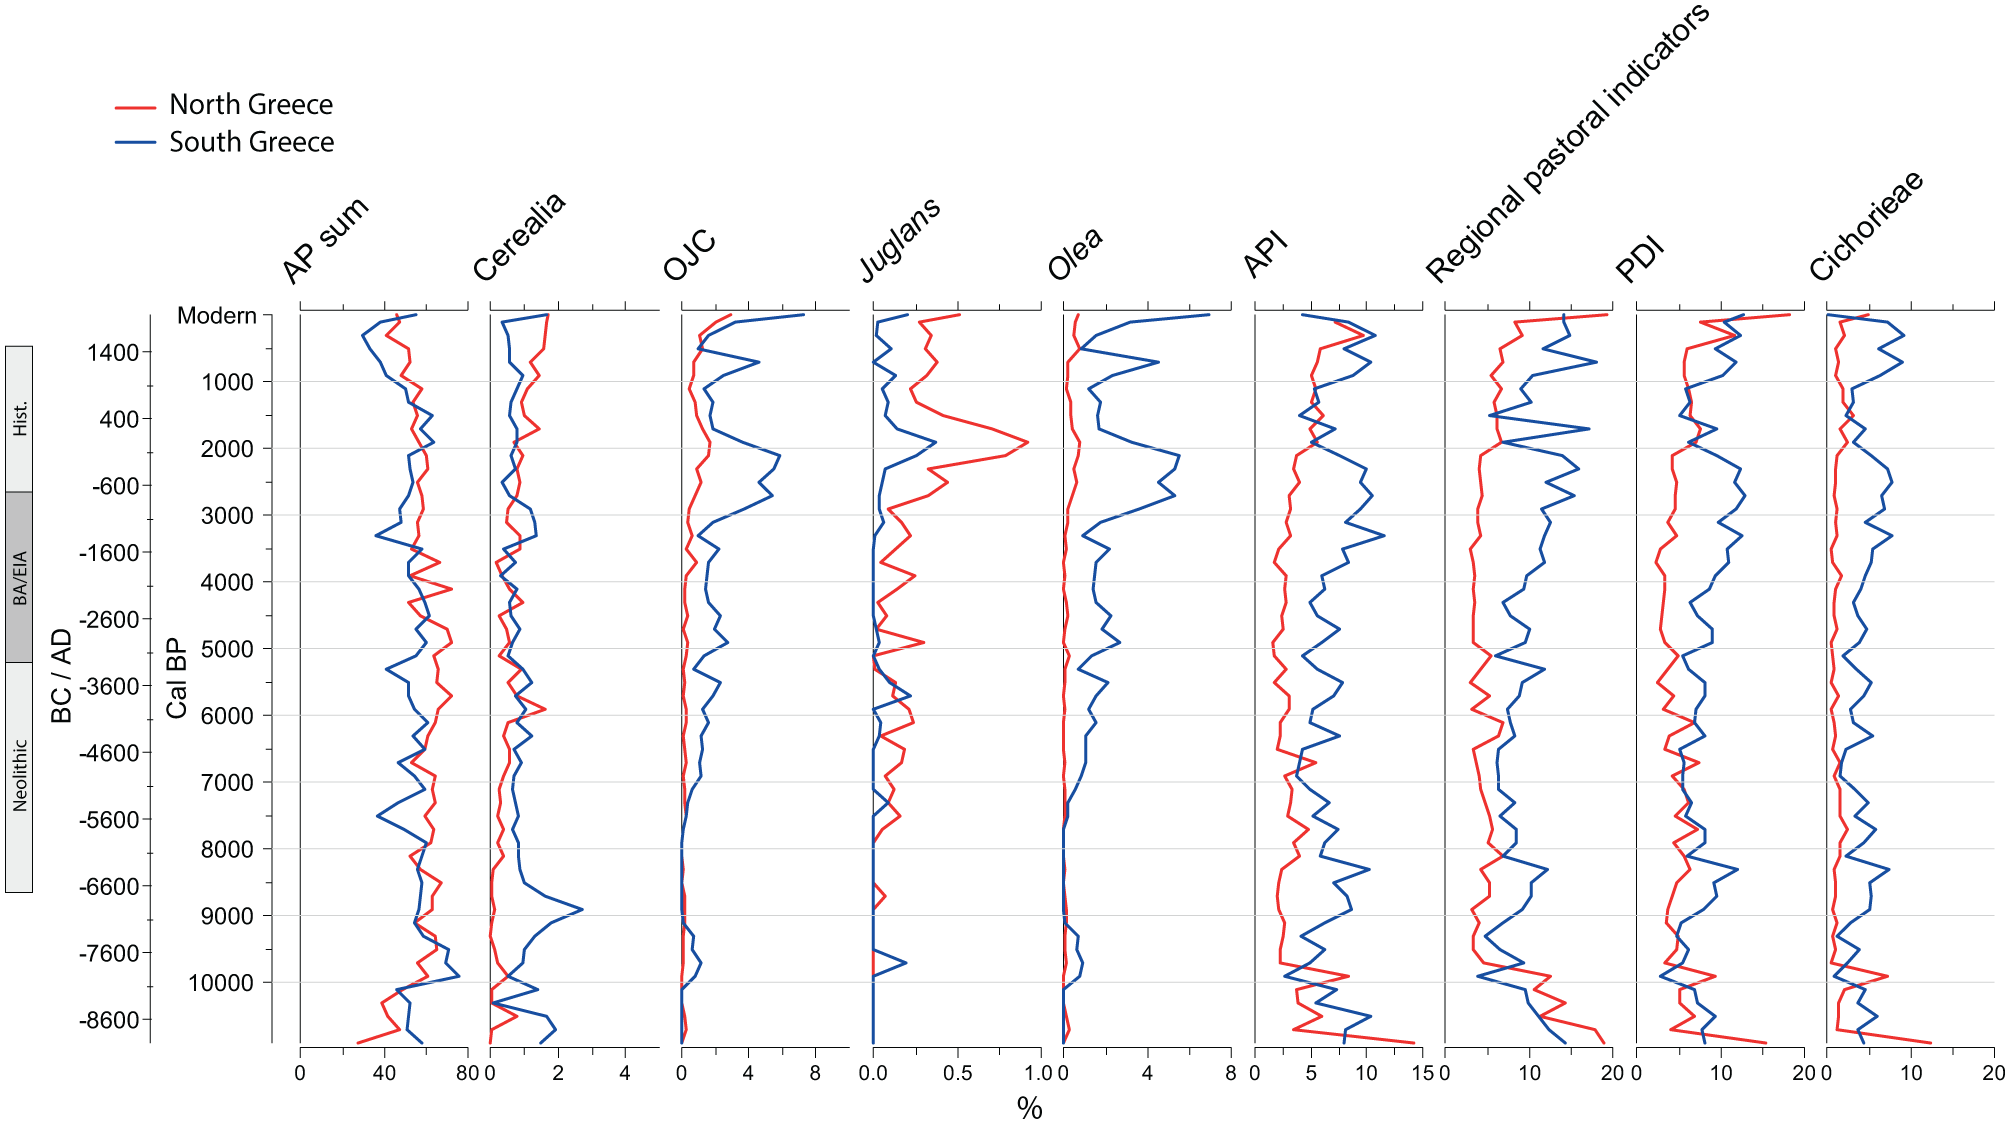
Pollen indicator groups for northern Greece (red curve) and southern Greece (blue curve) including arboreal pollen (AP sum), human cultivars (Cerealia, OJC, Juglans, Olea, Castanea), anthropogenic pollen index (API), summed grazing indicators (regional pastoral indicators, PDI and Cichorieae). The relative chronology is generalised to fit both sub-regions (for details see Table 1).
These results highlight the different geographical settings of the pollen cores in the two sub-regions of our study, predominantly in terms of the bioclimatic zones where the pollen core locations are situated. The sites for the north are all but one from within the meso-Mediterranean and supra-Mediterranean zones, and all but three are located at medium and high elevation (>260 masl), while all samples for the south derive from the thermo-Mediterranean zone, and all but one are located at low elevations (most around 20 masl) (Figure 1b, Supplementary Table 2, available online). The differences in the API can also (to some extent) be associated with the fact that most of the core locations in the north do not have any major settlements within their catchments, with the exception of the Orestias core that clearly records activity from the nearby settlement of Dispilió, with increased human activity during Neolithic, Hellenistic and Roman times (Kouli, 2015; Kouli et al., 2018; Mercuri et al., this volume). In contrast, most pollen core locations in the south are within regions for which archaeological remains suggest high human activity (if not specifically on site). The coastal locations of the cores mean moreover that they are also closer to the conditions where taxa included in the API grow naturally.
Apart from these differences, there are also some interesting trends that are roughly similar between the sub-regions. There is a clear peak in deciduous oak woods (cluster 6.1) around 6000–5400 BP in the north, and 7000–6000 BP in the south, decreasing thereafter until ~4000 BP in both sub-regions (i.e. a trend of decreasing values spanning from FN through to mid-EBA), followed by an (almost) gap in deciduous oak woods, with an overall emphasis on 4000–3400 BP (see Figure 6). This 600-year long period corresponds to the beginning of the Middle Helladic period until the beginning of the Mycenaean palatial period in the southern Aegean and would have meant a decimation of deciduous oak woods but without resulting in any significant change in AP. Another similarity between the sub-regions can be found in the timing of the peak period for OJC from ~3000 to 2000 BP in the south and 2750–1750 BP in the north (see further below). The percentages of OJC, however, are higher overall in the south compared with the north. The OJC index in the south does furthermore mainly consist of Olea, and these high values correlate well with low values of deciduous oak woods. In the north, where our sites are mostly located outside the olive distribution zone, Olea constitutes a very minor part of OJC (if any), which is instead primarily made up of walnut (Juglans) and correlates well with high values in the deciduous oak woods (e.g. ~2500‒1500 BP). The only exception is the coastal site of Tristinika (Panajiotidis and Papadopoulou, 2016), a site within the thermo-Mediterranean climate zone and thus closer to the locations in the south in terms of vegetation.
Data synthesis
Combining the lines of evidence provided by these three datasets is an important but challenging exercise. Although visual comparisons and qualitative assessments remain central, quantitative methods can help to nuance discussion. It is possible for instance to assess both when and to what degree two or more time series correlate well with one another. Figure 8 provides an example of such a ‘consensus model’, seeking agreement between the radiocarbon dates from the southern focal region presented in Figure 3a and the number of Peloponnesian sites presented in Figure 5. In the model it is assumed that the shape of a site’s activity (or its use-intensity) was not uniform across its sometimes large assigned date range, but instead was unevenly distributed roughly according to the varying activity suggested by the SPD. The amount the site then contributes to the overall summation is calculated as an average of how important that time range is to the radiocarbon (i.e. relative height of the line in ‘focal south’ time series in Figure 3b for 6450‒5050 BP compared with the rest of this series) versus how important it is in the survey evidence (i.e. the relative height of the maximum ‘surface area’ from Figure 5b for 6450‒5050 BP compared with the rest of this series). We certainly do not propose that this is a perfect final model of likely prehistoric population change in the Peloponnese, and as noted above, the very abrupt drops are largely an effect of our modern periodisation of time. However, the overall patterns remain plausible and the exercise in consensus-building is useful, not least because it highlights that perceived problem periods of incompatibility in the evidence (such as FN‒EB1: see further below) can sometimes be reconciled.
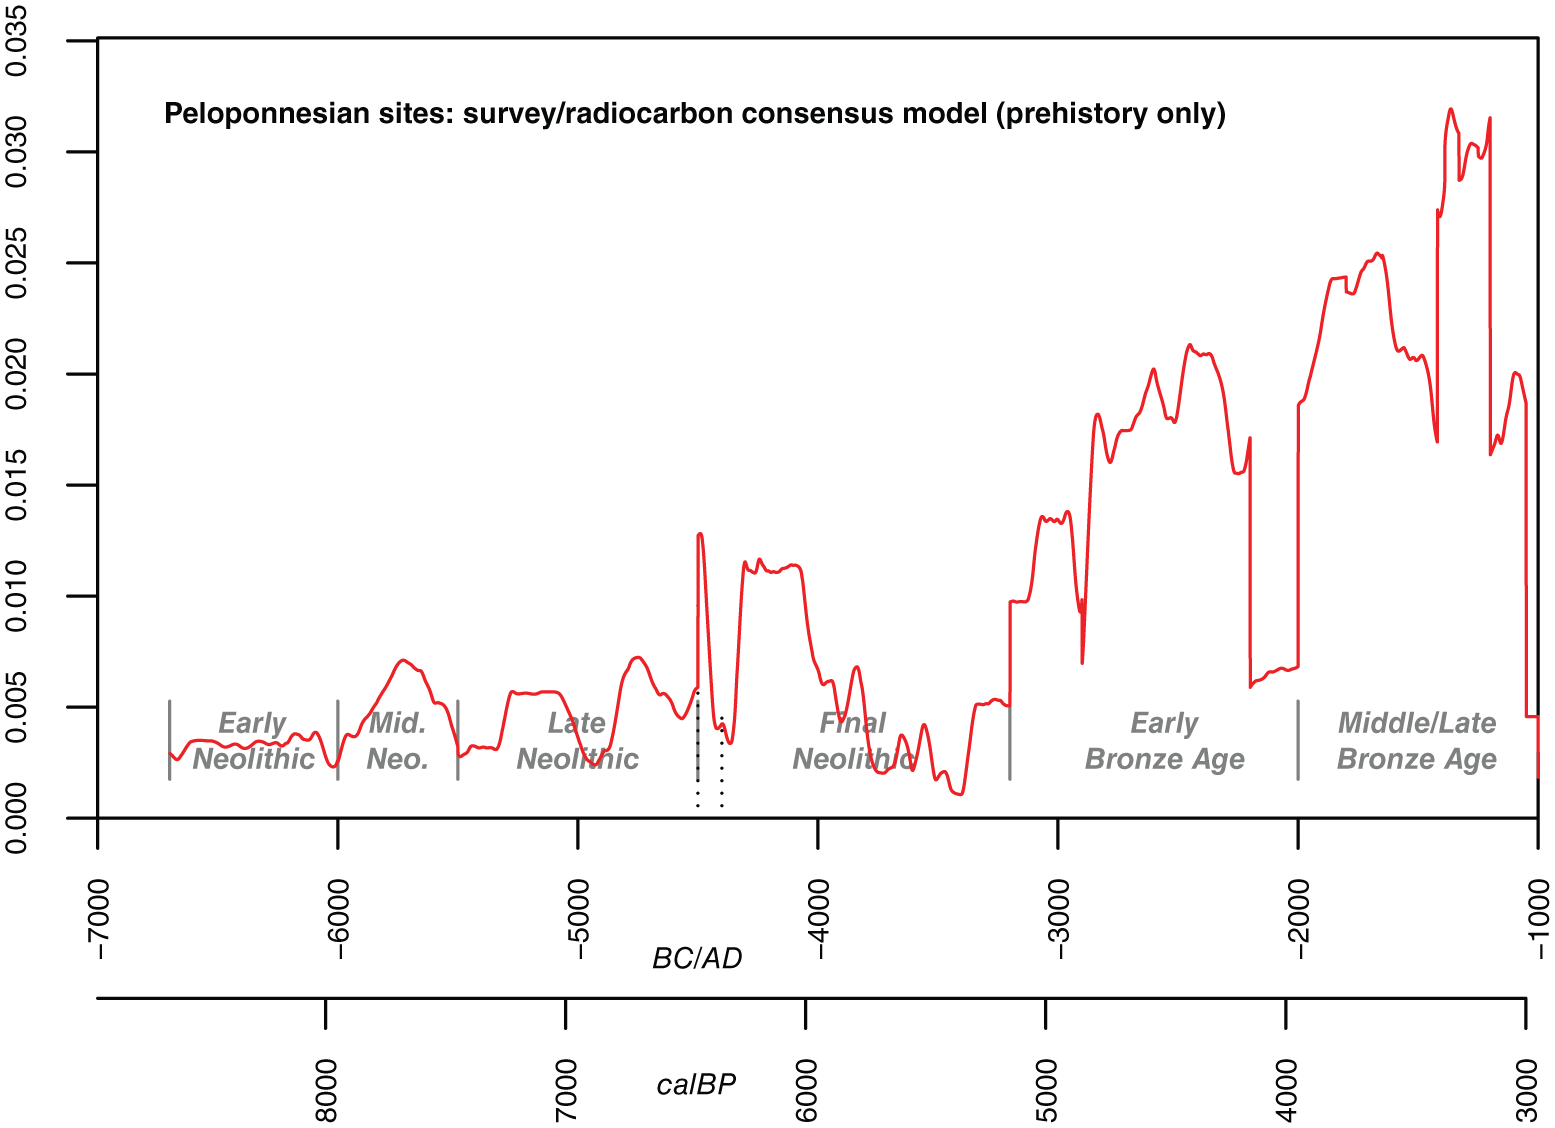
An example consensus model of the intensity of human activity, combining evidence from surveyed site areas and radiocarbon dates, based on data from prehistoric Peloponnese (cf. Figures 3 and 5) (a small spike in the mid 5th millennium BC, marked with dotted lines, is an artefact of the problematic periodisation at this point).
Spearman’s Rank correlations (Table 2) indicate that the demographic proxy (SPD of radiocarbon dated sites) is negatively correlated with changes in AP for both regions, which implies that when there are greater populations there are fewer trees. However, this correlation is only statistically significant for the north, and all correlations listed in Table 2 are generally low (<± 0.5) compared with other parts of the Mediterranean (see further analyses by Roberts et al., this volume: Table 3), indicating that the analysed relationships are more complex in Greece than in many other regions. As expected, the pollen indicator groups, which are reflective of human land use, generally show positive correlations with SPD, meaning that their prevalence increases with increasing population. The PDI shows the strongest significant positive correlation with SPD in the south and for the sub-regions combined, which suggests that when populations are larger, there is greater vegetation disturbance. Regional pastoral indicators do not show significant correlations, which may be because this indicator group derives from pollen sites in France (Mazier et al., 2006), and may be less relevant here. Overall, however, the SPD does seem to correlate better with the indicators of animal breeding (PDI), than with cultivation. This should be compared with results by Roberts et al. (this volume) who single out tree cultivation indicators (OJC with the addition of Vitis) as the best pollen-based indicator of human activity in the Mediterranean basin. In mainland Greece, the correlation between SPD and OJC is only statistically significant in the south, but split on the components, Juglans is positively correlated with SPD in the north and Olea in the south, highlighting the different bioclimatic conditions of the sub-regions. Although these patterns do seem to correspond with expected patterns, that is more people use greater areas of land for agriculture, the relatively weak correlations indicate again that in the drier parts of the Mediterranean especially, such as in (southern) Greece, the relationships between vegetation and population are complex over the long-term Holocene time frame (Roberts et al., this volume).
Spearman’s Rank Correlation Coefficient (R-values) value matrix for the period 10000–2800 BP for northern and southern Greece and both regions combined. Statistical significance in bold values (p < 0.05).
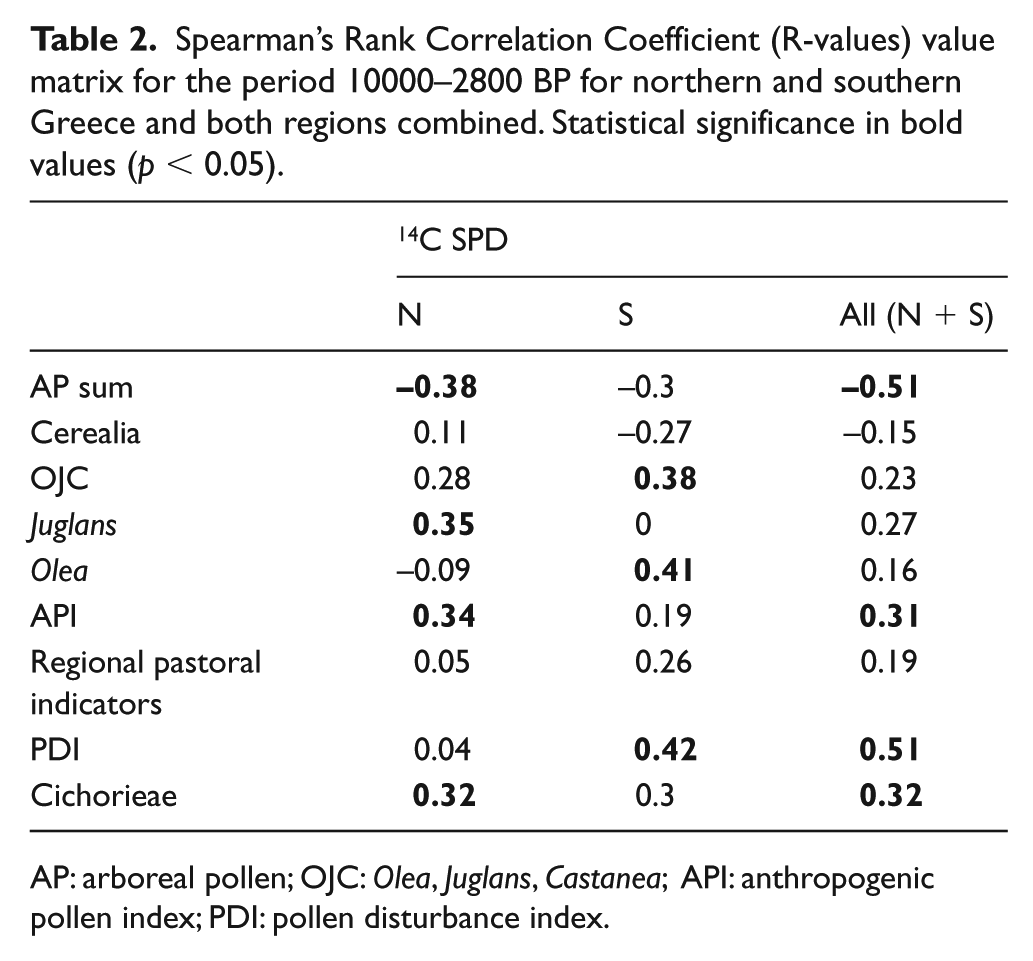
AP: arboreal pollen; OJC: Olea, Juglans, Castanea; API: anthropogenic pollen index; PDI: pollen disturbance index.
Discussion
The results presented so far provide a general overview of the trends highlighted by aggregating radiocarbon dates, synthesising pollen analyses and combining site surveys for the Peloponnese and Macedonia. In the following discussion, we set out to integrate the three primary datasets and describe Greece’s changing socio-ecological trajectories, with special emphasis on three periods and themes that have been prompted by the results in one or more of the datasets.
The onset of farming and Neolithic land use
Farming naturally brought major changes to land use and economic strategies in Greece. The lower SPD in the earliest Neolithic suggests a gradual emergence and demographic increase in farming communities that is consistent with archaeological information from both sub-regions. The dramatic rise ~8500 BP in the north represents the beginning of EN in Thessaly (Reingruber et al., 2017), but early radiocarbon dates also come from Macedonia, especially from the Yannitsa plain (Maniatis, 2014; Maniatis et al., 2011). Many regions in the north, however, remain sparsely populated in the EN and in western Macedonia LN and/or FN sites clearly outnumber EN and/or MN sites (Andreou et al., 2001: 296–297) as also suggested by the site data from Macedonia (Figure 4). The same pattern can be noted for the south (Figure 5), with a low number of EN sites, increasing number and size during MN and a general expansion in site numbers in LN/ FN. Comparing the two sub-regions, however, the SPD illustrates well the often noted and confirmed north‒south demographic divide (Kotsakis, 2014; Mee, 2007), with overall smaller sites within larger territories in the south and larger and more densely placed sites in the north, likely resulting in an overall larger Neolithic population in the north. There is also a positive correlation between SPD for the north and wetter climatic conditions around 8900‒8300 BP, suggesting that the initial spread of farming was favoured by climate circumstances (Roberts et al., this volume: Figure 5b).
The results of the increased human pressure inferred from SPD and archaeological site data are not very clear in the pollen record, and it is possible to suggest that pollen archives often exhibit a local pattern characterised as ‘influence’ during the Neolithic, but then humans have a greater ‘impact’ during the Bronze Age (Mercuri et al., this volume). This is in line with recent conclusions, based on anthracological data and other palaeoecological materials, that Neolithic communities in the north had only a local, modest effect on the surrounding landscape (Marinova and Ntinou, 2018; Ntinou, 2014). Nevertheless, the imprint of early human activities has been evidenced in pollen records originating from sites close to human activity centres already by the EN (Glais et al., 2016), becoming even more evident during the MN‒LN (Glais et al., 2016; Kouli, 2015) in northern Greece. The overall AP remains nevertheless high in the Neolithic north, with possible troughs indicating more open landscapes in EN and LN, corresponding to low levels of deciduous oak woods ~8200 BP and ~6500 BP (Figure 4b), which may correlate with the effect of the initial EN expansion into the area and settlement diversification noted for LN/FN. On the whole, the LN period seems to be one of increasing site numbers and the colonisation of more marginal lands (Andreou et al., 2001). The EN setback in forest cover may also have been influenced by the 8.2 ka cold climate event (Gkouma and Karkanas, 2018; Kotthoff et al., 2008; Pross et al., 2009; Weninger et al., 2006, 2014).
Evidence from the south is in partial contrast to this northern pattern, but ultimately the differences between them may be primarily because of the different locations of cores in the two regions (relative to vegetation zones and in extension to the intensity of human activity in the vicinity). AP for the south suggests a notable opening of the landscape in the MN period (7500 BP) followed by a regeneration during LN (Figure 7c). The MN low point can conceivably be connected to the establishment of larger settlements in the coastal plains (and thus close to the core locations) (Cavanagh, 2004). The regeneration of the forest cover in combination with decreasing API and PDI values during LN indicate a change that perhaps can be seen as the result of a diversification of the settlement and/or herding patterns into areas further away from the coast (and hence further away from the pollen core locations). Isotopic evidence from LN Kouphovouno, SE Peloponnese, suggests shrinking herd sizes from MN to LN and more spatial diversity in grazing grounds (Vaiglova et al., 2014), which may lead to an overall diminished effect of pastoral activities to be recorded in the pollen records (cf. Halstead, 2000). It should also be borne in mind that the number of pollen sites in southern Greece prior to ~8000 BP is small (Figure 6b) and that reconstructed vegetation and land cover changes in this sub-region during the EN must therefore be tentative.
FN/EBA
The transition to the Bronze Age, and specifically the period ~6500‒5000 BP, has recently seen renewed attention (Dietz et al., 2018; Horejs and Mehofer, 2014; Tsirtsoni, 2016c). Special emphasis has been placed on the absolute chronology of the period but despite a concerted effort, very few radiocarbon dates have been found that cover the ‘missing millennium’, the FN/EBA transitional period from ~5950‒5250/4950 BP (Maniatis et al., 2014) (Table 1). This pattern is supported in the north by the abandonment of many well-known Neolithic sites in the LN or early FN, such as Servia, Mandalo, Sitagroi and Dikili Tash (Andreou, 2010; Andreou et al., 2001; Maniatis et al., 2011; Maniatis and Kromer, 1990; Renfrew, 1971). Conversely, some surveys in the south instead give evidence of increased numbers of sites (Figure 5; Bintliff and Sarri, 2018) and a second wave of colonisers moving into the Cycladic islands is also proposed for the LN‒FN (Broodbank, 2000), suggesting perhaps an overall increase in activity, or at least in mobility (Parkinson et al., 2018). The long duration of the FN period (>1000 years), makes it probable, however, that the rise in site numbers suggested at first by southern surveys is much less significant than it appears or manifests in only part of the period, for example, at its beginning and/or end (cf. the difference between Figure 5a and c). The consensus model (Figure 8) downplays the amplitude of change but also still suggests that an overall drop in activity in the middle of the FN period is compatible with both survey and radiocarbon evidence once the chronological uncertainty of the former is taken into account (cf. Tsirtsoni, 2016a). The fact that sites dated FN/EBI are often detected in surveys and hence normally not radiocarbon dated nevertheless suggests that the inferred low population levels are to some extent a research bias. The abandonment of large sites may therefore signify a relocation of population in the landscape rather than a complete abandonment of regions, as exemplified by the site of Servia, where several smaller FN sites appeared nearby, only to be abandoned when Servia was reoccupied in the EBA (Andreou et al., 2001; cf. Alram-Stern, 2014; Tsirtsoni, 2016b). Furthermore, increased regionality noted for LN-FN pottery from the Peloponnese (Mee, 2007), in consort with settlement dispersal noted in both regions, signify a more fragmented and heterogeneous social landscape (Kotsakis, 2014). Such a landscape may result in a less visible archaeological record overall.
Interestingly, pollen evidence from both regions suggests a trend during the period towards decreasing values of deciduous oak wood from a ~6000 BP high point to a ~5250‒5000 BP low point, suggesting, in contrast to the SPD, an increased overall human pressure on the landscape. The point of departure for this trend, however, is the result of a ‘closing’ of the deciduous oak woods that would suggest decreasing human pressure during early FN. This peak is especially notable in northern Greece but represented also in the south by a 200-year period (from ~6200 BP). At the same time, both API and PDI levels show overall higher levels during this ‘missing millennium’ than just before and after (Figure 7). This is especially notable in the pastoral indicators in the north, while in the south, PDI shows clearly increased values from ~6300 BP to ~5500 BP. High pastoral activity (PDI, and overall API) in the coastal Peloponnesian records could mean a change towards strategies in which the herds were kept closer to the settlements, regardless of location (cf. Valamoti, 2007). Also Cerealia show relatively high levels in both regions (with a peak just before 6000 BP in the north) and the levels remain higher during FN than in the preceding Neolithic phases. It should be noted, however, that the early Cerealia signal in the north is almost exclusively made up of samples from the Orestias record and likely signifies the intensity of cultivation in the lakeside settlement of Dispilió, settled from MN to EBA (Karkanas et al., 2011; Kouli, 2015). This circumstance highlights the local character of Cerealia pollen but also that it may be underrepresented in the overall northern record because coring locations tend to be away from archaeological sites (cf. Glais et al., 2016).
These results from pollen and archaeology during the FN (and early EBA) are clearly inconsistent and the evidence remains inconclusive. Indications for low inferred population coexist with relatively high values for anthropogenic pollen indicators, suggesting a complex pattern of human-environment dynamics. It should furthermore be noted that the period from 6000 to 5000 BP corresponds to a phase of enhanced aridity during the transitional period from the overall wetter conditions of the early Holocene to a generally drier situation in the Balkan region (Figure 6; see also Finné et al., this volume). The period also overlap with an interval of colder conditions recorded in the Aegean Sea (Rohling et al., 2002). This pattern clearly adds further complexities and such arid conditions may have had (long-term) effects on deciduous oak woods, for example. Climate change can therefore not be excluded as a partial driver behind noted vegetation changes, and possibly any associated cultural changes (Lespez et al., 2016; Roberts et al., this volume).
Variabilities in land use across time
One clear trend through time is an increasing scale and complexity of anthropogenic impact from the onset of the Neolithic until the present (Bintliff, 2012; Weiberg et al., 2016). In all accounts, for example, the Bronze Age represents a significantly more complex social structure (in the diversity of material culture and scale of supra-regional connectedness) and came with a much larger overall environmental footprint than the Neolithic. Although local demographic trends may not always follow this general trajectory (both small and large regions can be sparsely or densely populated regardless of wider trends), archaeological site data does nevertheless suggest a slow densification of settlements in the landscape through time (Figures 4 and 5 and combined with SPD in Figure 3). The effect of this trajectory is likely evidenced by the decrease in deciduous oak woods during the Neolithic and the continued low levels thereafter (Figure 6). Notably, this general trend for deciduous oaks closely follows the overall climate trend identified for the Balkan region with a long-term drying trend from ~8000 BP to ~3500 BP (Figure 6; also Finné et al., this volume; cf. Roberts et al., this volume). This is yet another indication that climate should not be disregarded as a partial driver for noted changes in vegetation. This long-term trend, however, is not linear. Significantly, the second half of the EBA constitutes an overall wetter period that may very well have been conducive to the expanding settlement patterns during this period (Weiberg and Finné, 2013). The period ~4250‒3500 BP, from the end of the EBA until early LBA, constitutes an extreme low in deciduous oak woods in an otherwise continuous (albeit fluctuating) record of this vegetation type (cluster 6.1). This low is present in both regions and results in a relative increase in the visibility of pine woods (cluster 5.1) as well as deciduous oak parkland (cluster 6.2) and pasture/wetland (cluster 3.0). Pines, especially, are known to rapidly expand in disturbed areas (Bottema and Woldring, 1990; Kouli, 2012), and an increase of the taxon is common to several late-Holocene pollen records from southern Greece (Jahns, 1993; Kouli et al., 2009; Triantaphyllou et al., 2010).
Interestingly, the SPD and site data diverge completely in both sub-regions 4250‒3500 BP (Figures 4 and 5): while site numbers are increasing in the north, SPD is decreasing, and while site numbers are relatively low in the south, the SPD presents an all-time high. These marked contradictions require further examination. Moreover, the initial phase of the period ~4250‒3500 BP corresponds to a period of dry climate conditions in the Eastern Mediterranean region in general, including the so-called 4.2 ka event (Zanchetta et al., 2016), and local evidence of dry conditions recorded in a speleothem stable isotope record from the Mavri Trypa Cave, SW Peloponnese (Finné et al., 2017). In addition, a N‒S time-transgressive aridification gradient, correlated to the 4.2 ka event, has also been recorded in the Aegean Sea (Triantaphyllou et al., 2014). Such dry conditions could clearly have been unfavourable for oak wood regeneration. Furthermore, the subsequent partial regeneration of the deciduous oak woods (from ~3500 BP) corresponds in time with the probable expansion of population and overall activities in the landscape by the onset of the Mycenaean palatial era and suggests that anthropogenic factors may not have been the main driver behind the changes in the oak woods at that time. Although the average Balkan climate trend suggests dry conditions during LH III (3350‒3000 BP, see Finné et al., this volume), the Mavri Trypa record, also included in the calculations of the average Balkan trend, indicates overall wetter conditions during the Mycenaean palatial period (Finné et al., 2017; cf. Weiberg et al., 2016). This indicates local variability between the N and S part of the Balkan region and the results suggest, like for the EBA, that expanding settlement patterns and overall economic wellbeing in southern Greece may have been supported by benign climate conditions (Weiberg and Finné, 2018; cf. Roberts et al., this volume).
Increased anthropogenic (API, PDI; Figure 7) indicators are recorded from the LBA in both sub-regions, although more subdued in the north, and suggest economic expansion in line with an increased number of sites and inferred population growth. The first evidence for extensive agricultural and herding strategies has also been identified during the LBA (Halstead, 1999; Nakassis et al., 2011), which from then on would to varying degrees have constituted a complement to small-scale mixed and more intensively practised agriculture (Halstead, 2000). Although environmental effects of small-scale mixed farming may very well be recorded by nearby pollen cores (Glais et al., 2016), extensive strategies – in effect larger fields and herds – are more likely to have large-scale effects on the palynological record (Halstead, 2000). Indicatively, the LH III period and especially the early phases of the historical period (from ~3000 BP) stand out as a watershed for the pollen-based anthropogenic indices in the pollen records and signify an overall change in the scale of land use in Greece. In both regions, pasture/wetland (cluster 3.0) initially reached a low point (~3200‒2200 BP) and thereafter gradually increased until early modern times (Figure 6). This change did not develop similarly in the two regions, but rather more strongly in the south (at the expense of sclerophyllous parkland, cluster 1.1) and accentuated in the north only after ~1700 BP (corresponding to a drop in deciduous oaks). It should be noted also that this cluster combines two different ecosystems (upland pasture and shallow marshy wetlands) and its fluctuating values should be interpreted with caution and in combination with other indices.
In the south, then, low values of pasture/wetland (cluster 3.0) correspond to a period of high API values that continue from LH III with a double peak ~3300 and 2300 BP, with PDI following the same pattern and both mainly driven by high values of chicory (Cichorieae: Figure 7). OJC exhibits a very profound increase from ~3000 BP and a sharp fall after ~2000 BP following the curve of Olea. Deciduous oak woods begin to regenerate from ~3500 BP, but a stronger signal (and an overall peak in AP) is evident from ~2000 BP. This intensification of the signal coincides with a distinct drop in OJC, API and PDI. The double API peak then coincides with the high point in site numbers during LH III and during the Archaic to Hellenistic periods (Figure 5). Notably, the peak during LH III is driven by pastoral indicators, while in the historical period peaks are made up of both pastoral indicators as well as OJC (and especially Olea). The pollen record therefore seems to reflect the LH III focus on cereal cultivation and pastoral activities, with large herds of sheep geared at supplying wool to the palatially controlled textile industry (e.g. Killen, 1984). In contrast, the levels of Cerealia instead decline thereafter until a ~2500 BP low (Figure 7). It is therefore probable that an increasing population in the south during the early historical periods was engaging more actively in olive cultivation (based on the rise in OJC) and pastoral activities (based on high values of Cichorieae), and covered more of their cereal needs by importing grain from abroad (for a discussion of the significance of grain imports in this period, see Bresson, 2016; for evidence on Archaic to Hellenistic olive cultivation, see Foxhall, 2007). Aridity could potentially have been conducive of this change in strategies, with olive cultivation and herding being more sustainable during the accentuated dry conditions in the south ~3150‒2450 BP (Finné et al., 2017; Norström et al., 2018; Weiberg et al., 2016). The Balkan climate records suggest that climate conditions improved after ~2500 BP (Figure 6; with notable variability within the region, see Finné et al., this volume), and it appears that the most extensive use of the landscape in Classical and Hellenistic times had the benefit of wetter conditions. From ~1300 BP (AD 650), however, a new trend towards drier conditions was initiated, continuing until the modern day. The drop in anthropogenic indicators and the regeneration of the oak woods ~2000‒800 BP in the south corresponds to the Roman and early Byzantine periods. The Roman period especially is known for large-scale economic reorganisations with large agricultural estates generally replacing the earlier dispersed pattern of small settlements and farmsteads spread across the landscape as a complement to polis centres (Alcock, 1993; Bintliff, 2013; Rizakis, 2013, 2014). In this new economic context, olive cultivation seems to have played a less significant role compared with the preceding periods (with olive oil presumably imported, perhaps from the Levant: Palmisano et al., this volume). Herding appears also not to have been pursued to the same degree as before, with regeneration of deciduous oak woods (and generally increased AP) as a result and a much diminished imprint on the palynological record, although temporarily increased pastoral activity is evidenced in the Roman period (peak at ~1650 BP). The Late Roman/early Byzantine phase, however, although known as an expansive period (Izdebski et al., 2015; Weiberg et al., 2016), is less visible in the cluster analysis and anthropogenic indicators of the present study compared with the subsequent economic and agropastoral expansion during middle Byzantine times (Weiberg et al., 2016; Xoplaki et al., 2016).
Notably, the record from the north displays less of the boom and bust cycles present in the southern records, both in the pollen and the archaeological datasets, possibly reflecting the distance from the heartland of historical Greece in the south, and the high altitude locations of the large majority of the pollen cores. The change across time is instead overall more gradual. However, evidence for increased human pressure in the landscapes of the north from ~3000 BP does exist and includes increasing values of OJC (although much less distinct) and API, as well as all pastoral indicators (Figure 7). The period (from ~3250 BP) also sees some increase in deciduous oak woods, possibly as a result of a closing of the deciduous oak parkland landscapes, but deciduous oak woods decline again along with AP after ~2000 BP. The site numbers for the north do not provide evidence of any major changes during this period (Figure 4). However, the fact that Cerealia continuously increases in the region from ~3000 BP (with a notable peak ~1800 BP, in the Roman period) would seem to suggest that the economic strategies were less specialised in the north compared with the south, and that grain cultivation expanded over the whole region. Such cultivation could have been for local use but possibly also for export, in a region that because of bioclimatic conditions may have been more favourable for grain cultivation than the overall more arid south. Considering that Olea pollen are overall very rare in the north (Figure 7) and that no olive charcoal or olive stones have been recovered from prehistoric archaeological contexts in the north (Valamoti et al., 2018), the presence of Olea pollen in the prehistoric north should not be seen to indicate definite olive cultivation. The prevalence of olive stones from historical contexts in the north, however, suggest that more pollen cores from low altitude coastal locations may alter the visibility of olive pollen from the region for these later periods. According to Valamoti et al. (2018), cultivation of olives in the north was initiated in the littoral regions before 2500 BP and is attributable to the Greek colonisation of these northern lands and the increasing needs of olive oil in the Archaic and Classical Greek societies.
Conclusion
This study demonstrates that the imprint of human activities on pollen records from Greece is more clearly visible in the later prehistoric and historic periods (from LH III onwards) in line with the emergence of more extensive agricultural strategies. This result also confirms arguments made by Mercuri et al. (this volume) that Mediterranean land use before the LBA did not have a lasting effect on overall vegetation. In earlier periods, the location of pollen cores is an important factor, leading to opposite patterns in the south and north over the EN-LN time frame. More precisely, we probably see two sides of the same coin in these Neolithic phases because of the coastal location of the southern cores and the upland locations of the pollen cores in the north, signifying for both sub-regions a partial abandonment of coastal areas after the MN in favour of a more diversified use of the landscapes in the LN. More systematic and targeted core sampling in both regions could normalise these differences. During these early periods and into the Bronze Age, climate stands out as a potentially strong driver of vegetation changes over the long-term, amplifying the effect of changes caused by humans and possibly controlling regrowth, such as in the case of deciduous oak woods.
The radiocarbon SPD has also proven a useful tool for finding consistency and contrast in possible prehistoric population scenarios across the two sub-regions, and it is reassuring that the highs and lows of this time series consistently confirm traditionally identified cultural peak-and-trough-periods in Aegean prehistory. Radiocarbon densities also emphasise a likely increasing human presence in the LBA in a way that raw counts of archaeological site data do not while furthermore nuancing narratives about the FN-EB I periods (especially in the south where surveys show a strong increase in site numbers that may only apply at the beginning and/or end of this long phase). That said, the amplitudes of the SPD should be treated cautiously and probably in relative rather than absolute terms given the overall sample size (e.g. without necessarily taking at face value equal amplitude of the earlier Neolithic and EBA inferred population levels, cf. Timpson et al., 2014; cf. Roberts et al., this volume). The consensus modelling attempted here builds on previous efforts (e.g. Palmisano et al., 2017) to suggest ways in which the strengths of different lines of evidence might be brought together. Multi-proxy analysis and inter-disciplinary communication are key to such integrative efforts and for the successful integration of the diverse and specialised archives available for the reconstruction of socio-ecological trajectories across time.
Supplemental Material
Supplementary_Table_1_(Radiocarbon) – Supplemental material for Long-term trends of land use and demography in Greece: A comparative study
Supplemental material, Supplementary_Table_1_(Radiocarbon) for Long-term trends of land use and demography in Greece: A comparative study by C Neil Roberts, Ralph Fyfe, Stephen Shennan, Andrew Bevan, Jessie Woodbridge, Alessio Palmisano, Erika Weiberg, Andrew Bevan, Katerina Kouli, Markos Katsianis, Jessie Woodbridge, Anton Bonnier, Max Engel, Martin Finn�, Ralph Fyfe, Yannis Maniatis, Alessio Palmisano, Sampson Panajiotidis, C Neil Roberts and Stephen Shennan in The Holocene
Supplemental Material
Supplementary_Table_2_(Pollen) – Supplemental material for Long-term trends of land use and demography in Greece: A comparative study
Supplemental material, Supplementary_Table_2_(Pollen) for Long-term trends of land use and demography in Greece: A comparative study by C Neil Roberts, Ralph Fyfe, Stephen Shennan, Andrew Bevan, Jessie Woodbridge, Alessio Palmisano, Erika Weiberg, Andrew Bevan, Katerina Kouli, Markos Katsianis, Jessie Woodbridge, Anton Bonnier, Max Engel, Martin Finn�, Ralph Fyfe, Yannis Maniatis, Alessio Palmisano, Sampson Panajiotidis, C Neil Roberts and Stephen Shennan in The Holocene
Supplemental Material
Supplementary_Table_3_(Site_survey) – Supplemental material for Long-term trends of land use and demography in Greece: A comparative study
Supplemental material, Supplementary_Table_3_(Site_survey) for Long-term trends of land use and demography in Greece: A comparative study by C Neil Roberts, Ralph Fyfe, Stephen Shennan, Andrew Bevan, Jessie Woodbridge, Alessio Palmisano, Erika Weiberg, Andrew Bevan, Katerina Kouli, Markos Katsianis, Jessie Woodbridge, Anton Bonnier, Max Engel, Martin Finn�, Ralph Fyfe, Yannis Maniatis, Alessio Palmisano, Sampson Panajiotidis, C Neil Roberts and Stephen Shennan in The Holocene
Footnotes
Acknowledgements
The authors would like to thank the Swedish Research Council, the Institute of Aegean Prehistory and the Leverhulme Trust for generous funding. In particular, this paper emerged out of a workshop held in Mallorca in September 2017 under the umbrella of the Leverhulme-funded project Changing the Face of the Mediterranean: Land Cover and Population since the Advent of Farming (RPG-2015-031), a Plymouth-UCL collaboration. Pollen data were extracted from the EPD (![]() ), and the work of the data contributors and the EPD community is gratefully acknowledged as well as the work by those involved in maintaining or managing the databases (Michelle Leydet and Basil Davis). The authors would like to thank all those who have taken the original samples for radiocarbon dating from Greece or compiled and archived them for wider use by the research community. Furthermore, unpublished BP dates and relevant metadata were also kindly provided by the NCSR Demokritos Radiocarbon Laboratory. The generous support of the Institute of Aegean Prehistory (INSTAP) to Yannis Maniatis for the radiocarbon dating of Early Neolithic settlements all over Greece is highly acknowledged and appreciated. The authors also thank two anonymous Holocene reviewers for their helpful suggestions. This study is a contribution to the LandCover6k working group of Past Global Changes (PAGES), which in turn received support from the Swiss Academy of Sciences.
), and the work of the data contributors and the EPD community is gratefully acknowledged as well as the work by those involved in maintaining or managing the databases (Michelle Leydet and Basil Davis). The authors would like to thank all those who have taken the original samples for radiocarbon dating from Greece or compiled and archived them for wider use by the research community. Furthermore, unpublished BP dates and relevant metadata were also kindly provided by the NCSR Demokritos Radiocarbon Laboratory. The generous support of the Institute of Aegean Prehistory (INSTAP) to Yannis Maniatis for the radiocarbon dating of Early Neolithic settlements all over Greece is highly acknowledged and appreciated. The authors also thank two anonymous Holocene reviewers for their helpful suggestions. This study is a contribution to the LandCover6k working group of Past Global Changes (PAGES), which in turn received support from the Swiss Academy of Sciences.
Declaration of conflicting interests
The author(s) declared no potential conflicts of interest with respect to the research, authorship and/or publication of this article.
Funding
Weiberg, Bonnier and Finné’s work was supported by the Swedish Research Council (grant no.: 421-2014-1181; for the project Domesticated Landscapes of the Peloponnese, DoLP) while Bevan, Woodbridge, Palmisano, Fyfe, Shennan and Roberts’s work was supported by the Leverhulme Trust (grant number RPG-2015-031; for the project Changing the face of the Mediterranean: land cover and population since the advent of farming). Katsianis, Bevan and Shennan’s collection of the radiocarbon dates was supported by an Institute of Aegean Prehistory (INSTAP) grant, and INSTAP provided support for radiocarbon dating performed by Maniatis.
Supplemental material
Supplemental material for this article is available online.
Notes
References
Supplementary Material
Please find the following supplemental material available below.
For Open Access articles published under a Creative Commons License, all supplemental material carries the same license as the article it is associated with.
For non-Open Access articles published, all supplemental material carries a non-exclusive license, and permission requests for re-use of supplemental material or any part of supplemental material shall be sent directly to the copyright owner as specified in the copyright notice associated with the article.