
Abstract
The Greenland Ice Sheet has experienced significant mass loss in recent years. A substantial component of this is attributable to the retreat of marine-terminating outlet glaciers, which lose mass through increases in calving, submarine melting and terrestrial meltwater discharge. In terms of iceberg production, Jakobshavn Isbræ is the largest marine-terminating glacier in Greenland, yet relatively little is known about its history before the first glacier margin observations in 1851. Two marine sediment cores obtained 15 and 19 km northwest from the mouth of Jakobshavn Isfjord were analysed to reconstruct the past behaviour of Jakobshavn Isbræ and to investigate the response of the glacier system to ocean forcing. These records provide long-term (~2000) context for assessing the significance of the rapid changes in glacier stability over the last century. The X-ray imagery and high-resolution grain size analysis from both cores reveal distinct multi-centennial-scale changes in the flux of iceberg-rafted debris (IRD) from Jakobshavn Isbræ. Foraminiferal analysis shows that variability in the relatively warm West Greenland Current (WGC) may have been an important driver of calving activity at Jakobshavn Isbræ. We find that iceberg rafting and WGC inflow were relatively high from onset of the record, at 60 BC, until AD 1100. Subsequently, the inflow of the WGC into Disko Bugt decreased. This was accompanied by a dramatic reduction in IRD from AD 1500 to 1850, which is attributed to the establishment of a floating ice tongue. We also show that ocean warming in the 20th century is part of a longer-term warming trend in the WGC which started at around AD 1700. Finally, these new records underline the complexity of glaciomarine sediments; IRD variability was driven by the inflow of the WGC but was also modulated by a complex interplay of air temperature, sea-ice coverage and ice margin proximity.
Keywords
Introduction
Measurements and observations of volumetric changes of the Greenland Ice Sheet (GrIS) have improved significantly over the past two centuries. The first glacier observations and temperature measurements were obtained in the late 18th century (Box, 2002; Box et al., 2009; Joughin et al., 2004; McMillan et al., 2016; Vinther et al., 2006). The advent of satellite imaging in the late 1970s and subsequent advances in radar altimetry, laser altimetry and gravimetric monitoring have led to substantial improvements in our understanding of the magnitude and causes of mass loss (Chen et al., 2006; Pritchard et al., 2009; Shepherd et al., 2012). The GrIS has experienced a dramatic decrease in the total mass balance since the beginning of the 20th century, which has included rapid retreat of the majority of marine-terminating glaciers around Greenland (Alley et al., 2010; Box and Colgan, 2013; Kjeldsen et al., 2015; Weidick and Bennike, 2007). Given the vast quantities of freshwater release associated with glacier instability, an improved understanding of the processes of ice-sheet change, and the underlying forcing mechanisms, is crucial for improving future predictions of global sea-level rise and changes in the thermohaline circulation in the North Atlantic (Holland et al., 2008; Straneo et al., 2013). Oceanic and atmospheric warming are thought to be primary drivers of marine-terminating glacier retreat in Greenland (Andresen et al., 2012b; Holland et al., 2008; Rignot et al., 2012; Straneo et al., 2011). However, further data linking oceanographic and glacio-dynamic processes are required to better understand the physical processes and their evolution at longer timescales than are available from instrumental records (Straneo and Heimbach, 2013). Furthermore, individual glaciers often exhibit unique responses to changes in external forcing and it is therefore crucial to study glaciers across a wide variety of physical settings (Carr and Hiemstra, 2013; Enderlin et al., 2013).
Geological records can be used to reconstruct past environmental conditions beyond instrumental records and provide valuable empirical data for understanding how the GrIS responds to atmospheric and oceanographic changes. Long-term reconstructions of glacier behaviour also provide context for assessing the magnitude, frequency and duration of recent changes. Here, we extend the record of glaciological change and oceanic variability at Jakobshavn Isbræ two millennia back in time by analysing marine sediment cores from Disko Bugt (Figure 1). Oceanographic variability is reconstructed from benthic foraminifera assemblages. Glaciological behaviour is tracked by measuring the abundance of iceberg-rafted debris (IRD) originating from Jakobshavn Isbræ. We combine these records to assess the stability of Jakobshavn Isbræ in response to oceanic and climatic forcing through the late Holocene.
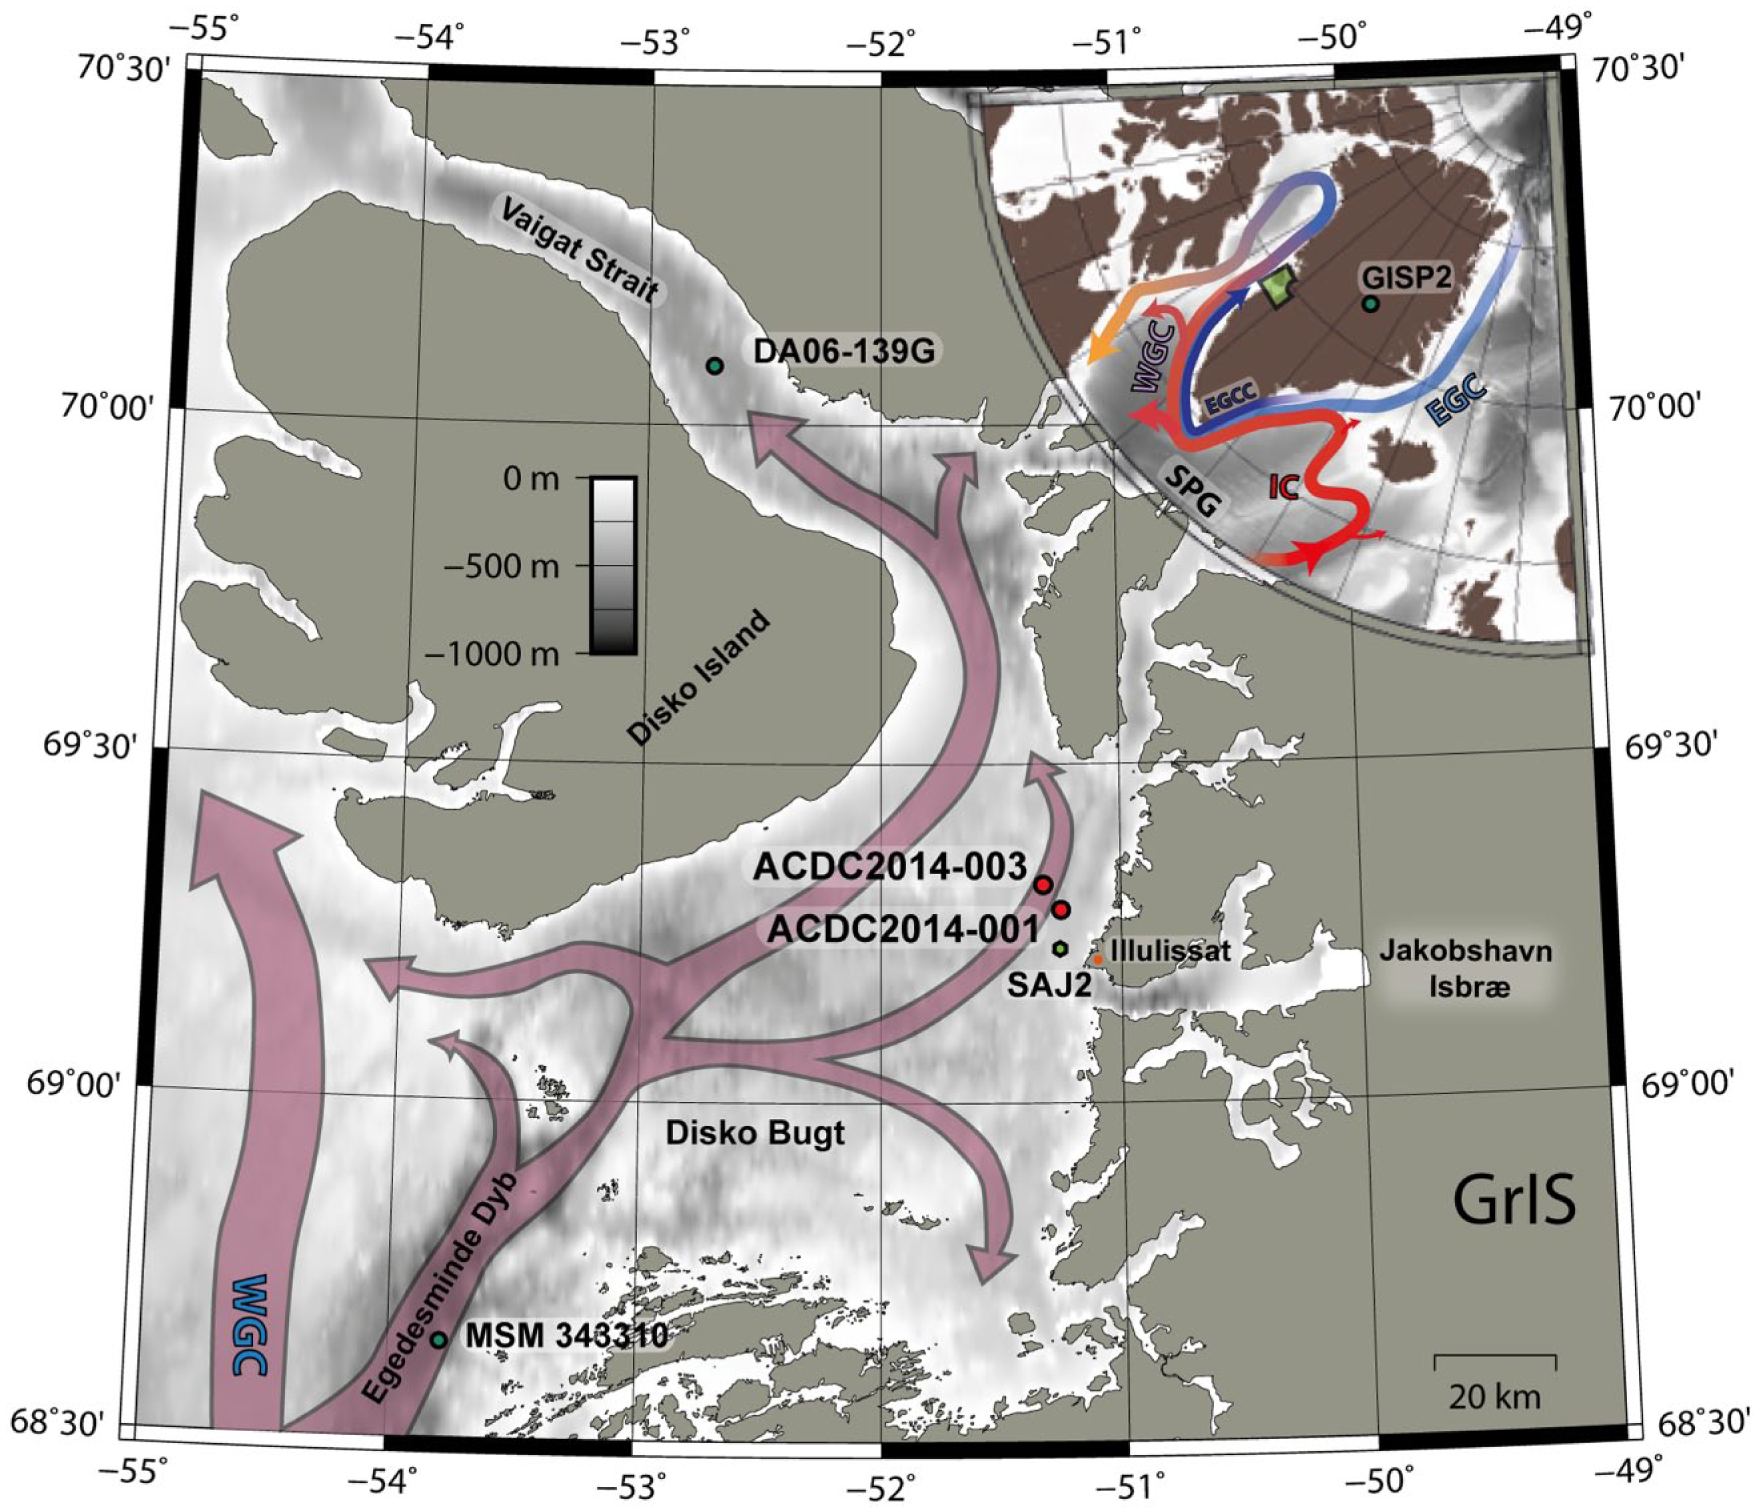
Map of Disko Bugt area with core locations indicated by red dots and other stations mentioned in the text by green dots. Main pathways of the West Greenland Current (WGC) are shown with red arrows (adapted from Ribergaard et al., 2006). Inset map shows Greenland and major surface ocean currents (Straneo et al., 2012). East Greenland Current (EGC), Irminger Current (IC), East Greenland Coastal Current (EGCC) and West Greenland Current (WGC) south of Greenland the IC forms the Subpolar Gyre (SPG). Bathymetric data are from the IBCAO v3 (Jakobsson et al., 2012). The figure was produced using GMT (Wessel et al., 2013).
Study area
Disko Bugt is a ~40,000 km2 embayment in West Greenland (Figure 1). The bay is generally 200 to 400-m deep, but maximum water depths of ~1100 m b.s.l. are found in Egedesminde Dyb (Hogan et al., 2012). The oceanography in Disko Bugt is dominated by the inflow of a branch of the West Greenland Current (WGC). The WGC is formed by the mixing and coupling of the Irminger Current (IC) and the East Greenland Current (EGC) as they flow northwards along the coast of southwest Greenland (Ribergaard et al., 2006). The IC brings relatively warm, saline water sourced from the North Atlantic Current, whereas the EGC bears cold and relatively fresh water from the Arctic Ocean (Figure 1). The two individual water masses are distinguishable within Disko Bugt. The IC component, which forms the bottom water in Disko Bugt, is characterised by temperatures of 2.5–3.5 °C and salinities between 32.5 and 34.8 psu. Intermediate waters are derived from the EGC and are typically characterised by temperatures between 1 and 3 °C and salinities of 32–33.7 psu (Andersen, 1981; Beaird et al., 2017). The WGC enters Disko Bugt from the southwest and exits the bay primarily through Vaigat Strait in the north (Ribergaard et al., 2006). Surface waters (0–50 m b.s.l.) are cold and fresh (−1 to 0°C and down to 25 psu), which reflects the influence of sea ice, icebergs and meltwater from the multiple glacier outlets that drain into the bay (Beaird et al., 2017).
Jakobshavn Isbræ
Jakobshavn Isbræ is the largest marine-terminating glacier in West Greenland; it drains around 7% of the GrIS (Bindschadler, 1984) and discharges ~24 km3 of ice annually; it is responsible for ~10% of the iceberg production in Greenland (Rignot and Kanagaratnam, 2006; Weidick and Bennike, 2007). Consequently, Jakobshavn Isbræ is by far the largest contributor to current mass loss in Greenland (Enderlin et al., 2014; van den Broeke et al., 2016). Ice-penetrating radar has identified a large palaeo-fluvial drainage basin underneath the ice sheet which covers about 20% of the total land area of Greenland (Bamber et al., 2013; Cooper et al., 2016). The ice stream drains into Disko Bugt via this drainage system and into the 45-km-long Ilulissat Fjord; the fjord is ~4-km wide at the fjord mouth and has water depths down to 1000 m b.s.l. (Schumann et al., 2012; Weidick and Bennike, 2007). The fjord shallows to 200 m b.s.l. at the mouth where a prominent sill hinders iceberg release (Schumann et al., 2012). Previous studies of the Holocene in Disko Bugt, Egedesminde Dyb and Vaigat Strait have focused on palaeo-oceanographic variability (Krawczyk et al., 2013, 2016; Moros et al., 2016; Ouellet-Bernier et al., 2014; Perner et al., 2011; Ribeiro et al., 2012; Sha et al., 2014; Sheldon et al., 2015) and in some cases also glaciological changes (Andresen et al., 2011; Lloyd et al., 2006a, 2011). The glaciological changes at Jakobshavn Isbræ have also been reconstructed from a land-based perspective using threshold lakes as well as from mapping and dating glacial landforms (Briner et al., 2010; Corbett et al., 2011; Kelley et al., 2013; Weidick and Bennike, 2007; Young et al., 2011). To summarise, these result show that after 7300–7600 yr BP, the terminus of Jakobshavn Isbræ was behind its current position (Briner et al., 2010; Corbett et al., 2011; Weidick and Bennike, 2007).
Based on lake sediments from Iceboom Lake north of Ilulissat Fjord, Young et al. (2011) suggest that the land-based ice margin advanced beyond its present-day configuration between AD 1500 and AD 1640 and 1850. However, for the region south of Jakobshavn Isbræ, Briner et al. (2010) dated the advance to 350 BC (1900 years earlier). Based on the same lake cores, Briner et al. (2011) suggest a rapid response of Jakobshavn Isbræ on the ‘Little Ice Age’ (LIA) cooling and a late advance of the glacier terminus ‘at least after AD ~1650 to ~1700, and more likely AD ~1800’.
Since the middle of the 19th century, it has been possible to directly reconstruct the behaviour of Jakobshavn Isbræ from historical observations, aerial photographs and satellite imagery (Csatho et al., 2008; Kjeldsen et al., 2015; Weidick and Bennike, 2007). The results from Csatho et al. (2008) show three periods of rapid thinning since the end of the ‘LIA’; these occurred from 1902–1913, 1930–1959 and has been especially pronounced from 1999 to the present day.
Materials and methods
Sampling design
Two sediment cores were collected in August 2014 from R/V Porsild using a Rumohr corer equipped with 2-m core liners (Meischner and Rumohr, 1974). This type of coring device ensures that the core top is preserved intact. The core locations are 15–19 km northwest of the mouth of Jakobshavn Isfjord in water depths between 380 and 391 m and are approximately spaced 4 km apart (Figure 1, Table 1). As prevailing currents flow northwards, these locations were chosen to catch the sediment and iceberg flux exiting the fjord.
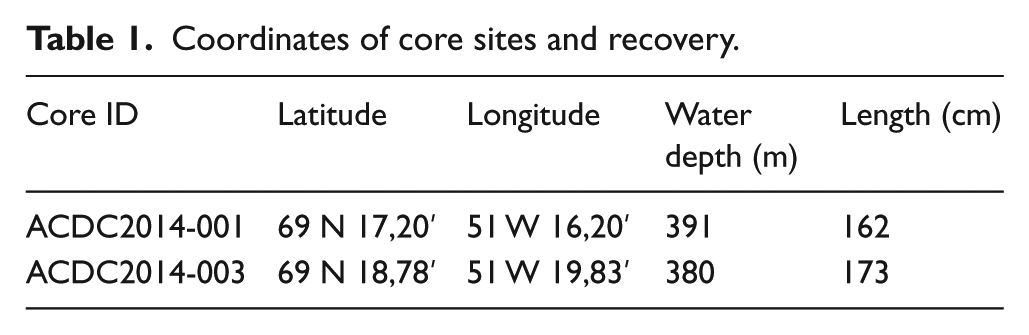
Coordinates of core sites and recovery.
Core imaging
The X-ray images were produced with a YXLON smart 160E/0.4 system at the National Museum of Denmark, Copenhagen (120 s, 3 mA, 90 KV). Single images, covering approximately 40 cm of the core half, were merged manually using Gimp 2.8 software to produce a composite X-ray image of the entire core. Line scans of each core were obtained using an Itrax Core scanner at the Natural History Museum of Denmark. Contrast and brightness were increased using Photoshop CS6.
Sediment grain size analysis
Grain size analyses were undertaken on both cores (ACDC2014-001 and ACDC2014-003) by wet sieving through 63 and 150 µm Retsche sieves. Material for the grain size analyses was sampled continuously throughout the cores at 1-cm increments. Samples were weighed before and after freeze-drying to determine the water content. Dry sample weights ranged from 3 to 11 g. Grains heavier than 0.1 g were manually picked from the >150-µm fraction, weighed and following excluded from further calculations to avoid the disproportional impact of single grains. Laser diffraction measurements were performed on the <63-µm grain size fraction. Measurements were undertaken using a Malvern Mastersizer 3000. Between 65 and 90 mg of the samples were homogenised in an agate mortar and put in a test tube. Samples were then dispensed with 15-mL 0.005 M tetra-sodium-diphosphate-decahydrate, and the solution was treated with an ultrasound probe for 45 s.
Fluxes (F) of the >150-µm fraction were calculated with the formula:
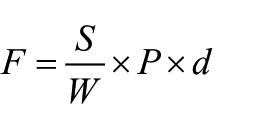
where F is the fluxes
Foraminiferal assemblage analysis
Foraminiferal assemblage analysis was undertaken on 1-cm slices of sediment every 5 cm within core ACDC2014-001. Eight additional samples were analysed between 82 and 127 cm. As both cores show a similar stratigraphy, the analysis was focused on one core only. Samples were soaked overnight in a solution of sodium metaphosphate before sieving at 63 µm. Samples were stored in a solution (targeted pH ~8) of distilled water, ethanol and sodium bicarbonate to avoid carbonate dissolution (Lloyd et al., 2005). Samples with high foraminifera concentrations were split into eighths using a wet splitter. Where possible, a minimum of 300 specimens were identified and counted on a picking tray. However, low concentrations of foraminifera between 97 and 107 cm only allowed a count of 51 and 94 specimens, respectively, despite using the full sample. Additional samples containing less than 300 specimens were obtained between 85 and 90 cm and at 157 cm. Data were plotted using the software C2 (Juggins, 2007). For statistical analyses, species >2% were fed into the software PAST (Hammer et al., 2001) to run a principal component analyses (PCAs). The PCA of the percentage data was run with square root transform. PCA case scores versus depth and PCA variable loadings for each species were calculated (Figure 2 and 4). Furthermore, a constrained cluster analysis was run with a paired group algorithm and a Euclidean similarity measure.
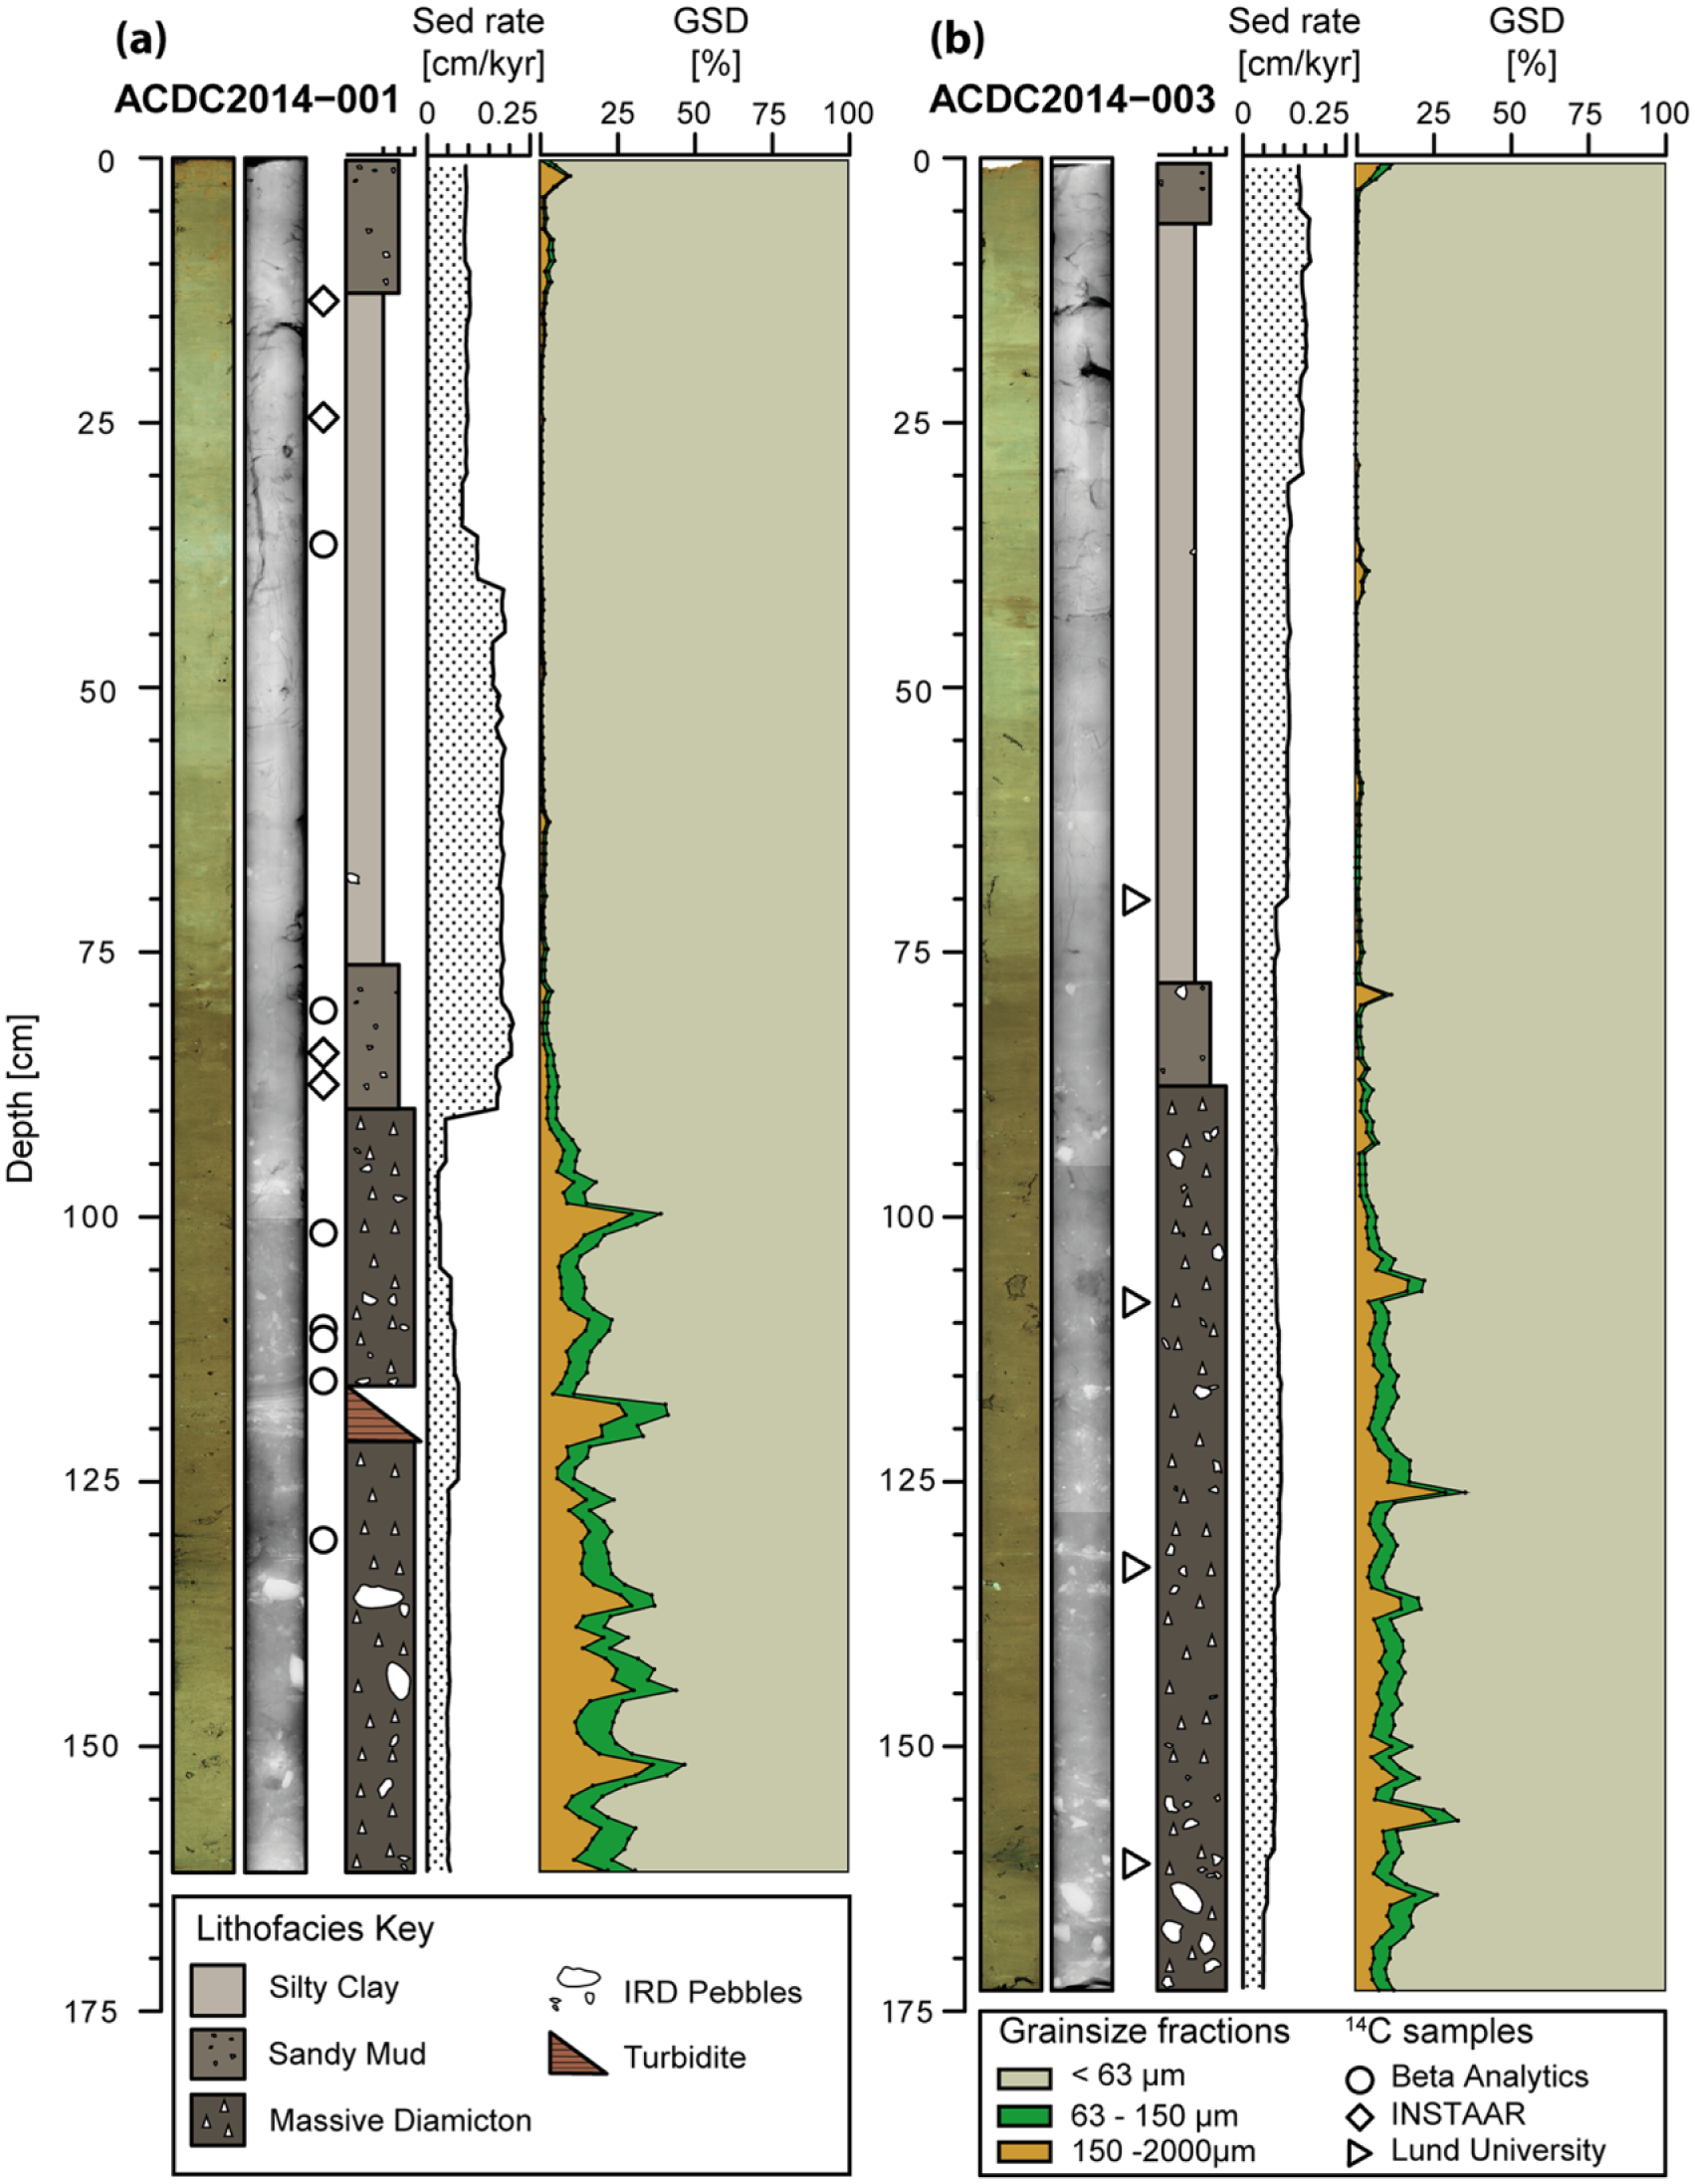
Core descriptions for (a) ACDC2014-001 and (b) ACDC2014-003. From left to right: Line scan with increased contrast and brightness. Composite X-ray images. Location of radiocarbon dates is indicated by white circles (INSTAAR), squares (Beta Analytic) and triangles (University of Lund). Lithofacies identified in the core. Sedimentation rates calculated from the age model. The coloured summary plot shows the grain size distribution (GSD) at 1-cm resolution, orange = 150 µm–2 mm, green = 63–150 µm, grey = <63 µm.
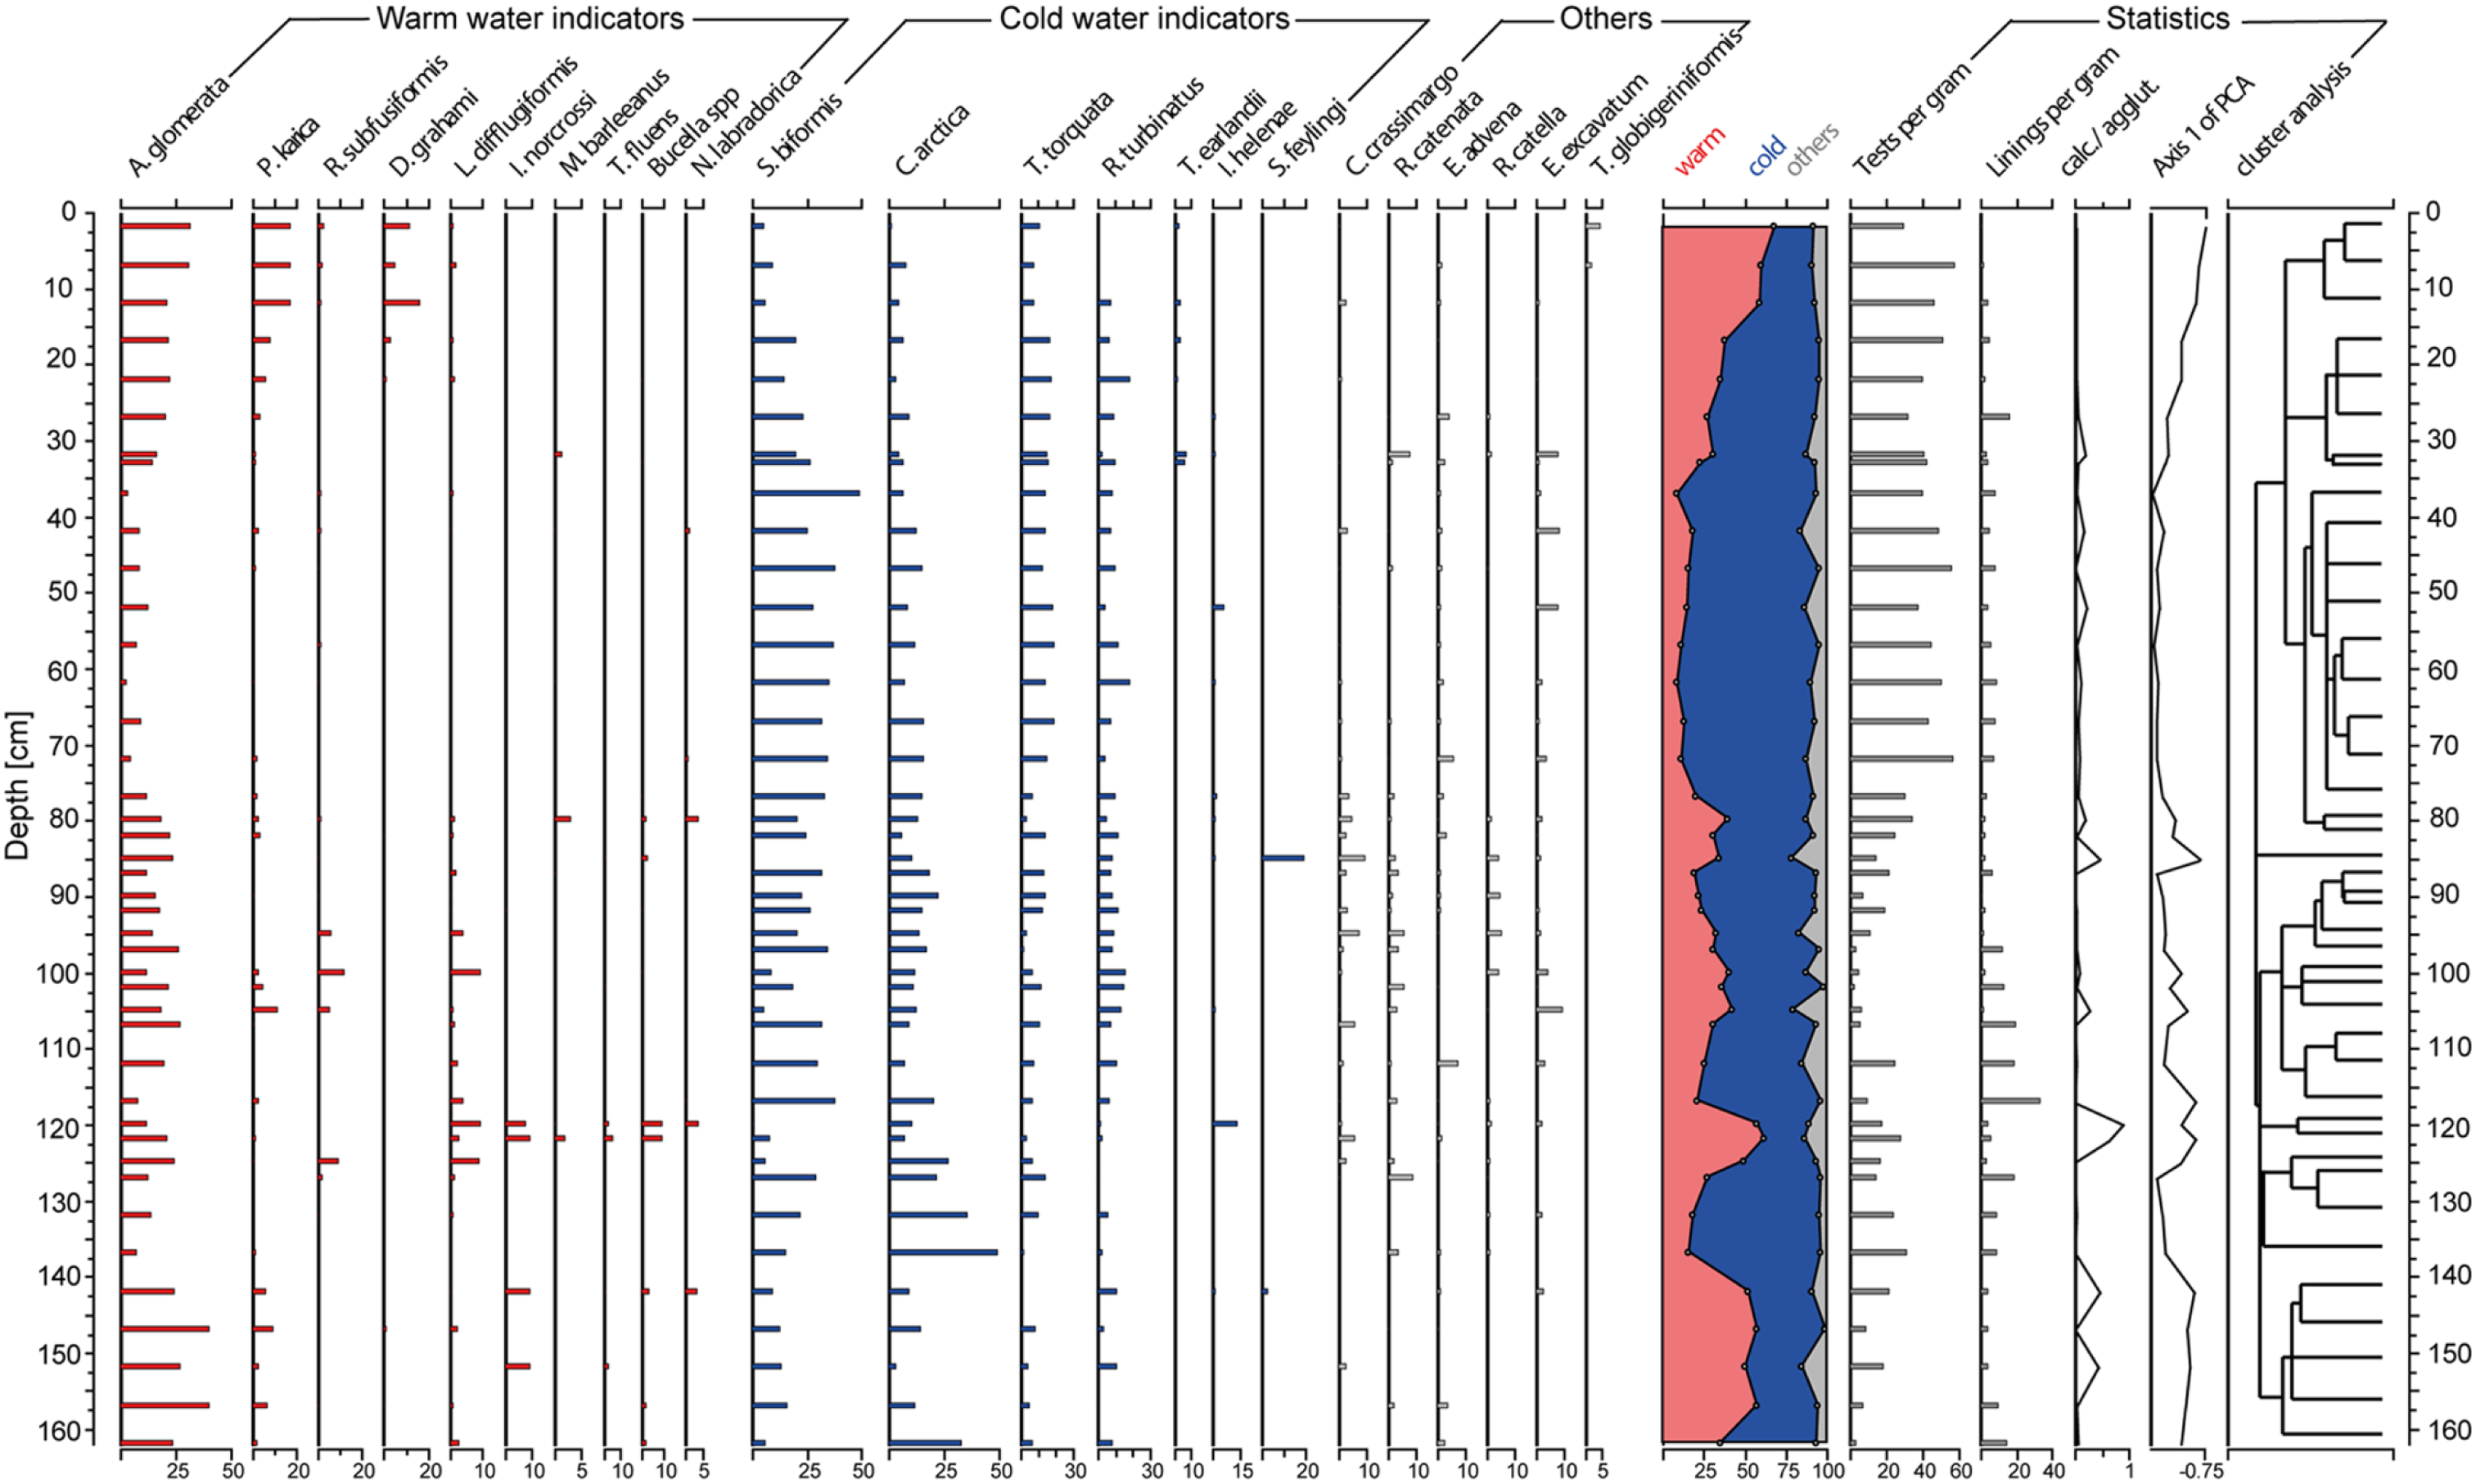
Agglutinated and calcareous species in core ACDC2014-001. The turbidite section between 121 to 117 cm is excluded from the data. Foraminiferal abundances are expressed as a percentage of total specimens counted. Species are grouped into cold water indicators (blue), warm water indicators (red) and undefined (grey). Stacked indicators are from both agglutinated and calcareous species. Concentrations are of foraminifera and test linings. Statistics is derived from the PCA with ‘past’ (Hammer et al., 2001).
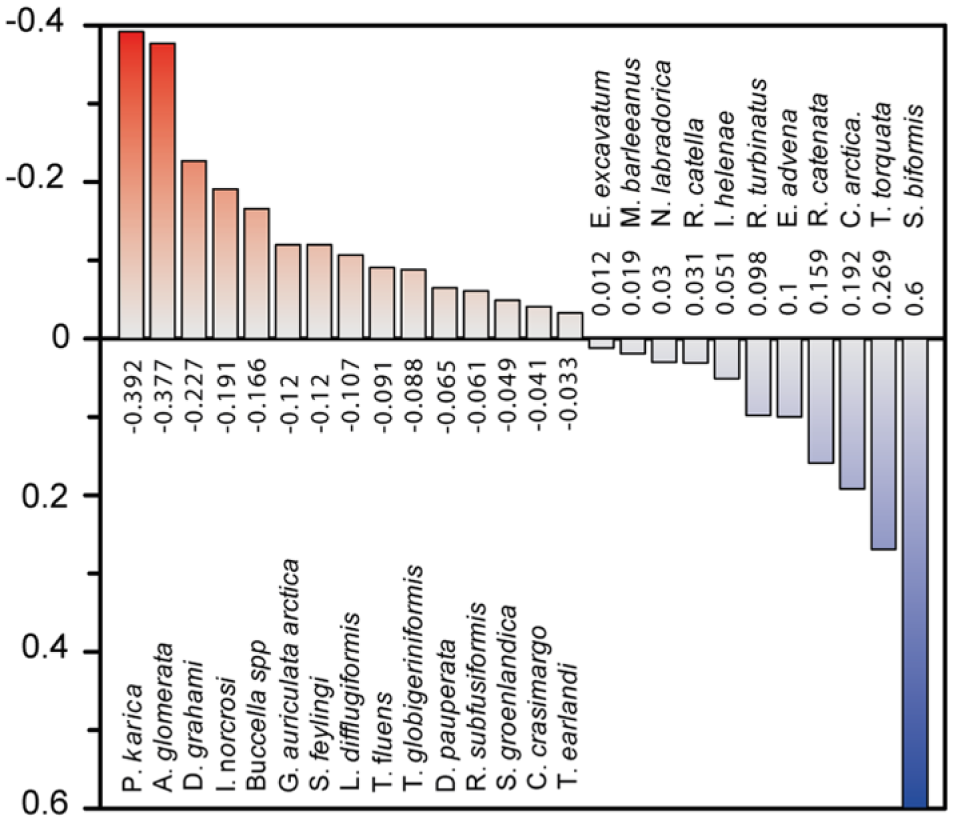
Loadings on Axis 1 derived from the principal component analysis. Only species with an abundance >2% were included in this analysis. PCA analysis was undertaken using PAST software (Hammer et al., 2001).
Chronological constraint
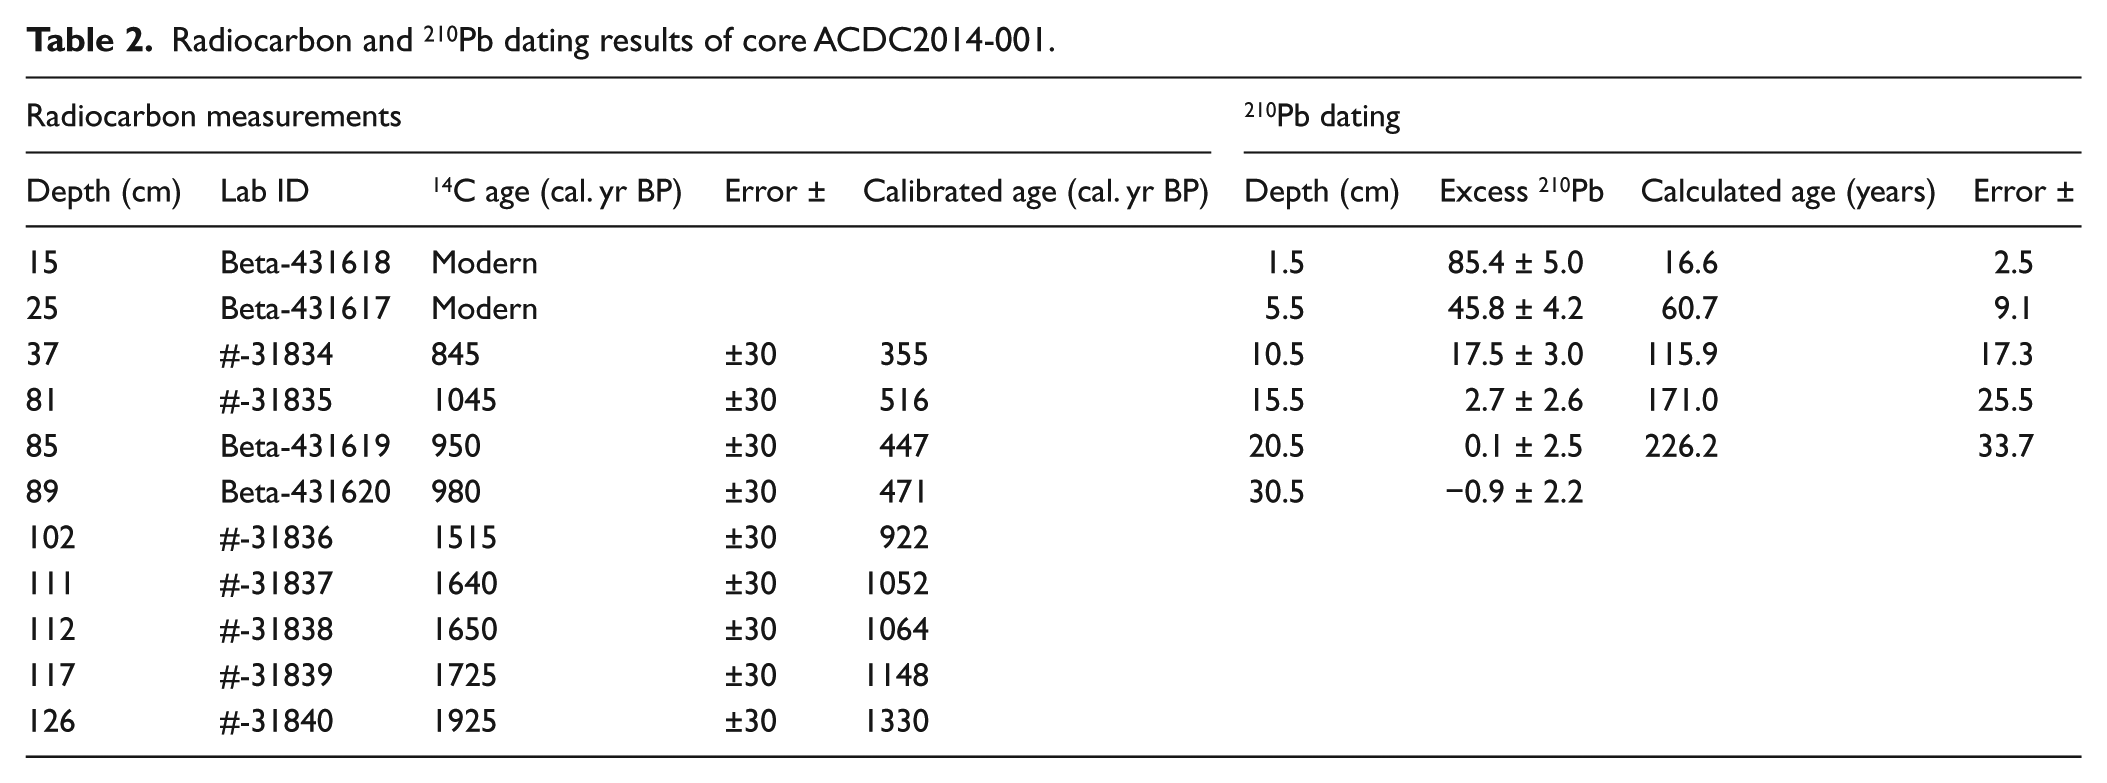
The age of sediments in cores ACDC2014-001 and ACDC2014-003 was constrained with lead-210 (210Pb) and carbon-14 (14C) age determinations. The lead-210 dating is based on the reduction in excess 210Pb (210Pbxs) in the sediment. In practice, aliquots of bulk sediment were taken within the upper 30 cm in a 5 cm resolution to measure the 210Pb, 226Ra and 137Cs activities using a low-background, high-efficiency gamma detector (Supplementary Figure 1, available online). Excesses of 210Pb were calculated as the difference of the measured 210Pb and 226Ra activities. Radiocarbon dating was undertaken on 15 samples of seaweed using accelerator mass spectrometry (AMS). Seven samples were prepared at the Laboratory for AMS Radiocarbon Preparation and Research (INSTAAR, University of Colorado, Boulder, CO, US), four samples at Beta Analytic (Miami, FL, US) and four samples at Lund University (Lund, Sweden).
Time series analysis
The spectral properties of the grain size data from sediment cores ACDC2014-001 and ACDC2014-003 were analysed using the Lomb–Scargle Fourier transform (Lomb, 1976; Scargle, 1982). This method is directly applicable to unevenly spaced data. The grain size records were first detrended with a polynomial of degree 5 to suppress spectral leakage from the low-frequency harmonics. Subsequently, the data were grouped in overlapping 1000 year windows, with a spacing of 20 years. Next, the spectrum and associated red-noise (AR1) false-alarm levels were computed for all individual windows. The univariate spectra were bias-corrected using 1000 Monte Carlo simulations, based on the publicly available software package REDFIT (Schulz and Mudelsee, 2002), which automatically produces first-order autoregressive (AR1) time series with sampling times and characteristic timescales matching the measured data. This approach makes it possible to assess the statistical significance of the spectral peaks that are mapped and coloured according to their significance in the time-dependent spectral density plots (Supplementary Figure 2, available online).
Results
Sedimentology
The sediment in both cores consists of dark olive to olive-grey mud (Munsell colour code: 5Y/1, the contrast of pictures in Figure 2 is increased to show variations). The processed colour scan reveals slightly darker sediments in the upper 10 cm, a lighter interval between 10 and 75 cm and a darker interval below 75 cm in both cores.
In core ACDC2014-001, the sediment lightens slightly again below 135 cm, whereas in core ACDC2014-003, the sediment lightens below 160 cm.
ACDC2014-001
Visual core descriptions and the X-ray images reveal that the sediment from 152 to 85 cm is characterised by a massive matrix-supported diamicton unit with a high abundance of sub-angular gravel throughout and larger, slightly rounded pebbles at 135 and 142 cm. In the work by Streuff et al. (2017), a similar unit was described as a ‘matrix-supported diamict with a mud-dominated matrix’ (their LD5). A coarse section from 121 to 117 cm shows characteristics indicative of a turbidite deposit (erosive base and an upwards fining trend) and is consequently excluded from further analysis.
The upper 85 cm of the core consists of homogeneous, structureless, silty clay with almost no sand and gravel content (Figure 2). This part of the core corresponds to the lithofacies LD2c in Streuff et al. (2017), where it is described as ‘massive, occasionally bioturbated mud’ It was found in multiple cores (JR175-VC05, VC06 and VC10) 15 to 35 km west of Ilulissat Fjord.
Grain size is highly variable throughout the core and can be divided into the following sections.
The bottom of the core, up to 90 cm, shows relatively high values in the sand fraction (>63 µm) with an average of ~20 wt%. The signal is highly variable with major peaks at 100, 119, 137, 145 and 152 cm. The grain size gradually increases from 90 to 77 cm into an interval from 77 to 20 cm consisting of silty clay with a sand content of less than 1 wt%. The uppermost 20 cm of the core contains small amounts of sand, with an average of 2.86 wt%.
ACDC2014-003
The X-ray images show a sediment structure that is similar to core ACDC2014-001. Below 90 cm, the sediment consists of a matrix-supported diamicton with several sub-angular pebble-sized clasts at 95, 117 and below 155 cm. This transitions into a homogeneous, structureless mud with very low percentages of sand and occasional larger clasts.
The similarity with ACDC2014-001 is also reflected in the grain size composition. Between 173 and 100 cm, the sand fraction of core ACDC2014-003 shows a high variability with peaks at 106, 126, 136, 156 and 164 cm and an average of ~14 wt%. Above 100 cm, the grain size gradually decreases to a fine-grained silty clay with minor peaks at 80 cm, 40 cm and in the uppermost 2 cm. The mean sand content in this interval is ~2 wt%. The variability in grain size is mostly shaped by an increase in the >150-µm fraction, whereas the 63- to 150-µm fractions stay relatively constant (4–8 wt%); this pattern is also observed in core ACDC2014-001.
Foraminiferal assemblages
In total, 33 different species were found during the foraminifera assemblage analyses (17 agglutinated and 16 calcareous). A complete list of species can be found in the supplementary information. One single planktonic test, Neogloboquadrina pachyderma, was found at 33 cm depth; this was not included in the percentage calculations. Results presented here are based on benthic foraminifera only. The assemblages for agglutinated and calcareous species are shown together in Figure 2. Percentages were calculated relative to the total count (Jennings et al., 2002). Species were divided into three categories: warm water indicators (WWIs), cold water indicators (CWIs) and others. Species were assigned to these categories on the basis of their environmental preferences established from previous research in the region (Jennings et al., 2017; Lloyd, 2006a, 2006b; Sheldon et al., 2016). Furthermore, species that were not attributed to any preference in former literature but showed strong correlation with other species based on the PCA were also added into these categories.
The species Adercotryma glomerata, Portatrochammina karica (formerly Portatrochammina bipolaris), Reophax subfusiformis, Trifarina fluens, Buccella spp, Melonis barleeanus and Nonionellina labradorica are commonly associated with Atlantic water inflow in the Disko Bugt region and thus are considered to be WWIs in this study (Lloyd, 2006a; Lloyd et al., 2007; Perner et al., 2013; Sheldon et al., 2016). We note that Lloyd et al. (2006a, 2007) used Islandiella norcrossi as a cold Arctic water indicator but this species has also been used as a WWI for areas slightly further offshore in this region (Perner et al., 2011, 2013). Thus, I. norcrossi was included in the WWI group. Deuterammina grahami has not been described in previous Disko Bugt studies but strongly correlates with WWIs and was therefore included in the WWI category (Figure 4).
Spiroplectammina biformis, Cuneata arctica, Textularia torquata, Recurvoides turbinatus, Islandiella helenae and Stainforthia feylingi are associated with cold Arctic water. Although the PCA analyses reveal a negative value for Textularia earlandi and S. feylingi, they are both included in the CWI group (Figure 4).
The foraminiferal assemblages are dominated by agglutinated species. Calcareous species do not show a continuous occurrence but are present in increased abundances within single samples. The lowest part of the core is dominated by A. glomerata. The samples at 152 and 142 cm show relatively high amounts of calcareous species. At 140–127 cm, there is an increase in CWI mostly because of an increase in C. arctica, to a maximum of 61%. The samples at 122 and 120 cm show a relatively high abundance of calcareous species in general (I. helenae, I. norcrossi and T. fluens) and a strong increase in WWI species. Between 117 and 80 cm, the prevalence of WWIs decreases with a concomitant increase in CWIs. From 80 to 35 cm, the assemblages are characterised by the lowest abundance of WWI (13%) and a concurrent increase in CWI species (77%); this interval is mostly dominated by a high abundance of S. biformis. Calcareous species, mostly I. helenae and Elphidium excavatum, are not very abundant but are found occasionally. The upper 35 cm of the core is characterised by a marked increase in WWI, especially A. glomerata, P. karica and D. grahami. Calcareous species were rarely found in this part of the core.
The number of foraminifera found per gram of wet sediment changes within the core. Around 10 tests per gram were counted in the lower half of the core. However, above 85 cm, numbers of foraminifera increase to around 60 tests per gram average. Below 85 cm, the decrease in tests is accompanied by an increase in counted test linings. This suggests some dissolution of calcium carbonate tests. The cluster analysis confirms the separation of the core into two main assemblage regimes at 85 cm.
Age modelling
The age models for cores ACDC2014-001 and ACDC2014-003 were produced by combining the results of 210Pb and 14C dating (Figure 5). The CF/CS (constant flux, constant sedimentation) model was applied for age determination based on the 210Pbxs profile. All data points (Tables 2 and 3) were then fed into the software Bacon in R (Blaauw and Christen, 2011). Radiocarbon ages were calibrated using the Marine13 calibration curve (Reimer et al., 2013) a ΔR of 140 ± 35 (Perner et al., 2011). In the upper part of core ACDC2014-001, the results from 210Pb and 14C dating are contradictory, as the 14C determinations are much younger than the 210Pb results. Both cores show a relatively regular (logarithmic) decay in their 210Pb profiles, which strengthens the confidence in the in 210Pb age model within the top 20 cm. In addition, only sediments corresponding to sediments deposited since 1950 show detectable levels of 137Cs (Supplementary Figure 1, available online).
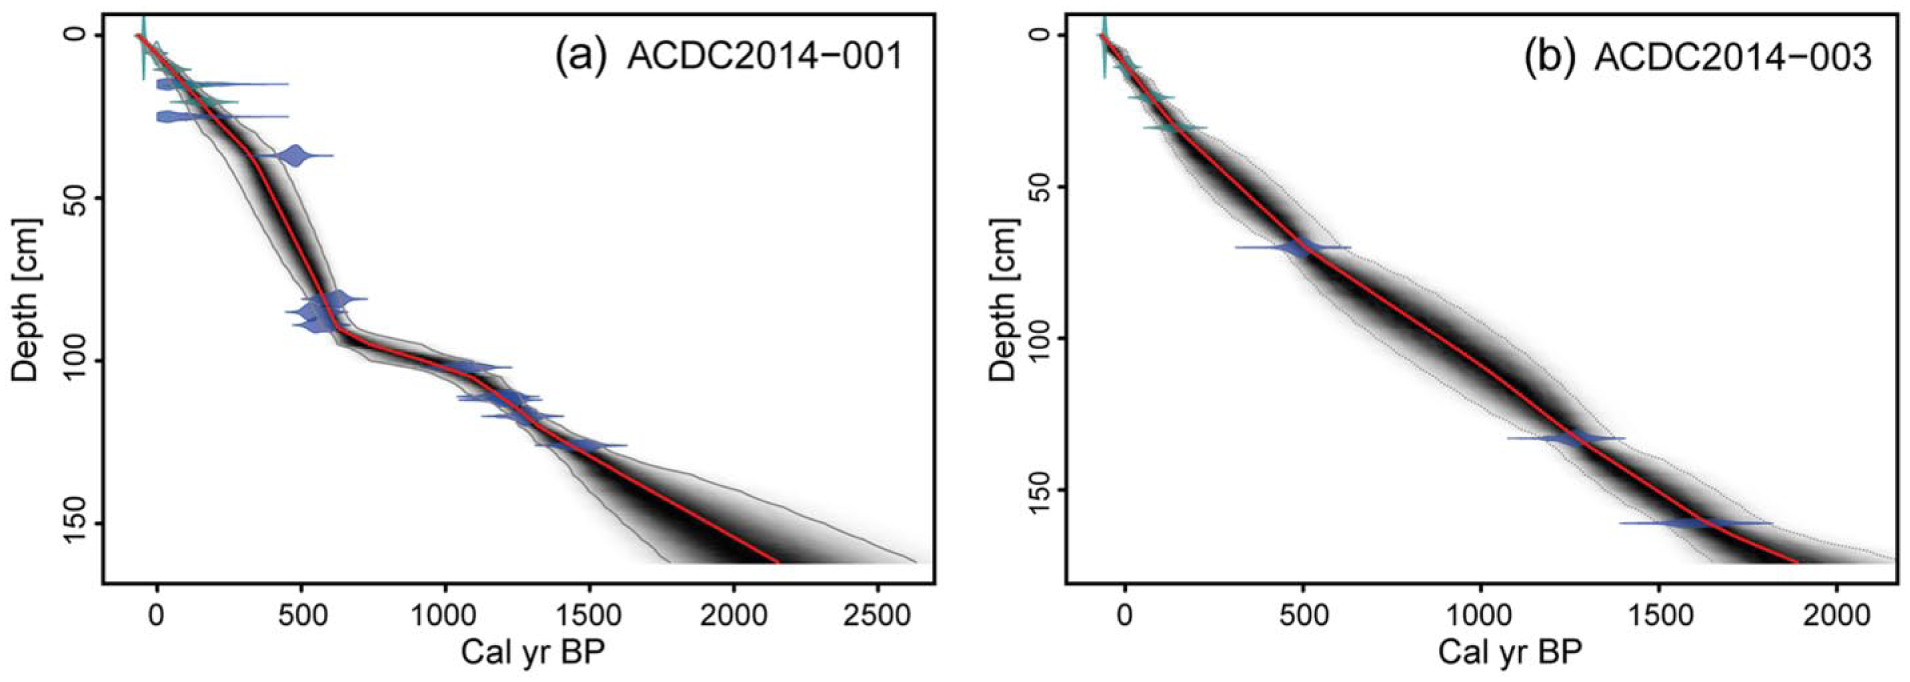
Age models for core (a) ACDC2014-001 and (b) ACDC2014-003. Calibrated radiocarbon samples are shown in blue and 210Pb samples in green. The red line indicates the used ages and the grey shade is the 95% certainty range. The program automatically excluded sample ACDC2014-003_108.
Radiocarbon and 210Pb dating results of core ACDC2014-001.
Radiocarbon and 210Pb dating results of core ACDC2014-003.
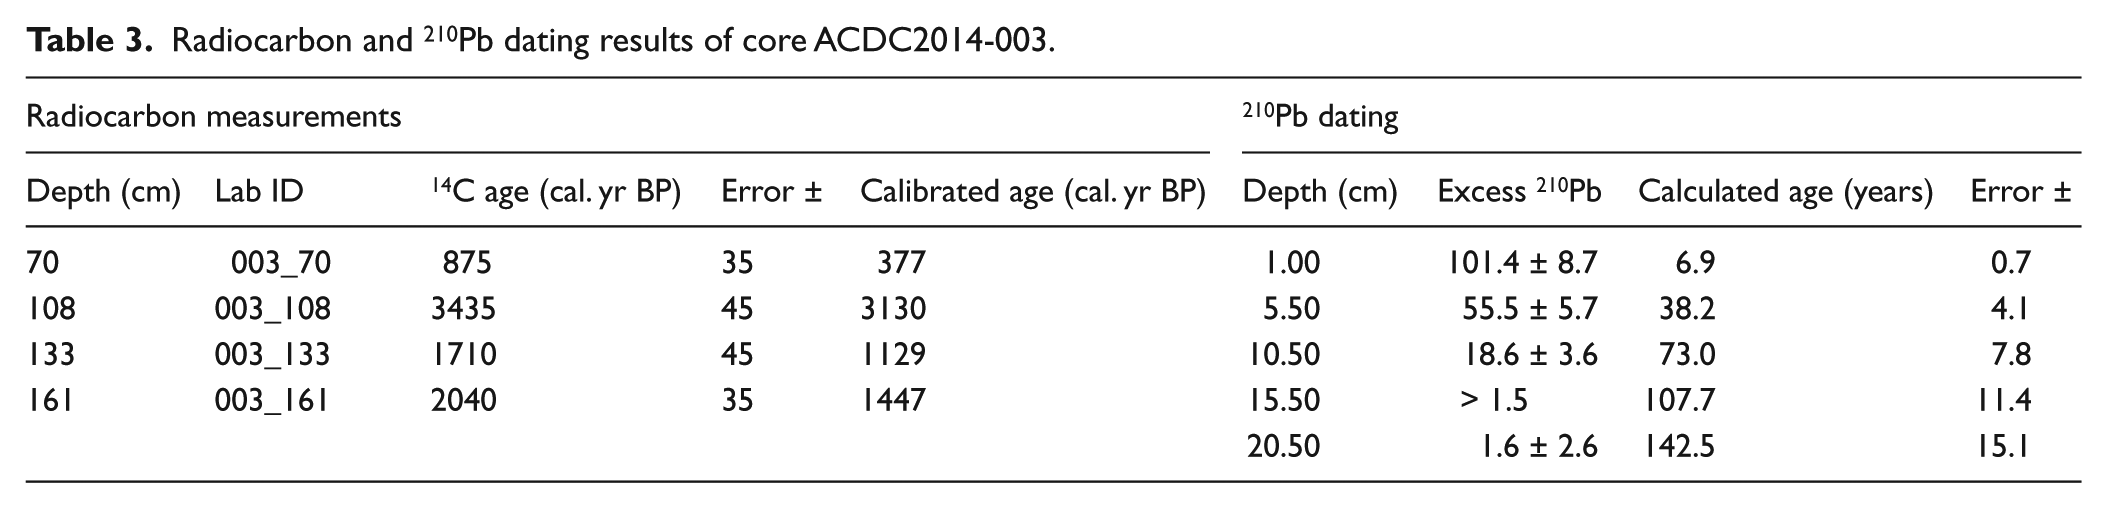
For core ACDC2014-003, the 210Pb dating and three radiocarbon dates were taken into account, whereas the sample from 108 cm is excluded from the age model as the measured radiocarbon age (3435 yr BP) indicates reworking of the plant material.
Discussion
Oceanographic changes in Disko Bugt
There are multiple factors influencing the structure of foraminiferal assemblages in marine sediments. Foraminifera assemblage data have been widely used to infer the temperature of bottom waters in high-latitude environments (Jennings and Weiner, 1996; Lloyd et al., 2011; Perner et al., 2013; Sheldon et al., 2015). However, foraminifera assemblages may also be controlled by salinity, water depth, nutrient supply and the substrate of the sediment. According to Lloyd (2006b), salinity and water depth are the most important variables in Disko Bugt; sediment substrate provides a secondary control, and bottom water temperature, total organic carbon and total nitrogen are less important. However, the correlation between temperature and foraminiferal assemblage variability has been shown in multiple studies comparing foraminifera assemblages with instrumental records (Jennings and Helgadottir, 1994; Lloyd et al., 2011; Perner et al., 2013). Ocean temperatures in Disko Bugt are primarily controlled by the strength of the WGC which, in turn, is controlled by the relative strengths of IC and EGC (Myers et al., 2007; Straneo et al., 2012). Furthermore, meltwater from the melting of icebergs and subglacial discharge can also influence the temperature of the water at the core location. However, glacially modified water forms a thick, stratified layer down to 125 m b.s.l. in coastal areas and consequently this water mass does not directly influence the bottom waters at the core sites (380 and 391 m b.s.l.) (Beaird et al., 2017). We use the relative variability in foraminiferal assemblage data as a proxy for temperature at the seabed. As this is controlled by the incursion of the WGC it represents a proxy for remote oceanographic changes (e.g. Krawczyk et al., 2016; Lloyd, 2006a; Perner et al., 2011). Figure 6e shows the percentage of WWIs superimposed on the PCA scores on Axis 1. This axis explains 23% of the variation in the assemblages (Eigenvalue: 4.415). The clear correlation strengthens the interpretation of Axis 1 as a representation of warm–cold species.
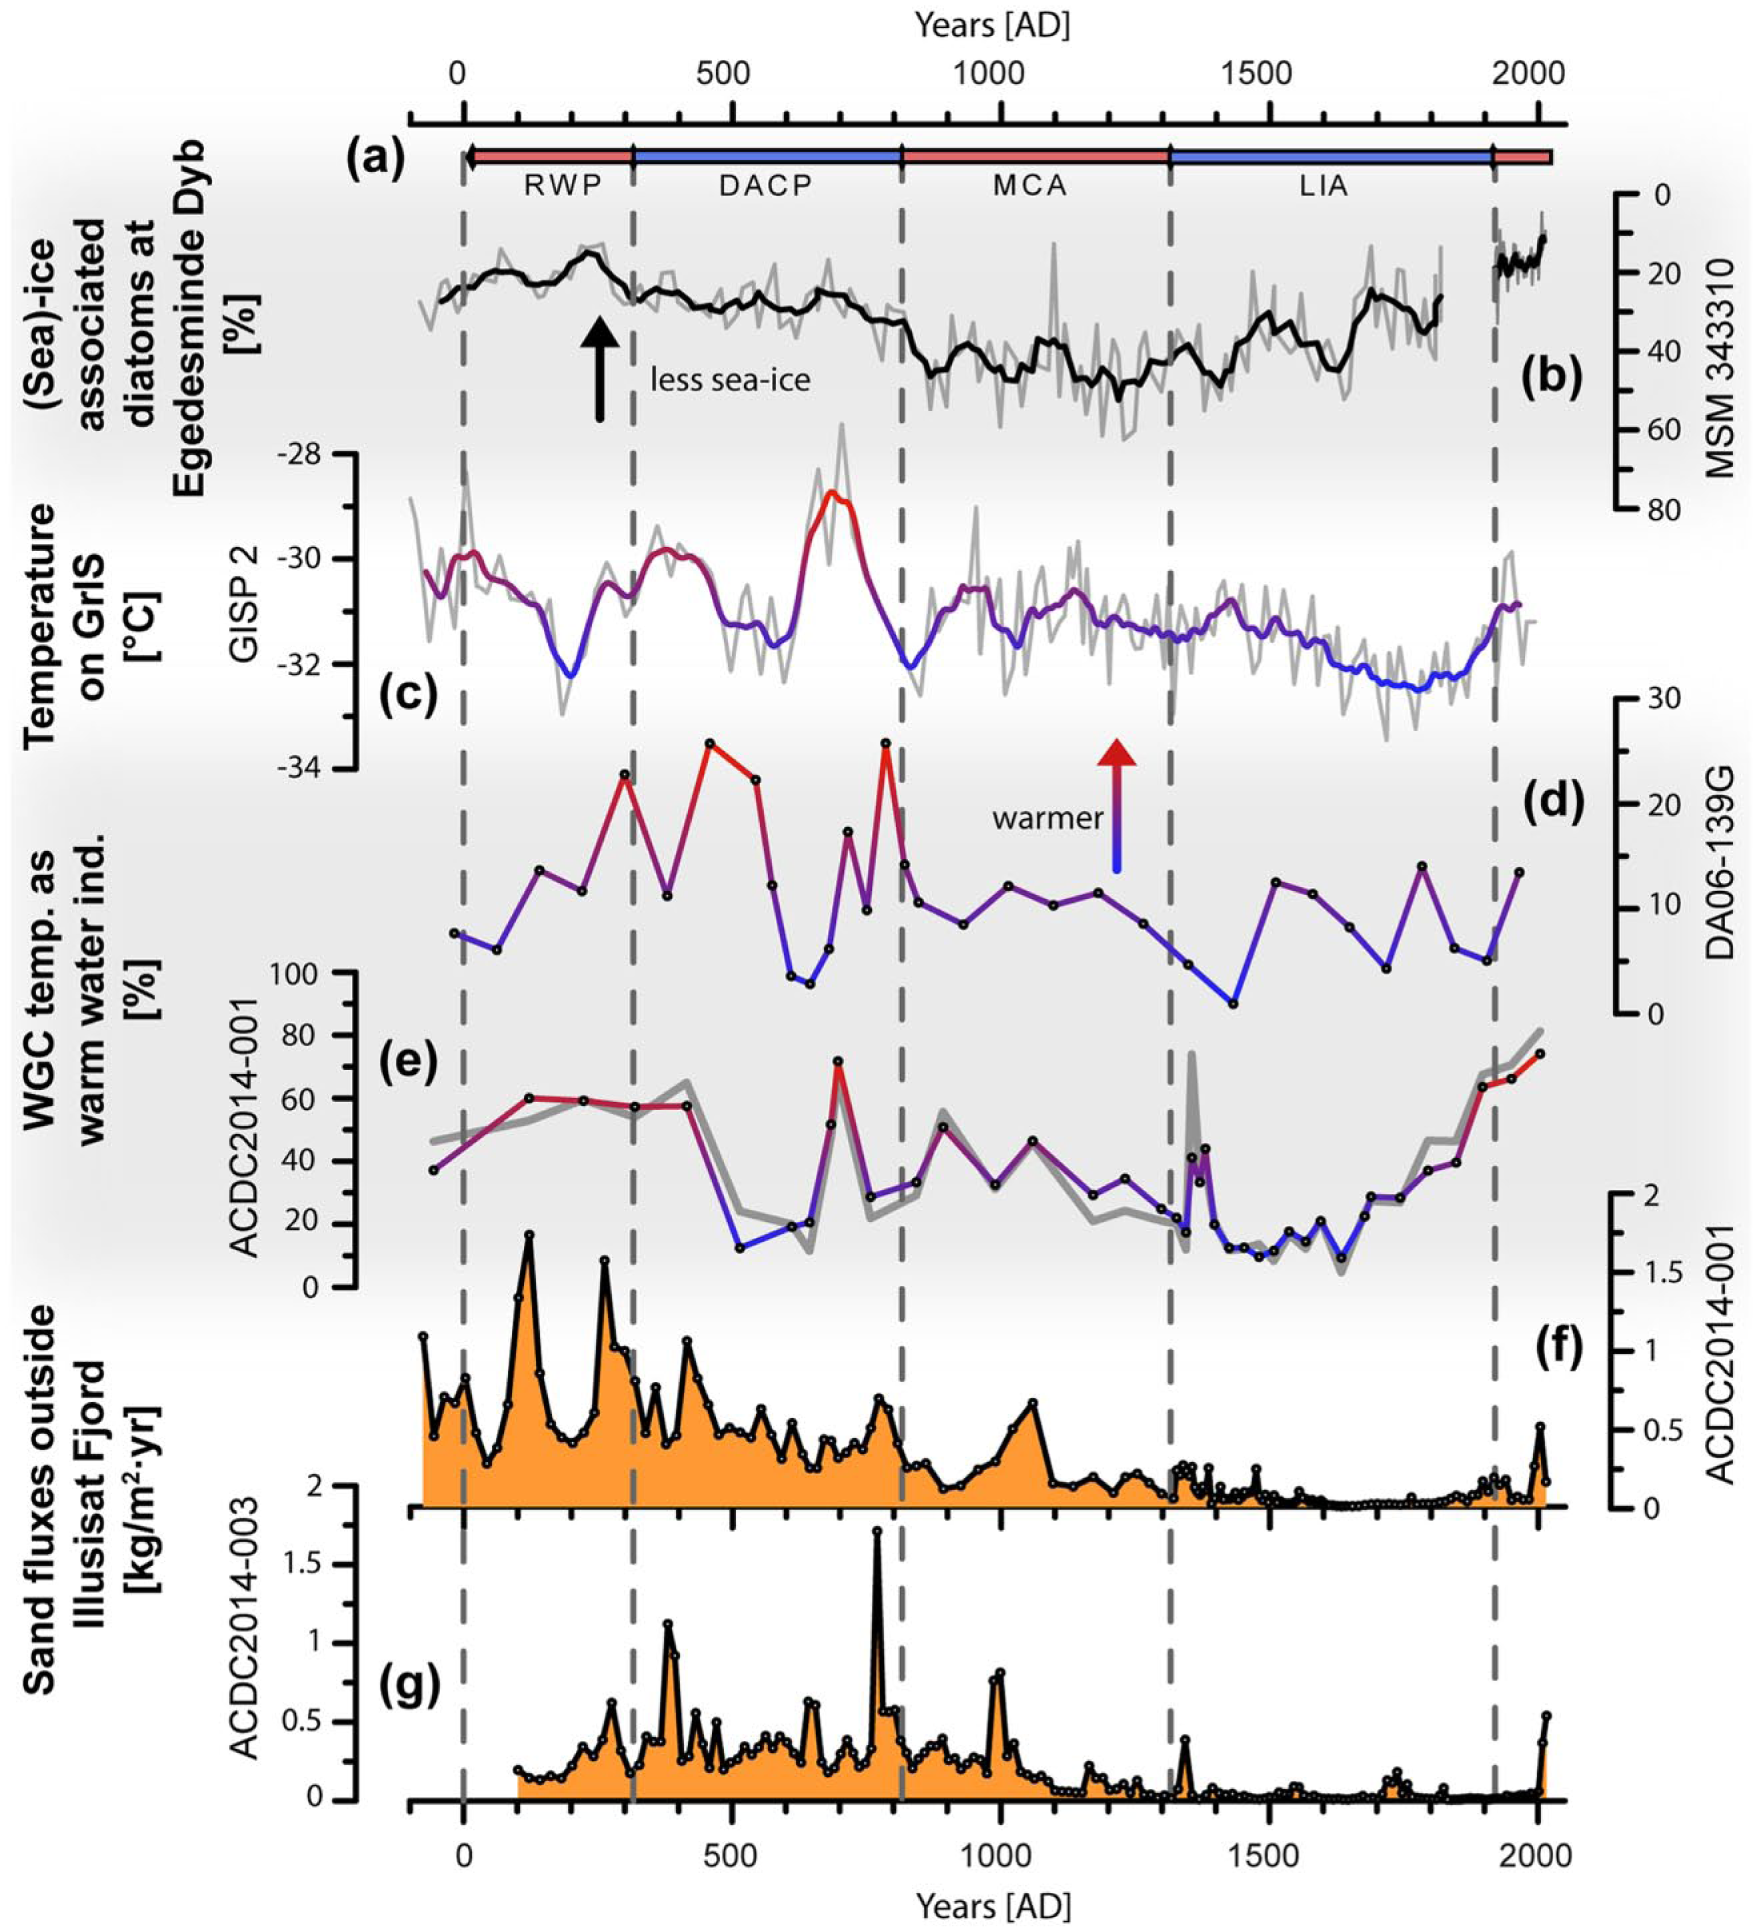
Records of ocean, climate and glacier behaviour in the late Holocene. (a) European climate intervals as defined in Ljungqvist (2010), (b) reconstructed sea ice coverage in outer Disko Bugt/Egedesminde Dyb (Krawczyk et al., 2013). The black line shows a 5-point running mean. Note the inverted y-axis. (c) Reconstructed surface temperature at the GISP2 ice core location (Kobashi et al., 2011). The thick line shows the 59-point running mean. (d) Atlantic water foraminiferal assemblage from Vaigat Strait (Andresen et al., 2011). Data are plotted versus an updated age model according to Sha et al. (2014). (e) Warm water indicators as percentage of the total assemblage (this study). The grey line represents Axis 1 of the PCA. (f) and (g) Results of the grain size analyses from core (f) ACDC2014-001 and (g) ACDC2014-003. Shown data are the calculated fluxes of the 150- to 2000-µm fraction (this study).
The cluster analyses of the foraminiferal assemblage data (Figure 2) indicate a clear change in the assemblage at 85 cm, which represents the year AD 1355 (595 BP) according to the age model (Figure 5a). Higher concentrations of foraminifera in the upper part and higher counts of test linings in the lower part indicate a better preservation and a reduction in dissolution of the carbonate shells after AD 1355. Calculated sedimentation rates show higher rates up to 0.20 cm/yr compared with 0.05 cm/yr below 90 cm (Figure 2). Foraminifera shells were buried faster and thus preserved better from dissolution by ocean waters. Furthermore, the degradation of organic matter within the sediment can decrease the pH of the pore water and affect the preservation of carbonate shells (Jennings and Helgadottir, 1994). Higher grain sizes below 80 cm could have increased pore water fluxes and thus enhanced degradation of organic material.
The foraminifera data show a general decrease in relative temperatures from the onset of the record, at 100 BC, until the minimum values at around AD 1690 (Figure 6e), and suggest a progressive weakening of the IC component in the WGC throughout this interval. This trend is consistent with previous studies from the Disko Bugt area (Andresen et al., 2011; Krawczyk et al., 2016; Lloyd, 2006a; Perner et al., 2011) and is part of a wider atmospheric cooling trend since the Holocene Thermal Maximum at around 6500 yr BP (Dahl-Jensen et al., 1998; Kobashi et al., 2011; Krawczyk et al., 2016; Lloyd et al., 2007; McGregor et al., 2015; Perner et al., 2012; Vinther et al., 2010).
The temperature of the WGC in Disko Bugt was relatively high between 100 BC and AD 450 (Figure 6a) which corresponds well with former studies in the Disko Bugt region (Andresen et al., 2011; Perner et al., 2011, Figure 6d). A diatom-based sea ice reconstruction indicates relatively diminished sea ice at this time (Krawczyk et al., 2013, Figure 6b). This relatively warm time interval correlates with a generally warm period in the Northern Hemisphere, the ‘Roman Warm Period’ (RWP; lasting 350 BC to AD 300) (e.g. Ljungqvist, 2010; Mann et al., 2009; Figure 6a). It was followed by a marked decrease in relative WGC temperature between AD 400 and 700. This cooling of the WGC is broadly concurrent with onset of the Dark Ages Cold Period (DACP; from AD 300 to 800) in Europe. This is also recorded in Vaigat (Andresen et al., 2011) and was synchronous with a lowering of air temperature as recorded at the ice core at GISP2 in Greenland (Kobashi et al., 2011). However, at AD 700, still within the European DACP, the WGC current and the air temperature on the GISP2 site increased markedly again (Figure 6c). Warm conditions during the DACP have also been recorded in the Irminger Sea proximal to SE Greenland (Andresen et al., 2017) and indicate a highly variable climate with episodic warm conditions in the ocean near SE and W Greenland at this time. During the following period, which corresponds to a period of climatic amelioration in Europe, the ‘Medieval Climate Anomaly’ (MCA; from AD 800 to 1300) (Ljungqvist, 2010; Mann et al., 2009) and the temperature of the WGC and on the GrIS declined compared with levels during the RWP and maximum values during DACP, but stay relatively high.
A further cooling took place between AD 1400 and 1700 within the cold time period on the Northern hemisphere generally known as the ‘LIA’ (from AD 1300 to 1900 (Ljungqvist, 2010)). The LIA has been linked with frequently occurring atmospheric blocking situations and negative NAO in response to lowered solar activity (Barriopedro et al., 2008). This atmospheric configuration favours shrinking and westward displacement of the Subpolar Gyre (Barrier et al., 2015) and thus warming of the IC in the vicinity of SE and SW Greenland (Andresen et al., 2012a, 2017; Seidenkrantz et al., 2008). At the same time, the EGC strengthened (Andresen et al., 2012a; Perner et al., 2015); whereas the result was more stratified waters in SE Greenland, it is unclear whether the mixing of these two water masses along W Greenland resulted in an overall warming or cooling of the WGC in Disko Bugt. Our data indicate an overall cooling of the WGC with a minimum during the LIA, occurring from AD 1400–1650, which is concurrent with episodic marked minima in SSTs in the Irminger Sea offshore SE Greenland (Andresen et al., 2017; Perner et al., 2016).
The benthic foraminifera assemblage shows a steady increase in WGC temperature starting at AD 1700. However, the LIA generally terminates around 1900, around 200 years later (Ljungqvist, 2010). A similar trend of late-LIA warming can be observed in records of reconstructed sea ice coverage, which shows decreasing percentages of sea ice indicating diatoms from AD 1650 onwards (Krawczyk et al., 2013). This is explained by a decreased meltwater input and a reduction in the cooling of surface waters. These data somewhat contradict the timing of maximum glacier extent of Jakobshavn Isbræ, which is usually reconstructed to AD 1850 (Briner et al., 2011; Weidick and Bennike, 2007; Young et al., 2011). The air temperature reconstruction from GISP2 (Kobashi et al., 2011), however, shows a strong increase starting around AD 1850. This may indicate a slow response of the Jakobshavn Isbræ terminus to ocean warming and a faster response to changes in air temperatures at this time. The WGC temperature during the 20th century in our study shows the highest percentages (74%) of WWIs throughout the record. CTD measurements at station SJA3 (Figure 1), close to the core location, show a clear warming trend of bottom waters of more than 2°C between 1954 and 2007 (Holland et al., 2008). Results presented here indicate that this dramatic warming is part of a longer warming process that was initiated in AD 1700. Lloyd et al. (2011) correlated these data to foraminiferal assemblage composition as well as to retreat rates of Jakobshavn Isbræ. However, the glacier terminus only started to retreat when WGC temperatures increased to temperatures similar to AD 700 and air temperature also started to rise. Our results demonstrate that the magnitude of recent warming is unprecedented at least in the last 1300 years. Finally, it is interesting to note the strong correlation of our bottom water temperature records with air temperatures recorded 600 km northeast of Disko Bugt at GISP2 (Figure 6c).
Glaciomarine sedimentation and its links to climatic changes
Sediment supply in the area proximal to marine-terminating glaciers can be characterised by three main processes: suspension settling from meltwater plume discharge, rainout from melting and overturning icebergs and gravity-driven mass movements (Cofaigh et al., 2001; Mugford, 2008). Except for the turbidite between 117 and 121 cm in core ACDC2014-001, we find no further evidence of mass-wasting events in either core and assume that meltwater and IRD sedimentation are the two dominant processes delivering sediment to the core site. The meltwater plume sedimentation of clay and silt is usually highest near the grounding line and decreases exponentially with the distance from the glacier margin (Dowdeswell, 1987).
Icebergs, on the other hand, can transport debris across the grain size spectrum, from clay to boulders, over thousands of kilometres, releasing the material as they melt (Mugford, 2008). Previous studies have shown that variability in IRD deposition in certain Greenland fjords is mainly controlled by variability in the amount of icebergs produced by nearby glaciers (Andresen et al., 2012b; Mugford and Dowdeswell, 2011). However, in certain settings, additional factors may potentially also modulate the amount of IRD deposited. These changes in the melting rate of the icebergs because of ocean and air temperature variability, changes in iceberg transport pathways (route and travel time) because of wind influence and/or changing distance between glacier margin and core site over time as well as changes in the initial sediment load in the ice before calving influenced by mélange persistence and/or growth of glacier tongues (Andresen et al., 2017; Syvitski and Shaw, 1995). These processes are also kept in mind when interpreting the causes of IRD variability in the two investigated cores. Here, we assume that the influence from potentially variable wind patterns is negligible since Ilulissat Fjord is relatively narrow. Icebergs calved from Jakobshavn Isbræ are channelled directly to the fjord mouth before entering the bay and passing over the core sites as they are entrained in ocean currents (Figure 1).
Our grain size analyses show synchronous sedimentary changes in the two cores situated 6 km apart (Figures 1 and 6), indicating that the changes are spatially homogeneous and represent changes to the amount of icebergs passing over the sites, rather than sporadic localised IRD drop loads. Between the onset of records (75 BC in core ACDC2014-001 and AD 100 in core ACDC2014-003), AD 1400 sedimentation is characterised by relatively high, but gradually decreasing IRD displaying a series of centennial long episodes of increased IRD fluxes.
The gradual decrease in IRD sedimentation from 75 BC to AD 1400 occurs during the general cooling trend in the late Holocene, which culminates in the LIA cold event (Kobashi et al., 2011; Perner et al., 2011) and the readvance of Jakobshavn Isbræ (Briner et al., 2010; Weidick and Bennike, 2007; and others) after AD 1500. The gradual IRD decrease was followed by an interval with almost no IRD deposition from AD 1400 to 1900, indicating that meltwater plume sedimentation was the dominant process at that time. We interpret the marked decrease in IRD at AD 1400 mainly as the result of a reduction in the calving rate of Jakobshavn Isbræ because of a more stable and advanced configuration. Despite the lower flux of IRD, the sedimentation rates increase in that interval (Figure 2), which can be explained by a closer proximity to the glacier front and with this an increase in meltwater plume sedimentation (Dowdeswell, 1987). Moreover, we speculate that under cooling atmospheric temperatures during the transition into the LIA, the ice mélange in Ilulissat Isfjord would have remained coherent most of the time and thus hindered icebergs from exiting Ilulissat Fjord thereby limiting IRD deposition. This process has been proposed for cold periods in East Greenland fjords where little or no IRD deposition is recorded in sediment cores (Dowdeswell and Dowdeswell, 1989). According to Landsat Satellite images of the area show that this process takes place in the Isfjord on seasonal scales today (https://landsatlook.usgs.gov/viewer.html). During winter, the Isfjord is covered in a relative stable ice mélange that breaks up in the summer months causing massive amounts of icebergs to drift into Disko Bugt (Sohn et al., 1998). Sea ice reconstructions from outer Disko Bugt support this hypothesis since high percentages of sea ice–associated diatoms, indicating cooling, are found during times of low IRD sedimentation and vice versa (Figure 6; Krawczyk et al., 2013). A decrease in iceberg production could also have affected the meltwater plume extension, as especially large icebergs floating down the fjord can block the distribution of the plume. The lack of larger icebergs during the LIA, on the other hand, would have enabled the meltwater plume to flow unhindered through the fjord and with this increasing the sedimentation rate at the core sites.
Finally, the lack of IRD from AD 1400 to 1900 may be attributable to an overall decrease in the sediment load of icebergs relating to the formation of a marked floating glacier tongue. Sediment is predominantly entrained into the lowest part of a glacier, close to the glacier bed (Alley et al., 1997; Cuffey et al., 2000; Dowdeswell and Dowdeswell, 1989; Knight, 1997). In its present-day configuration, after the break-up of its floating tongue in 2002 (Joughin et al., 2008; Motyka et al., 2011), icebergs calve from the full depth of the Jakobshavn Isbræ glacier terminus, which includes the sediment-rich basal ice layer (Figure 8). However, when a floating glacier tongue develops, the base of the glacier is exposed to submarine melting prior to calving and thin, tabular, sediment-poor icebergs calve from the tip of the floating tongue. When a floating tongue is present, the majority of coarse sediment is deposited close to the grounding line of the glacier (in the fjord) and is not entrained in icebergs (Domack and Harris, 1998). Besides a decreased calving rate and the strengthening of the ice mélange during the LIA, it is possible that decreased air temperatures may have promoted the formation of a glacier tongue at the terminus of Jakobshavn Isbræ, akin to the major outlets in northern Greenland today which experience high-Arctic conditions (low temperatures, low precipitation) and similar to the hypothesis of an ice tongue at Helheim Glacier in SE Greenland lasting until the end of the LIA (Andresen et al., 2017). This could explain the absence of IRD after AD 1400. Historical observations of relatively ‘ice-free’ conditions in the Isfjord in the early 1700s (see Weidick and Bennike, 2007, for a summary) may indicate the presence of a floating glacier tongue for a time, rather than a calving tidewater front. Indeed, the terminus of Jakobshavn Isbræ forms a small floating tongue during winter even today (Amundson et al., 2010; Das et al., 2008), suggesting that even slight climatic cooling would promote the formation of a glacier tongue. Accepting this theory, our data indicate that a floating glacier tongue may have developed at the terminus of Jakobshavn Isbræ between AD 1500 and 1600. This corresponds to the oldest estimations of glacier extent on land from Young et al. (2011) and contradicts the estimations from Briner et al. (2011) about a late Jakobshavn Isbræ advance most likely around AD 1800.
The increase in IRD flux from the middle of the 19th century coincides with the documented retreat of Jakobshavn Isbræ (Figure 7). Between AD 1880 and 1940, higher IRD fluxes and higher retreat rates are calculated. This is followed by a period from 1940 until the 1990s where retreat rates were low and deposition of IRD decreases significantly. Both peak again around AD 2000 with unprecedented retreat rates and the highest IRD flux rates in the past 500 years.
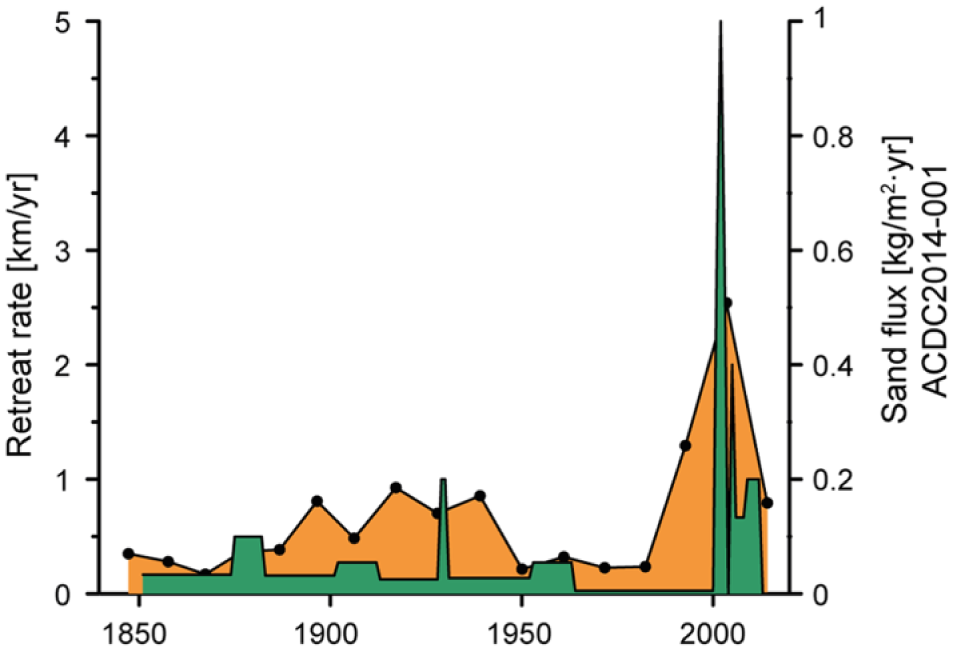
Estimated retreat rates of Jakobshavn Isbræ based on observed glacier front positions (Weidick and Bennike, 2007) underlain by the sand flux rates in the respective time periods.
Warm water influence and other drivers on IRD sedimentation
To assess the forcing behind Jakobshavn Isbræ activity during the latest 2000 years, we compare the glaciological data with proxy data of oceanic and climatic changes. The overall variability in the abundance of warm water foraminifera resembles the variability in iceberg rafting over the past 2000 years in both cores (Figure 6). This suggests that, over multi-decadal to centennial timescales, there is a connection between warm water inflow and the configuration and calving regime of Jakobshavn Isbræ. It is noticeable that the high warm water inflow between AD 0 and 400 is concurrent with three major peaks in the calculated IRD flux at AD 100, 250 and 400 (Figure 6d and e).
Despite the period of relatively cold bottom water and air temperatures between AD 450 and 600 (Figure 6c), the IRD flux stays relatively high. However, there are no major peaks in either core during that time, suggesting no major calving or ‘break-up’ events. The strong warming around AD 700 does not directly affect the IRD record. However, the highest flux rates in core ACDC2014-003 and a smaller peak in core ACDC2014-001 can be identified shortly after (AD ~770). Between 7500 cal. yr BP and AD 1500, the glacier terminus was located behind its current position (Young et al., 2011). Our data suggest that Jakobshavn Isbræ was configured as a calving glacier at this time and that IRD peaks reflect increased iceberg calving caused by increased warm water inflow. The absence of a floating glacier tongue results in a high sediment load in icebergs (Figure 8b), which may explain the generally high flux rates from the onset of the record until AD 1100. Between 1100 and AD 1500, both IRD and WGC temperatures are relatively low and declining, which likely reflects the early onset of the LIA cooling. The short but prominent warming around AD 1400 is not linked with an increase in IRD deposition, which could be explained by the initiated growth of a glacier tongue as regional temperatures cooled towards their LIA minima. This glacio-dynamic response to cooling may also explain the lower amplitude of IRD fluxes since AD 1850 compared with the older part of the core, where flux rates are more than three times as high as modern values. It is noticeable that even if warming of the WGC had commenced already in AD 1700, it was only as the relative temperature matched that before AD 700 and air temperatures started to rise that the glacier started to retreat around AD 1850. The retreat (Figure 7) resulted in the disintegration of the floating ice tongue in 2002 (Joughin et al., 2008; Motyka et al., 2011). This may indicate that, in the absence of a glacier tongue, IRD deposition in Disko Bugt might increase dramatically in the near future and is therefore simply not captured yet in seafloor sediment records.
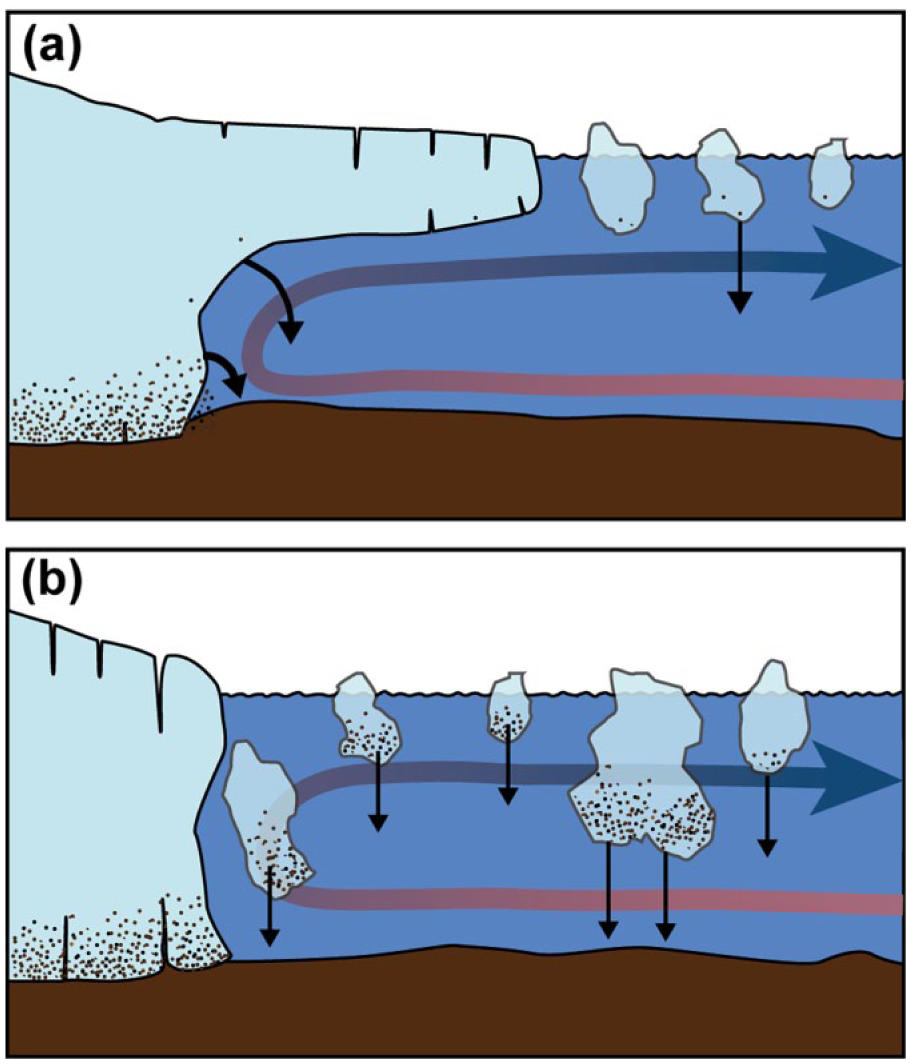
Conceptual figure of sediment load in icebergs depending on the presence (a) or absence (b) of a floating glacier tongue. Black arrows indicate pathways of sediment deposition. The red/blue arrows represent the current circulation in the fjord system.
Statistical analyses of the grain size data were performed to identify possible drivers in the IRD record (Supplementary Figure 2, available online). In core ACDC2014-001, a strong cyclicity with a period of ~150 years was found from the starting point of the periodogram around AD 440 until AD 650 (95% significance). This almost coincides with an interval between 450 BC and AD 250 where the sun’s 150-yr cycle was unusually strong (Knudsen et al., 2009). This cyclicity could not be confirmed by core ACDC2014-003, in which a strong cyclicity with a peak period undulating between 180 and 210 years was identified throughout the record. This periodicity is close to the Suess (de Vriess) solar cycle with a dominant periodicity around 210 years (Damon and Sonett, 1991). The presence of solar-like cyclicities in the two records indicates that solar activity might be one possible factor influencing the timing of some of the variations in IRD sedimentation, but it is not possible to identify solar variability as a dominant driver of changes at the two core sites. Rather, the record of IRD abundance appears to reflect multiple factors including the variations in oceanographic conditions, like temperature and sea-ice coverage, but also the position of the glacier front and changes in the configuration and calving style of Jakobshavn Isbræ.
Conclusion
In the early part of the record between 80 BC and AD 400, the data indicate high WGC temperatures resulting in high fluxes of IRD sedimentation. Similar to other records in Disko Bugt region, this period is followed by large fluctuations in temperature during the timing of the DACP. A general cooling trend from AD 700 reduced the calving activity of Jakobshavn Isbræ indicated by decreasing IRD sedimentation leading into a period of almost no IRD within the sediment. We interpret this signal as a direct indicator of a floating glacier tongue around AD 1500. Due to the presence of a floating glacier tongue IRD deposition stayed low, WGC temperature started to rise again in AD 1700. We show that the instrumentally measured warming since the beginning of the 20th century is part of a long-term warming trend starting 200 years earlier. However, the documented retreat of the glacier terminus starting in AD 1850 was not initiated until WGC temperatures were matching temperatures from 1400 years ago combined with rising air temperatures at that time. WGC temperatures over the past 2000 years correspond well with other palaeo-oceanographic reconstructions from outer Disko Bugt, the Vaigat Strait as well as with reconstructed air temperatures on the GrIS. The IRD deposition, derived from Jakobshavn Isbræ, follows the general trend of WGC temperature but the sedimentation process does not react instantaneously. We conclude that the sedimentary record in the vicinity of Jakobshavn Isbræ is influenced by a complex variety of glaciological and climatic factors. This includes the presence of an ice tongue, an extended duration of coherent winter mélange, the proximity and retreat rates of the glacier front as well as the production rate of icebergs.
Supplemental Material
Wangner_et_al_supplementary_information – Supplemental material for A 2000-year record of ocean influence on Jakobshavn Isbræ calving activity, based on marine sediment cores
Supplemental material, Wangner_et_al_supplementary_information for A 2000-year record of ocean influence on Jakobshavn Isbræ calving activity, based on marine sediment cores by David J Wangner, Anne E Jennings, Flor Vermassen, Laurence M Dyke, Kelly A Hogan, Sabine Schmidt, Kurt H Kjær, Mads F Knudsen and Camilla S Andresen in The Holocene
Footnotes
Acknowledgements
We thank the captain and crew of the R/V Porsild for crucial help during fieldwork. Thanks also to Christina Rosenberg Lynge, Pernille Stockmarr, Wendy Freeman-Roth and Glenn Oxfeldt Jensen for helping during the labwork. Finally, we thank Anders Anker Bjørk for helpful discussions. Finally, we want to thank the anonymous reviewer for helpful and constructive comments.
Funding
The project ‘Past and future dynamics of the Greenland Ice Sheet: what is the ocean hiding?’ is funded by the VILLUM Foundation (grant no. 10100).
References
Supplementary Material
Please find the following supplemental material available below.
For Open Access articles published under a Creative Commons License, all supplemental material carries the same license as the article it is associated with.
For non-Open Access articles published, all supplemental material carries a non-exclusive license, and permission requests for re-use of supplemental material or any part of supplemental material shall be sent directly to the copyright owner as specified in the copyright notice associated with the article.