
Abstract
Holocene drift-sand activity in the northwest European sand belt is commonly directly linked to population pressure (agricultural activity) or to climate change (e.g. storminess). In the Pleistocene sand areas of the Netherlands, small-scale Holocene drift-sand activity began in the Mesolithic, whereas large-scale sand drifting started during the Middle Ages. This last phase not only coincides with the intensification of farming and demographic pressure but also is commonly associated with a colder climate and enhanced storminess. This raises the question to what extent drift-sand activity can be attributed to either human activities or natural forcing factors. In this study, we compare the spatial and temporal patterns of drift-sand occurrence for the four characteristic Pleistocene sand regions in the Netherlands for the period between 1000 BC and AD 1700. To this end, we compiled a new supra-regional overview of drift-sand activity based on age estimates (14C, optically stimulated luminescence (OSL), archaeological and historical ages). The occurrence of sand drifting was then compared in time and space with historical-route networks, relative vegetation openness and climate. Results indicate a constant but low drift-sand activity between 1000 BC and AD 1000, interrupted by a remarkable decrease in activity around the BC/AD transition. It is evident that human pressure on the landscape was most influential on initiating sand drifting: this is supported by more frequent occurrences close to routes and the uninterrupted increase of drift-sand activity from AD 900 onwards, a period of high population density and large-scale deforestation. Once triggered by human activities, this drift-sand development was probably further intensified several centuries later during the cold and stormier ‘Little Ice Age’ (LIA; AD 1570–1850).
Introduction
Drift sands are relatively young Holocene aeolian deposits, which originate from local reworking of terrestrial Pleistocene sand deposits, mainly coversands (Koster, 1982). Throughout the Holocene, expansion of drift-sand fields has been a prominent geomorphological phenomenon in the northwest European sand belt (Fanta and Siepel, 2010; Koster, 2009; Lungershausen et al., 2018; Tolksdorf and Kaiser, 2012; see Figure 1). Drift-sand formation often led to the loss of suitable farming land (Lascaris, 1999; Ravi et al., 2010) and sometimes even caused settlement abandonment (Derese et al., 2010; Heidinga, 1987; Mikkelsen et al., 2007). Prehistorical small-scale drift-sand activity was demonstrated by Willemse and Groenewoudt (2012) and Tolksdorf and Kaiser (2012), whereas large-scale drift-sand activity started from the Middle Ages onwards when human impact (e.g. deforestation and intensification of farming) on the landscape increased (Koster et al., 1993). Therefore, Holocene drift-sand activity is commonly linked to population pressure and agricultural practices (e.g. Kolstrup, 1997; Koster et al., 1993; Tolksdorf and Kaiser, 2012). However, other studies consider changes in climate or storminess to be an important control as well (e.g. Alexanderson and Bernhardson, 2016; Bateman and Godby, 2004; Charman, 2010; Jungerius and Riksen, 2010). This raises the question to what extent drift-sand activity can be attributed to either natural or human factors, or to a combination of these.
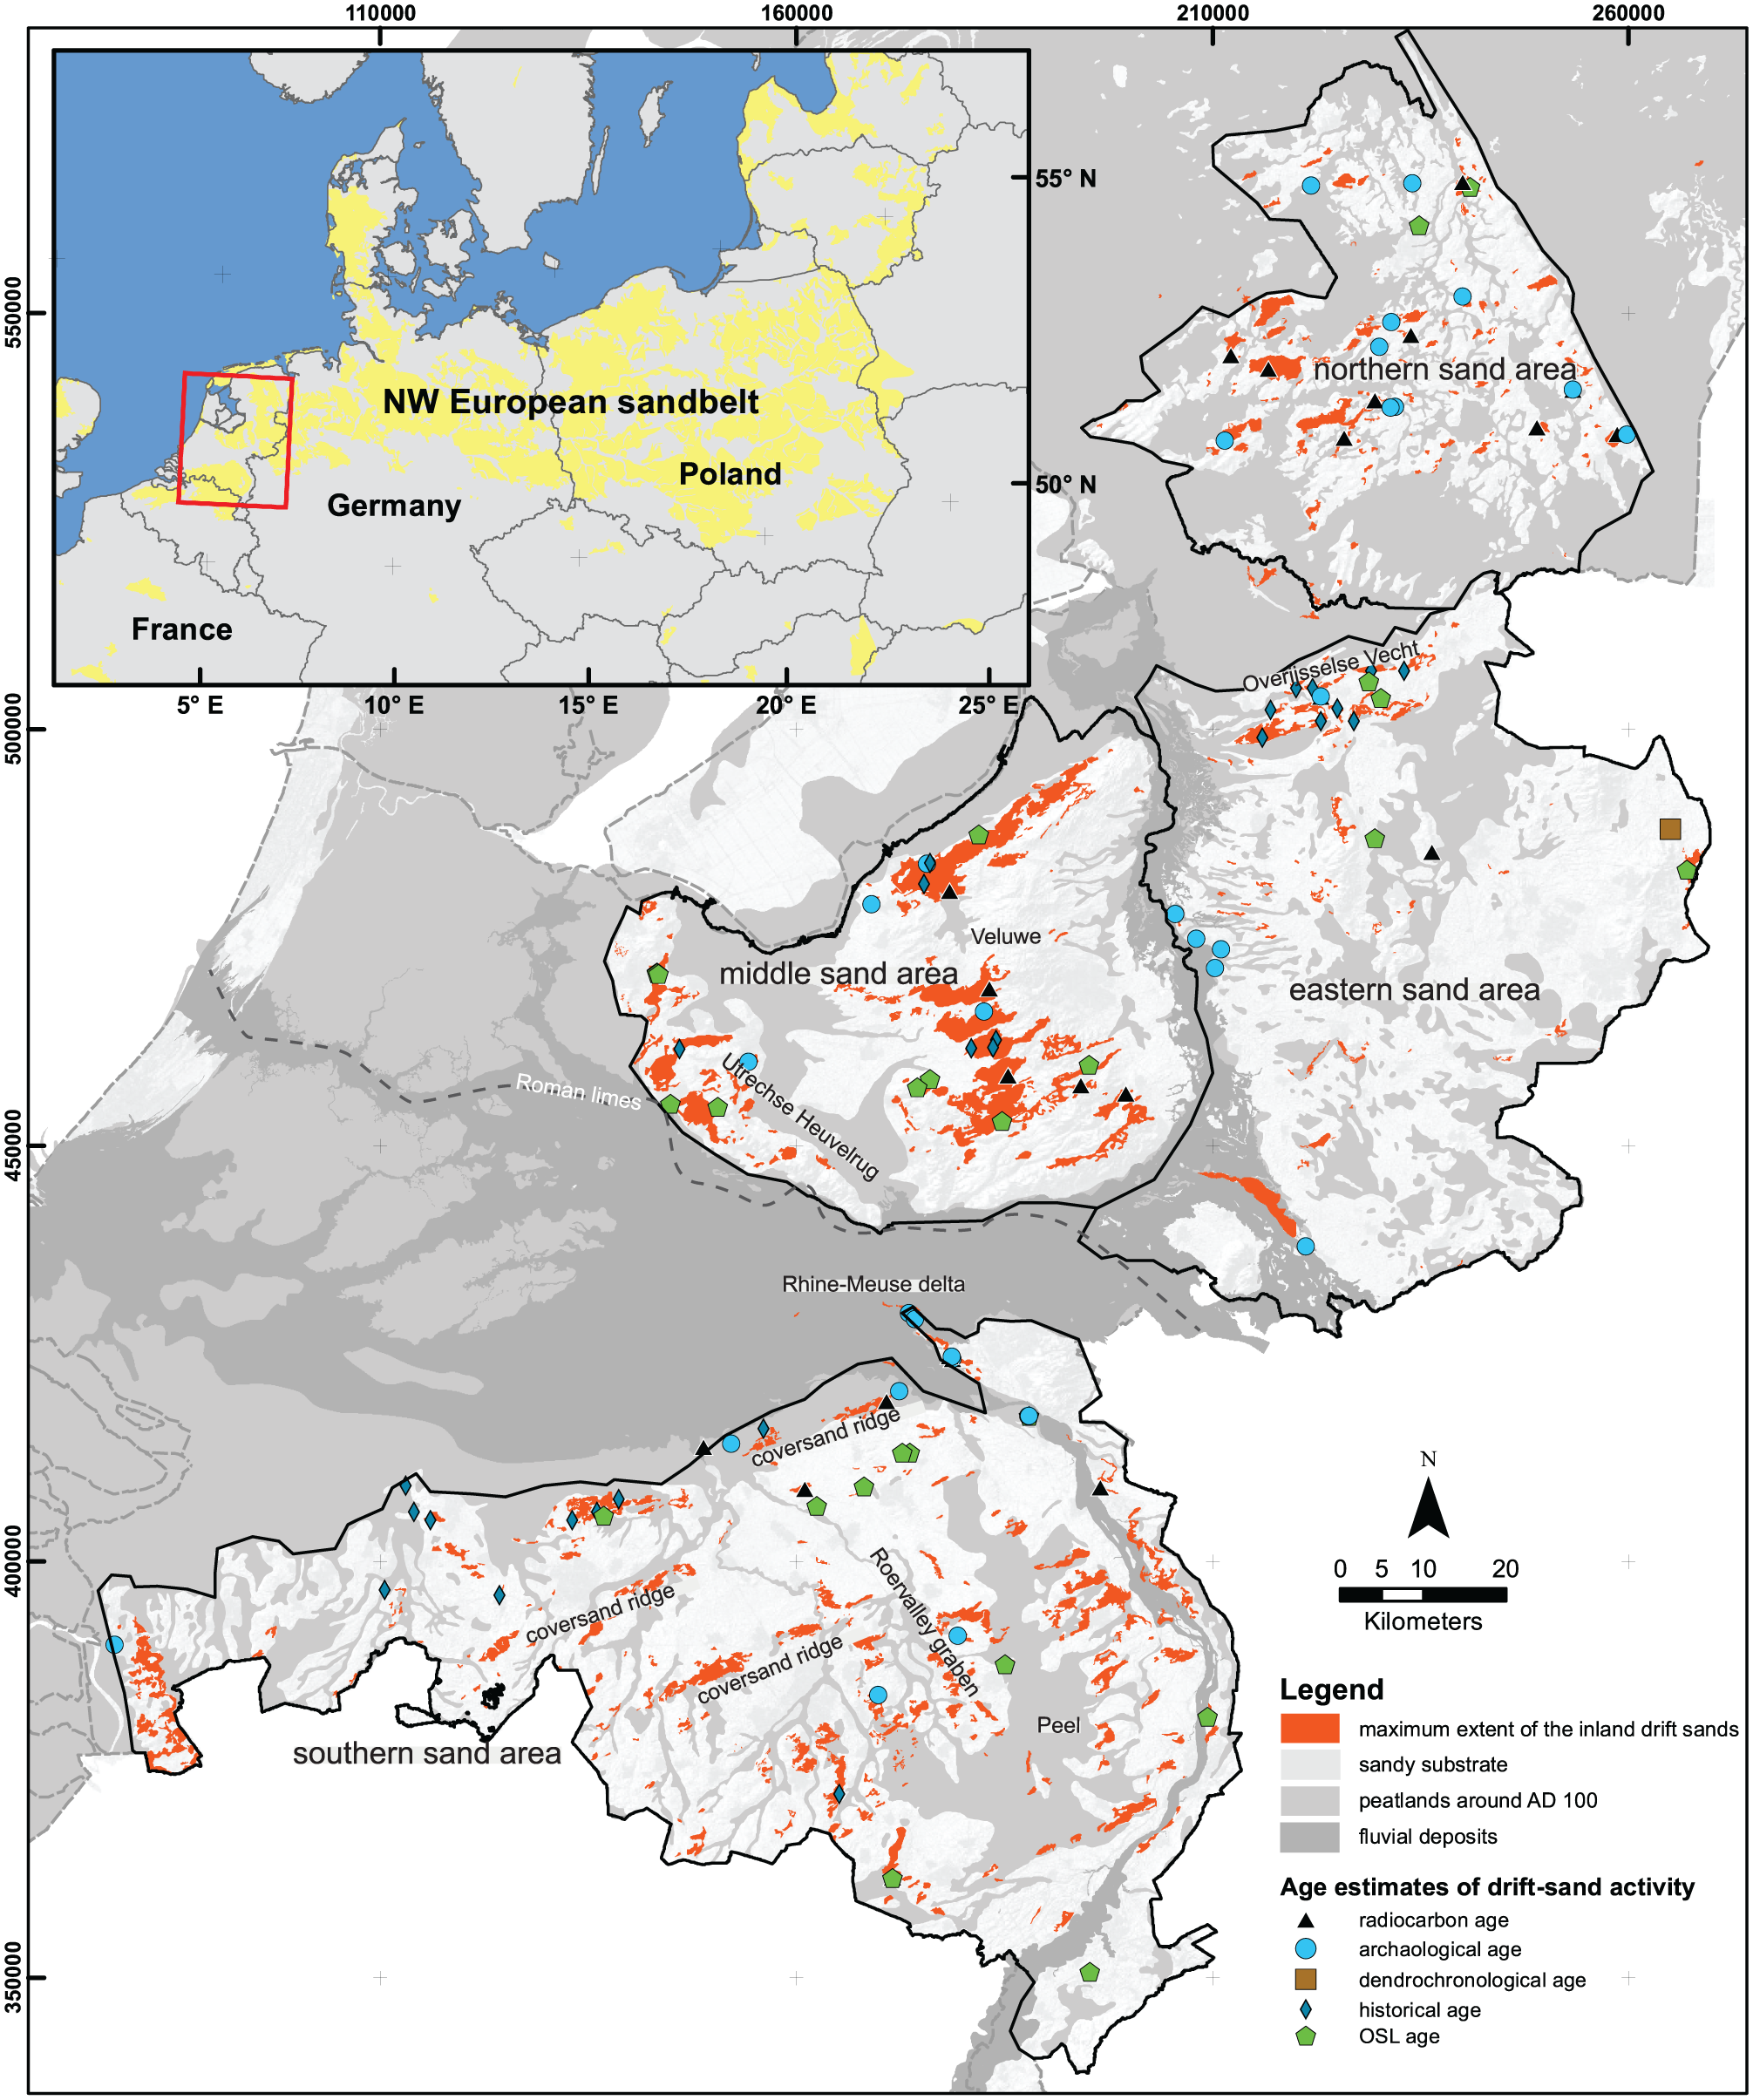
Location of the study area and the four regions distinguished in this study. Maximum extent of drift sands was taken from Vos and De Vries (2013) and the national soil map 1:50,000 (De Vries et al., 2003), peatland extent was taken from Vos and De Vries (2013) and extent of the fluvial deposits was taken from Pierik et al. (2017a).
Many studies that link drift-sand occurrence to fluctuations in climate or human pressure consider only a few sites in high detail. The information from these sites not always necessarily represents regional trends. Large supra-regional studies have resulted in useful overviews of multiple sites mainly by chronologically comparing patterns of forcing factors and drift sands (e.g. Koster et al., 1993; Tolksdorf and Kaiser, 2012). Few studies, however, analysed the spatial patterns of drift-sand activity and their forcings on a regional scale. Further understanding of past drift-sand activity would additionally benefit from complementing such overview studies with new data from different disciplines.
In this article, we explore the role and the relative importance of environmental factors (e.g. landscape setting, climate) and demographic pressure (population density (PD), deforestation) on the formation of drift sands. We focus on four Pleistocene sand regions in the Netherlands, which comprise the western part of the northwest European sand belt (Figure 1). For this area, abundant data on climate, vegetation development, human occupation and drift-sand activity are available. The four studied areas, all ca. 50 × 100 km in size, share common past climate trends but are different in many cultural and geomorphological aspects. We compiled an integrated supra-regional overview of drift-sand-related dates, either directly or indirectly indicating drift-sand activity or its absence using, 14C and optically stimulated luminescence (OSL), as well as archaeological and historical dates. Using this new data overview, we performed analyses of (a) the temporal changes in drift-sand activity between the areas and (b) the local spatial patterns of drift-sand activity within these regions. For the first analysis, the regional drift-sand chronology was compared with reconstructions of regional PD and forest cover. For the second analysis, the location of drift-sand activity was compared with areas with higher demographic pressure, indicated by the presence of past main route networks. The study focuses on the period between 1000 BC and AD 1700, because the PD and vegetation cover strongly changed during this time span (Jansma et al., 2014; Louwe Kooijmans, 1995; Teunissen, 1990), allowing a comparison between these factors and drift-sand occurrence. Furthermore, this time frame provides the most data regarding drift-sand activity, palaeoclimate data and demographic pressure, which enables to discriminate between forcing factors and resulting drift-sand activity. Before the selected time frame (before 1000 BC), data on sand drifting and possible forcings are scarce. After ca. AD 1700, the dune fields became so large and the pressure of people on the landscape so high, that an approach using written sources and historical maps would be more adequate, which is beyond the scope of this article. The dune fields reached their maximum extent in the 19th century, after which they were confined and reduced through the establishment of large-scale pine plantations (Koster, 2009; Riksen et al., 2006). The regional scale and the period 1000 BC–AD 1700 provides the best opportunity to test the relation between drift-sand activity and climate, demography and land use. As such, this article contributes to further understanding human–landscape interactions in sandy areas.
Controls in drift-sand formation
Several prerequisites of drift-sand initiation have been identified in previous studies (see Figure 2; Koster, 1978; Schelling, 1955). First of all, sand drifting requires the presence of fine and relatively well-sorted sand at the surface (Marzolf, 1988; Pye and Tsoar, 2008). Second, vegetation cover has to be low (generally lower than 30%; Ash and Wasson, 1983), not only at the surface of the sand source but also in its surroundings. In order to transport the sand, the wind needs a fetch of around 500 m (Steckhan, 1950). When these preconditions are met, strong winds (especially above 5.5 m/s) can generate large-scale sand transport (Livingstone and Warren, 1996). Silts are cohesive and will therefore hamper aeolian transport; fine sands with non-cohesive grains are most easily transported (Bagnold, 1941; Pye and Tsoar, 2008). Also, dry sand will be transported more easily.
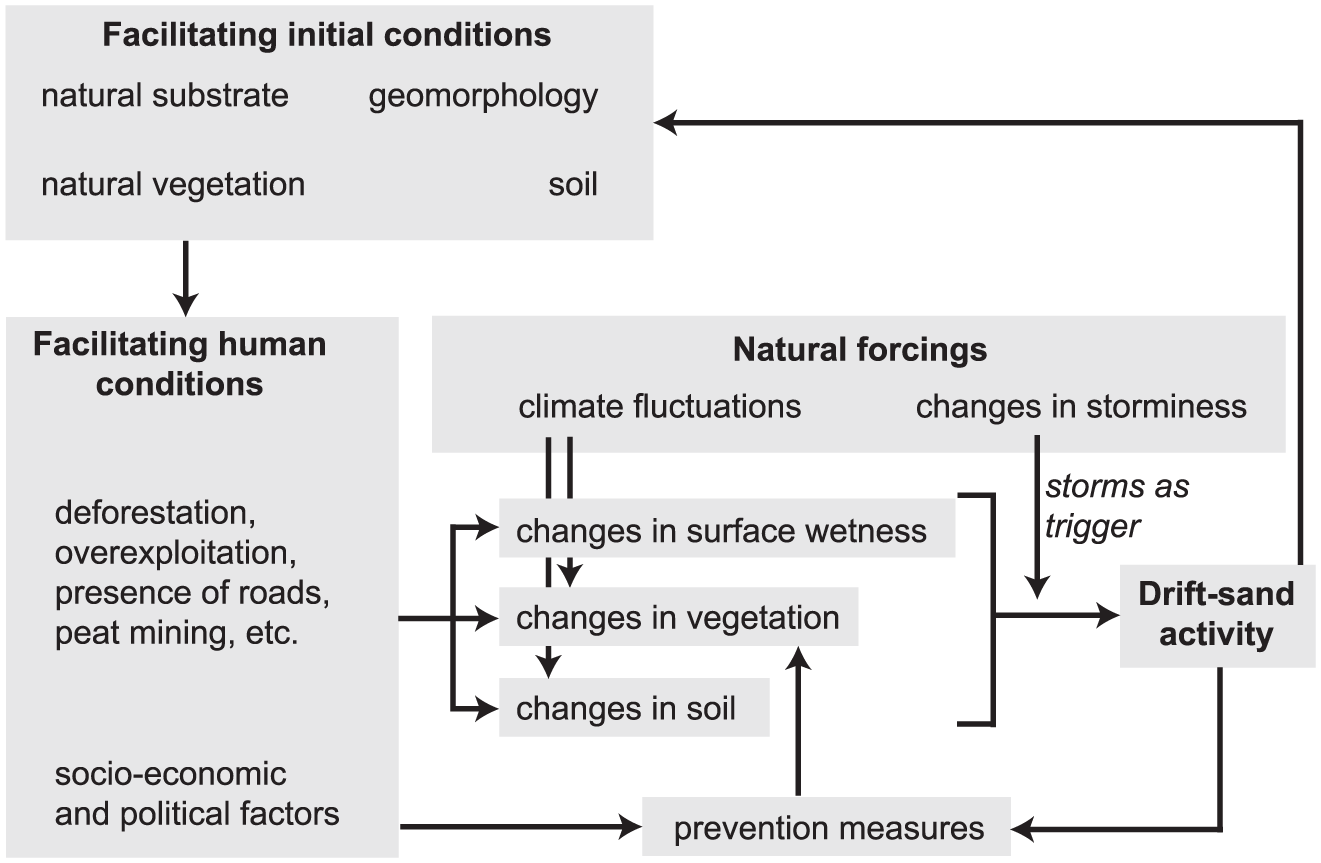
Conceptual diagram summarising the controls on Holocene drift-sand formation that are treated in this study (for explanation, see text).
Heidinga (1984a, 1984b) and Jungerius and Riksen (2010) suggested severe drought as a climatically facilitating condition that could have made the soil more prone to sand drifting. Also, colder climatic events could have weakened the vegetation cover. In the NW-European sand belt, sand drifting has been linked to land-use changes such as deforestation and especially to the presence of bare soil in croplands from which sand can deflate (Figure 2; for example, Castel et al., 1989; Dulias et al., 2008; Koster, 2009; Kozarski and Nowaczyk, 1991; Spek, 2004). The area of bare soil and the seasonal timing vary per region and crop and determine the risk of sand drifting. Overexploitation by grazing, burning practices and the use of plaggen (cutting of sods) from heathlands are also land-use practices associated with sand drifting (Koster, 2009; Lascaris, 1999). In addition, roads and cattle and sheep drifts have been suggested as drift-sand nuclei (Heidinga, 1984a; Spek, 2004). The occurrence of these land-use practices can be influenced by socio-economic factors, as are prevention measures (e.g. use of hedges) that prevent drift sands once formed (Figure 2; for example, De Keyzer, 2016; Heidinga, 1987).
Besides a research focus on facilitating controls that make the substrate more prone to sand drifting, much focus has been on the triggers causing it (Figure 2). Large-scale reactivation of both inland and coastal dune systems has been linked to climatic change, in particular to the frequency of intense storms (‘storminess’; Clemmensen et al., 2009; Costas et al., 2012; Sorrel et al., 2012). These periods seem to match reasonably well with colder climate episodes, especially for the ‘Little Ice Age’ (LIA; AD 1570–1850), which is associated with more severe storms in NW-Europe (Clarke and Rendell, 2009; Costas et al., 2012). Enhanced inland and coastal dune formation has been found in the United Kingdom for this period (Bateman and Godby, 2004; Charman, 2010), along the French Atlantic coast (Clarke and Rendell, 2006), in the Netherlands (Jungerius and Riksen, 2010), in Portugal (Clarke and Rendell, 2011; Costas et al., 2012) and in Denmark (Clemmensen et al., 2001, 2007, 2009). Many of these studies focussed on coastal settings where marine-influenced factors also played a role (e.g. Van Vliet-Lanoë et al., 2016); nevertheless, these cold and stormy climates might have caused inland sand drifting as well. While the observed large-scale dune formation also coincided with increasing PD and enhanced human pressure in both inland and coastal landscapes, most of these studies consider the human factor only to a limited extent. Therefore, in the present study, an integrative approach is applied, which considers the role and relative importance of the forcings (natural and human-induced) and initial conditions given in Figure 2.
Geographical setting
Geological and geomorphological setting
Inland drift sands in the Netherlands mainly consist of reworked Weichselian periglacial coversands (Schelling, 1955), which form the largest outcropping unit in the Pleistocene sandy area (Kasse, 2002; Schokker et al., 2007; Van der Hammen et al., 1967).During the Holocene, peat developed, either in brook valleys (Bisschops et al., 1985) or in other lower and wet areas, and could develop into large oligotrophic fen peat lands (Figure 1; Casparie and Streefkerk, 1992; Van Beek et al., 2015b). Within the Pleistocene sand area, we distinguish four areas that have distinct geological substrates and are separated by fen peat wetlands or large river floodplains: the northern, eastern, middle and southern sand area (Figure 1).
The substrate of the northern sand area contains till of Saalian age (Rappol, 1987), capped by up to 2 m of coversand (Bosch, 1990). The substrate is loamy and wet because of the presence of the impermeable till. The main drift-sand activity in this area was reconstructed to have taken place after ca. AD 1200 (Castel, 1991; Castel et al., 1989).
In the eastern sand area, relatively small isolated coversand ridges are present. The first indications of drift-sand activity date back to the Neolithic period (Table 1) and occurred on relatively high Pleistocene river dunes flanking small rivers (Willemse and Groenewoudt, 2012). At present, the largest drift-sand fields, which mainly are post-medieval, are situated along the Overijsselse Vecht (Bruins, 1981; Neefjes et al., 2011).
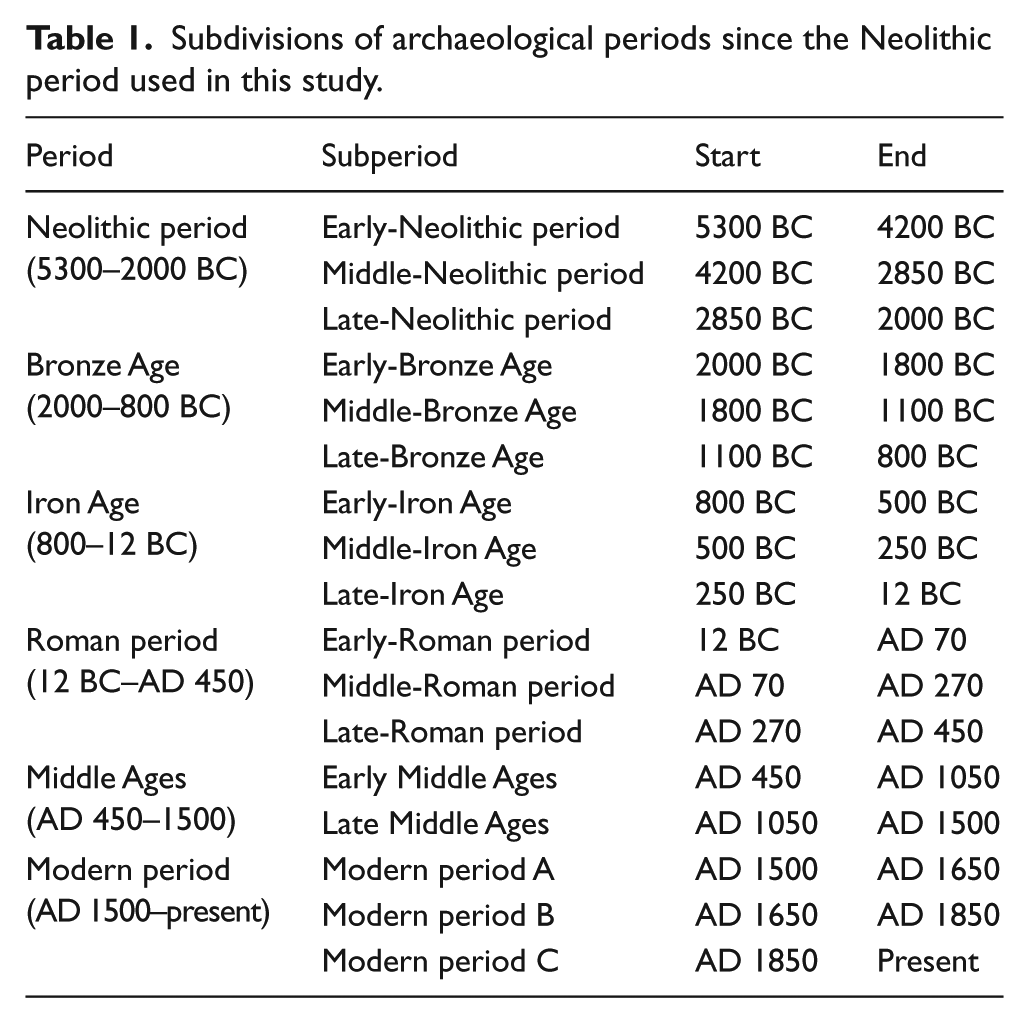
Subdivisions of archaeological periods since the Neolithic period used in this study.
A large part of the middle sand area consists of ice-pushed ridges formed during the Saalian, the Veluwe and Utrechtse Heuvelrug (Busschers et al., 2008). Although they are very well drained and thus dry, their coarse sandy and gravelly substrate makes them less likely sources for sand drifting On the western side, however, the ice-pushed ridges are flanked and partly covered by thick coversands, which are prone to sand drifting (Koster, 1978; Sevink et al., 2013). Early Holocene evidence of drift-sand activity was found by Sevink et al. (2013, 2018). Especially on the western flanks of the ice-pushed ridges, large drift-sand fields developed after AD 1200, which developed into the largest drift-sand fields of the Netherlands (Heidinga, 1984a, 1984b, 1987; Koster, 1978).
In the southern sand area, the Roer Valley Graben contains thick coversand deposits with quite shallow loamy impermeable deposits, causing the soils to be relatively wet (Bisschops et al., 1985; Schokker et al., 2007). Here, three long west-southwest to east-northeast-oriented coversand ridges occur, which locally have been reworked into drift-sand dunes (Figure 1). The earliest Holocene sand drifting has been dated around 4000 BC in this area (Van Mourik, 1988; Van Mourik et al., 2010).
Vegetation development and population
Until the Neolithic period (Table 1), vegetation development and soil formation in coversand deposits took place without significant human interference (Doorenbosch and Van Mourik, 2016). From the late-Neolithic period onwards, forest vegetation gradually developed into heathland (Casparie and Groenman-Van Waateringe, 1980; Janssen, 1972; Louwe Kooijmans, 1995; Van Geel et al., 2017), coinciding with soil depletion and podzol development (Sevink et al., 2013; Spek, 1996; Waterbolk, 1964). The first small-scale sand drifting took place on high and dry river dunes in the Neolithic period; it became more widespread since the middle-Bronze Age (Willemse and Groenewoudt, 2012). In all four areas, PD gradually increased towards the Roman period (Louwe Kooijmans et al., 2011), coeval with the decrease in forest cover. This pattern changed during the 4th and 5th centuries AD, when major depopulation and reforestation occurred (Cheyette, 2008; Groenewoudt et al., 2007; Kalis et al., 2008; Teunissen, 1990; Wickham, 2009). The latter trend was most pronounced in the areas south of the Roman limes (Figure 1) in the southern sand area, where it started from AD 270 onwards, a century later it also occurred in the other three areas. From the 7th century onwards, PD and the corresponding pressure on the landscape started to increase again, a trend which generally persisted throughout the entire Middle Ages (e.g. Van Bavel, 2010). As a result, the forested area decreased again, with the lowest forest cover occurring during the Modern period (Engels et al., 2016; Spek, 2004; Teunissen, 1990; Van Beek et al., 2015a). From the late Middle Ages onwards, the southern sand area became the most densely populated sand area in the Netherlands (Spek, 2004).
Climate
During the last three millennia, several warmer and colder periods occurred in northwestern Europe with temperature fluctuations of 1–2°C. The transitions between these periods usually were gradual and differ in timing between the various records from which they were derived. Before 500 BC, climate was relatively warm, followed by a colder episode between 500 and 300 BC, and subsequently by a warmer period between 300 BC and AD 500 (inferred from a Greenland ice core by Kobashi et al., 2011). This later warm period, the Roman Warm Period (RWP), is recorded in proxy records across NW-Europe (Büntgen et al., 2011). An abrupt cooling has been identified around AD 500 (Dark Ages Cold Period (DACP): AD 500–700: Büntgen et al., 2016; Ljungqvist, 2010) and was followed by the relatively warm Medieval climate optimum (MCO; AD 700–1570) and subsequently by the colder LIA (AD 1570–1850; Lamb, 1972; Mann, 2002). Accurate precipitation reconstructions are scarce; Büntgen et al. (2011) indicate normal conditions during the Iron Age (800–12 BC; Table 1), a wetter RWP and first part of the DACP (Dermody et al., 2011; McCormick et al., 2012) and a relatively dry second part of the DACP for NW-Europe. The MCO is often reconstructed as relatively wet. Periods of prolonged drought could lead to the dying of vegetation or fires, both resulting in bare soils susceptible to aeolian erosion (Doorenbosch and Van Mourik, 2016). Sorrel et al. (2012) have inferred periods of increased storminess in NW-Europe from sedimentological archives of coastal records, with increased storminess occurring in 1100–400 BC, AD 100–950 and AD 1400–1750. The latter period also has been documented as relatively stormy in historical records in the Netherlands dating from around AD 1400 onwards (Berendsen, 1984; Buisman and Van Engelen, 1996, 1998, 2000; Vos, 2015). Although the first historical storm references date from the 8th century, the record is only reliable after around AD 1300 for deriving long-term trends.
Materials and methods
In order to establish the relationship between drift-sand activity and human pressure between 1000 BC and AD 1700, the temporal patterns per region were analysed as outlined in the first methodological section. This was done by comparing the occurrence of 140 investigated drift-sand events with population-density data and forest cover trends. The occurrence and intensity of sand drifting in the Pleistocene coversand area were derived from ca. 340 ages related to drift-sand activity (see Figure 1 and Table 2). In the second methodological section, we outline how the location of the events of drift-sand activity was compared with zones of intensified demographic pressure.
Methods for estimating ages of drift sands and how the drift-sand events were derived from them.
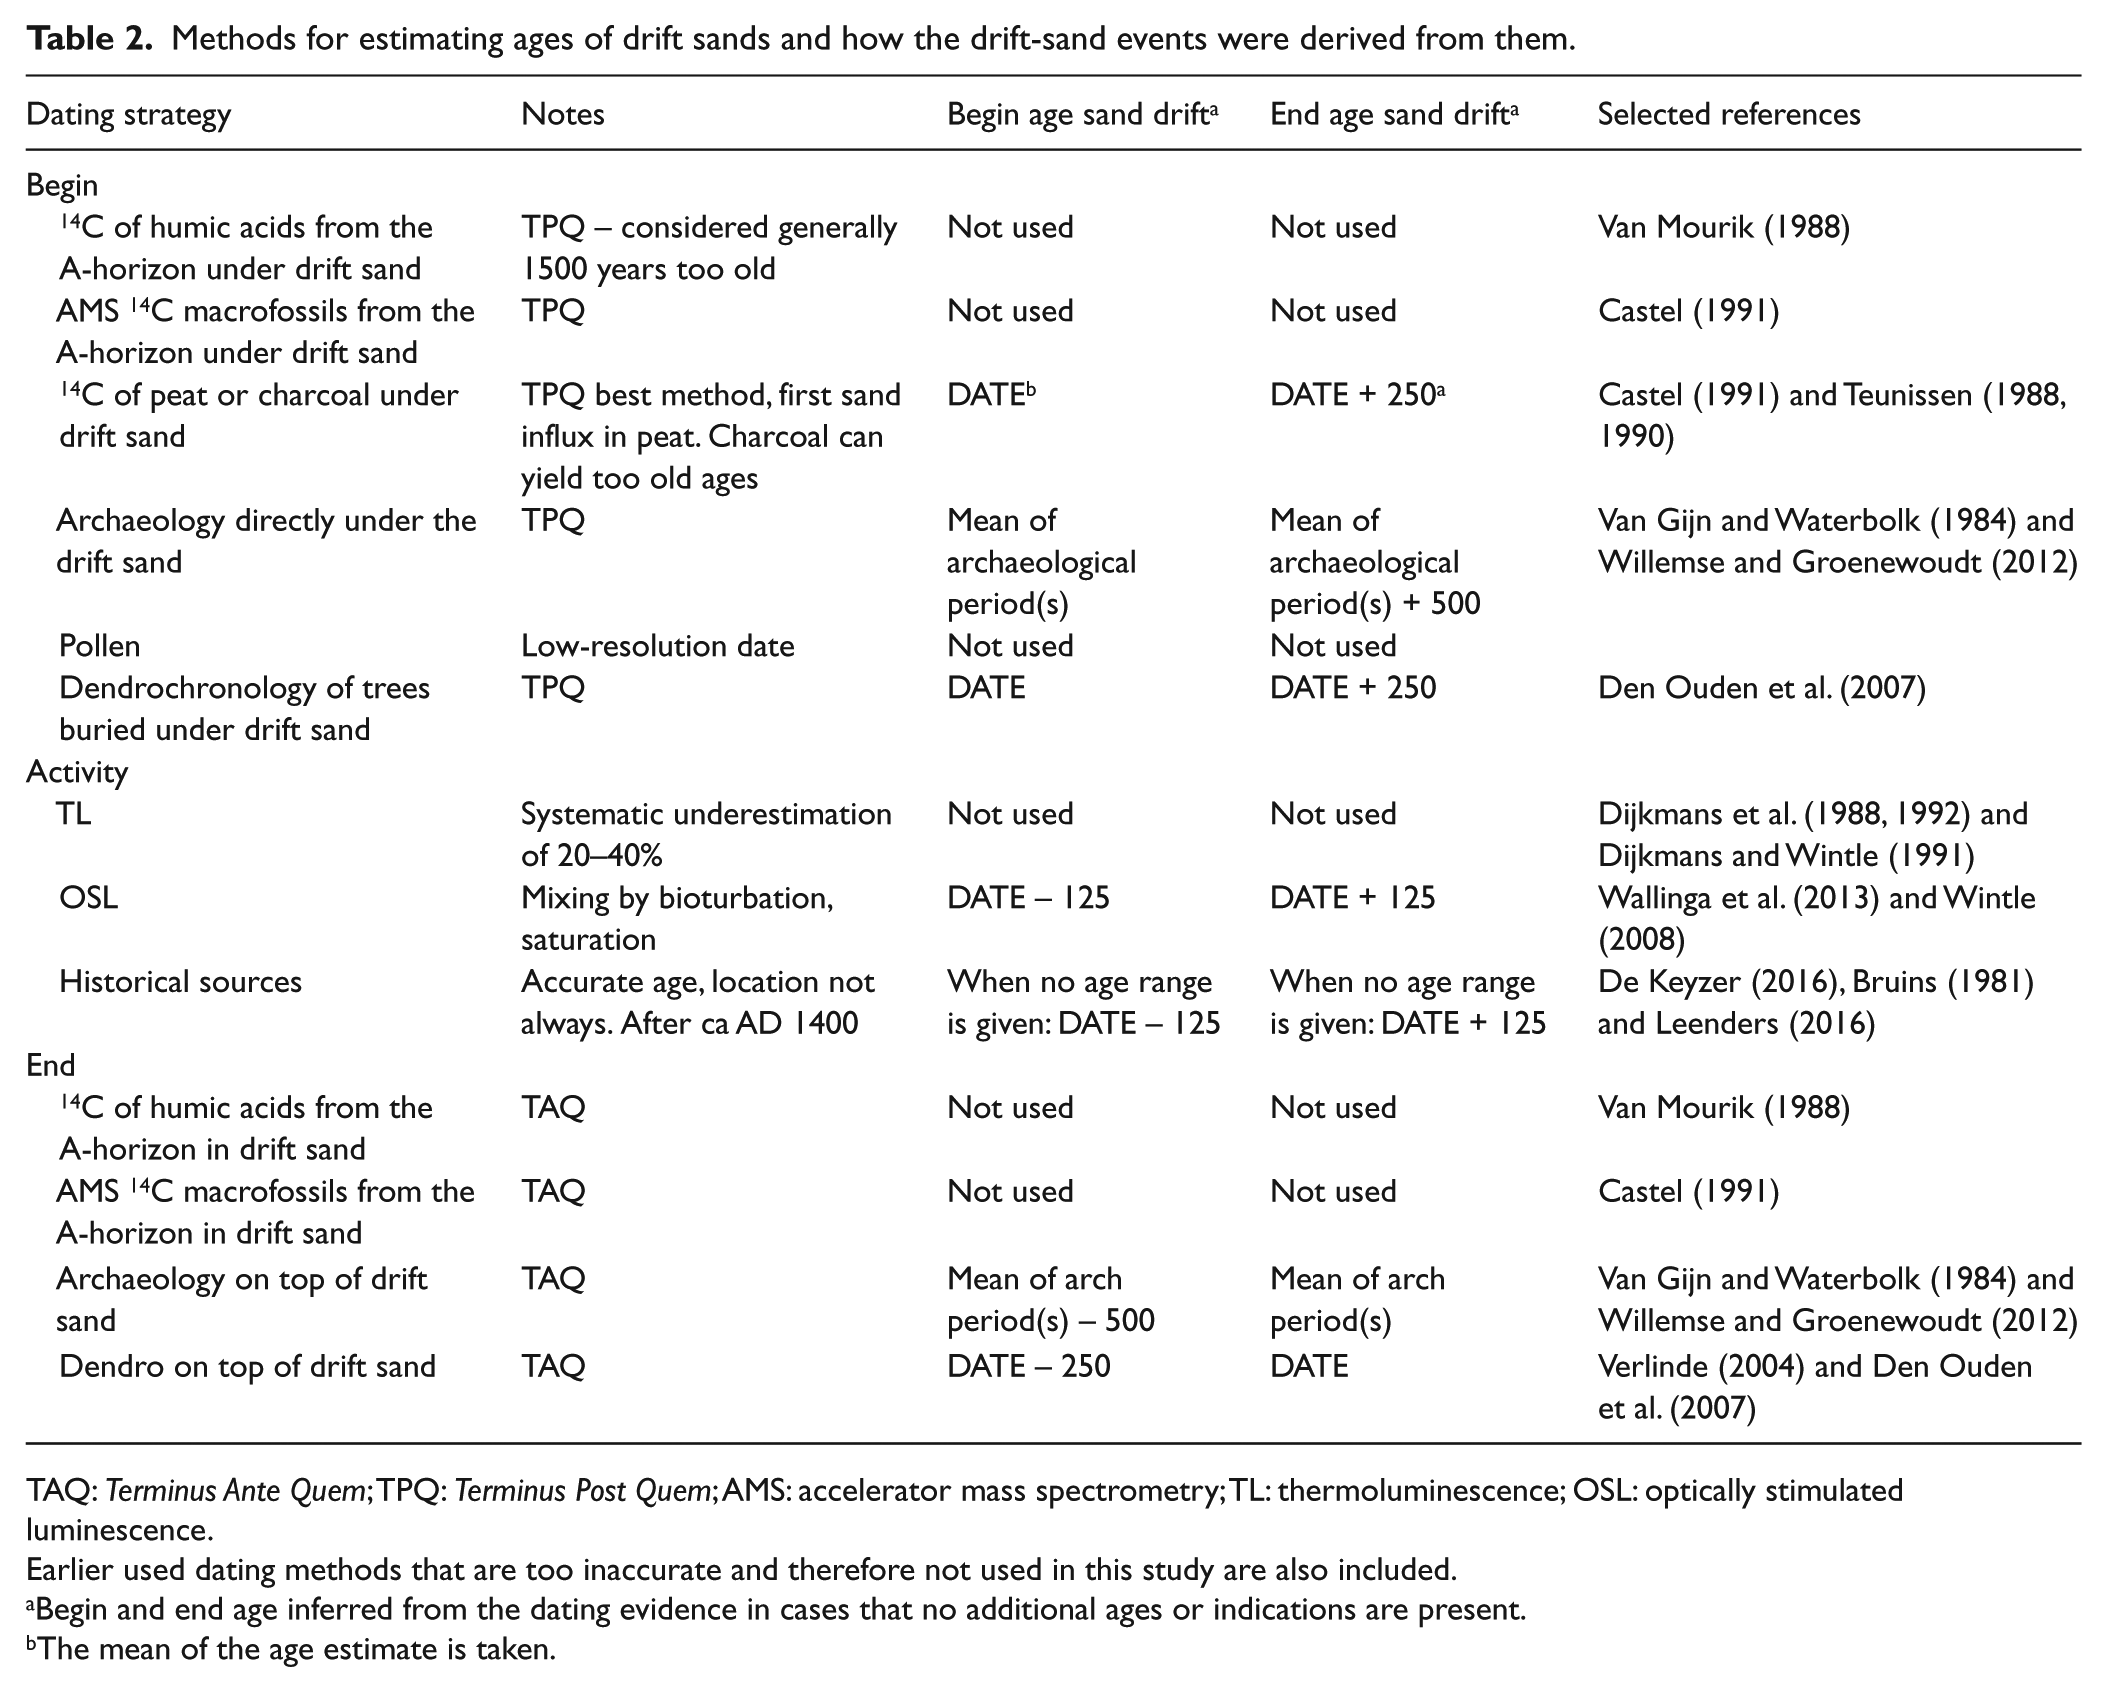
TAQ: Terminus Ante Quem; TPQ: Terminus Post Quem; AMS: accelerator mass spectrometry; TL: thermoluminescence; OSL: optically stimulated luminescence.
Earlier used dating methods that are too inaccurate and therefore not used in this study are also included.
Begin and end age inferred from the dating evidence in cases that no additional ages or indications are present.
The mean of the age estimate is taken.
Assessing temporal patterns per region
Collecting temporal information on events of drift-sand activity
Several techniques are available that can be used to directly or indirectly date (the absence of) drift-sand activity (Table 2). These age estimates were collected from the literature (e.g. Koster et al., 1993; Tolksdorf and Kaiser, 2012; Willemse and Groenewoudt, 2012), the LumiD database of OSL ages (www.lumid.nl) and archaeological reports (see Appendix B, available online). Only age estimates for inland drift sands were used (i.e. omitting events affected by coastal dynamics; for example, Vos et al., 2015).
OSL is a reliable direct dating tool of drift-sand activity (Wallinga et al., 2007); it has been applied to inland drift sands by, for example, Bateman and Van Huissteden (1999), Derese et al. (2010), Hilgers (2007), Sevink et al. (2013), Vandenberghe et al. (2013), Van Mourik et al. (2010) and Wallinga et al. (2013). Usually, multiple samples are taken within in a single drift-sand sequence, in order to determine the rate and duration of sand deposition. For this study, we only used OSL burial age estimates based on quartz OSL dating, where equivalent doses were obtained using the Single Aliquot Regenerative dose protocol (Murray and Wintle, 2003). The vast majority of analyses were performed at the Netherlands Centre for Luminescence Dating (NCL sample codes – see the original publications listed in Appendix B, available online, for further details of the measurement procedures).
Archaeological finds (usually pottery) below the drift-sand deposits, for example, Van Beek (2009), Van Gijn and Waterbolk (1984) and Willemse and Groenewoudt (2012), were used as indirect Terminus Post Quem ages (TPQ, providing an earliest possible age). Archaeological finds on top of the drift-sand deposits were used as Terminus Ante Quem (TAQ, providing a youngest possible age). Since drift sands rarely contain organic material, direct radiocarbon-dating opportunities of drift phases are limited. We excluded radiocarbon ages of humic acids from intercalating soils (Castel, 1991; Van Mourik, 1988), as these proved to be up to 1500 years too old when compared with OSL ages (Van Mourik et al., 2010; Wallinga et al., 2013). Peat below drift sands, however, provided more accurate TPQ 14C ages, especially when AMS was used (Castel, 1991; Koster et al., 1993).
Historical documents (i.e. written sources) recording drift-sand activity on a specific location are also used as age estimates for active sand drifting (e.g. Bruins, 1981; De Keyzer, 2016; Leenders, 2016). These records have the highest chronological accuracy, but the exact location of the described sites is not always clear and written sources on drift-sand activity are only available from around AD 1400 onwards.
Determining drift-sand events and establishing drift-sand intensity
The chronological information was incorporated into a database, registering the dating method and the literature reference (Appendix B, available online). From this information, the most likely periods of drift-sand activity were derived (Table 2), which were summed into drift-sand intensity per century. The beginning of drift-sand events was set at the mean TPQ age (if available) and the end of activity at the mean TAQ age (if available). When either the begin or end age was not available, we assumed the drift-sand activity to have taken place in a period of 250 years (Table 2). As a result of this, the chance of sand drifting was equally spread over the 250-year interval. Within this time frame, multiple short drift-sand events could then have occurred with hiatuses in between, which cannot be identified, even when multiple OSL samples were dated within a single section. The 250-year period was derived from empirical studies that resulted in multiple OSL ages for single drift-sand sequences (Derese et al., 2010; Sevink et al., 2013; Vandenberghe et al., 2013). The duration of drift-sand activity in these studies ranged from decades to a maximum of ca. 250 years; we took the 250-year period as a save maximum. In line with this, for sites with one OSL age estimate, we considered this age to reflect the middle of a phase of sand drifting lasting 250 years, that is, starting 125 years before this moment and ending 125 years after this moment. This approach results in smoothing of activity phases and prevents peaks in activity as an artefact of the limited number of OSL ages that are available. For TPQ ages based on radiocarbon dating of peat underneath drift sand, we assumed that no hiatus occurred between peat formation (cf. Koster et al., 1993) and sand influx. For archaeology buried by drift sand, the mean of the archaeological dating range was taken as the begin age, and the end age was set 500 years later in order to account for the possible large hiatus between the archaeological age and the drift-sand event. For finds on top of drift sands, we took the central age of the archaeological period as the end age and set the start age 500 years earlier.
To reconstruct drift-sand intensity from the combined data over time, we summed the intensity of all drift-sand events per century. The intensity per individual event (I) was set proportional to the reconstructed duration of the reconstructed drift-sand period (taken as the difference between its begin age (
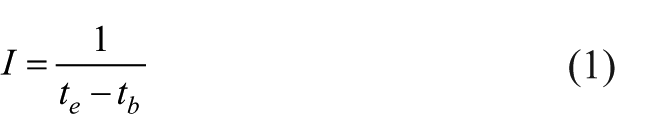
This method incorporates the precision of the events: events that were dated within a small time frame (i.e. more precisely dated events) received a high weight, whereas events that had a much more uncertain time frame were assigned a lower weight. Applying this step weights down the contribution of less well-dated events in the resulting intensity curve. In addition, this method filters overrepresentation of sections with multiple dates, because only inferred begin and end of the period were incorporated in the intensity curve.
This approach results in an overview of currently known sites with sand-drift activity, which is unavoidably biased because of research traditions and availability of ages (e.g. historical ages only are available for the last centuries). To assess the relative contribution of each dating method, the intensity curve shows the contribution of the different dating techniques. To partially overcome biases in the reconstructed sand drifting, we also used evidence regarding the absence of this phenomenon, among others, derived from dated peat sequences and well-dated hiatuses between drift-sand stages (e.g. between late-Glacial coversand and drift sand). This was incorporated in the temporal analysis as evidence of sand-drift absence (brown and grey bars in Figures 3–6).
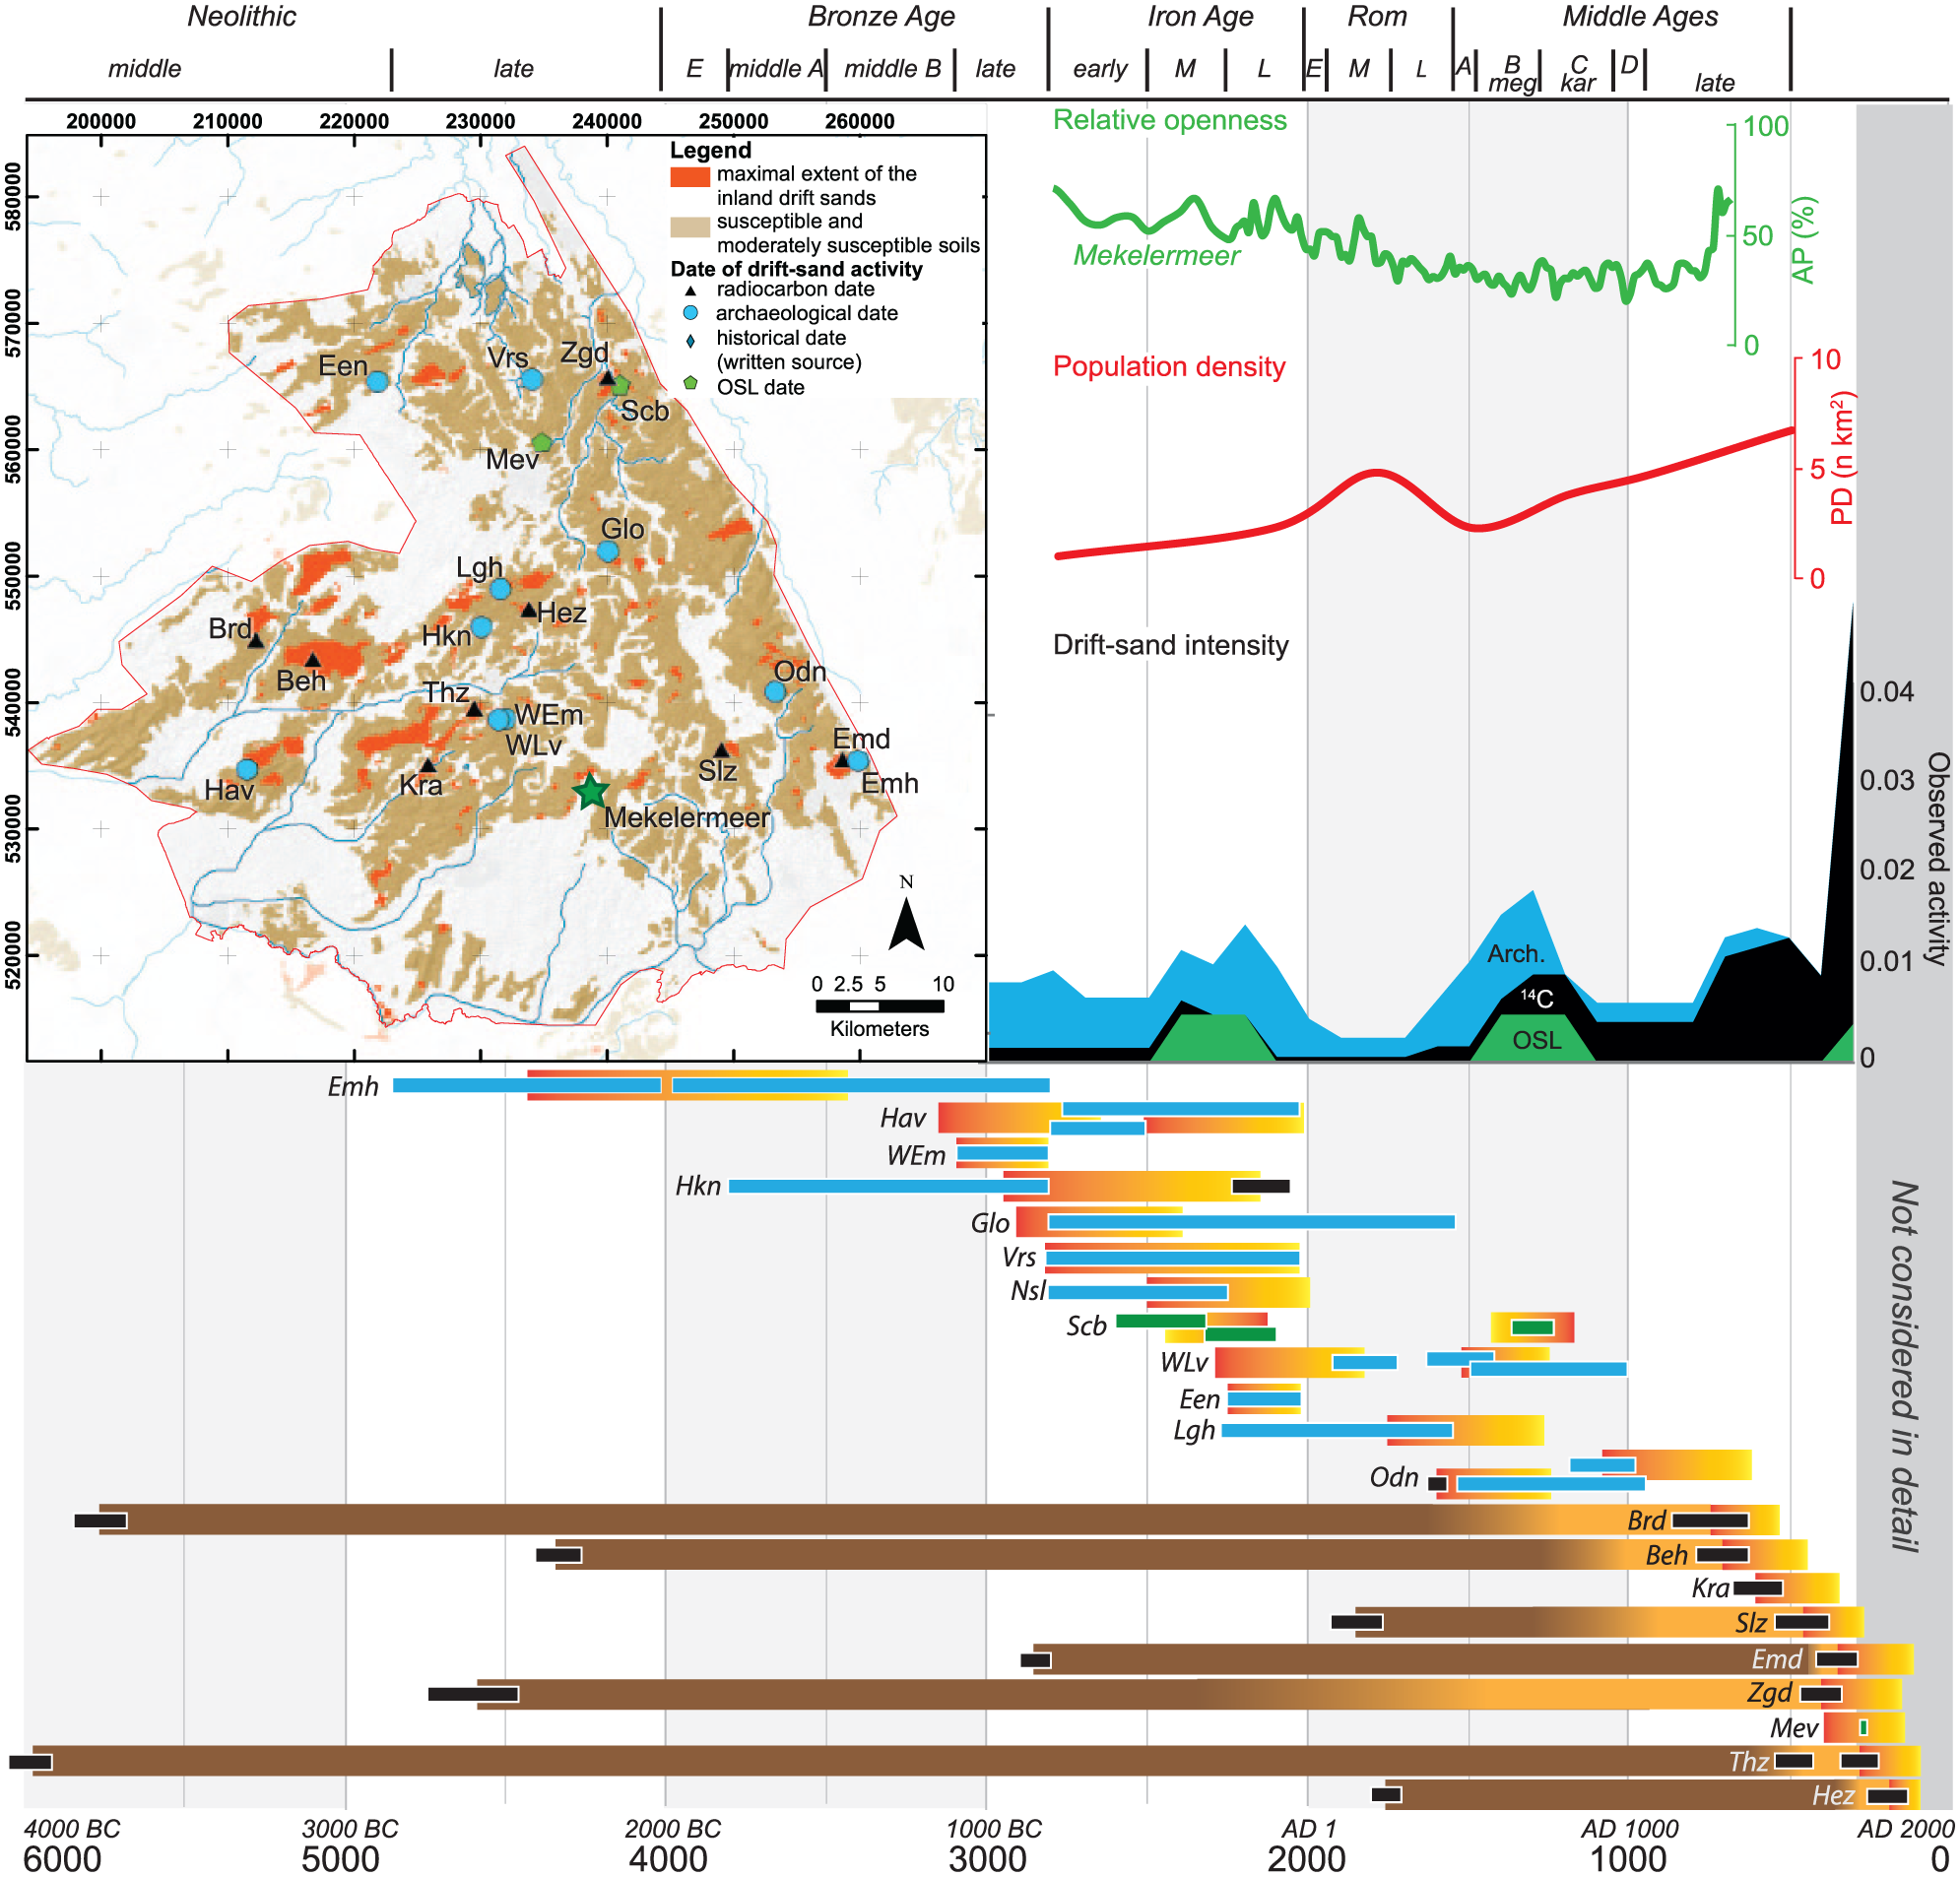
Drift-sand activity in the northern sand area. Ages are in B2k (before AD 2000); for legend, see Figure 4. The narrow bars indicate 1σ range for drift-sand age estimates (Appendix B, available online), the wider yellow–orange bars indicate estimated drift-sand activity, the dark brown bars indicate peat formation and the light brown bars indicate soil formation (during episodes with no sand drifting). The observed intensity graph (middle-right) shows the sum of all age estimates in the figure visualised per type of dating method (colour corresponds to the colours of the narrow bars). Population-density (PD) estimates are explained in Appendix A1, available online; the arboreal pollen percentage (AP%) is used as an indication for openness (see Appendix A2, available online).
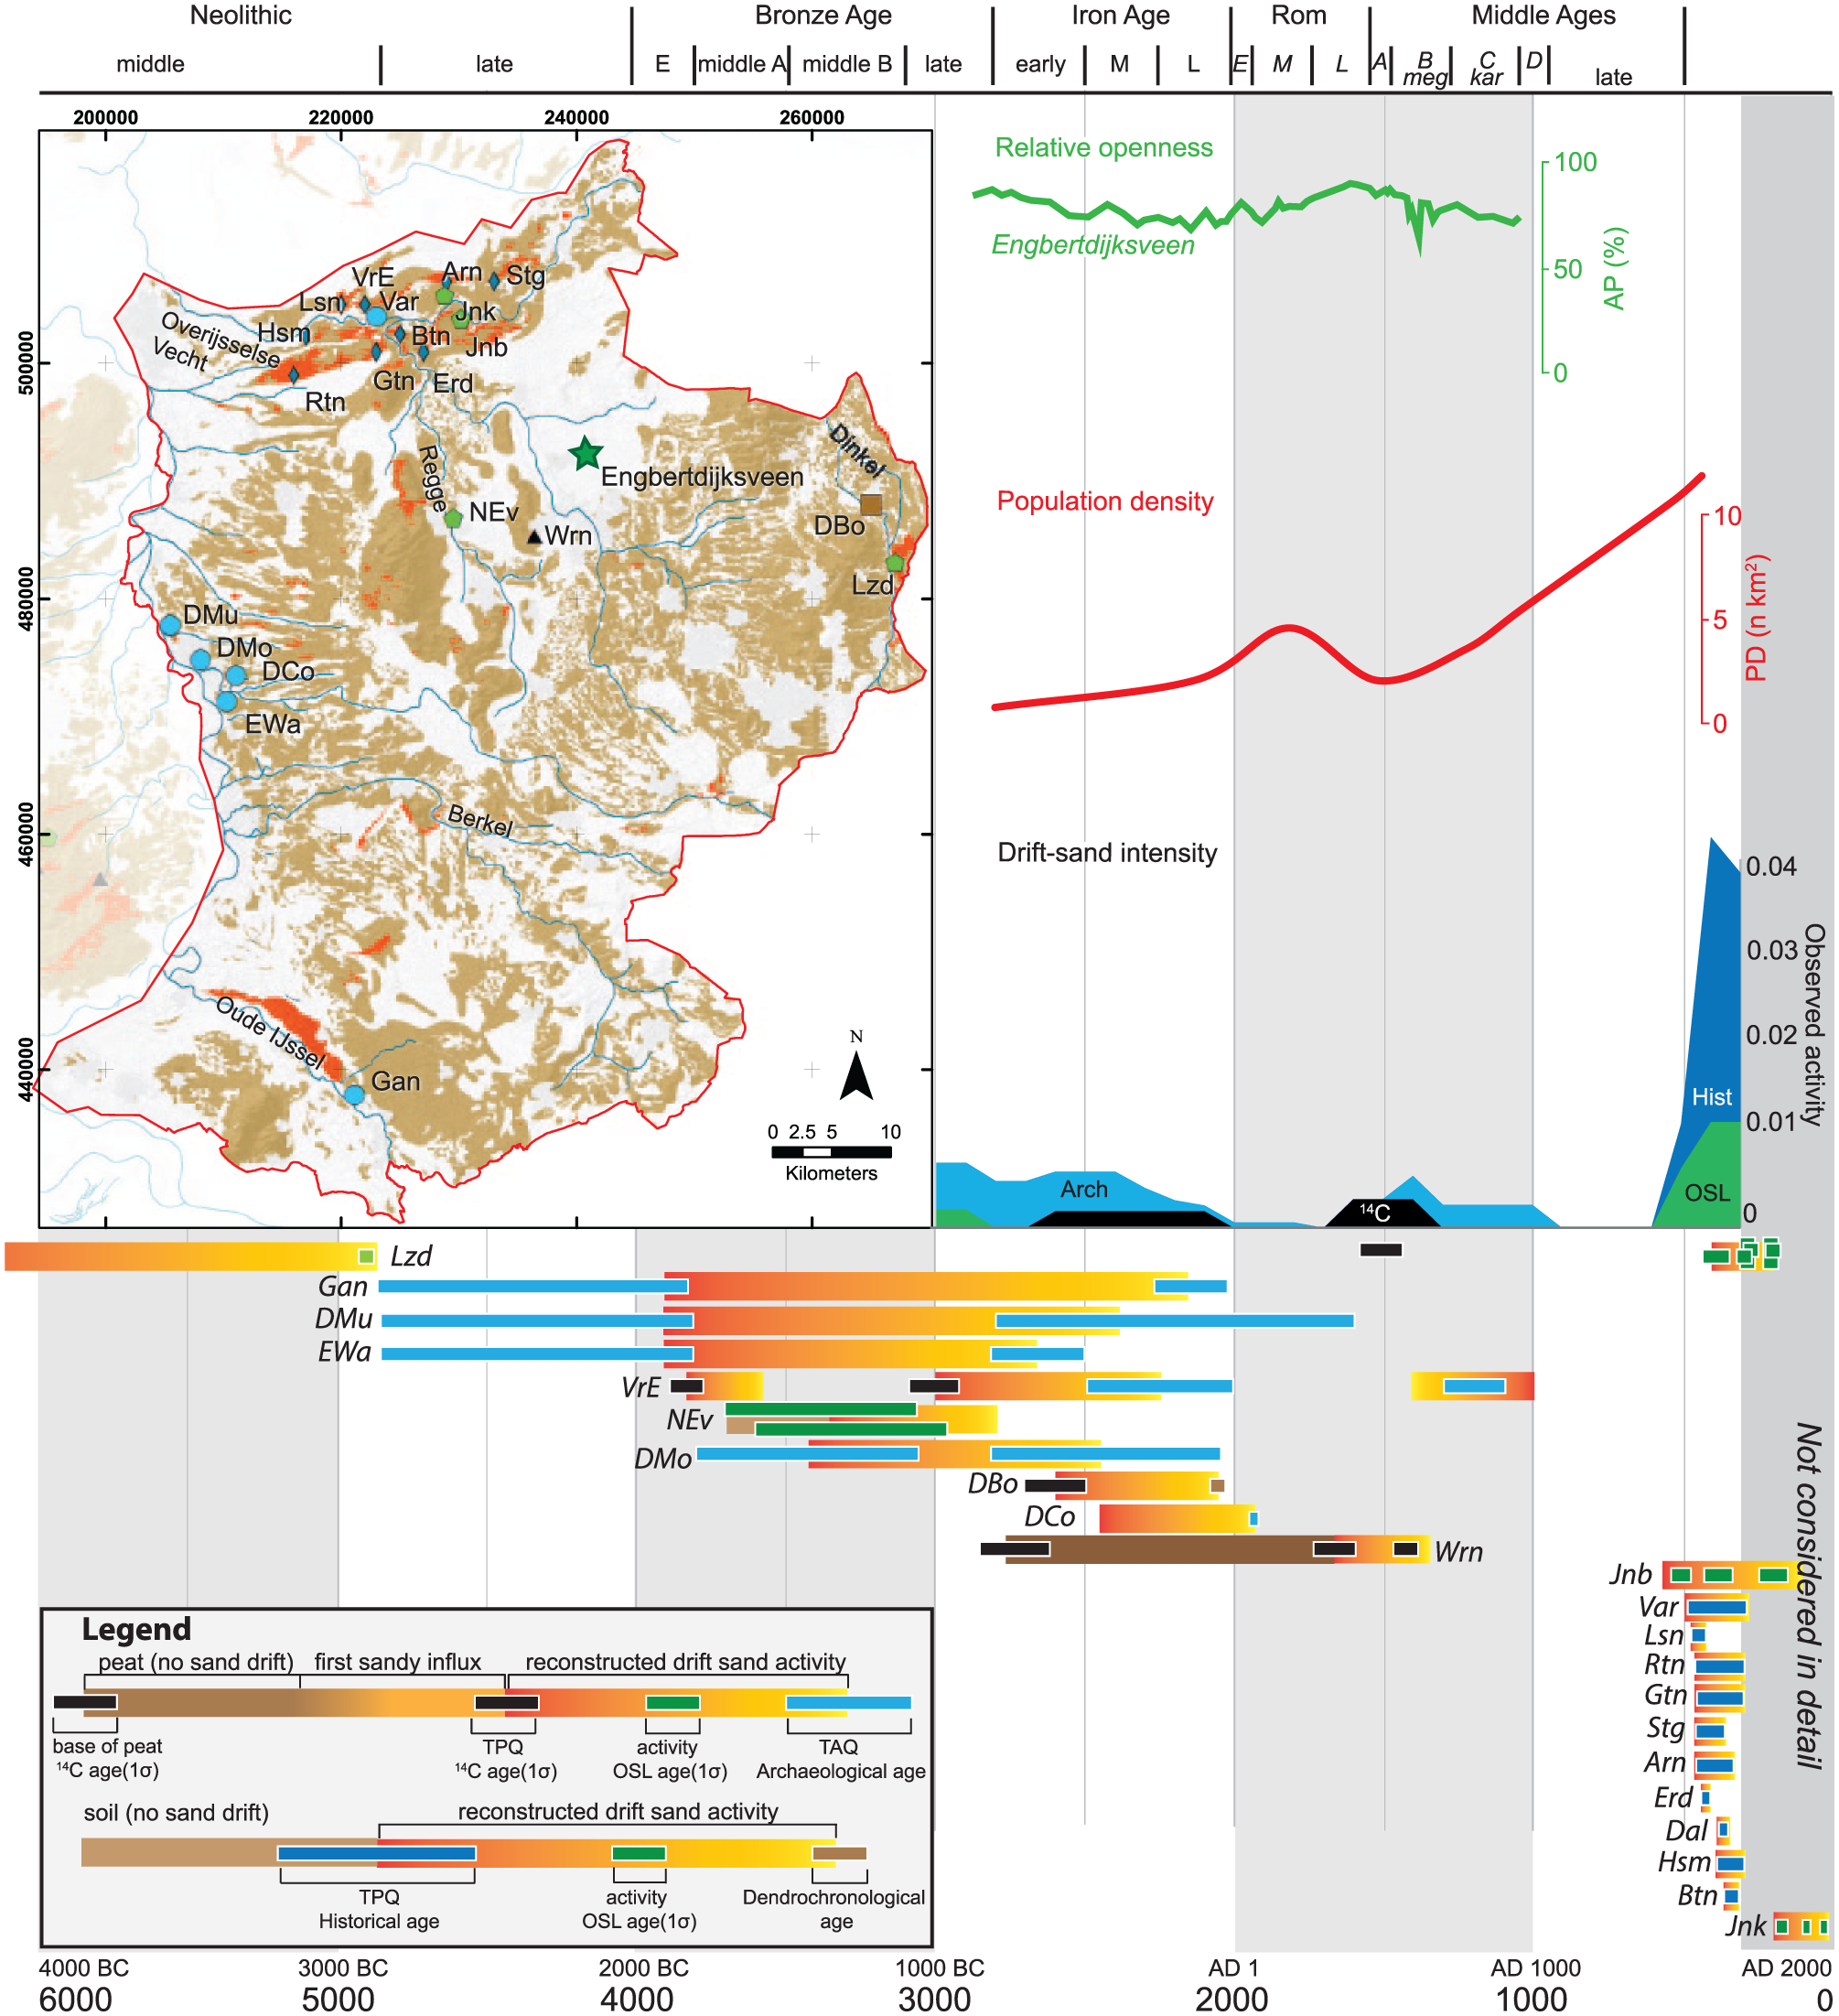
Drift-sand activity in the eastern sand area. For further explanation, we refer to the caption of Figure 3.
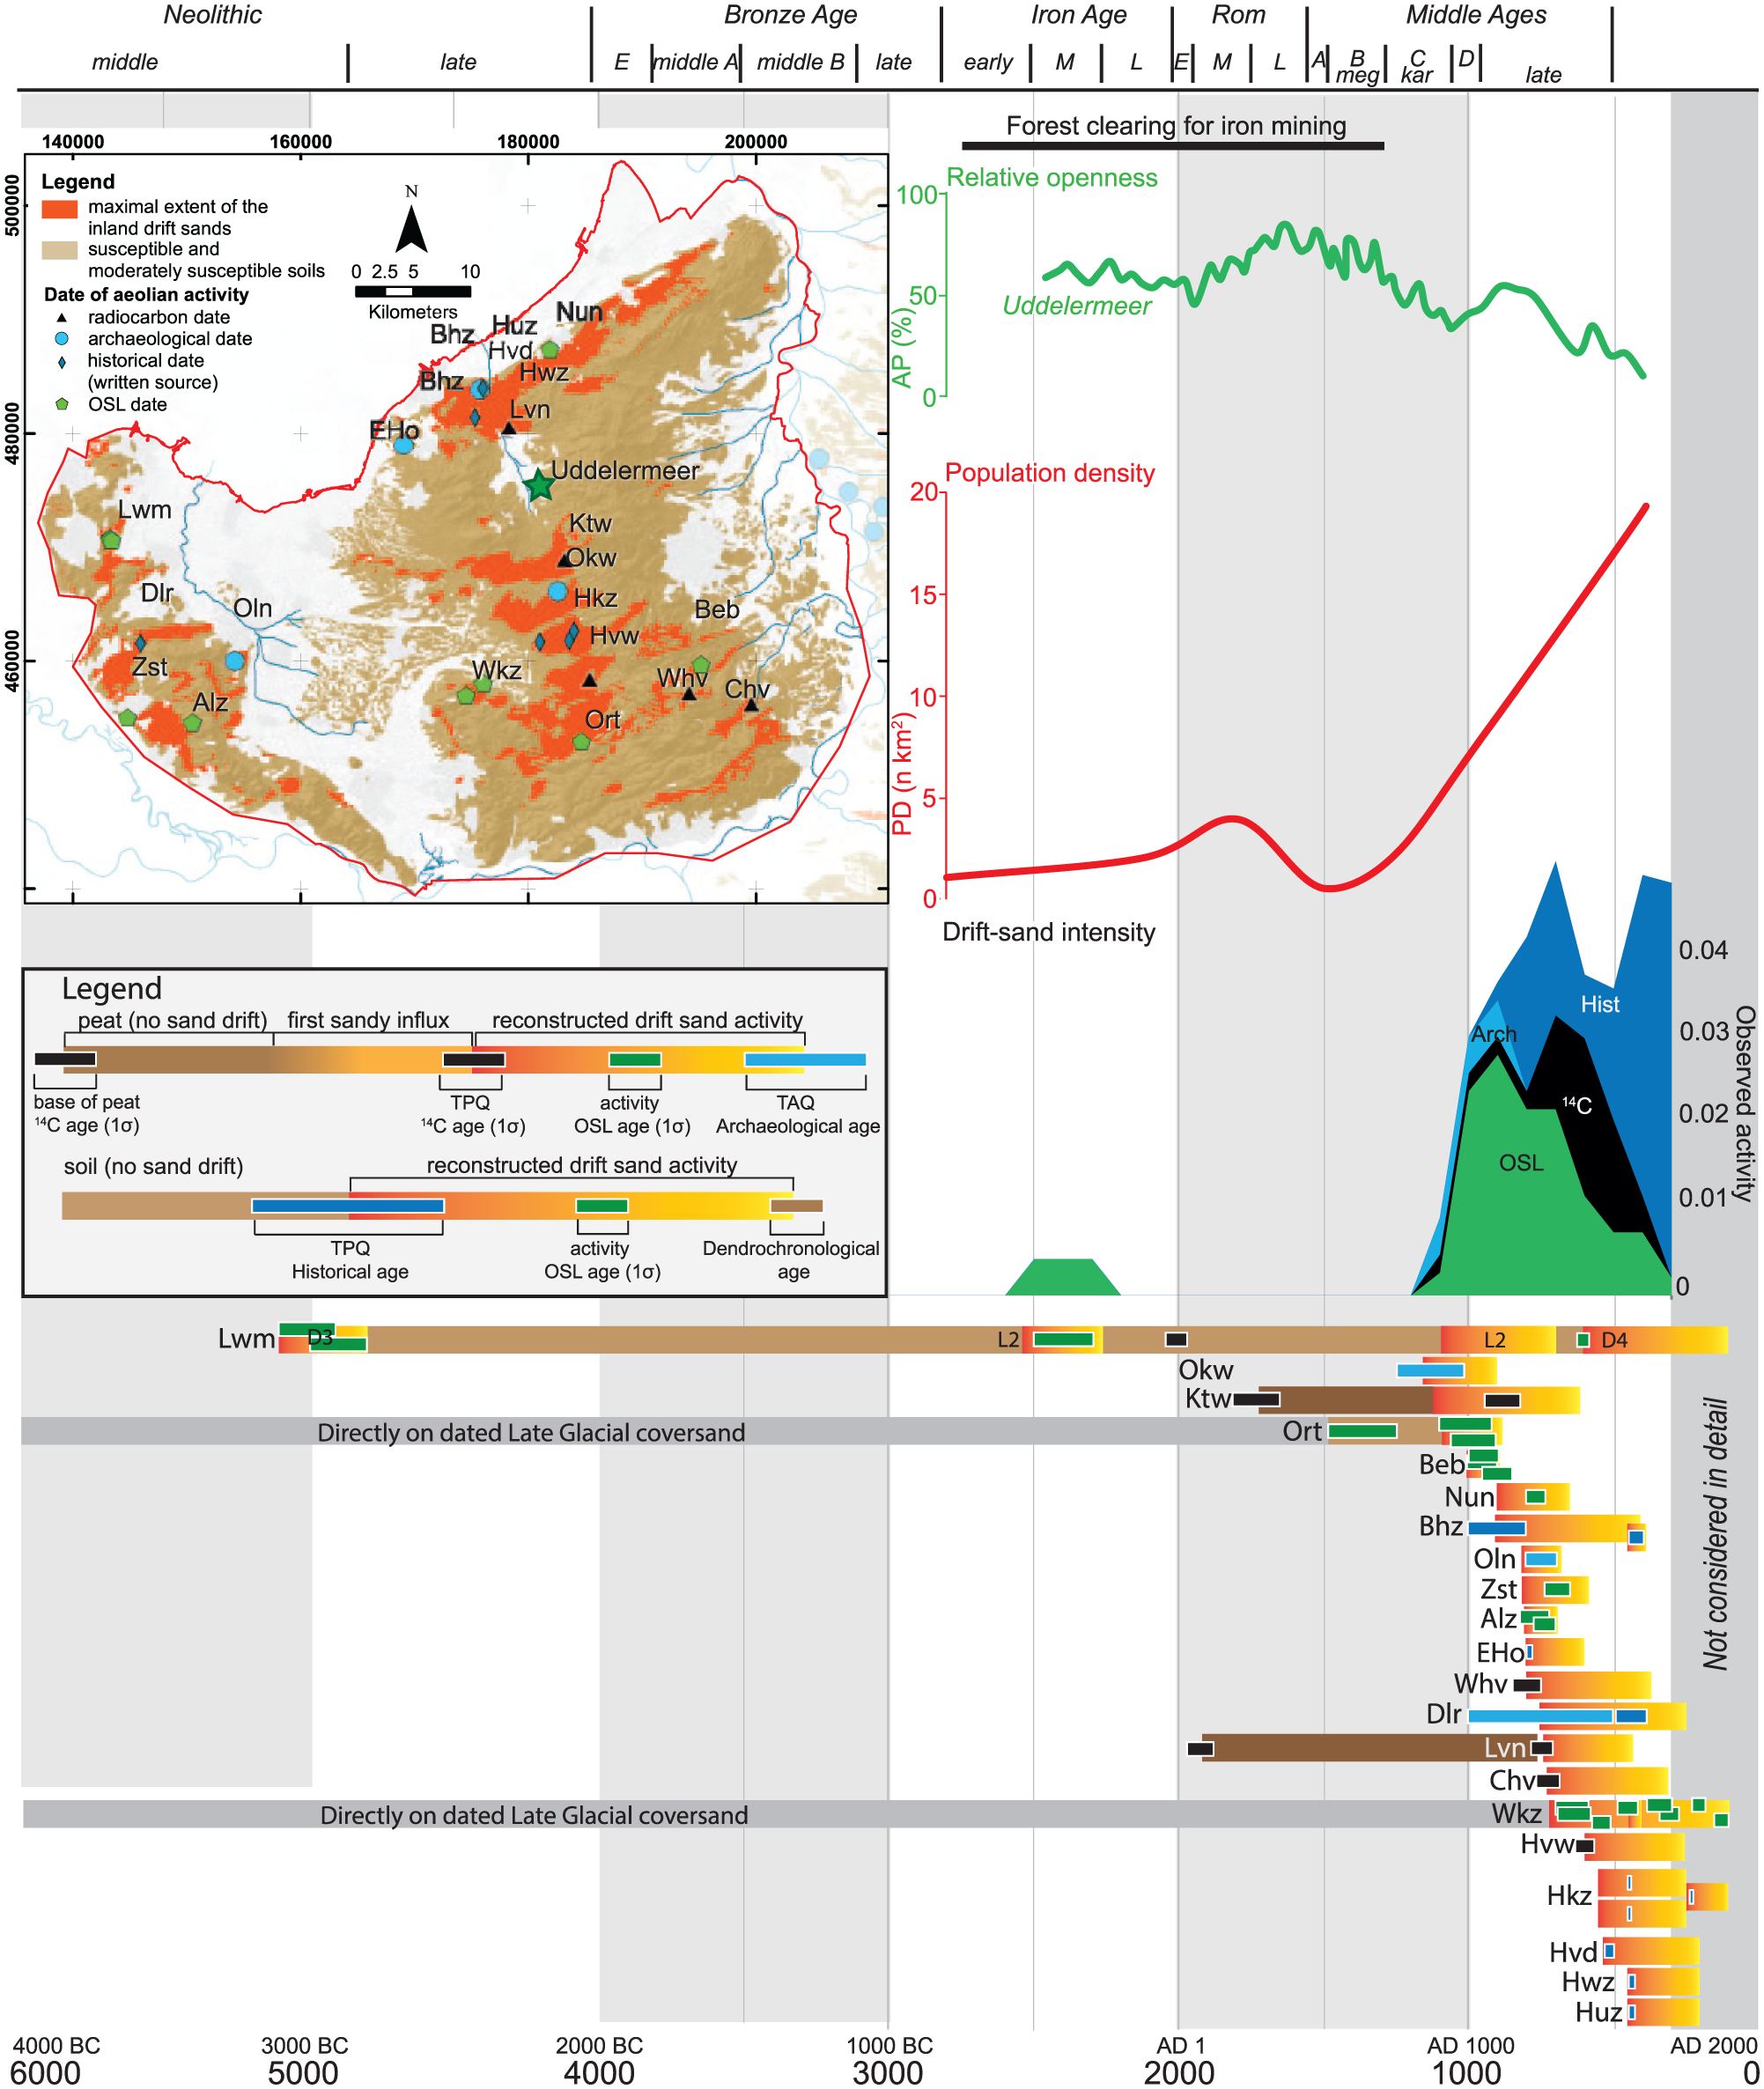
Drift-sand activity in the middle sand area. For further explanation, we refer to the caption of Figure 3.
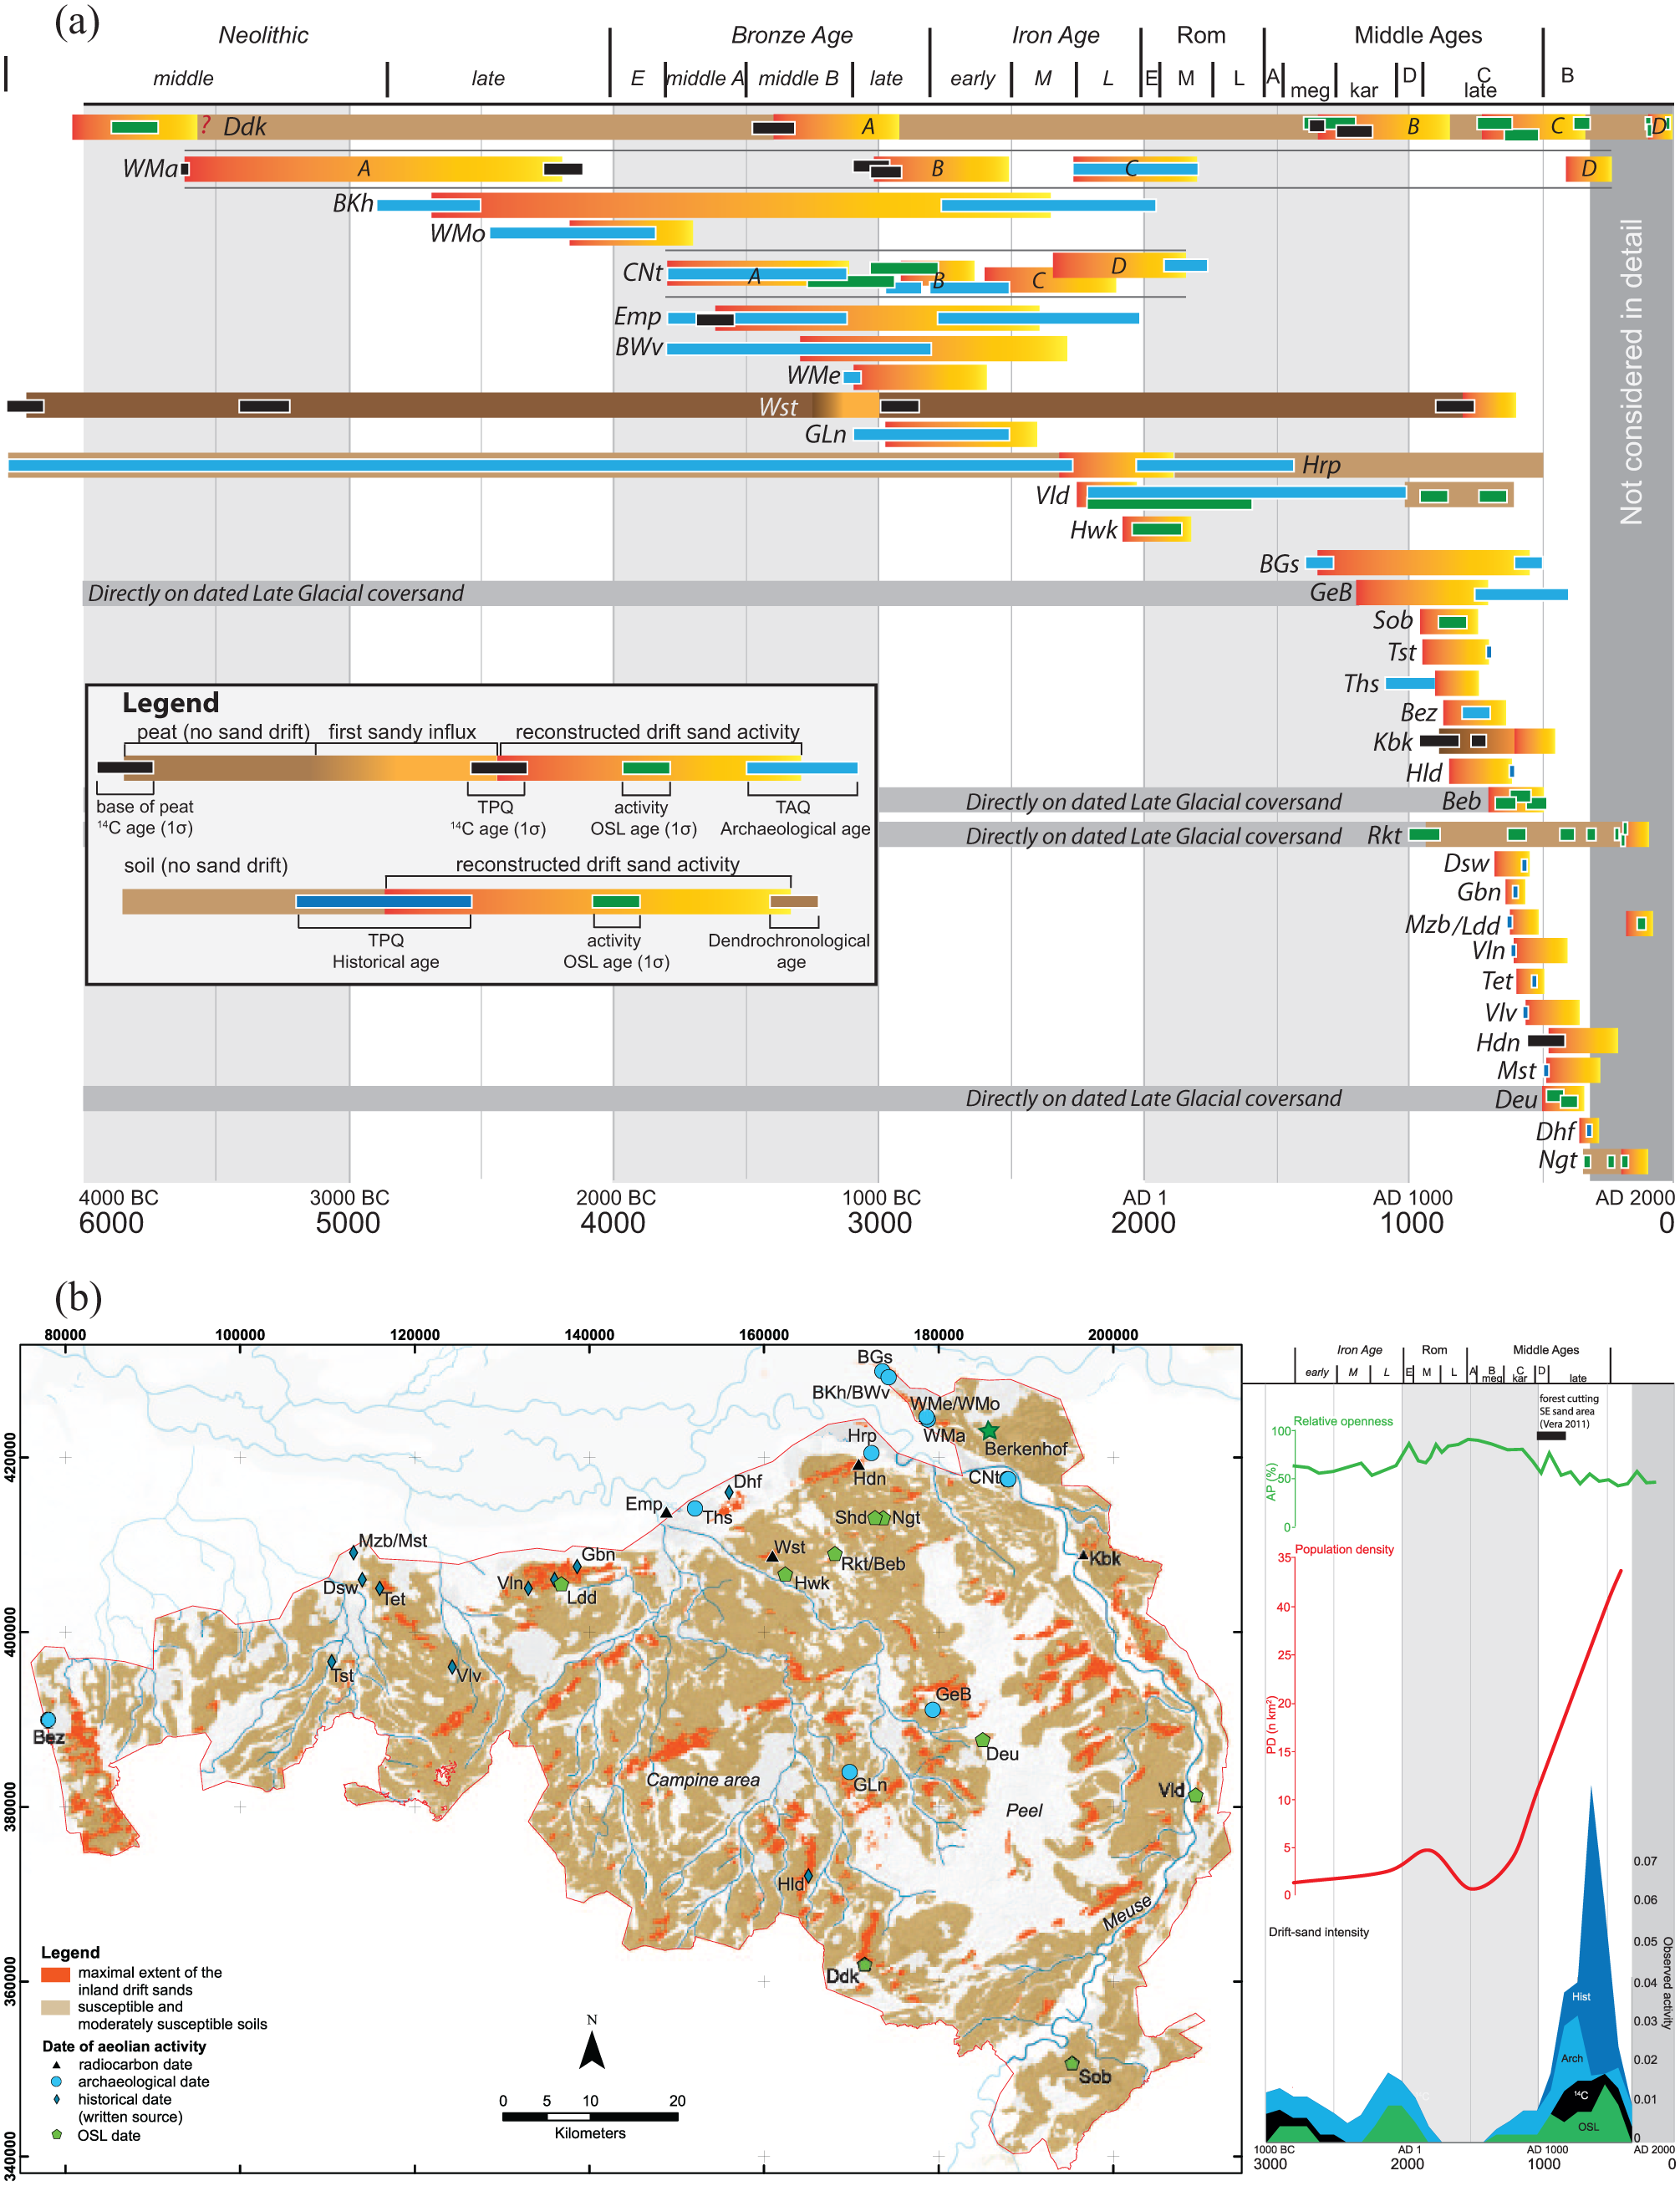
(a) Drift-sand activity in the southern sand area. (b) Map with the location of the sites and intensity curve compared with PD and relative openness. For further explanation, we refer to the caption of Figure 3.
Reconstructing PD
PD per period was calculated using existing population estimates for the Roman period of Van Beek and Groenewoudt (2011), and for AD 1500 and 1600 using estimates of Spek (2004). We estimated population for the less known periods in between by means of interpolation, taking into account the number of archaeological settlements in this period, following Zoetbrood et al. (2006). This procedure is further explained in Appendix A1, available online.
Assessing the areal extent of deforestation
The degree of deforestation was used as a proxy for human pressure on the vegetation and hence on the landscape. The relative amount of deforested area was derived from the arboreal pollen percentages (AP% values) in existing well-dated and detailed pollen diagrams from point locations per sand area: Mekelermeer (Figure 3; Bohncke, 1991), Engbertdijksveen (Figure 4; Van der Molen and Hoekstra, 1988), Uddelermeer (Figure 5; Engels et al., 2016; Gouw-Bouman, unpublished data) and Berkenhof (Figure 6; Teunissen, 1990). For more details on these records and how their AP% values were converted to degree of deforestation, we refer to Appendix A2, available online.
Spatial analysis
To investigate the relation between population pressure and the occurrence of sand drifting, spatial zones with increased human activity were identified based on route-network reconstructions (Van Lanen et al., 2015a, 2015b, 2016). This analysis was performed for soils susceptible for sand drifting for three time slices: roughly corresponding to the Roman period, the early Middle Ages and the late Middle Ages (Table 4).
Determining sand-drift susceptibility
The spatial analysis was performed for soils that are susceptible for sand drifting only (i.e. the drier sandy soils). The areal distribution of susceptible soils was derived from national datasets of soil maps and palaeogeographical maps using the criteria listed in Table 3. Using geographic information systems (GISs), we recatogorised these soil map units from the digital national soil map (De Vries et al., 2003) into drift-sand susceptibility classes (Table 3). Since the Roman period and especially the Middle Ages, the extent of peat lands diminished because of oxidation as a result of artificial drainage and excavation leaving behind, more sandy soils prone to sand drifting (Casparie and Streefkerk, 1992). Therefore, drift-sand susceptibility maps were compiled for three periods in time. We derived the fen–bog extent from the Vos and De Vries (2013) palaeogeographical maps for the three periods (using the AD 100, 800 and 1500 peat extent; Table 4) and assigned these landscape units as ‘not susceptible’.
Criteria for susceptibility of the soil to aeolian erosion (after Hack-Ten Broeke et al., 2009, and Hessel et al., 2011).
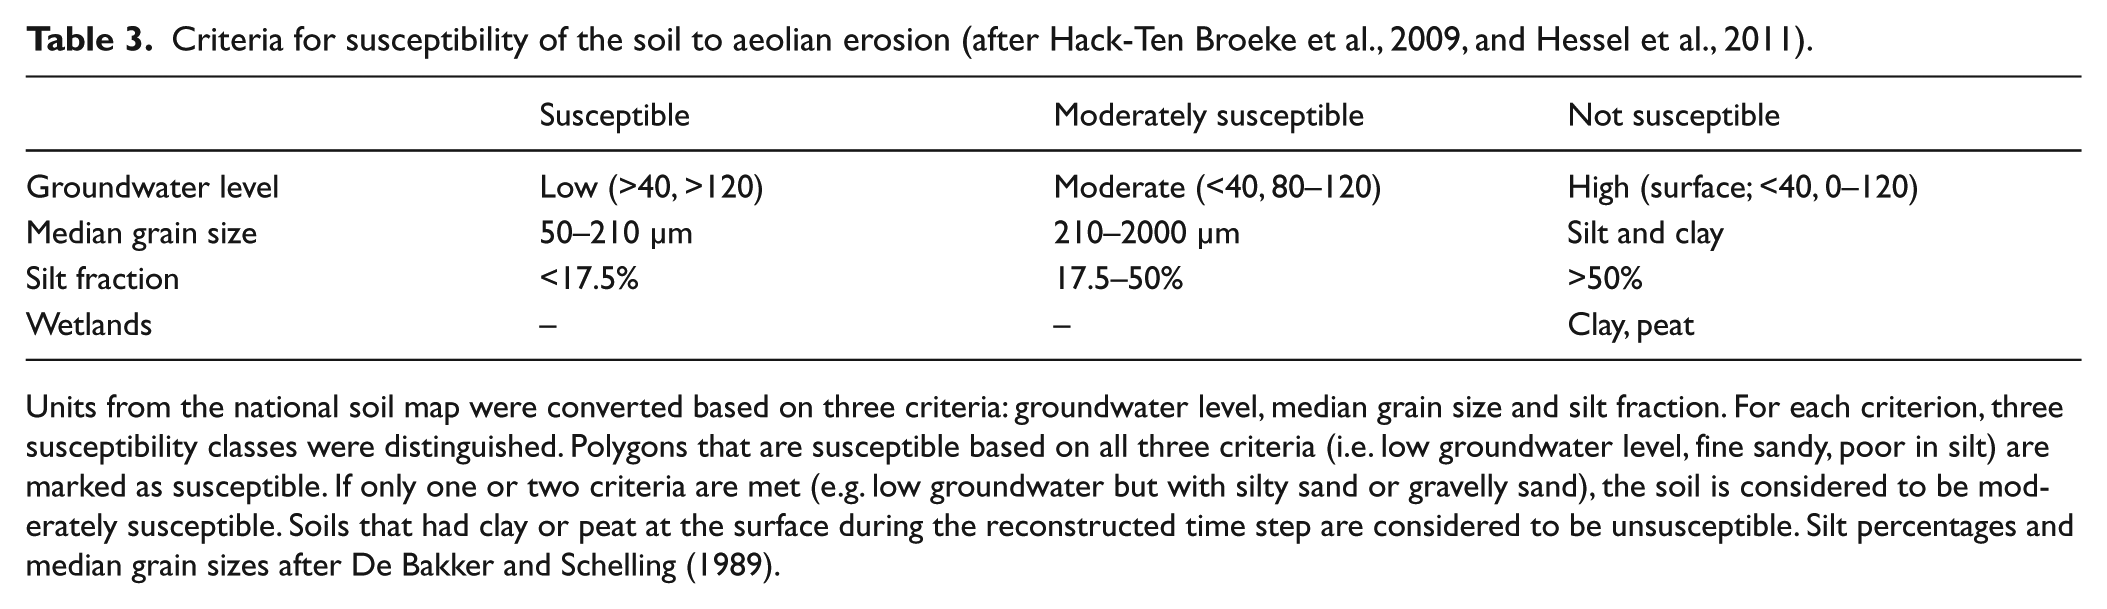
Units from the national soil map were converted based on three criteria: groundwater level, median grain size and silt fraction. For each criterion, three susceptibility classes were distinguished. Polygons that are susceptible based on all three criteria (i.e. low groundwater level, fine sandy, poor in silt) are marked as susceptible. If only one or two criteria are met (e.g. low groundwater but with silty sand or gravelly sand), the soil is considered to be moderately susceptible. Soils that had clay or peat at the surface during the reconstructed time step are considered to be unsusceptible. Silt percentages and median grain sizes after De Bakker and Schelling (1989).
Drift-sand activity ranges, route network and soil susceptibility maps used for the three studied periods in the spatial analysis.
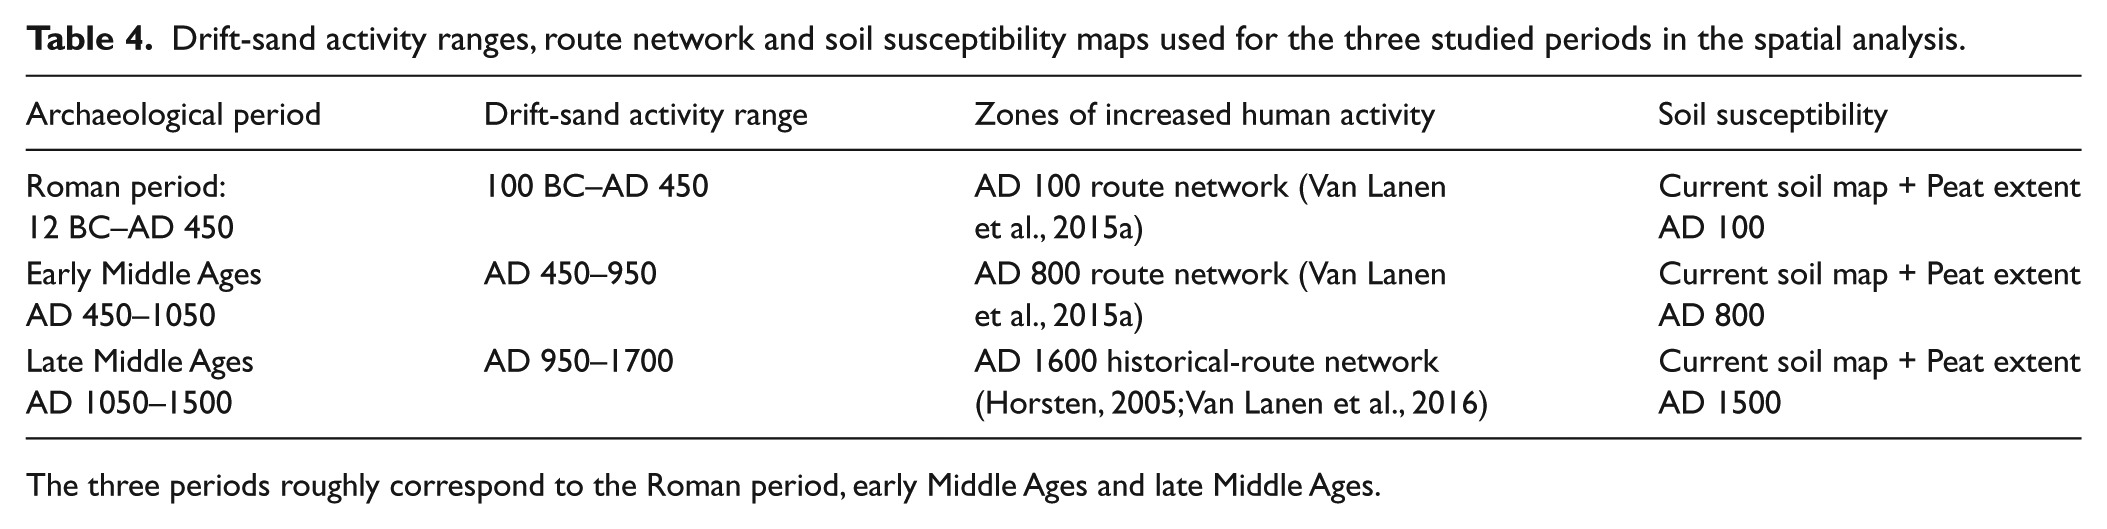
The three periods roughly correspond to the Roman period, early Middle Ages and late Middle Ages.
The current extent of fossil drift-sand dune fields was derived from the palaeogeographical map for AD 1500 (Vos and De Vries, 2013) that shows the presumed distribution of active drift-sand fields. This information is supplemented with pedological criteria (occurrence of young, incipient or undeveloped soils – cf. Koster, 1982) using the national soil map (De Bakker and Schelling, 1989; De Vries et al., 2003). The fossil dune fields derived from these datasets represent the maximum spatial extent of the dune fields during the Holocene, which roughly corresponds to the extent of active dunes in the 17th century to the 19th century. We included these areas as susceptible soils in the AD 100, 800 and 1500 reconstructions.
Comparing sand-drift locations to corridors of human activity
For the Roman period, we used drift-sand events ranging from 100 BC to AD 450, a time frame that reflects the absolute onset and end of Roman occupation in the Netherlands. The early Middle Ages, ranging from AD 450 to 950, roughly cover the period after Roman occupation until the end of Carolingian rule. For these two periods, we used zones around the AD 100 and 800 route networks of Van Lanen et al. (2015b). These networks have been calculated based on (a) the spatial distribution of excavated archaeological settlements and (b) the spatial distribution of movement corridors, that is, well-accessible areas, in the landscape derived from soil, and geomorphological maps. Verification against independent archaeological finds (i.e. infrastructural and isolated finds) has shown that the majority of these finds were uncovered within 1000 m around these route networks (<85% and <72% around AD 100 and 800, respectively; Van Lanen et al., 2015a). This indicates that these route networks reflect zones with a high level of human activity. In addition, routes (always located in these zones) themselves can directly cause sand drifting (Lascaris, 1999; Spek, 2004). Therefore, we used these route zones to determine the spatial link between sand drifting and population pressure.
The third time slice ranges from the end of the early Middle Ages to the beginning of the modern period, that is, AD 950–1700. At the end of the early Middle Ages, habitation started to cluster and in the sand areas became fixed on stable positions (Hamerow, 2002; Van der Velde, 2004; Waterbolk, 1980). Some of these settlements after AD 1300 developed into larger towns (Keunen, 2011; Rutte and IJsselstijn, 2014; Spek, 2004). Because most settlements were established by the end of the early Middle Ages, route networks are expected not to have changed significantly afterwards, even when urbanisation took place (Van Lanen et al., 2016). Major changes in the route networks did occur after the introduction of railways in AD 1848 (Horsten, 2005). Therefore, we used a historical roadmap of the AD 1600 route network reconstructed by Horsten (2005) and digitally made available by Van Lanen et al. (2016) as representative for the period AD 950–1700. This overview of roads in the Netherlands mainly was based on a variety of old maps showing contemporaneous data on roads. These data have been integrated into an overview of main thoroughfares, and therefore do not include secondary roads and local paths. Although the AD 1600 road network has a high spatial accuracy, this network does not – in contrast to the reconstructions made by Van Lanen et al. (2015a) – connect all known settlements from that period (Van Lanen et al., 2016). Still, the network does reflect the main thoroughfares, and therefore the areas where land transport and associated population pressure on the landscape were highest.
We compared the number of drift-sand events within and outside a 1000-m buffer around the routes. These buffers represent (a) the uncertainty in route-network location (AD 100 and 800) and (b) the expected impact zone of population pressure (settlements, arable fields, etc.) around these routes (Van Lanen et al., 2015a). Next, we calculated the spatial distribution of drift sand in and outside the zone of increased human pressure. This was done by determining the ratio of the number of sites inside and outside the buffer, corrected for the areal ratio in susceptible substrates within and outside the buffer (moderately susceptible and susceptible soils). The resulting factor expresses how often sand drifting was identified inside the buffer relative to its occurrence outside the buffer, with <1 expressing predominant occurrences outside the buffer and >1 expressing predominant occurrence within the buffer zone. To further test the statistical significance of the calculated factor values, we performed an exact binomial test. We took the assumption that drift-sand sites occurred as often within and outside the buffers per areal unit as a null hypothesis.
Results
Temporal patterns in drift-sand activity
The results show that abundant drift-sand activity took place during late-Bronze Age and Iron Age (Figures 3–6); in the middle sand area, this phenomenon was less prominent in these periods. All areas show a gradual decrease in forest cover and PD since the late-Bronze Age towards the Roman period, in line with reconstructions by Teunissen (1988), Louwe Kooijmans (1995) and Spek (2004).
Between AD 1 and 400 (the largest part of the Roman period), the data of drift-sand activity show a remarkable decrease for the northern and eastern sand areas (AD 1–400; Figures 3 and 4), as well as the southern Netherlands (AD 200–600; Figure 6). In the middle sand area, little drift-sand activity occurred before AD 800 (Figure 5). The Roman dip in drift-sand activity is confirmed by observed peat growth without sandy influx at several sites (brown bars in Figures 3–6). This timing is counter-intuitive since it coincides with a relatively high PD and a low forest cover. In the southern sand area the dip occurred somewhat later, but still at a time that PD was relatively high and forest cover was low (Figure 6).
Between AD 600 and 900, the observed drift-sand activity increased to the prehistoric level. This seems in line with the vegetation trends, which during this time interval show renewed deforestation. After AD 900, sand drifting shows a sharp rise, especially in the middle and southern sand areas (Figures 5 and 6). In the northern and eastern sand areas, the drift-sand activity remained moderately low; until after AD 1500, a sharp rise in the number of active sites occurred here as well (Figures 3 and 4). The change in timing of this major increase between the regions is consistent for all dating methods and therefore most likely represents a real trend rather than a sampling bias. The difference in timing is best explained by the increase in PD, which occurred earlier in the southern and middle sand areas than in the eastern and northern areas.
For the combined study sites, the number of point locations where sand drifting occurred did not increase from AD 1300 onwards. This does not imply that drift-sand activity stabilised as from this moment onwards, the surface area of existing drift sites increased (e.g. Lascaris, 1999).
Spatial patterns in drift-sand activity
The locations of sand drifting are not randomly distributed over the areas with susceptible soils but seem to occur more often close to routes (Figures 7–10). When comparing the number of active sites inside and outside the 1000-m buffer around reconstructed route networks, taking only the areas susceptible to sand drifting into account, most sites are indeed located relatively close to route zones. For the cases where more sites are available, the southern sand area for AD 1600 and the northern sand area for AD 800 have >1.8 times more activity close to routes (Table 5).
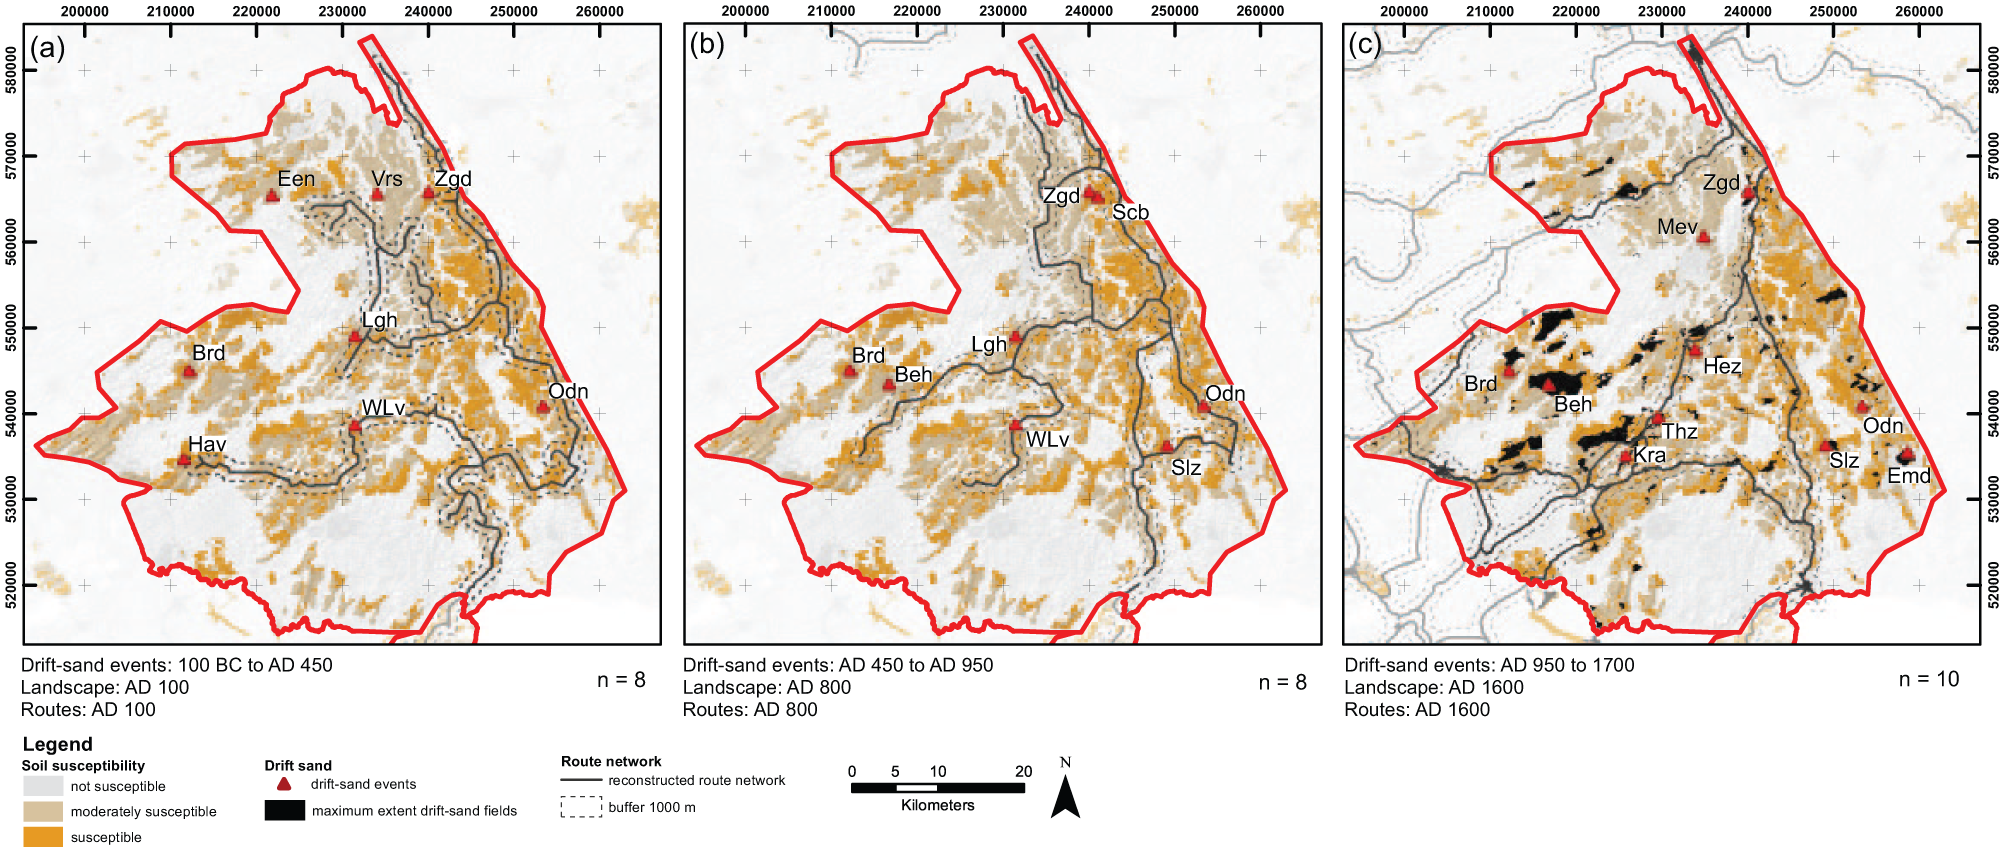
Position of sand-drifting events relative to the route networks in the northern sand area. For codes of the sites, see Figure 3. (a) AD 100, (b) AD 800 and (c) AD 1600. For all time slices, the sites show a rather good correspondence to the location of the route networks, except for some remote outliers in AD 1600.
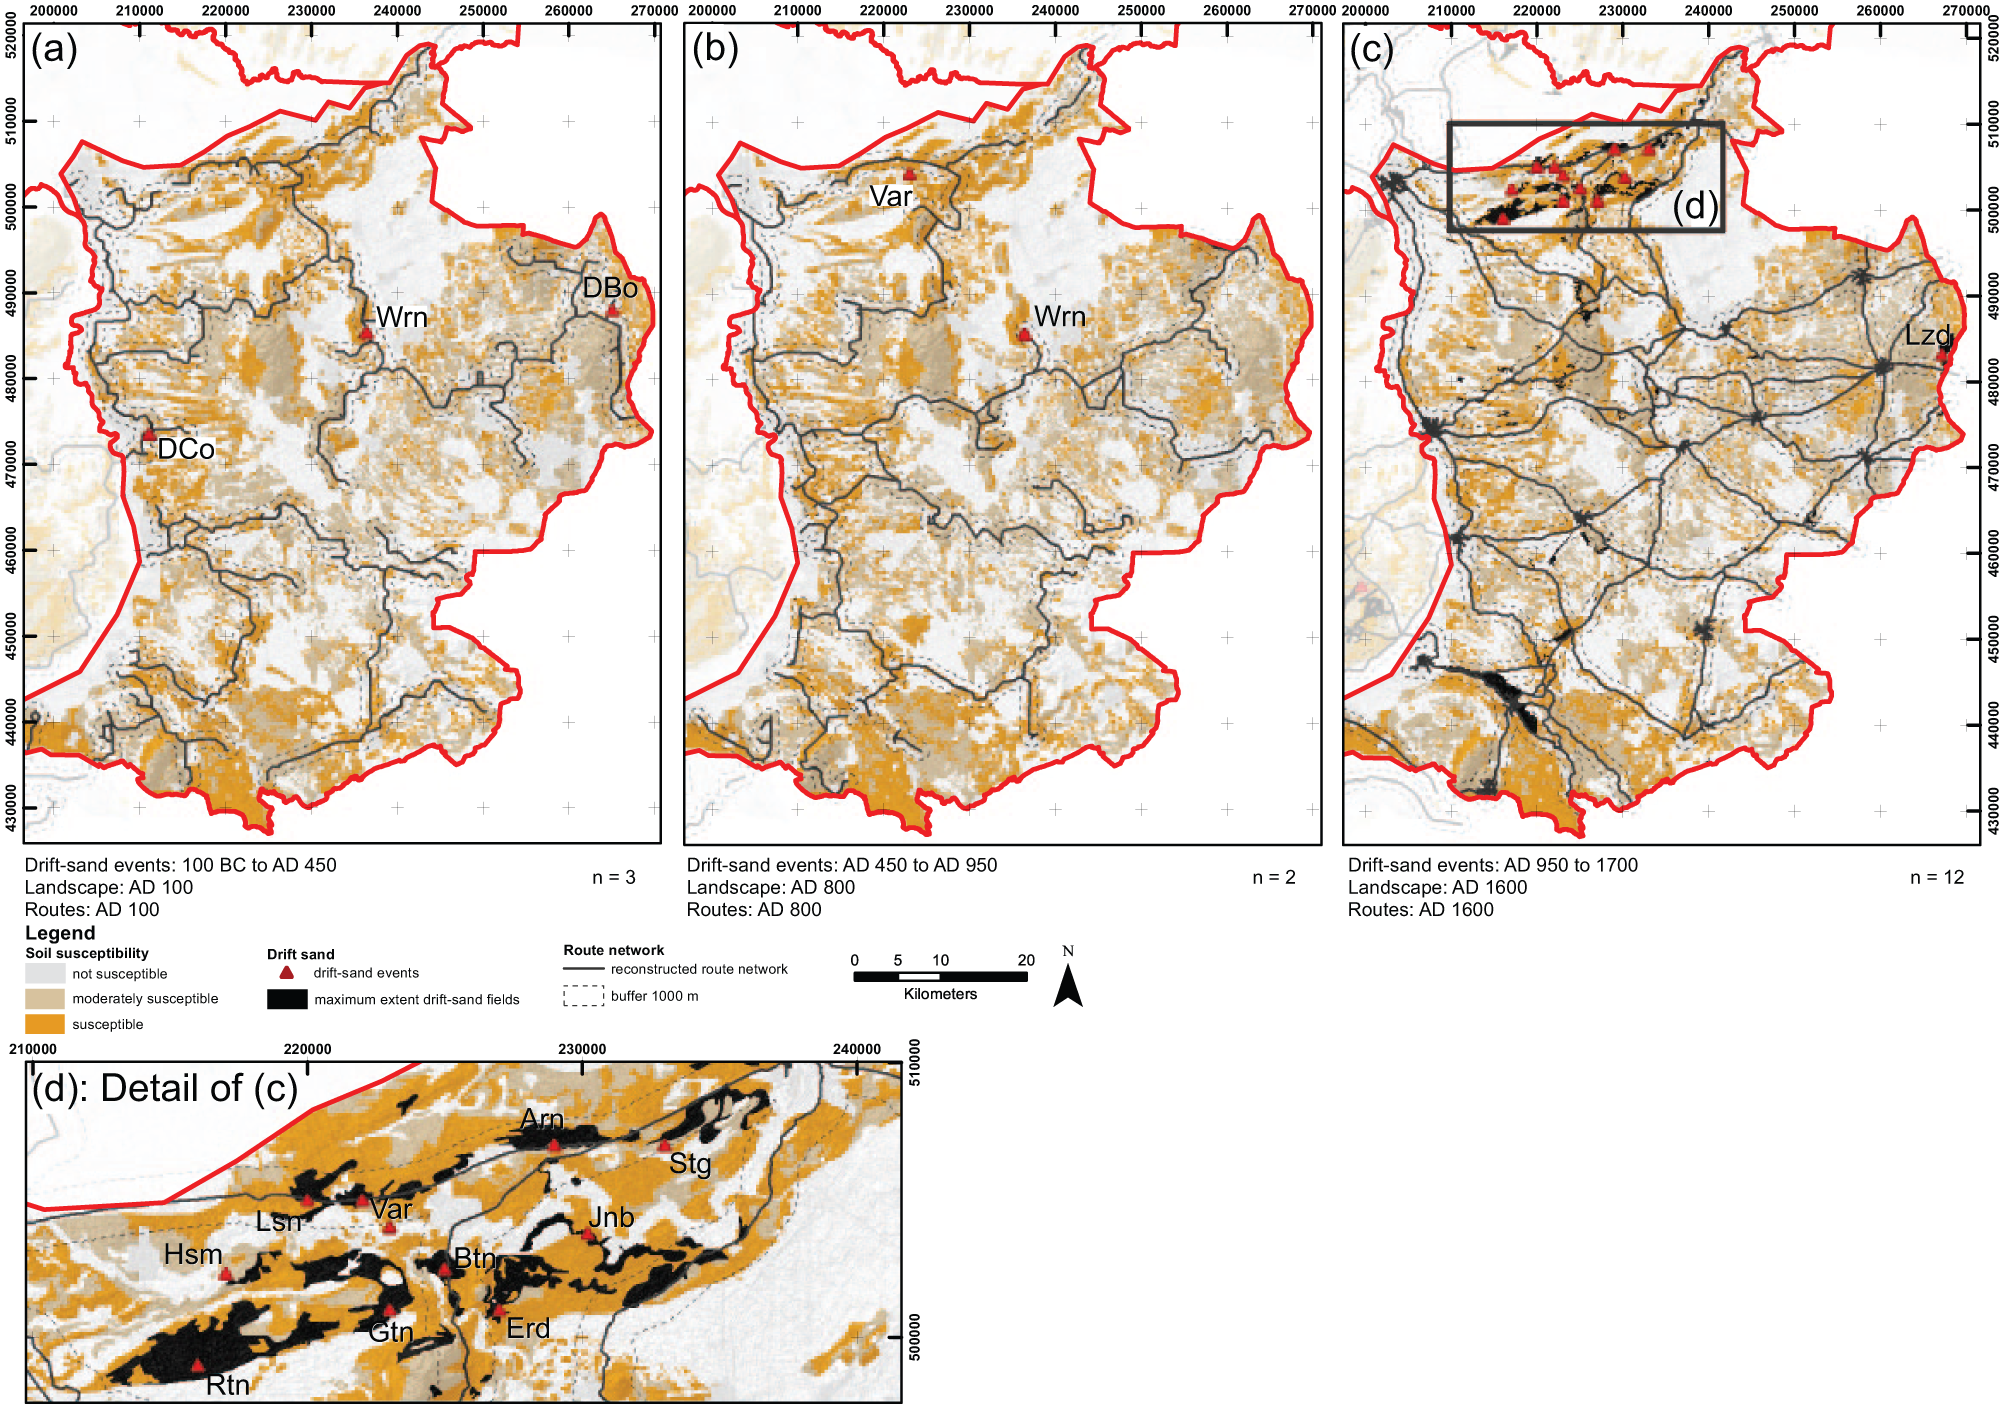
Position of sand-drifting events relative to the route networks in the eastern sand area. For codes of the sites, see Figure 4. (a) AD 100, (b) AD 800, (c) AD 1600 and (d) detail of the Overijsselse Vecht area for AD 1600. For AD 100 and 800, the few sites present show a rather good correspondence to the location of the route networks. For AD 1600, the correspondence is low.
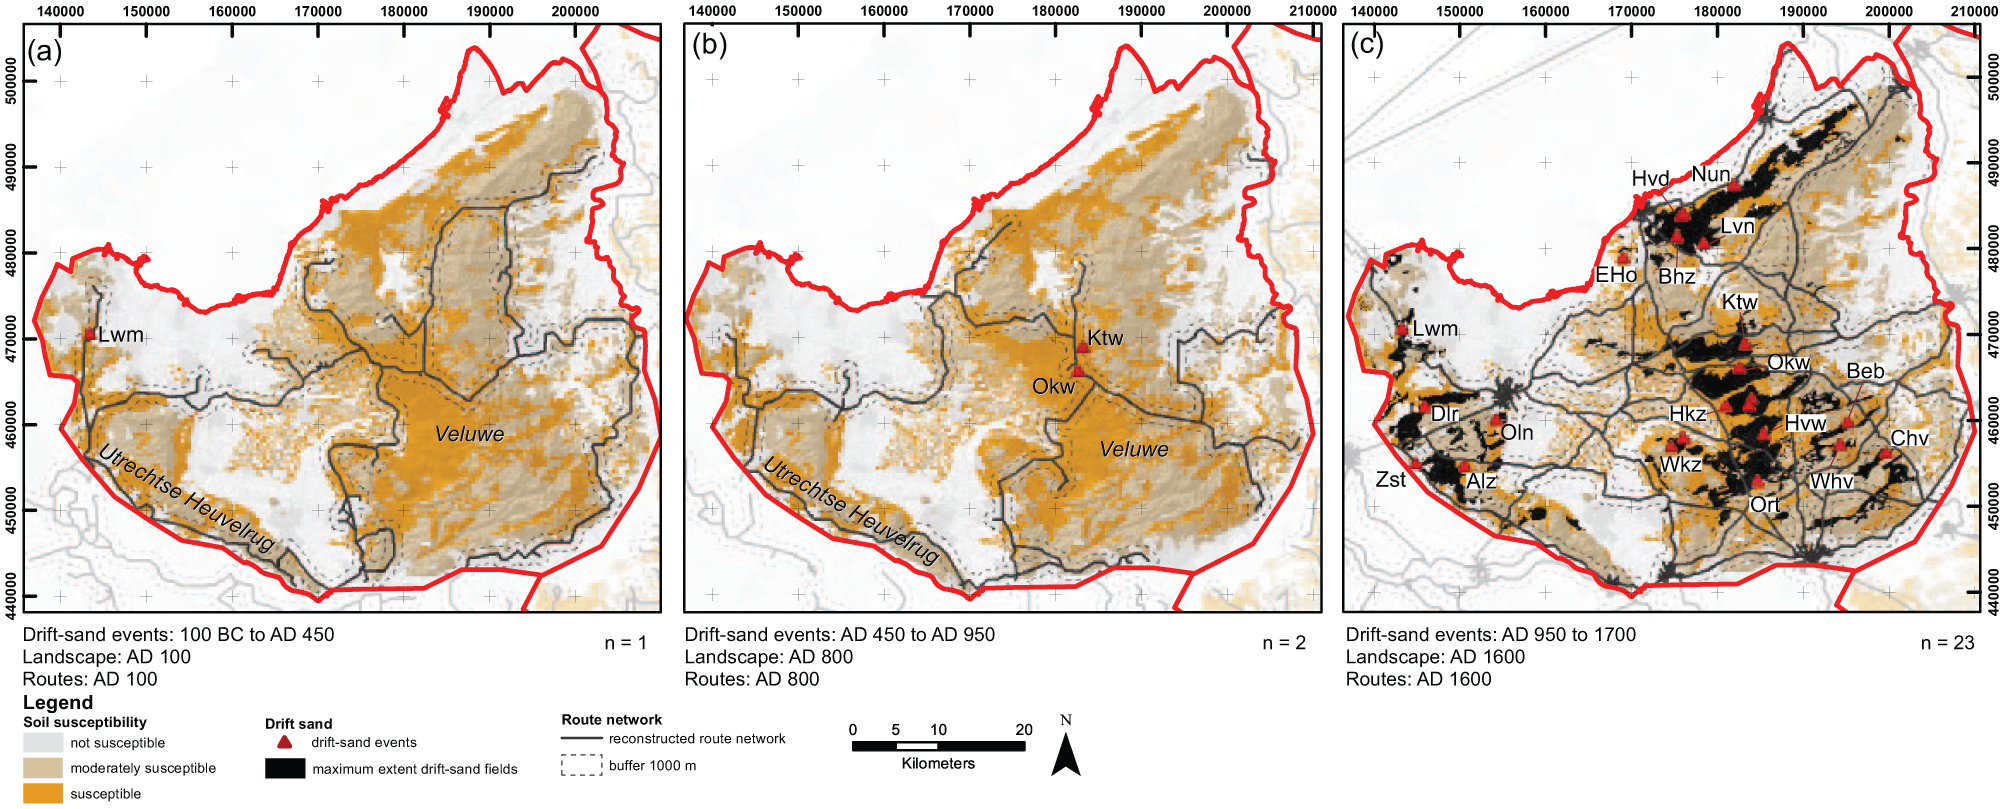
Position of sand-drifting events relative to the route networks in the middle sand area. For codes of the sites, see Figure 5. (a) AD 100, (b) AD 800 and (c) AD 1600. For AD 100 and 800, the few sites present show a rather good correspondence to the location of the route networks. For AD 1600, the sites are mostly located far away from the route networks.
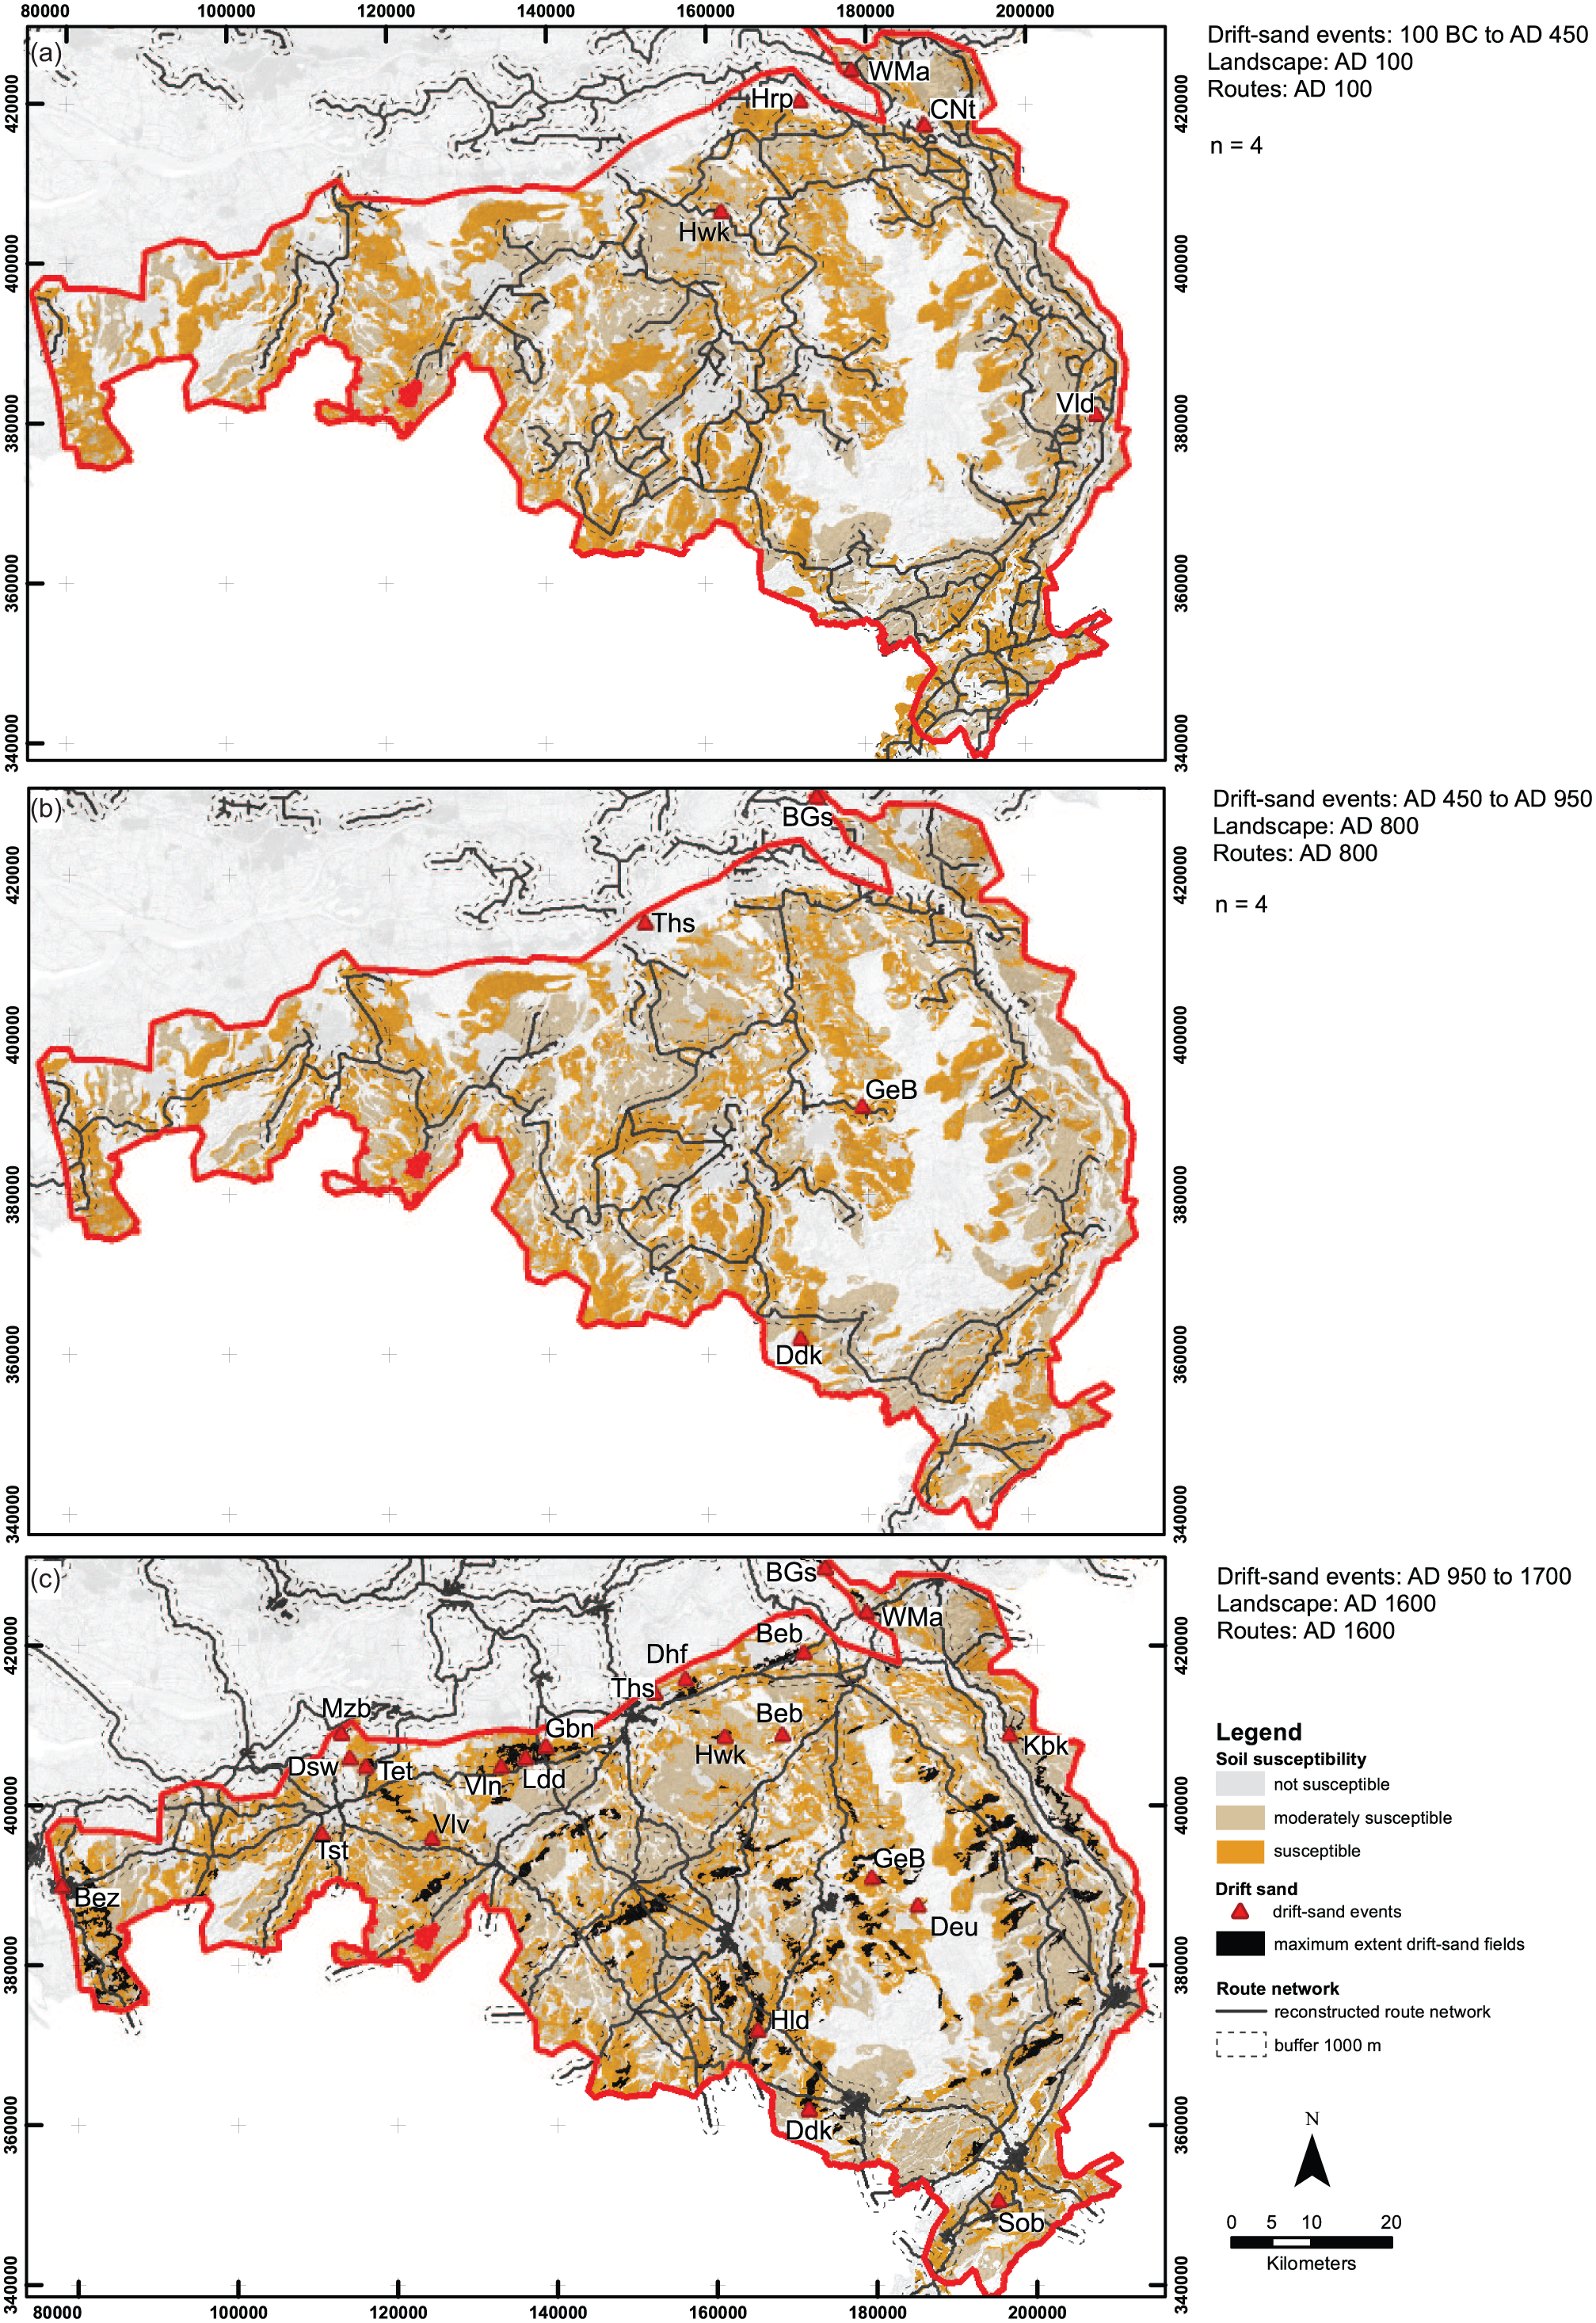
Position of sand-drifting events relative to the route networks in the southern sand area. For codes of the sites, see Figure 6. (a) AD 100, (b) AD 800 and (c) AD 1600. For AD 100 and 800, the few sites present show a rather good correspondence to the location of the route networks. For AD 1600, the sites mainly concentrate on the northern edge of the area with a good correspondence to the route networks.
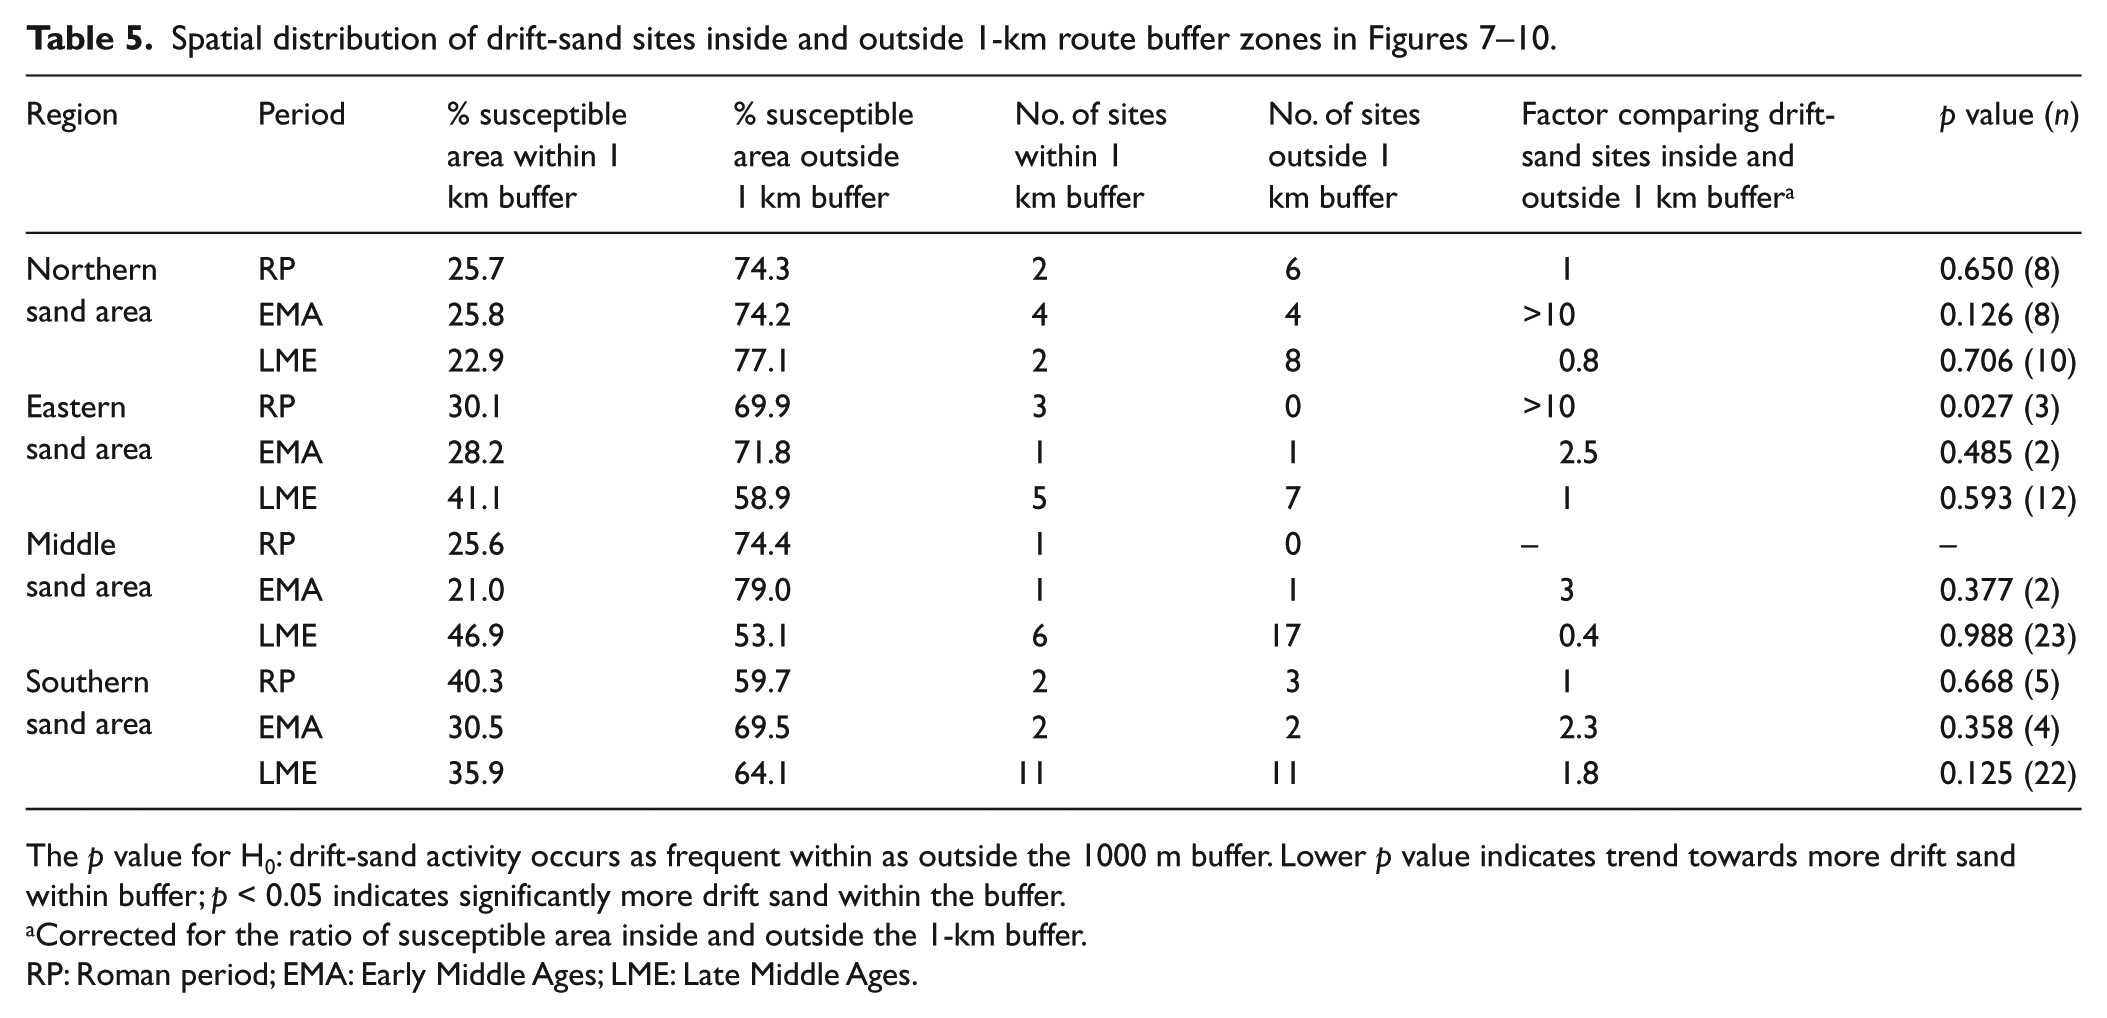
The p value for H0: drift-sand activity occurs as frequent within as outside the 1000 m buffer. Lower p value indicates trend towards more drift sand within buffer; p < 0.05 indicates significantly more drift sand within the buffer.
Corrected for the ratio of susceptible area inside and outside the 1-km buffer.
RP: Roman period; EMA: Early Middle Ages; LME: Late Middle Ages.
Few sites with sand drifting were found for the period between 100 BC and AD 450 (n = 18). The northern and southern sand areas contain eight and five sites, respectively. These are situated relatively close to the route network, but in each area, only two sites are located within the defined 1000-m buffer (Figures 7a and 10a). The eastern and middle sand areas contain few sites, which all are located within the buffer (Table 5; Figures 8a and 9a). Between AD 450 and 950, drift-sand frequency was low (generally n < 4), mostly occurring close to routes. In the northern sand area (Figure 7b), eight sites are present with a strong spatial tendency towards the routes (p = 0.126; Table 5).
For the late Middle Ages and early Modern period (until ca. AD 1700), more sites have been identified, and clear relations between drift-sand occurrence and human presence can be identified. In the southern sand area, 50% of the drift sites (11 out of 22) occur within the 1000-m buffer zones, which make up one-third of the total susceptible area (exact binomial test, p = 0.125 – Figure 10c; Table 5). In the northern sand area and the Overijsselse Vecht area in the eastern sand area, drift-sand activity was remarkably aligned along routes (Figures 7c and 8d). However, in this area, several outliers occur (remote sites), which reduces the overall spatial correspondence between route networks and drift sites (Table 5). This is probably caused by drift-sand occurrence in remote sites or by the fact that not all routes have been mapped.
For the Veluwe in the middle sand area, the opposite trend is observed: especially in the area around the largest dune fields, most sites are located relatively far away from routes (Figure 9; Table 5). The most likely reason is that these dune fields became so large that the roads had to be diverted around them as demonstrated for the Kootwijk (Ktw in Figure 9) area by Heidinga (1987). The AD 1600 roads represent the situation after significant extension of drift-sand fields had already occurred and therefore, in this specific case, do not reflect the initial spatial layout of the late medieval routes. The original route zones probably are buried under the fossil drift-sand fields. Around the western edge of the Veluwe (i.e. upwind, Nunspeet, Zeist), the same pattern emerges as in other areas. Here, relatively many drift sands are found close to routes. The reason is that the sand mostly was blown towards the east, and therefore these roads were not affected/relocated.
Discussion
Natural and anthropogenic causes
In this section, the role of natural and human facilitating conditions and natural forcings for sand drifting is outlined using the conceptual diagram of Figure 2 and the results from our study area summarised in Figure 11.
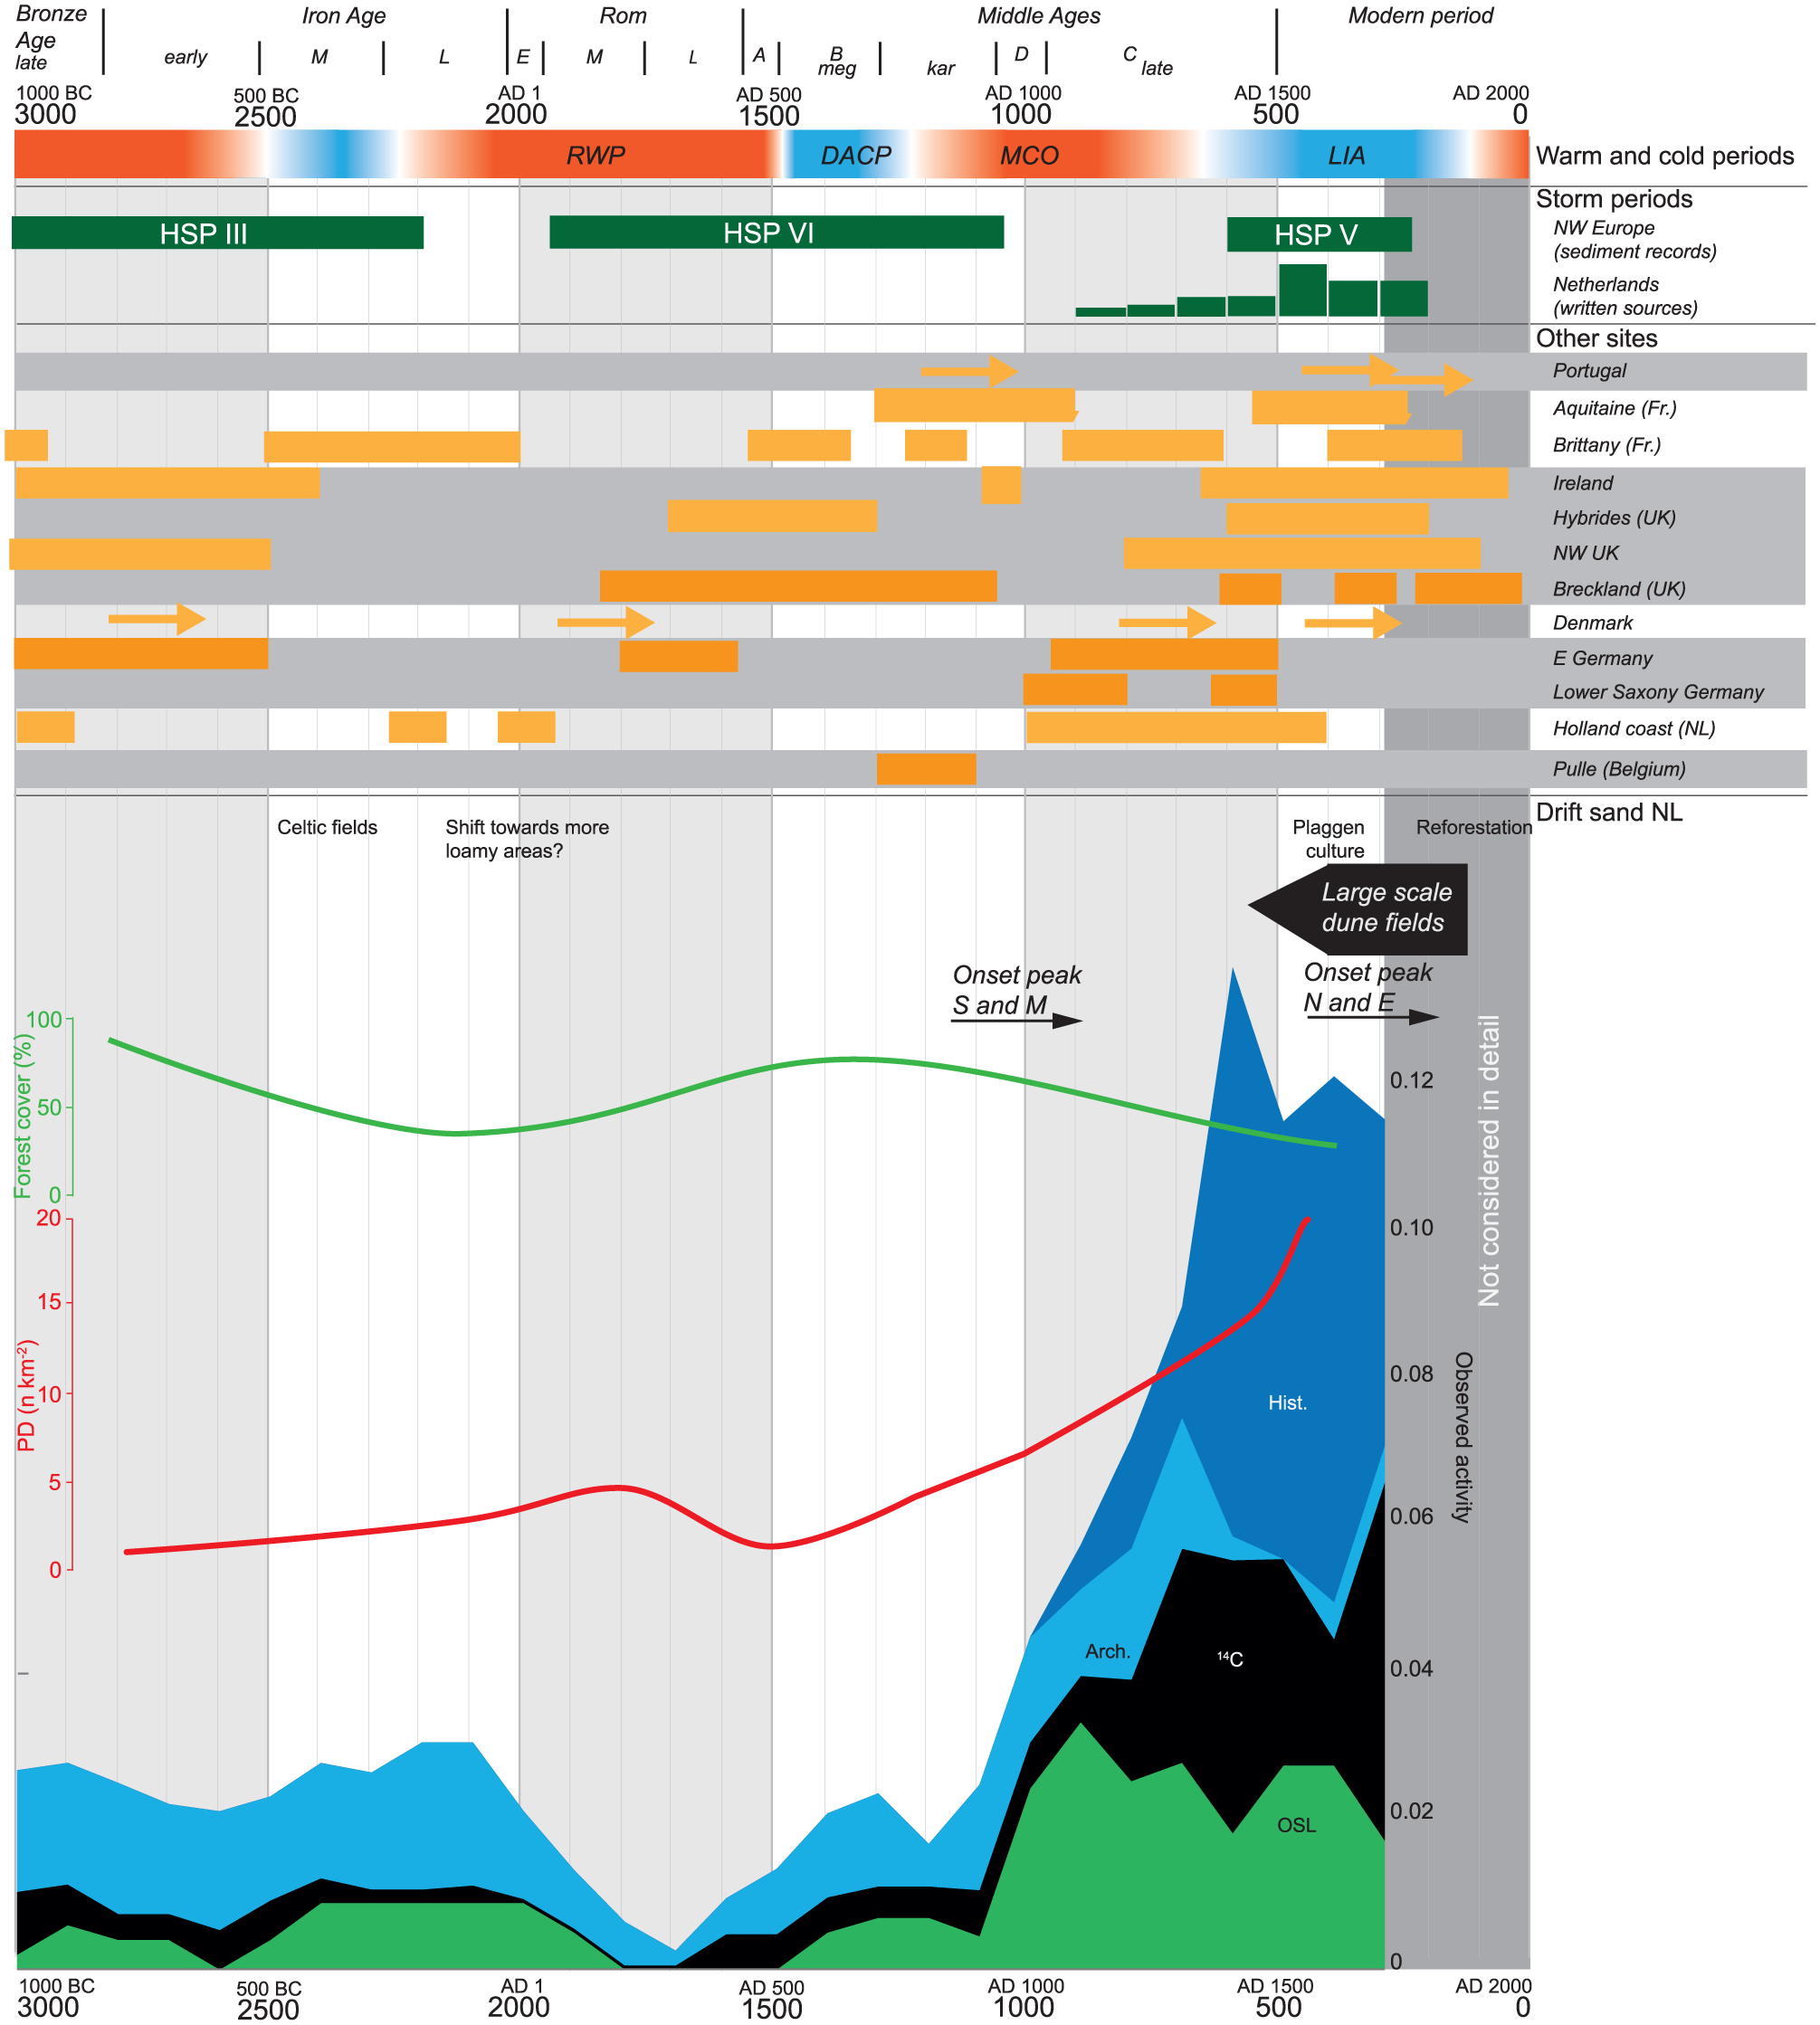
Timing of drift-sand formation for all four sand areas in the Netherlands combined and its forcings compared with other sites in NW-Europe. Warmer (red) and colder (blue) periods 1000 BC–AD 1 after Kobashi et al. (2011) – Greenland ice core, AD 1–2000 after Büntgen et al. (2016). RWP: Roman Warm Period, DACP: Dark Ages Cold Period, MCO: Medieval climate optimum, LIA: ‘Little Ice Age’. NW-European Holocene storm periods (HSPs) after Sorrel et al. (2012) and Dutch storms from written sources after Berendsen (1984) and Buisman and Van Engelen (1996, 1998, 2000). Light orange bars represent coastal dune sites, dark orange sites are inland drift sands: Portugal – Costas et al. (2012); Aquitaine, France – Clarke et al. (2002); Brittany, France – Van Vliet-Lanoë et al. (2016); Ireland – Wilson et al. (2004); Hybrides, NW Scotland – Gilbertson et al. (1999); northwestern UK – Pye and Neal (1993) and Orford et al. (2000); Brecklands – Bateman and Godby (2004); Denmark – Clemmensen et al. (2009); eastern Germany and Lower Saxony – Tolksdorf and Kaiser (2012); Holland coast – Jelgersma et al. (1970), Zagwijn (1984) and Pierik et al. (2017b); and Pulle, Belgium – Derese et al. (2010). Forest cover after Louwe Kooijmans (1995); PD and drift-sand intensity – this study. The drift-sand intensity graph shows the sum of all age estimates for the four study areas, visualised per type of dating method. Moderate drift-sand activity has been present at least since 1000 BC, with a clear dip between AD 1 and 500. After AD 900, the drift-sand activity increases uninterruptedly. Together with several Belgium and German sites, this increase occurs earlier than in many other parts of NW-Europe and does not seem to be related to climate or storm trends.
Facilitating initial conditions
Large dune fields can develop most easily in sandy and dry substrates that cover a large area (Figure 2). This explains why in the eastern sand area small isolated coversand outcrops are most prominent, and drifting is confined to smaller areas. An exception is the Vecht area (eastern sand area) with large W-E-oriented coversand ridges (Figures 4 and 8), since because of the predominantly western wind regime and the long fetch through the east-west-oriented valley, large drift sands could easily develop here. Southwest of the Veluwe, thick coversand deposits occur. Here the largest drift-sand fields of the study area developed, which were active until the 19th century. The peat bogs flanking and covering sandy areas were mainly excavated or reclaimed from the late Middle Ages onwards. This probably lowered the local groundwater level, further facilitating sand drifting. This mechanism could have played a role along the edges of large sand areas: the northern edge of the southern sand area (Figures 6 and 10) and the western edge of the Veluwe (Heidinga, 1984a, 1984b) and Utrechtse Heuvelrug (Sevink et al., 2013; Figures 5 and 9).
Natural forcings (climate and storms)
Our data do not support a direct link between either cold or warm periods and sand-drifting intensity. For example, the RWP is concurrent with a low drift-sand intensity, while the warm MCO (AD 750–1570) faces a strong rise in drift-sand intensity (Figure 11). Although we cannot rule out the possibility that sand-drifting activity is affected by temperature, it is clear that other factors are more important.
In order to identify periods with enhanced storminess, historical written sources can only be used after ca. AD 1400, and we therefore have to rely on sedimentary records for comparing drift-sand activity with storms. Sorrel et al. (2012) reconstructed a stormy Roman period in NW-Europe (Holocene storm period (HSP) VI in Figure 11), while during this period in the Netherlands, the lowest drift-sand activity of the past three millennia occurred. The sharp rise in drift-sand activity during the MCO after AD 900 also does not match a presumed NW-European storm period; it falls between HSP VI and V in Figure 11. The inland rise in drift-sand activity after AD 900 is in line with late-medieval inland drift sands recorded in Germany (Tolksdorf and Kaiser, 2012, and references therein) and dune phases along the Dutch coast from around AD 1000 onwards (Jelgersma et al., 1970; Pierik et al., 2017b; Vos et al., 2015). All these drift-sand activity phases occurred earlier than the onset of the cold LIA and inferred storm periods in NW-Europe. It is nevertheless possible that once drift sands were initiated, they further expanded during the colder and stormier LIA from ca. AD 1500 onwards. For this colder period, higher storm frequencies and much dune activity have been recorded throughout many sites in the Netherlands and many other parts of northwestern Europe (Figure 11).
When comparing storm periods to phases with increased drift-sand intensity on an NW-European scale, several methodological problems arise: (a) many of the sites of the Sorrel et al. (2012) study are situated in coastal dunes or in tidal areas, which are also sensitive to autogenic sediment dynamics such as supply from the shallow sea (Jelgersma et al., 1970, 1995; Pierik et al., 2017b; Van der Valk, 1992; Zagwijn, 1984); (b) the effect of individual storms that occur outside the period of enhanced storm activity on coastal and inland sand drifting can be overlooked. These storms could push an already vulnerable system (e.g. intensively used dry sandy soils) across a threshold, causing a non-linear response in the form of drift-sand formation; (c) within NW-Europe or even within the Netherlands, individual storms can have different magnitudes and impact. Not all storms that may have been important are recorded in independent sedimentary records or historical records (e.g. Bateman et al., 2018); and (d) dating uncertainty of drift-sand events (several centuries) often does not allow linking them to individual storms (Clarke and Rendell, 2009).
The issues discussed above highlight the importance of independent storm records and reconstructions (i.e. not inferred from aeolian dunes) on a regional scale rather than on an NW-European scale. With the exception of the LIA, the weak correlation between periods with temperature anomalies and periods of intense drift-sand activity indicate that climate changes are not the main cause behind drift-sand activity in the Netherlands. Most likely, climate variations over the last millennia occurred within the optimum temperature or wetness range of vegetation.
Facilitating human conditions
Generally, higher PDs will result in more intense land use (deforestation, overexploitation) leading to more sand drifting. When comparing the period before and after AD 1000 in terms of drift-sand activity and PD, it is clear that higher PDs indeed coincided with high drift-sand activity. This is further underlined by the early timing of large-scale drift-sand activity in the middle and southern sand areas, which were characterised by higher PDs than the other study areas. The higher PDs in the south are related to the development of flourishing medieval Flemish cities nearby. In the middle sand area, settlements mainly were located near its southern edge, close to the densely populated river area. We also see a clear link between forest cover and drift-sand activity. Periods of decreasing forest cover generally coincided with periods of increased drift-sand activity, for example, in the southern sand area during the Iron Age and the 11th–13th centuries (Vera, 2011) (Figure 6). In the middle sand area, a low forest cover after AD 900 coincided with high drift-sand activity. Modest forest clearings for iron mining between the Iron Age and the 6/7th century in this area do not seem to have caused much drift-sand activity (Doorenbosch and Van Mourik, 2016; Heidinga, 1987; Figure 5). The link between human occupation, low forest cover and drift-sand activity is in line with the findings from other studies in the NW-European sand belt (e.g. Poland – Dulias et al., 2008; Germany – Küster et al., 2014; Tolksdorf and Kaiser, 2012).
This link, however, is not linear. The consistent dip in drift-sand activity during the Roman period strongly suggests that population increase and deforestation did not automatically lead to more drift-sand activity. This dip is observed both south and north of the Roman limes. A possible explanation for this dip could be the rising groundwater levels caused by reduced evapotranspiration because of deforestation in the preceding Iron Age. It can alternatively be explained by the shift of human activities to areas that were less prone to sand drifting. After the Iron Age, Celtic fields were abandoned, indicating a shift in agricultural practices (Roymans and Gerritsen, 2002; Spek et al., 2003; Van Gijn and Waterbolk, 1984). In the eastern and northern sand area, this coincided with a settlement shift towards areas with loamier and more fertile substrates (Groenewoudt, 1989; Spek, 2004). The same type of shift has been documented by Roymans and Gerritsen (2002) and Kluiving et al. (2015) for the southern sand area. These trends could not be reproduced by Wolthuis and Arnoldussen (2015) for the northern and southern sand areas, but they did notice a settlement shift trend towards areas comprising more wet soils during the late-Iron Age and the early-Roman period. This shift in the Roman period may have decreased human pressure on the most sensitive sandy areas. More research should further explore both hypotheses, related to groundwater level change and spatial pattern of occupation, also for other sandy areas within the NW-European sand belt.
The introduction of different agricultural techniques from the early Middle Ages onwards, such as more advanced ploughs leading to increased soil destruction (Larsen, 2016), could have made the land more prone to sand drifting. From the 15th century onwards, heather sods (plaggen) were used as natural fertilisers in the southern sand area. These plaggen, with a high organic content, were collected by removing the vegetated organic top soil, causing the bare sandy substrate to become exposed to wind erosion. Around a century later, this technique was introduced in the middle and eastern sand areas, and during the 17th century, it was applied in the north (Groenman-Van Waateringe, 1992; Lascaris, 1999; Spek, 2004; Van Mourik et al., 2011). Initially, plaggen activities most likely took place close to settlements and routes. Later, plaggen material had to be collected from more remote areas as well. These areas generally contained the poorest and driest soils and therefore already were most prone to sand drifting. The large-scale destruction of the protecting top soil allowed drift-sand fields in these areas to develop into their final maximum extent during the 19th century, also in more remote areas.
Besides PD, also the type of land use (e.g. agricultural techniques, specialisation, ratio arable farming–animal husbandry) was an important driver for sand drifting (Figure 2). Socio-economic and political factors such as institutional arrangements, property structures, power balances and commercial strategies play an important role when it comes to the initiation and prevention of drift sand (e.g. De Keyzer, 2016; De Keyzer and Bateman, in preparation). These factors determine activities enhancing or preventing sand drifting such as the use of plaggen, deforestation and the construction of hedges and wooden fences.
From the cases presented in this study, it can be concluded that human pressure on a sandy landscape was the most important facilitating condition for drift-sand activity. When the landscape is more sensitive because of the human pressure, sand drifting can potentially be enhanced by higher storm intensity. Whether sand actually will start to drift or continue to drift depends strongly on how the land is used (e.g. deforestation, use of prevention measures), which is besides population pressure influenced by many cultural factors. This causes the relation between PD, deforestation and drift-sand activity to be strongly non-linear.
Reflection on data quality
In this study, temporal and spatial patterns of drift-sand activity were assessed by combining information from many point locations. This approach is sensitive to sampling biases, because the coverage of the earlier research this work was based on may vary in space and time depending on past research traditions. A source of undersampling are the plaggen soils in which drift sands have become homogenised by ploughing (Spek, 2004). When low drift-sand activity is found (e.g. the Roman period), bias caused by undersampling can be minimised by (a) considering regional patterns (i.e. by comparing multiple regions and other locations in NW-Europe), and (b) considering evidence of absence of drift sands (e.g. peat records), as was done in this study. Using the latter kind of evidence also minimises the overrepresentation of younger drift-sand events caused by reworking of older generations of dunes. The reworking bias could still have a local effect, but from peat records and dated soil horizons, it is clear that increasing drift-sand intensity in the Netherlands after AD 900 represents a real trend. To consider oversampling effects during observed high aeolian intensity (e.g. influenced by detailed records in written sources dating from AD 1400 onwards), the events were split up according to their dating method in which the increase is still evident (Figure 11).
Especially after AD 1500, not the amount of drift-sand sites but the size of the drift-sand dune fields becomes a more important indicator of human impact on the landscape and people. This makes the point location approach used in this article gradually less suitable for the period after AD 1500. Therefore, the growing dune fields are not well reflected in our study and even resulted in the apparent decrease of site events in Figure 11 after ca. AD 1400. Historical records mentioning the size and scale of the dunes therefore should be considered more suitable for this interval. In addition, for the interval after AD 1800, historical maps can be used for drift-sand reconstruction.
Despite the low amount of drift-sand data in the first millennium AD, it appears that sand drifting occurred more often close to the AD 100 and 800 route networks. Although the reconstructed route networks only reflect parts of the original networks because of a lack of data, they do show a spatial correspondence with drift-sand activity for the investigated period. Also for AD 1600, the results indicate that areas flanking these routes contained more drift-sand sites than areas further away, but this spatial trend cannot be proven statistically on a regional scale. This is partly because during this period more activities causing sand drifting took place at increasing distance from the main roads (e.g. digging of plaggen), as most likely is reflected by several clusters of sites further away from these routes. For drift-sand sites near settlements, results probably can improve by including secondary roads and local paths in the AD 1600-route network and by improving the chronological depth of the analyses.
Outlook
Including more exact age estimates from local site studies (preferentially OSL) would further unravel the chronological and spatial patterns of past drift-sand activity. In addition, sand influx data from continuous peat records will provide a good record of both the presence and absence of sand drifting. Further independent storm records (i.e. preferably not inferred from dune building phases) will help to assess the role of storms in episodes of drift-sand formation. Such records may include shell layers in coastal dunes (representing wave height – Cunningham et al., 2011; Jelgersma et al., 1995) or lagoon-derived sand layers (Degeai et al., 2015; Van den Biggelaar et al., 2014). Although these were mainly influenced by wind direction and resulting water setup rather than absolute wind strength, they can help to understand the role of storm events in drift-sand formation.
Comparing sand drifting north and south of the Roman limes based on more sites would probably further help to understand the (lack of) impact of anthropogenic and natural conditions during the Roman period. Combining such local studies in an interdisciplinary manner, also taking into account the occurrence of human activity, vegetation and past groundwater levels, will improve the understanding of the relation between people and landscapes of the past. To achieve this, spatial vegetation reconstructions including drift sands will be helpful (e.g. Van Beek et al., 2015a). Historical studies from AD 1500 onwards can unravel the political and economic factors behind land-use strategies (De Keyzer, 2016; Spek, 2004). These detailed local studies can be integrated into regional and supra-regional studies as done in this study or further extended towards adjacent areas in the NW-European sand belt.
Conclusion
This article presents an integrated overview of inland Holocene drift-sand activity in the Netherlands, aiming to assess the relative importance of natural and anthropogenic factors in this region on aeolian drift-sand activity:
From the cases presented in this study, it can be concluded that human pressure on a sandy landscape was the most important facilitating condition for drift-sand activity. The uninterrupted increase of drift-sand activity from ca. AD 900 onwards coincided with a growing PD and decreasing forest cover compared with preceding periods. This effect was strongest in the most densely populated southern and middle sand areas.
Human pressure as an important forcing is also demonstrated by the proximity of sand drifts to routes. Around these routes, road density, agricultural activities and overexploitation are presumed to have been most intense, enhancing drift-sand formation. After ca. AD 1500, drift-sand activity not only took place close to habitation but also on more remote sites, especially where plaggen digging led to the large-scale expansion of active dune fields.
The relation between PD, deforestation and drift-sand activity is non-linear. Whether sand actually started to drift, continued to drift or was prevented from drifting depended on the manner in which the land was used. The type of land use in turn depended on political and economic factors facilitating overexploitation or leading to prevention measures. Also, the spatial distribution of land-use practices controlled drift-sand activity: the observed dip in drift-sand activity during the densely populated Roman period, for example, could well be explained by the local shifting of habitation towards less drift-sand susceptible areas.
Sand drifting likely was enhanced, but not initiated, by higher storm intensity. These conditions accelerated the expansion of dune fields during the LIA after ca. AD 1500, although original facilitating conditions were provided by population pressure and type of land use.
Supplemental Material
Appendix_A_and_B – Supplemental material for Controls on late-Holocene drift-sand dynamics: The dominant role of human pressure in the Netherlands
Supplemental material, Appendix_A_and_B for Controls on late-Holocene drift-sand dynamics: The dominant role of human pressure in the Netherlands by Harm Jan Pierik, Rowin J van Lanen, Marjolein TIJ Gouw-Bouman, Bert J Groenewoudt, Jakob Wallinga and Wim Z Hoek in The Holocene
Footnotes
Acknowledgements
The authors thank Ward Koster, Theo Spek and Maïka de Keyzer for fruitful discussions on the topic of this article. They also thank Hans Middelkoop and Esther Jansma for their comments on earlier drafts of the paper. Finally, they thank Knut Kaiser and Mark Bateman for their useful comments on the manuscript.
Funding
References
Supplementary Material
Please find the following supplemental material available below.
For Open Access articles published under a Creative Commons License, all supplemental material carries the same license as the article it is associated with.
For non-Open Access articles published, all supplemental material carries a non-exclusive license, and permission requests for re-use of supplemental material or any part of supplemental material shall be sent directly to the copyright owner as specified in the copyright notice associated with the article.