
Abstract
This study investigates the Holocene sedimentary history of a small coastal lowland in Nankoku, Kochi Prefecture, on the coast of southern Japan facing the Nankai Trough. The sedimentary fill of the lowland area consists mainly of marine-brackish clay overlain by beds of freshwater clay and peat. We found four laterally extensive sand sheets, one directly underlying the freshwater deposits and the other three interbedded with them. Radiocarbon dates show that these sand sheets were deposited between 5970 and 2440 cal. BP. Although the sand sheets contained few marine-brackish diatoms, they were concentrated in the seaward part of the study site, suggesting that they were deposited by marine inundations. These sand sheets were formed as a result of tsunamis or unusually large storm surges. The apparent frequency of marine inundations during 5970–2440 cal. BP was much lower than that of megathrust earthquakes along the Nankai Trough recorded during the last 1300 years. Event deposits were absent between 2440 and 960 cal. BP, a gap that we attribute to the development of beach ridges. The new marine inundation records reported here will aid efforts to reconstruct the timing and recurrence intervals of megathrust earthquakes in the western Nankai Trough.
Introduction
The history of earthquakes and tsunamis along the Nankai-Suruga Trough, where the Philippine Sea plate is subducting beneath southwestern Japan, has been studied by using historical (e.g. Ishibashi, 1999), archaeological (e.g. Sangawa, 1999), geological (e.g. Fujiwara et al., 2013), geomorphological (e.g. Shishikura et al., 2008), and geophysical (e.g. Hyodo and Hori, 2013) approaches. In particular, historical records document a 1300-year history of earthquakes in southwestern Japan (e.g. Ishibashi, 2004, 2014). This body of work has been used to support evaluations of the occurrence potential of megathrust earthquakes over the next several decades (Headquarters for Earthquake Research Promotion, 2001).
Scientific and social concerns about future earthquakes along the Nankai-Suruga Trough have grown in the years since the 2011 Tohoku-oki earthquake (Mw 9.0) (Cabinet Office, Government of Japan, 2013; Goto et al., 2014). Recurrence intervals of such unusually large tsunamigenic earthquakes are inferred to be several to 10 centuries (e.g. Nanayama et al., 2003; Sawai et al., 2009, 2015a), which is much longer than that of usual megathrust earthquakes (~M8). Geological and geomorphological studies of paleoearthquakes provide basic information for better understanding of such unusually large events. Geological and geomorphological evidence along the Nankai-Suruga Trough has been studied in recent decades (e.g. Garrett et al., 2016; Komatsubara and Fujiwara, 2007 and references therein). Despite these studies, the long-term earthquake history remains fragmentary and tentative, mainly because the age constraints on paleoearthquakes have poor time resolution.
The diversity of paleoearthquake rupture areas is another critical issue for forecasting megathrust earthquakes along the Nankai-Suruga Trough (Ando, 1975; Ishibashi, 2004; Seno, 2012). Many events have been interpreted as rupturing one or two adjacent seismogenic segments based on historical, archaeological, geological, and geomorphological studies, but the record is far from complete (e.g. Ishibashi, 2014). Furthermore, information on rupture areas is crucial for evaluating the magnitudes of paleoearthquakes. Geological studies in coastal lowlands can reveal the distribution of tsunami deposits and coseismic deformations, which are used for earthquake modeling (e.g. Nanayama et al., 2003; Sawai et al., 2012; Wang et al., 2013). In and around the coast of Kochi Prefecture, which faces the western Nankai Trough, most geological studies have been conducted in coastal ponds (Okamura and Matsuoka, 2012). Although such studies are suitable for reconstructing tsunami histories, the horizontal distributions of tsunami deposits, that relate the tsunami inundation area, were not well understood.
In this study, we sought to improve understanding of the timing and recurrence of low-frequency large events by investigating geological evidence of coastal inundations at an isolated lowland in Nankoku, Kochi Prefecture (Figure 1).
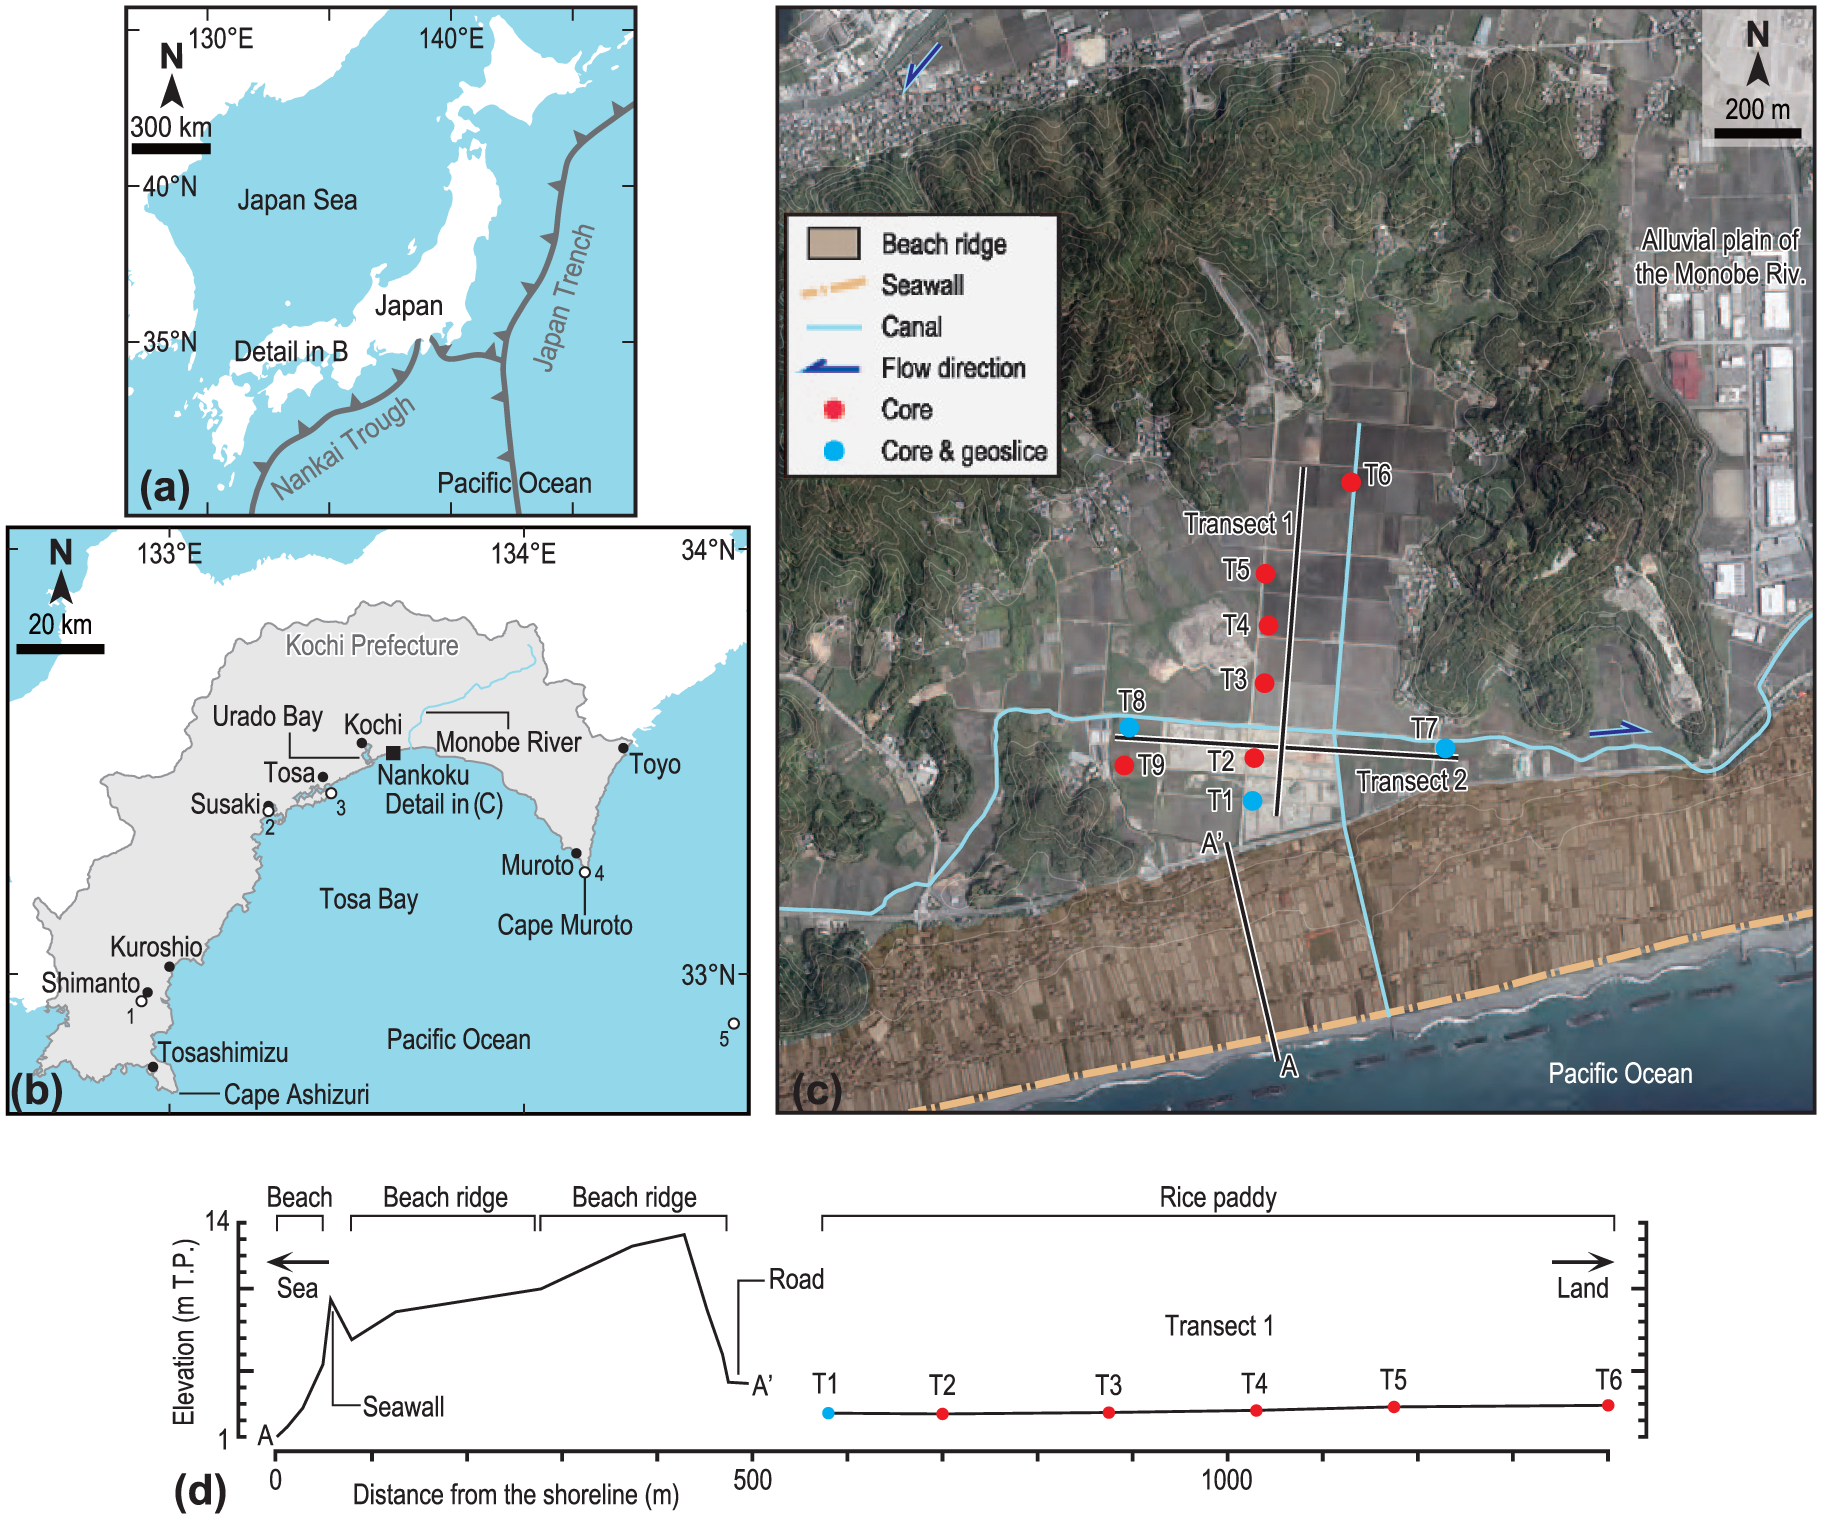
(a) Map of Japan showing major oceanic trenches. (b) Map of Kochi Prefecture showing the Nankoku study site. White circles indicate study locations: 1, Kochi Prefecture Board of Education (1989) and Sangawa (2001); 2 and 3, Okamura et al. (1997, 2000) and Tsukuda et al. (1999); 4, Maemoku (1988, 2001); 5, Iwai et al. (2004). A washover deposit correlated with the 1707 Hoei earthquake was found at the location 3. (c) Aerial photograph of study area showing core and geoslice locations (colored circles) and location of topographic profile in d. Contour interval is 10 m. We used aerial photographs taken by the Geospatial Authority of Japan on 5 May 2010 (photograph numbers: CSI20101-C14-31, CSI20101-C14-32, CSI20101-C14-33, CSI20101-C15-31, CSI20101-C15-32, and CSI20101-C15-33). (d) Surveyed topographic profile. Elevations are relative to mean sea level in Tokyo Bay (T.P., Tokyo Peil).
Study site
The Nankoku study site is a small, coastal lowland surrounded by hills about 70–160 m high, composed mainly of Cretaceous sandstone and mudstone, that isolate this lowland from the alluvial plain of the Monobe River (Figure 1c). Older aerial photographs and older editions of topographic maps show two beach ridges along the coastline, a higher landward one and a lower seaward one (Figure 1d). They are about 8–14 m high and ~400 m wide. Today, the two beach ridges are ambiguous in the aerial photographs because they were covered by houses and greenhouses (Figure 1c). Excavation sites are about 600 m inland from the present shoreline and 2–3 m above mean sea level in Tokyo Bay (Tokyo Peil: T.P.) (Figure 1d). Two small canals, probably modified streams, drain eastward behind the beach ridges. An excavated canal drains seaward through the beach ridge.
History of earthquakes, tsunamis, and storm surges
Historical records of earthquakes in the Nankai-Suruga Trough begin with the 684 Hakuho earthquake (Figure 2). Over the last 1300 years, the recurrence interval of megathrust earthquakes was basically 100–200 years (e.g. Ishibashi, 2004). However, the debate continues whether the Kowa and the counterpart of Meio earthquakes occurred in the western Nankai Trough. Recurrence intervals seem to be longer than 300 years in this period. Various patterns of rupture areas have been inferred from historical documents, archaeological, geological, and geomorphological evidences (e.g. Ishibashi, 2004), but the rupture areas of older earthquakes have greater uncertainties in the absence of instrumental observations. In addition to megathrust earthquakes, a far-field tsunami associated with the 1960 Chile earthquake was also recorded on the coast of Kochi Prefecture (Watanabe, 1998) (Table 1).
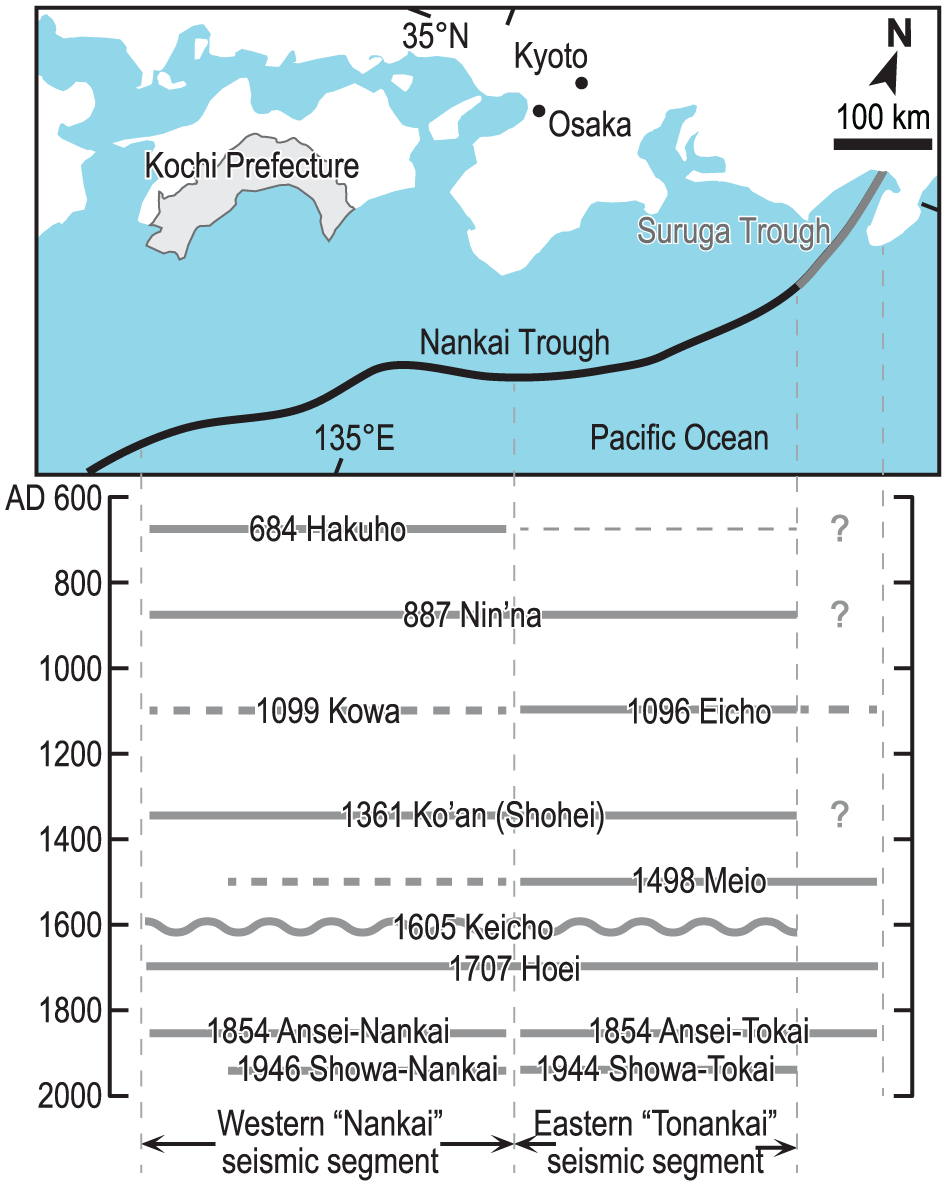
Inferred ruptures of historical and recent earthquakes along the Nankai-Suruga Trough (after Ishibashi, 2004). Thick solid, thick broken, and thin broken lines indicate certain, probable, and possible rupture zones, respectively. The wavy line indicates that the 1605 event was a tsunami earthquake.
Historical and recent records of earthquakes and storm surges affecting Kochi Prefecture before AD 1960.
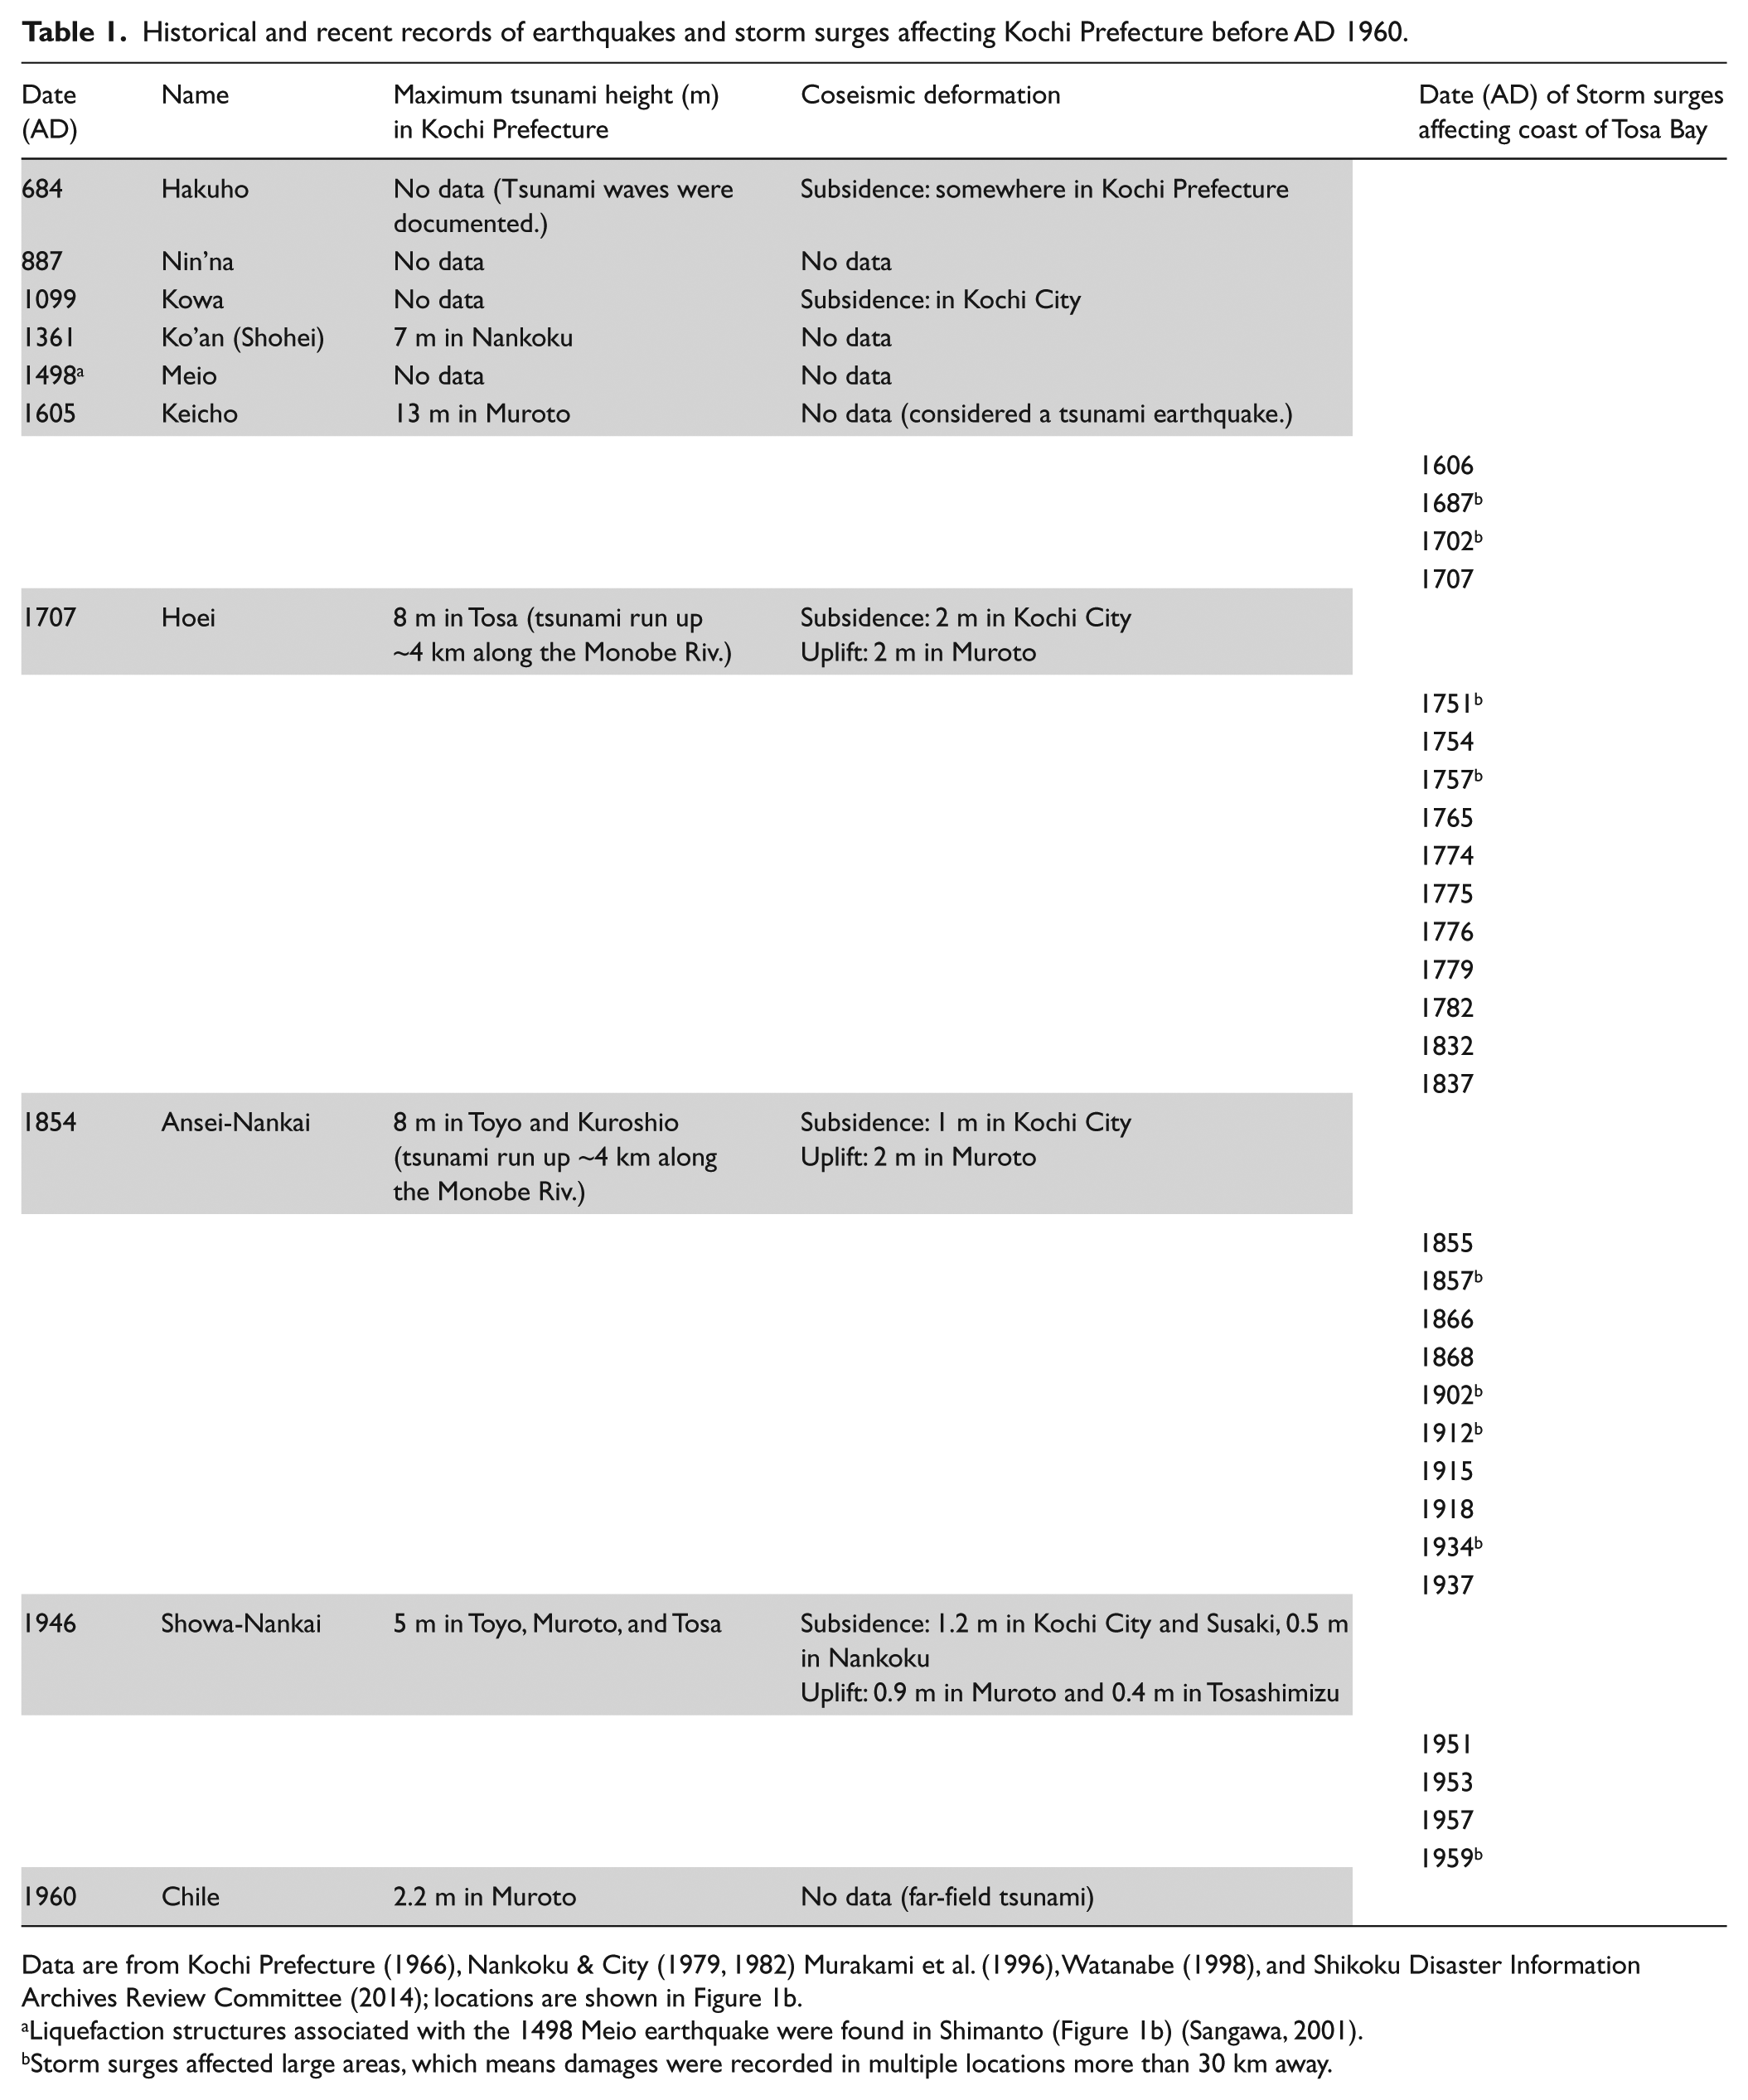
Data are from Kochi Prefecture (1966), Nankoku & City (1979, 1982) Murakami et al. (1996), Watanabe (1998), and Shikoku Disaster Information Archives Review Committee (2014); locations are shown in Figure 1b.
Liquefaction structures associated with the 1498 Meio earthquake were found in Shimanto (Figure 1b) (Sangawa, 2001).
Storm surges affected large areas, which means damages were recorded in multiple locations more than 30 km away.
Historical and recent records of tsunamis and storm surges in Kochi Prefecture
As in other regions, historical records are sparse and fragmentary (e.g. Koyama, 1999) in Kochi Prefecture (Table 1). For the 684 Hakuho earthquake, historical documents show that ships were carried out to sea by the tsunami and rice paddies were submerged by land subsidence in Tosa province (which included the area of today’s Kochi Prefecture). Damages in Tosa province from the 887 Nin’na and 1498 Meio earthquakes were not recorded. The tsunami associated with the 1361 Ko’an (Shohei) earthquake inundated an alluvial plain of the Monobe River (Figure 1c). In this plain, the tsunami hit and damaged a temple that once existed about 1.2 km inland from the present shoreline (Tsuji, 2015). After the 17th century, tsunami waves and coseismic displacements were documented at several locations for each earthquake (the following records are summarized in Watanabe (1998)). After the 1707 Hoei earthquake, which ruptured the entire length of the Nankai-Suruga Trough plate interface (Figure 2), tsunami heights exceeding 5 m were recorded in many coastal areas of Kochi Prefecture. This tsunami inundated the southern (seaward) half of the study site. Coseismic subsidence as great as 2 m was recorded around Urado Bay, about 6 km west of the study site (Figure 1b). Historical and recent records document coseismic uplift around Cape Muroto and Cape Ashizuri, which are characterized by late Pleistocene to Holocene marine terraces (Figure 1b) (e.g. Maemoku, 1988). Coseismic subsidence has occurred along the inner coast of Tosa Bay, including Nankoku (Table 1).
Kochi Prefecture is vulnerable to typhoons, and many storm surges are documented there since the 17th century (Table 1). Storm surges that affect relatively large areas have occurred a few times per century. In 1970, Typhoon Anita caused the highest tide on record at Kochi City since 1950, 313 cm T.P. (Japan Meteorological Agency, 2016).
Geological and geomorphological studies in Kochi Prefecture
Paleoseismic evidence along the Nankai-Suruga Trough were summarized in Komatsubara and Fujiwara (2007) and Garrett et al. (2016). Geological evidence of tsunamis has been studied at coastal ponds in Kochi Prefecture. Okamura and Matsuoka (2012) documented sandy washover deposits containing marine microfossils that were interbedded within lacustrine mud. These were interpreted as tsunami deposits on the basis of the present topography, in which beach ridges and dunes inhibit inundations by storm surges. The dates of many events have been estimated by radiocarbon ages obtained from within the washover deposits. Fourteen washover deposits were dated between 4800 and 1300 cal. BP at a pond in Susaki (Figure 1b; location 2, data before 2700 cal. BP were unpublished), and the youngest of these was correlated with the 684 Hakuho earthquake (Okamura et al., 1997, 2000; Tsukuda et al., 1999). A pond in Tosa (Figure 1b; location 3) contained six washover deposits from the last 2000 years, some of which have been correlated with the 684 Hakuho, 1361 Ko’an (Shohei), 1707 Hoei, and 1854 Ansei earthquakes (Okamura et al., 1997, 2000; Tsukuda et al., 1999). Distinguishing between tsunami and storm deposits is generally difficult, and storm surges could not be ruled out for the origin of these washover deposits.
Kochi Prefecture Board of Education (1989) and Sangawa (2001) reported traces of liquefaction from archaeological sites in Shimanto (Figure 1b; location 1). Based on pottery ages, they suggested that the liquefaction structures were induced by the 1498 Meio earthquake, which caused no recorded damage in Kochi Prefecture.
Geomorphological evidence of coseismic uplift events has been studied at Cape Muroto (Figure 1b; location 4). Radiocarbon ages of wood and marine sessile organisms and shells suggest that uplift occurred every 1000–2000 years during the last 6000 years (Maemoku, 1988, 2001). Maemoku (2001) suggested that these uplift events were caused by intraplate movements on offshore splay faults that may or may not have accompanied megathrust events.
Southeast of Muroto (Figure 1b; location 5), a seafloor core was found to contain 31 turbidites dating from the last 7000 years that were interpreted as the product of turbidity currents triggered by megathrust and offshore fault earthquakes (Iwai et al., 2004). Individual turbidites were correlated with historical earthquakes, including the 1099 Kowa, 1361 Ko’an (Shohei), and 1498 Meio events, on the basis of an age–depth curve.
Methods
We obtained nine sediment cores ~9 cm in diameter and up to 8 m long at sites T1–T9 (Figure 1c). These core sites form two orthogonal transects running north-south (transect 1) and east-west (transect 2). We also collected three large samples ~4 m long and 40 cm wide by using a geoslicer system (Nakata and Shimazaki, 1997) at sites T1, T7, and T8. We prepared peels from some cores and geoslices, using a hydrophilic grout (e.g. Takada and Atwater, 2004). The coarser the sediment, the deeper the grout penetrates because coarse sediments have large pore spaces among particles. Differences in grain size appear as relief of the peel, which help to observe sedimentary structures in detail.
Fossil diatoms were analyzed in 26 samples from the geoslice at T1. They were obtained at intervals of 2–6 cm, between 32 and −47 cm in elevation. We identified and counted more than 300 valves except in samples where the concentration of diatoms was low, in which we counted at least 100 valves. The methodology for preparation of diatom slides followed Watanabe (2010). Diatom identifications and ecological interpretations followed Krammer and Lange-Bertalot (1986, 1988, 1991a, 1991b), Round et al. (1990), Vos and De Wolf (1993), Witkowski et al. (2000), and Chiba and Sawai (2014). Fossils in 12 samples from the geoslice at T1 were analyzed for foraminifers by Palynosurvey Co., Tokyo, Japan.
For radiocarbon dating, we picked out terrestrial plant macrofossils such as fruits, seeds, leaves, and insects, under a binocular microscope, from geoslices at T1, T7, and T8, and cores at T2, T3, and T4. When we could not find enough plant macrofossils, we picked charred materials for dating. All samples were dated by accelerator mass spectrometry at Beta Analytic, Florida, USA. The ages of event deposits were constrained using Bayesian statistics in the radiocarbon calibration program OxCal 4.2 (Bronk Ramsey, 2009) with the IntCal13 radiocarbon calibration dataset (Reimer et al., 2013). Age estimation followed the procedure of Lienkaemper and Bronk Ramsey (2009).
A visible tephra layer was identified as the Kikai-Akahoya tephra (K-Ah) by the Furusawa Geological Survey, Aichi, Japan, based on refractive indices and forms of volcanic glass and on mineral composition. K-Ah is a widespread marker tephra, erupted 7.2 cal. kyr BP from Kikai caldera in southwestern Japan (Machida and Arai, 2003; Smith et al., 2013).
Results
Stratigraphy
The surface of the study site is covered by a few meters of artificial fill and used for rice cultivation. Deposits beneath the fill can be divided into three stratigraphic units (Figure 3). Unit 1, the lowest, was found at seaward sites T1, T2, T3, and T7. Units 2 and 3 were found at all sites. Unit 1 is composed of sand and gravel. Unit 2 is more than 3 m thick and is composed of gray silty clay. Within Unit 2 at sites T1, T3, T6, and T7, there are layers of sand and sandy silt that sometimes contain gravels. The whole unit is bioturbated and contains plant fragments. Unit 3, the uppermost, consists of dark brown organic clay and peat 1–2 m thick and some intercalated sand sheets. The contact between Units 2 and 3, clearly seen in the seaward sites, is accompanied by sand sheets at all sites except T5 and T6, and by brownish gray silty clay at T2, T3, T7, and T8 (Figures 3c, 4, S1, S2, S3, S4, and S5).
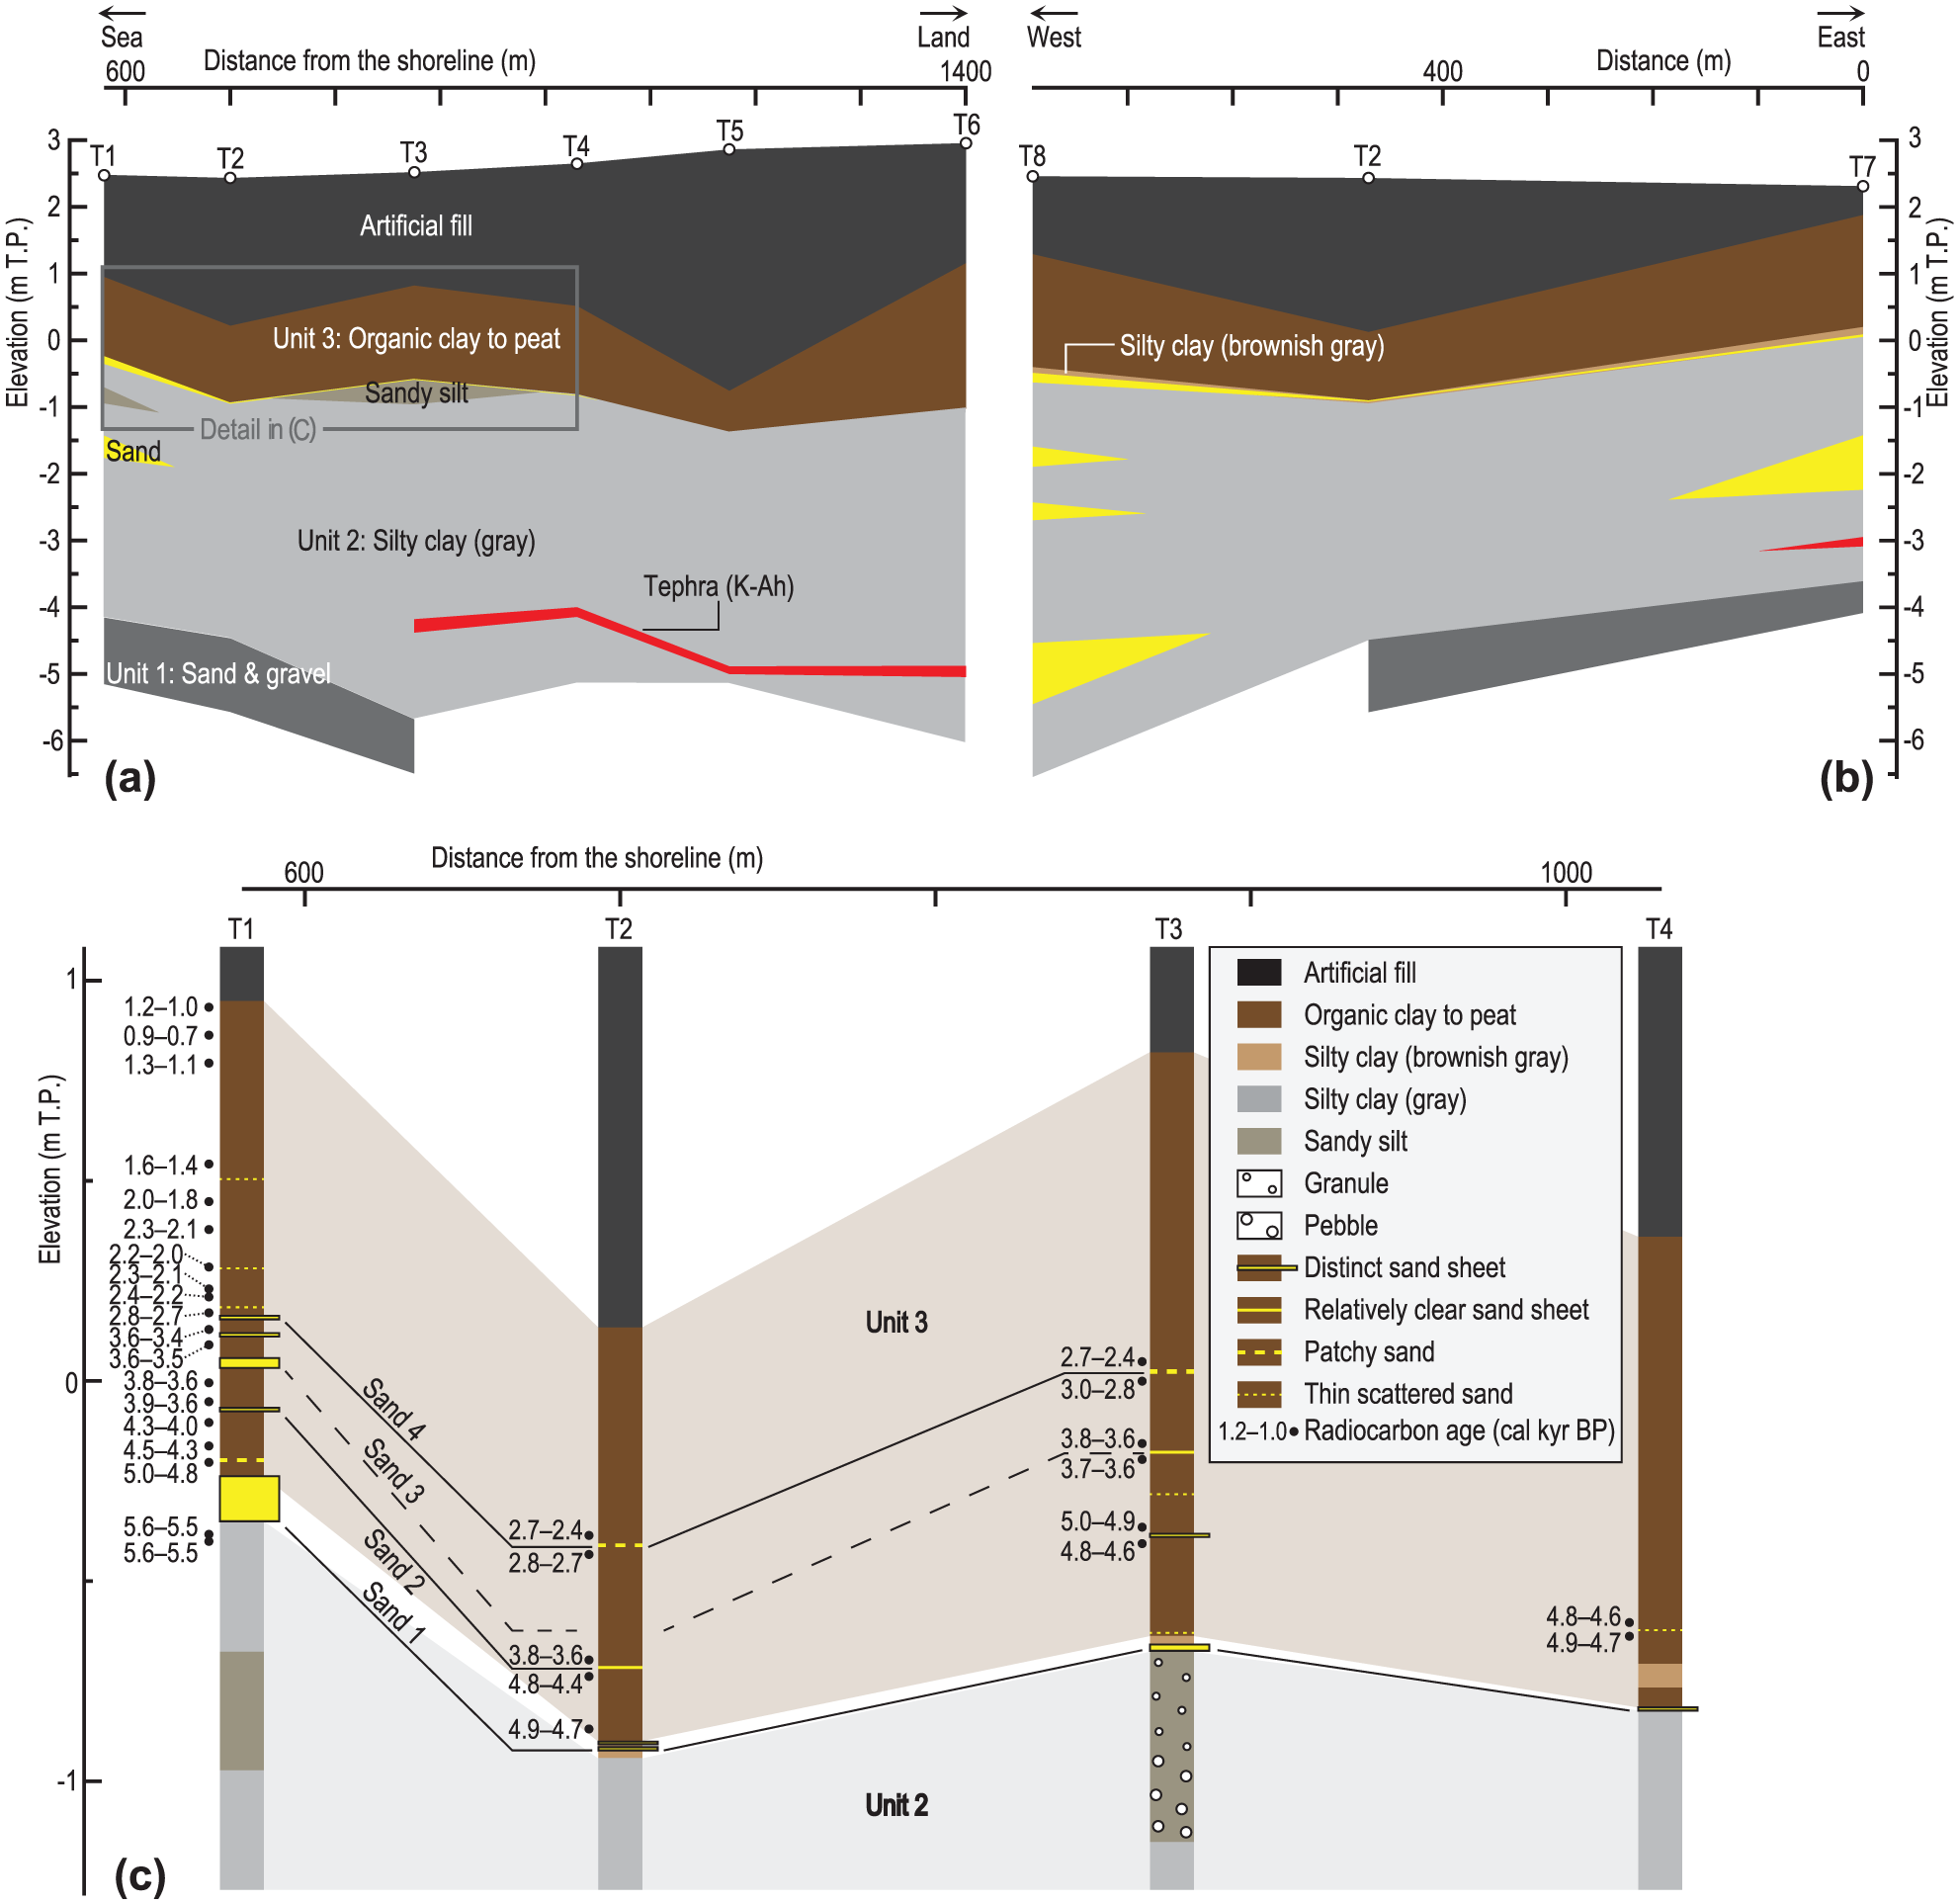
(a) Cross-section of transect 1 (location in Figure 1c), (b) cross-section of transect 2 (location in Figure 1c), and (c) detail of transect 1 from T1 to T4 (outline in (a)). Cores at T5 and T6 are omitted from this figure because they did not contain any sand sheets. Sand 1 was correlated based on their stratigraphic position. Sand 2, 3, and 4 were correlated based on their depositional ages.
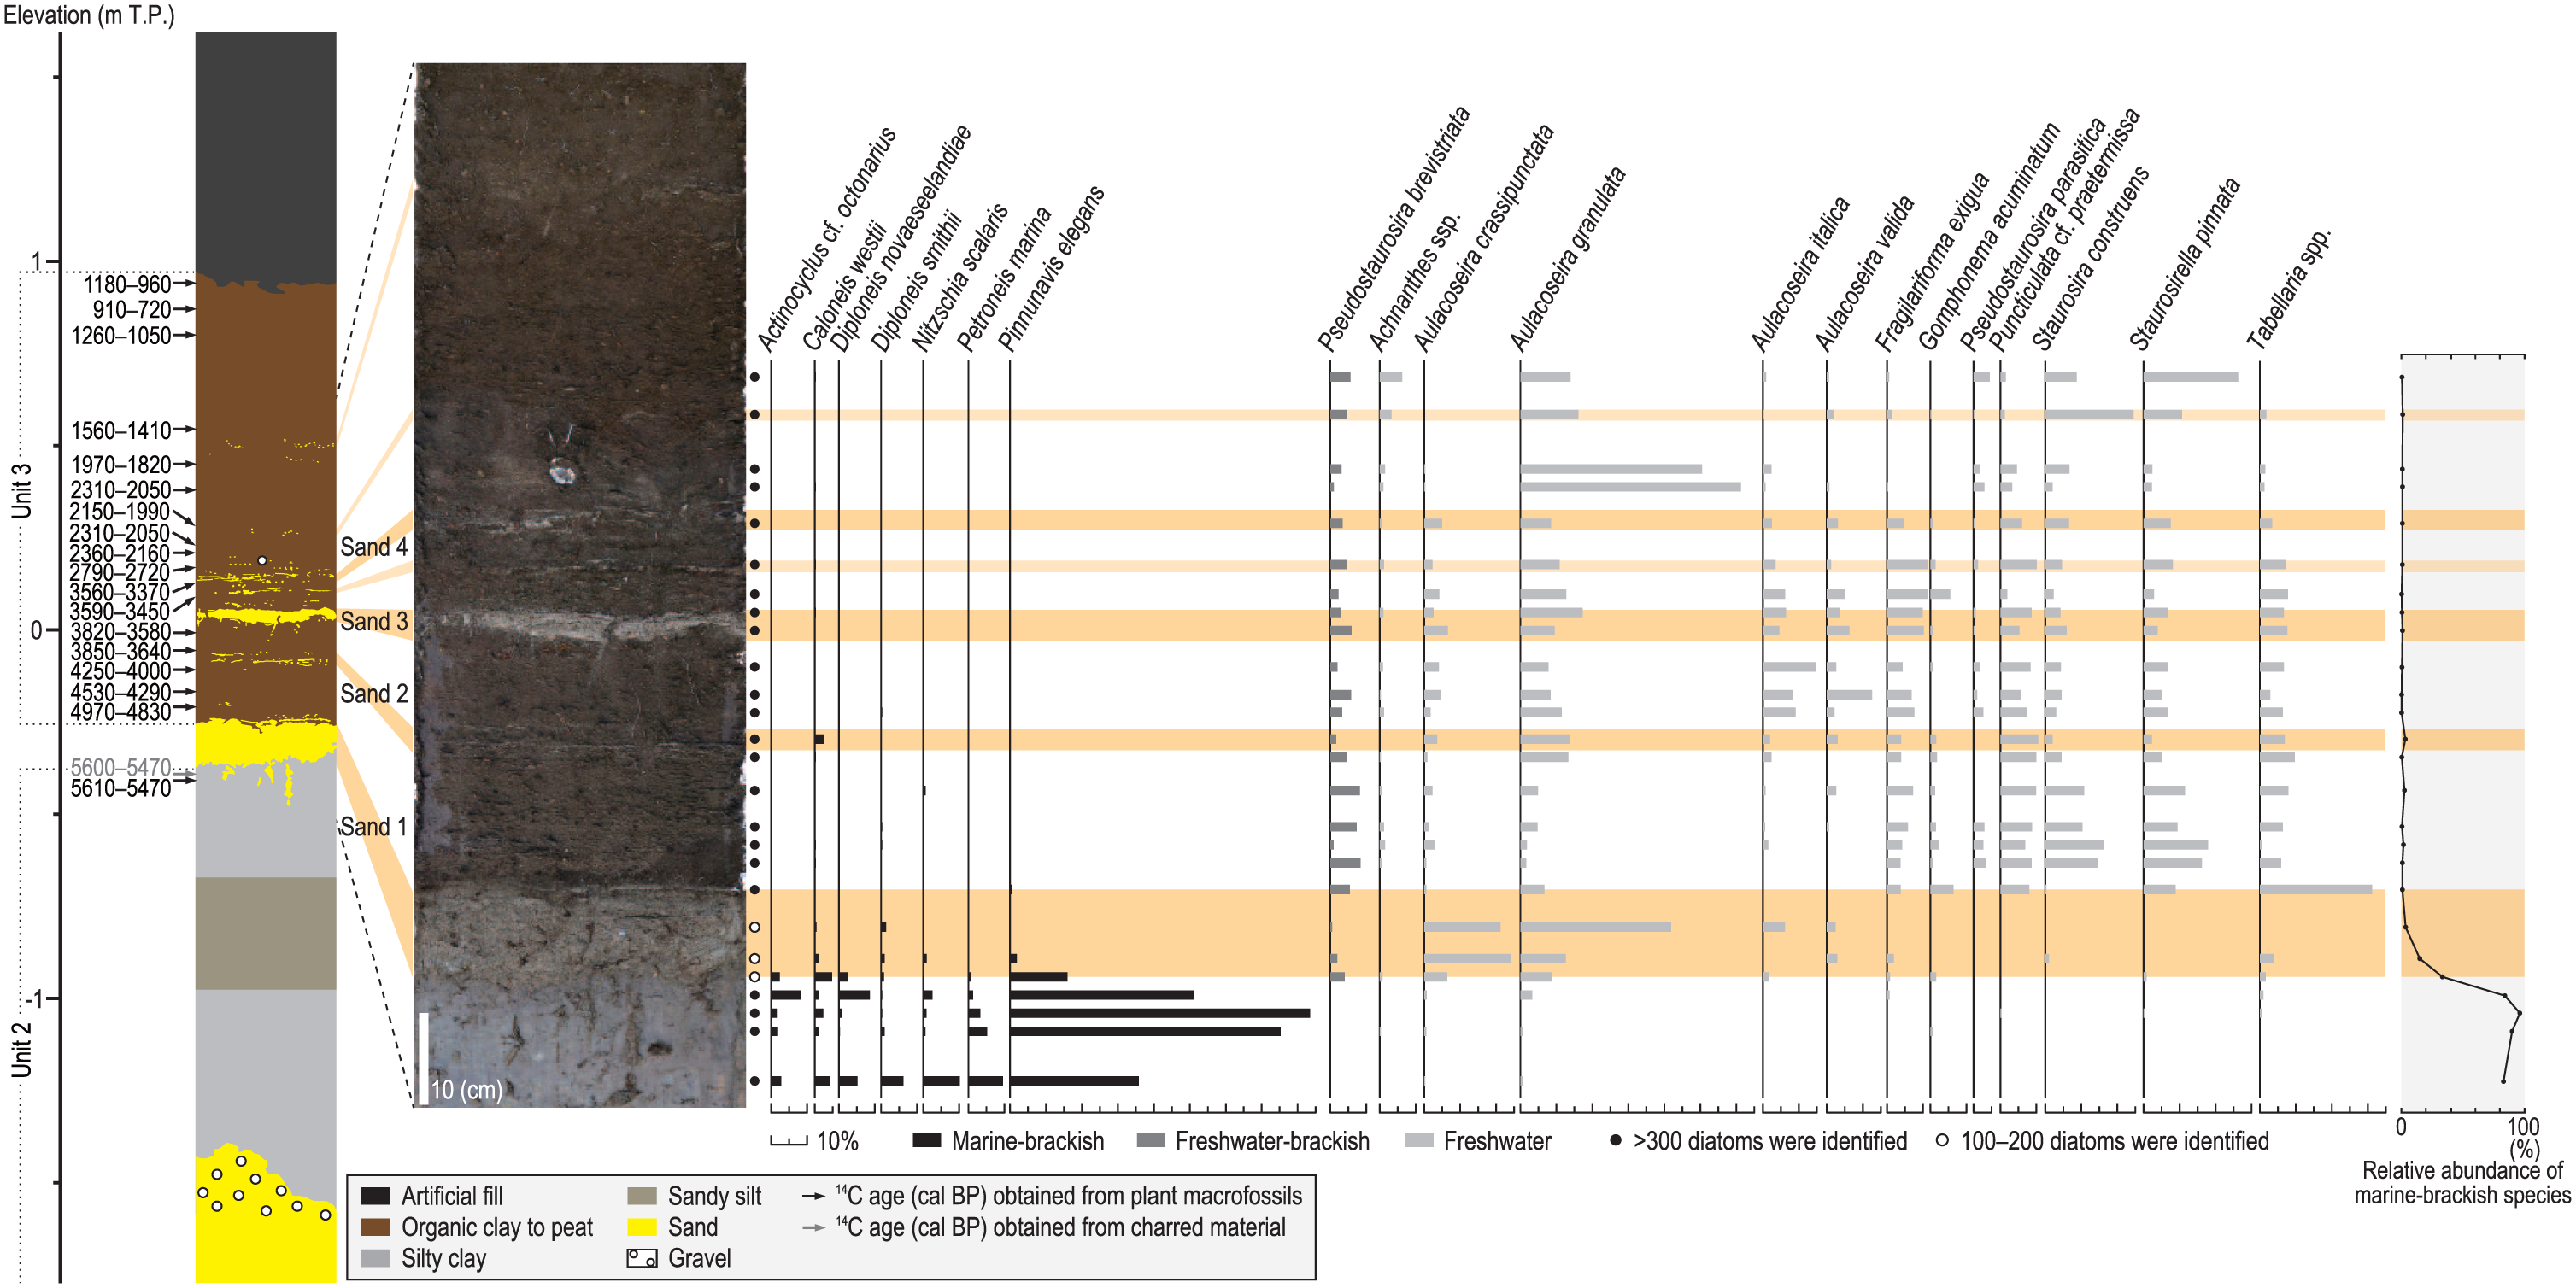
Lithofacies profile with radiocarbon ages, photograph of a peel, and fossil diatom assemblages of the geoslice at T1. The photograph shows the section between −0.51 and 0.63 m T.P. The right-hand column shows the relative proportions of marine-brackish and freshwater diatoms.
Unit 2 was deposited before 5.5 cal. kyr BP. The base of Unit 2 dates from before 7.2 cal. kyr BP because the K-Ah tephra lies within it at around −4 to −5 m in elevation. Radiocarbon ages of plant macrofossils show that Unit 3 was deposited between 5.0 and 1.0 cal. kyr BP (Figure 3c). Although Unit 3 probably continued to accumulate after 1.0 cal. kyr BP, its uppermost part was removed to develop agricultural fields.
Event deposits
We recognized sand sheets, patchy sand beds, and thin lines of scattered sand by eye in cores and geoslices (Figures 3c, 4, S1, S2, S3, S4, and S5). The thin lines of scattered sand were too thin to analyze and we do not discuss them here. We correlated a sand sheet along the contact between Units 2 and 3 based on their stratigraphic position. Three of the sand sheets in Unit 3 were correlated between cores based on their depositional ages, as constrained by radiocarbon ages of plant macrofossils just above and below the sand sheets (Figure 3c, Table 2). We referred to these four sand sheets as Sand 1, 2, 3, and 4 in ascending order.
Radiocarbon ages from cores T1, T2, T3, T4, T7, and T8.
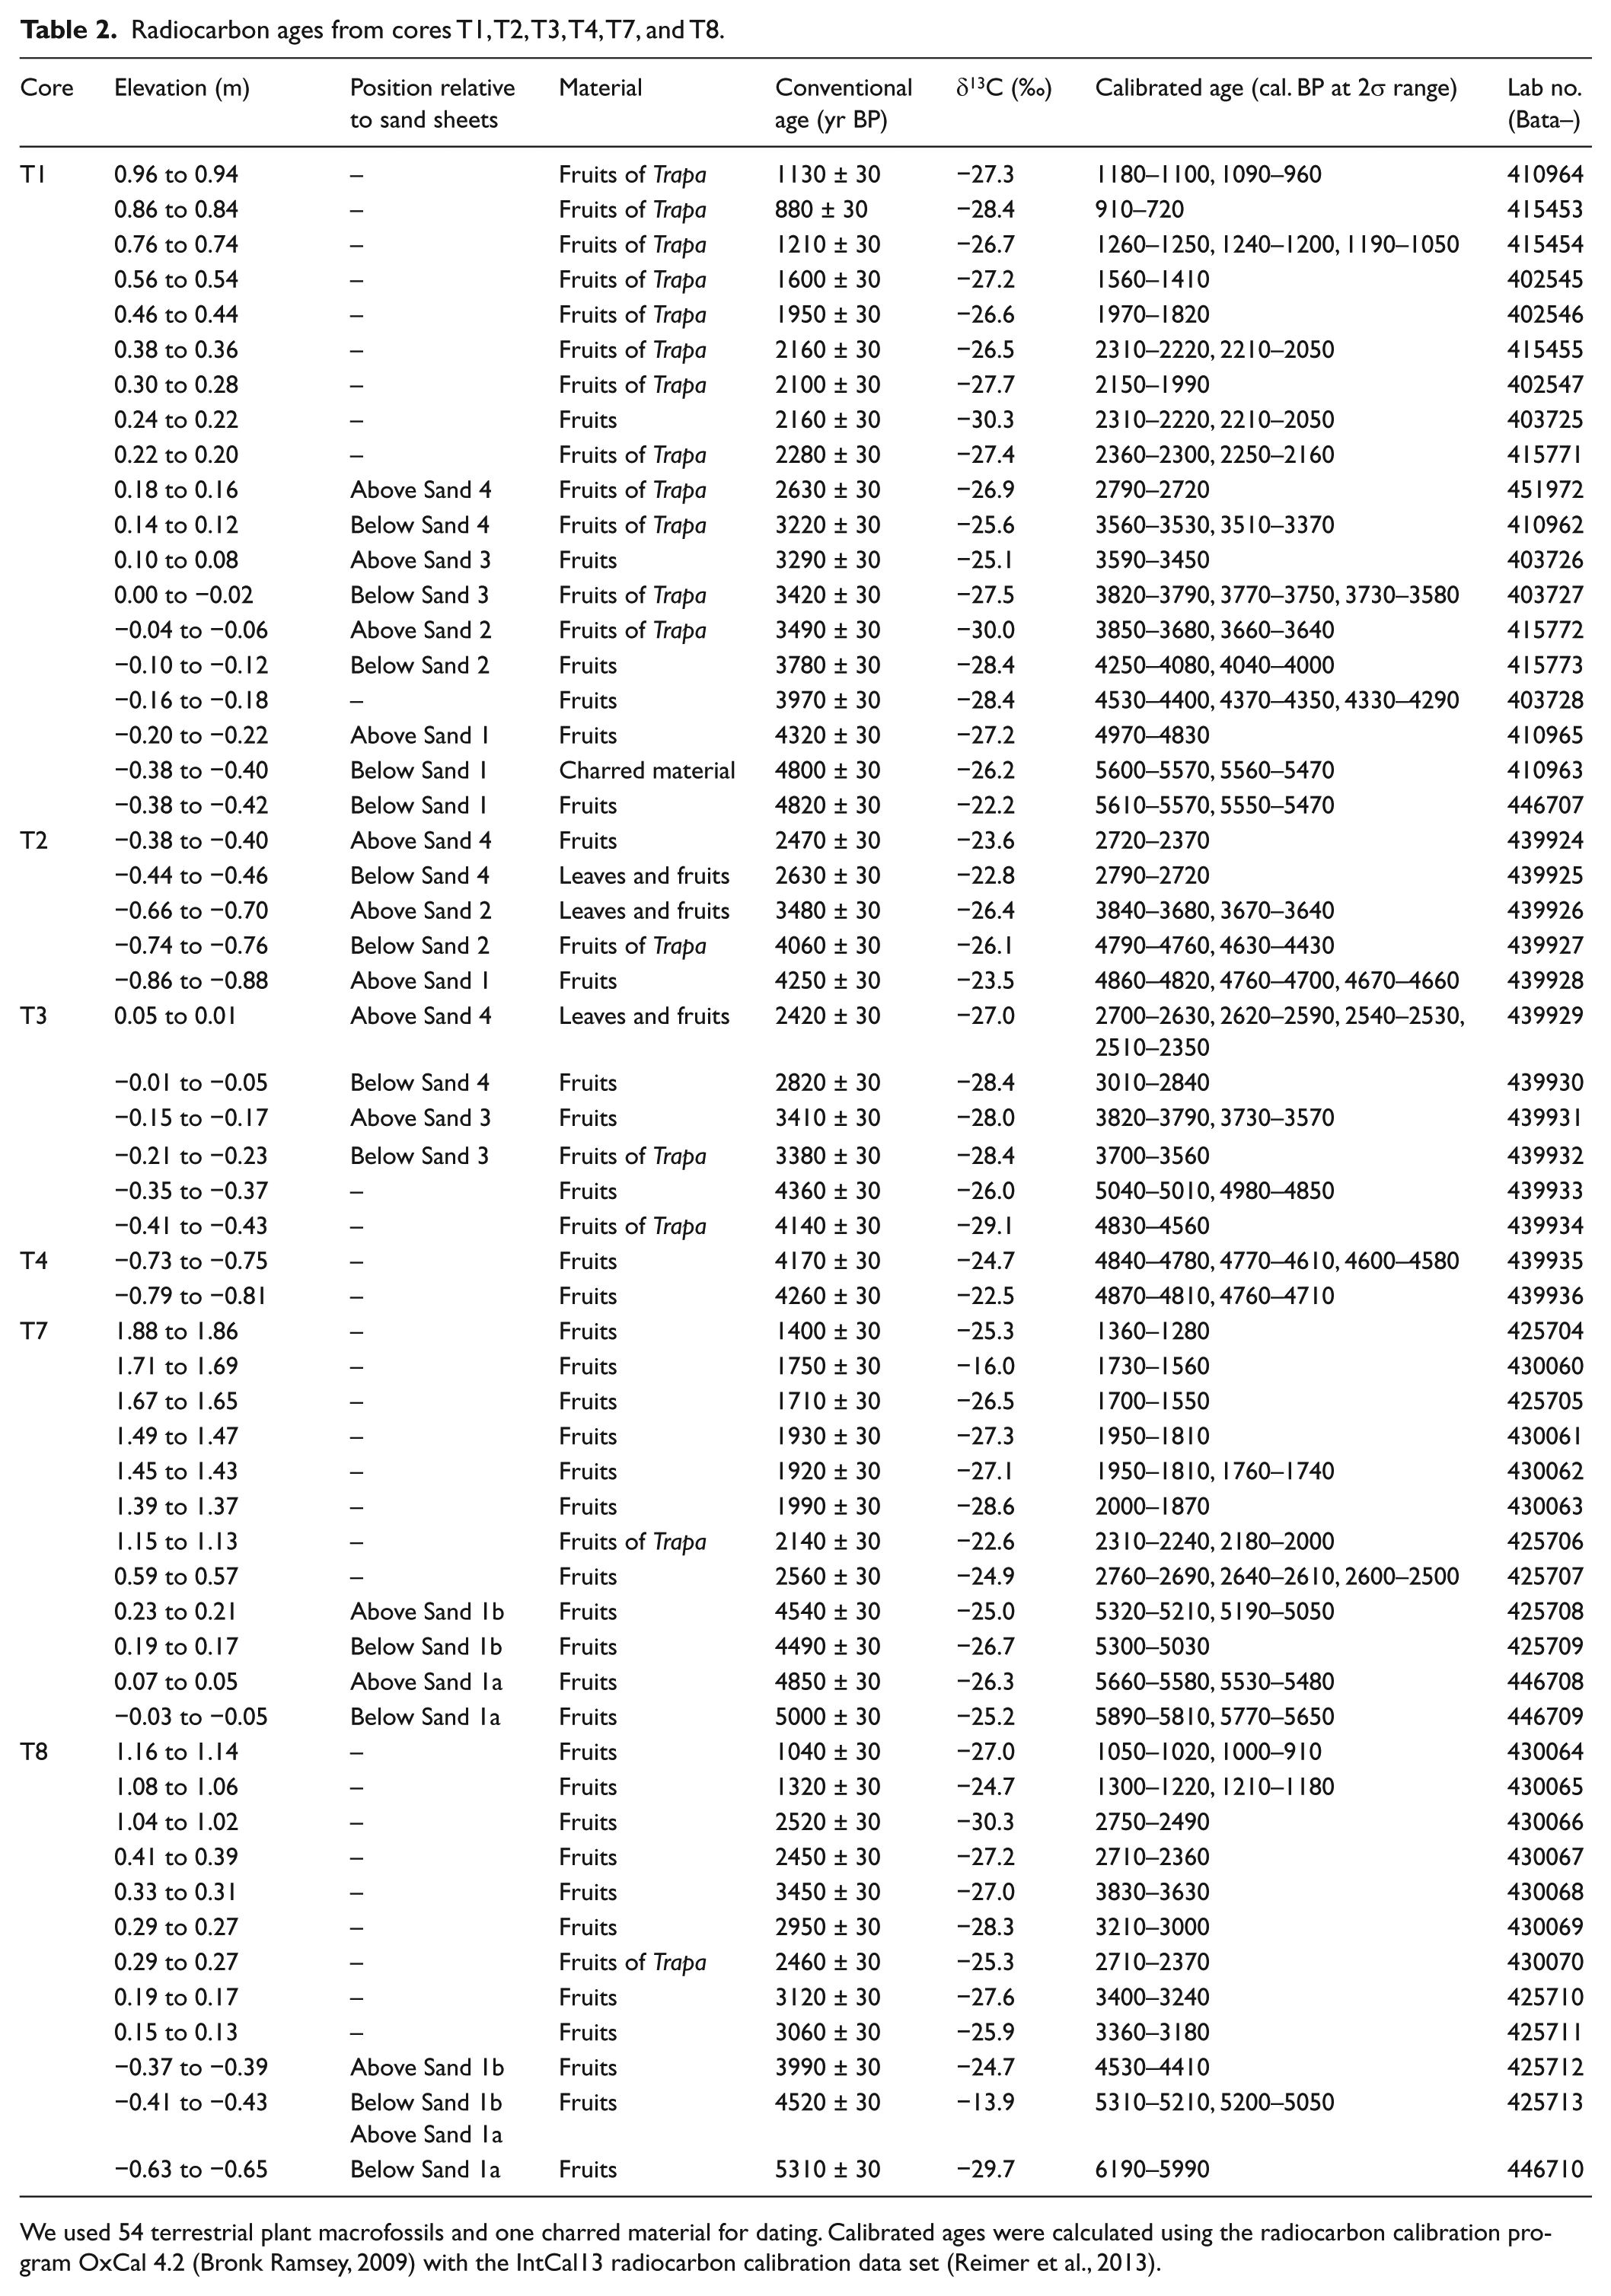
We used 54 terrestrial plant macrofossils and one charred material for dating. Calibrated ages were calculated using the radiocarbon calibration program OxCal 4.2 (Bronk Ramsey, 2009) with the IntCal13 radiocarbon calibration data set (Reimer et al., 2013).
Sand 1 was found at the contact between Units 2 and 3 at sites T1–T4 (~400 m along transect 1) and sites T7–T9 (~800 m along transect 2) (Figure 3). At T7 and T8, there were two sand sheets at the contact, with a layer of brownish gray silty clay between them (Figures S4 and S5, available online). It is difficult to distinguish which sand sheet is correlated with Sand 1 at T1 based on their stratigraphic position. Therefore, we referred the lower and the upper sand sheets as Sand 1a and 1b, respectively. Sand 1 is found about 600–1000 m from the present shoreline (Figure 1), and its distribution was limited to the seaward part of the study area. It consists of fine to coarse sand including quartz and feldspar grains, and it contains abundant plant fragments (Figures 4, S1, S2, S3, S4, and S5). Sand 1 and 1a consist of medium to coarse sand at T1 and T8, where it was ~15 cm thick, and at T3 and T7, where it was 0.5–4 cm thick. Sand 1 and 1b consist of fine sand at T2, T4, T7, and T8, where it was up to 0.3 cm thick. Although upward fining from coarse to medium sand was observed in Sand 1a at T8, there were few sedimentary structures in Sand 1. In general, Sand 1 was thinner and finer in landward areas. The basal contact is sharp at T1, T3, T7, and T8.
Sand 2, composed of fine to medium sand, was within Unit 3 approximately 20 cm above Sand 1 (Figure 3c). Sand 2 was ~0.3 cm thick and was found only at sites T1 and T2 (Figures 4 and S1), about 700 m inland from the present shoreline (Figure 1). At T1, Sand 2 consists of some planar sand beds between −0.11 and −0.07 m T.P. (Figure 4). Sand 3, composed of well-sorted fine to medium sand, was 4 cm thick at T1, absent at T2, and 0.3 cm thick at T3 (Figures 3c, 4, and S2), about 900 m inland from the present shoreline (Figure 1). Sand 3 has a sharp basal contact and includes few plant fragments at T1 (Figure 4). Sand 4, composed of fine to medium sand, was up to 1 cm thick at T1 and patchy at T2 and T3 (Figures 3c, 4, S1, and S2), about 900 m inland from the present shoreline (Figure 1). At T1, Sand 4 consists of planar sand beds between 0.14 and 0.17 m T.P. (Figure 4).
Depositional ages of the sand sheets
Depositional ages of Sand 1, 2, 3, and 4 were constrained by radiocarbon ages of plant macrofossils (Figure 3c, Table 2). We interpreted the age of each sand sheet to be younger than the radiocarbon ages obtained from just below the sand sheet and older than those obtained from just above the sand sheet.
We propose two depositional ages for Sand 1 (Figure 5, Table 3). Because there are two cases in which Sand 1 at T1 was correlated with Sand 1a or 1b at T7 and T8. Table 3 lists the two cases, using radiocarbon dates from sites T1, T7, and T8 (Figures S1 and S2, available online). Considering Sand 1a, the depositional age of Sand 1 was constrained by six radiocarbon ages as 5510–4870 cal. BP for T1, 5810–5500 cal. BP for T7, and 5970–5150 cal. BP for T8 (Figure 5, Table 3). Considering Sand 1b, the depositional age of Sand 1 was constrained by six radiocarbon ages as 5510–4870 cal. BP for T1, 5270–5070 cal. BP for T7, and 5180–4440 cal. BP for T8 (Figure 5, Table 3). From these ages, we inferred the two possible depositional ages of Sand 1 to be 5970–4870 and 5510–4440 cal. BP.
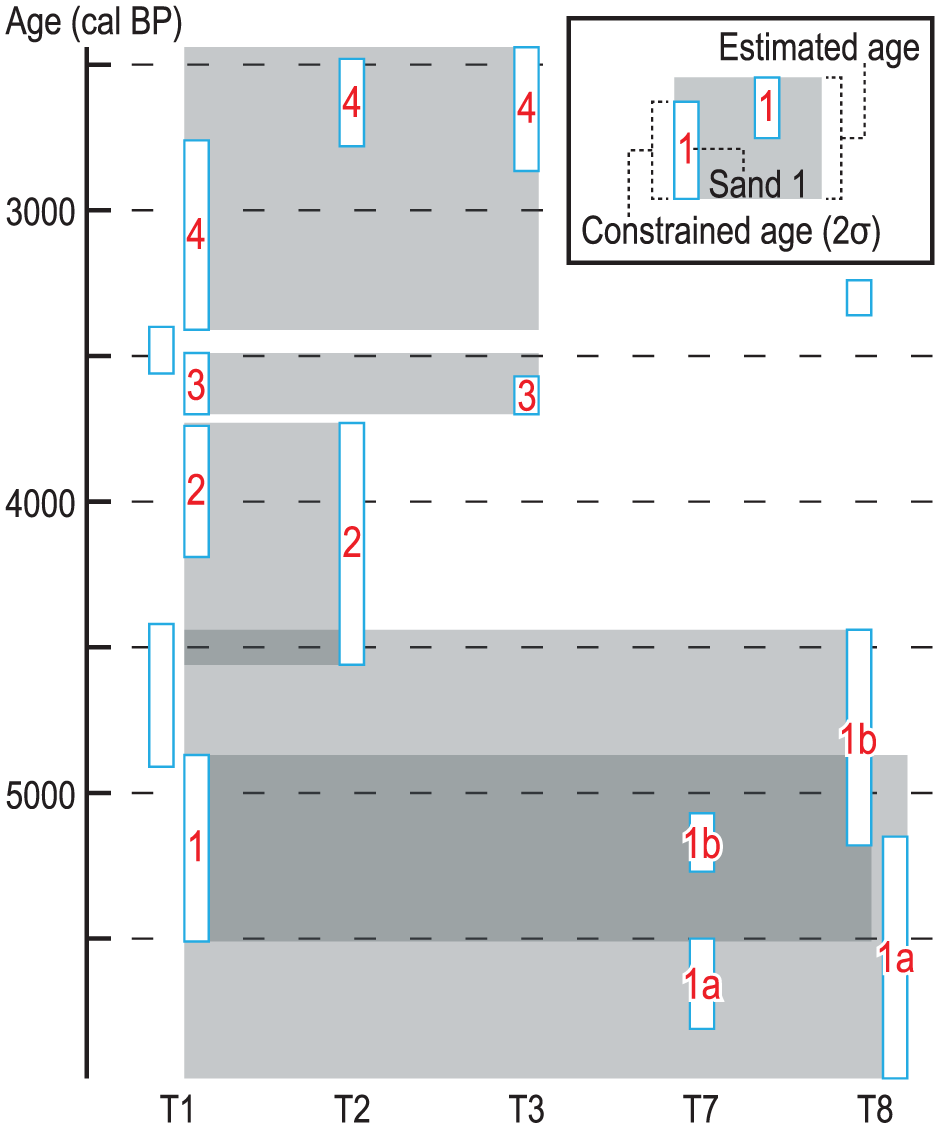
Estimates of ages of Sand 1, 2, 3, and 4. Constrained ages (2σ range) are summarized in Table 3. They were constrained using the OxCal 4.2 (Bronk Ramsey, 2009) with the IntCal13 (Reimer et al., 2013). Age estimation followed the procedure of Lienkaemper and Bronk Ramsey (2009).
Estimates of ages of Sand 1, 2, 3, and 4.
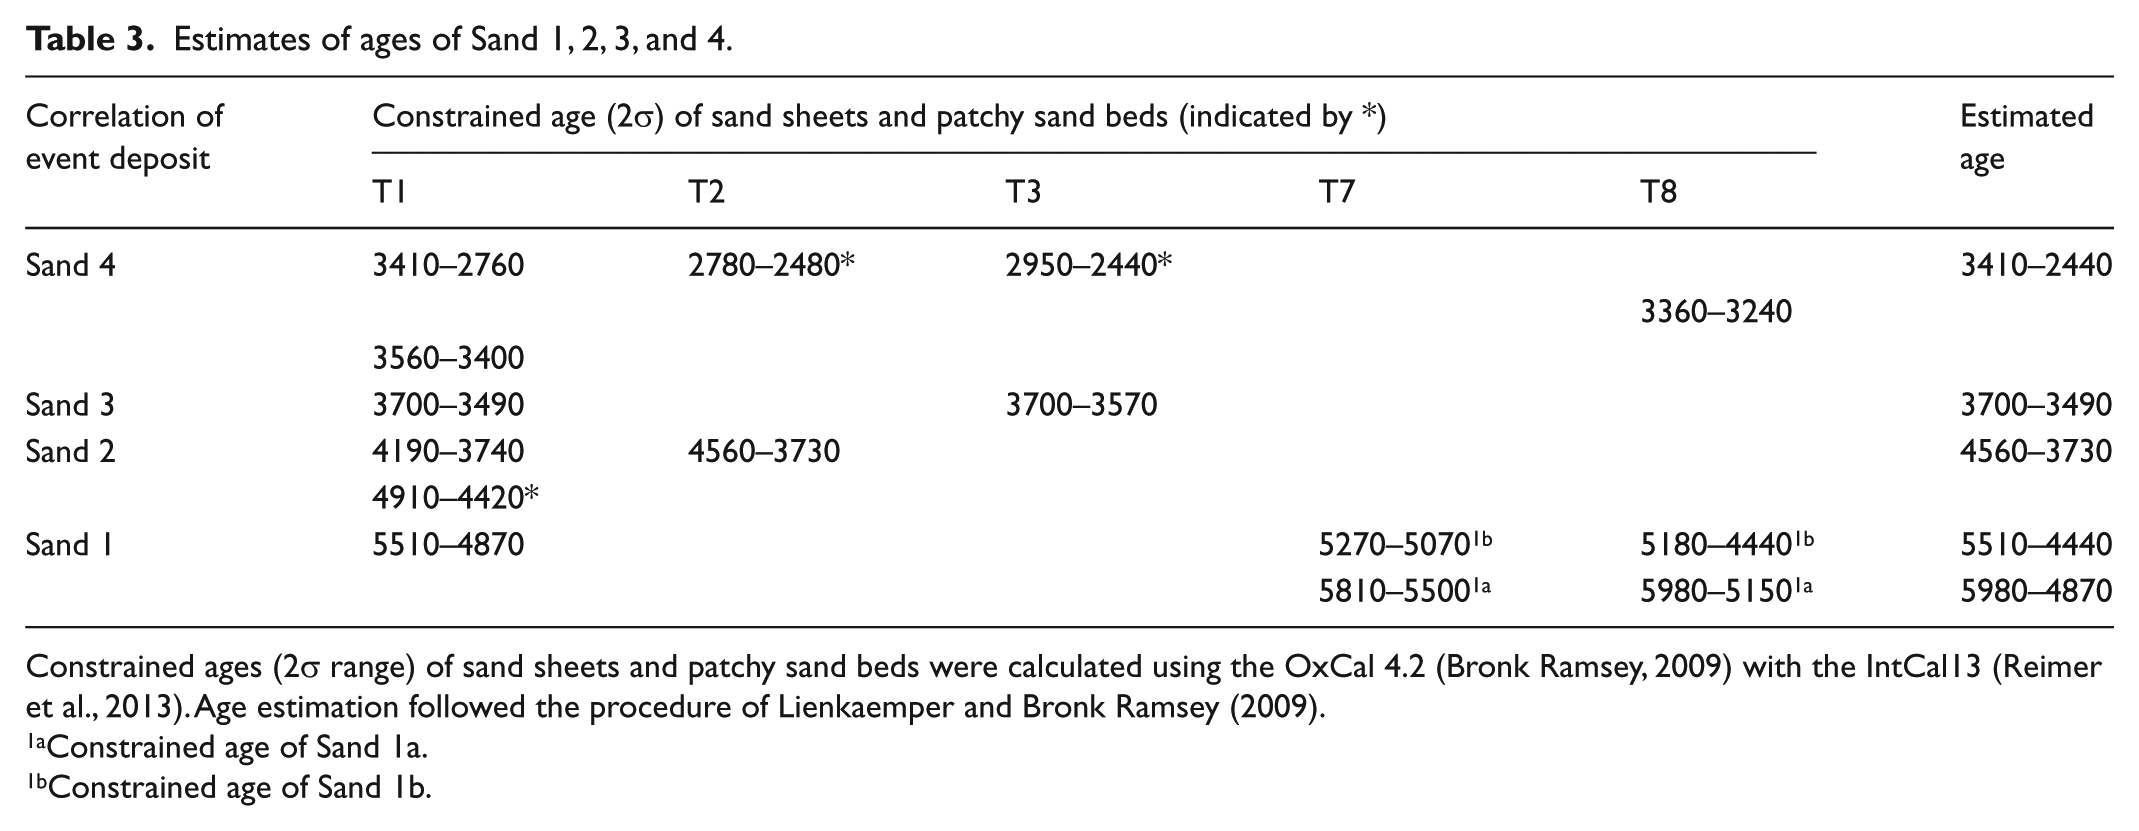
Constrained ages (2σ range) of sand sheets and patchy sand beds were calculated using the OxCal 4.2 (Bronk Ramsey, 2009) with the IntCal13 (Reimer et al., 2013). Age estimation followed the procedure of Lienkaemper and Bronk Ramsey (2009).
Constrained age of Sand 1a.
Constrained age of Sand 1b.
Depositional age of Sand 2 was constrained by four radiocarbon ages from T1 and T2 (Table 2). Constrained ages were 4190–3740 cal. BP for T1 and 4560–3730 cal. BP for T2 (Figure 5, Table 3), and we inferred the depositional age of Sand 2 to be 4560–3730 cal. BP.Depositional age of Sand 3 was constrained by four radiocarbon ages from T1 and T3 (Table 2). Constrained ages were 3700–3490 cal. BP for T1 and 3700–3570 cal. BP for T3 (Figure 5, Table 3), and we inferred the depositional age of Sand 3 to be 3700–3490 cal. BP.Depositional age of Sand 4 was constrained by six radiocarbon ages from T1, T2, and T3 (Table 2). Constrained ages were 3410–2760 cal. BP for T1, 2780–2480 cal. BP for T2, and 2950–2440 cal. BP for T3 (Figure 5, Table 3), and we inferred the depositional age of Sand 4 to be 3410–2440 cal. BP.
In the upper part of Unit 3 (above Sand 4), we recognized some thin lines of scattered sand, but there were no clear sand sheets and patchy sand beds (Figure 3c). Therefore, the record from the study site shows a gap of approximately 1500 years before Sand 4, the youngest event deposit of 3420–2440 cal. BP.
Fossil records
The uppermost part of Unit 2 contained benthic marine-brackish diatoms such as Diploneis novaeseelandiae, Diploneis smithii, Nitzschia scalaris, Petroneis marina, and Pinnunavis elegans (Figure 4). Marine-brackish diatoms made up more than 80% of the specimens counted. The most abundant species, P. elegans, is common on salt marshes, and D. smithii and P. marina are common on tidal flats (Chiba and Sawai, 2014; Witkowski et al., 2000).
Sand 1, just above Unit 2, contained mixed assemblages of abundant freshwater species and a few marine-brackish species. Planktonic Aulacoseira spp., inhabiting freshwater pond and marsh environments (Chiba and Sawai, 2014), were predominant in Sand 1.
The lower part of Unit 3 was dominated by freshwater species such as Aulacoseira spp., Fragilariforma exigua, Puncticulata praetermissa, Staurosira construens, Staurosirella pinnata, and Tabellaria spp., as well as a few freshwater-brackish (tolerates low salinity) species such as Pseudostaurosira brevistriata. The planktonic freshwater species Aulacoseira spp., P. praetermissa, and Tabellaria spp. accounted for 20–80% of the specimens counted throughout the lower part of Unit 3. Diatom assemblages in Sand 2, 3, and 4 were similar to those in the surrounding clay and peat in Unit 3.
Foraminiferal analyses of seven samples from Sands 1 to 3 in Unit 3 and five samples from Unit 2 yielded no forams. Plant macrofossils, obtained from above and below the sand sheets for radiocarbon dating (Table 1), included fruits of floating leaved plants such as Trapa spp. and Brasenia schreberi, and emergent plants such as Schoenoplectus spp. Of these, Trapa spp. and Schoenoplectus spp. were abundant in almost all samples from the geoslice at T1.
Discussion
Paleoenvironment inferred from fossil records
The sedimentary environment in the study area changed from marine to freshwater after the deposition of Sand 1 at 5510–4870 cal. BP (Table 3 and Figure 4). Diatom assemblages in the uppermost part of Unit 2, below Sand 1, were dominated by benthic marine-brackish species that are common in salt marshes and tidal flats (Chiba and Sawai, 2014; Witkowski et al., 2000) and indicate that the sediment accumulated in the intertidal zone. Diatom assemblages in the lower part of Unit 3, above Sand 1, were dominated by freshwater species, such as the planktonic Aulacoseira spp., that are typical in freshwater ponds and swamps (Chiba and Sawai, 2014), and abundant fruits of floating leaved plants and emergent plants, all indicative of freshwater ponds and/or swamps.
We attribute this change in sedimentary facies and environment to the isolation of tidal flats and salt marshes from the Pacific Ocean and their subsequent desalination during 5510–4870 cal. BP (Figure 4). The isolation may have been caused by the formation of a sand barrier and/or marine regression. In either case, the washover event that deposited Sand 1 must have eroded away the transition zone from marine to freshwater facies and created a discrepancy of more than 600 years between radiocarbon ages obtained from just above and below Sand 1. This interpretation is also consistent with the predominance of freshwater diatoms in Sand 1. This diatom composition suggests that eroded terrestrial deposit has been incorporated into Sand 1.
Alternatively, the change from marine-brackish clay at the top of Unit 2 to freshwater organic clay and peat at the base of Unit 3, separated by a sandy event deposit, was the result of coseismic uplift associated with a megathrust earthquake. This alternative interpretation may suggest that Sand 1 has been deposited by a tsunami associated with a different type of megathrust earthquake. Because, in historic time, the inner coast of Tosa Bay including the study site has repeatedly undergone coseismic subsidence (Table 1). For example, an earthquake with an unusually deep rupture along the subduction zone might cause the coseismic uplift in areas more distant from the trench axis. Further geological studies in adjacent areas are necessary to establish the coseismic displacement.
Origins of the event deposits
We recognized four sand sheets interbedded with clay and peat in the coastal deposit (Figure 3). Anomalous sand sheets within sediments typical of low-energy environments are commonly attributed to extreme waves including tsunamis, storm surges, and floods. Three lines of evidence point to marine inundations rather than floods. First, the study site is a small, isolated lowland fed by small streams that are incapable of producing large floods (Figure 1c). Second, all four sand sheets were distributed in the seaward part of the study site (Figure 3). Third, Sand 1 and 2 contain a few marine-brackish diatoms. Although the other two sand sheets contain few marine-brackish diatoms, the presence of few marine-brackish diatoms does not always rule out a marine origin. The 2011 Tohoku-oki tsunami deposits on the Sendai Plain (Szczuciński et al., 2012; Takashimizu et al., 2012) and the Misawa coast (Tanigawa et al., 2016) also had low abundances of marine-brackish diatoms. Tsunami waves entrain terrestrial soil that dilutes the concentration of marine-brackish diatoms in tsunami deposits. Limited and patchy distributions of Sand 3 and 4 may raise an alternative possibility of deposition by liquefaction (sand boiling). However, liquefaction is likely to be inappropriate for the origins of them. This is because there are no sand layers that can potentially lead to the sand boiling below Sand 3 and 4. Although, around T1, Sand 1 of ~15 cm thick might be the source of sand boiling, Sand 1 of up to 4 cm thick around T2 and T3 could not have caused sand boiling. Therefore, the sand sheets are probably marine origin, indicating they are formed by tsunamis or storm surges.
It is difficult to distinguish between tsunami and storm deposits in most studies (e.g. Atwater et al., 2017; Gouramanis et al., 2017; Sawai et al., 2015b; Switzer and Jones, 2008). The landward extent of event deposits might be one criterion, with the exception of extraordinary storms such as Typhoon Haiyan that transported deposit more than 1.6 km inland (Pilarczyk et al., 2016; Soria et al., 2017). Storm deposits commonly extend no more than several hundred meters from the shoreline, whereas tsunami deposits may extend much farther inland (e.g. Goff et al., 2004; Morton et al., 2007). As the positions of the paleo-shoreline when the marine inundations occurred are unknown, we are uncertain as to whether the sand sheets deposited as a result of tsunamis or storm surges based on the inundation distance. Moreover, we argue below that the beach ridges existing in 5970–2440 cal. BP were probably narrower and lower than the present ones, thus the study site was more easily inundated than today.
The number of documented storm surges is much larger than that of tsunamis in the last 400 years (Table 1). If storm surges had left the washover deposits in the studied lowland, much more sand sheets might be found within Unit 3. In fact, there are no historical records of coastal inundations by storm surges, comparable to tsunami inundations, in this area. These facts indicate that tsunamis were more likely to form sandy event deposits than usual storms. Therefore, we conclude that the four sand sheets were deposited by tsunamis or unusually large storm surges.
Frequency and timing of marine inundation events
As one possibility, assuming that all four sand sheets were deposited by tsunamis, it gives a frequency of four tsunamigenic earthquakes during the 3500-year period of 5970–2440 cal. BP (Figure 3c, Table 3). This apparent frequency of tsunamis is quite low given the nine major earthquakes along the western Nankai Trough in the last 1300 years (Figure 2). If some of the sand sheets are the result of storm surges, the frequency of tsunamigenic earthquakes is even lower. We attribute this apparent difference in frequency to three possible causes. First, the difference may reflect the low preservation potential of event deposits. Studies of modern sandy tsunami deposits have reported that their thicknesses and extents decrease within a few years (e.g. Bahlburg and Spiske, 2015; Szczuciński, 2012). Second, all the megathrust earthquakes may not generate sizeable tsunamis enough to leave tsunami deposits in the lowland. Third, Unit 3 may not preserve continuous records owing to depositional hiatuses. Although the sedimentation rates in Unit 3 differed at sites T1, T7, and T8, there were no observable changes in sedimentary facies in Unit 3 other than the sand sheets (Figures 4, S4, and S5). These three cases could have occurred simultaneously.
We found no clear event deposits in the upper part of Unit 3 dating from the ~1500 years before 960 cal. BP (Figure 3c, Table 3). The lack of evidence of the marine inundation in the late Holocene probably reflects not only the low preservation potential of event deposits but also changes in coastal geomorphology. However, there have been no geomorphological studies of beach ridges along the coast of Kochi Prefecture. After the deposition of Sand 1, the stable sea levels of the Japanese Islands during the middle to late Holocene (e.g. Umitsu, 1991) likely have allowed beach ridges to grow wider and higher toward their current size of 14 m height and 400 m width. The growth of beach ridges could have progressively weakened or prevented marine flooding during the middle to late Holocene.
Although the estimated event ages in this study have intrinsic uncertainties of several to 10 centuries (Table 3), the evidence supports four marine inundation events during 5970–2440 cal. BP. In this time interval, some studies found geological and geomorphological evidences in and around Kochi Prefecture (washover deposits in coastal ponds: Nanayama et al., 2002; Okamura and Matsuoka, 2012 turbidites: Iwai et al., 2004; coseismic uplifts: Maemoku (1988, 2001; Shishikura et al., 2008). By using limiting maximum and minimum ages derived from plant macrofossils, we provide more precise age constraints of paleo events than these studies. Our results demonstrate the need to reconsider the timing, recurrence intervals of the Nankai Trough earthquakes.
Conclusion
We documented four sand sheets interbedded with clay and peat beneath a coastal lowland in Nankoku, adjacent to the Nankai Trough. Diatom evidence, radiocarbon dates, and the coast normal distribution of these event deposits suggest that they were formed by tsunamis or extraordinary storms between 5970 and 2440 cal. BP. No event deposits were found with dates between 2440 and 930 cal. BP. This may be because development of beach ridges protected the site from tsunamis and storm surges. The frequency of marine inundations between 5970 and 2440 cal. BP, four events in 3500 years, is much lower than the historical tsunamigenic earthquake record along the Nankai Trough. We presented better constrained event ages than previous studies in this time interval. The event ages will aid in understanding the long-term earthquake history.
Footnotes
Acknowledgements
Landowners gave us permission to take sediment samples. We thank members of staff at Kochi Prefecture and Nankoku City offices for helping our drilling survey. We thank Dr Yuki Sawai for his help picking plant macrofossils, conducting the topographical survey, and fruitful comments. We also thank Dr Yasuto Kuwahara and Dr Yukinobu Okamura for their valuable suggestions. Dr Adam Switzer and an anonymous reviewer provided constructive reviews that substantially improved the manuscript.
Funding
This study was supported by funding from the ‘Research Project for Compound Disaster Mitigation on the Great Earthquakes and Tsunamis around the Nankai Trough Region’ by the Ministry of Education, Culture, Sports and Technology of Japan.
References
Supplementary Material
Please find the following supplemental material available below.
For Open Access articles published under a Creative Commons License, all supplemental material carries the same license as the article it is associated with.
For non-Open Access articles published, all supplemental material carries a non-exclusive license, and permission requests for re-use of supplemental material or any part of supplemental material shall be sent directly to the copyright owner as specified in the copyright notice associated with the article.