
Abstract
Dates for early cultivation in Finland obtained from pollen analysis and remains from archaeological sites are compared with the changes in population size derived from the summed calendar-year probability distributions. The results from these two independent proxies correlate strongly with one another indicating that population size and the advance of farming were closely linked to each other. Moreover, the results show that the adaptation and development of farming in this area was a complex process comprising several stages and with major differences between regions The most intensive expansion having occurred in and after the Iron Age. It is therefore more accurate to describe the introduction of farming into the area as a long-lasting process, rather than an event.
Keywords
Introduction
Discussions of prehistoric farming often focus on its earliest appearance. The date of the start of farming in Finland is the subject of debate. Recent discussions have argued for dates anywhere between 5000 BC to the final millennium BC (Alenius, 2011; Alenius et al., 2013; Bläuer et al., 2013; Lahtinen and Rowley-Conwy, 2013; Mökkönen, 2010). However, it is the question of not only when farming was first practised in Finland that is of interest but also the particular processes involved with its spread throughout the country. This aspect of the phenomenon has been neglected, which reveals an implicit assumption that farming was present throughout the area when it is first observed in one location, something only previously discussed by Vuorela and Hicks (1996) – see below. Understanding the process by which farming practices advanced could contribute to the more general discussion of the spread of farming in other marginal areas throughout the Northern Hemisphere. In this paper, we will discuss when farming spread into the different parts of Finland and link this to the changes in population size starting around the time of the Bronze Age (Tallavaara et al., 2010). While the focus of this paper is on the spread of farming, it also discusses agricultural intensification within the Eastern Fennoscandia.
In most areas, farming causes a significant increase in productivity which, in turn, causes population density to increase. In Europe and North America, this increase in population size has been studied using summed calendar-year probability distributions (spds) of radiocarbon dates. In Britain, France and Denmark, population size increased rapidly after the arrival of farming (Collard et al., 2010; Shennan et al., 2013; Timpson et al., 2014). Collard et al. (2010) also showed that the earliest cereal macrofossil dates correspond with an increase in the number of radiocarbon dates on other materials which are used as a proxy for population size in their study. In Finland, estimates of population size based on radiocarbon dates covering most of Finland have recently been published (Oinonen et al., 2010; Tallavaara et al., 2010). Furthermore, a link between radiocarbon date–based population levels and agriculture has been qualitatively proposed by Tallavaara et al. (2010).
In this paper, we focus on the quantitative pollen evidence from Finland as a proxy for early farming. We consider that single grains of cereal-type pollen do not constitute reliable indicators of the presence of cultivation, for the reasons discussed by Lahtinen and Rowley-Conwy (2013). In this study, we use the earliest continuous curve of cereal-type pollen. Chronological data on the earliest observations of continuous cereal-type pollen are converted into spds that contain information on the time and magnitude of the advance of cultivation within the area. We also created an artificial reference data set of equidistant radiocarbon dates and compared the spds generated from this with the cereal pollen spds, and also with archaeological radiocarbon dates. The ‘artificial’ spd was created in order to examine the possible effects of the radiocarbon calibration process and the ‘archaeological’ and ‘pollen’ spds to analyse the links between human activity and cereal cultivation.
The spread of farming in Eastern Fennoscandia
The advance of farming based on pollen evidence has been discussed previously in two review papers (Donner, 1984; Vuorela and Hicks, 1996). Donner (1984) studied pollen results from south Finland. His conclusions were first, that there is only sporadic evidence of farming in the form of single grains of cereal-type pollen during the Bronze Age (1500 BC–500 BC) that could indicate cultivation, but that most signs of cultivation in pollen analyses can be seen during the Iron Age (500 BC–AD 1200) and second, that the introduction of rye is visible in pollen cores between AD 450 and 1000. Vuorela and Hicks (1996) estimate the spread of farming also based solely on pollen analysis. They include every single cereal-type pollen grain as evidence and conclude that farming first started in the south-west of Finland approximately 4000 ago and spread very quickly across the country. It has already been pointed out (Lahtinen and Rowley-Conwy, 2013; Simola, 1999) that this synthesis is based on the uncritical use of pollen studies and thus is very likely flawed. Furthermore, it leaves out the important question of how farming spread throughout the country. This question is highly significant to the issue of whether farming was introduced by immigrants, adopted by locals, or through a combination of both (Galeta et al., 2011). It can be assumed that if there was significant immigration into Finland, this could mean a fast introduction of farming into the most favourable areas (such as Southwest Finland) and a significant population increase.
Direct evidence for cereal cultivation in the form of macrofossils has not been collected systematically, and thus it is impossible to estimate the advance of farming practices in the area based on macrofossils. No evidence of cereal macrofossils dated to before the last millennium BC has been well supported (Lahtinen and Rowley-Conwy, 2013). Although controversial, macrofossils from Niuskala (1891–1018 cal. BC; Vuorela and Lempiäinen, 1988) and Kitulansuo (1400–1048 cal. BC; Lavento, 1998) precede this (see Lahtinen and Rowley-Conwy, 2013). It is likely that more macrofossils will be discovered in the future which will increase our knowledge on farming practices, but currently the lack of them limits interpretation. Lack of macrofossils is also a problem in the Iron Age (500 BC to 13th-century AD) and Medieval (13th-century AD to 16th-century AD) periods in many areas of Finland because most archaeological excavations are carried out in the south, creating a geographic bias in data representation. Nor can the advance of farming be estimated from tools or archaeological sites because of a lack of evidence for farming-related activities before the Medieval period (Mikkola, 2009). This could be because of recovery bias as most excavated sites are cemeteries, single objects, or hoard finds (Mikkola, 2009). This makes it very difficult to use archaeology to document migrations or carry out research on the establishment of new settlements or small-scale variations in farming practices.
It has been suggested that farming did not spread to many areas of Finland until as late as the Medieval period (in Finland, the 13–16th-century AD) or even the Early Modern period (Enbuske, 2006; Keränen, 1984; Orrman, 1991, 2003; Soininen, 1957; Taavitsainen et al., 1998; Zvelebil, 2010). This large-scale advance of farming has been seen as an independent event in the Medieval period. However, this assumption is based solely on very limited historical material. Korpela (2012) strongly objects to the theory of migration into Eastern Finland during the late Medieval period, claiming that the idea is based solely on historical documents that are very likely biased. He argues that farmers become visible in remote areas only when the Swedish or Novgorod states and churches were established and began keeping records. Thus, this assumed migration into new areas might reflect the establishment of centralised authority and record keeping, not actually a new occupation. Korpela (2012) suggests that it is very likely that the inner part of Finland was not empty, nor was wilderness used in the way that Taavitsainen et al. (1998; Luukko, 1959; Taavitsainen, 1987, 2004) have suggested. Permanent occupation could have reached remote areas, but because of the lack of a central administrative system there are no records of this. They further suggest that pollen analysis has shown evidence of cultivation in these areas during the periods of the claimed migrations. Thus, this model of medieval advancement remains hypothetical.
Dating of pollen analysis
Establishing chronological timelines for events through high-resolution dating methods is a major objective in all fields of archaeology and palaeobotany. It is particularly important when case studies are compared with one another. Only then is it possible to determine whether different events are simultaneous and thus connected to each other. In pollen studies, the most common methods used are radiocarbon, varve, or palaeomagnetic dating. However, there is always a degree of uncertainty in the results, and they should always be critically examined and discussed in light of potential variability because of the differences in materials and methods.
Varve dating is based on the calculation of annual laminated sediment layers deposited in lakes. This can be studied only in very specific sedimentation environments where lamination is not disturbed during the formation of each varve. Typically, these environments are small lakes that are topographically closed or sheltered. Varve dating is the most precise dating method available for pollen cores, and if there is little disturbance in such an environment the pollen profiles are also often very reliable. However, this method can be problematic because of missing varves, issues with the identification of individual varve layers and underestimation of sediment disturbance (Ojala et al., 2012).
Radiocarbon dating from bulk sediment has long been known to result in dates that can be too old or recent in sediment age-depth models. In Finland, the difference between varve and bulk sediment radiocarbon dates has been as much as 1500 years (Alenius et al., 2011; Tolonen, 1978a, 1978b, 1980, 1981). Improvements in calibration have narrowed this difference in some studies (see Table 1), which suggest that the offset might be smaller than was previously estimated. Finnish bedrock is not rich in carbonates, so this difference is not likely because of the effect of hard water, but is more likely because of the recycling of old organic carbon in the lake catchment area. Similar effects have been recorded in Sweden (Stanton et al., 2010; Zillén et al., 2003). Based on the above, corrections towards true ages may be worthwhile for bulk sediment radiocarbon dates.
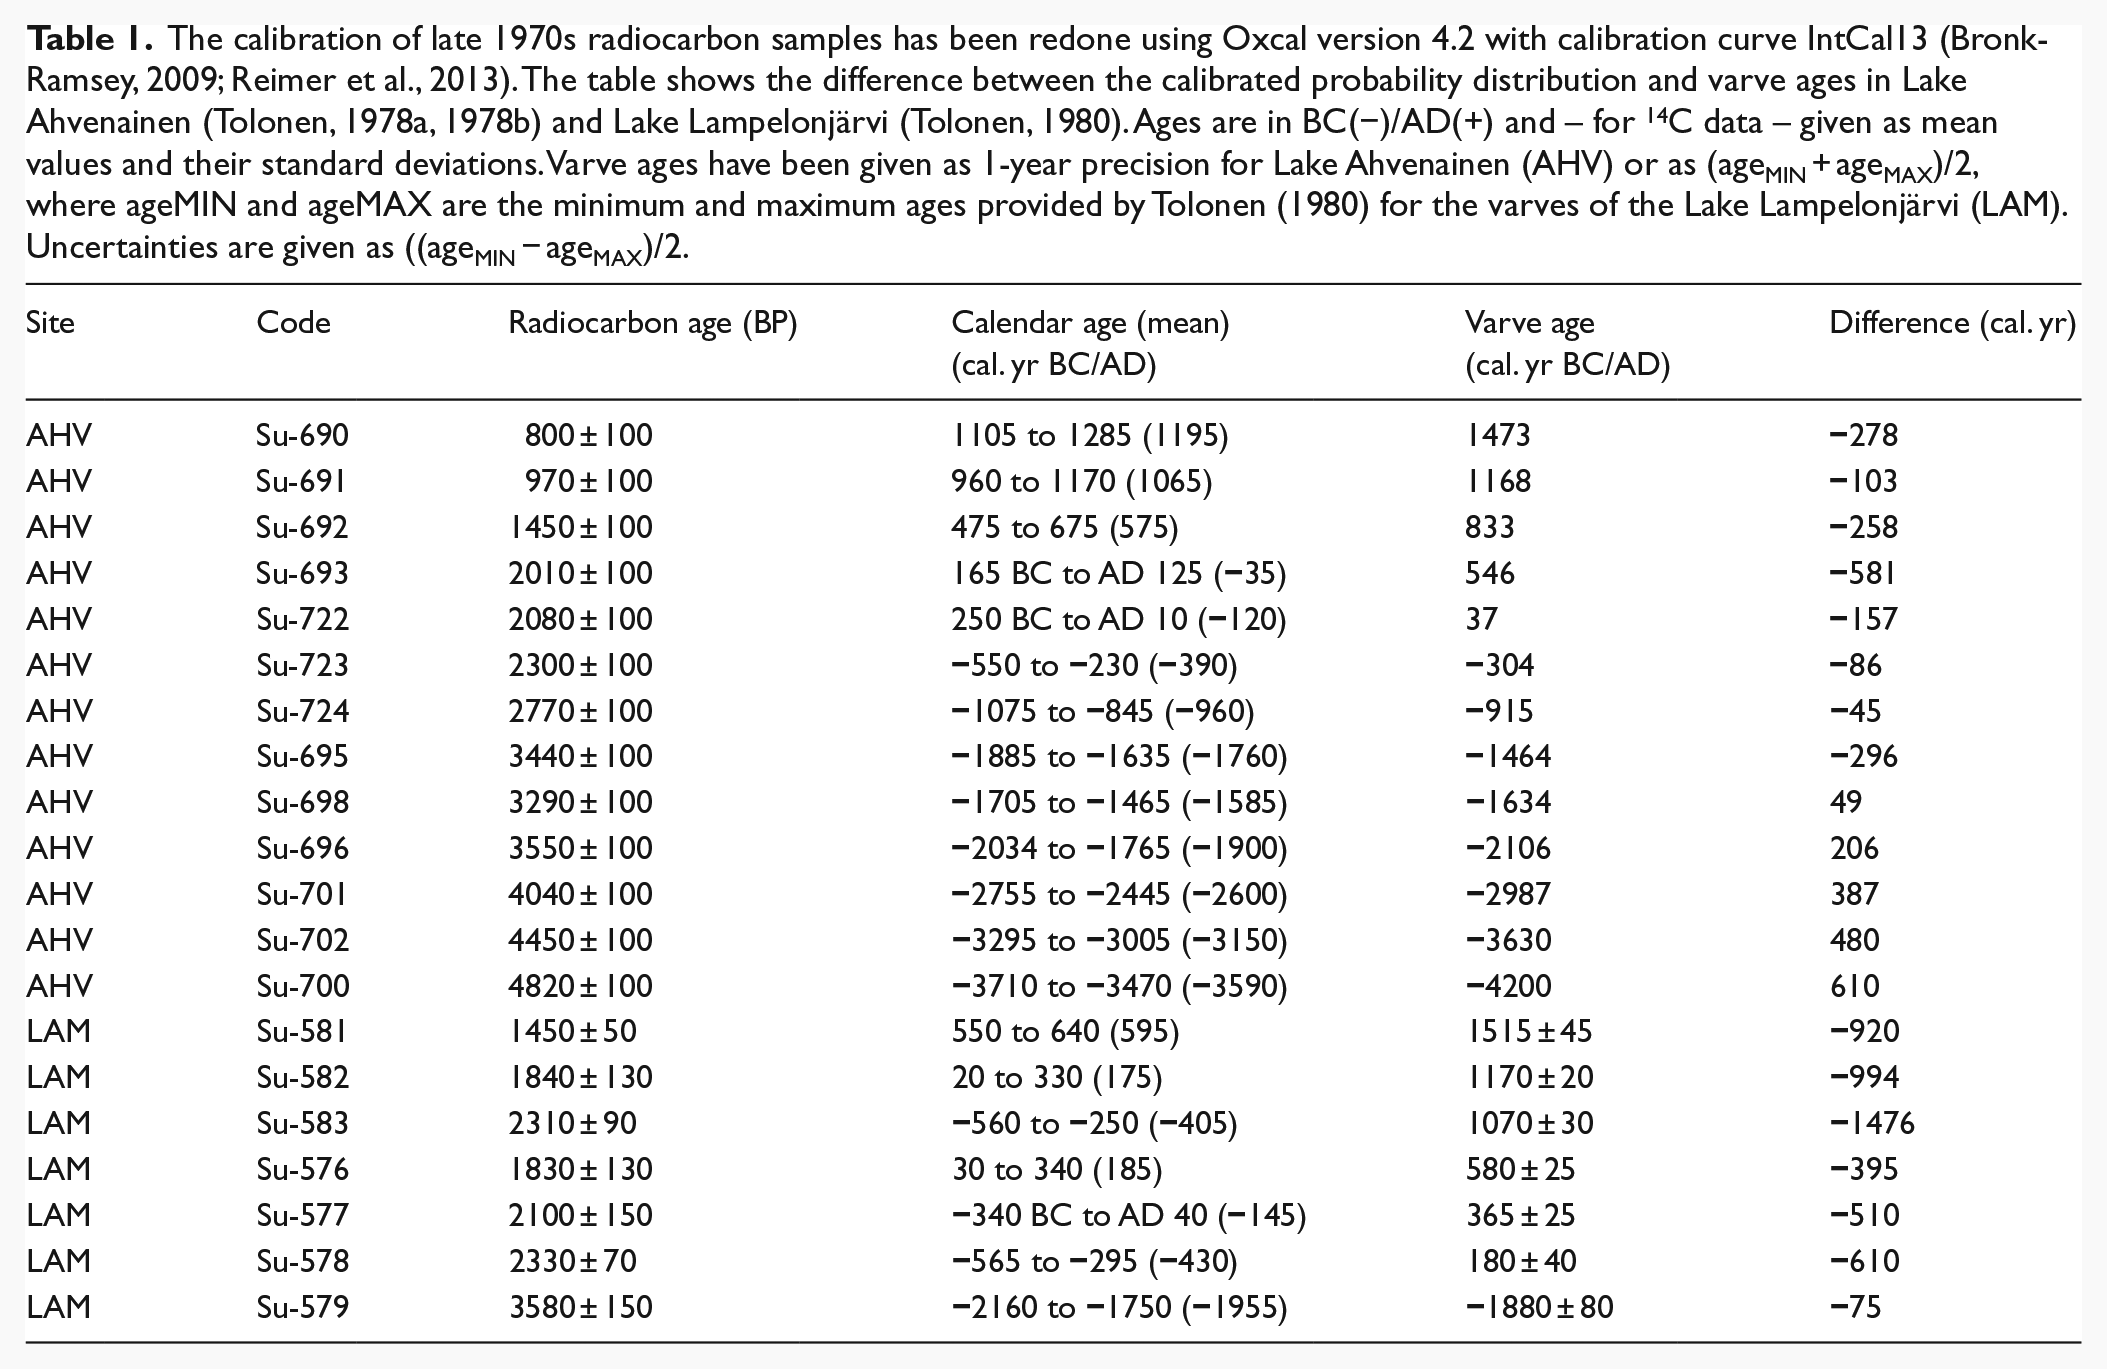
The calibration of late 1970s radiocarbon samples has been redone using Oxcal version 4.2 with calibration curve IntCal13 (Bronk-Ramsey, 2009; Reimer et al., 2013). The table shows the difference between the calibrated probability distribution and varve ages in Lake Ahvenainen (Tolonen, 1978a, 1978b) and Lake Lampelonjärvi (Tolonen, 1980). Ages are in BC(−)/AD(+) and – for 14C data – given as mean values and their standard deviations. Varve ages have been given as 1-year precision for Lake Ahvenainen (AHV) or as (ageMIN + ageMAX)/2, where ageMIN and ageMAX are the minimum and maximum ages provided by Tolonen (1980) for the varves of the Lake Lampelonjärvi (LAM). Uncertainties are given as ((ageMIN − ageMAX)/2.
Radiocarbon dating from bog peat samples has been shown to be more reliable because the organic material has grown in-situ and, unlike in lakes, there is less significant carbon recycling (Goslar et al., 2005). Studies show that pure sphagnum (peat moss) samples are very suitable for carbon dating and one study even suggests that there is no reservoir effect when only sphagnum leaves are used in dating samples (Blaauw et al., 2004).
Furthermore, the calibration process of radiocarbon dates may induce magnified peaks when summing the individual calendar-year probability distributions into one common distribution (Brown, 2015; Michczyńska et al., 2007; Williams, 2012), as is done in this study. This is largely because of the steep slopes of the calibration curve that concentrate the calendar-year probability into these periods of time. Regardless of these slopes, summarised distributions can still contain valid information, and the peaks are therefore not totally spurious. Furthermore, calibration curve plateaux cause an opposite effect by spreading the calendar-year probability distribution across broader periods of time. The location and magnitude of these effects can be assessed by comparing them to the spd of the series of equidistant, artificial radiocarbon dates throughout the study period. In addition, it has been suggested that for the Holocene these effects could be smoothed by applying a 500-year running average of the summed probability distributions (Brown, 2015). The two opposite effects of peaking and broadening thus to some extent cancel each other out.
Palaeomagnetic dating is based on measuring the palaeomagnetic secular variation (PSV) observed from several different proxies (Holcomb, 1986; Lund, 1996). This variation is seen in the sediment’s magnetic orientation (natural remanent magnetisation), and when compared with known changes in the Earth’s magnetic field, it can be used for dating sediment layers (Creer, 1982; Mackereth, 1971). In other words, it is a relative tool that is calibrated with other dating methods, such as varves or radiocarbon from other environments in close proximity. The advantage of this method is that it can be used to date lake sediments which would otherwise provide misleading radiocarbon dates because of carbon recycling, because it is not dependent on dating in a single sedimentation environment (Mackereth, 1971). Several studies suggest that it is highly precise (error 50–100 years) in lakes in Finland (Haltia-Hovi et al., 2010; Kotilainen et al., 2010).
In summary, each dating method has particular issues and different levels of uncertainty that cannot always be estimated, and it is important to understand that accuracy to within less than 100 years is simply impossible. The margin of error is likely to be significantly greater. In addition, the role of the radiocarbon calibration process should be considered. Despite this, we expect to observe summed and averaged calendar-year probability distributions displaying trends of cultivational development within the study area. Moreover, by combining several published studies, we try to minimise the possibility of interpreting or over-emphasising any one case study.
Materials and methods
The data cover published and unpublished institutional reports of pollen studies conducted in Finland and the surrounding areas. The total number of studies used in this work is 112. This data set provides the best current approximation for the spread of farming within the country. The data are presented in Table 2.
The radiocarbon dates from pollen analysis used in this study. The results of calibrated radiocarbon dates are given as 95.4% confidence ranges.
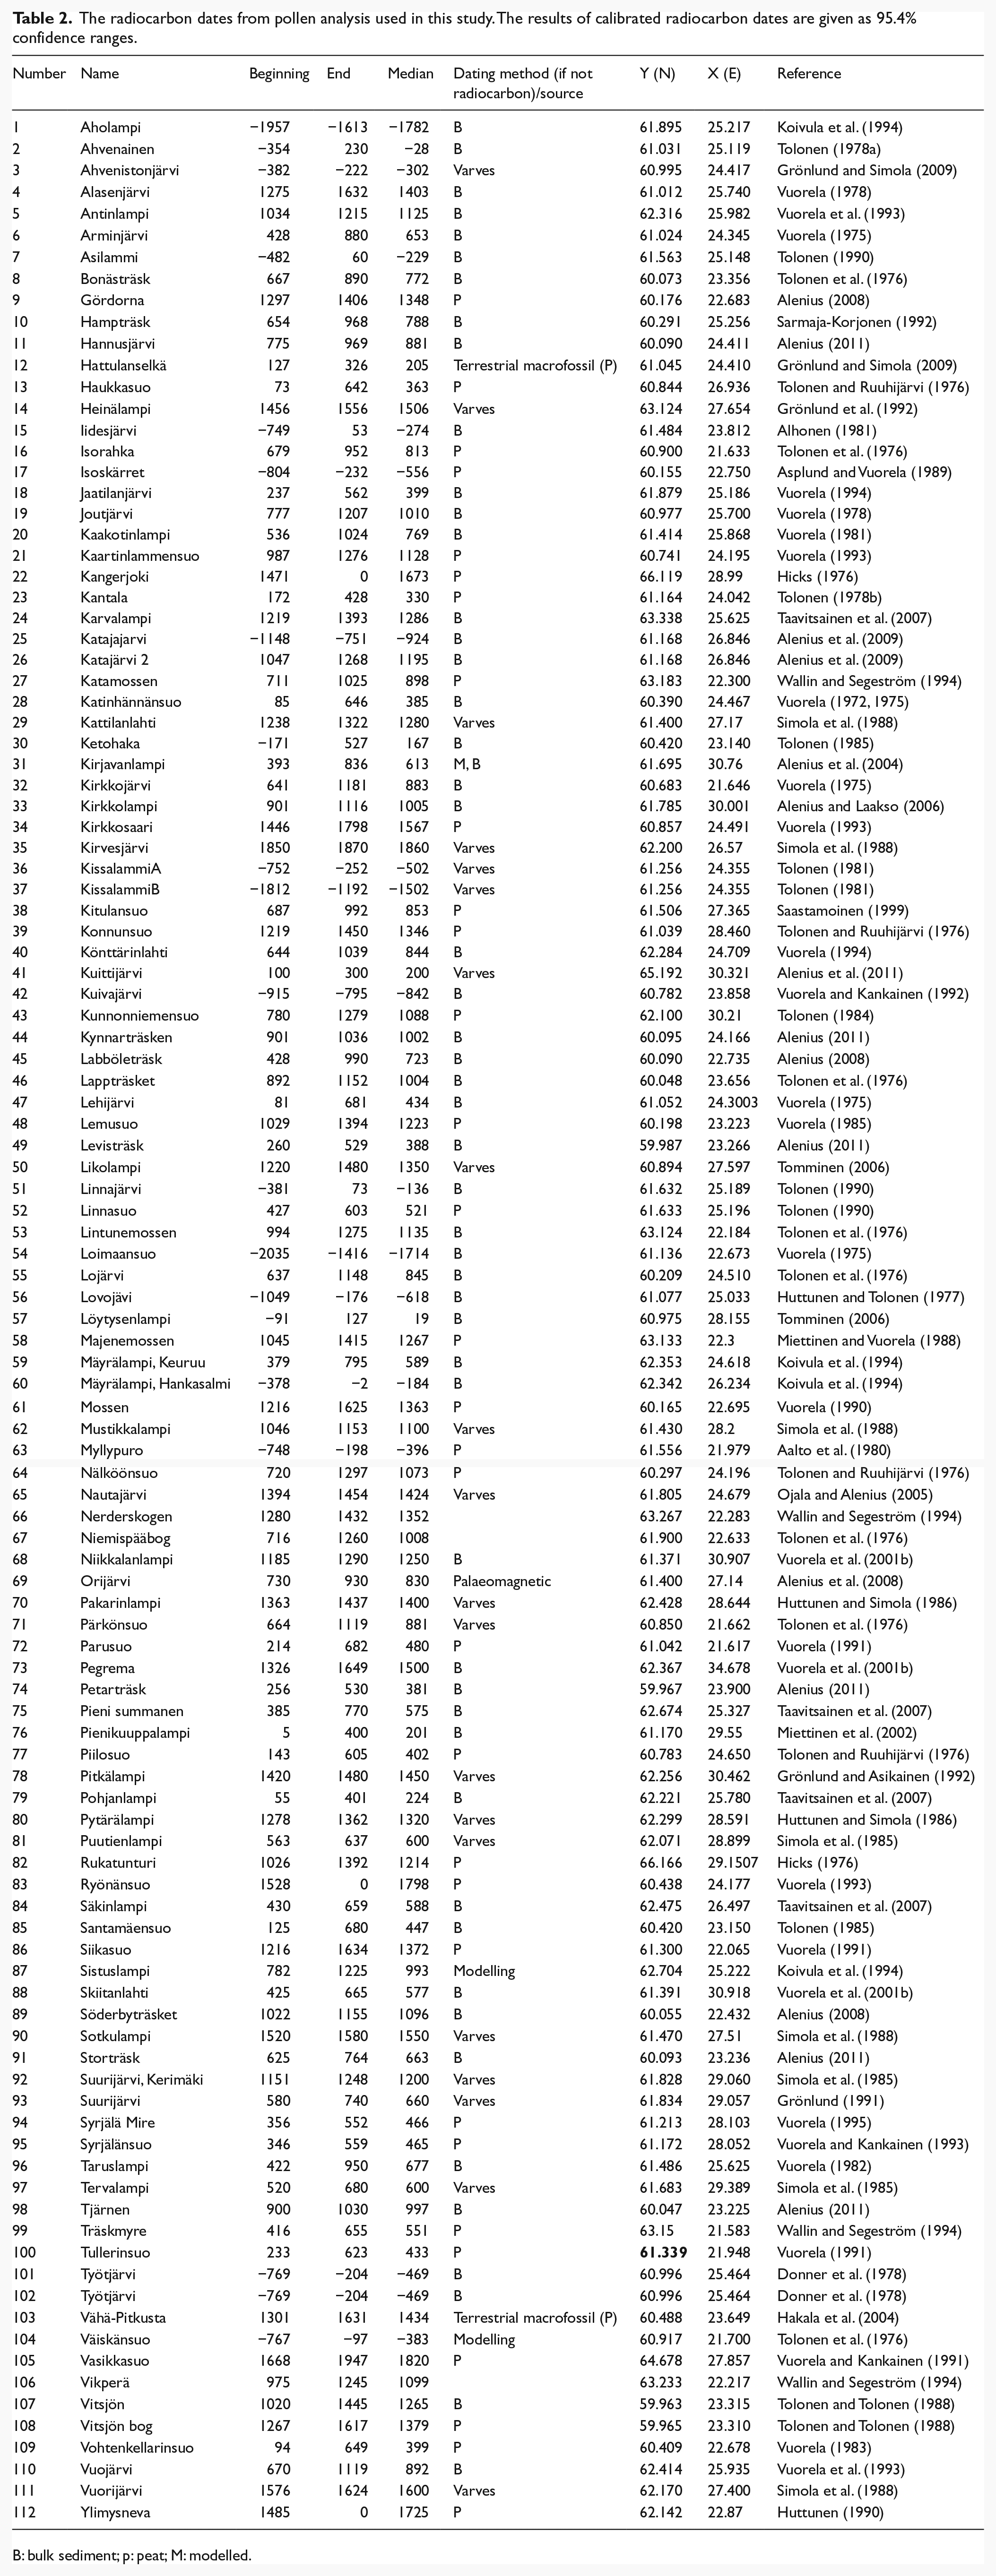
B: bulk sediment; p: peat; M: modelled.
The data consist of radiocarbon dates of pollen studies where a continuous cereal-type pollen curve has been observed. The date of the layer where the first indication of cereal-type pollen was visible is entered into the database. In several pollen records, cereal-type pollen shows a hiatus. In these cases, both available radiocarbon dates are included. If the layer with the early signal was not dated, it is interpolated with the Bayesian data analysis tool with Oxcal (version 4.2; Bronk-Ramsey, 2009). In summary, sites were excluded if (1) the data needed extrapolation (the layer was not dated itself, and it did not lie in between radiocarbon dated layers), (2) the error margins could not be estimated and (3) the dating was considered considerably too old and erroneous by the original authors. None of the sites was excluded on the basis that the event itself did not fit in with the wider picture of the beginning of the cultivation in Finland.
Dates were calibrated with Oxcal (version 4.2, Bronk-Ramsey, 2009) using calibration curve Intcal13 (Reimer et al., 2013). Calibration was performed even if a calibrated date was already published, in order to make the data set more comparable and accurate, especially in the case of older studies. The resulting individual calendar-year probability distributions (spd) were then summed to a single distribution. Normally distributed calendar-year probability distribution of varve and palaeomagnetic dates was also summed to yield summed spds for each dating method used for comparison. Most of the varve studies used did not provide an error estimation. However, in Finland, errors are typically 1–3% (Ojala et al., 2012). We adapted a 3% margin of error for all varve dates to reflect this.
The resulting total sum distribution was compared with the spd of the archaeological radiocarbon data from southern Finland discussed by Tallavaara et al. (2010) and Oinonen et al. (2010). This contains 465 radiocarbon dates ranging from 9480 to 800 BP. As described by Oinonen et al. (2010), many of these dates have been published in the Radiocarbon Dates List – documents (I–VI), and recently as part of an online database (Junno et al., 2016). This data set has been complemented by unpublished dates released to us by archaeologists and/or their institutes. Unfortunately, permissions to use these latter dates cover only the sum distributions, thus preventing us from publishing individual dates.
To investigate the possible effects of the radiocarbon calibration process, we established a set of artificial and equidistant radiocarbon dates through the study period of 3000 BC–AD 1950 (that is approximately 4300–0 BP) with 40 radiocarbon years between them and with ±40 radiocarbon-year standard deviations. This totals 124 artificial and equidistant dates to be compared with the full data set of 112. Because of the assumed recycling of old carbon in bulk dates, we have adopted a factor to correct these based on the recalibrated radiocarbon dates and varve ages from Lake Ahvenainen (Tolonen, 1978b) and Lake Lampelonjärvi (Tolonen, 1980). This average factor is ΔT = 250 years (see Table 1), meaning the bulk ages are, on average, 250 years too old compared with the varve. The large standard deviation, averaging 510 years, indicates that an even larger correction factor might be necessary.
The spds of artificial, archaeological and pollen data sets in the range 2500 BC–AD 1200 have been explored using principal component analysis (PCA) to identify independent factors responsible for the distributions. The resulting spds were also smoothed by 500-year running averages to suppress the calibration effects in the radiocarbon data. As a comparison, the smoothing was also performed on the results of Tallavaara et al. (2010). To discuss the results with consistency, we have defined threshold values T10 and Tmax which are times when the calendar-year probability reaches 10% of a peak maximum and maximum, respectively. These are used to provide quantitative estimates for the advance of cultivation.
Results
As already mentioned, the accuracy of each dating method varies, possibly introducing systematic biases into distributions. In the following, we assume that the varve and palaeomagnetic data from the pollen analysis provide the most accurate (not necessarily most precise) distributions free of systematic effects. The averaged pollen analysis spds of the different dating methods were compared with the averaged spds of this varve and palaeomagnetic data. The 250-year shift of the bulk sediment spd, observed in recalibrated dates from (Tolonen, 1978b, 1980), improves the correlation between the distributions drastically from r = 0.36 (bulk vs varve and palaeomagnetic spds) to r = 0.68 (shifted bulk vs varve and palaeomagnetic spds). This adds confidence to our correction procedure. It is noteworthy that the correlation coefficient (shifted bulk vs varve and palaeomagnetic spds) increases with larger shifts, until the shift reaches ΔT = 700 years, indicating that the correction could be even larger. Even though we do not have solid evidence for applying a similar correction procedure for peat dates, the same test was carried out between averaged peat spd and varve and palaeomagnetic spd. In this case, the best correlation was obtained when peat spd was not shifted at all (r = 0.54). We interpret this as an indication that the peat dates do not require correction. The total spd summing all the pollen data was made based on these considerations.
The cumulative geographical distribution of the mean radiocarbon dates of the pollen data for the different periods is presented in Figure 1. The sum distributions of artificial, archaeological and pollen data are presented in Figure 2 together with breakdowns of the latter into different dating methods. The calibration process itself introduces a few magnified peaks into the summed probability distribution (Figure 2a) at around 800 BC, 400 BC, AD 600–700, AD 1000 and AD 1300–1400 (a double peak), and this should be taken into account when interpreting the results. All the calibration-induced peaks can possibly be identified from the bulk sediment spd and also from the archaeological data. Particularly, the effect is pronounced at 800 BC, AD 600–700, AD 1000 and AD 1300–1400.
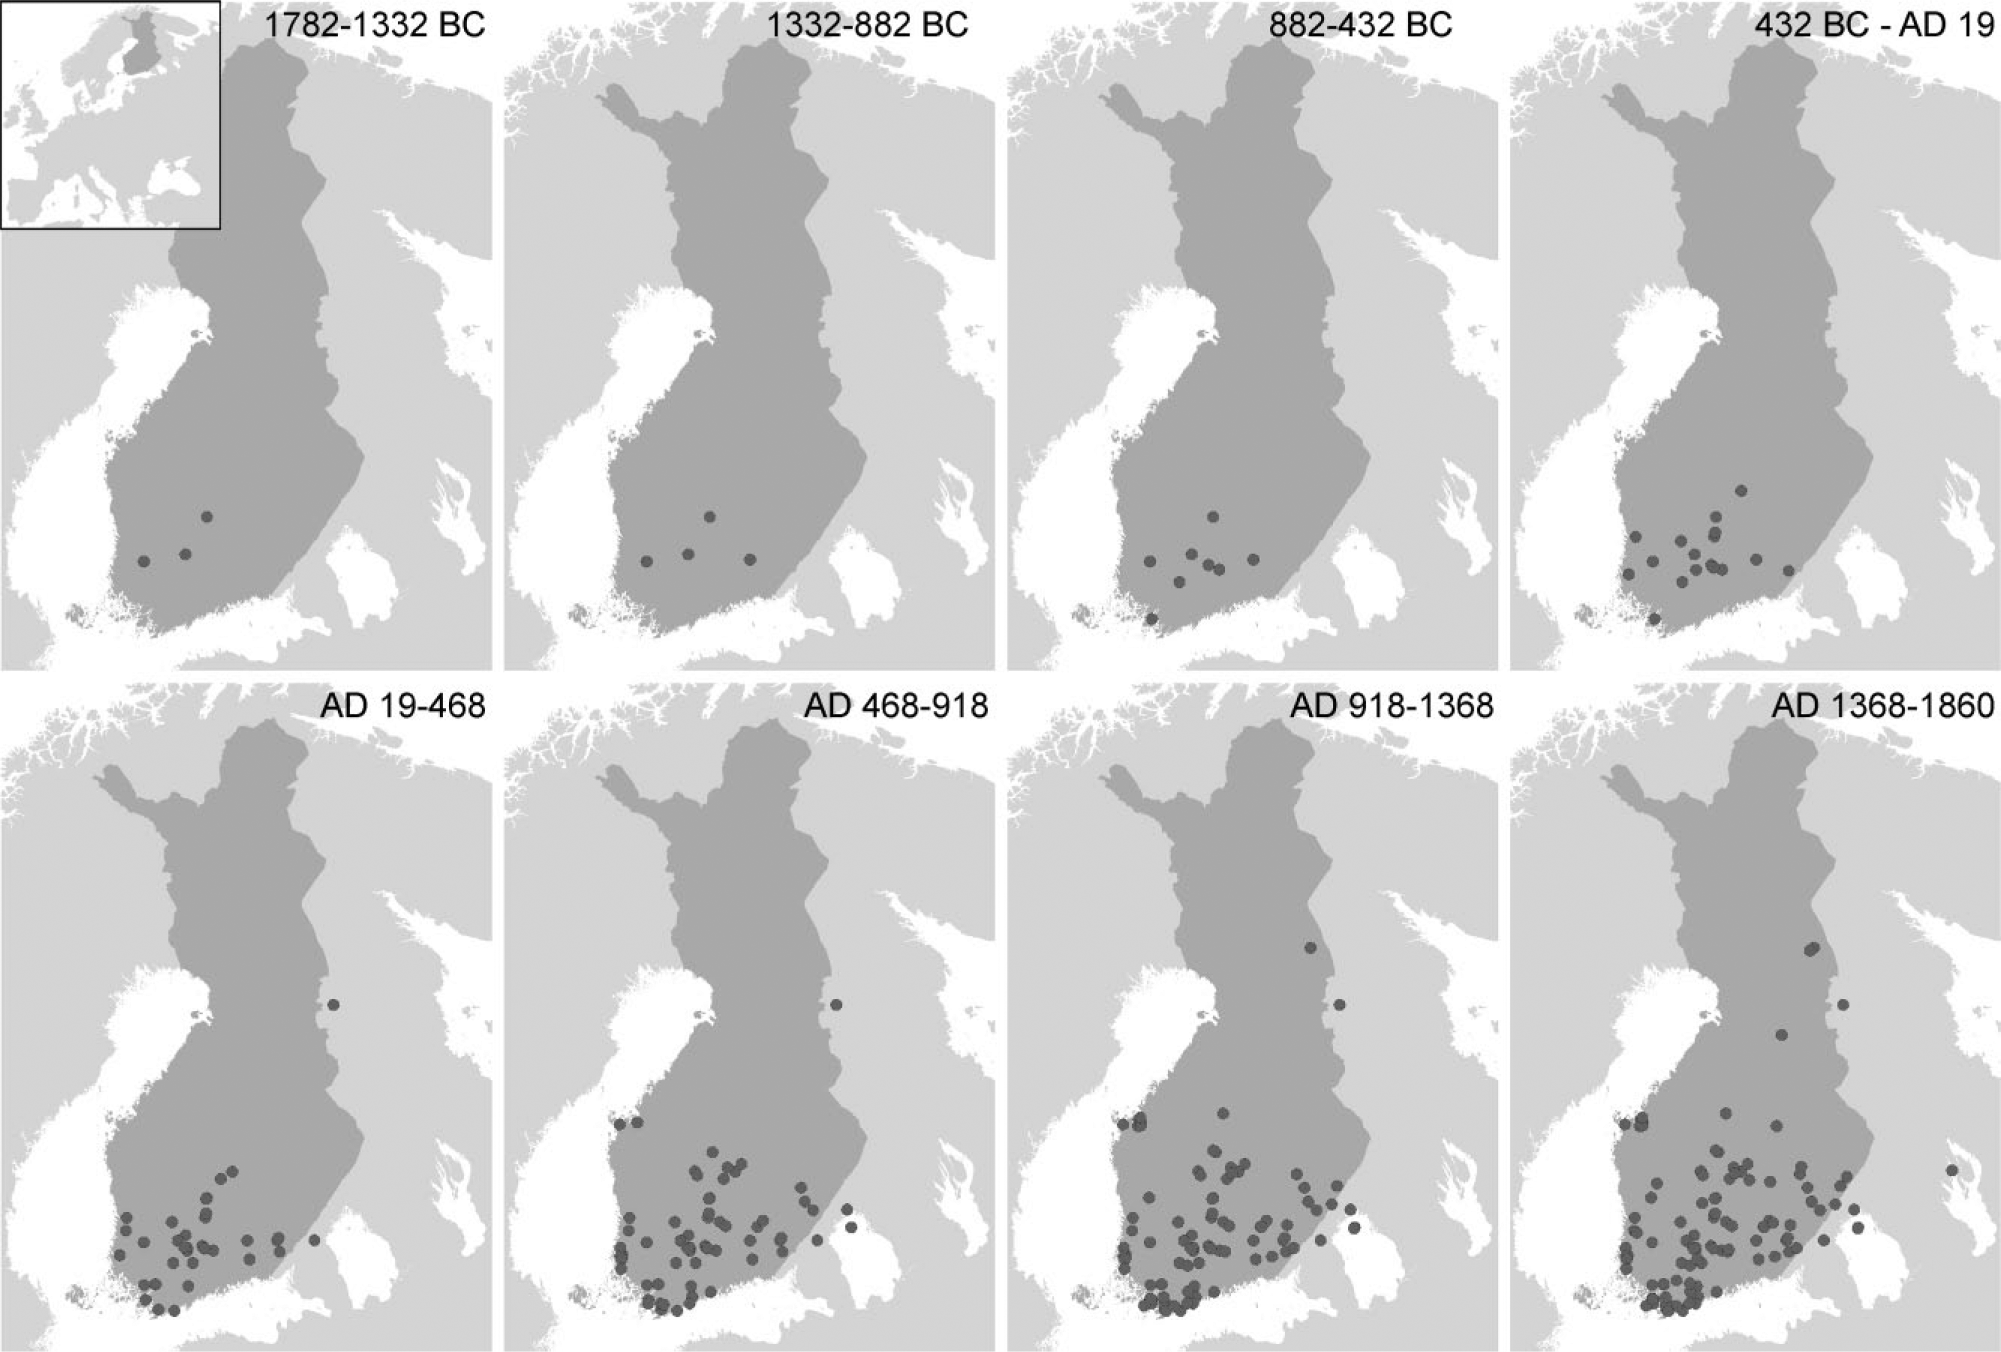
Map of the cumulative distribution of median ages of radiocarbon dates obtained from pollen cores (Table 2).
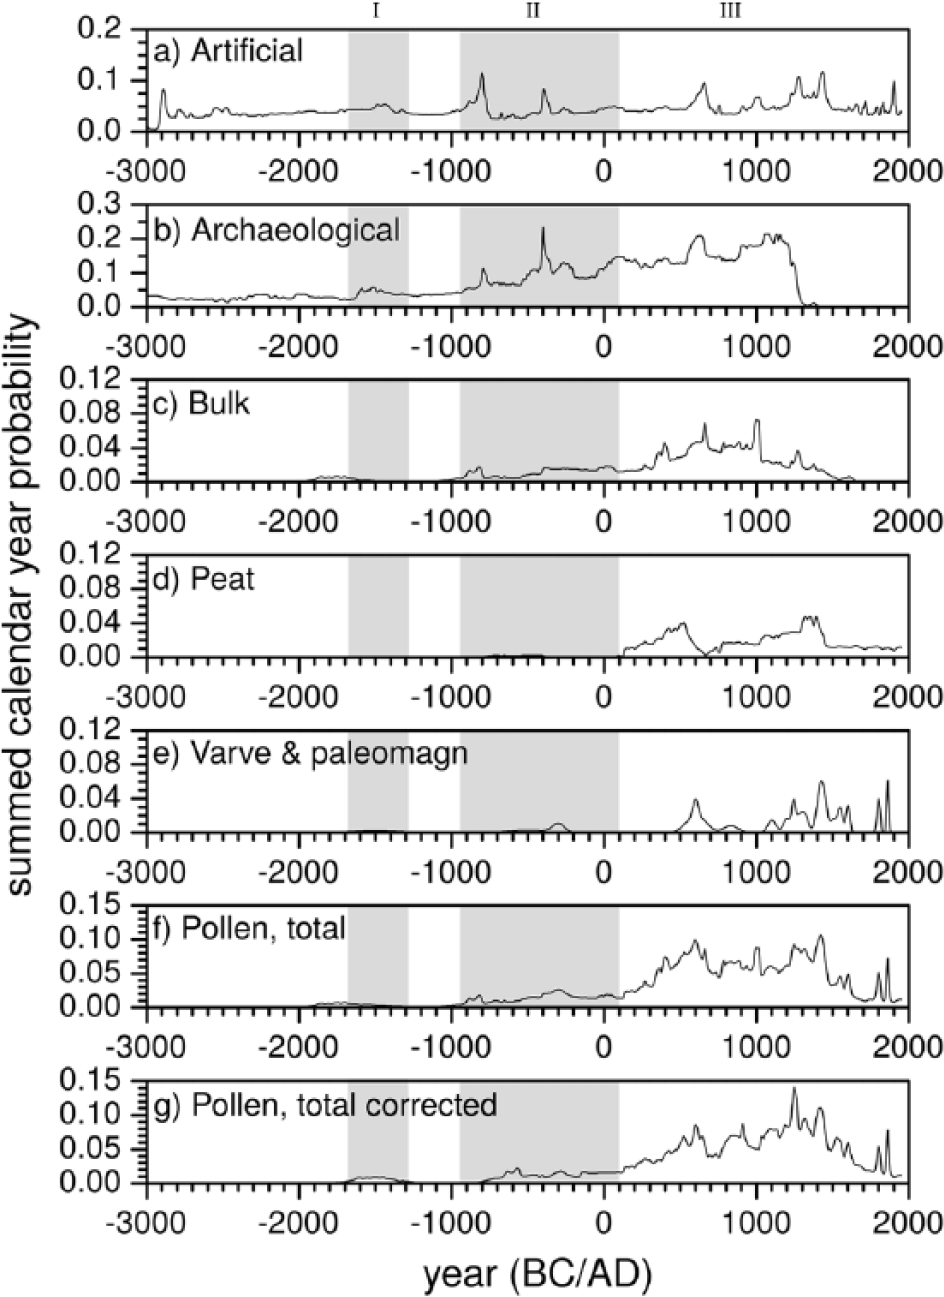
Summed calendar-year probability distributions assessed in the work. All the distributions are given with 5-year resolution: (a) artificial equidistant dates, (b) archaeological dates based on Oinonen et al. (2010) and Tallavaara et al. (2010), (c) bulk sediment dates from the pollen data, (d) peat dates from the pollen data, (e) varve and palaeomagnetic dates from the pollen data, (f) total sum distribution of (c)–(e) and (g) total sum distribution of (c)–(e) with bulk dates corrected by +250 years. Three intensification periods discussed in this paper are marked with Roman numbers.
PCA of the three – total corrected for pollen – spds reveals the following (see Figures 3a and b and 4a and d):
There is a very strong correlation between archaeological and pollen data with r = 0.87.
There is a weak correlation between the artificial and archaeological or pollen data with r = 0.34–0.35.
The first principal component (PC1) explains 71% of the total variance of the data and the shape of the PC1 scores resemble the archaeological or pollen spds.
The second principal component (PC2) explains 25% of the variance and the shape of the PC2 scores resemble that of the artificial spd.
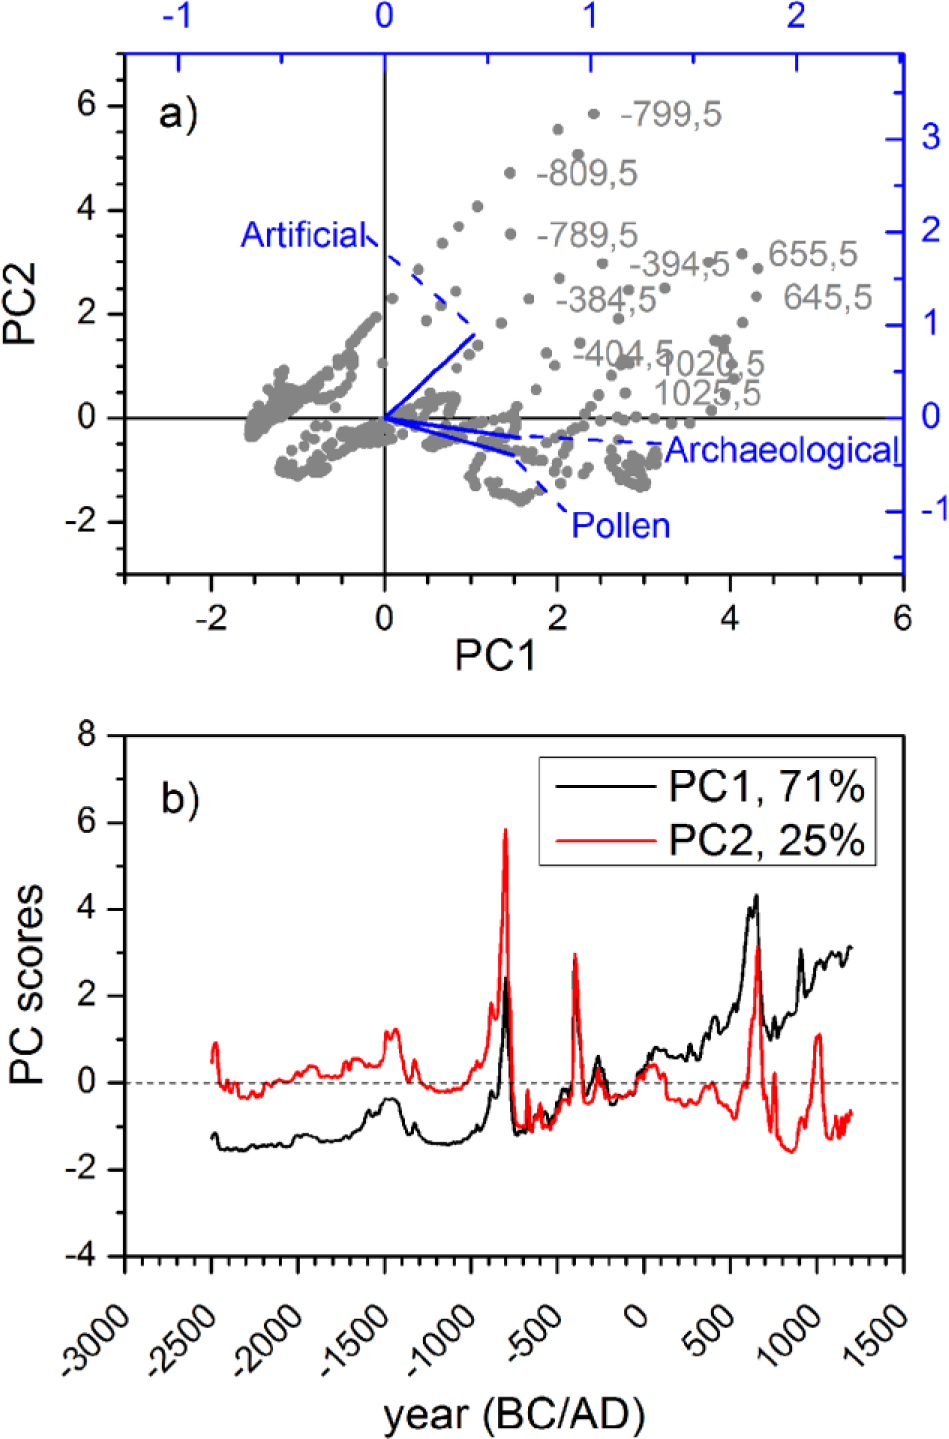
Results of the principal component analysis: (a) biplot of principal component scores (grey) of PC1 and PC2, and eigenvectors of the original data sets. Sharp peaks of the spds are displayed in the top-right corner of the PC space with calendar years shown for peak identification. (b) PC1 and PC2 scores as a function of calendar years. Percentages of variability of the data the component explains are also provided.
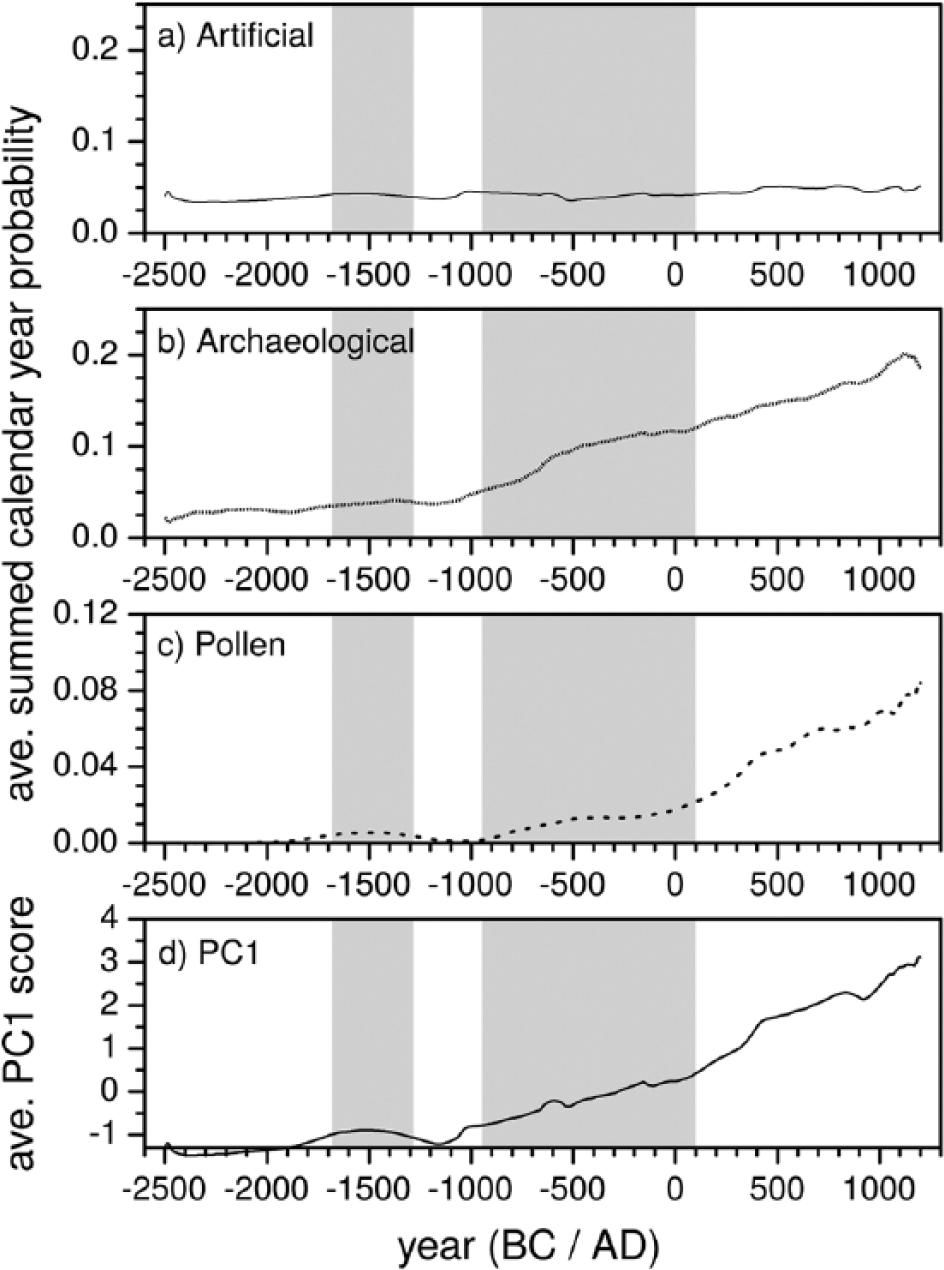
Averaged calendar-year probability distributions (500-year running average, Williams, 2012) and similarly averaged PC1 scores: (a) artificial equidistant dates, (b) archaeological dates based on Oinonen et al. (2010) and Tallavaara et al. (2010), (c) total sum distribution of pollen data with bulk dates corrected by +250 years and (d) PC1 scores. Note that (a), (b) and (d) are restricted to AD 1200 because of time scale of (b).
The peaks found are suppressed by using 500-year running average (Figure 4a–c). For comparison, similarly averaged PC1 scores are also plotted in Figure 4d. The PC1 score plot shows the same major features as the averaged pollen spd. Quantitative correlation analysis between the distributions (range 2500 BC–AD 1200) confirms the visual observations: both non-averaged (r = 0.87) and averaged (r = 0.98) archaeological and pollen spds correlate extremely strongly.
The corrected total pollen spd shows three different phases of agricultural advance. The first modest advance is during the second millennium BC (T10_1 ~ 1900 BC, Tmax_1 ~ 1550 BC), coinciding with the Kiukainen culture and the Early Bronze Age. A minimum is reached at around 1000 BC, after which the second advance can be seen in the first millennium BC, during the Late Bronze Age (T10_2 ~ 950 BC, Tmax_2 ~ 500 BC). The third broad phase of advance is in the first millennium AD during the Iron Age and lasts until the Middle Ages in Eastern Fennoscandia (T10_3 ~ AD 100, Tmax_3 ~ AD 1300). This last maximum is also clearly seen in all the subsets of non-averaged data (see Figure 2c–e): in the old organic carbon-corrected bulk spd at ~AD 1250, in the peat spd at ~AD 1350 and in the varve and palaeomagnetic spd at ~AD 1400.
Discussion
The quantity of radiocarbon dates can allow the estimated reconstruction of the changes in population sizes (Timpson et al., 2014). Within the study area, the population history has been assessed by recording radiocarbon dates obtained from Finnish archaeological finds (Oinonen et al., 2010; Tallavaara and Seppä, 2012; Tallavaara et al., 2010). These population size estimates are based on radiocarbon dates from archaeological materials and are thus totally independent of our pollen-based analysis or radiocarbon dates obtained from the pollen cores. This method has been criticised because of the underlying assumption that population size and productivity of consumables correlate (Contreras and Meadows, 2014); also, radiocarbon calibration-induced effects can bias interpretations of spds if not taken into account (Brown, 2015).
However, regardless of whether the change in calendar-year probability distributions of radiocarbon dates is caused by population increase (i.e. increase in productivity) or because of a cultural change resulting in greater archaeological visibility, this distribution correlates extremely strongly (R = 0.98) with the spd of the first continuous appearance of cereal-type pollen. The strong correlation between the observed cereal-type pollen and archaeological spds and, furthermore, the observed strong PC1 displaying a similar signal to the above spds suggests that there is a common factor behind the two distributions. It seems that the PC2 can be linked to calibration effects: the similarity of the PC2 score data to the artificial spd of equidistant dates is striking. PC1 must therefore be related to something else. We suggest that this component represents the human influence behind the distributions. Furthermore, it is equally clear that the earliest strong signals of cereal pollen found in the sediments are because of humans cultivating these lands. Therefore, our suggestion that human influence lies behind the PC1 is plausible. More confidence concerning this connection comes from the similarity of pollen spd and PC1 scores (Figure 4): all the essential features in the two plots are the same. Although we tentatively suggest that PC1 records human influence, in the following we base our conservative discussions mainly on the 500-year averaged total spd instead of the similar PC1 scores.
We have thus gathered together the existing chronological evidence relevant to the advance of cultivation in Finland and have produced a more comprehensive pattern than has been hitherto observed. We now discuss the pattern in chronological order relative to the other available evidence.
Our data selection procedure does not allow the inclusion of the suspected find of buckwheat pollen (Alenius et al., 2013) dated to before 5000 BC as continuous pollen evidence for this species has not been discovered from this period. There is therefore no calendar-year probability allotted to this very early period of time. We remain interested in this find and hope that future studies will clarify its status.
As mentioned, farming is not the only possible explanation for an increase in population size. However, farming can be one of the causes, because it can increase the quantity of food extracted from an area. As discussed by Tallavaara et al. (2010), the first large peak in the quantity of spd of archaeological radiocarbon dates around 4000 BC, but none of the pollen studies supports such a large-scale increase in cultivation at this time. Only a few single cereal-type pollen grains are known from this early period. For the reasons discussed above and by Lahtinen and Rowley-Conwy (2013), we consider such single grains to be unreliable indicators of cultivation in the absence of other line of evidence. It is notable that later peaks in archaeological radiocarbon dates are matched by increases in the frequency of cereal-type pollen. It is therefore most unlikely that the peak in archaeological radiocarbon dates around 4000 BC indicates the introduction of farming practices. This population increase coincides with several proxies indicating a broad climatic optimum: it has been mentioned that this led to a natural increase in productivity leading to a higher carrying capacity for hunter-gatherer populations (Tallavaara and Seppä, 2012). In eastern Finland, it may have been locally supported by landscape changes after the Vuoksi breakthrough occurred (Oinonen et al., 2014). The Vuoksi river was created because the post-glacial isostatic rebound made the previous outflow of the lake Saimaa physically impossible. The existence of this new channel decreased the water table of the lake Saimaa and reviled approximately 5000 km2 new fertile land at around 4000 BC (Oinonen et al., 2014).
The earliest evidence for farming has been discovered through lipid residue analysis. This suggests that the Corded Ware (CW) culture practised animal husbandry (Cramp et al., 2014). Animal husbandry does not necessarily involve cultivation, which explains the absence of indications of cultivation from our pollen data, and why it is not visible in our population size estimate either. Moreover, there is a lack of any archaeological evidence for cultivation by CW people (Nordqvist and Häkälä, 2014), although Siiriäinen (1980) argued that their lack of hunting-related tools could indicate a subsistence based on something other than hunting. The first, modest indication for cultivation in the pollen spd dates to Kiukainen Culture (mean approximately 1500 BC). Signs of cultivation from this period are seen in three pollen studies, two with bulk sediment dates – Aholammi (1957–1613 BC, Koivula et al., 1994) and Loimaansuo (2035–1716 BC, Vuorela, 1975) – and one with a varve date – Kissalammi (c. 1500 BC, Tolonen, 1981). Even taking into account our most moderate temporal shift (ΔT = 250 years) in bulk sediment dates, these dates form the first increase in calendar-year probability within our plots, covering the period of the Kiukainen Culture to the Bronze Age. Preliminary results have also suggested that starch grains of barley have been detected on a pottery sherd of Kiukainen although the sherd itself dates from the Bronze Age (Juhola et al., 2014). A radiocarbon date obtained from a burnt sheep/goat bone also dates to this period (2200–1950 BC; Bläuer and Kantanen, 2013). Animal husbandry is also evidenced in the Bronze Age by a cow maxillary molar from Nakkila, south-west Finland (1427–1271 cal. BC, Bläuer et al., 2013). Thus, some independent evidence – although still very scarce – is starting to appear for both cultivation and animal husbandry from the Kiukainen Culture and the Bronze Age – in accordance with our spd plots. There are still somewhat speculative, but reasonable, challenges to this to be considered. If the temporal shift (ΔT) of the bulk sediment dates is larger than 250 years (as our correlation analyses may indicate), two of the three available dates would fall into the Bronze Age, thus making the early intensification a later development. Furthermore, as already discussed by Lahtinen and Rowley-Conwy (2013), the pollen of wild and cultivated species may be misidentified. Juhola et al. (2014) have already suggested that future investigations on the reliability of the starch identification method are also needed before these results can be unanimously accepted. Therefore, the intriguing question of the early development of cultivation needs much future work.
Cultivation seems to advance again during the Late Bronze Age, from c. 900 BC onwards, and the averaged signal shows a maximum at around 500 BC. The peak in the raw data concentrates within more the narrow period of 700–200 BC. Evidence of milk lipids has been discovered from Bronze Age vessels (undated; Cramp et al., 2014), and direct dates have been obtained from two barley grains from southern Ostrobothnia (1000–844 BC; 831–552 BC; Holmblad, 2010), thus agreeing with our observation. Evidence for cultivation in this early period also remains limited, but this could all be indicative of minor Late Bronze Age farming practised on a local scale, as seen at similar latitudes in northern Sweden (Viklund, 2011). This second advance coincides with the strong increase in the archaeological finds illustrated by Tallavaara et al. (2010) (Figure 2). In addition to the overall significant correlation between the spds, this agreement adds more confidence to the suggestion that cultivation contributed to the assumed population increase.
The third advance of cultivation started from c. AD 100 onwards, during Iron Age. This is mainly dominated by radiocarbon dates derived from peat samples and is supported by bulk sediment, varve and palaeomagnetic dates after AD 300. A local maximum is reached at around AD 700, after which an ultimate maximum is eventually reached at AD 1300 (Tmax_3), during the Medieval period. The peak at approximately AD 500–700 followed by a decline is observed at the non-averaged data (Figure 2g) and in the PC1 scores (Figure 3b). Although it was not possible in this study to estimate which varieties or species of cereals produced these signals of cultivation, we suspect that the distribution may be connected to the introduction of rye. During the Iron Age, a change in macrofossil evidence in southern Sweden indicates an intensification of rye cultivation (Grabowski, 2011). As already mentioned, Donner (1984) also claims that rye spread to Finland between the 5th and 11th centuries AD. This could partly explain the rise in the quantity of pollen studies indicating farming during the first millennium AD. This rise in frequency is not necessarily an indication just of the advance of farming, as Donner (1984) has already argued: rye produces more pollen than barley and therefore has greater visibility in the pollen record. However, because of the simultaneous increase in population size, it would be reasonable to suggest that farming may have spread into new areas. The start of rye cultivation could partially explain the population increase because rye is more difficult to cultivate than barley for climatic reasons, but it provides larger harvests in the northern latitudes (Solantie, 1988). Another possibility is that this population increase was connected to a growth in trade evidenced by an increase in imported objects from AD 700 onwards (Huurre, 1979; Uino, 1999). Increased trade could have provided needed food supplements during harvest failures, therefore reducing pressure upon farmers.
As mentioned, a decrease in non-averaged pollen spd and PC1 scores occurs at c. AD 700. This is visible in varve, bulk and peat dated cores (Figure 2). It is in agreement with the observation of a possible genetic bottleneck (Sundell et al., 2010). This would suggest a decline in the occupation of new areas by farming communities. This same decline in the number of farms at c. AD 600 is recorded in Upland in southern Sweden (Lagerås, 2013) and Estonia (Tvauri, 2014), possibly because of the climatic anomaly at AD 536 (Gräslund, 2007; Tvauri, 2014). Furthermore, a tree ring summer temperature reconstruction from northern Sweden suggests that summers were cooler between AD 600 and 700 (Briffa et al., 1992). This could indicate a difficult time for farming-based economies in northern latitudes. Another possibility is that the northern border of farming was reached, and instead of occupying new areas, farming was just intensified within the areas it already occupied, which would not be visible in this study. However, this seems a less likely scenario because the same phenomenon has been reported in neighbouring countries.
The archaeological spd does not include radiocarbon data from the historical period (c. AD 1200 onwards). Thus, comparison of pollen spd and archaeological spd is not possible for the historical period. Moreover, in light of pollen analyses, it seems likely that the occupation of new areas was a long-lasting practice among farmers, which continued even until the 16th-century AD in Finland. Furthermore, these results suggest that there was no separate Medieval spread of farming, but rather that the third advance of farming, which started during the Iron Age, simply continued during this period. After the most intensive stage of this expansion up to the 16th-century AD, historical sources suggest that Finns continued to spread, but to other parts of the Swedish state, into Sweden’s forested uplands, into Lapland, and to the new world in North America.
The geographical distribution of radiocarbon dates from the pollen studies is shown in Figure 1. The maps show no clear pattern of advance, but rather intensification taking place in various areas simultaneously. This is in agreement with Mannermaa and Deckwirth (2010), who have suggested, based on osteological evidence, that even during the Iron Age subsistence was based on both farming and hunter-gathering. Thus, it is likely that the advance of farming took place in widely separated areas, leaving much ‘non-farmed’ land in between, in which other subsistence activities could have been practised. This could also indicate high mobility among people, the adoption of farming from neighbouring areas by the local population, or both.
The rate at which Neolithic farming spread across Europe as a whole has been estimated at no more than about 1 km a year, although regional variations are significant (Bocquet-Appel et al., 2012; Galeta et al., 2011; Pinhasi et al., 2005). For example, the LBK culture spread over Central Europe at a rate of approximately 6 km/yr (Dolukhanov et al., 2005). This would mean that even with a much slower rate, Finland (1200 km in length) could have been settled by farmers more quickly than we see in the data. It is not possible to draw conclusions based on migrations, or at least not using such studies alone, but this study suggests a very slow expansion process over several thousand of years. This was therefore different to the Central European neolithisation. Moreover, this process was not an even one: our study suggests at least three separate periods of advance within it.
Summary
We have collected the existing chronological information on the advance of cultivation at its northern limits in Finland and compared the resulting spds to the available archaeological data. Through applying PCA to spds, it has been possible to identify calibration effects and to explore the underlying factors within the distributions.
Two independent proxies, the spds of the archaeological and the pollen dates, correlate extremely strongly (R = 0.98). We suggest that this is because of a common underlying cause: the advance of cultivation. This correlation leads us to argue that the anomalous appearance of a few single cereal-type pollen grains at around 4000 BC is not because of the appearance of cultivation at this time.
The advance of farming involved several phases, of which three major ones (1500 BC, 900–500 BC and AD 100 onward) were observed. Consequently, the advancement of farming should be seen as a process rather than an event.
Finally, our summed calendar-year pollen studies suggest a possible decline in the spread of farming at c. AD 700. This would coincide with the possible genetic bottleneck suggested by Sundell et al. (2010), and with similar phenomena observed in neighbouring countries.
Footnotes
Acknowledgements
The authors would like to thank the two anonymous reviewers for the constructive comments which improved this article.
Funding
This study was funded by the Jenny and Antti Wihuri foundation.