
Abstract
Saunders KM, Grosjean M, Hodgson DA (2013) A 950 yr temperature reconstruction from
Duckhole Lake, southern Tasmania, Australia. The Holocene 23(6) 771–783. DOI:
The calibration model was based on a negative, not positive, relationship between trough area (R570/630) and temperature. The corrected model is: R = −0.56, pauto < 0.05, root mean squared error of prediction (RMSEP) = 0.21°C, five-year filtered data, calibration period 1911–2000.
The correlations in this paragraph are negative (not positive as stated in the original paper). The paragraph should read as follows:
VIS-RS data are summarized in Figure 3. R570/630 and R660/670 fluctuated throughout the core with a slight overall decreasing trend towards the surface. R570/630 was positively correlated to R660/670 (R = 0.5, p < 0.05). R650;700 and RABD660;670 were highly significantly correlated (R = −0.85, p < 0.05). R650;700 was weakly correlated to R660/670 (R = 0.36). R650;700, RABD660;670 and R660/670 were significantly correlated with water content (R = −0.83, 0.60 and –0.53, respectively, p < 0.05). Once corrected for water content, the negative correlation between R650;700 and R660/670 increased (R = −0.41, p < 0.05), while there was no longer a correlation between RABD660;670 and R660/670.
The R values referred to should be negative:
All VIS-RS-derived proxies (R650;700, RABD660;670, R660/670 and R570/630) were calibrated to monthly and annual temperature (mean, maximum and minimum) and precipitation (total) for the period AD 1911–2000. R650;700 was most highly and significantly correlated to mean annual (January–December) temperature (R = −0.84, pauto < 0.05, pauto after detrending < 0.05).
The correlation between R650;700 and annual temperature was highly significant after applying a five-year triangular filter (non-detrended: R = −0.85, pauto < 0.001; Figure 4a) and remained significant when detrended (R = −0.29, pauto < 0.05; Figure 4b).
Consequently, as R650;700 (reflecting chlorophylls and derivatives) correlated best to temperature, it was used to develop an annual temperature calibration model for Duckhole Lake: R = −0.56, pauto < 0.05, RMSEP = 0.21°C, where both R and p were adjusted for autocorrelation.
The y axes of the lower panels in 4(a) and 4(b) were not correct. The corrected figure is
above: Comparison of R650;700 and annual mean temperature: (a)
non-detrended R650;700 and mean annual temperature; (b)
detrended data. All data are five-year triangular filtered. Note: reversed y axes in
the lower panels (proxy data) of (a) and (b).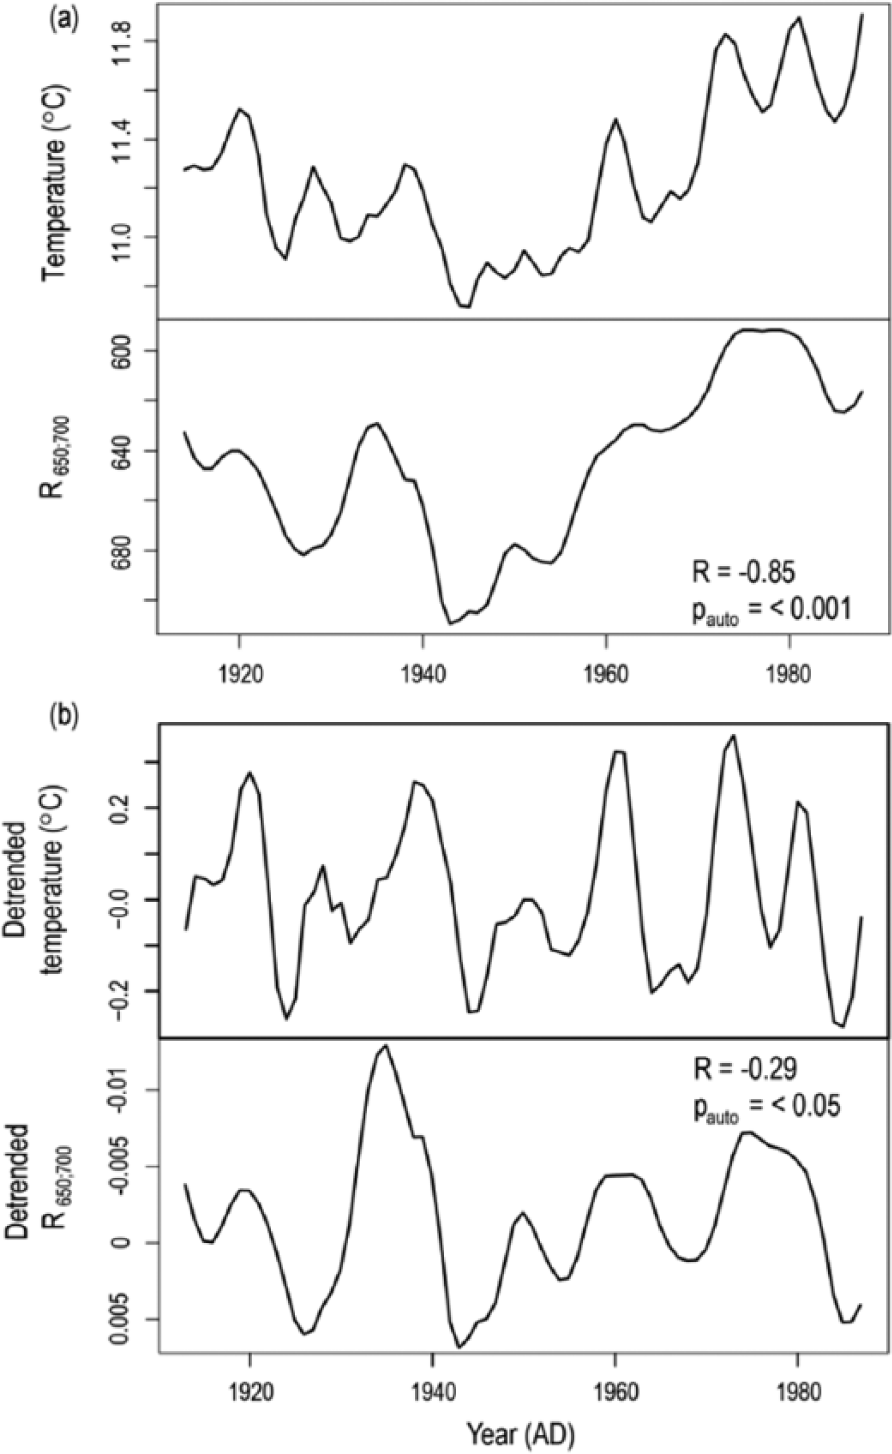
Get full access to this article
View all access options for this article.