
Abstract
The sediment of Lake Çubuk in NW Anatolia, which is situated very close to the climate boundary between the dry Central Anatolia and the wet Marmara region, is regarded as a suitable climate archive to test inward and outward movements of this boundary in accordance with past climate variations. Herein, we study the stratigraphic record of the last 2800 years of this landslide-dammed lake at 1030 m elevation, using multi-proxy tools (sedimentology, major and trace element geochemistry, stable isotopes, pollen, diatoms and ostracods) and compare the results with other contemporaneous Anatolian climatic records. Our findings indicate that Lake Çubuk recorded seven distinct climatic periods in the last 2800 years that have been previously revealed elsewhere in Anatolia. The most arid period occurred at the end of the Near-East Aridification Phase at approximately 200 BC when the δ18O shifted to very negative values, and the planktonic diatom ratio considerably decreased. The Dark Ages and the late Byzantine periods between AD 670 and 1070 are characterized by more positive δ18O values, increasingly higher lake levels and the most extensive arboreal cover of the entire record. The ‘Little Ice Age’ appeared suddenly, within 40 years, at AD 1350 and is reflected in all of the proxies, including a positive shift in δ18O, a sharp decrease in pollen of shrub and herb to the benefit of pine trees and a rapid increase in benthic diatom abundance indicating a lake level shallowing. In many parts of the record, a close match between the stable isotopes and the pollen assemblage zones in the last 2800 years demonstrates that climate rather than human activity was the primary driver of vegetation cover in this mid-altitude mountain of NW Anatolia.
Introduction
The investigation of palaeoclimates of the last 2500 years when orbital forcing has remained nearly unchanged is regarded as particularly important to the understanding of pre-industrial background climatic trends (Wanner et al., 2008; Woodbridge and Roberts, 2011). Because the Mediterranean Basin is anticipated to be one of the worst influenced regions in terms of drought from global warming, more palaeoclimatic records with robust chronology and geographic proximity are essential for regional/global modelling studies (Finné et al., 2011; Randall et al., 2007; Trenberth et al., 2007).
Because the late Holocene witnessed intense human settlement all over Anatolia, one of the most challenging topics of palaeoclimatology is filtering out the climatic signal from anthropogenic noise in complex proxy records. England et al. (2008) stated that palaeoclimatic studies based on multi-proxy indicators are unfortunately rare in Anatolia, and these studies revealed different estimates of the significance of climate versus human activity on the ecology and landscape. For example, the Bereket plain, the Gravgaz wetland (SW Anatolia) and the Lake Nar (Cappadocia) records indicated dominant human intervention (Jones et al., 2006; Kaniewski et al., 2007; Vermoere et al., 2000). In contrast, some NW Anatolian records display a direct climatic influence on the ecology (Ülgen et al., 2012). As with climatic modelling, more multi-proxy records with robust chronologies are required for resolving this issue.
Palaeoclimatic archives in NW Anatolia are varied in nature. Although some continuous marine and stalagmite records are available in the Aegean, Sea of Marmara and the W Black Sea region, they do not contribute a significant understanding to the late Holocene climate because of their often poor temporal resolution (Badertscher et al., 2011; Caner and Algan, 2002; Göktürk et al., 2011; Kotthoff et al., 2008; Mudie et al., 2007). The lakes to the south and east of the Sea of Marmara that have developed mostly in relation to splays of the North Anatolian Fault have also been exploited in terms of palaeoclimatology. The Lake İznik record dates back to the Pre-Holocene period and was investigated using geochemical and partial ecological proxies (Franz et al., 2006; Roeser et al., 2012; Ülgen et al., 2012). The southerly situated Manyas and Ulubat lakes and the Sapanca Lake in the east were not evaluated systematically in terms of past climates, but they provided important insights into earthquakes, erosion and extreme climatic events (Kazancı et al., 2004; Leroy et al., 2002, 2009, 2010). Lake Sünnet, 15 km to the SE, comprises a continuous early Holocene record as terraces, but the late Holocene sediments are not easily accessible because of the water depths (Ocakoğlu et al., 2011b, 2013). Lake Çubuk, presented herein, is one of a series of early Holocene landslide-dammed lakes triggered presumably by earthquakes sourced from the nearby North Anatolian Fault Zone (NAFZ) (Figure 1b; Abdüsselamoğlu, 1959; Kır, 2010; Ocakoğlu et al., 2011a, 2011b; Tunoğlu et al., 2011). Sedimentation in these lakes has been very high because of the landslide damming, yielding a high-resolution lake record. However, Lake Çubuk is situated very close to the climate boundary between the dry Central Anatolia and the wet Marmara regions (Figure 1a). A multi-proxy-based climatic investigation of the Lake Çubuk record would indicate expansion and shrinkage periods of the dry Eastern Mediterranean climate across this boundary and would provide correlation opportunities with dry and wet records on both sides. It is hypothesized that the high altitude of the lake would reduce any direct human interference and provide a clearer climatic signal.
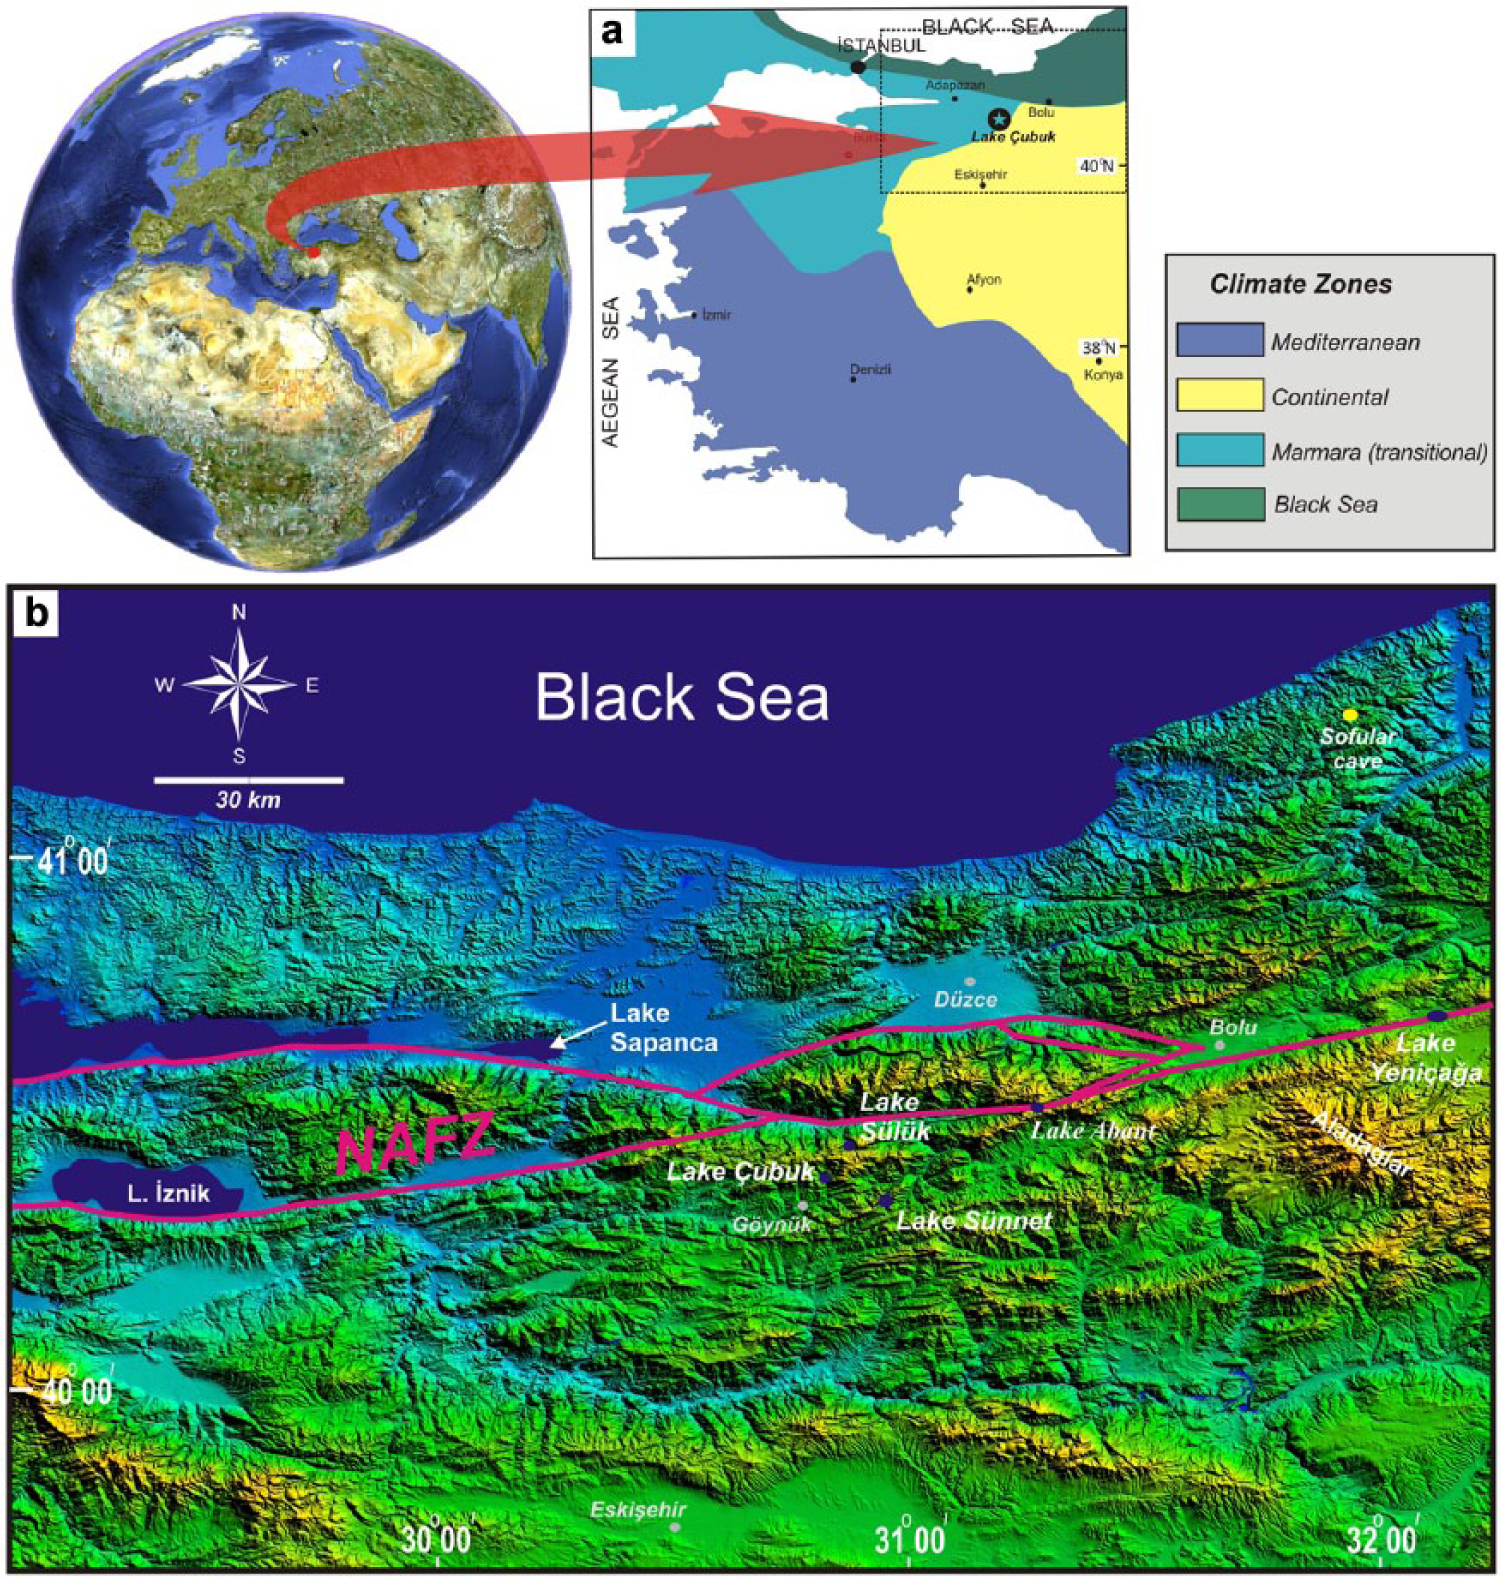
(a) Overall climatic setting (climate zones from Atalay and Mortan, 1997) of Lake Çubuk and (b) palaeoclimatic archives of NW Anatolia on SRTM 90 m DEM.
Geographic and climatic frames
Geological and morphological settings
Lake Çubuk (40°28.9′N, 30°50.0′E) is situated 15 km ENE of Göynük town within the territory of the Bolu province in NW Anatolia (Figure 1b). The lake is located at 1030 m a.s.l. and surrounded by peaks at c. 1500 m high. The lake is fed by two creeks, namely, the Şimşir and Soğukpınar creeks, draining a total surface area of 12 km2 (Figure 2). The surface area of the lake was 0.16 km2 in July 2009 with a maximum water depth of 7 m (Figure 2). A recent limnological study revealed that Lake Çubuk is an oligotrophic, moderately soft lake with an average epilimnion depth of 4 m. Hypolimnion below a thin thermolimnion is quite poor in terms of dissolved oxygen (<4 mg/L) (Sarı, 2013). The bottom of the deeper area is composed of dark grey mud, whereas the shallower areas (<3 m) are completely invaded by aquatic plants, such as Polygonum amphibium, Potamogeton gramineus and Potamogeton trichoides (Seçmen and Leblebici, 1997). The subtle subaqueous delta morphology was differentiated in sonar studies at the mouths of the inflowing creeks (Ocakoğlu et al., 2011a). The subaerial portions of these deltas are covered by gravelly sediments. The lowest altitude of the damming landslide in the valley at the south stands at 1030 m a.s.l. (Figure 2). A deep canyon has been entrenched in the south of this blocking landslide, most likely due to backward erosion during past overflowing wet periods (location ‘a’ in Figure 2). Approximately 15 years ago, the villagers dug a drainage channel at an altitude of 1027 m to protect the lakeside agricultural areas from lake flooding. The watershed of Lake Çubuk is covered predominantly by carbonate rocks of the Jurassic to Cretaceous age and by the Eocene siliciclastic rocks to a lesser extent (Kır, 2010). The latter is found in the northern highlands as limited scattered outcrops. Neither morphological nor rapid unexpected lake level change data of intense karstification have been reported in Lake Çubuk and its watershed. The NAFZ, which is the most prominent intracontinental fault zone in Anatolia, passes across 5 km to the north (Figure 1b). It is suggested that Lake Çubuk and Lake Sünnet, which is another landslide-dammed lake 15 km in the SE (Figure 1b), were formed because of a trigger by this fault zone (Abdüsselamoğlu, 1959; Ocakoğlu et al., 2011a, 2011b). In the case of Lake Çubuk, Ocakoğlu et al. (2011a) and Kır (2010) have suggested that a strong earthquake triggered a kilometre-sized landslide to the north of Dikmen hill, and this land mass was displaced more than 500 m westward, ultimately blocking the Şimşir creek (Figure 2). Investigation of the valley profiles perpendicular to and parallel with the Şimşir creek demonstrated an approximately 50-m-thick sediment at the bottom of the lake (Ocakoğlu et al., 2011a). Volumetric calculations based on the sedimentation rates of the last 2800 years indicate a latest Pleistocene to early Holocene age for the formation of Lake Çubuk (Ocakoğlu et al., 2011a; Kır, 2010).
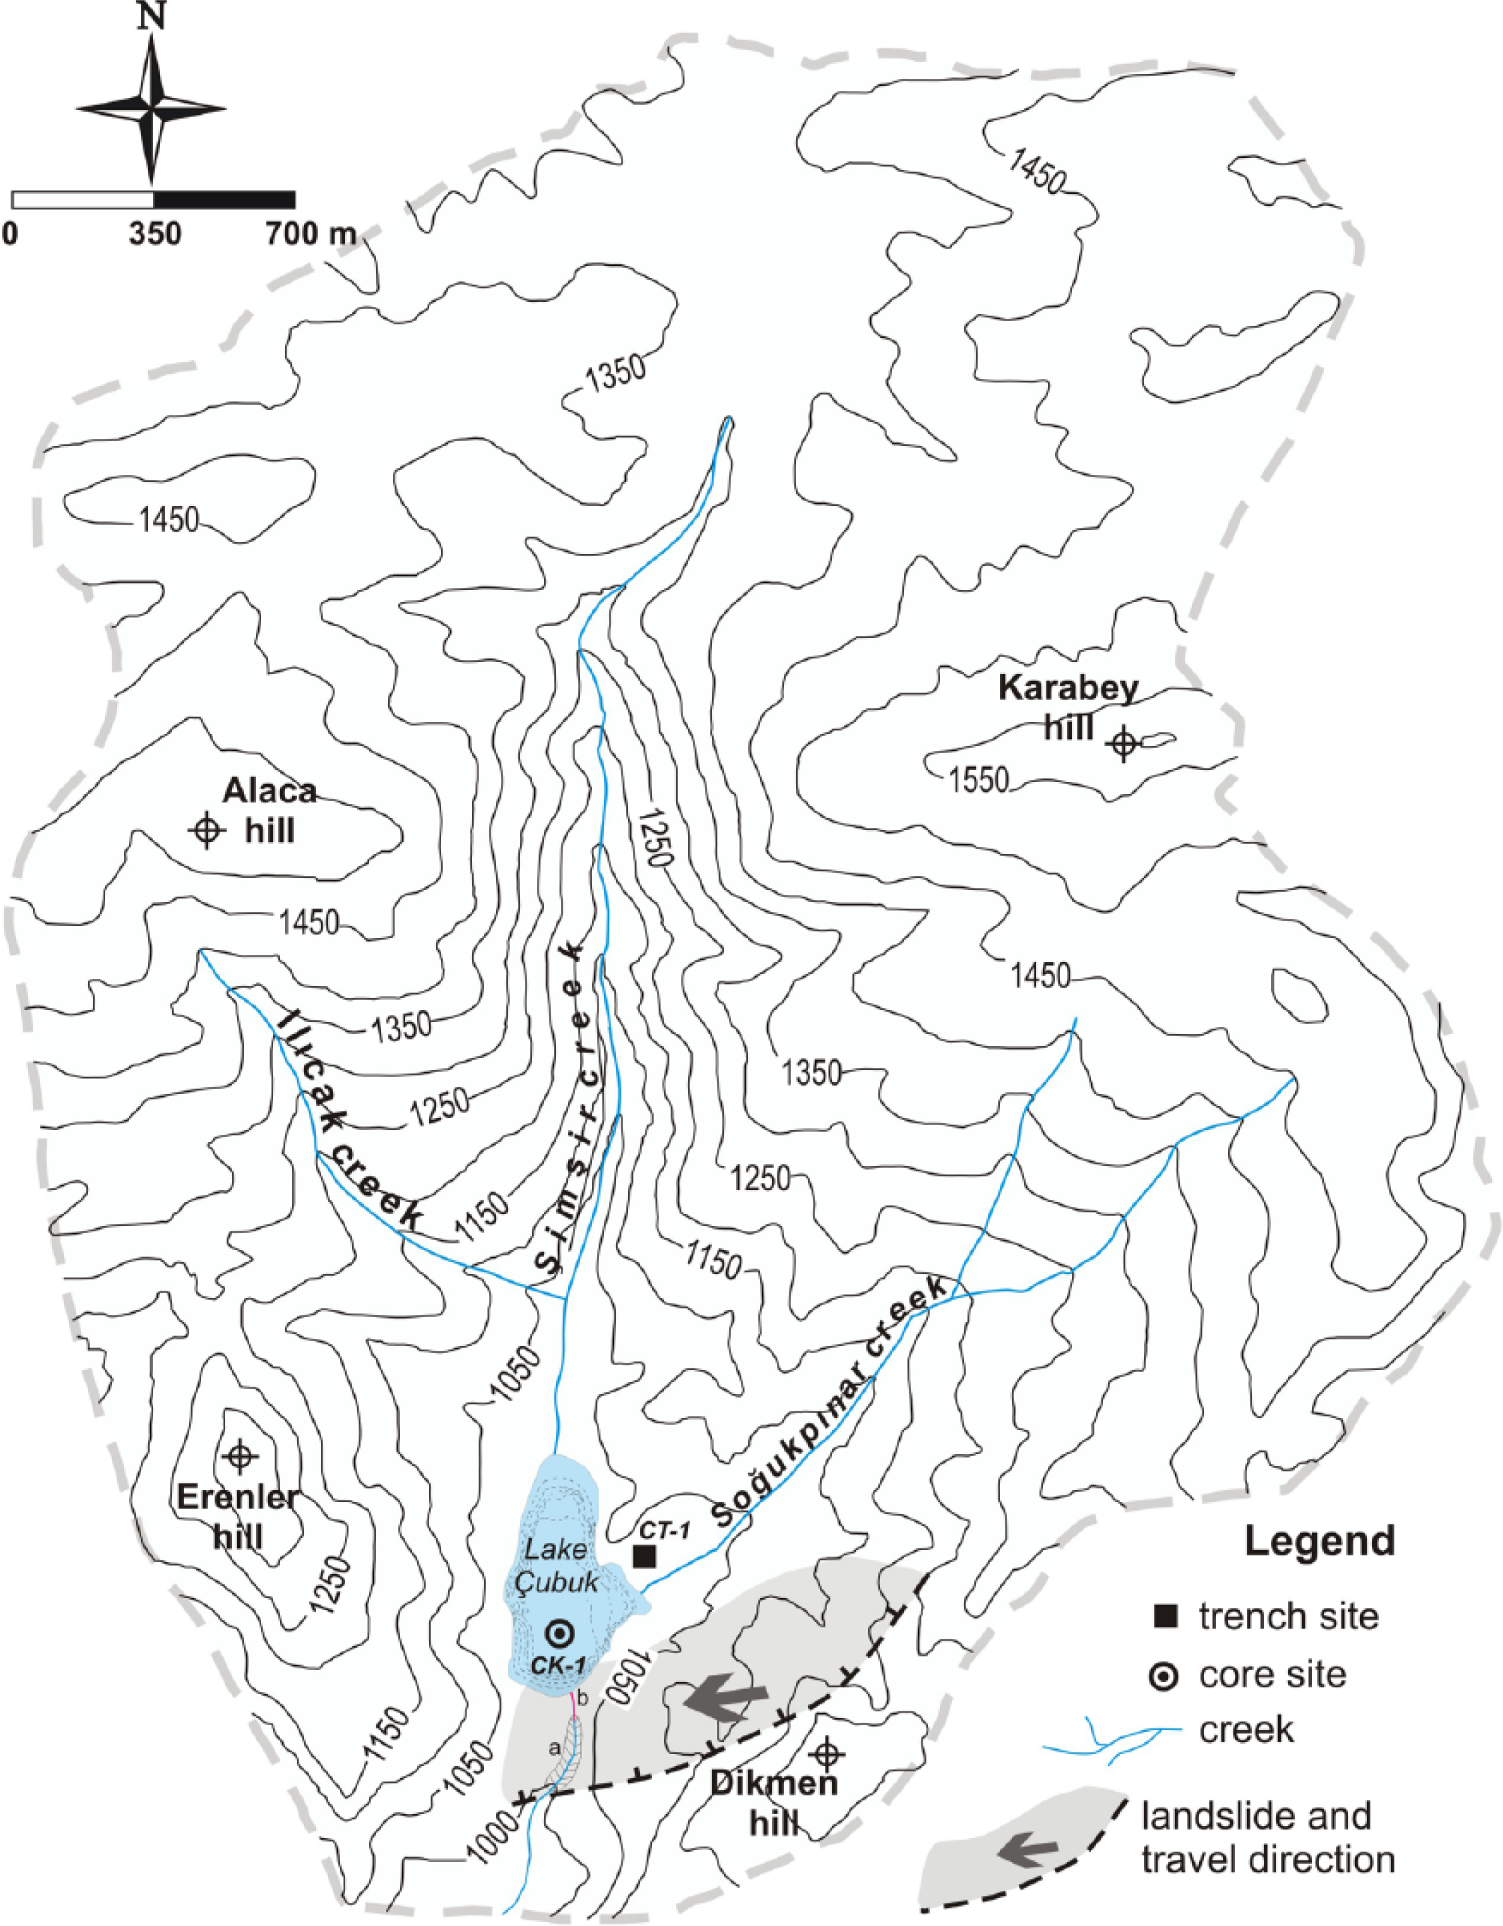
Watershed morphology, including lake bathymetry (1 m interval), core and trench locations and landslide features in the area of Lake Çubuk. Locations a and b are mentioned in the text.
Climate and vegetation cover
Lake Çubuk is situated between the relatively wet transition climate of the Marmara region and the dry climate of Central Anatolia (Figure 1b). Due to this specific setting, past shifts of the climate belts are expected to be recorded in the bottom sediments of Lake Çubuk. The meteorological data are from the nearby Bolu station at 740 m elevation; hence, Lake Çubuk is 300 m higher and definitely colder. The annual precipitation is 597 mm, the majority of which falls more or less equally, except for the summer months when it is lower (Figure 3). The average temperatures of the summer and winter months are 18 and 3.6°C, respectively. The evaporation rate exceeds the precipitation rate between April and October and on an annual basis, causing a net annual water deficit (Figure 3). A recent limnological study by Sarı (2013) revealed seasonal lake level fluctuations as much as 1.85 and 3.7 m in the years 2009 and 2010, but unfortunately it did not cover water budget issues. Lake level rises mostly occur in early spring months as a result of increased rainfall. Relatively low salinities measured in the summer and early autumn months (Sarı, 2013) would indicate a secondary significance of evaporation in the control of lake level variations.
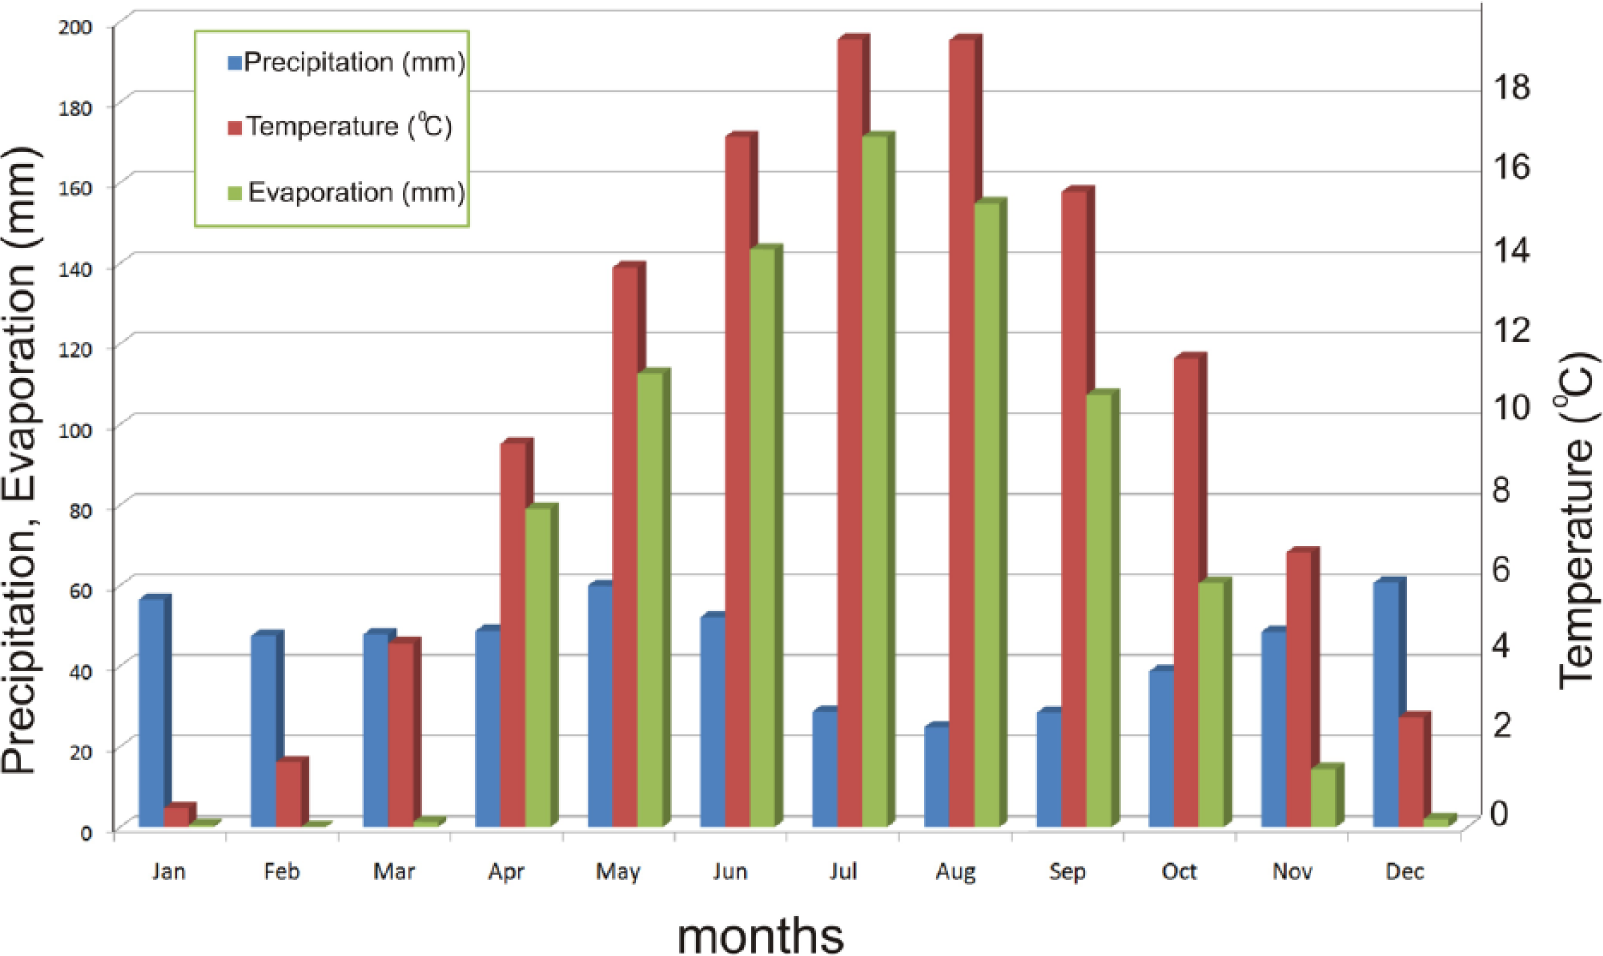
Average climate data (1929–2001) from the Bolu Meteorological Station at 740 m altitude (from Turkish State Meteorological Service database).
The present natural vegetation of the Bolu region is rich, and it has received a great deal of attention from botanists (e.g. Akman and Ketenoğlu, 1978, 1979; Akman and Yurdakulol, 1981; Ekim and İlarslan, 1982; İkinci and Güner 2007; Ketenoğlu 1983). Seçmen and Leblebici (1997) have recorded members of the present aquatic vegetation in several lakes in the region, including Lake Çubuk. The natural vegetation of the region belongs to the Euxine subprovince of the Euro-Siberian phyto-geographic region (Atalay, 1983). At lower elevations, broad-leaved deciduous trees and shrubs prevail, whereas at higher elevations, coniferous trees can be found. In humid locations, moisture-loving elements of the forest, including oaks (Quercus robur subsp. robur and Quercus petraea subsp. iberica), beech (Fagus orientalis), hornbeam (Carpinus orientalis) and alder (Alnus glutinosa), are present. At higher elevations, above 1000 m, Scots pine (Pinus sylvestris) and fir (Abies nordmanniana subsp. bornmuelleriana) become the dominant trees of the forest. The subalpine zone is primarily found above the timberline from 2000 m, especially on Aladağlar (2499 m) lying to 80 km east of the study area. On the slopes facing north, under humid climatic conditions, fir becomes the dominant element, whereas on the slopes facing south, under semi-continental climatic conditions, black pine (Pinus nigra) becomes the most dominant tree. Specifically around Lake Çubuk Pinus nigra dominates. The adjacent marshy areas support a rich flora represented by many species, such as Myriophyllum spicatum, Polygonum amphibium, Potamogeton gramineus and Agrostis stolonifera (Seçmen and Leblebici, 1997). Additionally, pastures and crop fields for dominantly wheat and fodder production (<30%) indicate a current, strong anthropogenic influence in the area (Ocakoğlu et al., 2011a).
Previous pollen studies in the region
Based on pollen analyses and radiocarbon dating alone, the sediments of Lake Abant (1300 m) and Lake Yeniçağa (976 m), situated to the north of the Bolu region (Figure 1b), which is approximately 35 and 100 km to the NE of the present study area, have been previously investigated to document the past environmental changes in the region (Beug, 1967; Bottema et al., 1993/1994). The study by Bottema et al. (1993/1994) has shown that the late-Glacial period (c. 12,000–10,000 BP) in the region was cold and dry. Steppe vegetation, in which herbaceous plants, such as Artemisia, Chenopodiaceae and Asteraceae became common, was dominant, whereas tree cover consisting mainly of birch (Betula), juniper (Juniperus) and sea-buckthorn (Hippophae) was sparse at that time. At the beginning of the Holocene, fir (Abies) and beech (Fagus) began to expand in the region. After 7000 BP, pine (Pinus) became the dominant tree, accompanied by oak (Quercus), hornbeam (Carpinus) and alder (Alnus) trees. In previous pollen diagrams from the region, human activity has been traced since approximately 3880 BP, which is characterized by the growth of arable cereal and pastoralism (Bottema and Woldring, 1990; Bottema et al., 1993/1994).
Lake Sapanca, 50 km to the NW (Figure 1b), has provided a record of the last ⩾1500 years (Leroy et al., 2010). The main results from core R6 are the presence of a deciduous forest dominated by Quercus and Carpinus betulus, a higher vegetation belt of Fagus and Pinus and a riparian belt of Alnus. A human influence has been detected throughout the sequence, especially strong during the Beyşehir Occupation Phase (BOP).
Methodology
All proxy measurements are based on core CK-1 (core length: 303 cm) obtained from the lake centre at a depth of 7 m (Figure 2). We also dug a 4-m-deep trench (CT-1) in the lake margin to enable a correlation with the subaerial stratigraphy and the highstands. Livingstone corer equipment installed on a plastic platform was used to retrieve the bottom sediments. Five series of overlapping cores are used to have the master core seen in Figures 4 –9. Parallel core sections are integrated based on careful corer height measurements during the coring operation and key horizons in the cores. The limits of each core section are displayed in Figure 4. Sub-sampling of the core for each proxy record was performed at 4 cm intervals. An age–depth model of the core and trench sediments was built based on the radiocarbon technique of charcoal or the organic fraction of bulk mud. Radiocarbon analysis was conducted in the Applied Isotope Studies Laboratory at University of Georgia (US) and calibrated by Calib Rev 7.0.2 software by Reimer et al. (2013). Stable δ18O and δ13C measurements were performed from the carbonate fraction of the bulk mud in the Iso-Analytical Laboratory (UK). A continuous flow isotope mass spectrometer (Europa 20-20) with an ANCA-G gas purification module was used in the analysis. Precision levels are 0.1‰ for δ13C and 0.2‰ for δ18O. Major and trace elements were analysed at ACME Laboratories (Canada) using the ICP-MS technique. In the pollen extraction, we applied HF methodology (Moore et al., 1991) including removal of carbonates and silicates by dilute HCl and HF, centrifuging and washing. Two slides were prepared for each level and mounted in glycerine-jelly. In most cases, a minimum of 500 pollen grains was counted per level, 250 from each of the duplicate slides. The pollen and spores were identified using the reference collection in the Department of Biology at Hacettepe University. The pollen and spore types used are defined in Faegri and Iversen (1989), Moore et al. (1991), Punt et al. (1976, 1988, 1995) and Punt and Clarke (1980, 1981, 1984). Diagrams were plotted using Psimpoll (Bennett, 2007) with 10× exaggeration curves and black dots for values lower than 0.5%. Zonation was calculated by cluster analysis (CONISS) after square-root transformation. To prepare the permanent slides for the diatom studies (76 samples in total), the method by Round et al. (1990) was followed. For each slide, 600 diatom frustules are considered in the concentration analysis, following the method by Battarbee (1986). Diagram plotting and zonation were made as for palynology. Only samples with at least 40 diatoms were plotted. Diluted hydrogen peroxide was used for the extraction of ostracoda valves and other shells in 30 g of bulk sediment (details are given in Tunoğlu et al., 2012). Determination of ostracoda valves, carapaces and other fossils was primarily performed under a binocular microscope (maximum 50× magnification) and a scanning electron microscope at Hacettepe University. Ostracoda catalogues and freshwater ostracoda monographies (Bronstein, 1947; Meisch, 2000) were used in the determination. Magnetic susceptibility (MS) measurements were obtained using a Bartington MS2 system with an MS2B dual sensor on powdered air-dried samples on a mass-specific base in the laboratory. Loss on ignition (LOI) analysis was carried out at 1000°C by sintering at ACME Laboratories (Canada).
Depth–age model for core CK-1.
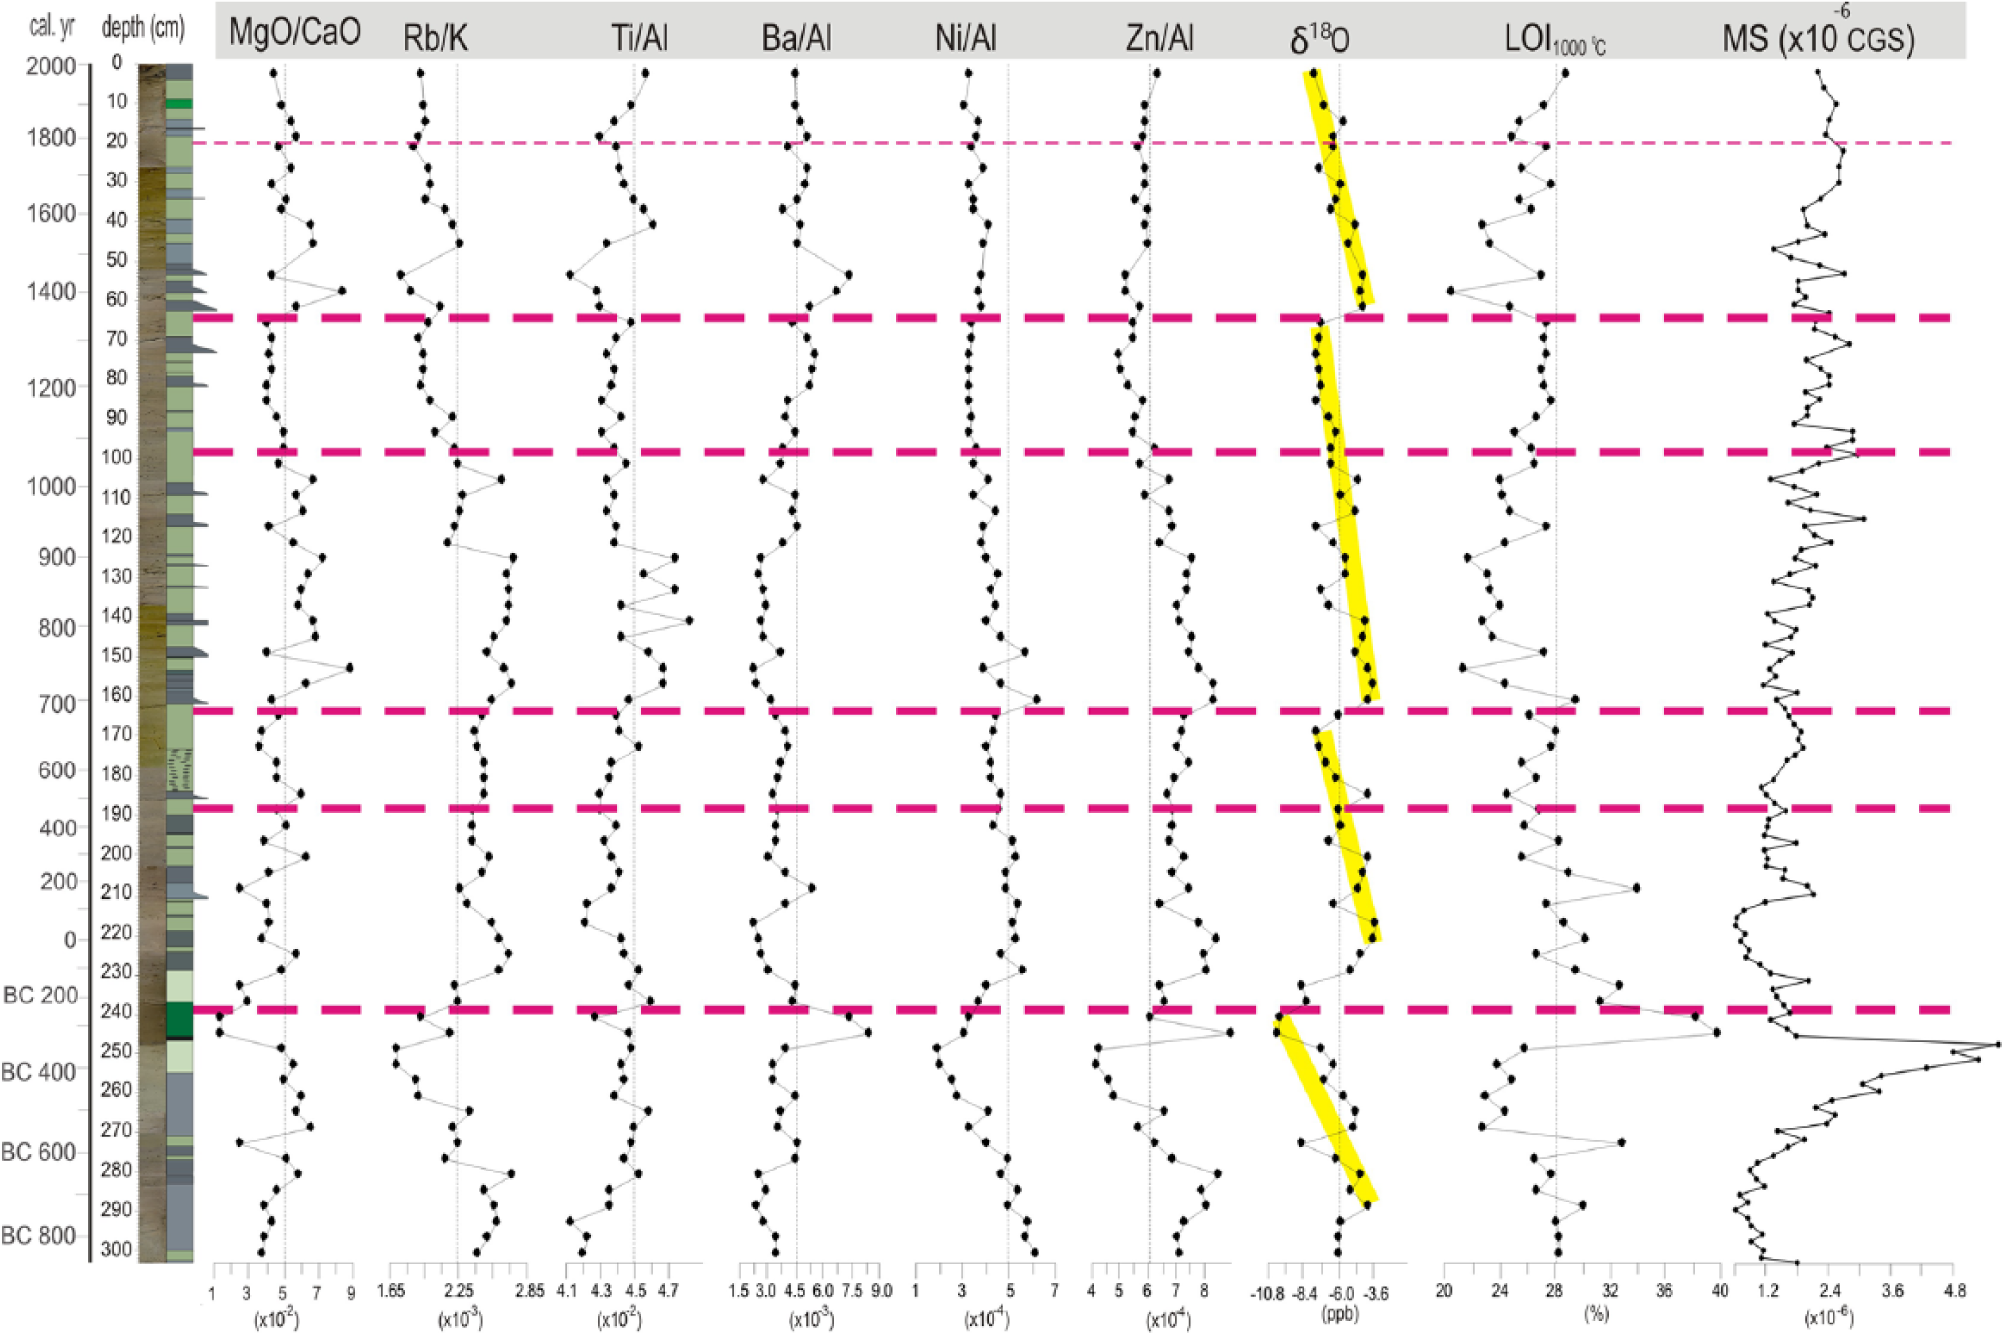
Stable isotope and geochemical data through core CK-1.
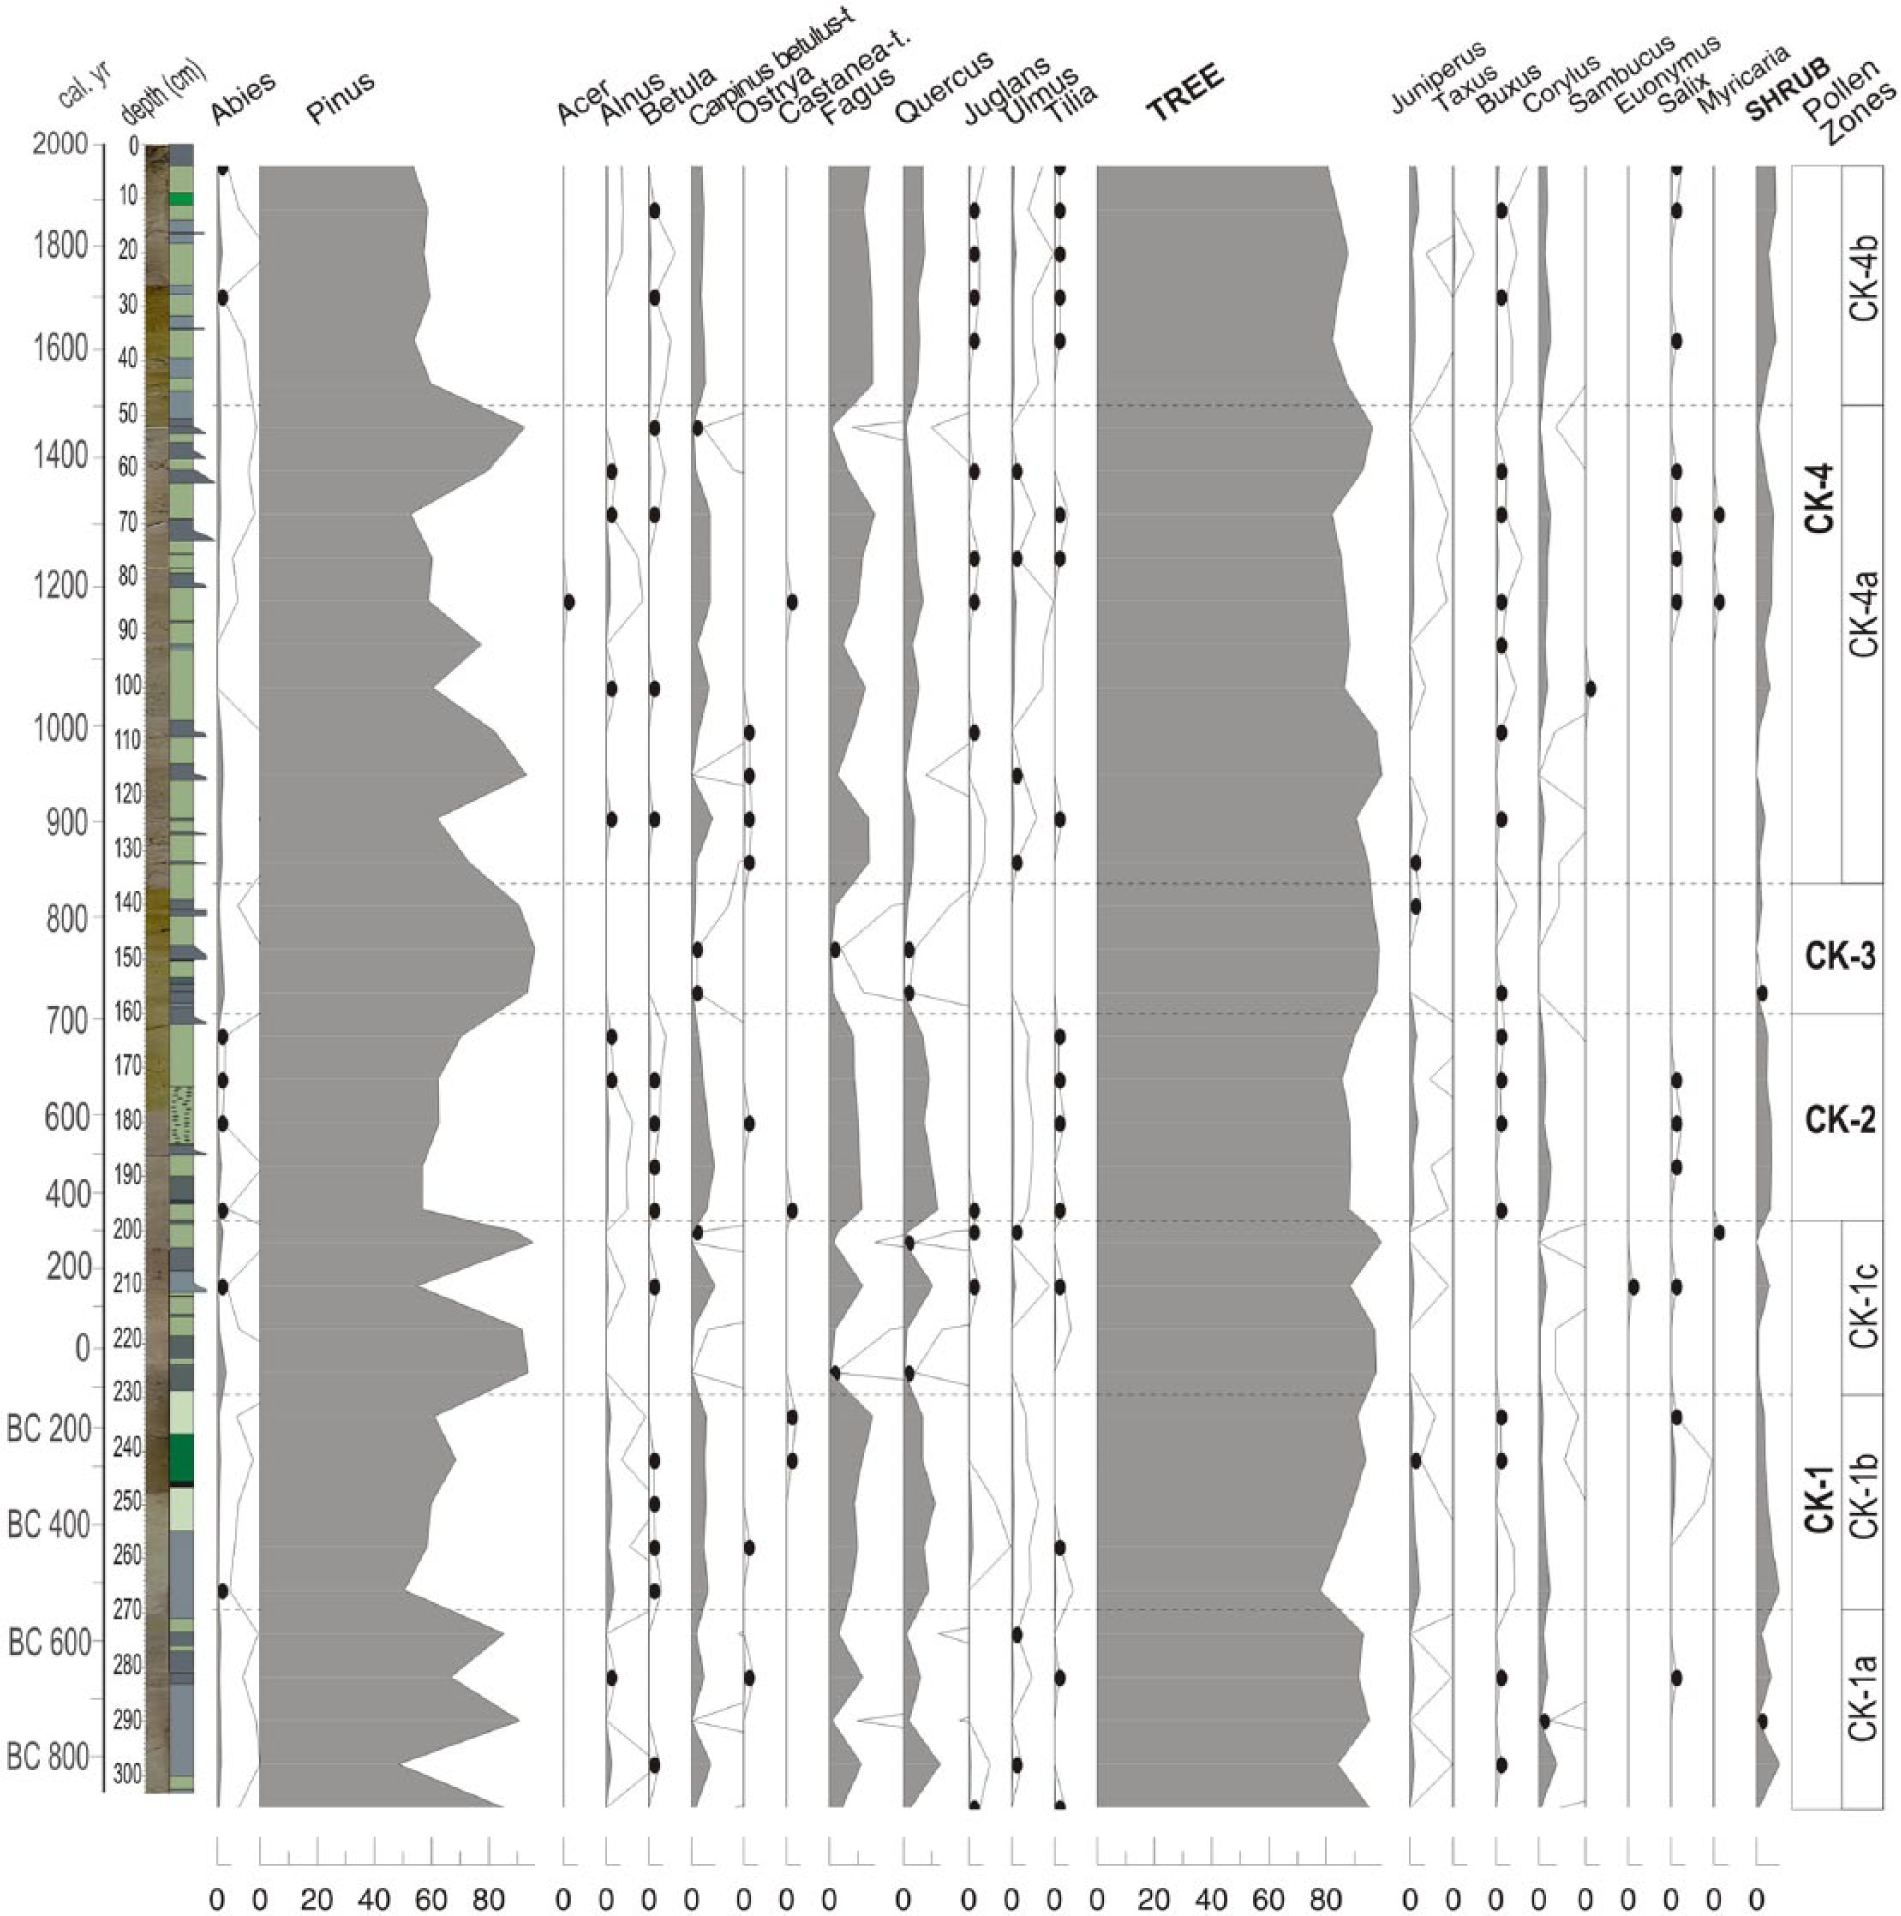
Tree and shrub pollen curves through core CK-1 (analyses made by E Oybak Dönmez).
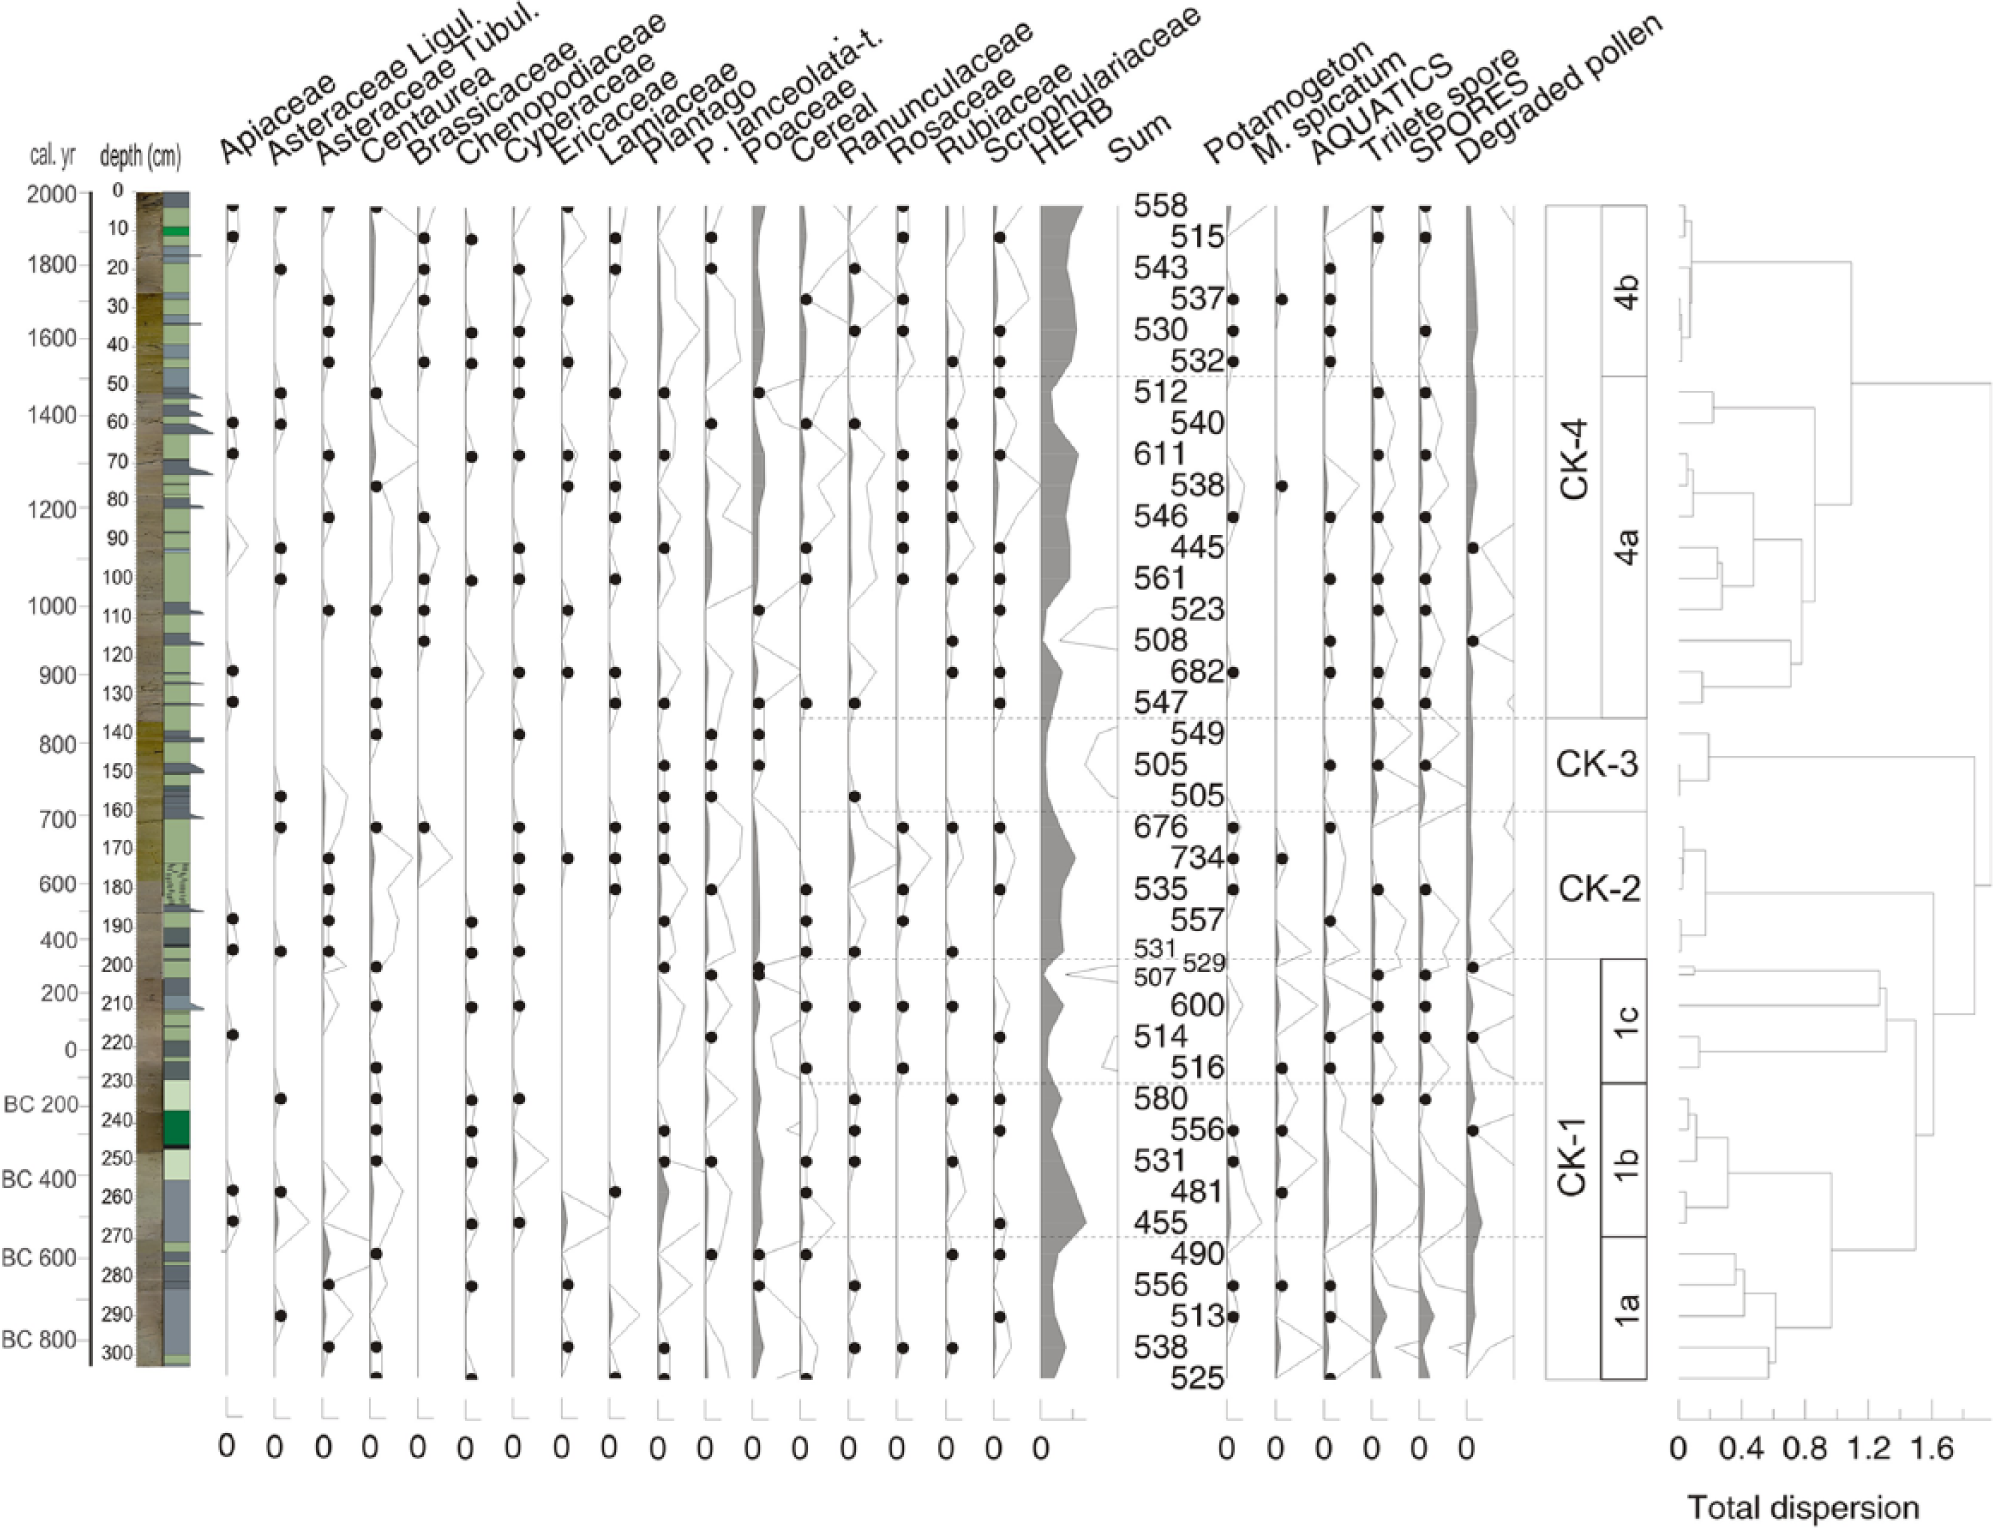
Selected herbaceous pollen, aquatic spores, and corresponding pollen zones through core CK-1 (analyses made by E Oybak Dönmez). Zonation was calculated by cluster analysis (CONISS) after square-root transformation using the software Psimpoll (Bennett, 2007).
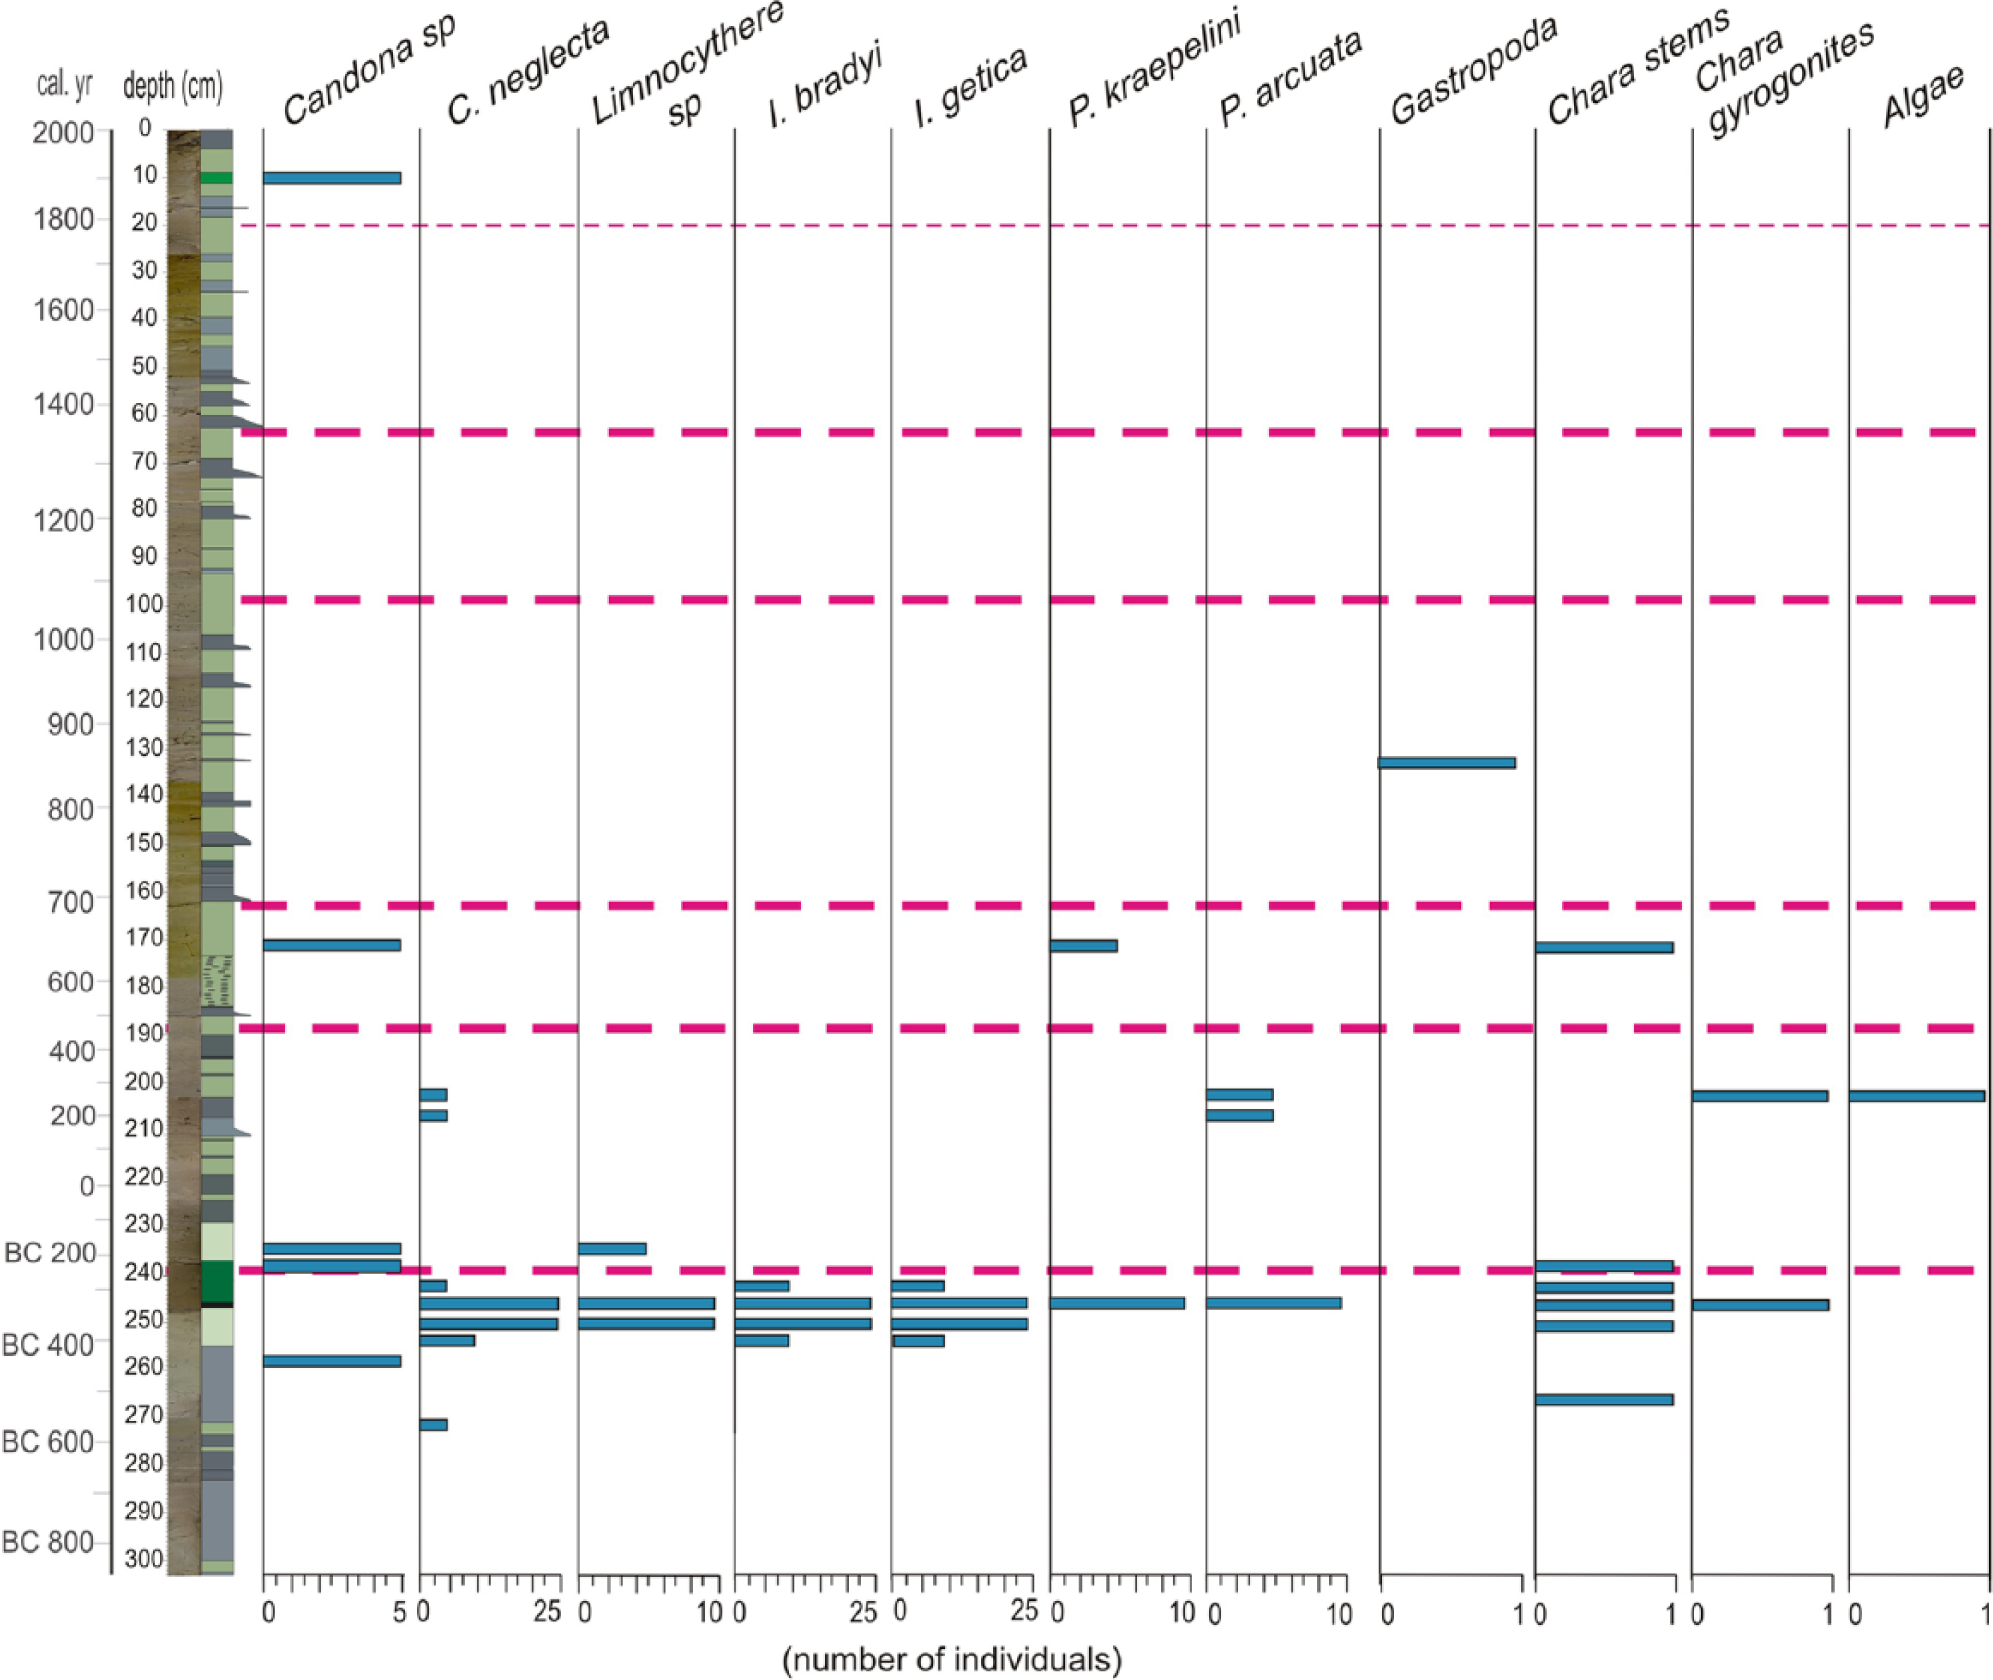
Ostracoda species and other macro-fossil remains through core CK-1 (analysis done by C Tunoğlu).
Results from core CK-1
Types of sediments
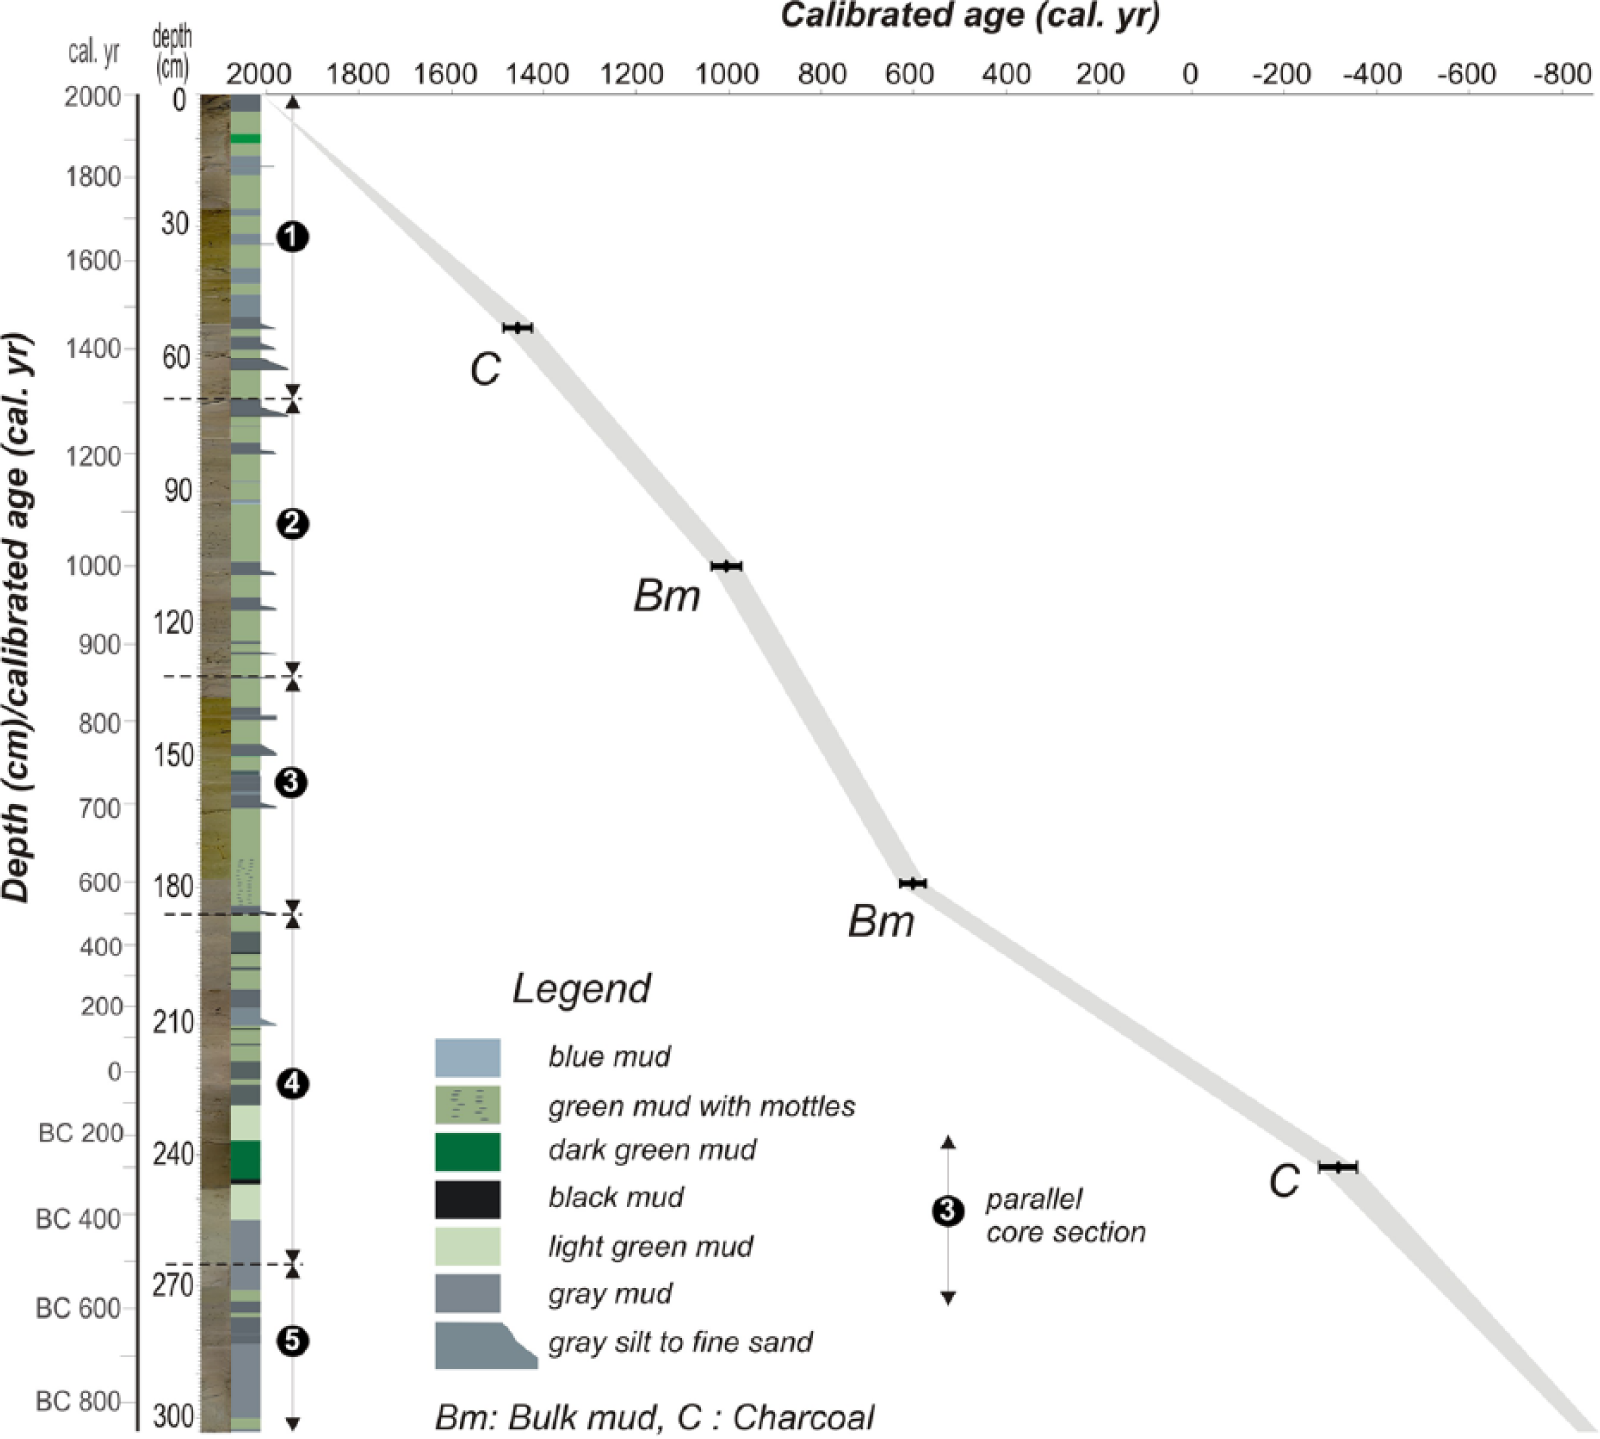
From the bottom (303 cm) to 203 cm of the core, a non-rhythmic alternation of dark and light grey mud occurs (Figure 4). Within these lowermost levels, a dark green interval centred at 243–234 cm and a thin black organic-rich lamina (1 cm) just underneath this interval are particularly noticeable. Upwards, the interval between 203 and 162 cm is dominantly composed of green mud with occasional grey lamina in which an apparent yellow mottling occurs at approximately 180 cm. Between 162 and 106 cm, the first sandy interval appears in which seven thin sandy layers (each 1 to 3 cm thick) alternate with green mud. This interval is overlain by green mud including several thin lamina of grey and blue mud. The second sandy package between 83 and 53 cm is composed of five thin (1–3 cm thick) fine-sand beds and interbedded green muds. The sandy levels have sharp basal contact and contain plant fragments. Alternation of thin (<4 cm) grey and thicker green mud appears upwards. The uppermost 4 cm of the core is composed of dark grey mud with occasional plant debris.
The age–depth model
The core CK-1 is radiocarbon-dated using the following four samples: two samples of charcoal fragments and two samples of bulk mud (Figure 4 and Table 1). The calibrated age of the charcoal sample closest to the base of the core gives 360–270 BC. The three age attributes coming from the upper levels are generally in agreement with each other (Figure 4; Table 1), depicting a rather constant sedimentation rate of 1 mm/yr throughout the studied interval. Accordingly, each sample (4 cm thick) used in the proxy analysis covers an average time interval of 40 years, and the base of the core dates back to 800 BC.
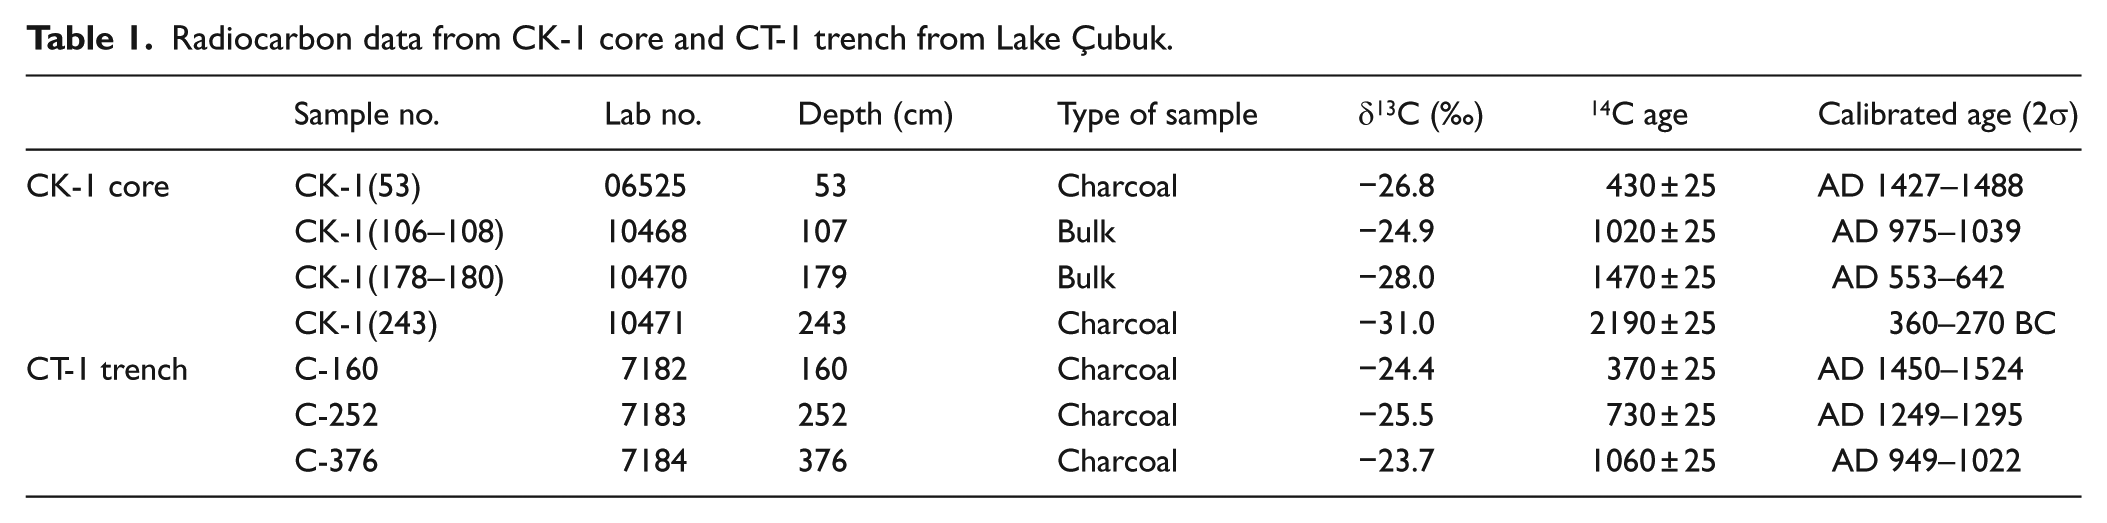
Radiocarbon data from CK-1 core and CT-1 trench from Lake Çubuk.
MS, geochemistry and stable isotope data
The MS values show a gradual increase from the bottom to a depth of 250 cm where an abrupt drop occurs just at the passage to the overlying dark-black lamina (Figure 5). This drop gradually continues until a depth of 210 cm. After an obvious fluctuation at that level, the MS record increases upwards steadily. Larger shift in consecutive samples between 160 and 50 cm is compatible with sand and mud alternations.
Six geochemical proxies are presented in Figure 5. The MgO/CaO and Rb/K ratios are regarded as the salinity/palaeotemperature proxies (Huntsman-Mapila et al., 2006; Ito, 2001; Scheffler et al., 2003; Sinha et al., 2006) and broadly covary. In these two curves, very low values between 280 and 235 cm and low values between 100 and 67 cm are evident, whereas a gradual increase between 210 and 125 cm and a rapid rise at 50 cm, particularly in the Rb/K ratio, are observed. The Ti/Al ratio, an indicator of sediment/soil influx into the lake (Kylander et al., 2011; Sinha et al., 2006), shows regular fluctuations with consistently higher values at depths between 285 and 220 cm. This result is also valid for the interval of 163–125 cm in which the highest Ti/Al ratio of the core matches well with the sandy/silty interval. The interval of 50–0 cm represents the third highest Ti/Al ratio with well-defined rising and falling trends.
The Ba/Al ratio, which reflects the organic productivity in lakes (Agnihotri et al., 2003), displays two major shifts (>3.0). One shift is between 280 and 230 cm and peaks at the black organic level at 246 cm. The second shift occurs between 85 and 45 cm and displays an obvious peak in the sandy interval at 55 cm. The mud-dominated level between 200 and 125 cm shows a consistent decreasing trend.
The Ni/Al and Zn/Al ratios, both of which indicate the degree of reducing conditions (Huntsman-Mapila et al., 2006), have broadly parallel trends. Both curves display a gradually decreasing trend topped with the lowest values of the core at 248 cm. After a rapid rise and following a stable interval of 248–165 cm, these records tend to decrease gradually until 67 cm and then keep constant until the top of the core.
The LOI (at 1000°C) analysis shows a general inverse trend compared with the Zn/Al ratio. From the base of the core until a depth of 250 cm (the black layer), the LOI shows lower values, including even the lowest values (271–250 cm) of the entire record. After a rapid shift to the highest LOI rate (40%) at the black layer at 247 cm, a gradual decrease occurs until a depth of 150 cm. The LOI graph gradually increases until 65 cm, where a sandy bundle appears. After an abrupt shift to minimal LOI values (20%) at that point, the LOI rate increases with abrupt fluctuations until the top of the core.
The δ18O and δ13C stable isotopes are very coherent with each other (r = 0.96) and display four gross long-term (300–600 years) depletion cycles (Figure 5). Each larger cycle shows many smaller centennial cycles, many of which were observed between 230 and 130 cm. The first larger negative δ18O shift (from −4.6‰ to −9.8‰) occurs between 320 and 240 cm. After a rapid recovery interval between 240 and 230 cm, the second large δ18O cycle occurs between 230 and 170 cm. The following very short recovery interval (170–160 cm) is followed by the third larger cycle, the upper part of which exhibits a rather steady depletion of the δ18O values (−7.4‰) without any apparent embedded higher resolution cycles. The last δ18O depletion trend begins at exactly 63 cm after a slight positive shift from −7.4‰ to −4.8‰ where the youngest sandy bundle first appears. Several smaller δ18O fluctuations are evident in the graph, but the sampling resolution does not allow their precise positioning. The present level of δ18O depletion (−7.7‰) appears to be the highest of all of the record, except the important turnover at 245 cm.
Palynological data
The pollen diagram is largely dominated by Pinus (Figures 6 and 7). The other prevailing arboreal taxa (AP) are Fagus, Quercus and Carpinus betulus-t. The shrub taxa contain low percentages of various small trees and tall bushes with a small dominance of Corylus. This reflects the location of the lake in mid-mountains with the deciduous vegetation around the lake and the pines at higher altitudes. The non-arboreal pollen is diverse with a nearly continuous curve of Poaceae (Figure 7). Human activity indicators are present throughout the diagram. Aquatic pollen grains and spores are rather sparse. Cluster analysis (CONISS) of pollen data after square-root transformation enabled the discrimination of four pollen zones with some subzones (Figures 6 and 7).
CK-1 (303–198 cm)
It comprises three subzones. CK-1a (303–273 cm) is characterized by very high AP (mainly Pinus (pine) and Abies (fir)) and low shrub and herbaceous percentages (Figure 6). CK-1b (273–230 cm) is represented by the slightly lower AP and significantly high shrub and herbaceous pollen percentages (almost doubled compared with CK-1a). A rise in the Poaceae, cereals, Centaurea and Juniperus curves marks this pollen zone (Figure 7). No significant change in pollen types is seen at the interval 250–240 cm where a number of proxies display anomaly. CK-1c (230–198 cm) is distinguished generally by higher AP (>92%) and lower shrub and NAP. Pine pollens show very high percentages (90%), whereas Quercus, Alnus and Fagus pollen nearly disappear, except in one sample. Pollen percentages of Poaceae and cereal decrease, and Asteraceae and Buxus pollen are reduced to nearly zero.
CK-2 (198–160 cm)
Pine pollen percentages drop (60%), whereas all of the other tree pollen percentages increase. All of the shrub and herb pollen percentages increase relative to the underlying pollen zone. The Corylus and Juniperus pollen percentage peaks are doubled, whereas a peak occurs in Centaurea and Ranunculaceae pollen centred in the mottled muds at 180 cm.
CK-3 (160–136 cm)
Arboreal pollen percentages rise over 95% in this small zone. The Pinus and Abies pollen percentages are higher, but the Fagus, Quercus and Alnus percentages retreat to background values (Figure 6). All of the shrub and herb pollen percentages decrease dramatically. Corylus and Juniperus nearly disappear. Poaceae, Centaurea, Asteraceae and Ranunculaceae pollen are almost lacking too (Figure 7).
CK-4 (136–0 cm)
Two subzones are distinguished here. The subzone CK-4a (136–48 cm) is mostly characterized by lower arboreal pollen rates and gradually increasing NAP rates and is divided into two subzones. Contrary to other AP, the Fagus and Ulmus pollen gradually increases with some breaks. Corylus and Juniperus as well as cereals, Poaceae and Centaurea pollen values display a gradual increase followed by a dramatic decrease in Poaceae and Plantago pollen on the top of the zone. The subzone CK-4b (48–0 cm) is characterized by the minimum Pinus and the maximum Fagus pollen values and a progressive increase in the Quercus and Carpinus pollen values (Figure 6). Shrub pollen displays an overall increase. The cereal and Poaceae pollen is the highest of all the record in this zone (Figure 7).
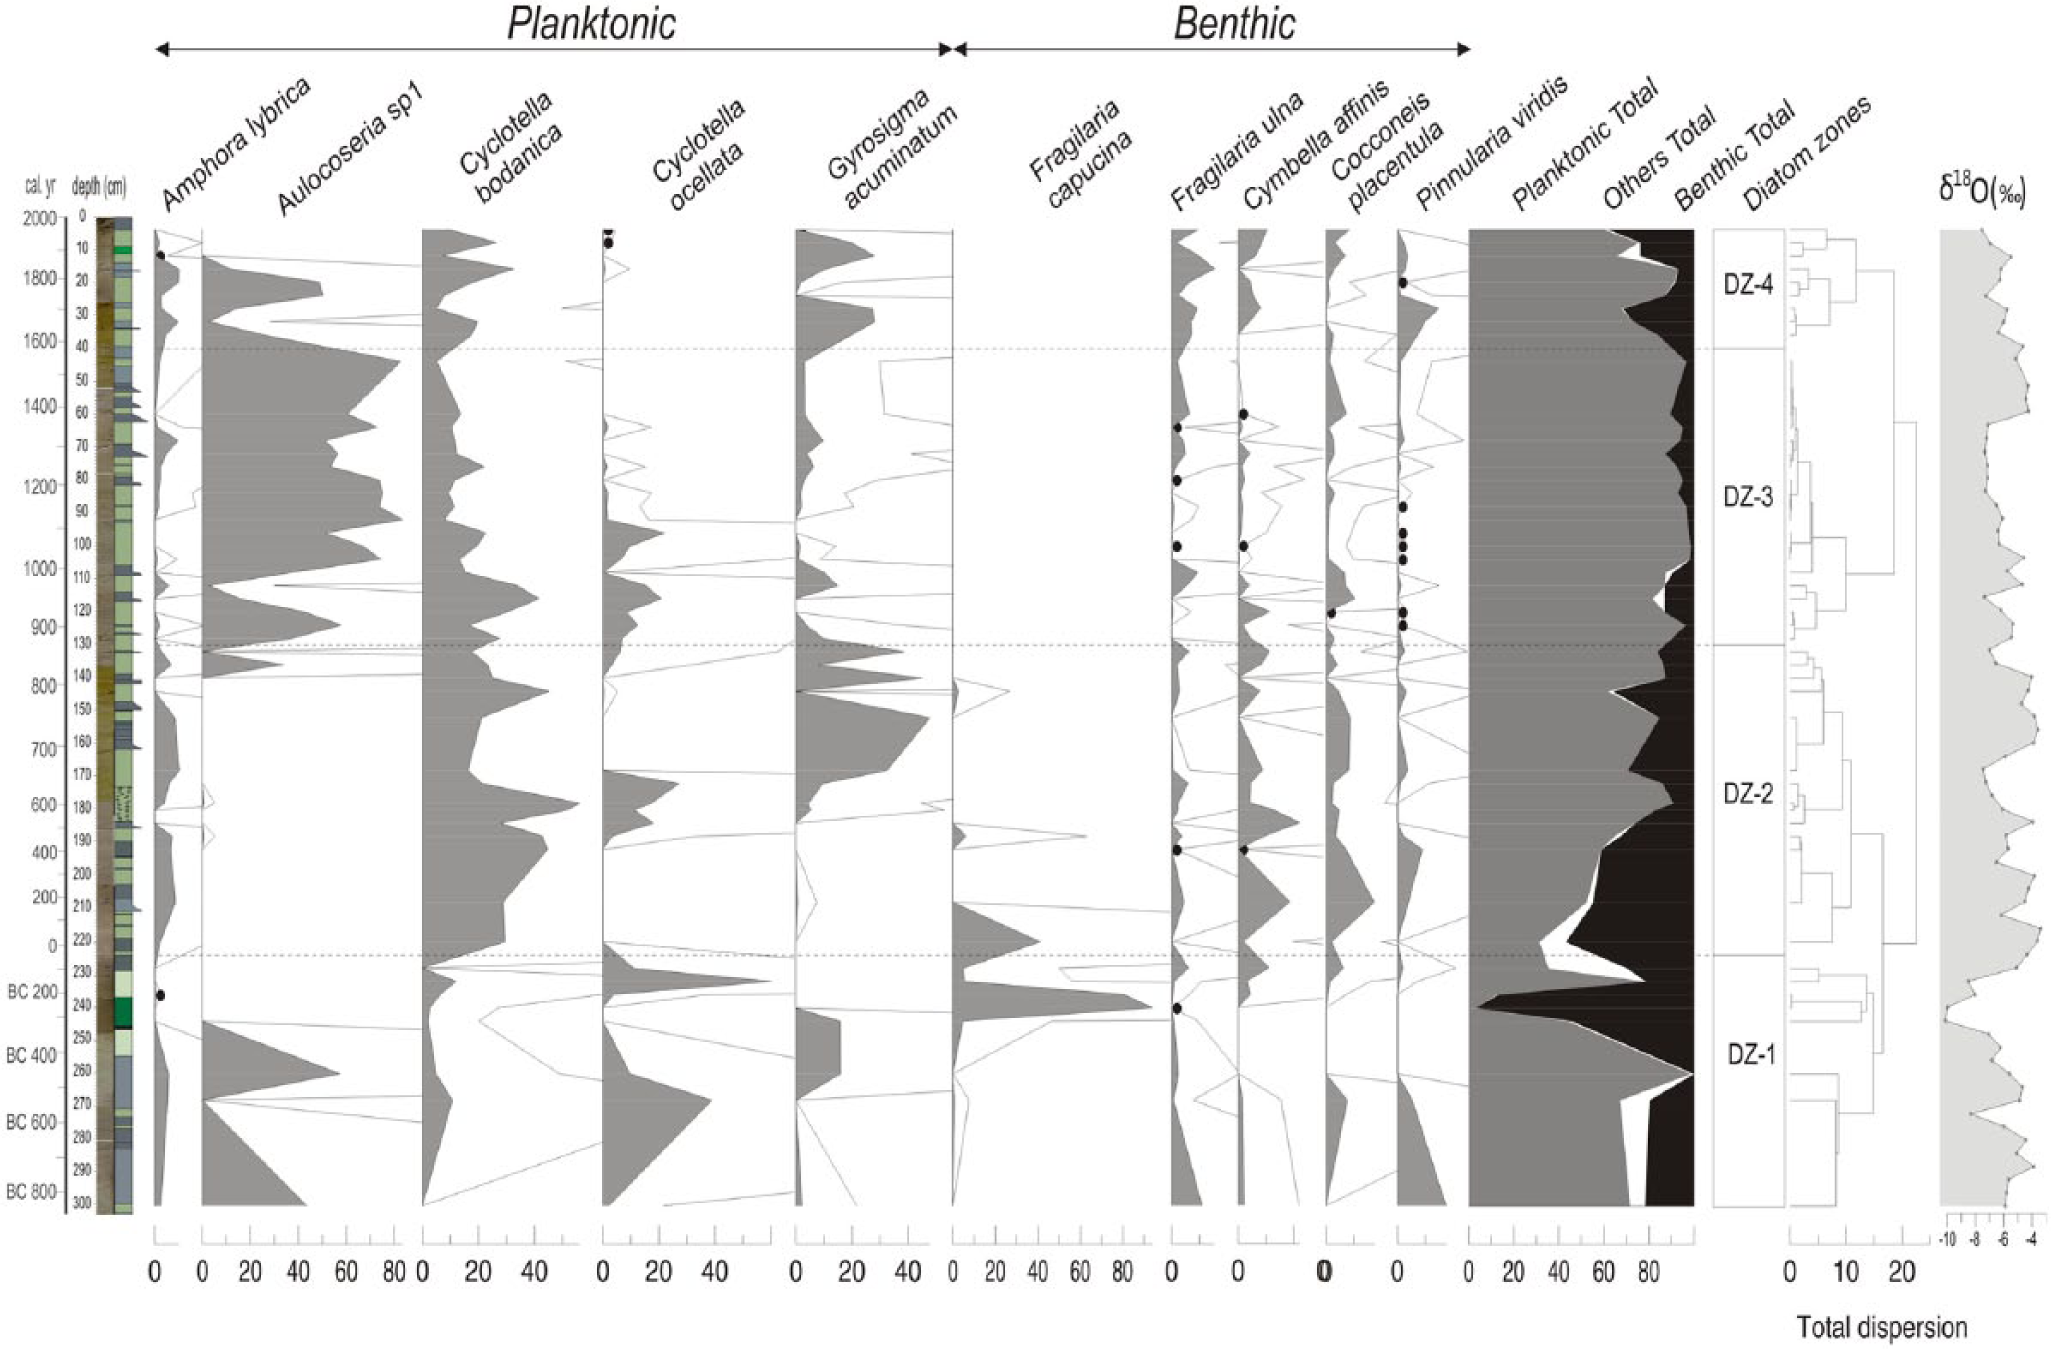
Diatom data
We determined 97 diatom taxa in core CK-1 and regrouped them as benthic and planktonic based on their habitats. The most continuous taxa, along with the planktonic and benthic diatom relative abundance, diatom zones and the δ18O concentrations on the bulk mud, are displayed in Figure 8. The highly fragmented nature of the diatom distribution does not enable a detailed account of environmental change, but general traits can be distinguished. Benthic diatom abundance in the lower part of the zone DZ-1 (303–252 cm) is about 20%, but the overlying part of the zone (252–224 cm) comprises up to 90% benthic diatom fauna (Figure 8). These upper parts of the diatom zone are characterized by the dominance of Fragilaria capucina that prefers low-salinity waters (Battarbee et al., 2001) and more negative δ18O values compared with lower levels. The abundance of benthic diatoms gradually decreases throughout the diatom zone DZ-2 (224–130 cm). Cyclotella bodanica and Cocconeis placentula (both alkalophilous species) occur continuously, and Cycotella ocellata and Gyrosigma acuminatum sporadically appear and make up the bulk of planktonic diatoms in this interval. In zone DZ-3 (130–40 cm), planktonic diatom abundance is highest (>95%) of all the record. This zone is typical with large numbers (<70%) of Aulacoseira sp. and Cyclotella bodanica in lesser amounts. Cymbella neocistula above 62 cm completely disappears sequentially within a 4-sample-thick interval (20 cm); instead, a benthic diatom flora with few species and individual variability (mainly Cocconeis placentula, Epithemia adnata and Hantzschia amphioxys) appears (Figure 8). Zone DZ-4 (40–0 cm) is characterized by increased diatom flora (mainly Pinnularia viridis and Fragilaria ulna) up to 25% followed by a planktonic bloom of Aulacoseira sp. and Cyclotella bodanica centred at 20 cm. Slightly negative δ18O values characterize this zone. The uppermost part of this diatom zone above 10 cm displays increasing trend of benthic fauna (basically Cymbella affinis and Cocconeis placentula) and is accompanied by a slight negative shift in δ18O values (Figure 8).
Ostracoda data
In terms of the ostracoda diversity, core CK-1 is quite poor. Seven ostracoda taxa are found, mostly in three thin intervals (Figure 9). The interval of 255–245 cm includes the richest and the most abundant fauna composed of Candona neglecta, Limnocythere sp., Ilyocypris bradyi, Ilyocypris getica, Physocypria kraepelini and Potamocypris arcuata. This interval includes a considerable quantity of chara stems and gyronites. The neighbouring lower and upper sediments mostly host a cosmopolitan species, Candona sp. The interval of 210–200 cm is typical with rare Candona neglecta and Potamocypris arcuata along with gyronites and algae. In one sample at 172 cm, Candona sp., Potamocypris arcuata and chara were encountered (Figure 9). Among the determined fauna, Candona neglecta is considered a cold-stenotherm and oligothermophilous species (Roca and Baltanas, 1993). Candona neglecta is also tolerant, even when below hypoxic conditions, which is under the O2 content of 3 mg/L at the sediment–water transition in the summer period (Meisch, 2000). Ilyocypris getica has been found in small, shallow water bodies and is tolerant of slight increases in salinity conditions. Ilyocypris getica lives most likely in stenothermal conditions between 10 and 15°C (Meisch, 2000). Ilyocypris getica prefers muddy-sandy substrates (Bronstein, 1947; Meisch, 2000). Ilyocypris bradyi typically lives in freshwater lakes, springs, swamps, fluvial waters and brackish waters at the coastal areas and prefers oligohaline (0.3–4.4‰) conditions.
Description of the trench CT-1 and its correlation with the core CK-1
The trench CT-1 was dug on gravelly delta top sediments of Soğukpınar creek, 150 m away from the present lake shoreline (Figure 2). In the 4-m-deep trench, we observed three sandy intervals erosively overlain by gravels. Sandy layers are typically yellow in colour, fine-grained and massive, and closely resemble those actually being deposited in the present shoreline. Sandy intervals occasionally comprise mollusc shells and carbonized plant fragments (Figure 10). The overlying gravels are composed of 2- to 5-cm-thick angular limestone fragments, with a clast-supported texture. The intergranular space is partially filled with sand/silt grade clastic material. Radiocarbon dating from each of the three fine-grained intervals yielded stratigraphically conformable calibrated dates as AD 970, 1270 and 1485 (Table 1). Figure 10 depicts the proposed correlation of the trench CT-1 with the core CK-1. Dates in core CK-1 in this figure are extrapolated according to the age–depth model in Figure 4. As anticipated, the sedimentation rates at the centre of the lake are reduced compared with gravelly delta top areas. In the trench, 370-cm-thick sediments have been deposited since AD 970, whereas the concurrent sedimentation in the lake centre is only 100 cm thick. This correlation indicates that the thicker lowermost gravel bed would correlate to the two thin sandy beds at approximately 110 cm. The middle gravelly bed is most likely the lateral equivalent of the sandy interval at 75–50 cm in the core. The correlated horizon of the upper gravel layer in the core is not immediately apparent.
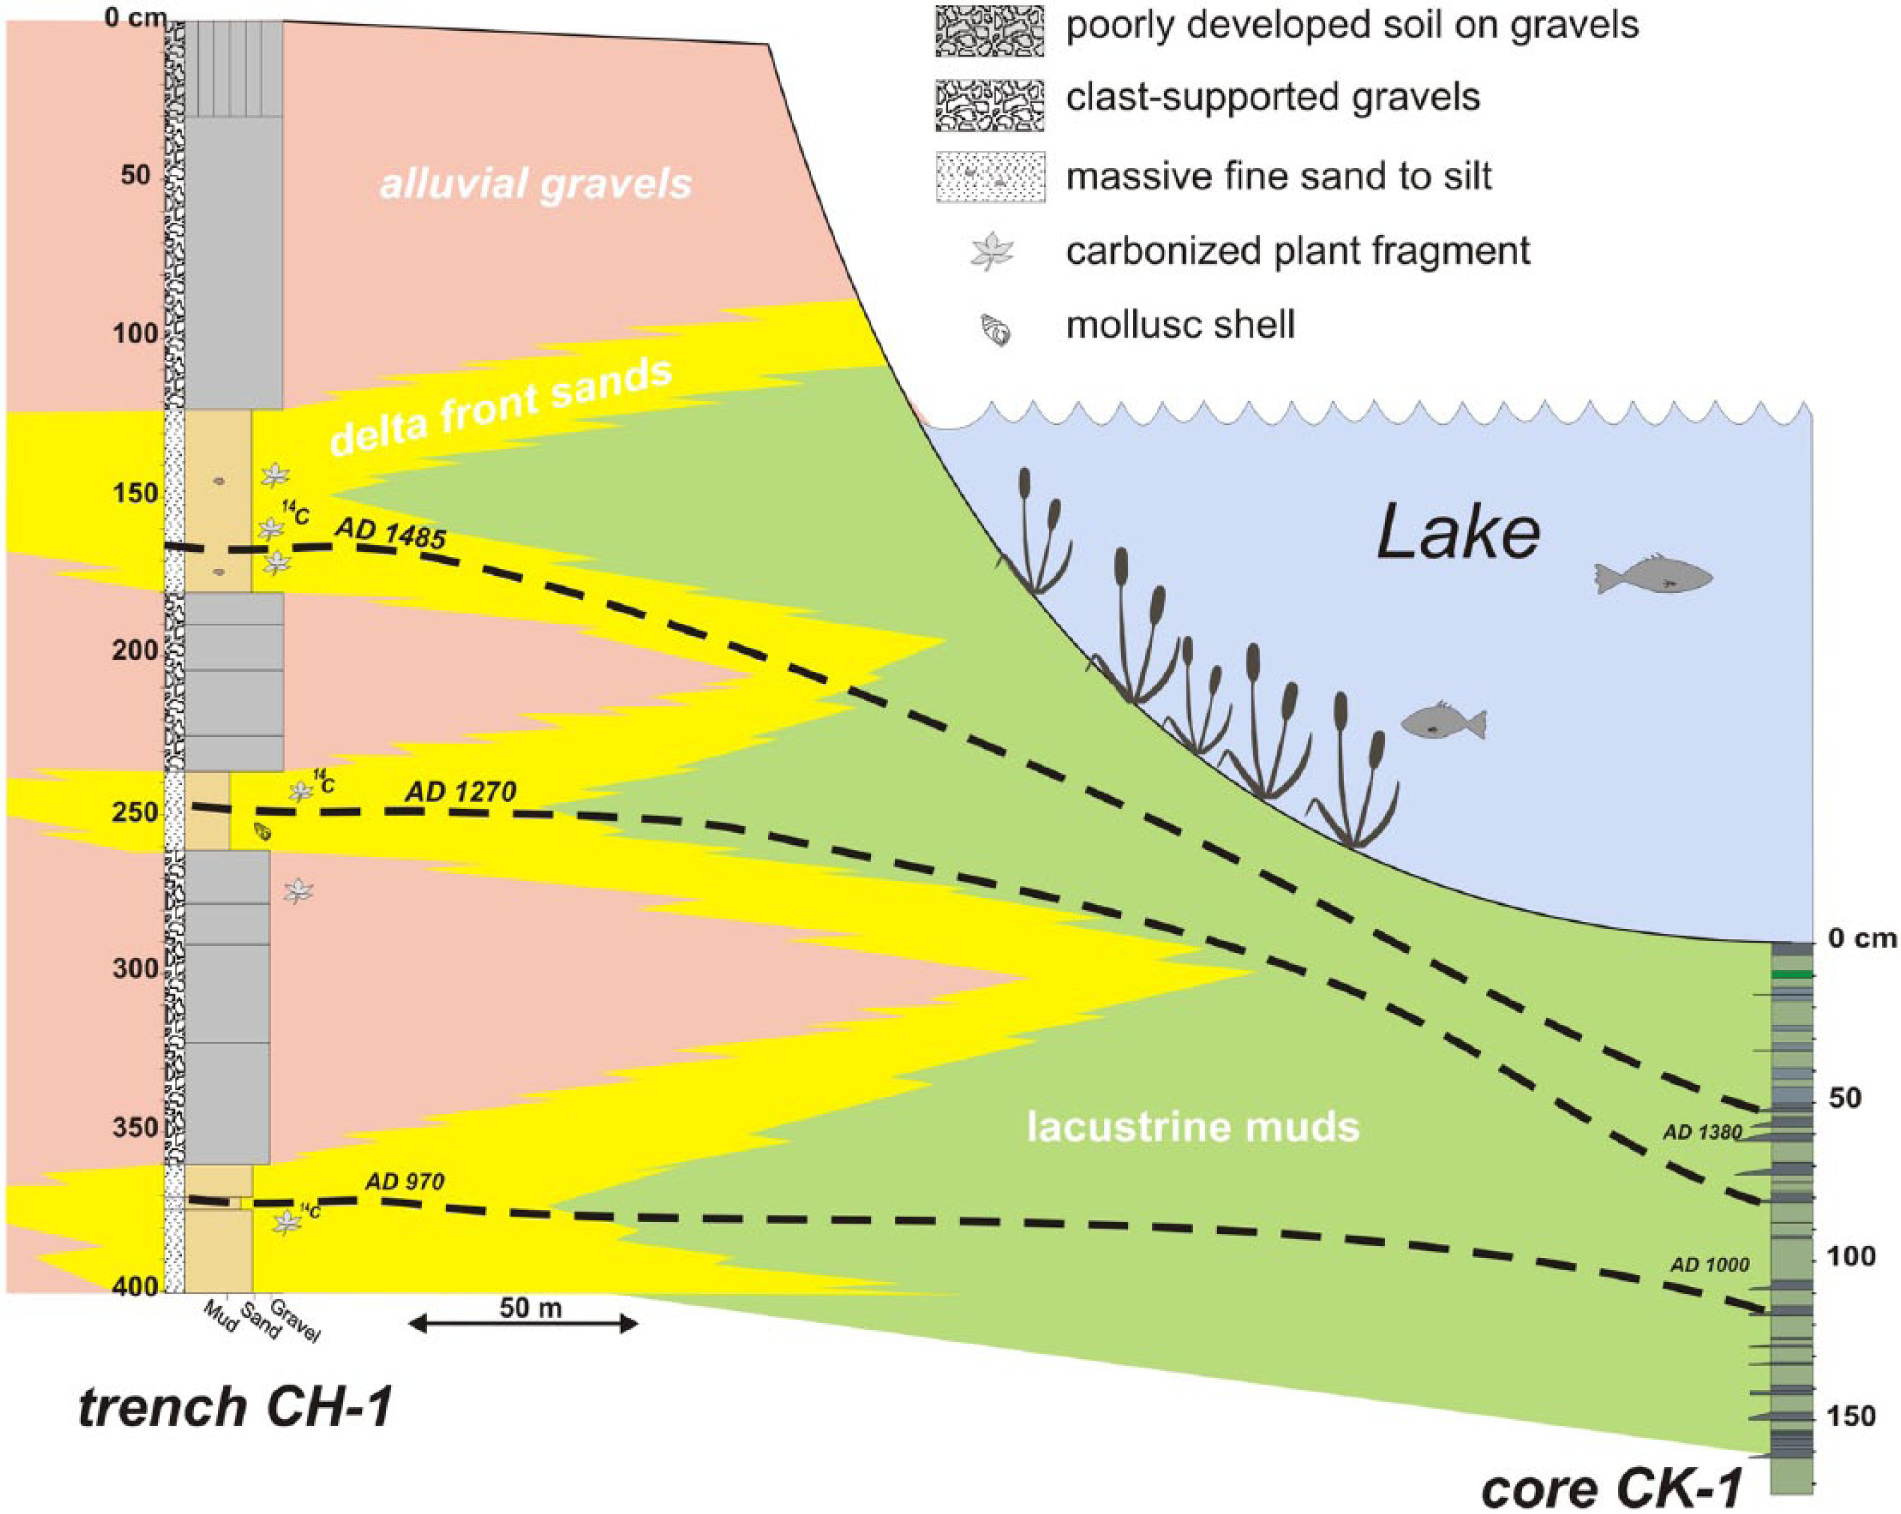
Correlation of core CK-1 and trench CT-1.
Interpretation of the proxy records
The above-mentioned multi-sourced data from the core CK-1 and the trench CT-1 strongly suggest that the trends in several datasets are generally similar, and their onsets are nearly simultaneous on the order of 2–3 samples thick (80–120 years). The diversity of the proxies is considered particularly significant in resolving the climatic signal and filtering out the anthropogenic noise.
Stable isotope ratios of δ18O and δ13C are believed to be direct climatic proxies, although their interpretation is not straightforward (Cronin, 1999; Jones and Roberts, 2008; Leng and Marshall, 2004; Stuiver, 1970). Generally, negative δ18O shifts would indicate lower ambient temperatures due to the predominance of isotopic fractionation of rainfall, but the reverse case (positive shifts) would also indicate a decrease in winter rainfall and aridity, as shown by Jones et al. (2006). Diatom studies are favourable for the understanding of the precipitation/evaporation ratio shifts by providing environmental (such as salinity and temperature) and ecological (benthic vs planktonic) data (Battarbee et al., 2001; Smol and Stoermer, 2010; Woodbridge, 2009). Herein, the sudden proliferation of certain species independent of external climatic control appears to be an important problem to address (England et al., 2008). In addition to other biological proxies, ostracods form another strong tool for the deduction of the past physical and chemical properties of lake bodies (Meisch, 2000). However, geochemical proxies provide important insights in terms of physicochemical conditions of lakes and watersheds (Boyle, 2001). We used a selected dataset to understand salinity (MgO/CaO, Rb/K), detrital influx (Ti/Al), organic productivity (Ba/Al) and reducing conditions (Ni/Al, Zn/Al) in the lake. It has been suggested that increased MgO/CaO and Rb/K ratios would indicate increasing arid conditions (i.e. a lower precipitation/evaporation ratio) because most of the Ca has already been precipitated at lower temperatures (Ito, 2001). Similarly, Rb requires a higher temperature for deposition. Ti increases in lake sediments are explained by higher sediment influx and, hence, higher runoff (Sinha et al., 2006). Ba is believed to be a key element enriched in lake sediments in which organic productivity is elevated (Agnihotri et al., 2003). Finally, Ni and Zn are the elements enriched in bottom sediments in relatively reducing conditions and would indicate higher lake levels (Huntsman-Mapila et al., 2006). Pollen, the last proxy used for past environmental reconstruction, is regarded as the direct manifestation of vegetation cover of the watershed and occasionally the larger area and has direct implications in terms of past climates and human activities (Bradley, 1999; Moore et al., 1991). Figure 11 is a summary illustration that enables correlation between various types of proxy records. Below, we made a climatic interpretation of the 2800-year long record in Lake Çubuk. Climate phasing of the record is basically made according to lake level changes derived from diatom data, δ18O variations and partially pollen data. Figure 11 also encompasses well-known Anatolian historical periods and climatic events (after England et al., 2008; Kuzucuoğlu et al., 2011; Vermoere et al., 2000) in order to enable societal and regional climatic connections.
Phase I (303–240 cm). It comprises two subphases (I-1 (303–270 cm) and I-2 (270–240 cm)) with relatively different climatic traits and mostly corresponds to the Near-East Aridification Phase (975–250 BC) in the literature (Kaniewski et al., 2007; Schilman et al., 2001). The δ18O values are progressively depleted from I-1 to I-2, indicating cooling (except for an interval centred at 274 cm), and achieved a −10 ppb level at the top of this phase (Figure 5). The Zn/Al ratio shows a progressive decrease due to lowering lake levels. Similarly, the MgO/CaO and Rb/K ratios undergo a declining trend during the same period. Although the benthic diatom ratio is high at the base (50–60%), the basic shoaling of the lake occurs in the upper part, concurrent with drought. In terms of pollen assemblages, the lower two subzones of CK-1 pollen zone mostly overlap with this phase (Figure 8). CK-1a represents a relatively wet climate dominated by a wider arboreal and lesser shrub and herbaceous covers, in accordance with more positive δ18O signals (Figure 11). Approaching more drought conditions at the end of this phase, the composition of the vegetation cover reverses (CK-1b pollen zone). Progressive cooling and shoaling of the lake level are best expressed in the ostracoda fauna (Figure 9). The richest ostracoda fauna of the entire record is mostly characterized by Candona neglecta, Limnocythere sp. and Ilyocypris bradyi, which indicate a shallow and cool lake environment. Similarly, benthic diatom abundance characterized by a low-salinity species Cocconeis placentula reaches the maximum of all the lake record towards the end of diatom zone DZ-1 (Figures 8 and 11). This further substantiates the conclusion that the thin black bed at 245 cm would be an organic-rich layer formed under extremely shallow conditions.
Phase 2 (240–104 cm). This is characterized by an overall lake level deepening (i.e. wet) between 270 BC and AD 1060 interrupted by short-term drop or still-stand intervals of the lake level. It encompasses two well-established warm periods (‘Roman Warm Period’ and ‘Medieval Warm Period’) and the transitions in-between (Kuzucuoğlu et al., 2011).
Subphase II-1 is found between 240 and 195 cm of the core and mostly corresponds to ‘Roman Warm Period’ in the Mediterranean (Eastwood et al., 1998; Kaniewski et al., 2007). An abrupt positive shift of the δ18O concentrations at the base and a later gradual recovery towards more negative values are indicative of an early drier and then mild and wet climate. Accordingly, the benthic diatom values show a gradual decrease parallel to the δ18O curve in most of the subphase, and the ostracoda fauna completely disappear (Figure 11). The Rb/K ratio indicates increasing organic productivity in the lake (Figure 5). The pollen zone CK-1c, which is rather characterized by prevailingly arboreal pollen (>90%), also testifies of a mostly warm and humid climate (Figure 11).
Subphase II-2 (197–163 cm) is a cold interval that fits well to the late Roman–early Byzantine period (AD 450–670). The δ18O concentrations shift to relatively negative (−6 and −7 ppb) values (Figure 11). Geochemical proxies do not respond to this slight cooling, but a mild decrease in the planktonic diatom abundance matching well with the appearance of certain species, such as C. ocellata and Cymbella affinis, would indicate slightly harsher alkaline conditions (Figure 8). A subtle climate variation in this period is mostly reflected in the CK-2 pollen zone, which is apparently dominated by shrubs and herbs (Figure 11).
Subphase II-3 (163–104 cm) matches well with the Dark Ages and late Byzantine period (AD 670–1070). The δ18O signal displays a sharp positive shift to the −4 ppb level within a 2-sample-thick interval (80 years) and then displays a gradual negative shift towards the end of the period. Over the entire period especially above 147 cm, the planktonic diatom percentages gradually increase (upper part of DZ-2 and lower part of DZ-3) and reach the maximum values of the record, indicating maximum lake levels (Figure 11). The first massive appearance of Aulacoseira occurs in the upper part of this period (Figure 8). Salinity indicators display lower values, especially in the upper parts, supposedly resulting from decreased evaporation. The upper part of the pollen zone CK-2 and the lower part of the pollen zone CK-4a mostly match with this period and indicate the most extensive (>96%) arboreal cover of the entire record. Cereals nearly disappear, indicating minimum agricultural activity (Figure 7). The lowermost fine-grained interval in trench CT-1 (Figure 10) represents highstand lake level and further testifies to humid conditions in this subphase.
Phase III (104–0 cm). This is characterized by an overall lake level drop, first in a slow pace and then in a rapid and fluctuating manner. It hosts the record of the ‘Little Ice Age’ (LIA) and the Modern Warming.
Subphase III-1 (100–63 cm) overlaps with the Seljuq period (AD 1070–1350). The δ18O negative shifts of 1–1.5 ppb compared with the previous period indicate slightly cooler conditions. The smallest benthic diatom abundance in this period indicates less evaporative conditions, although a slight increase towards the top would indicate a small gradual lake level decrease, and hence aridity (Figure 11). A massive occurrence of freshwater preferred by Aulacoseira sp. in particular shows less evaporation (Figure 8). The Rb/K ratio depicts a progressive salinity decrease, whereas a slight increase in the Ba/Al ratio indicates an increasing organic activity under cooler conditions (Figure 5). The pollen subzone CK-4a grossly overlaps with the Seljuq period with a slight time shift (50–60 years) from both the lower and upper boundaries. The arboreal coverage, particularly that of Pinus, significantly decreases, whereas Poaceae gain their maximal values (>3%) for the first time in the record (Figure 7). This vegetative change is interpreted as a climatically driven phenomenon. Furthermore, a fine-grained interval in trench CT-1 substantiates a highstand lake level and hence more humid conditions at the end of this phase around AD 1200–1300 (Figure 10).
Subphase III-2 (63–28 cm) mostly covers the LIA. It is typical with first a still-stand and then a rapid lake level drop (above 44 cm) according to diatom data. Moreover, the base of the LIA is apparent with an abrupt positive shift of the δ18O value from −7 to −5 ppb within a 1-sample-thick (40 years) interval (Figure 11). Progradation of the middle gravelly bed in trench CT-1 at about AD 1300 is likely related to a small lake level drop at the onset of LIA (Figure 10). Most of the geochemical proxies respond to this important climatic variation in a general parallel manner (Figure 5). The δ18O signal displays a gradual negative shift until the end of the Subphase III-2. A rapid positive shift at the beginning of the LIA is interpreted as decreased winter precipitation and increased evaporation, following the interpretation of Jones et al. (2006) for Lake Nar, Central Anatolia. In the early times of the LIA between 63 and 48 cm, the upper part of pollen subzone CK-4a is documented where the AP are relatively high and shrubs and herbs are less represented (Figures 6, 7 and 11). We suggest that this lower interval corresponds to the coolest part of the LIA between AD 1400 and 1500. Subphase III-3 (28–16 cm) is a brief interval of short-term lake level rise spanning AD 1700 to 1830. This rise is well reflected in gradual apparent positive shift in δ18O values. The last Subphase III-4 (16–0 cm) corresponds to the Modern Warming and is characterized by a rapid lake level drop accompanied by negative shift of δ18O and lower values of MgO/CaO ratio (Figure 11).
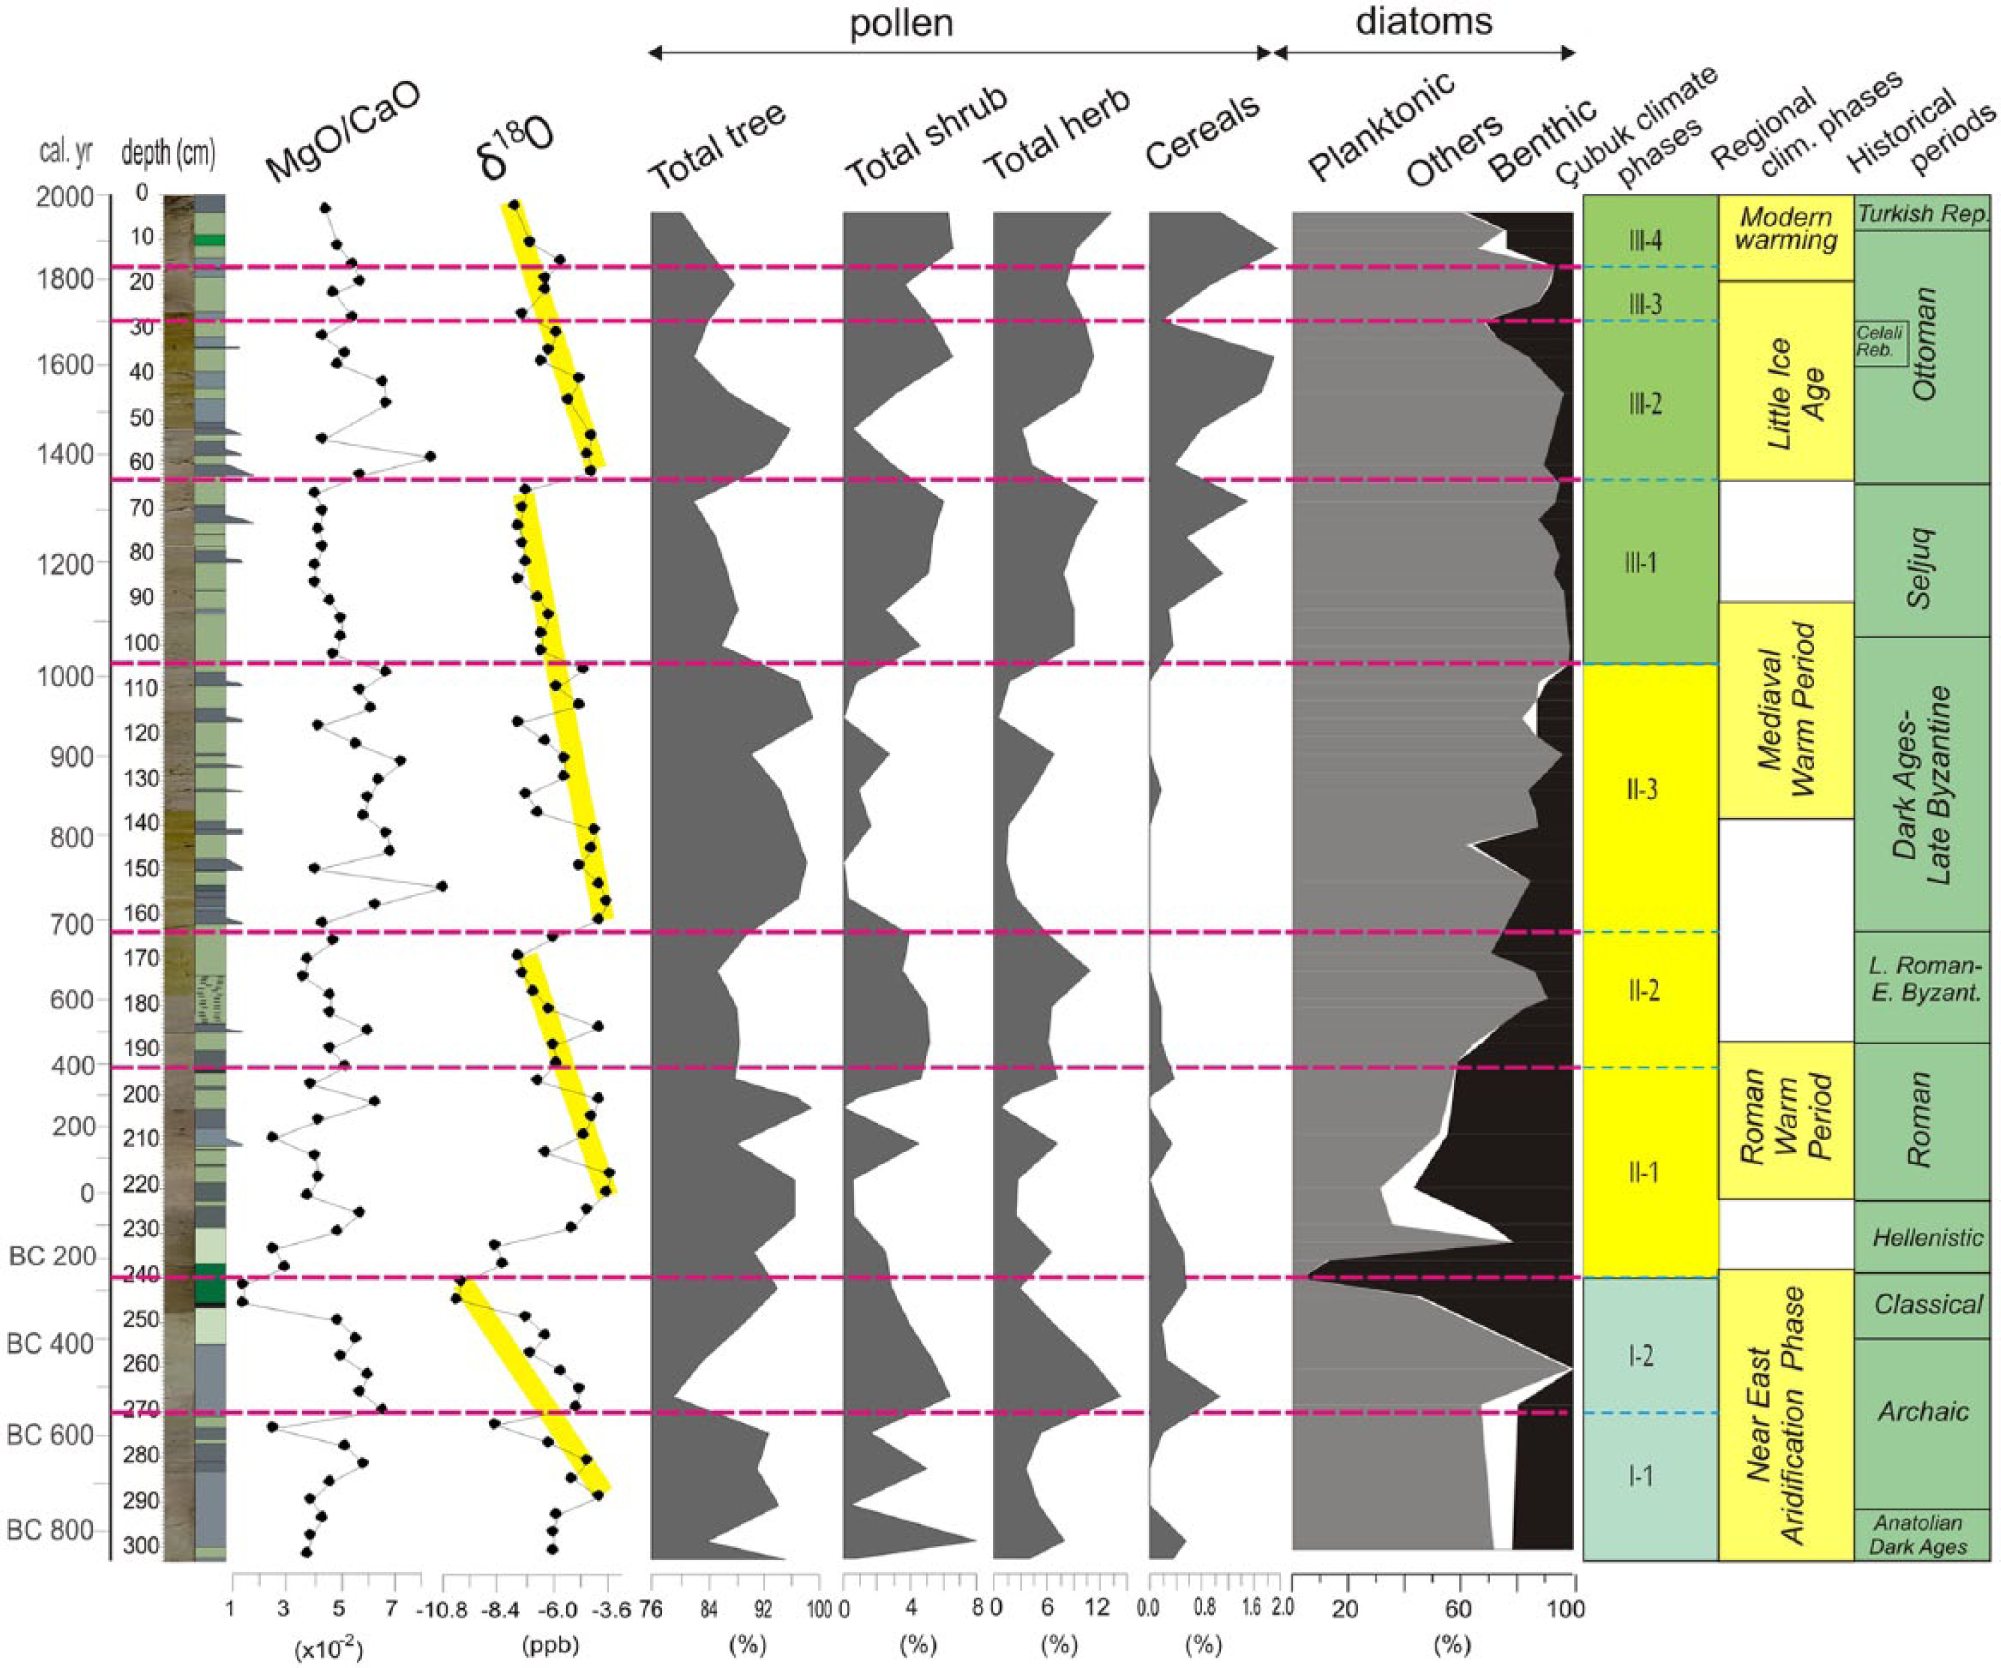
Summarized proxy records in core CK-1.
Discussion
Figure 12 presents the climatic turnovers in the last 2800 years documented by this study and by some other studies carried out in different parts of Anatolia on a chronological base. The selected records are generally continuous and have a high time resolution. Many other valuable archives with narrower time spans are also considered in the discussion below.
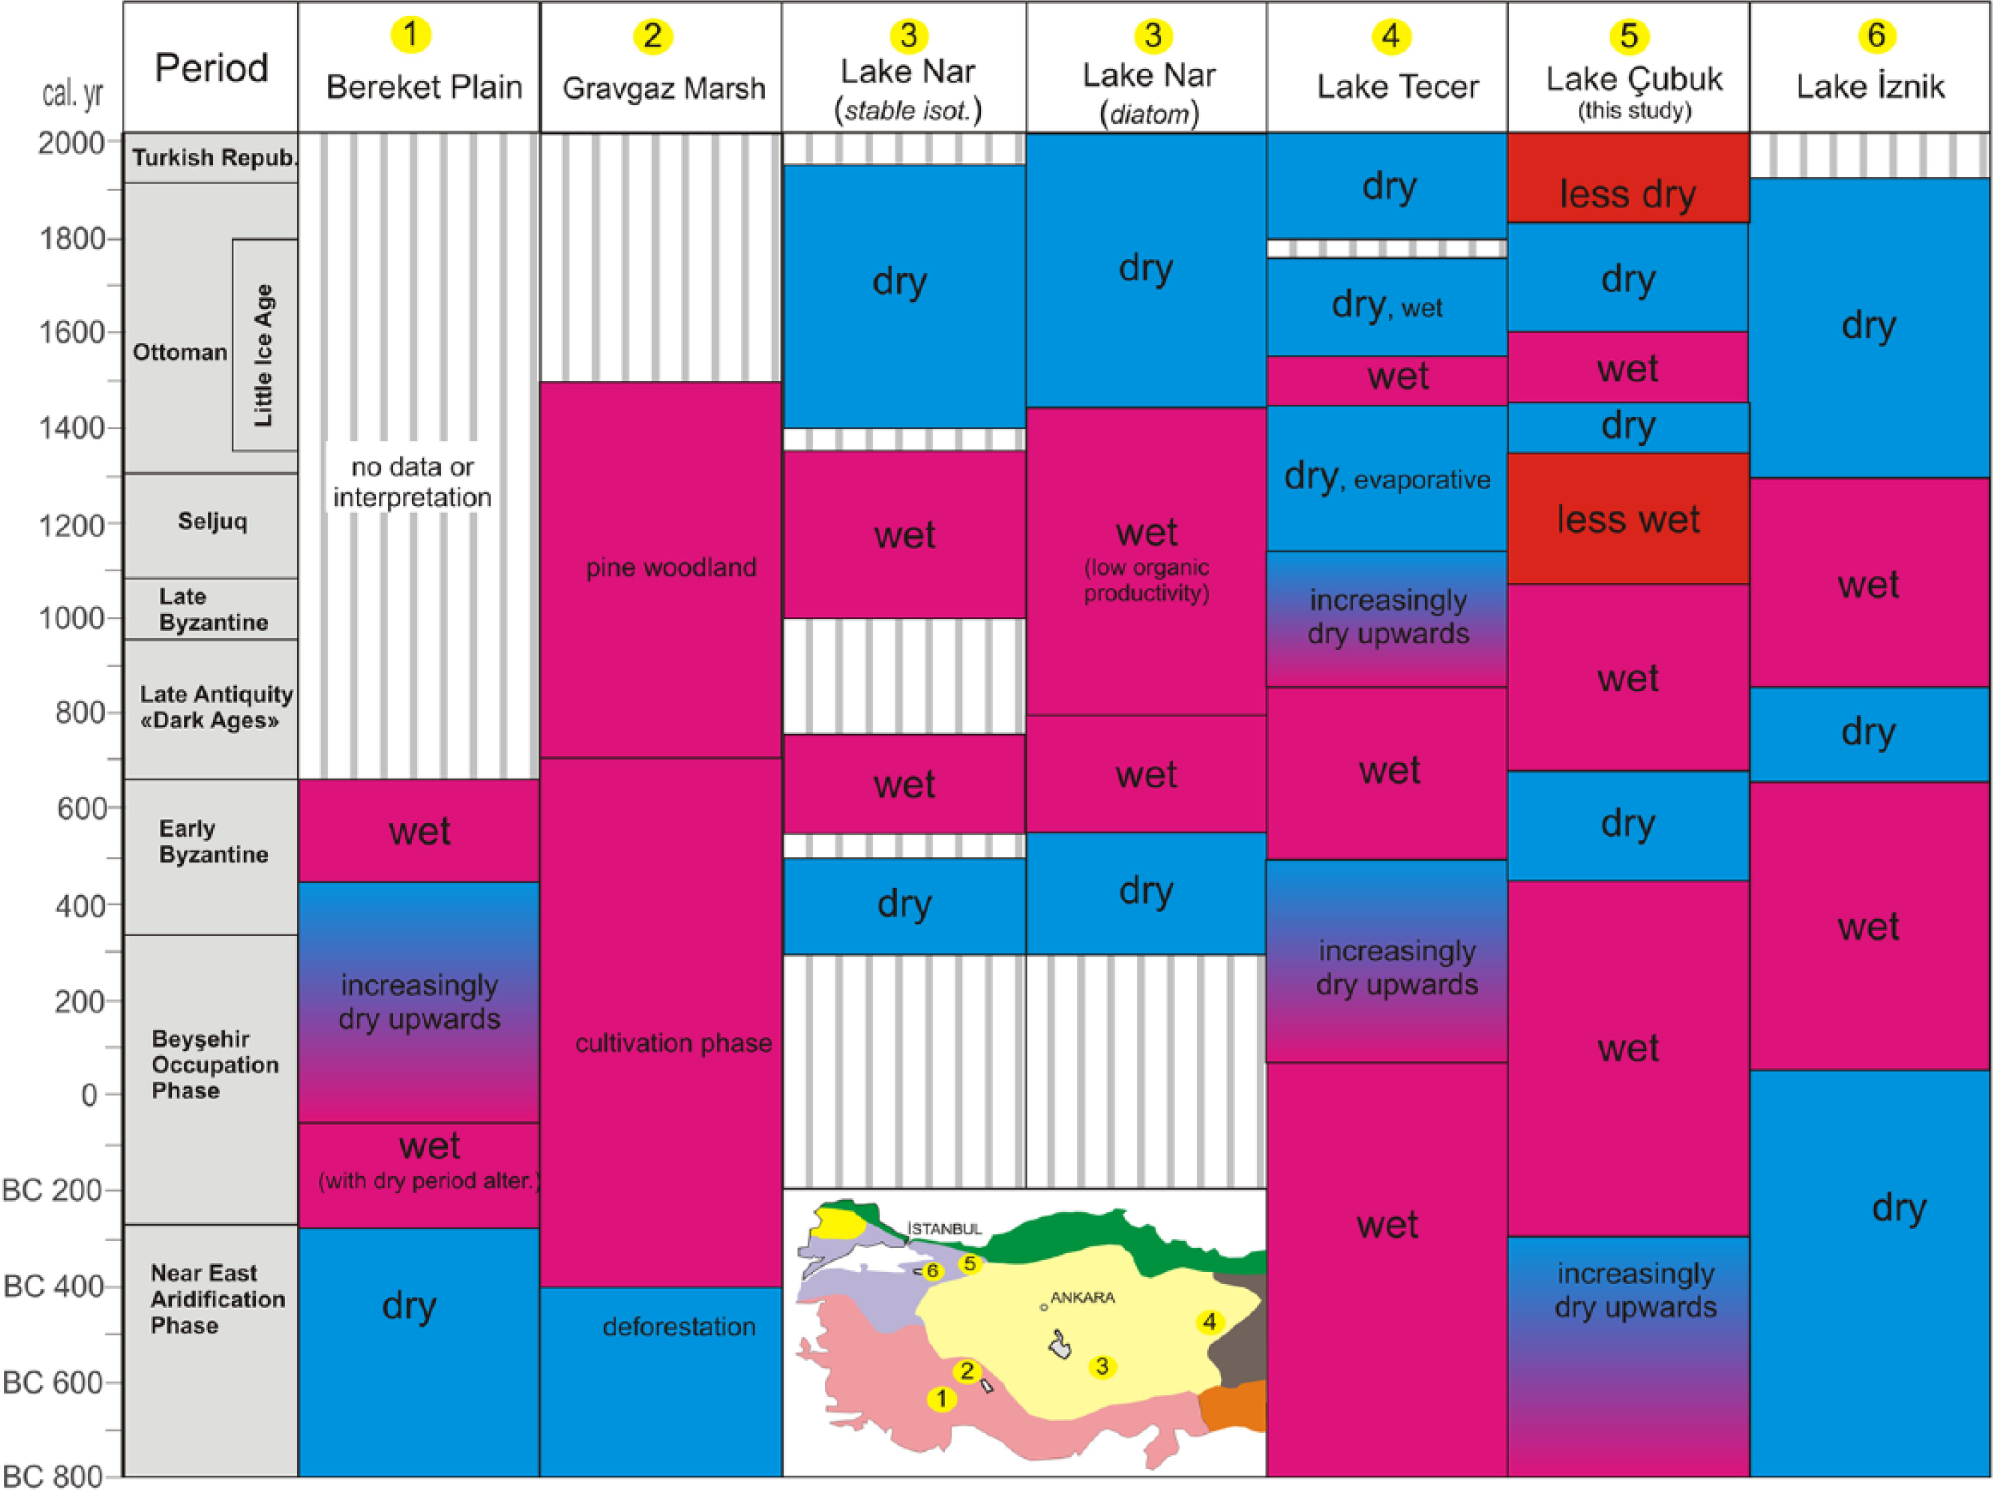
Correlation of the palaeoclimatic results from selected late Holocene records from Anatolia. Inbox map displays the locations: 1 – Bereket plain (Kaniewski et al., 2007), 2 – Gravgaz wetland (Vermoere et al., 2000), 3 – Lake Nar (Jones et al., 2006), 4 – Lake Nar (Woodbridge and Roberts, 2011), 5 – Lake Çubuk (this study), 6 – Lake İznik (Ülgen et al., 2012). Limits of historical periods are from England et al. (2008).
The Near-East Aridification Phase has been previously recorded, at least at approximately 800 BC, in West Taurus (the Bereket plain and the Gravgaz wetland; 1 and 2 in Figure 12, respectively) and in NW Anatolia (Lake İznik) as a dry period. In contrast, in Lake Tecer to the east of central Anatolia (4 in Figure 12), a deep and freshwater environment, rarely interrupted by saline conditions, was reconstructed. Fleitmann et al.’s (2009) supplementary data reveal that the Sofular Cave in the Black Sea coast (Figure 1b) experienced this phase as a comparatively cold period between 400 and 100 BC. In Lake Çubuk, a progressive shift of the δ18O value to more negative values and elevated rates of the benthic diatom species confirm increasingly drier and colder conditions towards the end of the phase at 270 BC (Phase I-2 in Figure 11). Planktic foraminifera δ18O data by Schilman et al. (2001) from the Israeli offshore indicate that aridification continued until 100 BC in the SE Mediterranean region. Similarly, Kaniewski et al. (2007) discovered a pollen zone in Bereket plain spanning 270–360 BC with abundant charcoal which was interpreted as intense landscape opening in an arid environment.
The subsequent humid period (II-1) in the Lake Çubuk record mostly corresponds to the BOP in the literature. It begins at approximately 280 BC, according to the detailed palynological studies in the Bereket plain (Kaniewski et al., 2007). In the nearby Gravgaz wetland, this period was named the ‘cultivation phase’ and begins somewhat earlier (Vermoere et al., 2000). Wet conditions prevailed throughout this period in Lake Tecer (Kuzucuoğlu et al., 2011). In the Çubuk record, a precipitation and temperature increase following the maximum drought in 280 BC is characterized by a rise in lake level and an expansion of the arboreal cover (Figure 11). This rise in AP would tend to indicate less human activity and the development of natural conditions, contrary to the Beysehir Occupation Phase, when the landscape was intensively cultivated and open. But, regarding the occurrence of cereal pollen even at the base of the Çubuk core, the initiation of the BOP would be spotted earlier. In Lake İznik situated further west, the onset of the wetter BOP occurs several hundred years later (Ülgen et al., 2012).
Towards the end of the BOP (i.e. AD 300), nearly all proxies indicate a transition towards a dry period, namely, the early Byzantine. At this time, indicators of anthropogenic activity and the abundance of wetland herbs and aquatic plants decrease, and members of a step-like vegetation increase, possibly indicating gradual drier conditions in the Bereket plain. In Lake Nar, a positive shift of the δ18O concentrations coupled with a higher abundance of salinity-demanding diatom species and lower lake levels indicate dry and arid conditions (England et al., 2008). Similarly, the Lake Tecer record provides chemical evidence indicating a progressively drier condition until AD 500.
The time interval AD 470–750 was attributed to a significant turnover in terms of human interference in the whole East Roman World. Izdebski et al. (in press) suggested that this is a warm period enabling the flourishing of rural settlements and wealth. Almost in the same period (AD 300–670) a strong cultural influence on nature and landscape was evidenced in Cappadocia (England et al., 2008). Interestingly, the same time interval (mostly our Phase II-2) manifests itself by a significant increase of cereal, shrub and herb pollen at the expense of tree pollen, which would be attributed to forest clearance (Figure 11). Negative shift in δ18O and generally increasing planktonic diatom abundance in the Çubuk record indicate a relatively wet climate. The drought appears in Lake İznik 200 years later in approximately AD 625 and is characterized by elevated aragonite/calcite and Ca/Ti ratios and TIC and TOC percentages.
The period between AD 750 and 1100 is known as Dark Ages in East Roman and Byzantine when cultural traditions, urbanization and state ruling patterns were undergoing drastic changes (England et al., 2008). In this period, anthropogenic/agricultural indicators decreased to the benefit of tree pollen in Cappadocia. Vermoere et al. (2000) and Haldon et al. (2014) described this arid period when colossal land abandonment occurred all over the Toros settlements. As a good coincidence, cereal pollen almost disappeared similarly to shrub and herb pollen while tree pollen displays the maximum values of whole core in the Çubuk record. To the contrary of the Mediterranean belt, the climate was wet all the way through this period (Figure 11).
Towards the middle of the early Byzantine period, all of the Anatolian locations considered here (Figure 12) underwent the influence of a warm climate with a time delay of several hundred years. This period corresponds to the Medieval Climatic Anomaly. In the Bereket plain, this period is characterized by massive forest fires, decreased steppe vegetation and increased wetland and marsh plants. The Lake Nar record in Central Anatolia displays a positive shift in the δ18O concentrations and decreasing DI-conductivities, except for a short-lived dry period between AD 800 and 950. In Lake Tecer, the precipitation increased relatively after AD 500 and caused higher lake levels until approximately AD 1000. In the Çubuk record during the same period, the lake level continued to rise, as evidenced by increasing planktonic diatom species, and the densest forest cover of the entire record developed during this wet period (Figure 11). Occurrence of lake margin sands in the stratigraphy of lake border trench (Figure 10) independently verifies higher lake levels in this period in Lake Çubuk. To the west in Lake İznik, wetter conditions were established after AD 825 and were recorded geochemically by lower TIC and TOC contents and a reduced aragonite/calcite ratio. Increased Pinus cover and decreased Mediterranean xerophytes are also characteristic of this period. The most intense drought period of the last millennium between AD 1195 and 1265, as observed in dendrochronological records from south-west Anatolia (Touchan et al., 2007), was only differentiated in the Lake Tecer record. This dry event is contained within a relatively dry period that had been started several hundred years earlier in Lake Çubuk (Figure 11). None of the proxies responds to this event precisely, which would indicate a southerly spatial domination or a limitation in the sensitivity of the proxies to resolve it.
The LIA coalesces with a dry and evaporative period that previously began in AD 1100 in eastern Central Anatolia. However, this period apparently begins in Lake Nar at approximately AD 1400 and is characterized by a sharp δ18O positive shift and significant aragonite precipitation. The diatom studies in the same locality did not reveal strong environmental changes. Similarly, pollen studies demonstrated no evident turnover in the vegetative cover related to this important climate variation. In contrast, the initiation of the LIA occurred relatively simultaneously (AD 1300–1330) in Lake Çubuk and Lake İznik. This climatic event influenced nearly all of the geochemical and biological proxies in Lake Çubuk and is characterized by a sharp positive shift in the δ18O signal (Figures 11 and 12). In Lake İznik, this event is characterized by the disappearance of the Mediterranean xerophytes in the pollen record and an increase in the values of aragonite/calcite, TIC, TOC and C/N. Additionally, the excessively wet period during AD 1518–1587, determined in the dendrochronological record of south-west Anatolia by Touchan et al. (2007), is observed as a high lake level interval with a low benthic diatom content in Lake Çubuk. Lake margin trench stratigraphy (lake margin sands over alluvial gravels) supports independently higher lake levels too (Figure 10). In contrast, during the Maunder Minimum between AD 1620 and 1750, a distinct benthic diatom peak occurs (Figure 11), indicating a significant lake level decrease. This shoaling results in alluvial deposition over shallow lake sands in the lake margin stratigraphy (Figure 10).
It seems that the Celali Rebellions in the 17th century as an extremely important social crisis in the Ottoman history have a time-equivalent evident trace in the Çubuk record (Figure 11). White (2006, 2011) explained that the Celali Rebellions started in 1590s and caused a century-long mobilization of Turkic and Greek populations in rural areas. The author also suggested a strong link between social upheaval and several decades of extreme arid events concentrated in a century. In the Çubuk record, we observe an abrupt drop in cereal pollen concentration – comparable with the Dark Ages – in the early AD 1600s up to AD 1700. In the same period, tree pollen slightly increased to the expense of shrub and NAP pollen. However climatic indicators do not have sudden shifts at that time, which hints to an anthropogenic control.
Although direct anthropogenic indicators such as Poaceae, Centaurea and Plantago occur throughout the Lake Çubuk record in varying degrees of significance, the isotopic, geochemical and partially biologic indicators display a close match with previously documented climatic periods in Anatolia and the Middle East. A potential reason as to why the anthropogenic influence remained minor excluding several periods discussed above in the Çubuk area would be the high mountainous relief, generally unsuitable for agricultural activities, and its remoteness from past agricultural centres. Additionally, the particular geographic position of Lake Çubuk, very close to the boundary between two distinctly contrasting climate belts (Figure 1a), would have served as an effective preservation of climatic fluctuations in the lake record.
Another point deserving to be discussed here is abrupt ‘crisis periods’ that are seen particularly in isotopic and chemical proxies, but also partially reflected in pollen spectra (Figure 11). The most prominent of these are 230–120 BC, AD 680–710, AD 1030–1070 and AD 1330–1360. The existing age model shows that they are mostly multi-decadal and separate smaller scale climate cycles. Similar abrupt multi-decadal changes were distinguished in some late Holocene climate records and were related to the North Atlantic Oscillation (Cronin et al., 2003; Finné et al., 2014).
Conclusion
The main conclusions derived from palaeoclimatic study of the Lake Çubuk sediments are as follows:
Lake Çubuk experienced a series of lake level fluctuations in the last 2800 years. Three highstands (centred at AD 950, 1270 and 1500), clearly lithologically manifested in the lake margin trench, correspond, respectively, to the late Byzantine period, the Seljuq period and the LIA. A fourth brief highstand is evidenced by the highest planktonic diatom abundance during the late Near-East Aridification Phase at about 450 BC.
The δ18O curve displays four distinct cycles; each starts with a drought with an abrupt setting (40–150 years) at the base and continues upwards with a gradual increase in wetness. The last three prominent cycles are as follows: from the ‘Roman Warm Period’ to the early Byzantine (100 BC–AD 500), from the Dark Ages to the Seljuq period (AD 700–1400) and from the LIA onwards (AD 1400–recent).
The coldest and driest period of the last 2800 years in the Çubuk area lasted for about 100 years at the end of Near-East Aridification Phase in 300 BC when Lake Çubuk shrank and briefly became a shallow wetland.
The LIA starts at about AD 1350 and is characterized by a slight but sudden positive shift of δ18O (aridity), considerable increase in sediment influx and widening pine cover.
Three archaeological/historical periods well established in previous studies (late Roman–early Byzantine (AD 470–750), late Byzantine (AD 750–1100) and Celali Rebellions (AD 1600–1700)) are evident by anthropogenic indicators in the Çubuk record as well.
It is probably the remoteness of Lake Çubuk that hindered human influence and maintained its sensitivity as an archive of climate change throughout the past 2800 years.
Footnotes
Acknowledgements
This publication is a contribution to the INQUA QuickLakeH project (no. 1227). The authors also feel indebted for invaluable critiques and contributions from two anonymous referees.
Funding
This study was financially supported by the Scientific and Technological Research Council of Turkey (TÜBİTAK) with the project (no. 109Y353) entitled ‘Paleoclimatic Investigation of Çubuk Lake (Bolu, NW Anatolia) by Sedimentological, Geochemical and Paleo-ecological Tools’. The Commission for Scientific Research Projects of Eskişehir Osmangazi University also financially contributed to this study with the project numbered 200915009.