
Abstract
The transformation of natural landscapes in Middle Europe began in the Neolithic as a result of the introduction of food-producing economies. This paper examines the relation between land-cover and demographic change in a regionally restricted case study. The study area is the Western Lake Constance area which has very detailed palynological as well as archaeological records. We compare land-cover change derived from nine pollen records using a pseudo-biomisation approach with 14C date probability density functions from archaeological sites which serve as a demographic proxy. We chose the Lake Constance area as a regional example where the pollen signal integrates a larger spatial pattern. The land-cover reconstructions for this region show first notable impacts at the Middle to Young Neolithic transition. The beginning of the Bronze Age is characterised by increases of arable land and pasture/meadow, whereas the deciduous woodland decreases dramatically. Changes in the land-cover classes show a correlation with the 14C density curve: the correlation is best with secondary woodland in the Young Neolithic which reflects the lake shore settlement dynamics. In the Early Bronze Age, the radiocarbon density correlates with open land-cover classes, such as pasture, meadow and arable land, reflecting a change in the land-use strategy. The close overall correspondence between the two archives implies that population dynamics and land-cover change were intrinsically linked. We therefore see human impact as a key driver for vegetation change in the Neolithic. Climate might have an influence on vegetation development, but the changes caused by human land use are clearly detectable from Neolithic times, at least in these densely settled, mid-altitude landscapes.
Keywords
Introduction
It is increasingly clear that early farming societies were major agents of mid-Holocene land-cover change (cf. Ellis et al., 2013; Kerig and Lechterbeck, 2004). Nonetheless, vegetation has also been subject to other drivers; some authors argue, for example, that climate might be more important than human impact (e.g. Cayless and Tipping, 2002; Gajewski et al., 2006; Huntley, 1990, 1999; Van Geel and Mauquoy, 2010). In a recent analysis, Woodbridge et al. (2012) were able to show that there is a close relationship between archaeological and pollen records in Britain and that land-cover changes are correlated with demographic change rather than climate shifts.
The arrival of food-producing economies in the Neolithic started the transformation of the natural landscapes into the cultural landscapes we see today. The mode and tempo of this major change are equivocal, but it is nonetheless recorded at various levels of resolution in numerous natural archives. Fossil pollen records contain information about vegetation and land-use change and can serve as a proxy for land-use intensity. The modelling of agricultural intensity requires an accurate representation of actual vegetation before it can be compared with archaeologically derived variation in ancient population histories. We believe that a combination of fine-grained environmental evidence and archaeologically derived demographic proxies provides new insight into ancient cultural ecosystems. However, before demographic comparisons are made, the amount and type of agricultural and pre-agricultural land have to be temporally and geographically delineated and reconstructed. Reconstruction of past vegetation from pollen data is not a trivial matter and has been a crucial question since the beginning of palynology as a discipline. Various approaches have been applied to the better understanding of the relationship between vegetation and pollen data using semi-quantitative modern analogues (e.g. Andersen, 1970; Behre, 1986; Gaillard et al., 1996) and multivariate techniques (e.g. Birks et al., 1988; Kalis and Zimmermann, 1997; Kerig and Lechterbeck, 2004; Lechterbeck, 2001) which do not involve modern analogues.
In the 1960s, Davis (1963) and also Andersen (1970) began to formulate the theory of the relationship between pollen spectra and vegetation. In the 1970s and 1980s, Prentice and colleagues (Parsons and Prentice, 1981; Prentice, 1985; Prentice and Parsons, 1983) developed the first mathematical tools based on physical laws of pollen dispersal and deposition. Since then, great advances have been made in the field of quantitative vegetation reconstruction from pollen data (e.g. Gaillard et al., 1994, 2010), with the most detailed and advanced models being formulated by Sugita (2007a, 2007b). These models are strongly rooted in our understanding of the relationship between pollen production and vegetation cover – and the estimation of pollen production is fundamental to these calculations. Pollen productivity estimates show strong regional variability and are not yet available for most regions in Europe (for an overview: Broström et al., 2008). To address this problem, Fyfe et al. (2010) developed a simpler ‘pseudo-biomisation’ (PBM) approach which is based on the principles set out by Prentice et al. (1996). Instead of using Prentice’s plant functional types (PFT), pollen taxa are assigned to land-cover classes (LCCs) to summarise the dominant land-cover type from individual pollen records for the mid to late Holocene. This is a method of intermediate complexity which does not rely on the detailed understanding of relative pollen productivity, and which does not try to quantify vegetation cover but to use pollen count data to categorise the dominant land cover around sites. Woodbridge et al. (2012) successfully applied this method to 42 sites in Britain to assess the impact and effects of the Neolithic agricultural transition.
Our study area is the Western Lake Constance area in South West Germany (Figure 1). It has an outstanding record of Neolithic settlement history accompanied by a large number of radiocarbon as well as dendro-dates, and a number of well-dated pollen diagrams. This ensures spatial congruence between our two datasets. Following Shennan et al. (2013) and Woodbridge et al. (2012), we use archaeologically derived radiocarbon dates as a measure of the relative amounts of human activity in our study region, thus enabling us to examine fine-grained anthropogenic causal effects upon these prehistoric landscapes.
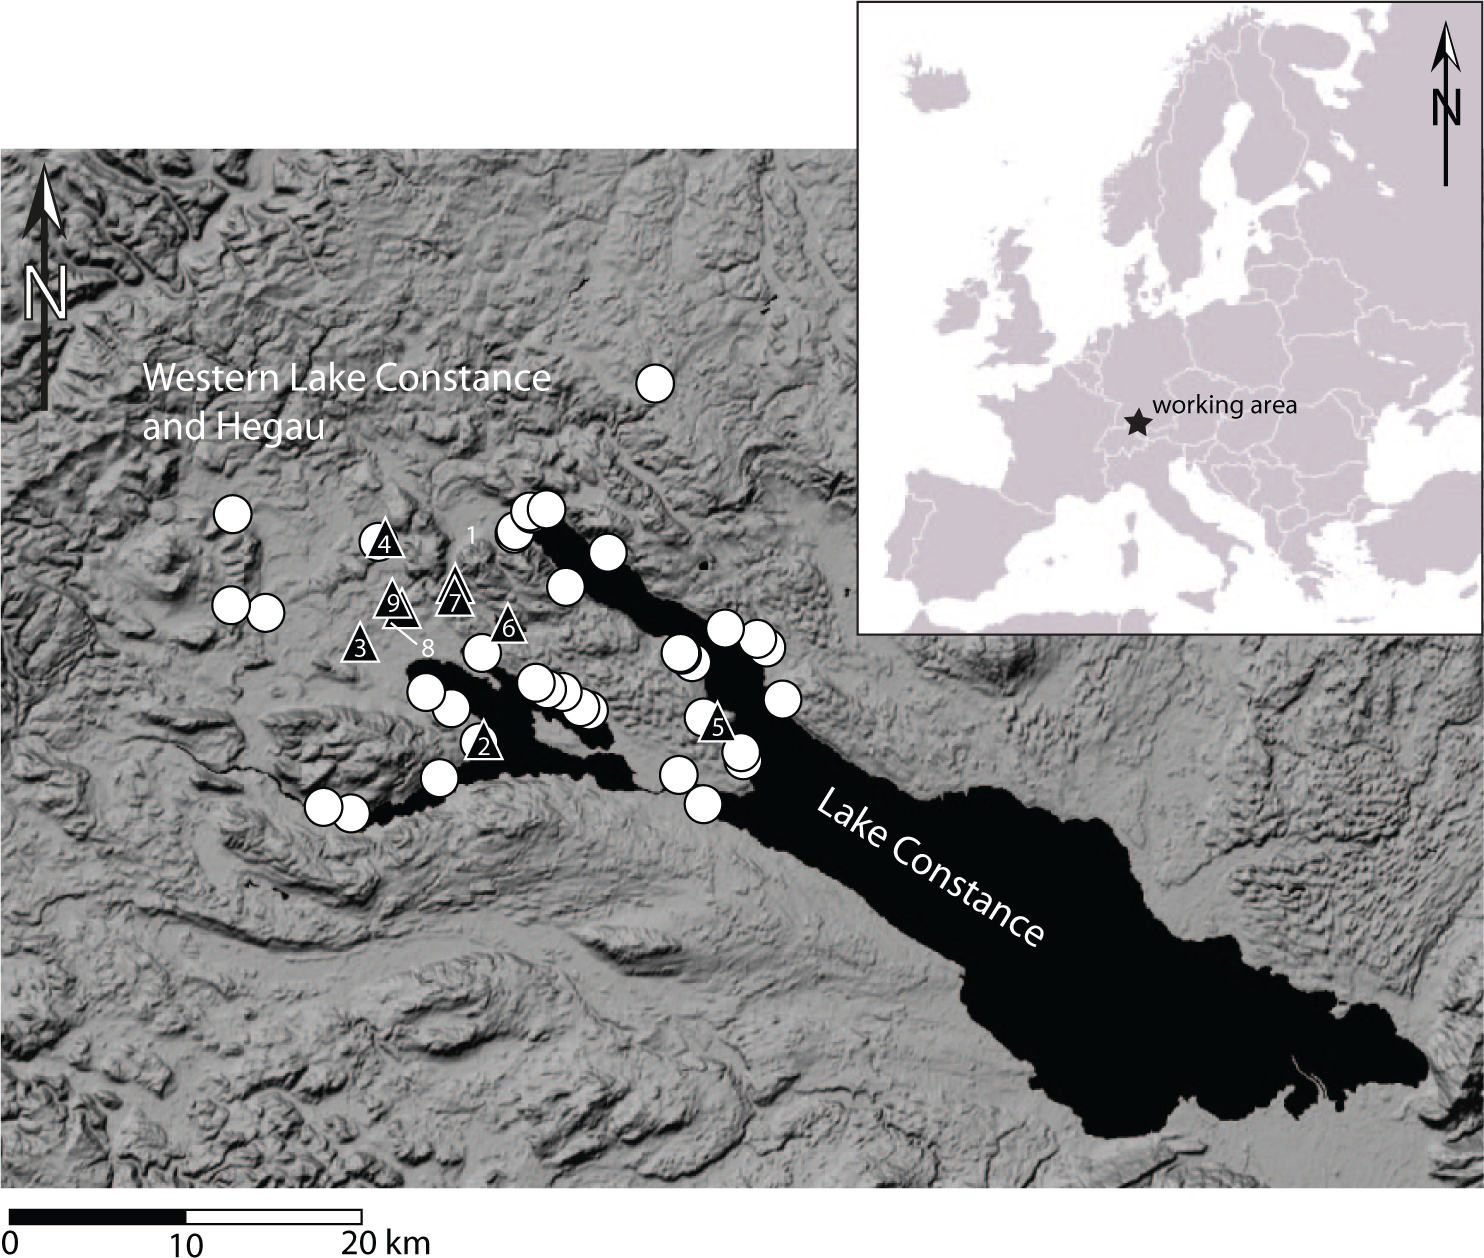
The study area.
The study region
Western Lake Constance and the Hegau (Figure 1) – the latter being the Western hinterland to the lake shore – have long been a focus of Neolithic and Bronze Age research (e.g. Kaeser, 2004; Keller, 1866; Matuschik et al., 2010). Up to now, there are 261 known Neolithic sites containing at least 383 discrete settlement phases in the district of Constance (817.97 km2), which corresponds roughly to the entire Western Lake Constance/Hegau area (Bofinger et al., 2012). This landscape shows a remarkably fine-grained division into a wide variety of distinct natural entities, including steep volcanoes, moraines, tertiary sandstones (Molasse) and limestone mountains and canyons, each in very close vicinity to the others and at the same time showing the occurrence of very specific archaeological materials (Lechterbeck et al., 2013). While Early and Middle Neolithic sites (see Figure 2 for culture names and dates), as well as evidence from the End Neolithic Bell Beaker period, are found nearly exclusively on mineral soils, the Younger and Late Neolithic settlements (‘pile dwellings’) as well as End Neolithic Corded Ware are situated along the lake shore. The earlier part of the Young Neolithic is represented by the local Hornstaad group in the Lake Constance area, followed by Pfyn and then by Late Neolithic Horgen, all especially present at Lake Constance. The End Neolithic is represented in the Western Lake Constance/Hegau area by Corded Ware and later Bell Beaker (Lechterbeck et al., 2013). However, the long accepted view of the apparently clear spatial and chronological division between lake shore and hinterland might be differentiated because there is also evidence for a more substantial use of the Hegau in the time of the pile dwellings and for the use of the lake shores in Early and Middle Neolithic (Dieckmann et al., 2012) times and in the Beaker period (e.g. Schlichtherle, 1982).
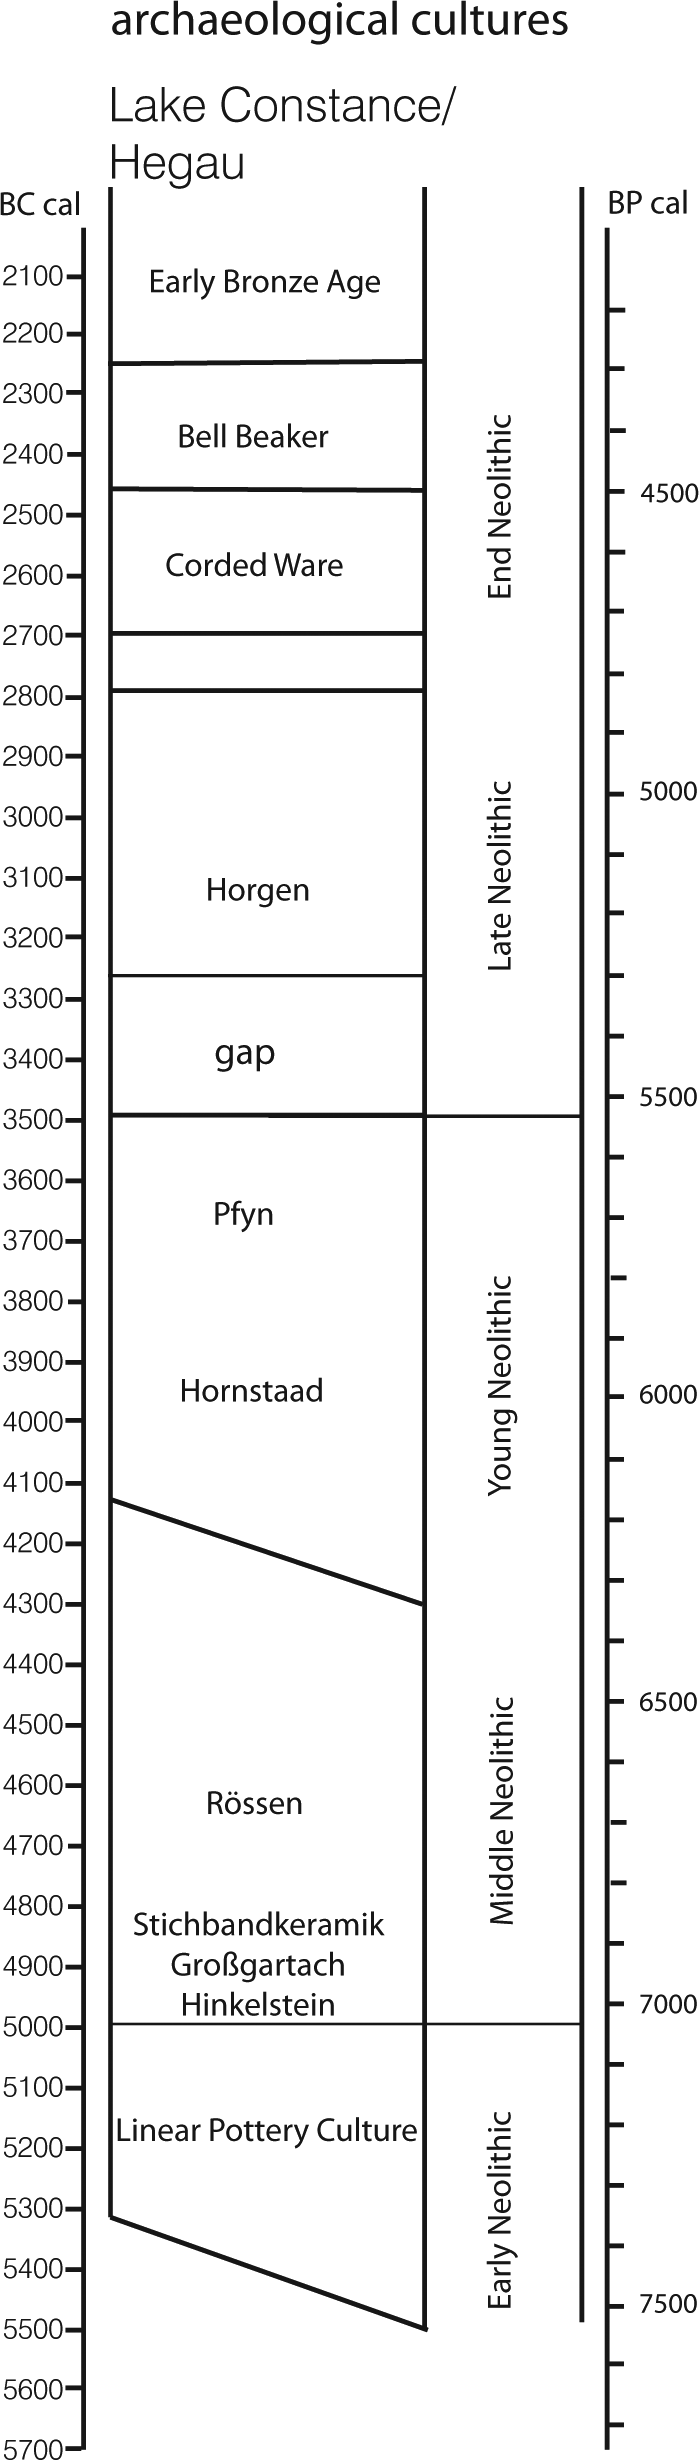
Culture names and dates.
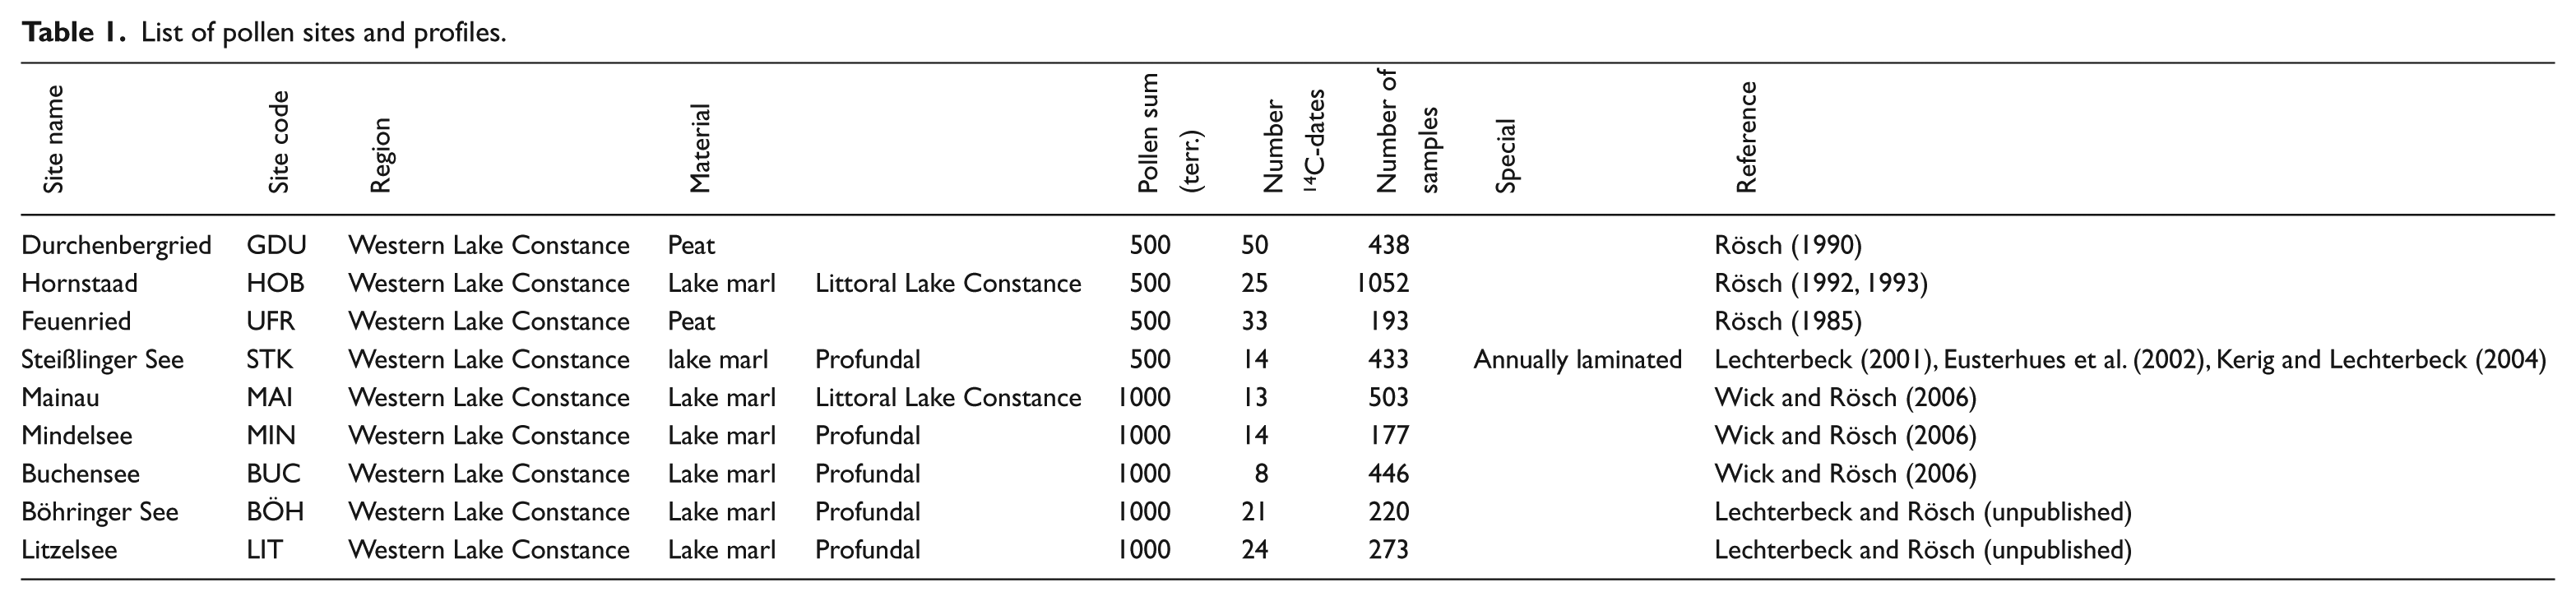
The Hegau/Western Lake Constance is an area with one of the most detailed pollen records in Europe for the Neolithic (Table 1). In recent decades, nine pollen profiles have been made there, each with closed sampling between 0.5 and 1 cm and a terrestrial pollen sum of 500–1000. The profiles are dated by over 200 radiocarbon dates and annually laminated sediments.
List of pollen sites and profiles.
The vegetation development as reflected by the pollen records in the Lake Constance area is remarkably uniform. At the beginning of the Atlantic period (8500–6245 BP), the pollen record is dominated by oak-mixed-forest (QMF) and hazel (Corylus avellana type). Hazel grows then preferentially on wetland stands where it is replaced gradually by alder (Alnus glutinosa) and ash (Fraxinus excelsior) during the Atlantic period (Lechterbeck, 2001). By the time of the first mass expansion of beech (Fagus sylvatica) between 7000 and 6500 BP, hazel is quite restricted to special stands in the woodland community such as clearances and forest fringes. With the elm decline around 6250 BP – which is synchronous in all profiles – a remarkable hazel peak can be observed. Whether the elm decline is caused by human action, climate change, disease or a combination of all these factors is frequently discussed (e.g. Behre and Kucan, 1994; Parker et al., 2002; Peglar and Birks, 1993). We think that the spreading of hazel with the elm decline can be attributed to human action rather than climate, caused by a certain mode of swidden cultivation producing large areas with secondary woodland in various stages of regeneration (Rösch, 2013; Schier et al., 2013). This technique would have allowed the expansion of the Neolithic to areas with less fertile soils. Hazel as a fire-resistant pioneer shrub was strongly supported by this kind of agriculture. The pollen record of the Neolithic in the Lake Constance area is characterised by alternating beech and hazel peaks and only very little non-arboreal pollen (i.e. herbaceous pollen and grasses); cereal pollen grains are likewise very sparse. This is true not only for the records lying in the hinterland of the lake shore dwellings but also for those records in the direct vicinity of settlements.
Methods
Seven of the pollen datasets used here were made from lake sediments and two from bogs. Our work (Fyfe et al., 2010; Woodbridge et al., 2012) so far indicates that if we want to obtain a representative signal of regional land use, we need to include multiple pollen sites. The PBM approach is based on transforming pollen counts from single samples of 14C-dated pollen profiles into records of natural and culturally modified vegetation cover according to the dominance of different taxa through time (Fyfe et al., 2010). The method assigns pollen taxa to different LCCs using the indicator species approach (Behre, 1981) and is an extension of the transformation of pollen counts to biomes using PFT (Fyfe et al., 2010; Gachet et al., 2003; Peyron et al., 1998; Prentice et al., 1996).
Here, the pollen counts of every species in a 200-year time interval were summed. From these sums, percentages were made for each time interval and then square root transformed for down-weighting of major taxa and up-weighting of less frequent taxa. LCCs for each time interval were then calculated by summing up the square root percentages for all taxa belonging to the respective LCC. The pollen chronologies are based on over 200 radiocarbon dates with a minimum of 15 dates per profile. Age models were made with deposition models of the OxCal program (Bronk-Ramsey, 2008) and could be validated with the record of the Steißlinger See which has an uninterrupted annual lamination between 8520 and 1137 BP (Eusterhues et al., 2002; Kerig and Lechterbeck, 2004; Lechterbeck, 2001).
In contrast to Fyfe et al.’s (2010) original approach, where closed and open land vegetation types were used, we have also defined classes of primary and secondary woodland. This was done because human impact in the Neolithic in South-Western Germany is often expressed by changes in the woodland cover rather than in terms of open vegetation. Three primary LCCs (coniferous forest, deciduous forest, wet woodland/fen carr) and five secondary LCCs (secondary forest, pastoral/meadow, wet meadow, arable, heath) were defined. For a full list of taxa assigned to each LCC, see Table 2. Although heath is not a vegetation type with a wide distribution in South West Germany, it was included in the LCCs because plants belonging to this class tend to spread locally on mires when the original vegetation is cleared. The LCCs assigned to each pollen sample have been summed in 200-year time windows in order to create a spatially and temporally integrated land-cover record for the time period from 8400 to 1200 BP. The LCCs have then been transformed to percentage values to compare them with the demographic data derived from radiocarbon dates.
Taxa list of plants integrated in the LCCs.
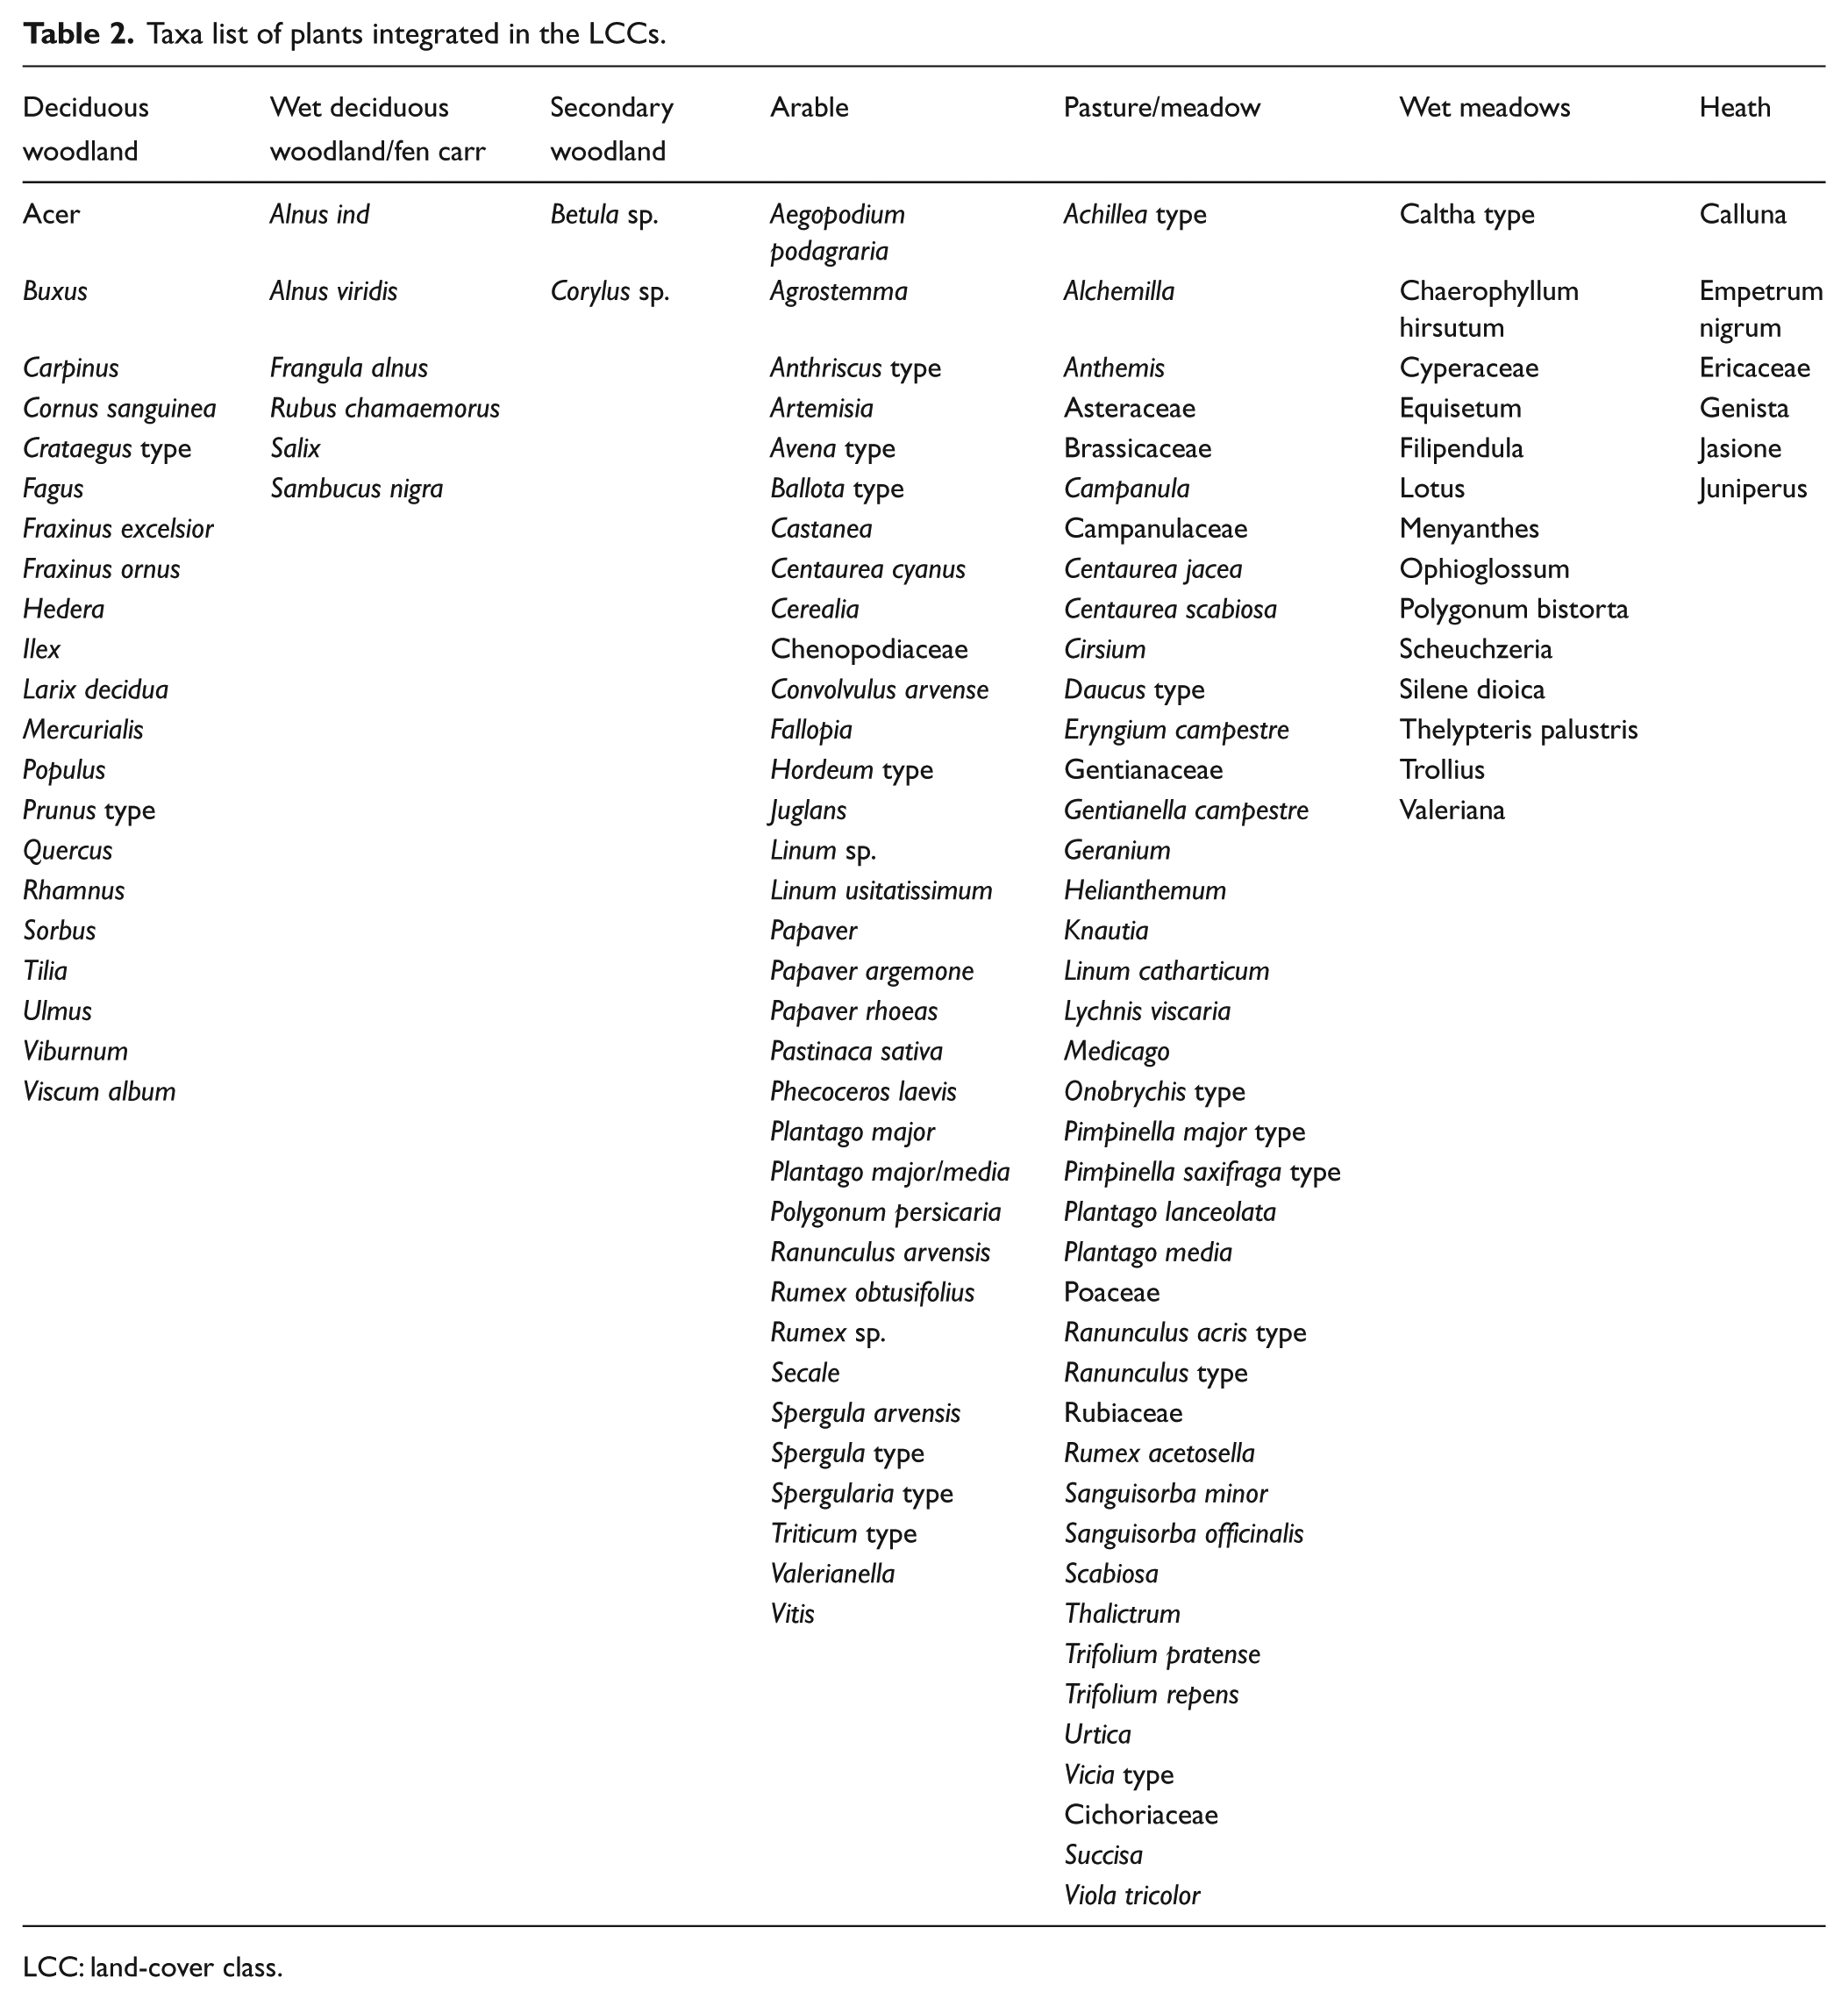
LCC: land-cover class.
A final threshold landscape openness value to mark the shift from near natural to strongly culturally modified vegetation similar to Fyfe et al.’s (2010) affinity scores could not be calculated, as analogous modern vegetation data are lacking. Simulation studies might help to construct probable land-cover scenarios; first attempts with the landscape reconstruction algorithm (LRA, Sugita, 2007a, 2007b) have been made (Lechterbeck, 2013). A comparison of modern pollen-derived LCCs with remote-sensed vegetation data for Europe shows that it is possible to infer LCCs from pollen (Woodbridge et al., in press). In the Lake Constance area, surface samples from moss polsters have been taken for a number of sites and a thorough analysis of present-day vegetation is under way. In this paper, we subtracted the sum of all secondary LCC from the sum of all primary LCC and plotted them against time to show the land-cover shifts through time (Figure 3).
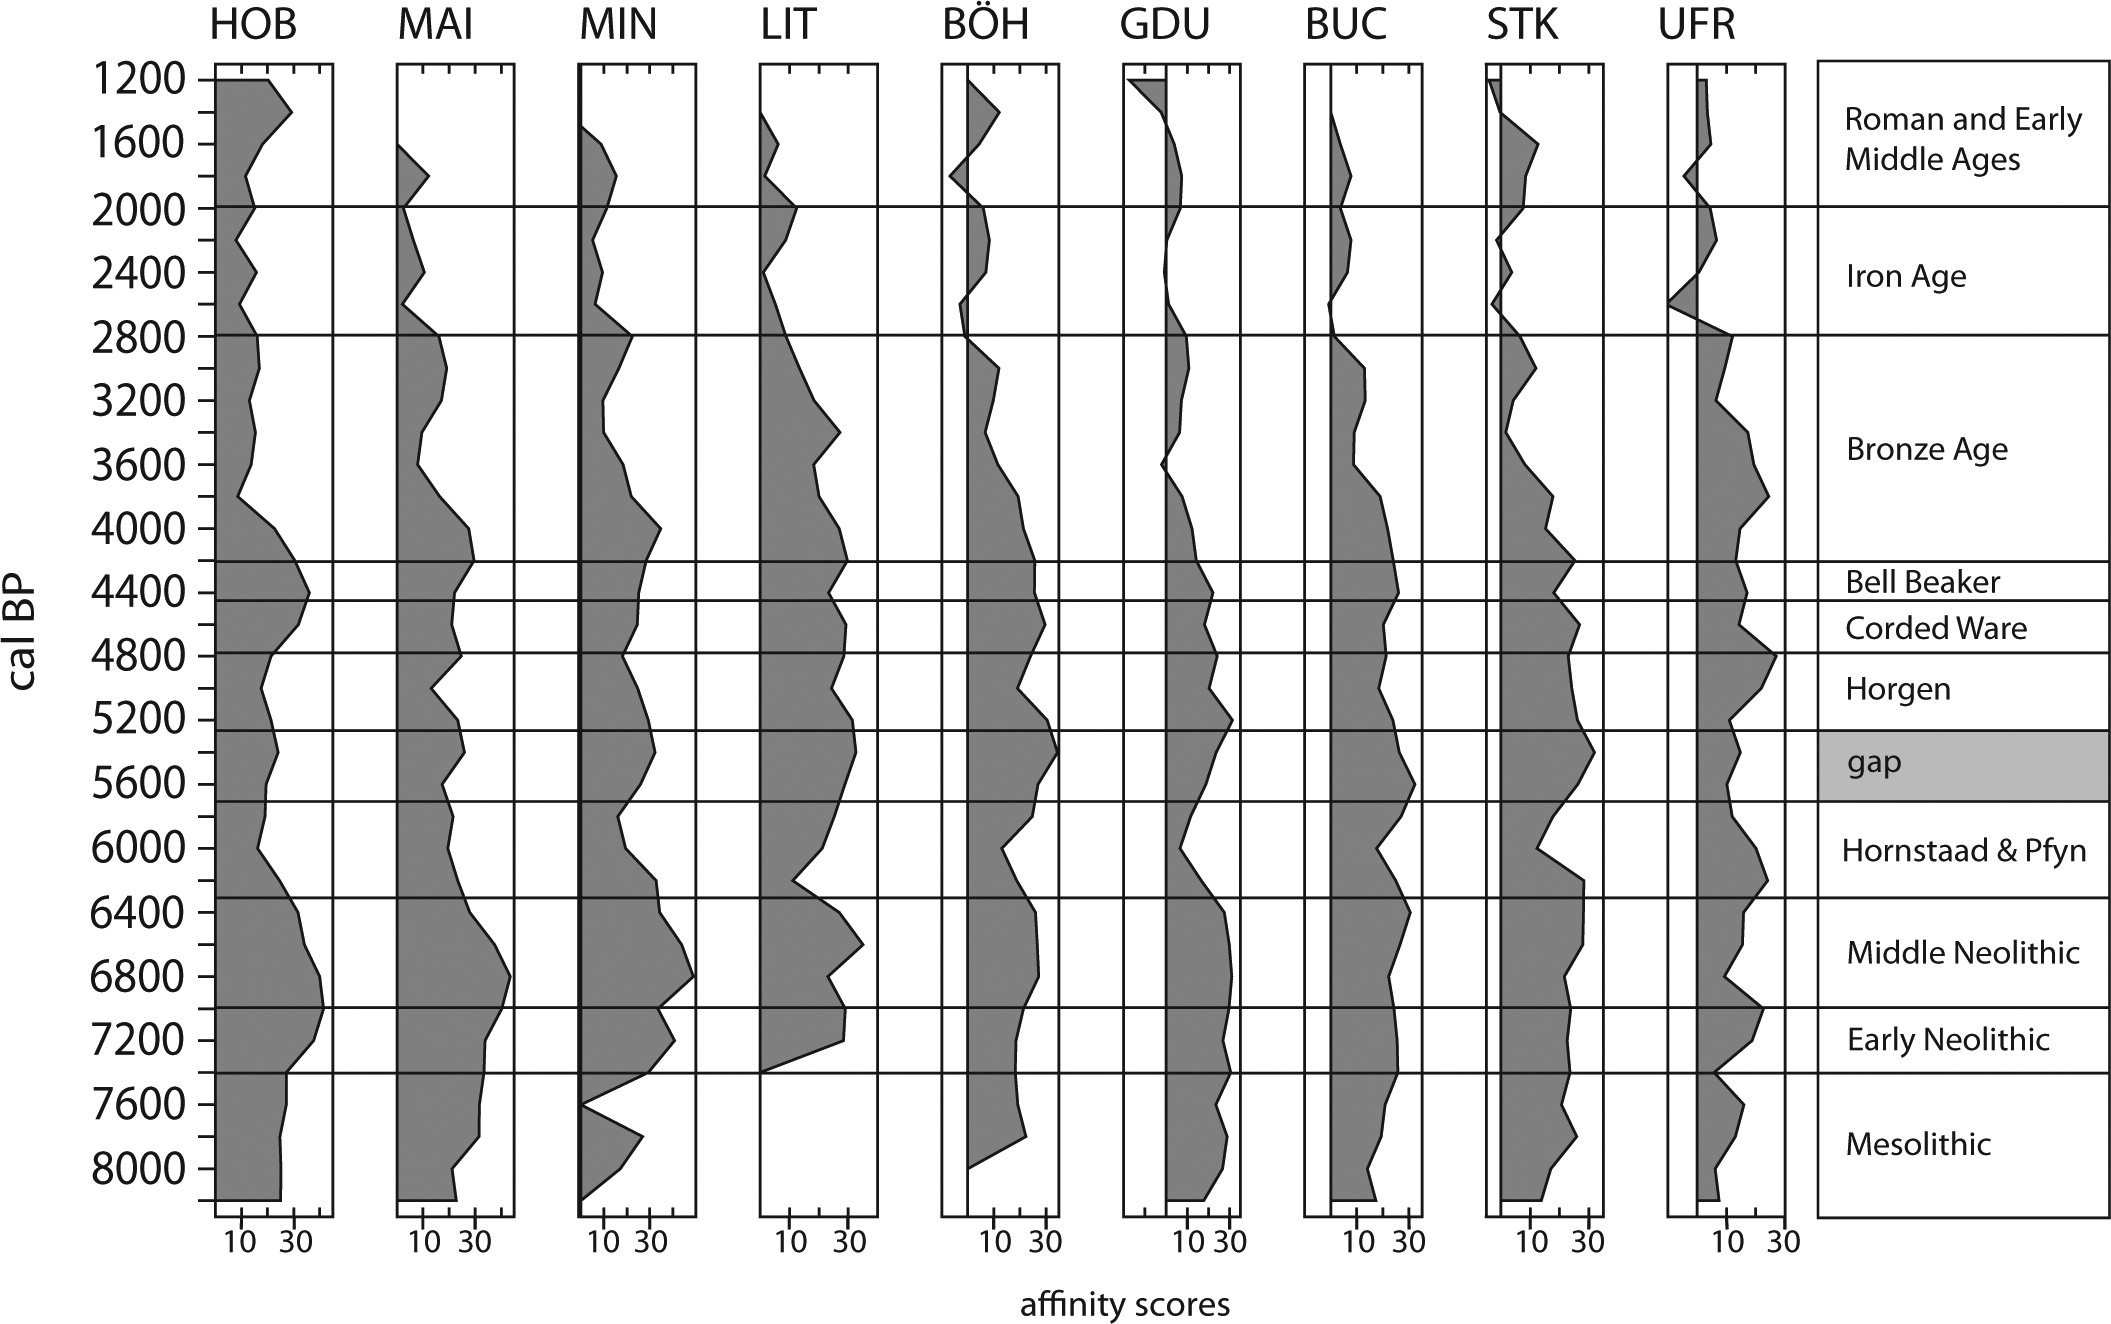
Relation between primary and secondary vegetation. Values have been calculated by subtracting the sum of all secondary from all primary LCCs.
To infer prehistoric population fluctuations, we use a radiocarbon dates-as-data method (Collard et al., 2010; Hinz et al., 2012; Rick, 1987; Shennan and Edinborough, 2007). This method rests on the simple premise that at a regionally scaled first order of approximation, there is a direct proportional relationship between the number of archaeological dates in a given region and the amount of human activity there. A number of caveats have to be taken into account when using summed calibrated radiocarbon probability distributions, and various measures have been adopted to address potentially confounding issues such as taphonomic and research biases (e.g. Surovell et al., 2009, see also Collard et al., 2010; Hinz et al., 2012). In this study, following the same methods as Collard et al. (2010), multiple dates from the same site-phase have been normalised so that all site-phases have equal weight. The resultant site-phase normalised date probabilities are then summed after calibration to provide a combined regionally scaled summed date probability distribution which we take as a valid indicator of demographic patterns. The radiocarbon density curve is based on all available data from the Western Lake Constance area (n = 349). We did not think it necessary to use the more complex methods we have developed elsewhere (Shennan et al., 2013) in this case.
Results
With the calculation of LCCs in 200-year time windows (Figure 4), a spatially integrated vegetation signal for the Lake Constance region could be obtained. From 8400 BP, an increase in deciduous woodland as well as wet woodland is visible. Parallel to this, the secondary woodland, which is mainly hazel, declines. As explained above, in these early contexts, hazel is not a secondary element.
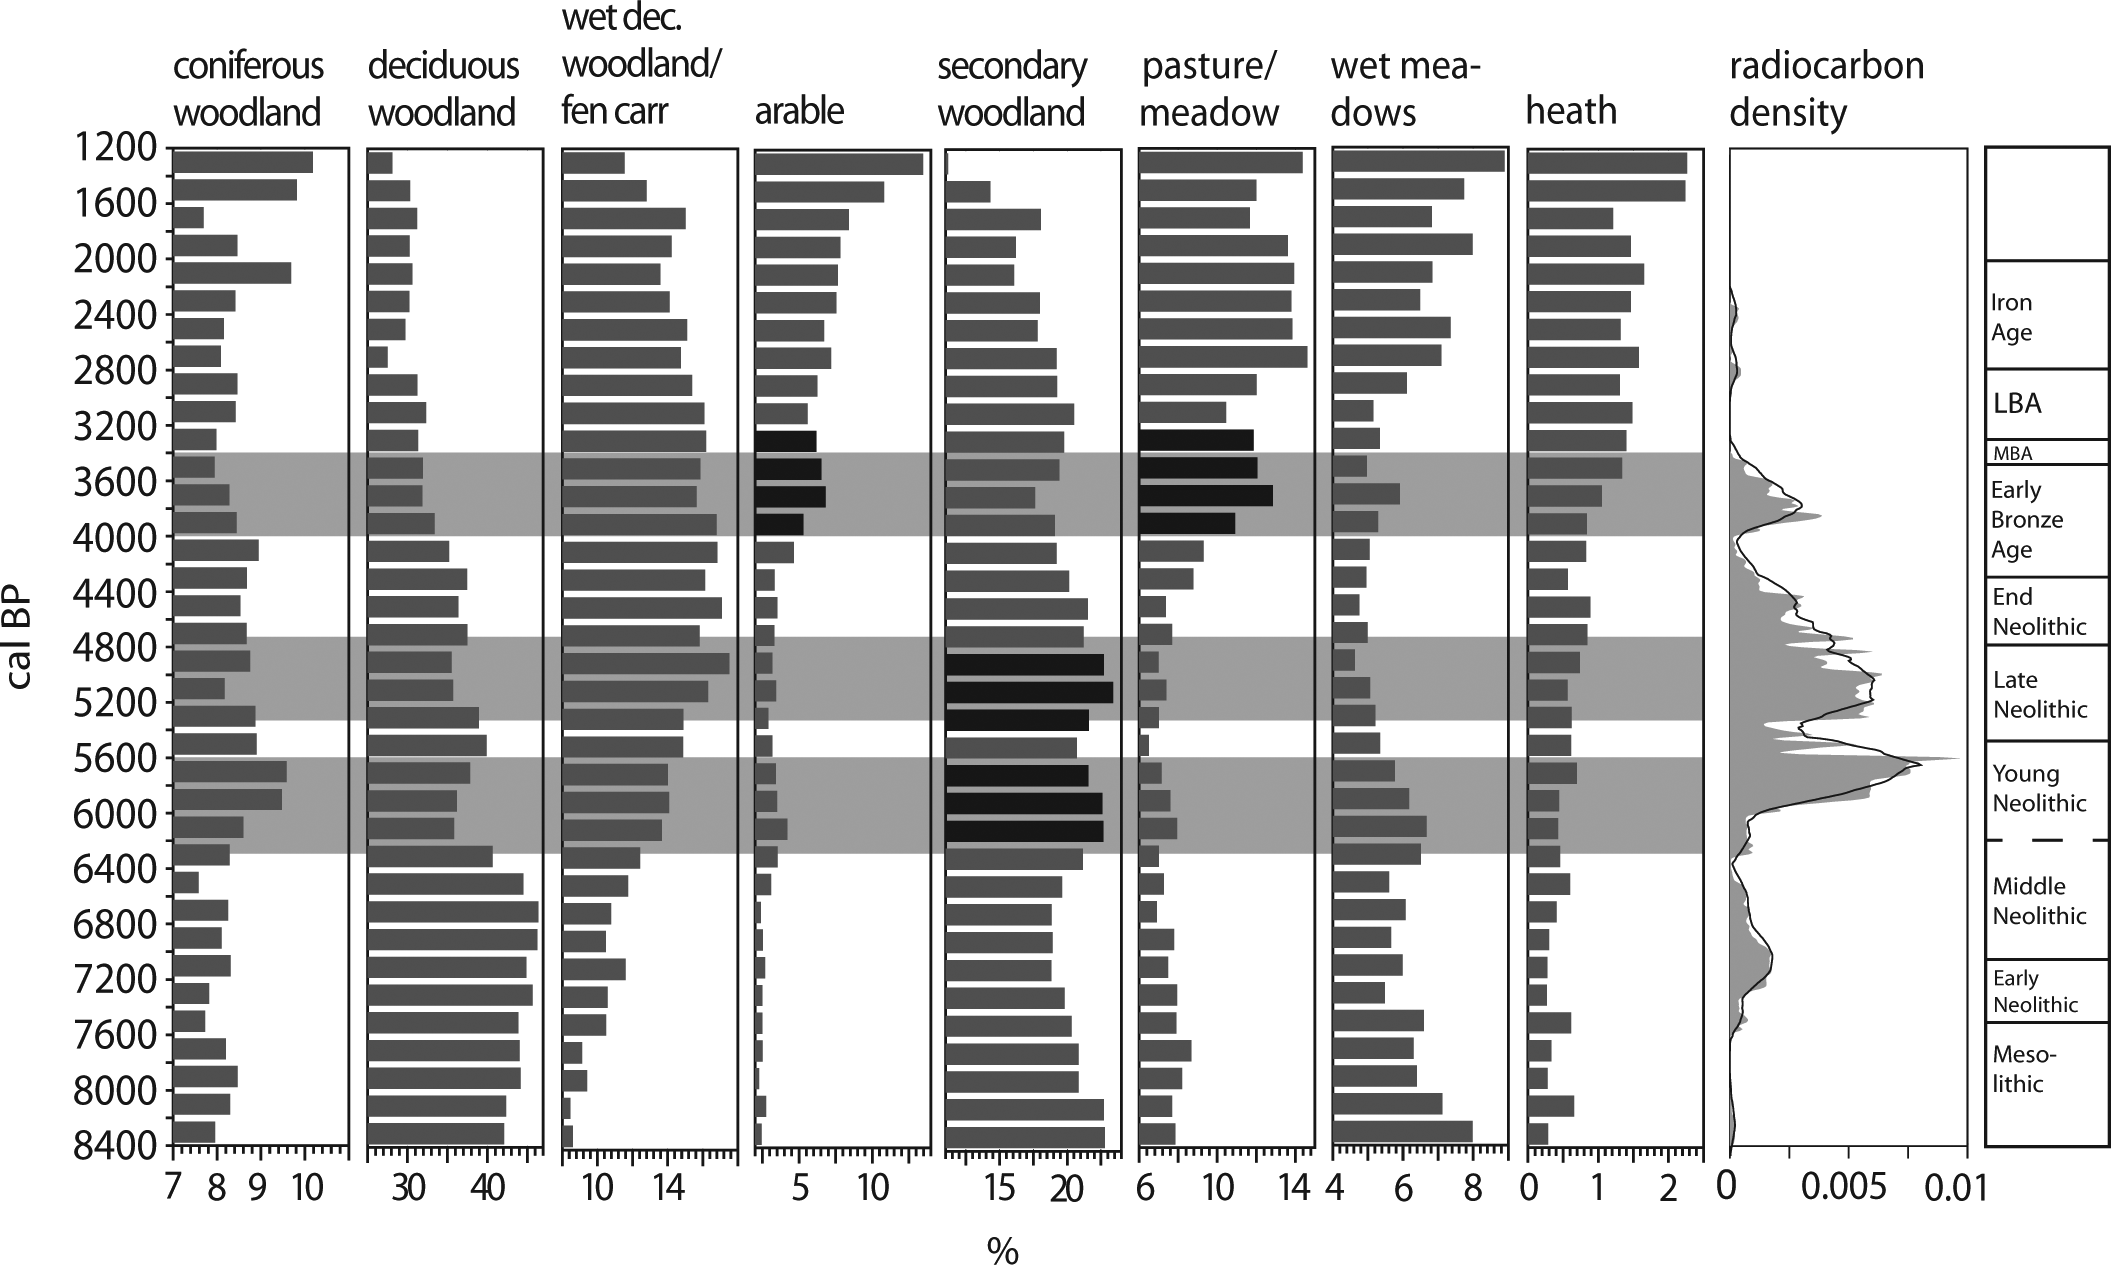
Land-cover classes for the Western Lake Constance region and radiocarbon density curve with 200-year running mean.
The decline of deciduous woodland beginning 6600–6400 BP is accompanied by the rise of secondary and conifer woodland, arable, pasture/meadow and wet meadow LCC. The wet woodland/fen carr LCCs are unaffected; they rise continually during the Neolithic. This phase ends c. 5600 BP.
After a short reforestation or recovery period, there follows another decline of deciduous forest and secondary woodland peaks anew. This second peak is not accompanied by the rise of other secondary LCCs.
The next event is the rise of arable, pasture/meadow and wet meadow LCCs from 4000 BP in the Early Bronze Age (EBA). The secondary woodland LCC does not peak here; on the contrary, it declines. A third event occurs at the start of the Iron Age, around 2800 BP, with an increase in open-habitat LCCs (arable, pasture, wet meadows), and a decline in woodland.
The radiocarbon density curve rises between 7400 and 7200 BP and clearly reflects the early Neolithic Linear Pottery and Middle Neolithic settlement of the Hegau area. The curve declines in the 6400–6200 time window. Then it rises again and stays at a quite low level between 6200 and 5900 BP. This corresponds to the local Young Neolithic Hornstaad group in the Lake Constance area, which occurs in a series of lake shore settlements at Lake Constance. From 6000 BP, the density curve rises rapidly to a maximum at 5600 BP. This corresponds to the Pfyn archaeological group for which settlements are very widespread and frequent at the shore of Lake Constance (Billamboz, 2001).
Between 5500 and 5300, the density curve has a minimum and the settlement record also features a gap at that time. After a new maximum around 5200 BP, the curve then runs down slowly to 4000 BP. This course of the curve mirrors the settlement history of Lake Constance with a high settlement density during the Horgen phase (Figure 2) and a gradual decrease in settlement activities during the End Neolithic.
Settlements of the earliest EBA are not known from Lake Constance. Bronze Age pile dwellings set in about 3800 BP. Earlier dates come from an EBA cemetery in the Hegau (Krause, 1988; Lechterbeck et al., 2013). The density curve reflects this settlement pattern with a new maximum around 3800 BP. After the Bronze Age peak, the density curve is not representative because of the lack of data for later periods.
The relation between secondary and primary vegetation (Figure 3) shows that the development of the primary forest vegetation is completed by or at the beginning of the Early Neolithic. All profiles feature high primary forest LCC during the Middle Neolithic. In some profiles, however (HOB, MAI, MIN, LIT), the secondary forest LCCs increase already in the second half of the Middle Neolithic. Hornstaad (HOB), Mainau (MAI) and Mindelsee (MIN) are profiles from Lake Constance or in close vicinity to it. During the Younger Neolithic Hornstaad and Pfyn phase, all profiles feature a maximum of secondary LCC, although not wholly synchronous and of varying intensity. The Pfyn/Horgen gap is characterised by an increase in primary woodland LCC with the exception of UFR (Feuenried). Whereas the increase in secondary LCC in the Hornstaad/Pfyn phase is very pronounced and visible in all profiles, this is not the case for Horgen, the second important pile dwelling phase at Lake Constance. Most profiles show only a slight decrease of primary LCC, UFR (Feuenried) even has a distinct peak of primary LCC at that time. The Late and End Neolithic phases have only small and disparate shifts toward secondary vegetation LCC. In the Bronze Age, this changes considerably: the primary vegetation LCC decline in all profiles during that period and already in the Iron Age secondary vegetation values are reached comparable with those of the Early Middle Ages.
Discussion
For the calculation of the LCCs, we used pollen data from different sized archives, and from both bogs and lakes from the Lake Constance/Hegau area. Previous studies have shown that pollen assemblages from large sites (>100 ha) tend to be stable in a given region and that assemblages from smaller lakes are more sensitive to local variations (Berglund, 1973; Jacobson and Bradshaw, 1981; Sugita, 1994, 2007a). The records used here come from four small lakes, three large lakes (two from Lake Constance, one from the Mindelsee) and two from bog sites. As our aim was to construct a spatially and chronologically integrated proxy rather than actual vegetation cover, considerations about the relative source area of pollen for the different basins was less important than it would be for other methods such as the LRA (e.g. Lechterbeck, 2013). Bogs, however, do record pollen signals in a different way: (1) they frequently have hiatuses, (2) the actual mire vegetation is overrepresented and (3) the pollen are directly incorporated into the sediment and do not float around and mix before deposition. Despite these differences, the bog profiles are absolutely comparable with the lake sites with respect to their pollen composition. We ran the PBM analysis excluding the bog sites to see whether the results are biased by ecological and sedimentological differences. The results proved to be stable so we decided to integrate the bog data in order to achieve a larger spatial signal.
The results of PBM for the Lake Constance area have to be discussed in the light of the vegetation development and the settlement history of the region. The secondary woodland LCC needs a special consideration. Included in ‘secondary woodland’ are hazel and birch. Both of these taxa occupy particular ecological niches within the Holocene landscapes. Birch is one of the major taxa in the Preboreal period and becomes restricted to special habitats during the Boreal period. In the Boreal, it is replaced mainly by hazel, which is then the major tree taxon. With the expansion of oak mixed forest, hazel becomes restricted to wet stands, forest fringes and clearings. Hazel is shade intolerant, but it can flourish where there are canopy disturbances or clearances. It still has quite high values in the pollen record because it is a strong pollen producer. Therefore, around 8400 BP, when the reconstruction starts, the secondary woodland LCC has quite high values but cannot be regarded as secondary at that time. It declines with the increase of deciduous forest LCC. Pollen diagrams as well as influx analyses (Lechterbeck, 2001) show that it is also replaced by alder and ash on wet stands, which is reflected in the PBM analysis by the rise of the wet woodland/fen carr LCC.
Mesolithic hunter-gatherers used hazel as a fat- and protein-rich food resource, which is frequently demonstrated by large amounts of nutshells in mesolithic contexts (e.g. Holst, 2007, 2010). Apart from its nutritious value, hazel also delivers long, straight shoots for arrow shafts and wickerwork. But it remains questionable whether hazel was intentionally fostered by humans. Newer analyses favour climatic reasons at least for the initial spreading of hazel (Finsinger et al., 2006; Tallantire, 2002; Tinner and Lotter, 2001). However, the presence of large amounts of charcoal in mesolithic contexts in combination with nitrogen and light indicators is seen as evidence for deliberate burning to favour the spreading of hazel (Bos and Urz, 2003). Burning for the enhancement of hunting possibilities was discussed for the British Mesolithic (Bell and Walker, 1992), but this could not be proven for the Lake Constance area (Clark et al., 1989). A review of data illustrating the interactions between humans and woodland in Mesolithic Ireland (Warren et al., 2013) shows that existing models of the role humans had in the structuring of the wooded landscape are inadequate to describe these complex interactions.
Likewise, Early Neolithic land use has only a small impact on the woodland communities. Bogaard (2004) describes intensive garden cultivation as ‘the most plausible and widespread form of crop husbandry’ for the Early Neolithic Linear Pottery Culture. Kreuz (1990) states that from an archaeobotanical point of view, an intensive soil cultivation without ploughing is most probable among other reasons because of the occurrence of annual weeds. Kerig (2008, 2013) argues that there is no proof for either plough or traction in the Early Neolithic in Europe and that the required agricultural land might well have been worked by hand.
For intensive garden cultivation, only small patches of woodland have to be cleared which are commonly invisible in the pollen record. But it is possible that the clearance activities of Linear Pottery people aided the expansion of beech. Beech profits from clearing activities as it is a shade tolerant tree and could blend in the forest community on a small scale where single trees were felled or where larger clearings where made (Haas and Hadorn, 1998; Rösch, 1990). The first beech expansion in the Lake Constance area took place between 7000 and 6500 BP. By the end of that time the post-glacial forest development can be considered as having reached an equilibrium state in accordance with edaphic and climatic conditions, and beech has become the major tree taxon. This is also visible in the single records of the profiles (Figure 3), where the primary LCCs come to a maximum.
The time of the Middle to End Neolithic (7000–4300 BP) in the pollen record is characterised by alternating beech and hazel peaks: when beech has a minimum, hazel has a peak. It has been argued that hazel peaks in the pollen record of the Neolithic of the Lake Constance area are caused by Neolithic land use (for a summary: Kerig and Lechterbeck, 2004; Rösch, 2013). A ‘slash and burn’ system for the Young Neolithic, with short arable and long fallow phases, has been proposed (Rösch, 2013; Rösch et al., 2008; Schier et al., 2013), although it has not remained undisputed (cf. Jacomet, 2008). Nevertheless, farming experiments show that such a land-use system would produce large areas of secondary woodland, as only 3% of the agricultural land would have been arable, the rest would have been fallow fields in different stages of reforestation, pathways and pasture areas (Rösch et al., 2008). This would certainly explain the high amounts of secondary woodland indicators in pollen-based vegetation reconstructions (Lechterbeck, 2013).
With the radiocarbon density curve and the LCCs, we have two proxies – one for demographic change and one for land-use change. These two proxies are independent and do not necessarily have to correlate. Our analysis shows that this is the case for the Linear Pottery culture (7400–7000 BP), where the radiocarbon curve indicates a certain population density but the LCC do not show any hints of land-use activities.
The rise of the secondary forest LCC already at the Middle to Young Neolithic (around 6300 BP) transition slightly predates the rise of the 14C density curve. Land-use activities on mineral soils become visible in the pollen record. At this time, the dendro- and relatively dated archaeological record shows a focus of settlement in the Hegau area; these sites are dated by cultural material rather than radiocarbon dates. The single records (Figure 3), however, show that the increase of secondary LCC in the Middle Neolithic is recorded foremost in the lake shore sites, which is enigmatic as only few Middle Neolithic finds are known from the lake shores, mostly single, allochthonous sherds from younger Neolithic contexts.
During the following phases of lake shore settlements, there is a good correlation of the radiocarbon density and the secondary woodland curve when the radiocarbon dates are binned at the same 200-year intervals as the pollen data (r = 0.77 between 6000 and 4000 BP). We suggest that this is the time when the secondary woodland peaks in the pollen record are most securely linked to anthropogenic activity. Subsequently, the reforestation phase between 5500 and 5300 BP corresponds to a minimum in the radiocarbon density curve. In the settlement record, this is known as the ‘Pfyn/Horgen gap’, a phase where settlements at the lake shore are abandoned. As most of the analysed pollen records come from the hinterland of the lake, we can assume not only that settlements at the lake vanish but that there is decreasing land use in the hinterland of the lake, providing clear signs of demographic decline. These developments are unequivocally reflected in all single profiles, with the exception of Feuenried (UFR). The single records show additionally that this development was not wholly synchronous in the area. The reasons for this might lie in a dating uncertainty, but it might also be the result of the shifting of arable land and settlements in the course of swidden cultivation.
Towards the end of the Neolithic, the settlement density at the lake shore lessens as the radiocarbon densities decrease. There are few settlements and single finds of Corded Ware age known (Lechterbeck et al., 2013). Our results suggest a possible link between this decline of settlement intensity and decrease in land-use intensity in the hinterland.
Whereas there is a clear correlation between secondary forest LCC in the younger Neolithic stages and the radiocarbon density curve (see Figure 4), the correlation between the 14C curve and the changes in the LCC recorded in the EBA is less pronounced (r = 0.33 between density values and sum of arable and pasture/meadow LCC, 4000–3200 BP). This might be because of the fact that most of the radiocarbon dates come from Bronze Age pile dwellings which belong to a later phase of the EBA, whereas the settlement in the hinterland of the lake – as reflected in the pollen data – starts earlier (around 4400 BP).
On-site (Lechterbeck et al., 2013) and off-site botanical as well as pollen analytical data for the Bronze Age (4300–2800 BP) and the immediately preceding End Neolithic Bell Beaker culture indicate a change in land-use techniques. For the first time, off-site data show strong deforestation (Kalis et al., 2003). Perennial and wind-pollinated species such as Plantago lanceolata and Centaurea jacea became much more abundant, indicating fields with short fallow phases and grazing on pastures with an open tree canopy; Corylus only increases very slightly during phases of strong land use; instead, rises of Betula indicate the first stages of reforestation (Rösch, 2013). This change in land use is reflected very clearly in the LCC reconstruction. The 14C density curve no longer correlates with secondary forest elements but with a rise in pasture/meadow and arable LCC. This indicates stationary arable fields and, for the first time, true grassland. Secondary forest elements occur from now on only as first stages of a reforestation phase and hence indicate a lessening of land-use pressure. Again, hazel and also birch have undergone a change in the ecological niche they occupy.
The LCCs represent a regional, spatially integrated signal over the whole of the Western Lake Constance area and reflect complicated, small-scale ecological patterns as well as the settlement history of the hinterland, which does not show to the same extent in the radiocarbon record, as the dates come in large part from the lake shore dwellings (Figure 1). The LCC reconstruction and demographic proxy make sense; we argue that the changes observed in the pollen record are primarily caused by human impact.
Conclusion
In this paper, we have combined a PBM approach for land-cover reconstruction with a method for assessing demographic change using archaeological radiocarbon date density as a proxy. The aim of the study was to evaluate whether land use and population density in the Neolithic are connected. The close overall correspondence between the two archives implies that population dynamics and land-cover change were intrinsically linked, especially for the time period from the Young Neolithic to the EBA. Different LCCs correlate with the radiocarbon density curve in the Lake Constance area; in the younger parts of the Neolithic, this corresponds to increases in secondary woodland arable and pasture land. It has long been argued that these secondary woodland peaks were caused by Neolithic land use.
Here, for the first time, these peaks are correlated to archaeological evidence in the form of radiocarbon dates from timber and artefacts. Later on, the EBA radiocarbon density curve correlates with pasture/meadow and arable LCC. On the other hand, the LCCs fail to indicate Linear Pottery land use and the radiocarbon curve does not depict Middle Neolithic population density – in both cases presumably because of a lack of data. This is an inherent problem for contemporaneous pollen analysis as Early Neolithic land use is almost never visible in the pollen record or only in very discrete and disputable instances. We suggest that more archaeological radiocarbon data should be acquired from this time frame to address this crucial issue.
We find that the overall patterns of LCC and the radiocarbon population proxy are closely linked. Like Woodbridge et al. (2012), we see human impact as a key driver for vegetation change in the Neolithic. Climate obviously has an influence on vegetation development, but changes caused by human land use are clearly detectable from early Neolithic times, at least in these densely settled, mid-altitude landscapes.
Footnotes
Acknowledgements
We wish to thank M. Merkl for providing settlement data from the Hegau (DFG project ‘Archäologische und vegetationsgeschichtliche Untersuchungen zur neolithischen Besiedlungsgeschichte im Hegau und am westlichen Bodensee im diachronen Vergleich’, PI J. Bofinger and M. Rösch) and H. Schlichtherle and A. Billamboz for radiocarbon dates. We wish to thank two anonymous reviewers whose comments, suggestions and critique greatly improved the paper.
Funding
The work was made possible by the ERC Advanced Research Grant #249390 (PI S. Shennan). The development of the pseudo-biomisation approach was supported through Plymouth University Geography PUP funds and Leverhulme Trust grant F/568W.