
Abstract
We present measurements of Sr/Ca, δ18O, and spectral luminescence ratios (G/B) from a mid-Holocene Porites sp. microatoll recovered from the nearshore Great Barrier Reef (GBR). These records were used as proxies to reconstruct sea surface temperature (SST), the δ18O of surrounding seawater (δ18Osw), and riverine influence, respectively, and compared with records from a modern Porites sp. microatoll growing in the same environment. Strong riverine influence in the mid-Holocene record is indicated by (1) an increased annual δ18Osw range in the mid-Holocene record, (2) negative peaks in δ18O characteristic of flood events, and (3) a higher G/B luminescence ratio. Seasonal cycles in G/B suggest that humic acid inputs were elevated for a longer portion of the year during the mid-Holocene. The seasonal cycle of δ18Osw peaked earlier in the year in the mid-Holocene record relative to the modern, while mean δ18Osw values from the mid-Holocene record were similar to modern values. These records provide an insight into the oceanographic conditions the nearshore GBR experienced during mid-Holocene climatic shifts and are consistent with a strong Australian–Indonesian Summer Monsoon (AISM) system at ~ 4700 cal. yr BP.
Introduction
The mid-Holocene (~ 6000–4000 yr BP) is a period where rapid shifts in global climate patterns and monsoon systems occurred (Duprey et al., 2012; Greer and Swart, 2006). Modeling data suggest variations in paleomonsoon intensity influenced the Western Pacific particularly (Braconnot et al., 2008). Palynological data from north-eastern Australia indicate generally wetter conditions and suggest that a shift occurred in ENSO system state at ~ 5000 yr BP from a La Niña type with higher precipitation, to an El Niño-dominated state with lower precipitation associated with modern ENSO conditions (Rodbell et al., 1999; Sandweiss et al., 1996; Shulmeister and Lees, 1995). Variations in the ENSO system and the AISM were likely to have been important influences on Holocene reef growth in the Great Barrier Reef (GBR; Smithers et al., 2006; Stott et al., 2004).
The GBR is one of the most studied reef provinces, with numerous studies focusing on determining the relationship between coral geochemical proxies and modern SSTs (Alibert et al., 2003; Cardinal et al., 2001; Fallon et al., 2003; Marshall and McCulloch, 2002). In comparison, fewer studies have focused on coral records investigating the hydrological cycle (Gagan et al., 1998, 2002). Mid-Holocene proxy records from the GBR are also rare, further limiting our understanding of oceanographic conditions during the Holocene period of reef-building.
Studies using corals as proxy recorders of riverine input to the GBR have found no overall trend toward conditions of higher or lower rainfall over the last ~ 350 years (Lough, 2007), yet suggest rainfall variability has increased (Lough, 2011). However, one of the major difficulties within this topic is identifying the natural variability in runoff conditions over long-term (centennial to millennial) timescales, as opposed to anthropogenically induced runoff.
Porites sp. corals are a valuable source of proxy data for reconstructing changes in coastal oceanographic conditions as (1) they are relatively long-lived, allowing recovery of decadal to centennial scale records; (2) their yearly growth rate (5–15 mm/yr) allows for subannual resolution of proxy records; and (3) the physical characteristics and chemical composition of their skeleton respond to environmental changes. Investigation of coral skeletal δ18O has great value for understanding hydrological conditions and changes in paleomonsoon systems as its composition in coral skeleton is a function of both SST and the oxygen isotopic composition of the surrounding seawater (δ18Osw; Corrège, 2006; Grottoli and Eakin, 2007). δ18Osw is closely related to the balance between precipitation and evaporation, and is influenced by continental runoff in coastal areas (Schmidt, 1998). Additionally, the skeletal luminescence displayed by Porites skeleton under UV light is related to the intensity of riverine flood events on the GBR (Lough et al., 2002).
Reconstructions of paleoenvironmental conditions based on comparisons between modern and fossil coral colonies are complicated by potentially large inter-colony variation in proxies (Allison, 1996; Linsley et al., 1999). However, several studies have demonstrated good reproducibility between Porites colonies (Inoue et al., 2007; Stephans et al., 2004), and the inter-colony signal reproducibility for δ18O in Porites microatolls has been found to be comparable with or better than domed Porites (McGregor et al., 2011). Recent laboratory experiments suggest that light intensity may be an important factor in reproducibility, supporting the use of shallow growing microatolls for paleoclimate reconstruction (Hayashi et al., 2013).
We present a multi-proxy skeletal δ18O, Sr/Ca, and spectral luminescence record of seasonal to interannual variability in riverine influence obtained from nearshore GBR coral microatolls. Annual mean SST and mean summer and winter values were calculated from a mid-Holocene (4665 cal. yr BP) record spanning 31 years, and a modern record spanning 17 years. The combined data provide high-resolution information on past climate variability within the north-eastern Australian region and suggest that an altered mid-Holocene hydrological cycle influenced coastal oceanographic conditions of the GBR.
Study site and environmental conditions
King Reef (17°46′S, 146°08′E) has been described as a nearshore platform reef (Sinclair, 2005), or a mainland fringing reef (Hopley et al., 2007). Reef growth has occurred in two major lobes extending seaward, with reef flat development beginning approximately 1 km from the shoreline, separated by a sandy bottomed channel, which is ~ 1 m in depth at Lowest Astronomical Tide (LAT; Figure 1). The reef flat, which contains both living modern and fossil Holocene Porites microatolls in close proximity, has a total area of ~ 2 km2.
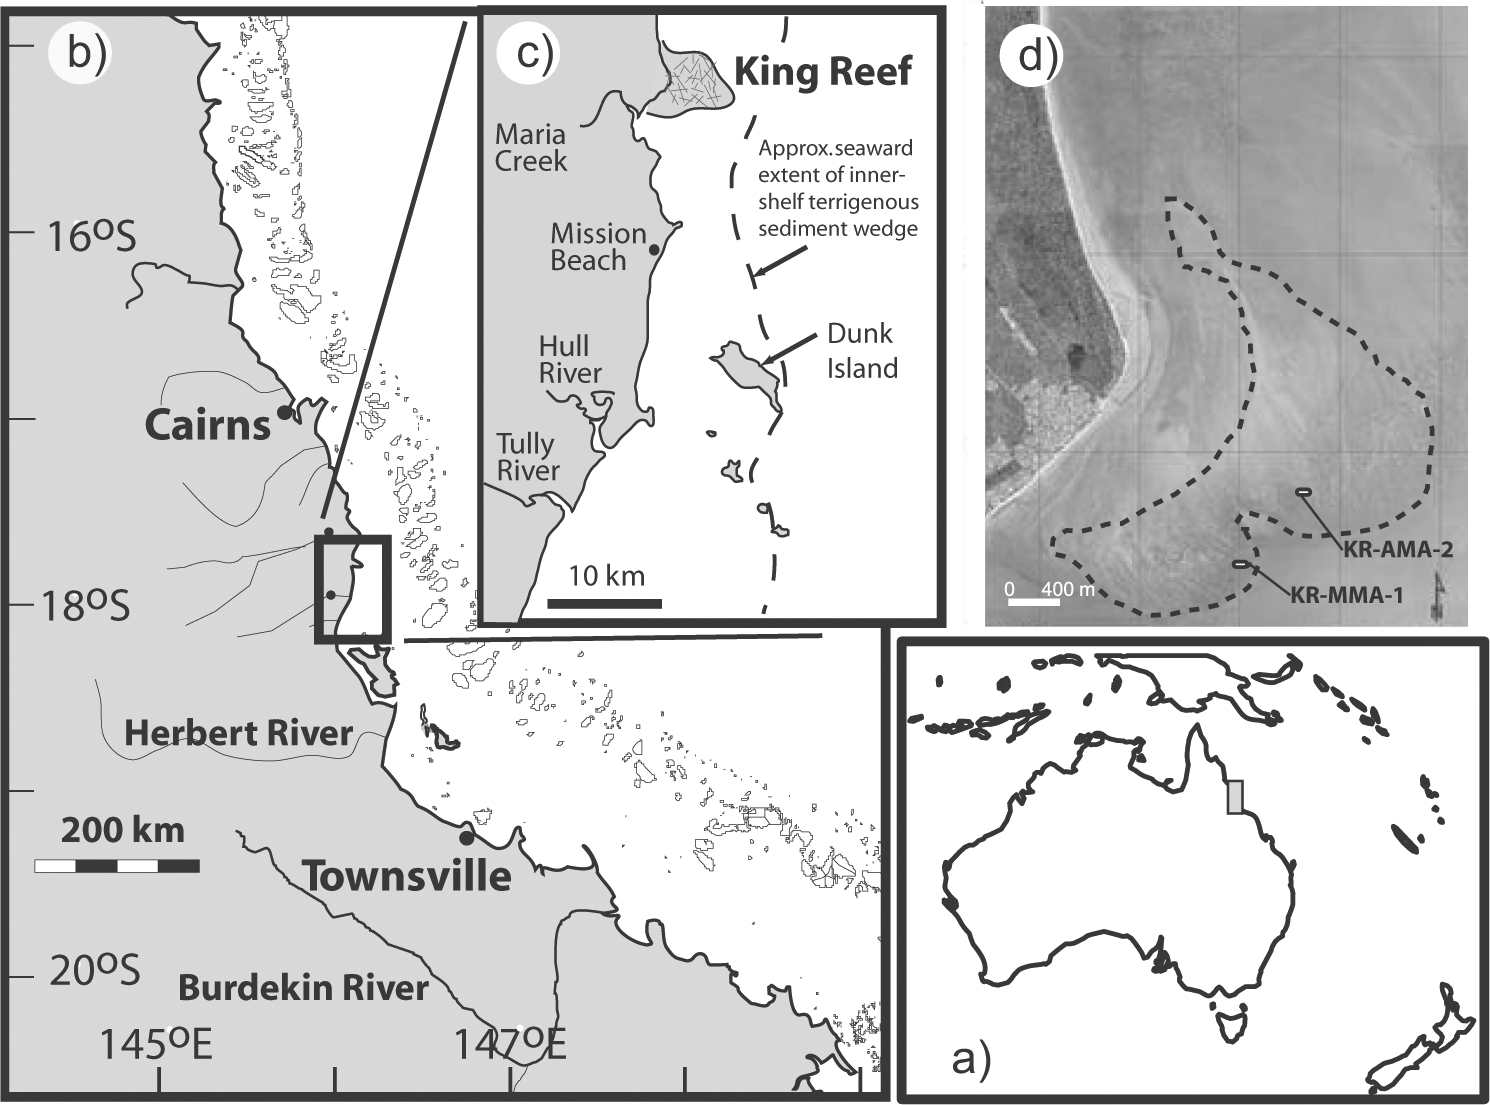
Location map showing (a) position of the study area within Australia, (b) location of King Reef within the Great Barrier Reef, (c) local riverine influences on King Reef, and (d) location of coral microatoll samples within King Reef.
The oceanography and climatology of north-eastern Australia are characterized by a warm summer wet season and a cooler winter dry season (Figure 2a and b). Intense rainfall events occur during the summer season because of the high cloud cover and moist air masses resulting from the seasonal switch in circulation (Figure 2c and d), as well as tropical cyclones passing through (Wolanski and Jones, 1981). Southeasterly tradewinds prevail during most of the year within the GBR region (Cresswell and Greig, 1978) but are displaced by the northerly winds of the Australian monsoon during the austral summer (Pickard et al., 1977; Figure 2e and f). The wet season heavy tropical rain results in soil erosion from terrestrial areas, delivering pulses of high-sediment, low-salinity waters to nearshore and mid-shelf reefs via riverine discharge (Brodie et al., 2010).
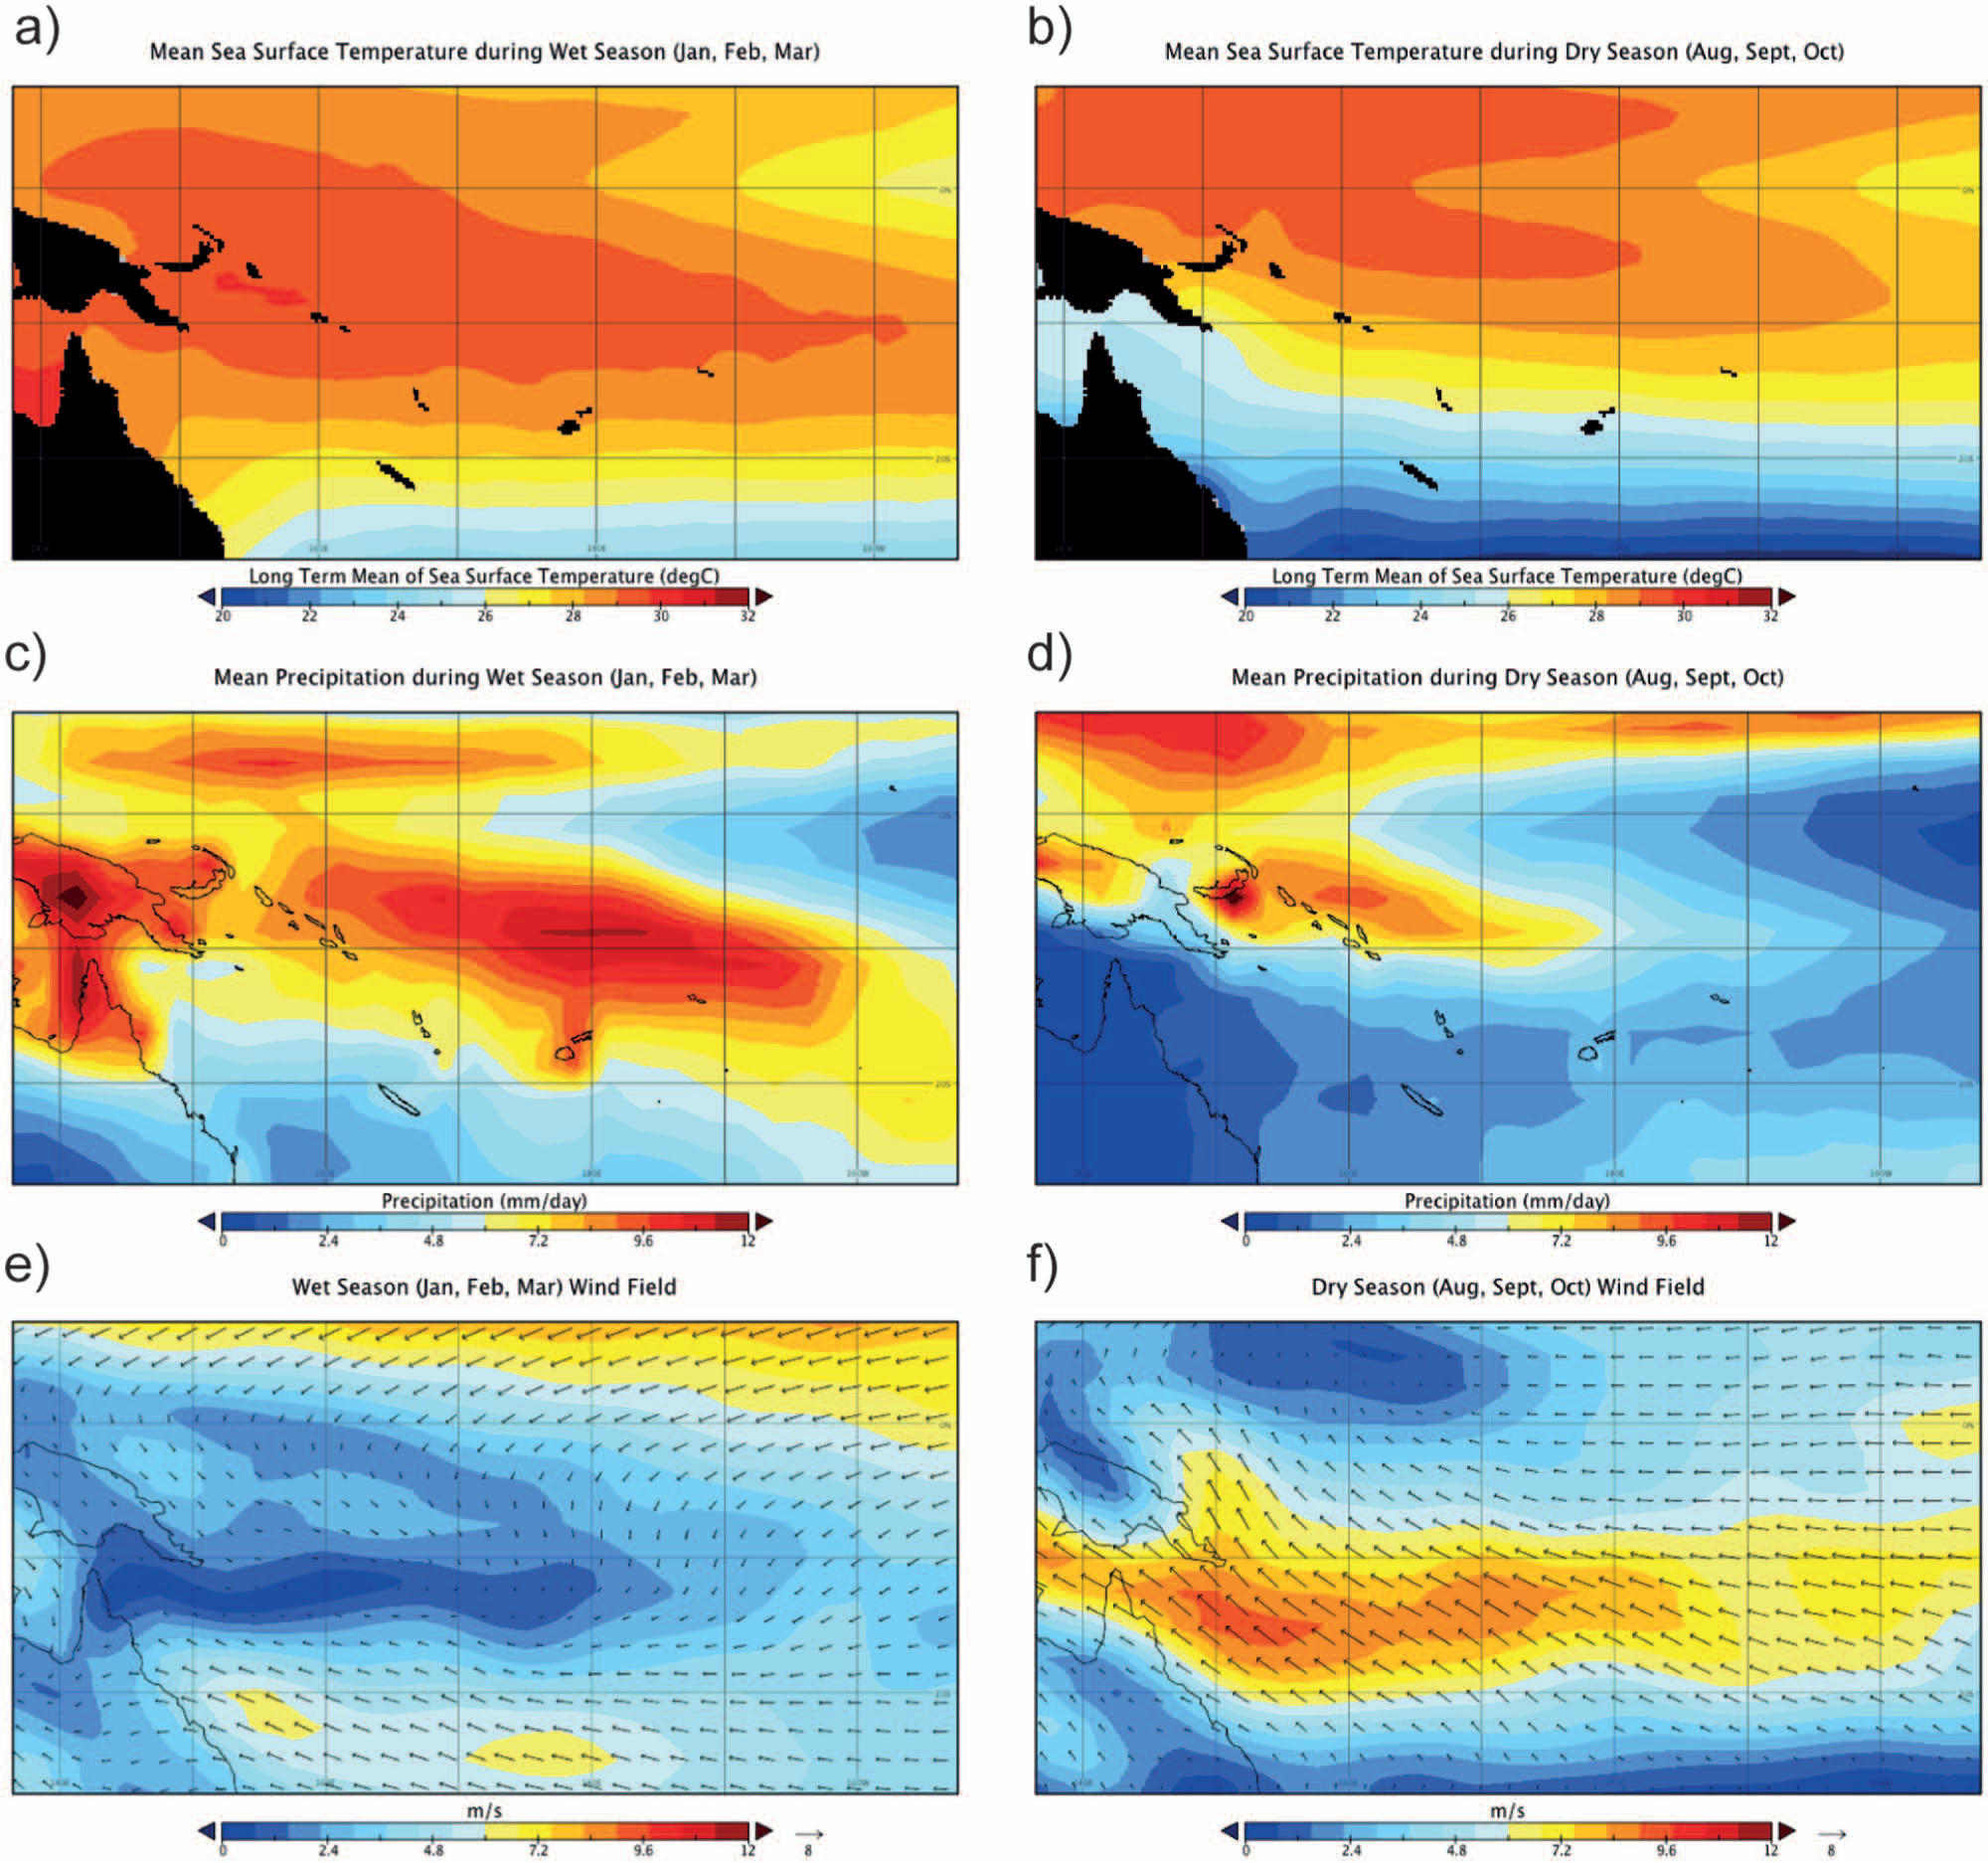
Mean SST within southwestern Pacific during (a) peak wet season months. (b) Peak dry season months, from NOAA Optimum Interpolation SST V2 Data (1971–2000). Mean precipitation levels within southwestern Pacific during (c) peak wet season months, and (d) peak dry season months, obtained from GPCP Version 2.2 Combined Precipitation Dataset (1981–2010). Mean wind field characteristics within southwestern Pacific (e) peak wet season months and (f) peak dry season months, obtained from NCEP/NCAR 1 Reanalysis (1981–2010). All data accessed from http://www.esrl.noaa.gov/psd/.
The interaction of buoyant riverine freshwater and the Coriolis force transports riverine flood plumes northwards within the GBR lagoon (Wolanski and Jones, 1981). As a result, King Reef is exposed to discharges from the Herbert River, Hull River, Murray River, and Tully River, and during exceptional flood events, even those of the Burdekin more than 200 km further south (Sinclair and McCulloch, 2004). The major riverine influence is the Tully River, which enters the GBR lagoon ~ 40 km to the south of King Reef and has an average annual discharge of 3.0 (±0.9) million megaliters. Flood plume movements of the Tully are noted as being variable because of wind and local topographic effects dominating plume fate during lower discharges (King et al., 2001). King Reef is further influenced by a small local river, Maria Creek, which discharges approximately 1 km south (Sinclair and McCulloch, 2004).
Instrumental data from Mourilyan Harbour (17°59′S, 146°12′E), ~ 20 km to the north, show average monthly SST temperatures approaching a peak of 30°C, in January and February, and a minimum of 22°C in July (http://www.aims.gov.au). Highest precipitation levels (500–700 mm) occur in the summer wet season months of February and March, but show high interannual variability. Modeled salinity data for the GBR covering the area of King Reef suggest that salinities reach 30 psu during flood events (King et al., 2002), while near-surface salinity recorded at Dunk Island during a Tully River flood event reached a minimum of 16 psu, indicating that extremely low salinity patches reach nearshore reefs within this region (Wolanski et al., 2008).
Materials and methods
Physical sampling of corals
Microatolls were selected from the reef flat of King Reef based on size, accessibility, and degree of preservation. Small slabs of 10 cm length by 2 cm width were sampled from candidate microatolls to confirm that a consistent banding pattern was present. A microatoll inferred to be of mid-Holocene age based on its elevation relative to modern microatolls (later confirmed by dating) was labeled ‘KR-AMA-2’ and was sampled by cutting a slab 1.4 m in length, approximately 8 cm in width, and ranging from 6 to 10 cm in height, through the major growth axis of the colony (Supplementary Figure 1, available online). An 8-cm slab was also cut through a modern Porites microatoll labeled ‘KR-MMA-1’, growing near the contemporary reef edge in a comparable habitat. The void left by sampling was replaced with a customized concrete block to minimize visual disturbance and the potential of exposing the corals to additional bioerosion.
The upper limit to coral growth on modern microatolls is constrained by mean low tide level, while the surface of the Holocene colony was elevated by approximately 0.5 m above this level. In the inner-central GBR, sea level during the mid-Holocene (5000–4000 cal. yr BP) is estimated to have been 0.5–1 m higher than present (Chappell, 1983; Lewis et al., 2008). Thus, the water depth at which the mid-Holocene microatoll grew is similar to that of the modern colony.
Microatoll slabs were cut to a thickness of 7 mm and were ultrasonically cleaned in deionized water for 20 min. The samples were then rinsed three times with deionized water and dried at 40°C for 24 h. X-radiographs carried out at the Natural History Museum, London, revealed that annual density bands were present in both the modern and mid-Holocene microatoll sections. Linear extension rates based on measurements of annual density banding varied from 10 to 13 mm/yr in the modern slab, and from 12 to 15 mm/yr in the fossil slab. This is consistent with previous reports of growth rates of ~ 10–15 mm/yr for Porites corals growing in shallow water (<10 m) on the GBR (Lough and Barnes, 1997). Selection of an optimal sampling track in the mid-Holocene specimen required cutting a series of overlapping sections, guided by the density-banding pattern (Supplementary Figure 1, available online).
Samples were drilled along this axis at 1.5-mm (modern specimen) or 1.75-mm (mid-Holocene specimen) intervals, using a diamond-tipped drill bit 1 mm in diameter. This sampling resolution corresponds to monthly to bi-monthly resolution based on growth rates of the mid-Holocene and modern specimens. Following collection, the powdered samples obtained were split into separate aliquots for trace element (Sr/Ca) and stable isotope (δ18O) analysis.
Age determination and assessment of diagenetic alteration
A sample from the outer edge of KR-AMA-2 was C14 dated at the University of Waikato Radiocarbon Dating Laboratory, New Zealand. Radiocarbon ages obtained were converted to 14C years before the present using the CALIB program. Dating of the outer edge of KR-AMA-1 yielded an age of 4481 ±30 14C yr BP, with a calibrated median probability age of 4665 yr BP following Telford et al. (2004).
Representative samples from both modern and fossil corals were screened for diagenetic alteration and secondary recrystallization. X-ray diffraction (XRD) analysis was carried out at the University of Liverpool on powdered samples taken from outer, central, and inner locations; results revealed the presence of aragonite with no calcite peaks detected, indicating that significant diagenesis had not occurred.
Scanning electron microscopy (SEM) was carried out at Manchester Metropolitan University on a Zeiss Supra 40 VP (Field Emission Gun) system. No calcite and no secondary cements of either calcite or aragonite were found in the skeleton of KR-AMA-2. KR-AMA-2 showed identical forms of acicular aragonite to modern Porites samples. SEM images of KR-AMA-2 illustrate the presence of the unaltered meso-architectural skeletal structure typical of Porites (Supplementary Figure 1, available online).
Stable isotopes and elemental ratios
Stable isotopic determinations were made on coral powder sub-samples at the British Geological Survey, Nottingham. Powdered coral samples were weighed to yield sub-samples of approximately 30–100 µg. Isotope analysis was carried out on a GV IsoPrime mass spectrometer plus Multiprep device. Isotope values (δ18O) are reported as per mille (‰) deviations of the isotopic ratios (δ18O/δ16O) calculated to the Vienna Pee Dee Belemnite (VPDB) scale using a within-run laboratory standard calibrated against that of National Bureau of Standards (NBS). Analytical precision based on long-term repeated measurements of the standard calcite (KCM) is 0.05‰ for δ18O.
Sr/Ca determinations were made on coral powder sub-samples by inductively coupled plasma atomic emission spectroscopy at the Natural History Museum of London using a Varian Vista Pro ICP-AES. Each coral sample of 0.5 mg was dissolved in 1 mL of 2% (v/v) trace metal-grade nitric acid diluted with deionized water (18 MΩ resistance). Blanks of nitric acid and deionized water were routinely monitored for contamination. Instrumental drift was monitored by measuring a laboratory control sample after every 10 solutions. Each element was determined using two wavelengths (Ca 315.887 and Ca 315.887 nm, Sr 407.771 and 421.552 nm), and an average of the two was then taken as the final value. Analytical precision was 0.025 mmol/mol for Sr/Ca based on repeated determinations of the coral standard solution (n = 23).
To assign a chronology to the KR-MMA-1 and KR-AMA-2 records, the highest monthly SST value derived from the satellite Reyn-smith OIv2 dataset was tied to the lowest δ18O value (and vice versa) using the Analyseries program (Paillard et al., 1996). δ18O was used to create anchor points as the seasonal cycle was more apparent than within the Sr/Ca record, and high SST and low SSS occur during the same months in the GBR. The same timepoints were used to assign a chronology to the Sr/Ca record. Linear interpolation was used to provide a monthly resolution for comparison with instrumental SST and SSS datasets. To calibrate modern Sr/Ca with the instrumental SST record, a least squares regression analysis was carried out, using only annual minimum and maximum values, to avoid errors introduced by assumption of a constant intra-seasonal growth rate (Morimoto et al., 2007). Temperature calibration equations were determined from the modern King Reef microatoll specimen, as differing equations have been previously noted along an inshore to offshore gradient of the GBR and at locations considered marginal for coral growth (Fallon et al., 2003; Suzuki et al., 1999). Regressions between annual minimum and maximum Sr/Ca–SST and δ18O–SST gave the following temperature calibrations:


At monthly resolution, the correlation between δ18O and instrumental SST is strong (n = 214, r = −0.70) and significant (p < 0.001). The correlation between monthly Sr/Ca values and instrumental SST is also reasonably strong (n = 214, r = −0.58) and significant (p < 0.001). The correlation between annual minimum and maximum Sr/Ca and δ18O values and instrumental SST is similar for both proxies (Sr/Ca; n = 17, r = 0.88, δ18O; n = 17, r = 0.89). Mean summer Sr/Ca and δ18O values were obtained from the three datapoints corresponding to summer months, and winter from the three datapoints corresponding to winter months. The annual range was calculated as the difference between summer and winter values (Table 1). Because of unequal sample sizes, differences between mid-Holocene and modern values were tested using the Welch two-sample t-test (Ruxton, 2006).
Summary of coral δ18O, Sr/Ca and G/B luminescence analysis.
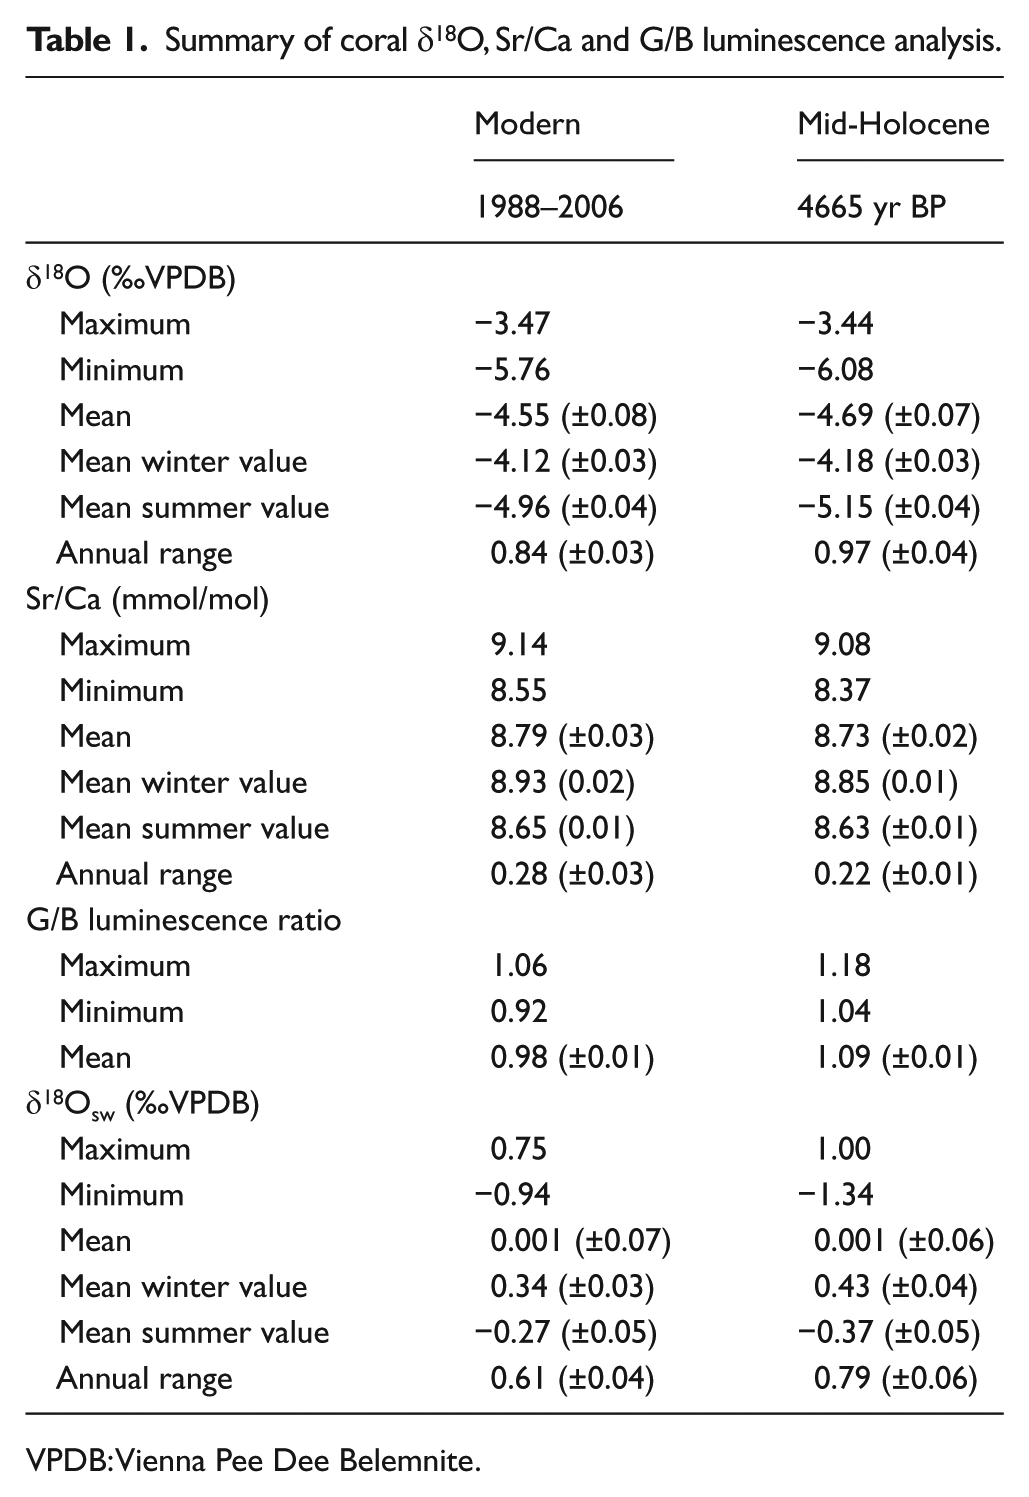
VPDB: Vienna Pee Dee Belemnite.
Calculation of δ18Oseawater
To calculate δ18O of the surrounding seawater (δ18Osw), the centering method of Cahyarini et al. (2008) was used, calculated as:
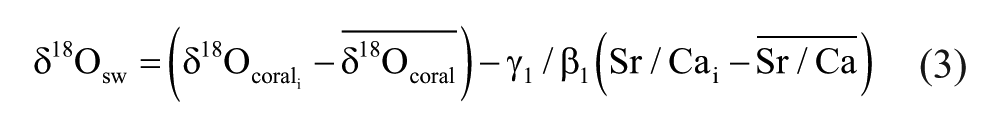
This method omits the intercept in the calculation of δ18Osw, thereby removing the issue of errors within the independent variable (Sr/Ca–SST proxy). γ1 is the regression slope of coral δ18O versus SST obtained from Eq. 1, and β1 is the regression slope of coral Sr/Ca versus SST obtained from Eq. 2. The effect of substituting previously published slope estimates contained in Cahyarini et al. (2008) of 0.2 ‰/°C for δ18O and 0.06 mmol/mol/°C for Sr/Ca was tested and resulted in a negligible difference in mean mid-Holocene δ18Osw of 0.00002‰ and 0.00001‰ for modern δ18Osw values (Supplementary Information, available online). The error of δ18Osw was calculated as:

The error in δ18Osw within this study obtained by this method is 0.09‰ (PDB). Mean summer and winter values and annual range for the modern and mid-Holocene records were calculated using the same methodology as Sr/Ca and δ18O. Monthly seasonal cycles (Figure 3) were derived by averaging datapoints for each month over the entire modern and mid-Holocene record of δ18Osw. Instrumental records of salinity and river discharge at monthly resolution were generated by the same method.
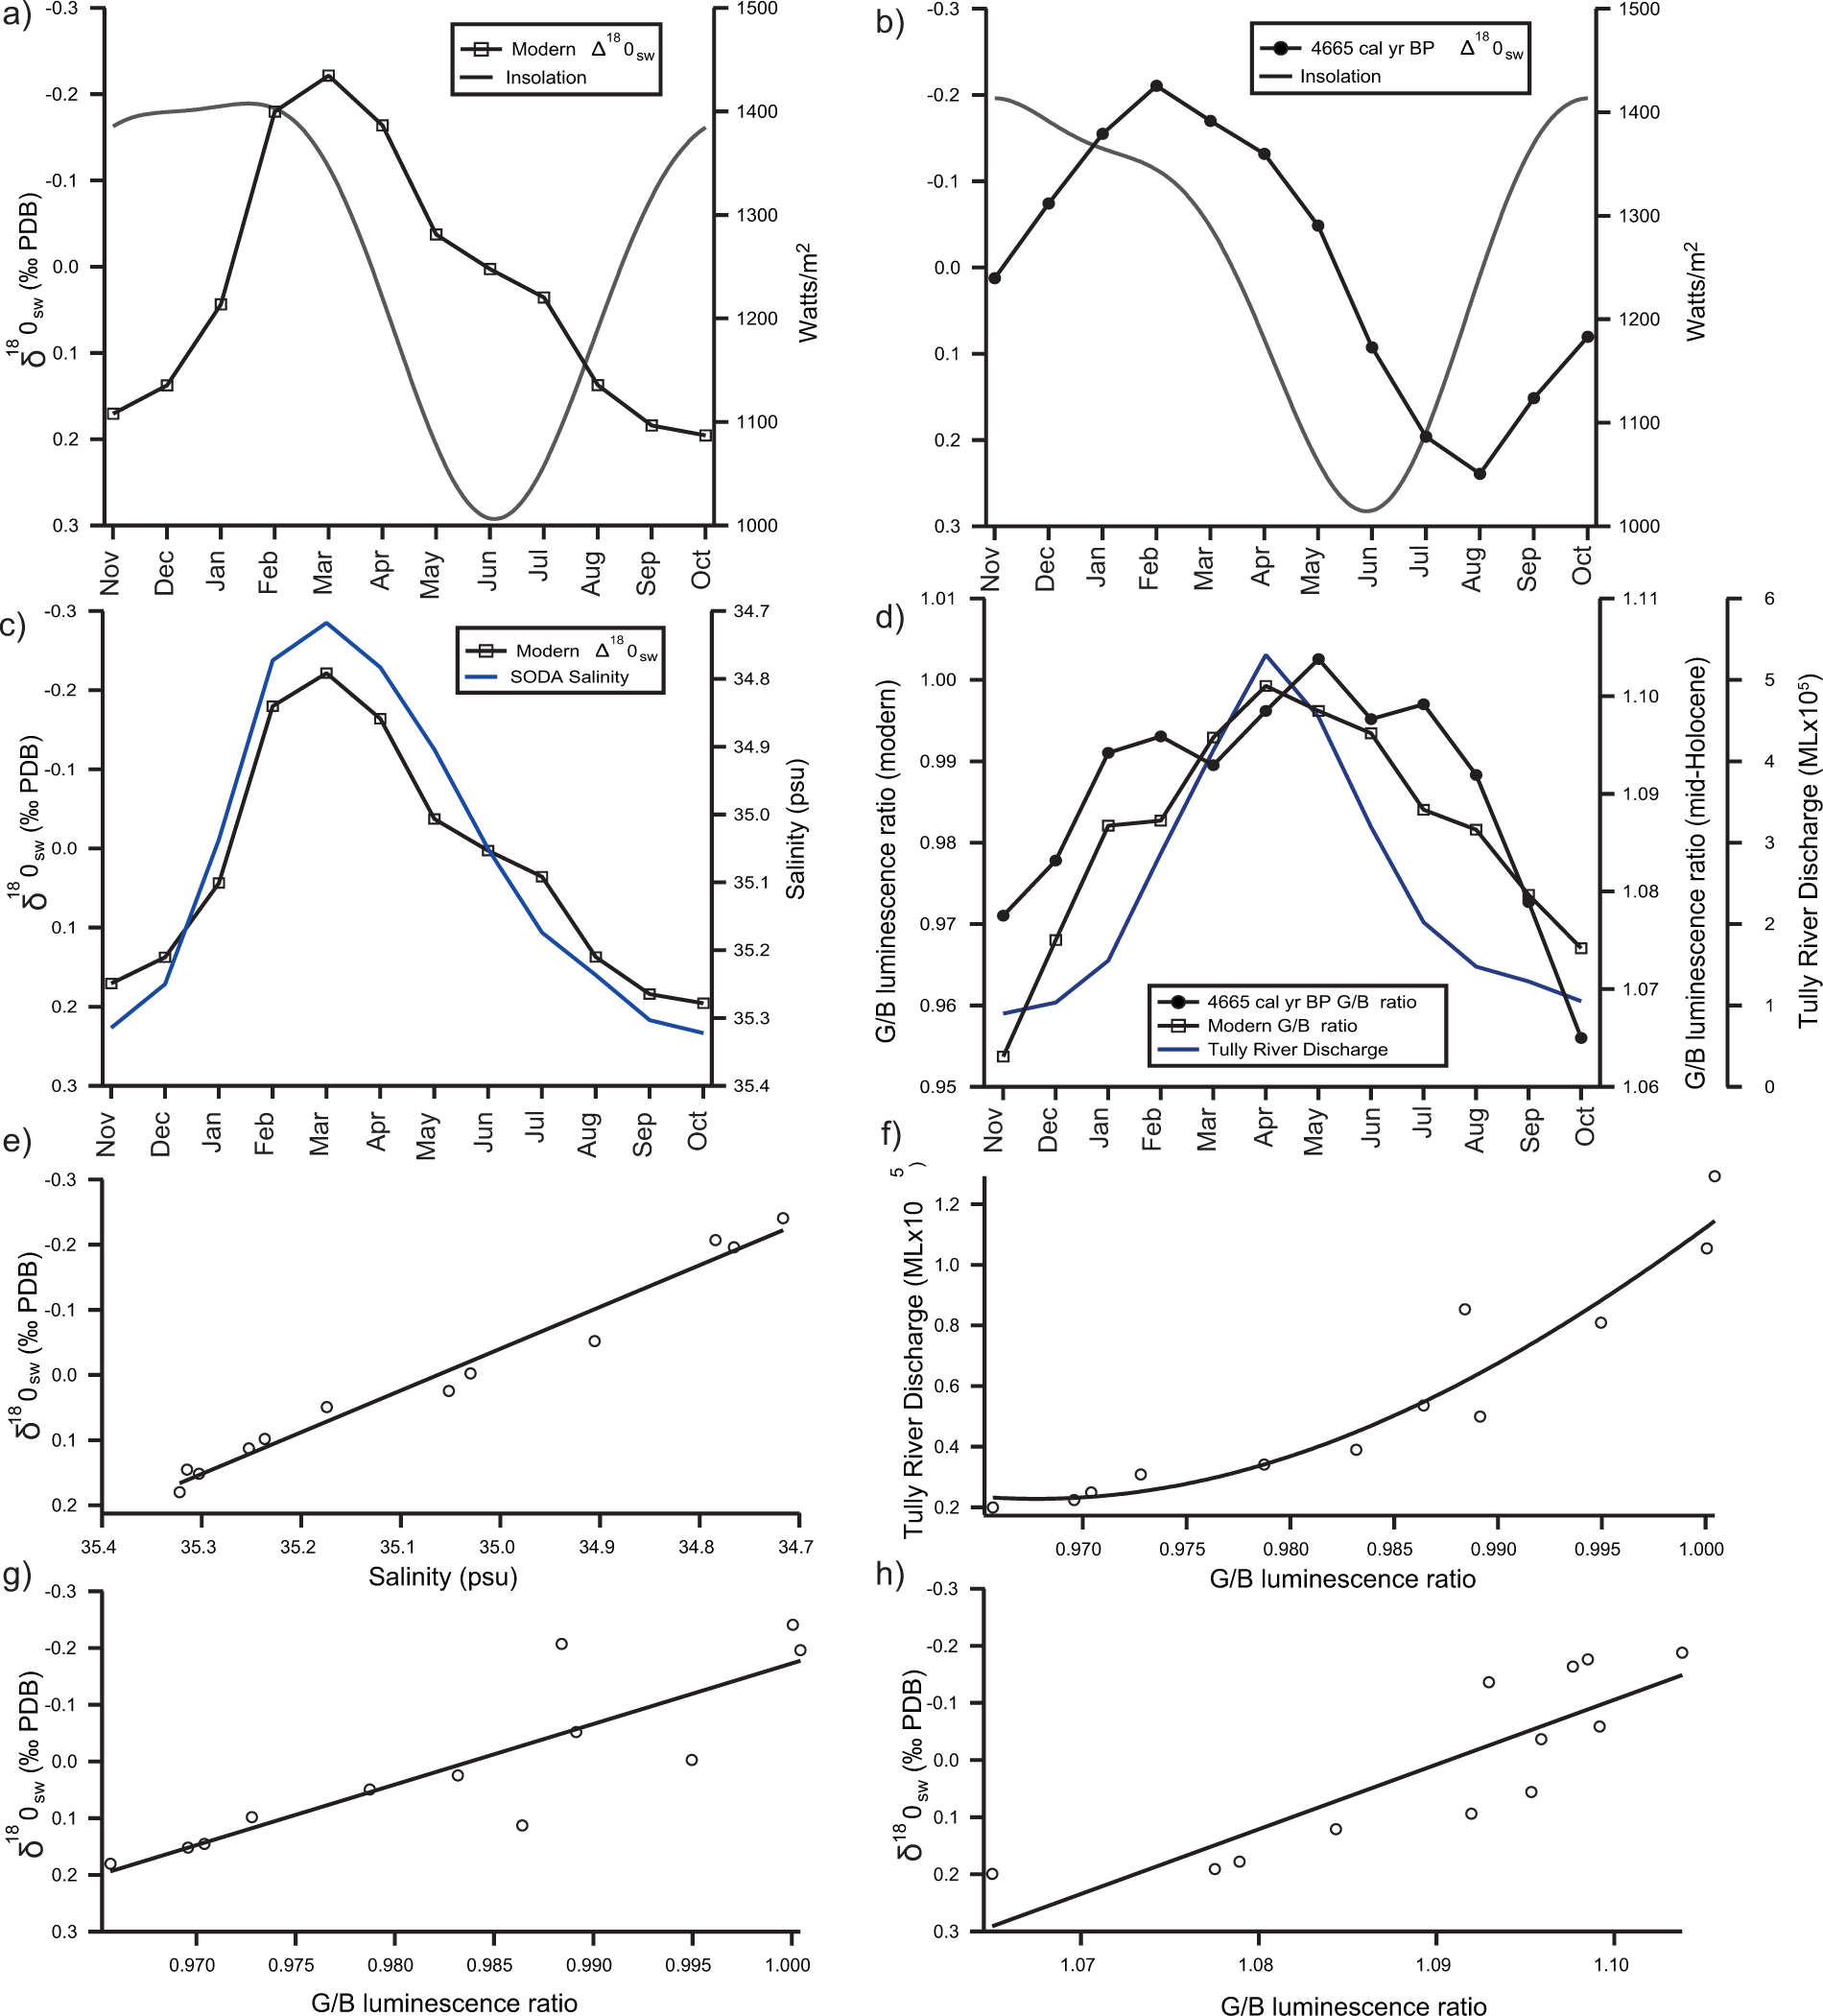
(a) Mean seasonal cycle of δ18Osw for the microatoll KR-MMA-1, together with the modern seasonal cycle of insolation at 17°S. (b) Mean seasonal cycle of δ18Osw for the mid-Holocene microatoll KR-AMA-2, together with the seasonal cycle of insolation at 17°S, 4700 yr BP (Laskar et al., 2004). (c) Mean seasonal cycle of δ18Osw for the microatoll KR-MMA-1, and the seasonal salinity cycle from the SODA salinity dataset. (d) Mean seasonal cycle of G/B luminescence ratio for the mid-Holocene microatoll KR-AMA-2, together with the mean modern seasonal cycle from KR-MMA-1, and the monthly river discharge for the Tully River. (e) Regression of monthly δ18Osw from the modern microatoll KR-MMA-1, with monthly salinity values from the SODA dataset. (f) Regression of monthly G/B luminescence values with monthly Tully River Discharge. (g) Regression of modern monthly G/B luminescence values with modern monthly δ18Osw. (h) Regression of mid-Holocene monthly G/B luminescence values with mid-Holocene monthly δ18Osw.
Spectral luminescence measurement
Luminescence measurements on the coral specimens were performed following the method of (Grove et al., 2010) and was carried out at Nederlands Instituut voor Onderzoek der Zee (NIOZ), Texel, Holland. This technique allows determination of the humic acid/aragonite ratios within the skeleton (Grove et al., 2010, 2012, 2013b). An Avaatech core-scanner, conventionally used for analyzing sediment cores by x-ray fluorescence, was modified and equipped with a line scan camera. Luminescence emissions from UV tubes in the 350−450 nm range are split into three wavelength ranges (Red, Green, and Blue) by a Dichroic RGB beam splitter prism and are recorded by separate sensors (Grove et al., 2010). Prior to analysis, oxidative cleaning for 24 h with sodium hypochlorite (BDH Spectrosol: 12% w/v reactive chloride) was carried out to remove any contaminating organics (Nagtegaal et al., 2012). Sampling for geochemical analysis was carried out prior to treatment with NaOCl. The spectral line scanning technique achieves a linear resolution of 71.4 µm, equating to a temporal resolution of approximately 2.5 days for a 10 mm/yr coral growth rate. Scanning was carried out on modern and mid-Holocene slabs parallel to the sampling tracks taken for trace element and stable isotope analysis. To transform luminescence data from a distance to time scale, the average month of minimum Tully River Discharge was tied to troughs within the luminescence record. The same average timing of minimum discharge was applied to the mid-Holocene record. Luminescence datapoints were smoothed using a 10-point running mean filter and were then interpolated to monthly resolution for comparison with instrumental river discharge data. Monthly seasonal cycles were derived by averaging datapoints for each month over the entire modern and mid-Holocene record of G/B.
Instrumental SST, river discharge, and salinity
Instrumental SST data were obtained from the Australian Institute of Marine Science (AIMS) data logger located at Mourilyan Harbour (17°59′S, 146°12′E). Satellite temperature data were obtained from the NOAA NCEP EMC CMB Global Reyn-Smith OIv2 weekly blended satellite and observations SST dataset with the box centered on 17.5°S (17°–18°) and 146.5°E (146°–147°). As the satellite dataset does not capture the full seasonal range recorded by the Mourilyan Harbour data logger, the linear relationship between the two datasets was used to create a composite SST which spans the full temporal range of the isotope and trace element data.
River discharge data for the Tully River were obtained from the Queensland Bureau of Meteorology (http://www.bom.gov.au). No long-term in situ salinity data are available from King Reef; therefore, data from the Carton-Giese Simple Ocean Data Assimilation (SODA) reanalysis project were chosen as a long-term monthly resolution SSS dataset. This consists of a combination of observed and modeled data (Carton et al., 2000). Data were obtained from the box centered on 17.5°S (17.25°–17.75°) and 146°E (145.75°–146.25°). SODA version 1.4.2 extends from 1958 to 2001 and uses surface wind products from the European Center for Medium-Range Weather Forecasts 40-year reanalysis (ECMWF ERA 40), which may contain inaccuracies in tropical regions (Cahyarini et al., 2008). The most recent version of SODA (1.4.3) now uses wind data from the Quick-Scat scatterometer, thus providing more accurate data for the tropics (Cahyarini et al., 2008; Carton and Giese, 2008). However, as SODA 1.4.3 currently extends from 2000 to 2004, a composite salinity dataset was created by combining SODA 1.4.2 and 1.4.3 to allow a more complete comparison with the modern coral record.
Results
Oxygen isotope and Sr/Ca records from modern and mid-Holocene Porites microatolls
Seasonal cycles in oxygen isotopes and Sr/Ca were evident in both the modern and mid-Holocene samples (Figures 4 and 5). Mean δ18O values were lower in the mid-Holocene coral record, with a statistically significant difference of 0.14‰ between the mid-Holocene mean and modern mean values (p = 0.006). Mean winter δ18O values were 0.06‰ lower in the mid-Holocene than the modern, but statistically similar. Mean summer δ18O values were significantly (0.19‰) lower in the mid-Holocene than the modern (p < 0.001). The annual range between mean summer and winter δ18O values was 0.14‰ greater in the mid-Holocene (p = 0.004). Flood events (δ18O < −5.5‰) are indicated within the shaded box (Figure 5c and d).
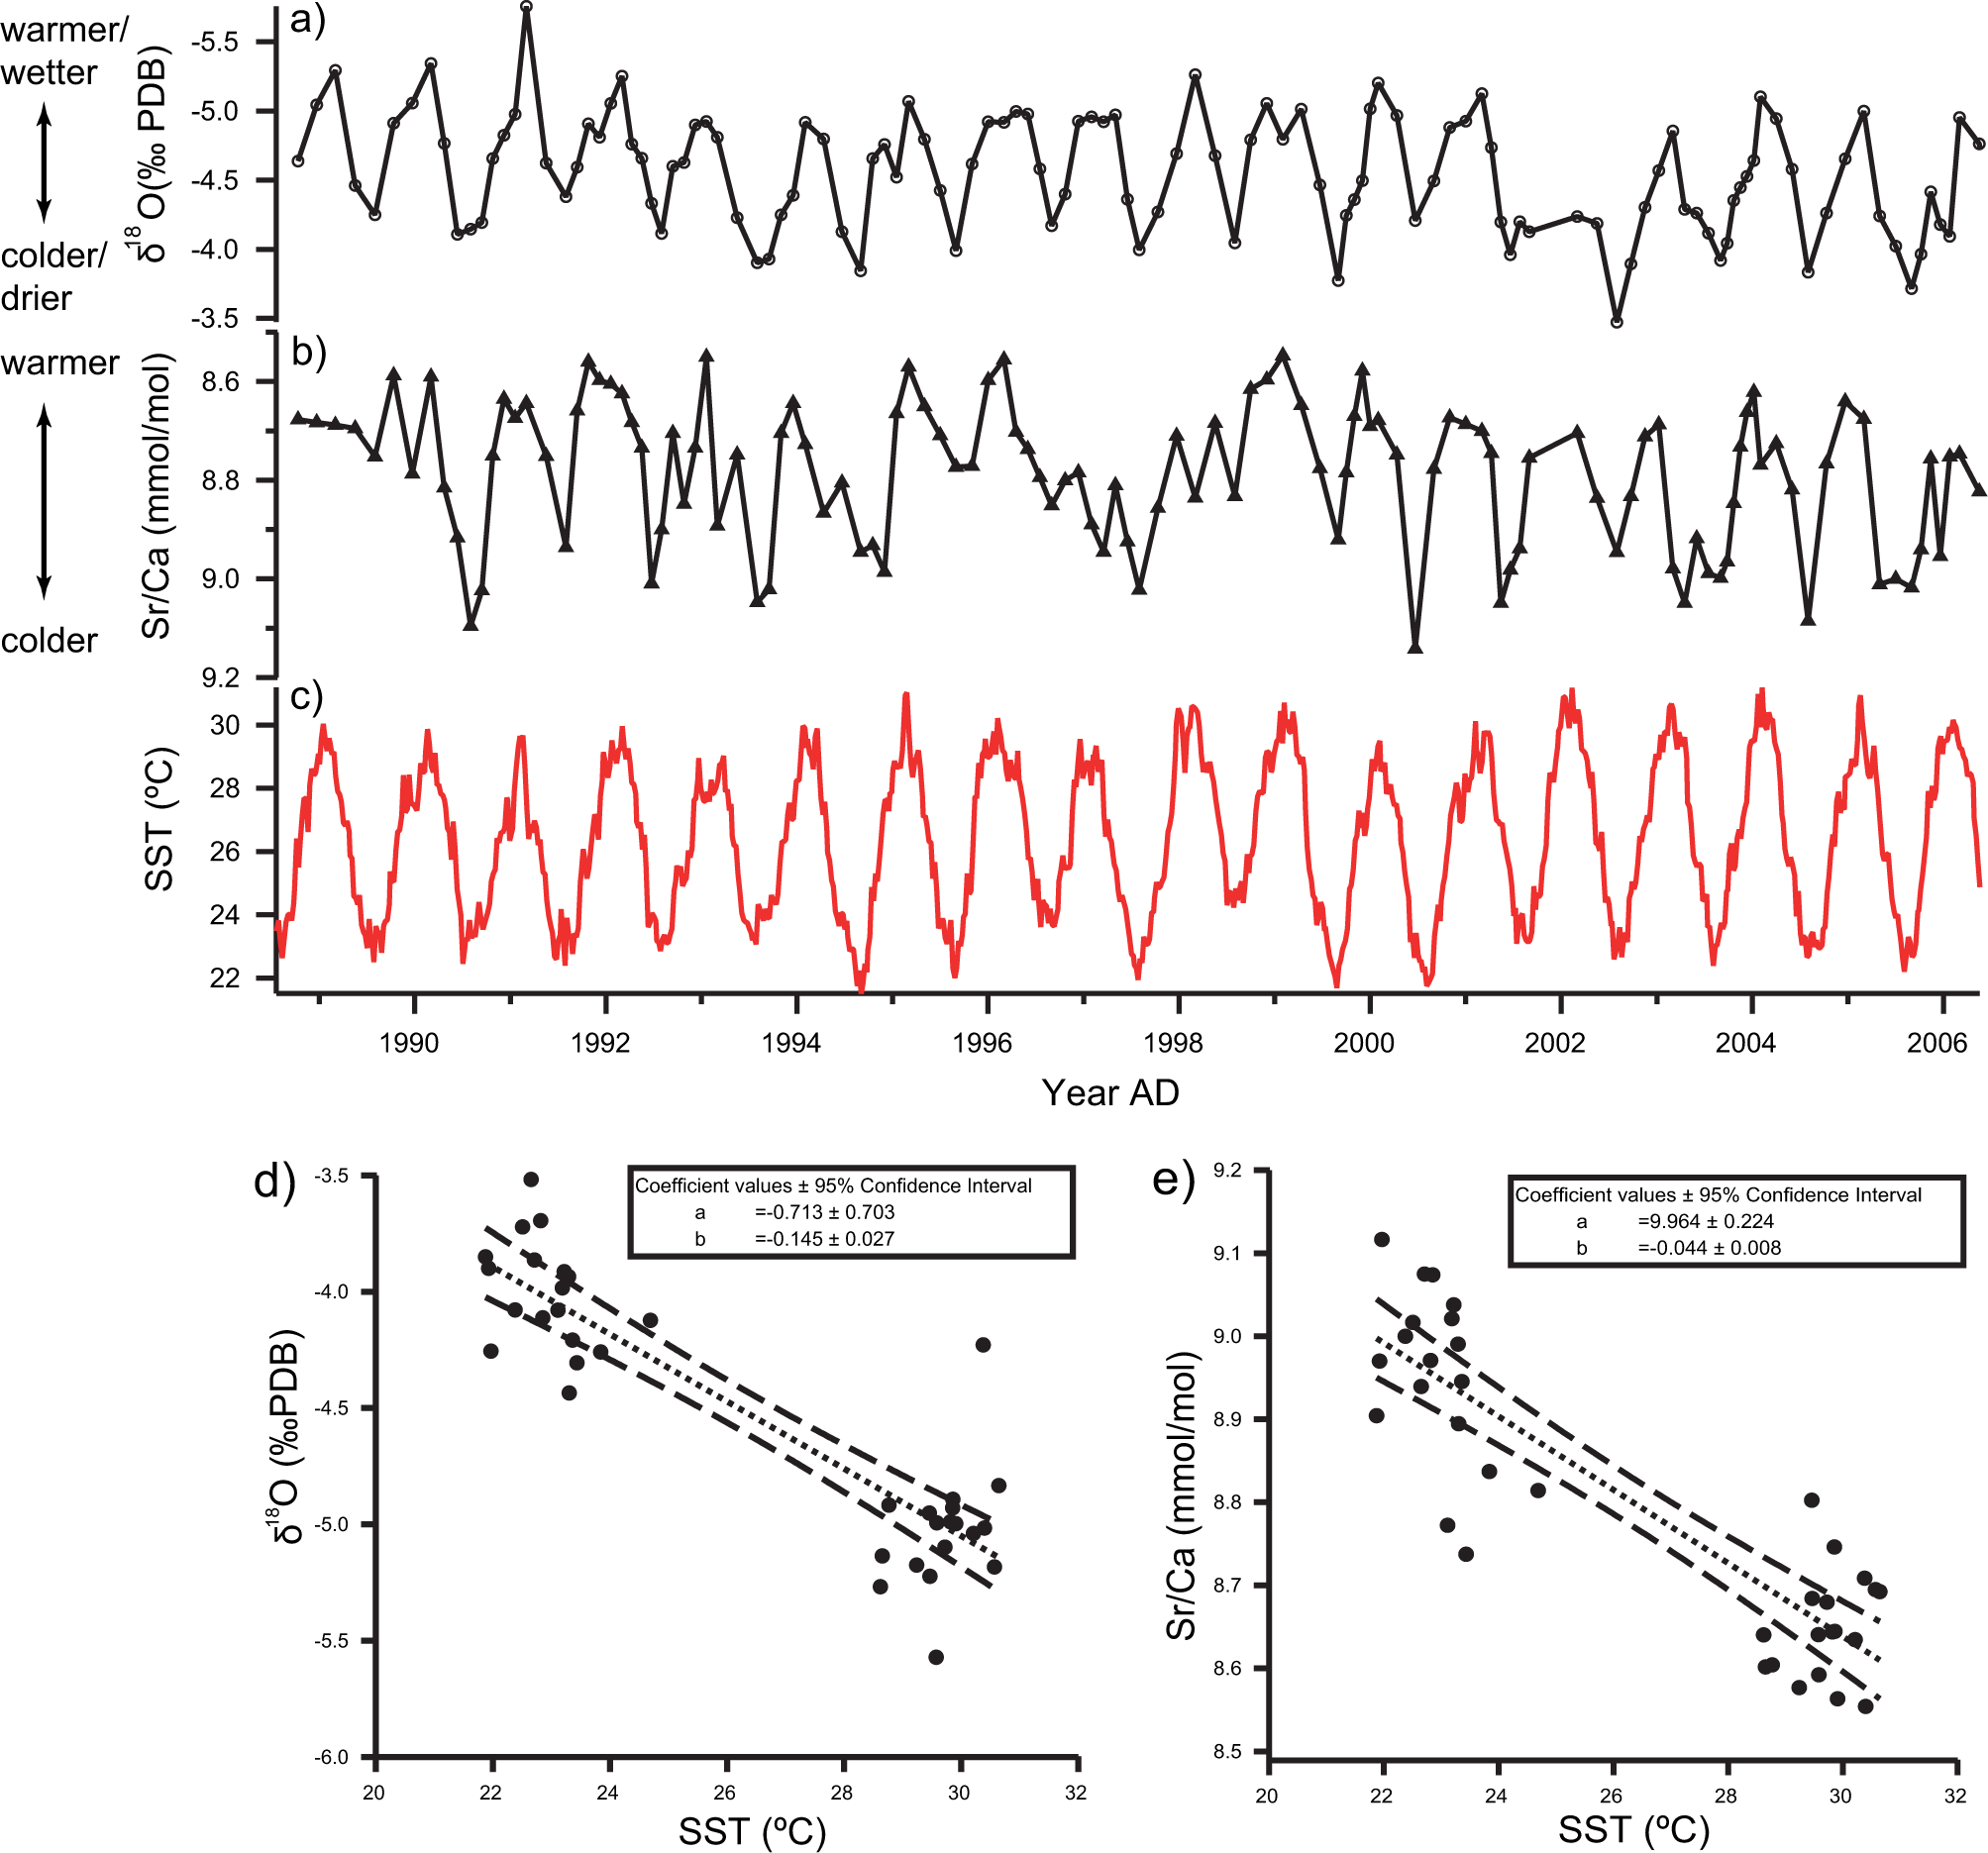
(a) δ18O time series from modern KR-MMA-1 coral microatoll. (b) Paired Sr/Ca time series from modern KR-MMA-1 coral microatoll. Datapoints shown are un-resampled values prior to interpolation for regression with instrumental values. (c) Composite instrumental SST record (Mourilyan Harbour data logger and NOAA NCEP) for 1989–2006. (d) Regression between δ18O and instrumental SST from 1989 to 2006. (e) Regression between Sr/Ca and instrumental SST from 1989 to 2006. Maximum monthly SST in summer and minimum monthly SST in winter are used for the calibration. Dashed lines indicate the 95% confidence interval of the line of best fit.
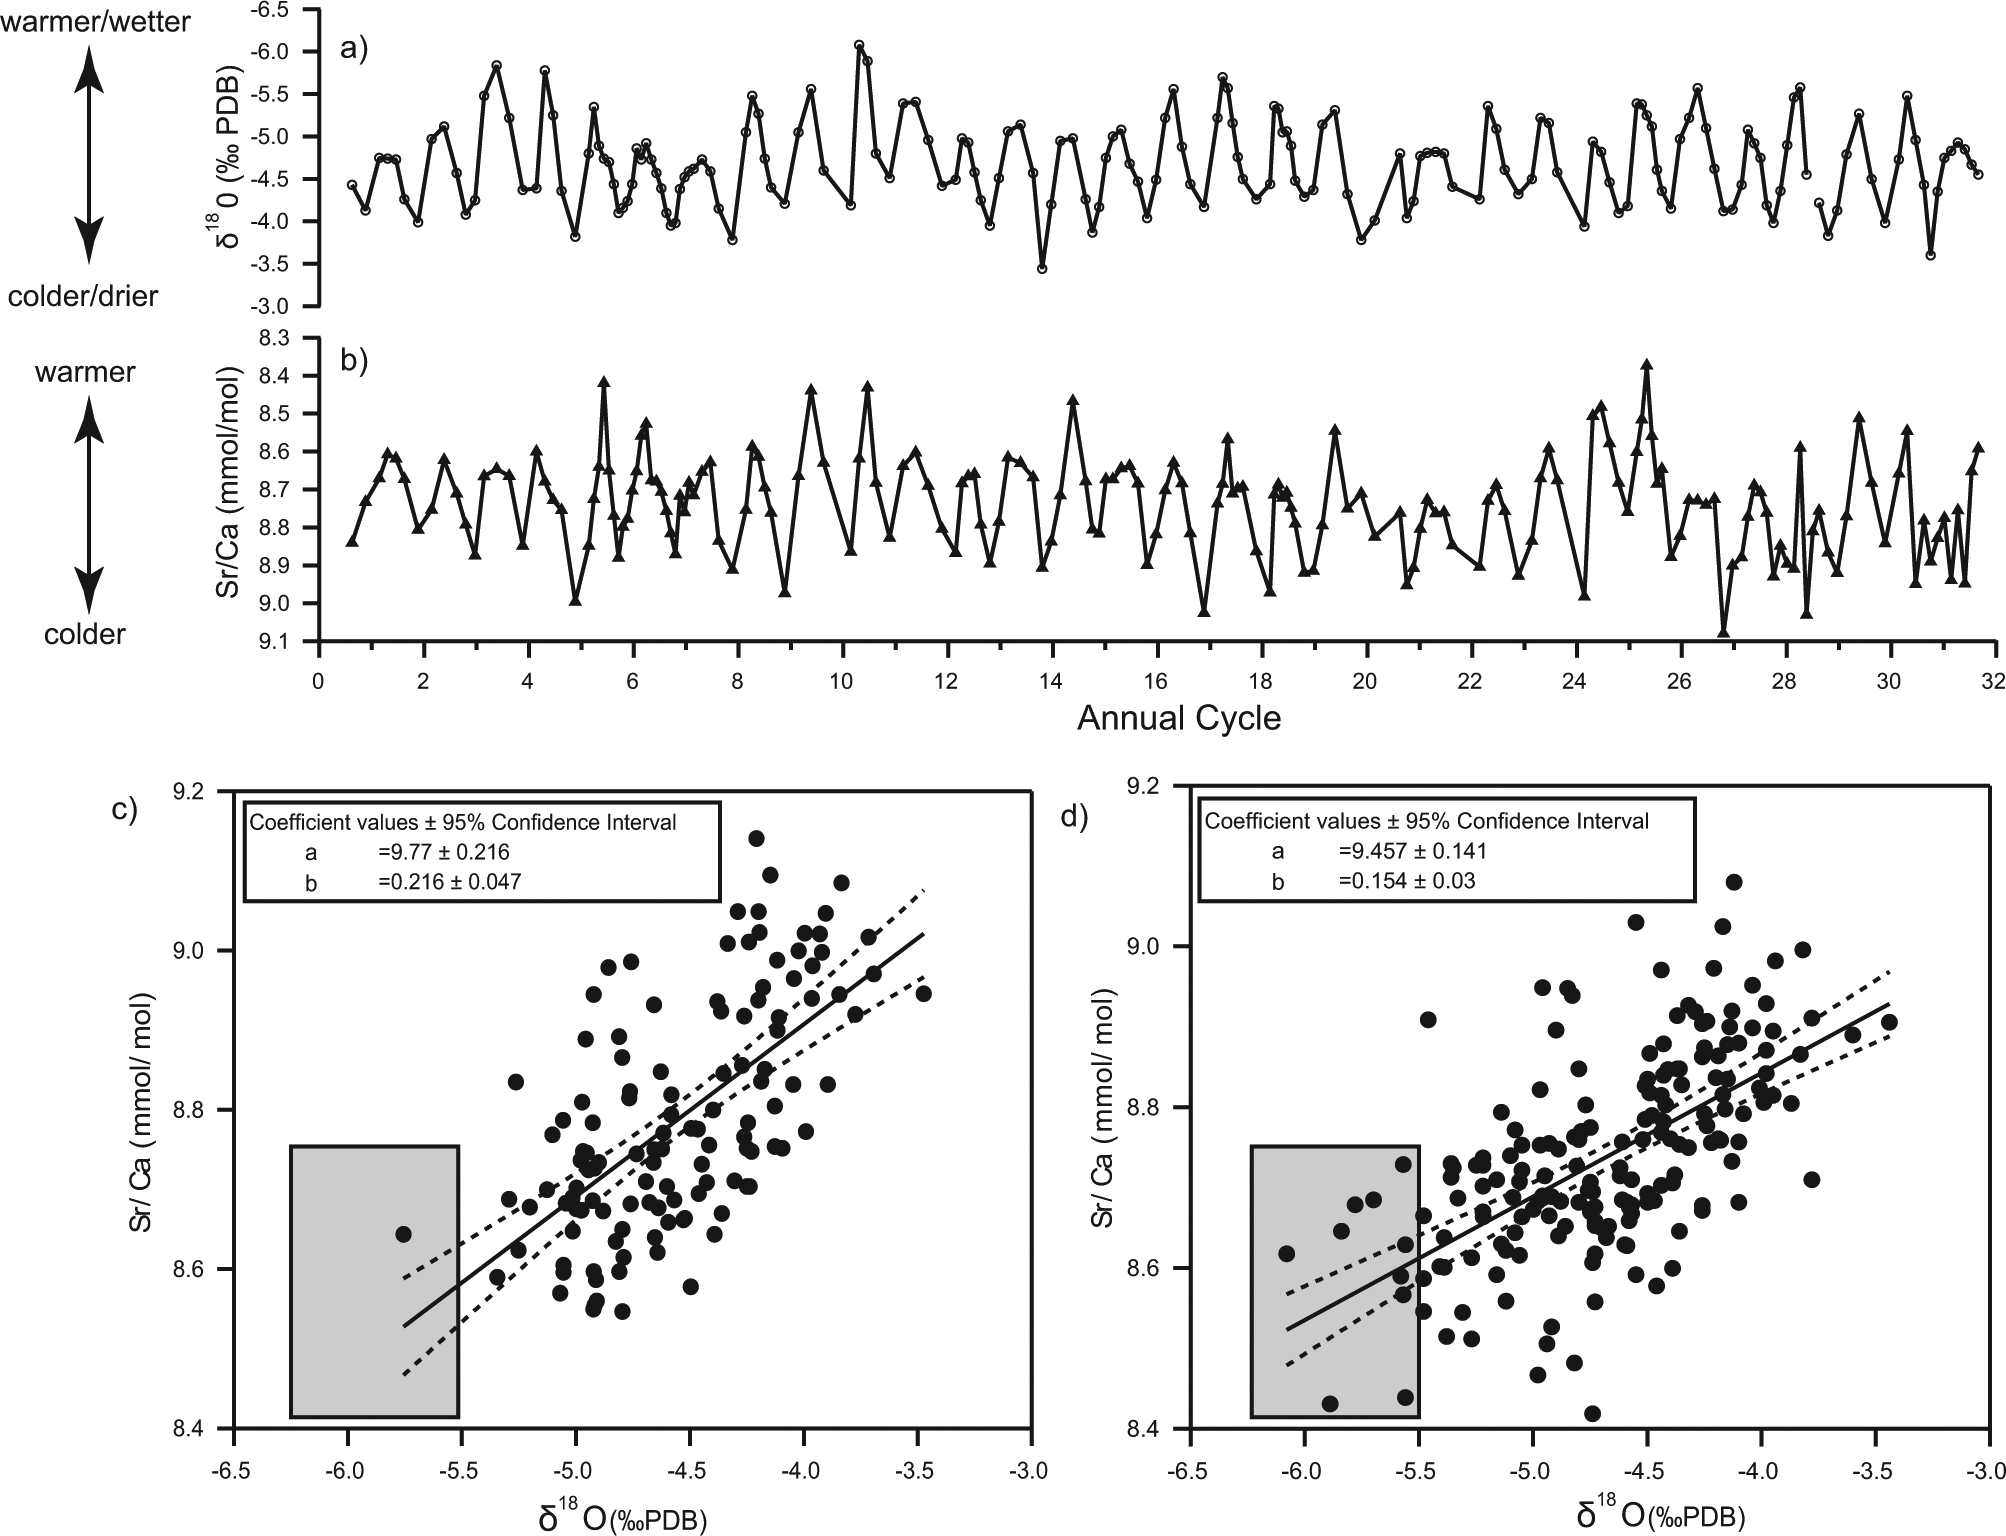
(a) δ18O time series and (b) Sr/Ca time series from KR-AMA-2 at ~ 4665 cal. yr BP. Datapoints shown are un-resampled values prior to interpolation. (c) Regression between Sr/Ca and δ18Ofor KR-MMA-1 for 1989–2006. (d) KR-AMA-2 from ~ 4665 yr BP. Gray-shaded squares illustrate the greater number of datapoints characteristic of flood events within the mid-Holocene record. Dashed lines indicate the 95% confidence interval of the line of best fit.
Mean Sr/Ca values were lower in the mid-Holocene coral record than in the modern record with a statistically significant difference of 0.06 mmol/mol between the mid-Holocene and modern mean (p < 0.001). Mean winter Sr/Ca values were 0.08 mmol/mol lower in the mid-Holocene than the modern (p < 0.001). Mean summer Sr/Ca values were 0.02 mmol/mol lower in the mid-Holocene, but statistically similar. The annual range between mean summer and winter Sr/Ca values was 0.06 mmol/mol smaller in the mid-Holocene (p = 0.009). The correlations between Sr/Ca and δ18O in the modern (n = 214, r = 0.67, p < 0.001) and the mid-Holocene microatoll (n = 314, r = 0.62, p < 0.001) were statistically similar (ANCOVA: p = 0.114; Figure 5c and d).
δ18Osw reconstructed from oxygen isotope and Sr/Ca values
A moderately strong (n = 214, r = 0.40) and statistically significant (p < 0.001) relationship was found at monthly resolution between the modern δ18Osw record and the SODA salinity data (Figure 6a). The monthly δ18Osw record was also significantly correlated (n = 214, r = 0.39, p < 0.001) with log-transformed Tully River discharge. Regular peaks indicating the influence of riverine flood events were present in both the mid-Holocene and modern δ18Osw time series (Figure 6). Overall mean δ18Osw values were statistically similar in the mid-Holocene (0.001‰) and the modern record (0.001‰). Mean winter δ18Osw values were 0.09‰ higher in the mid-Holocene record, but statistically similar. Mean summer δ18Osw values were 0.10‰ lower in the mid-Holocene record, but statistically similar (Table 1). The annual δ18Osw range was 0.18‰ greater in the mid-Holocene record than the modern record (p = 0.01).
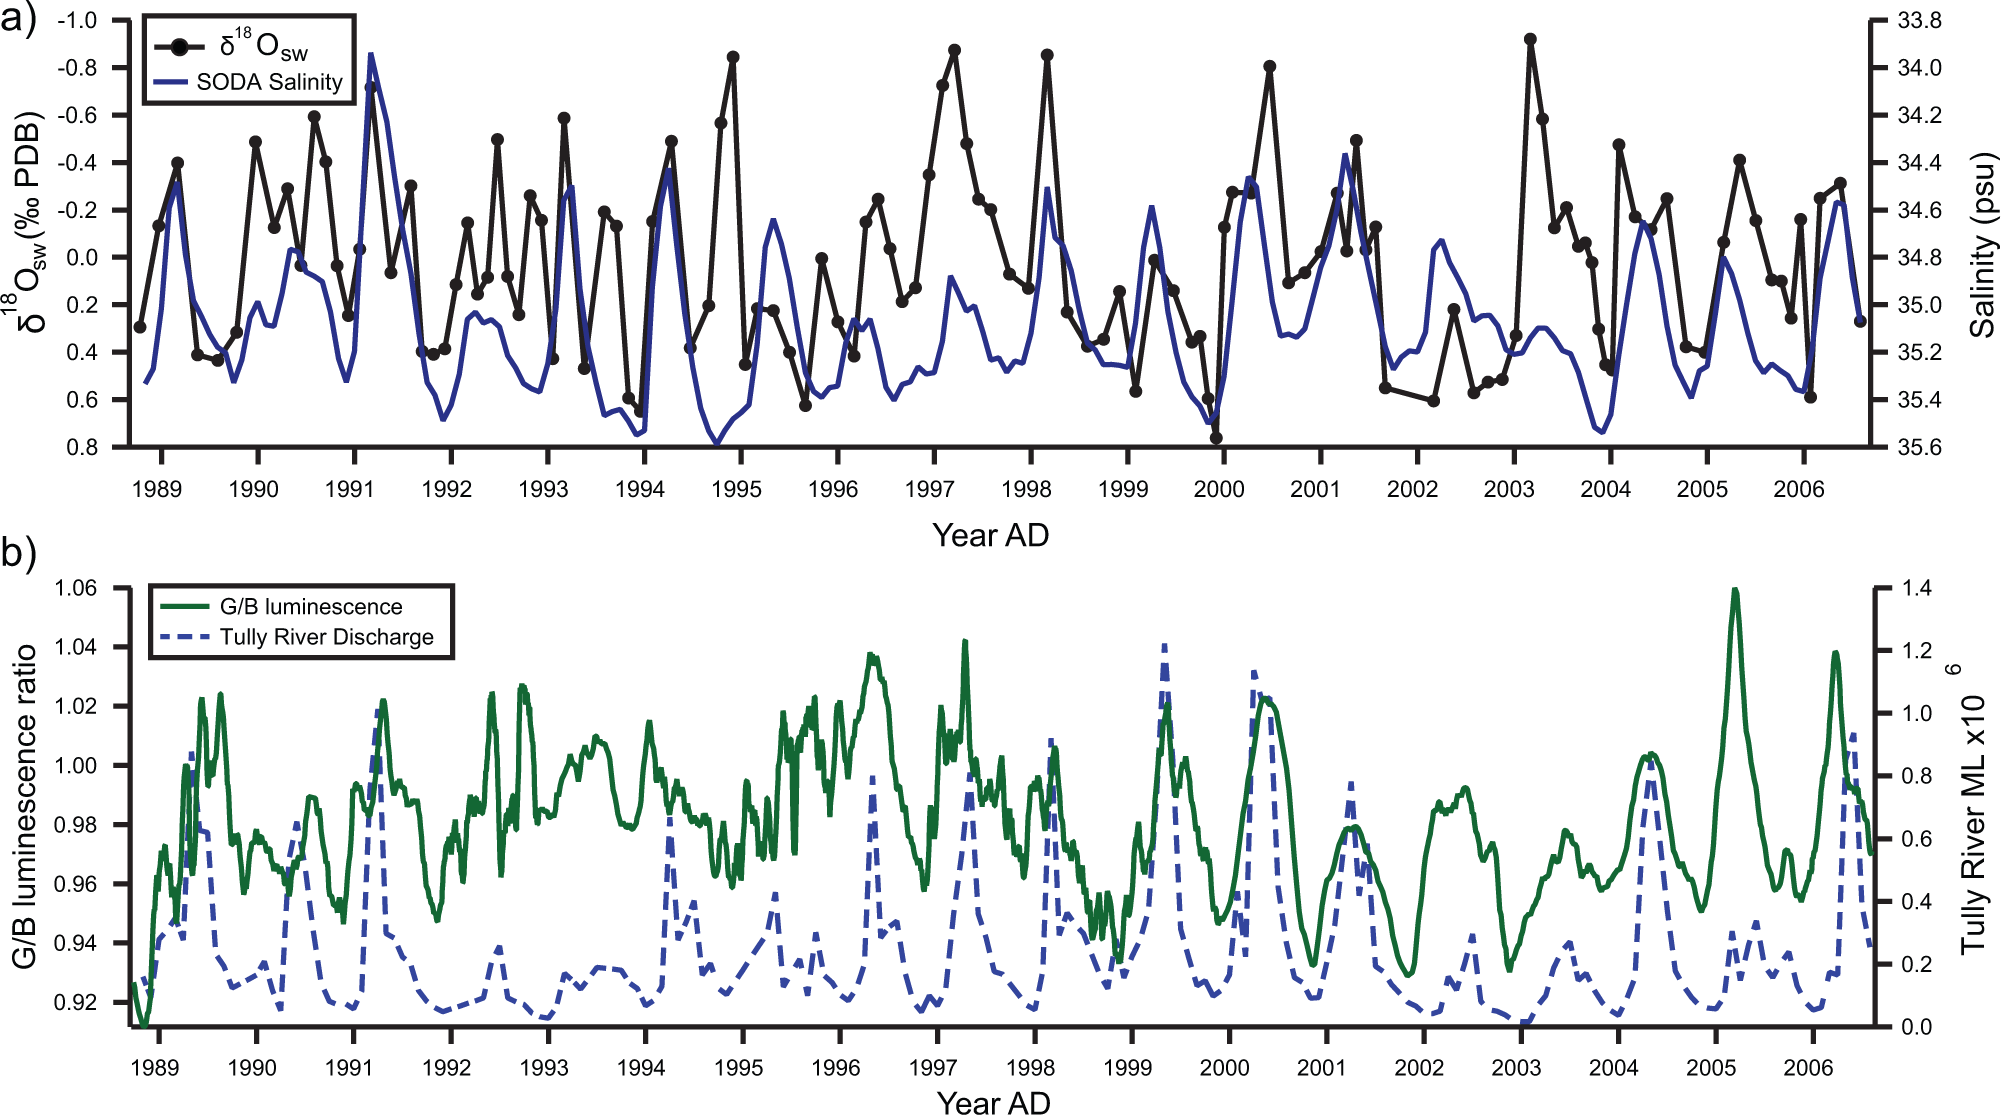
(a) δ18Osw from KR-MMA-1 and SODA salinity time series for 1989–2006. δ18Osw datapoints (solid circles) shown are un-resampled values prior to interpolation. (b) G/B luminescence from KR-MMA-1 and instrumental Tully River discharge for 1989–2006.
The monthly seasonal cycle of δ18Osw reached the most negative values in March and the most positive values in October (Figure 3a). This closely matches the seasonal salinity cycle generated from the SODA salinity dataset (Figure 3c). A regression of monthly δ18Oswand SODA salinity values (Figure 3e) found a strong relationship between decreasing δ18Osw and decreasing salinity values (n = 12, r = 0.98, p < 0.001). In the mid-Holocene seasonal cycle, monthly δ18Osw values reached their most negative during February, and the most positive values in August (Figure 3b).
Spectral luminescence (G/B) seasonal cycles
Quasi-seasonal cycles are present in both the modern and mid-Holocene G/B records (Figure 7). Overall, mean G/B ratios were significantly higher (p < 0.001) in the mid-Holocene (1.09) than the modern record (0.98). Peaks in the G/B ratio in the modern record generally occurred during high summer discharges of the Tully River, and the modern G/B record was significantly correlated with log-transformed Tully River discharge (n = 214, r = 0.39, p < 0.001; Figure 6b).
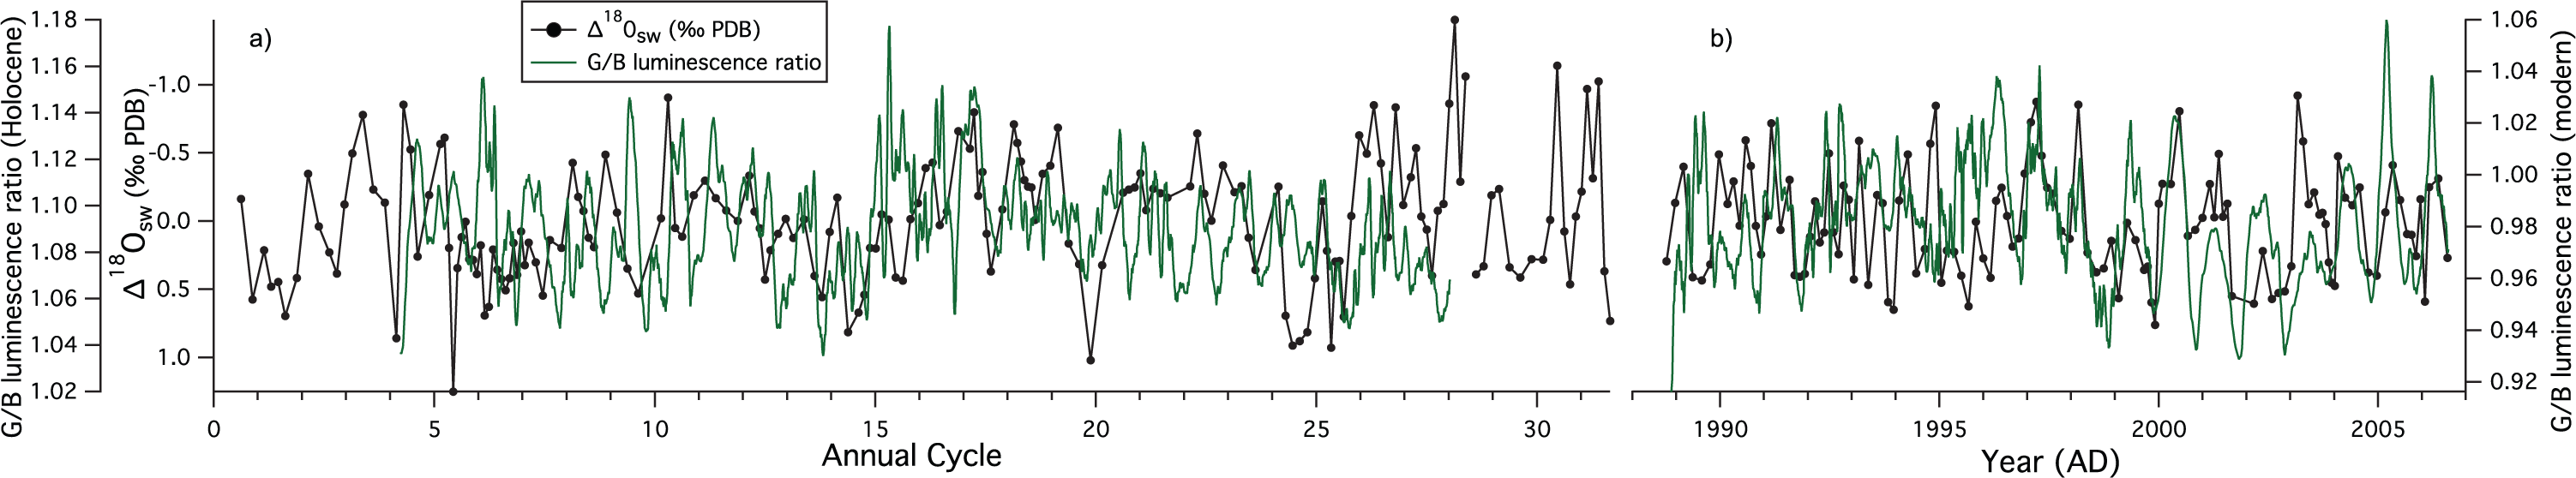
(a) δ18Osw and G/B luminescence from the mid-Holocene microatoll KR-AMA-2 at ~ 4665 cal. yr BP. (b) δ18Osw and G/B luminescence from the modern microatoll KR-MMA-1 for 1989–2006.
The modern monthly seasonal cycle of G/B reached the most positive values in March and the most negative values in October. This corresponds to the monthly seasonal cycle of Tully River discharge (Figure 3d). The relationship between monthly G/B ratios and Tully River discharge is non-linear (Figure 3f), with an exponential regression line showing a strong relationship (n = 12, r = 0.93, p < 0.001). Mid-Holocene monthly G/B ratios peaked in May and reached their most negative values in October (Figure 3d).
The relationship between modern monthly seasonal δ18Osw and G/B ratios (Figure 3g) shows that lower δ18Osw values correspond to higher G/B ratios (n = 12, r = −0.76, p = 0.005). A similar pattern is observed between monthly mid-Holocene δ18Osw and G/B ratios (Figure 3h), but the overall relationship is weaker and marginally non-significant (n = 12, r = −0.56, p = 0.06).
Discussion
Mean SST, δ18Osw, and G/B luminescence values from modern and mid-Holocene corals
There has been considerable discussion of the differences observed in Sr/Ca–SST relationships, and the potential causes of the differing equations obtained (Corrège, 2006; Gagan et al., 2000). Common factors cited are the effects of coral physiology, growth rate dependence, and regional differences (Grove et al., 2013a; Moustafa et al., 2000). Ayling et al. (2006) summarized Sr/Ca–SST and δ–SST relationships obtained from corals at a global level and found average proxy SST slope relationships of −0.166‰/°C (−0.15 to −0.20‰/°C) for δ18O and −0.065 mmol/mol (−0.0469 to −0.079 mmol/mol) for Sr/Ca.
While similar to this range of values from the Indo-Pacific region, the intercept and slope of the proxy SST equations obtained here from King Reef are lower than those found in several previous studies from the GBR (e.g. Gagan et al., 1998; Marshall and McCulloch, 2002). This difference may be because of the nearshore location of the sampled modern microatoll. The location of the most inshore record previously obtained is Pandora reef, which is ~ 20 km offshore (Gagan et al., 1994), in comparison with ~ 1 km for the modern microatoll in this study. The value may also be influenced by the microatoll growth form of the Porites colony – McGregor et al. (2011) also found a δ18O–SST slope of −0.15‰/°C from a modern microatoll obtained from the reef flat of Kiritimati Island in the central Pacific.
While some previous studies have noted a greater SST range obtained from coral proxy SST records in the mid-Holocene (Moustafa et al., 2000; Sun et al., 2005), these were based solely on δ18O records, and therefore may be affected by changes in precipitation. The King Reef microatoll Sr/Ca records in this study, influenced primarily by SST, find a significantly smaller annual Sr/Ca annual range in the mid-Holocene. Recent climate modeling and Pacific sediment core data also indicate a reduced SST seasonality resulting from an attenuated ENSO influence in the mid-Holocene (Clement et al., 1999; Koutavas et al., 2006; Luan et al., 2012).
Evidence for warmer mean SST during the mid-Holocene has been provided by a range of studies in the southwest Pacific region using coral SST proxies and other paleodata (Corrège et al., 2000; Duprey et al., 2012; Woodroffe and Gagan, 2000). The Sr/Ca dataset obtained from the mid-Holocene KR-AMA-2 microatoll in this study indicates a mean SST of 27.8°C, when all datapoints are considered (Figure 7). The closest previously obtained SST dataset both geographically and temporally is from Orpheus Island, where Gagan et al. (1998) found a similar mean SST of 27.0°C at 5350 cal. yr BP, also utilizing Sr/Ca as a temperature proxy. However, studies have shown that SSTs reconstructed using Sr/Ca are influenced by individual Porites colonies growth response to SST (Grove et al., 2013a). Therefore, mean SST should ideally be reconstructed from Sr/Ca records obtained from multiple colonies (Pfeiffer et al., 2009), and the absolute value of the mid-Holocene mean SST obtained from the King Reef microatoll should be cautiously interpreted.
Previous comparisons between mean mid-Holocene and modern δ18Osw values in the Western Pacific have found δ18Osw values to be higher in the mid-Holocene. Stott et al. (2004) combined sediment core foraminiferal oxygen isotope and Mg/Ca data from sites across the Western Tropical Pacific and found a decrease of 0.5‰ in δ18Osw values since ~ 8000 yr BP (corresponding to a decrease of 1–1.5 psu). Gagan et al. (1998) found an enrichment in δof 0.47‰ relative to modern values at ~ 5350 yr BP when comparing the 1992–1993 drought with mean mid-Holocene winter values. Comparing the same drought period within the modern microatoll δ18Osw record with the mean value at 4700 cal. yr BP for King Reef shows a 0.46‰ mid-Holocene enrichment, in agreement with Gagan et al. (1998). However, the comparison between mean δ18Osw values for the modern and mid-Holocene King Reef microatoll records finds that the two records have a similar mean value of 0.01‰. Ideally, δ18Osw values would be compared between modern and mid-Holocene drought periods where the influence of freshwater runoff is minimal; however, as drought periods cannot be unambiguously assigned to the mid-Holocene δ18Osw , mean values for the entire δ18Osw record are used in this study.
Two mechanisms have been put forward to explain higher mid-Holocene δ18Osw values observed in previous studies: Gagan et al. (1998) and Yu et al. (2005) attribute higher seawater δ18Osw to enhanced surface-ocean evaporation in response to higher SSTs during the mid-Holocene. Alternatively, Stott et al. (2004) suggest that the observed difference in mid-Holocene salinity is because of increased westward advection of high salinity waters through the WTP. The mid-Holocene microatoll record presented here indicates that higher SSTs may have influenced King Reef, but does not show a large associated increase in δ18Osw values. This suggests that the advection of high-salinity water masses resulting in higher δ18Osw values at oceanic Western Pacific sites during the mid-Holocene did not extend to nearshore coastal areas of the GBR.
Elevated G/B levels in the mid-Holocene record indicate that higher levels of humic acids were present in the waters around King Reef at ~ 4665 yr BP. This supports the δ18Osw data, suggesting that conditions were wetter during the mid-Holocene compared with modern conditions (Grove et al., 2012). Flood events, evident as negative δ18Osw peaks, would have resulted in higher coastal humic acid concentrations during this period. However, it should also be noted that humic acid inputs during the mid-Holocene may also have been higher because of the greater extent of catchment forestation, riparian vegetation, and coastal mangroves, prior to European settlement and the introduction of modern methods of agriculture (Grove et al., 2012). The total difference between mid-Holocene and modern day G/B baselines is therefore likely a combination of (1) increased rainfall associated with a strong AISM and (2) higher vegetation cover. A modern record of G/B luminescence from the GBR has recently been linked with the Pacific Decadal Oscillation, which indicates that the G/B signal in the mid-Holocene coral was also likely influenced by the activity of large-scale climatic phenomena during this time (Rodriguez-Ramirez et al., 2014).
Seasonal cycles of salinity and riverine runoff proxies
Clear seasonal cycles were observed in Sr/Ca and δ18O from the modern microatoll record, which were closely related to the seasonal instrumental SST record. A similar pattern of seasonal cycles in Sr/Ca and δ18O was displayed within the mid-Holocene microatoll record. However, the records differed in two major aspects: (1) both the Sr/Ca and δ18O values were significantly lower in the mid-Holocene record, which may indicate warmer (Sr/Ca), and warmer/wetter conditions (δ18O) and (2) a difference was observed in the annual ranges present in the Sr/Ca and δ18O records, whereby the δ18O range was significantly larger in the mid-Holocene, while the Sr/Ca range was significantly smaller, indicating that δ18O is likely driven not only by temperature but also by the influence of runoff in the mid-Holocene record.
The seasonal cycle of δ18Osw had a greater range during the mid-Holocene. The most negative δ18Osw value, corresponding to lower salinities, was reached earlier in the seasonal cycle during the mid-Holocene, and δ18Osw values begin to decrease earlier in the seasonal cycle. This shift in the seasonal δ18Osw cycle may be related to changes in the seasonal cycle of insolation during the mid-Holocene. Peak seasonal insolation values were higher during the mid-Holocene, and this peak was reached earlier in the seasonal cycle. These characteristics of the seasonal insolation cycle are likely to have influenced precipitation patterns over north-eastern Australia and fueled strong AISM activity during the mid-Holocene.
G/B luminescence ratio values reach their peak values later in the seasonal cycle during the mid-Holocene, than in the modern record, and remain at high levels for longer. This is consistent with higher levels of vegetation within river catchments and floodwaters remaining in contact with humic acid rich vegetation for longer during the mid-Holocene.
Assuming that the δ18O–Sr/Ca vital effect relationship remained constant between mid-Holocene and modern day corals, δ18Osw data provide a robust method to assess hydrological differences between different epochs. The seasonal patterns observed in δ18Osw show that during the summer monsoon rainfall season, the oxygen isotopic composition of seawater at King Reef reached negative values, as SSS decreased. This indicates that the seasonal variation in δ18Osw at King Reef is influenced by the influx of freshwater from river runoff and the depleted oxygen values from direct rainfall.
The strength of the relationship observed between the modern microatoll δ18Osw and the SODA salinity dataset is similar to previous values obtained from studies using Porites corals in the tropical Pacific. Cahyarini et al. (2008) found a correlation of r = 0.33 between reconstructed SSS and SODA salinity data at Tahiti, and r = 0.5 from Timor, while Kilbourne et al. (2004) examined the relationship between δ18Osw and monthly gridded ship-of-opportunity salinity data at Vanuatu over a 16-year period and found a correlation of r = 0.47.
Ideally, the SSS–δ18Osw relationship should be established on a local/regional basis because of variation in the isotopic composition of rainfall and river water (Corrège, 2006). Published values of the slope of the SSS–δ18Osw relationship obtained in the tropical Pacific Ocean vary between 0.27 and 0.45 psu (Fairbanks et al., 1997; Morimoto et al., 2002). As an estimate of salinity values, the equation generated by Morimoto et al. (2002) from Palau, when applied to the data in this study, yielded a mean value of 34.7 psu for both modern and mid-Holocene δ18Osw records. This value corresponds well with the 35.1 psu mean value from the SODA salinity dataset, given that salinities are likely to be lower in the nearshore area of King Reef, and the satellite data average a square grid of 0.5° × 0.5°. The annual salinity range of 2.1 psu obtained by applying the Morimoto et al. (2002) equation to the modern δ18Osw is higher than the annual salinity range of 1.67 psu indicated by the SODA dataset. The Holocene δ18Osw record indicates an annual salinity range of 2.4 psu, suggesting that the annual salinity range was significantly greater in the nearshore GBR at ~ 4700 cal. yr BP.
The King Reef microatoll record, indicating strong riverine influence on the GBR during the mid-Holocene, is consistent with tropical northern Australian terrestrial pollen records that indicate that generally wetter conditions prevailed in the mid-Holocene (Shulmeister and Lees, 1995). Sedimentary paleoprecipitation records also provide evidence for wetter climatic conditions during the mid-Holocene in the region of tropical northern Australia (Nott and Price, 1994). Stalagmites from northern Borneo using δ18O values as a proxy of AISM strength suggest that AISM activity during the Holocene peaked at ~ 5000 yr BP (Partin et al., 2007), while similar records from Flores show a δ18O pattern suggestive of a regional perturbation in ocean-atmosphere circulation patterns between ~ 6000 and ~ 4000 yr BP (Griffiths et al., 2010). In contrast, an oceanic sediment core from south of Java shows AISM activity and precipitation peaking in the late Holocene, with comparatively drier mid-Holocene conditions (Mohtadi et al., 2011). The King Reef microatoll record presented here from a more southerly sector of AISM influence suggests that continental runoff and associated precipitation were high at ~ 4700 yr BP and may reflect a southerly displacement of the Inter-Tropical Convergence Zone (ITCZ) during this period of the mid-Holocene (Griffiths et al., 2010).
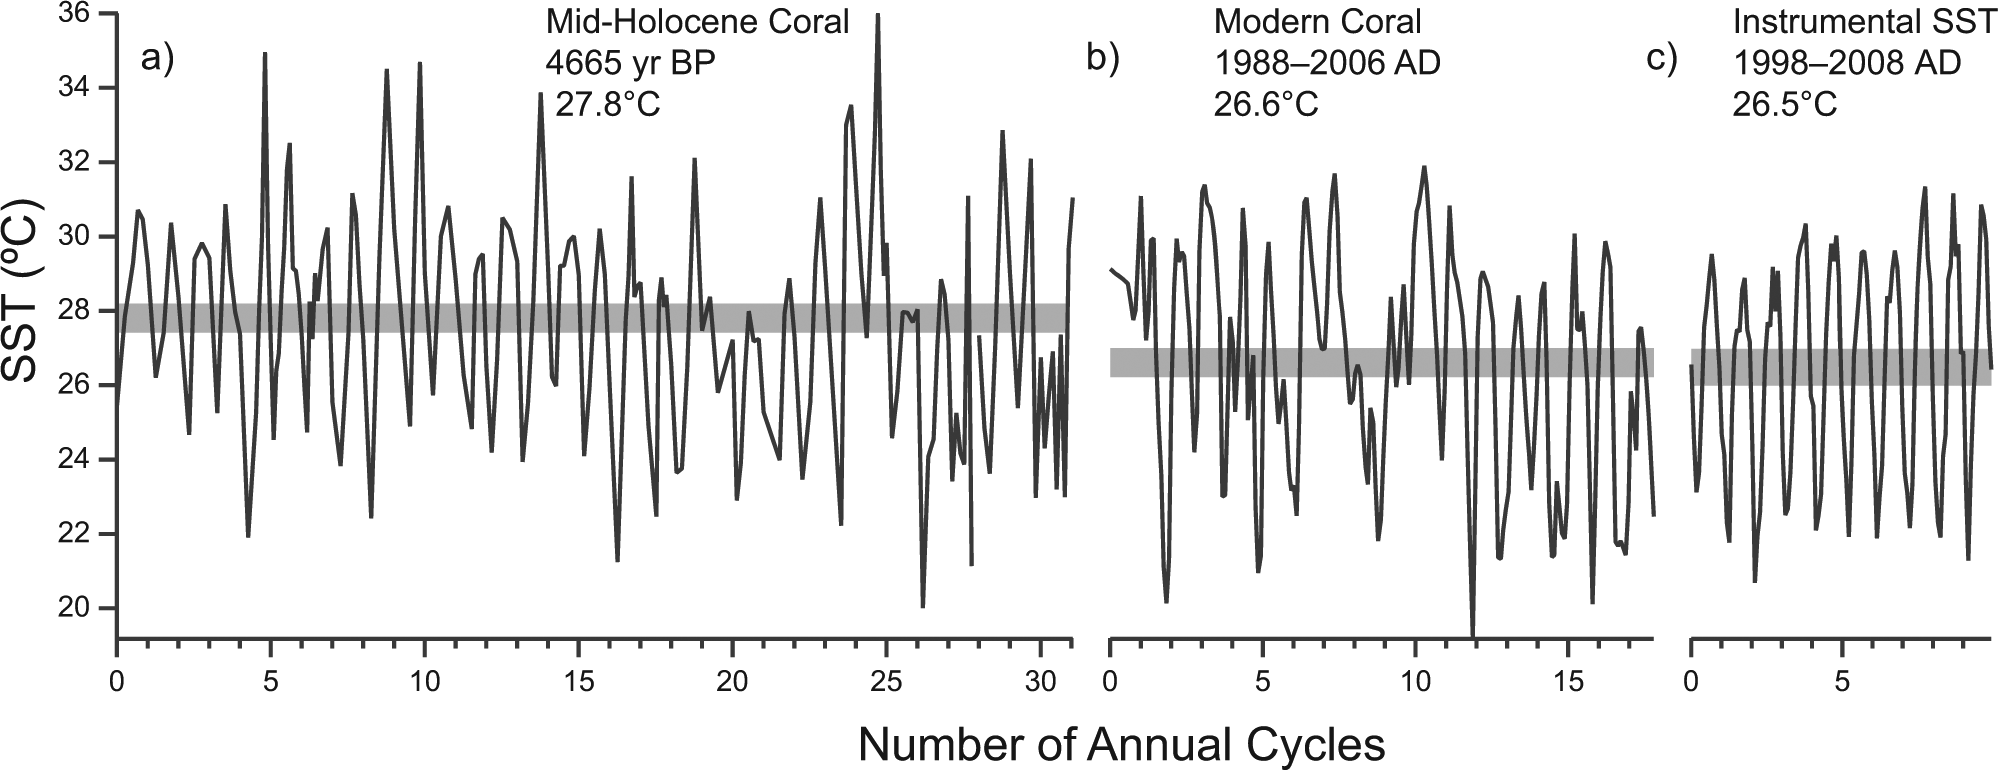
Temperature records from (a) mid-Holocene Sr/Ca derived record from KR-AMA-2, (b) modern microatoll KR-MMA-1 Sr/Ca record, and (c) instrumental data obtained from Mourilyan Harbour in situ data logger (http://www.aims.gov.au). Temperature values given are the mean of each dataset, with gray shading indicating the 95% confidence interval of the mean.
While the King Reef mid-Holocene microatoll record does not cover a sufficient temporal range to identify the timing of peak Holocene AISM activity at the site, it provides a high-resolution record from a period of change in the regional climate system and suggests that during the mid-Holocene, nearshore GBR reefs experienced strong flood events and a greater annual range of salinities than at present. This is important in the context of contemporary anthropogenically driven climate change, which may alter the strength of the AISM and associated precipitation patterns.
Summary
A greater annual salinity range, indicated by δ18Osw, influenced the nearshore GBR during the mid-Holocene. However, no difference in mean δ18Osw values was found between the two time periods, suggesting that the mechanisms responsible for previous findings of higher Western Pacific salinities during the mid-Holocene did not extend to the nearshore GBR. The influence of flood events in the mid-Holocene at ~ 4700 yr BP is supported by the enhanced G/B luminescence signal recorded in the mid-Holocene microatoll. The seasonal cycle of G/B luminescence observed may also reflect changes in vegetation cover within river catchments between the two time periods. The annual SST range influencing the nearshore GBR is likely to have been reduced relative to present during the mid-Holocene. Difficulties remain in the reconstruction of absolute paleo-SST from fossil corals; however, mean SSTs are likely to have been similar to or slightly higher than present at this nearshore GBR site during the mid-Holocene. Together, these findings support an active AISM monsoon system at ~ 4700 yr BP and highlight the range of conditions which nearshore GBR sites have been exposed to during the Holocene.
Footnotes
Acknowledgements
Ronan Roche would like to acknowledge the assistance from the MMU Postgraduate Development Award, and PADI International. Thanks to Jasper Wassenburg for assistance with fieldwork.
Funding
This work was financed by Natural Environmental Research Council Isotope Geosciences Allocation (IP-1122-0509) to RCR and CTP, and Natural Environment Research Council Grant (NE/F01077X/1) to CTP and SGS helped to fund this research.
References
Supplementary Material
Please find the following supplemental material available below.
For Open Access articles published under a Creative Commons License, all supplemental material carries the same license as the article it is associated with.
For non-Open Access articles published, all supplemental material carries a non-exclusive license, and permission requests for re-use of supplemental material or any part of supplemental material shall be sent directly to the copyright owner as specified in the copyright notice associated with the article.