
Abstract
The methodology currently used to measure poverty in the European Union faces some important limitations. Capturing key aspects of poverty is done using a dashboard of indicators, which often tell conflicting stories. We propose a new income-based measure of poverty for Europe that captures in a consistent way in a single indicator the level of relative poverty, the intensity of poverty, poverty with a threshold anchored in time and a pan-European perspective on poverty. To do so, we work with a recently developed poverty index, the extended headcount ratio (EHC) and derive the relevant poverty lines to apply the index to poverty in Europe. We show empirically that our measure consistently captures the aspects typically monitored using a variety of indicators and yields rankings that seem more aligned with intuitions than those obtained by these individual indicators. According to our measure, Eastern Europe has a much higher level of poverty than Southern Europe, which, in turn, has a considerably higher level of poverty than North-Western Europe. In North-Western Europe, the evolution of our measure over time correlates most strongly with the at-risk-of-poverty rate, while in Southern and Eastern Europe, it correlates most strongly with at-risk-of-poverty with the threshold anchored in time.
Keywords
Introduction
Not only do economic crises lead to increases in poverty, they also, at least in the European Union (EU), often result in new debates about how to monitor poverty. These recurring debates are primarily the result of the difficulty of coming up with a comparable poverty measure when living conditions differ strongly across countries (e.g. Beblavy and Mizsei, 2006; Fahey, 2007; Whelan and Maître, 2010a) or change very quickly over time (e.g. Whelan and Maître, 2010b). The solution adopted by the EU is to use a dashboard of social indicators to monitor poverty (Atkinson et al., 2002; Marlier et al., 2007), which usefully captures various perspectives. This allows for a nuanced view on reality but has as a downside that indicators are not always in agreement with each other about patterns across countries and trends within countries over time (see below). Furthermore, the list of indicators on which to keep an eye is fairly large. While it is obvious that a dashboard of indicators that complement each other is needed for monitoring social trends adequately, there is at the same time a clear demand from both policymakers and poverty researchers for a single headline indicator to keep track of the general trend in poverty. This can be illustrated by the Europe 2020 poverty reduction target and the social scoreboard indicators for the European Pillar of Social Rights, 1 as well as a large number of poverty studies that focus on just one or a few poverty indicators (e.g. Leventi et al., 2018; Vandelannoote and Verbist, 2020). Therefore, in this article, we propose a new indicator of poverty, which in spirit and design stays close to existing income-based indicators of poverty used by the EU and many poverty researchers, but which captures the situation in a consistent way in a single number, for which otherwise at least four other dashboard indicators are required. We show its added value compared to current indicators by analysing poverty trends between 2007 and 2017.
In the EU, poverty is defined as ‘individuals or families whose resources are so small as to exclude them from the minimum acceptable way of life of the member state in which they live’ (Council of the European Communities, 1975). This definition is relatively well accepted within Europe, with rather little conceptual discussion (but see, for instance, Lister, 2021). The measurement of poverty is a different matter entirely, though, with long-standing academic and political debates. For quite a while, the so-called at-risk-of-poverty indicator (AROP60) has been the main tool to measure poverty in the EU, although with some variations in its implementation (Atkinson et al., 2002; Eurostat, 1990, 2010). It was also a key component of the Europe 2020 poverty reduction target as defined by the at-risk-of-poverty or social exclusion indicator (AROPE). The key characteristic of AROP60 is that the level of the poverty threshold is defined as a percentage of the median income in the country in which one lives, and those with an income below the threshold are considered at-risk-of-poverty. Its main strengths are the relative ease with which it can be implemented in a large number of countries, with a relatively straightforward interpretation as the ‘low-income proportion’.
The principal criticism which the indicator has received refers to its use as an indicator of poverty as defined above (see Jenkins, 2020). For instance, according to the indicator, poverty seems to evolve in counterintuitive ways during periods of strong economic growth – indicating increased poverty levels while the purchasing power of the poor is growing (e.g. in Ireland) (Whelan and Maître, 2010b), as well as during periods of rapid economic decline, when the indicator suggests falling or barely increasing poverty rates, even if the living conditions of the poor have deteriorated in many respects (see, for instance, Finland in the early 1990s Halleröd et al., 1999) and Southern Europe in the wake of the previous financial crisis (e.g. Cutillo et al., 2020; Matsaganis and Leventi, 2014). Furthermore, the indicator seems to overlook vast cross-country differences in living standards that are relevant for understanding poverty: some of the poorer EU member states appear to have relatively low poverty rates compared to others, although those at the bottom of the income distribution clearly have a much lower purchasing power (e.g. since 2007 Hungary has had a consistently lower poverty rate than Germany, although disposable incomes in the bottom half of the distribution have consistently been considerably higher in Germany compared to Hungary in terms of purchasing power). As a result, the at-risk-of-poverty threshold has been criticised for not representing very well the minimum acceptable living standard across countries (e.g. Goedemé et al., 2019), and especially for being too low in the poorest EU Member States, as well as for being relativistic, dismissing too quickly that it is also relevant to directly compare living standards of European citizens at the bottom of the distribution across countries (Brandolini, 2007; Fahey, 2007). To some extent, these shortcomings are covered by the material deprivation (MD) indicator (now being replaced by the material and social deprivation (MSD) indicator) which captures differences in living conditions and complements the relative poverty indicators in the EU portfolio of social indicators (Guio et al., 2016). However, many if not most social policies fight or prevent poverty by increasing or redistributing incomes. An income-based measure offers obvious strong advantages for both ex-post and ex-ante policy evaluations (e.g. through microsimulation).
Therefore, building on Decerf et al. (2021), we propose a new income measure of poverty: the extended headcount ratio (EHC). 2 In our view, the indicator that we propose overcomes the aforementioned criticisms in a coherent way, while staying as close as possible to the indicators that are currently used in the EU to monitor poverty. Furthermore, our indicator helps to grasp a number of intuitions about poverty that are currently captured by looking at four indicators separately: (1) The understanding that one’s risk of being poor is affected by the relative level of income one has – currently captured by the at-risk-of-poverty indicator. (2) The notion that the level of the poverty threshold in real terms is essential contextual information for comparing one country to the next – currently captured by expressing the at-risk-of-poverty threshold in purchasing power standards (PPS) (an international currency which allows the amount of goods and services that can be bought at the level of the threshold to be directly compared). (3) The notion that when the median income increases or falls relatively quickly, it is relevant to assess poverty with the same poverty threshold – in constant prices – for several years in a row – currently captured by the ‘at-risk-of-poverty indicator with the poverty threshold anchored at a fixed moment in time’. (4) The notion that the severity of poverty matters: having an income further below the poverty line is a worse condition compared to having an income closer to the poverty line – currently monitored by the median at-risk-of-poverty gap. Furthermore, the indicator we propose ties in with Atkinson et al.’s (2017) suggestion that the EU should include indicators of extreme poverty and real income growth at the bottom of the income distribution, which the European Commission is currently investigating with regard to the development of an ‘absolute’ poverty indicator (Menyhért et al., 2021). To do so, our indicator includes a threshold that is the same for all EU citizens, which also responds to the need to include a pan-European perspective on poverty, as has been voiced by some authors for sociological, political and policy reasons (e.g. Brandolini, 2007; Brandolini and Rosolia, 2019; Fahey, 2007).
Other than making adjustments for accommodating these concerns, we keep most of the features of our indicator in line with the AROP60 indicator, for example, in terms of working with disposable income, and the assumptions regarding household economies of scale. A key difference with the AROP60 indicator is that it combines information on the poverty status of individuals based on two poverty thresholds, a (low) fixed threshold (constant in real terms across space and time) and a floating threshold (defined as a percentage of median income in each country and year, equal to the 60% at-risk-of-poverty threshold). The EHC integrates this information in a consistent way. It equals the percentage of the population below the fixed threshold plus a weighted percentage of the population with an income above the fixed, but below the floating threshold, with the weight being determined by how far that group is below the floating threshold.
Using EU-SILC data, we show that poverty according to our measure is much more concentrated in Eastern Europe than according to alternative measures (AROP60 and AROPE). Furthermore, we find that for the period 2007–2017 our poverty measure decreased for the EU as a whole, while AROP60 and AROPE remained stable. Different regions of the EU experienced different evolutions, though. Our measure barely changed for Western EU countries, increased by about 22% for Southern EU countries and decreased by about 45% for Eastern EU countries. These differences are much larger than those found by alternative measures (AROP60 and AROPE) because, unlike these alternative measures, our measure takes account of the intensity of poverty.
Our article is structured as follows. First, we explain the main characteristics of the poverty measure we propose. Subsequently, we explain how we derive the poverty thresholds as well as the data that we use to test the new indicator. Next, we illustrate the indicator by first discussing the distribution of poverty in the EU, and subsequently looking at trends. We pay particular attention to poverty trends in Poland and Greece, as these countries show the most striking patterns. We conclude with a summary of our findings, the limitations of our study and a discussion of ways forward to further improve the practical implementation of the indicator.
The new indicator: the structure of the poverty index
We first explain the definition of the two poverty lines and how they could be used for computing a ‘standard’ headcount ratio. Subsequently we explain the index which aggregates poverty into the extended headcount ratio.
The two poverty lines and a ‘standard’ headcount ratio
With the extended headcount ratio, the poverty status depends on two poverty lines. The fixed threshold zf reflects a very restricted budget of minimum necessities. This threshold is kept constant across time and space, except for adjustments with regard to national price level differences and changes in prices. The floating threshold is equal to the at-risk-of-poverty threshold used in AROP60. More formally, let an income distribution y: = (y1, . . ., yn) be a list of non-negative equivalised disposable incomes sorted in non-decreasing order y1 ≤ · · · ≤ yn. Let median income (denoted by
Individual i is considered to be in severe poverty if
The headcount ratio, denoted by HC(y), measures the fraction of individuals who are poor. HCF(y) measures the fraction of individuals who are severely poor and HCR(y) the fraction of individuals who are exclusively at-risk-of-poverty (who are poor but not in severe poverty).
3
By definition, if
The extended headcount ratio
The index defining our poverty measure is the extended headcount ratio (Decerf et al., 2021). The difference with the ‘standard’ headcount ratio is that the extended headcount ratio is not a clear headcount as it gives a higher weight to income shortfalls below the fixed threshold as compared to income shortfalls below the floating threshold. Formally, the extended headcount ratio (EHC) can be defined as
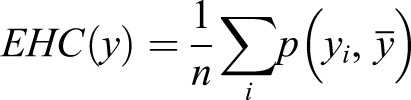
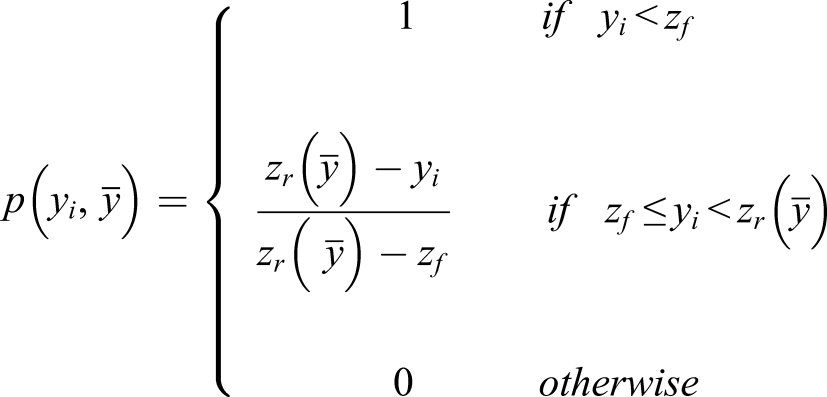
Thus, individuals with an income below the fixed threshold contribute 1 to the index, and individuals exclusively at-risk-of-poverty contribute in proportion to the distance between their income and the two poverty thresholds. If their income is close to the fixed threshold
There is a straightforward relation between the extended headcount ratio and the ‘standard’ headcount ratio. When the floating threshold is higher than the fixed threshold, the extended headcount ratio can be decomposed as follows

In a nutshell, we call poor the individuals whose income is below any of the two poverty thresholds. We call severely poor the individuals whose income is below the rather frugal fixed threshold. The indicator is equal to the fraction of severely poor individuals in the population plus the fraction of individuals who are poor but not severely poor, multiplied by an endogenous weight between zero and one. Thus, the extended headcount ratio can also be interpreted as the equivalent fraction of severely poor individuals.
The new indicator: implementation in the EU
Data
We use the EU-SILC data to assess poverty in the EU between 2007 and 2017. EU-SILC consists of a random sample of private households in all EU Member States and is the EU reference source for information on income and living conditions in the EU. In most countries, the income reference year is the calendar year before the year of interview, except for Ireland and the United Kingdom. Therefore, we use data from the 2008 wave (with incomes of 2007) up to SILC 2018 (incomes of 2017), except for Ireland and the United Kingdom, where we use waves 2007 up to 2017. 5 In all tables and figures, years refer to the income reference year, so the latest year shown is 2017.
We use equivalent disposable household income as our income measure. This equals the sum of all after-transfer incomes of all household members, net of taxes and social contributions, divided by the modified-OECD equivalence scale of the household. We use ‘income’ and ‘equivalent disposable household income’ interchangeably. These incomes are top-coded at the (country and year specific) 99th percentile, and bottom coded at the first percentile, or at zero where the first percentile was negative (note that top–bottom coding is very unlikely to affect the EHC).
In order to apply the fixed line, it is necessary to make incomes comparable across countries in terms of purchasing power. We do so in two steps (see Schreyer and Koechlin, 2002). First, incomes are updated or deflated within each country to the year 2012, using the HICP (harmonised index of consumer prices), provided by Eurostat. Second, we apply purchasing power parities (PPPs) for final household consumption, referring to the year 2012 as calculated by Eurostat, to convert incomes into purchasing power standards (PPS), or Euro PPPs. We are aware that the use of PPPs is not a perfect solution for making incomes cross-nationally comparable, but they are the best tool available (for a more extensive discussion, see Deaton, 2010). The estimation of the sampling variance is complicated by EU-SILC’s complex sample design and the limited quality of the sample design variables in the microdata. We follow Goedemé (2013) to compute robust standard errors that take the sample designs as much as possible into account. As regards the EHC, we take a simplified approach to the computation of standard errors, by disregarding the fact that the floating poverty line has been estimated on the basis of the data. Based on findings for the low-income proportion, it can be expected that we moderately over-estimate standard errors (see Berger and Skinner, 2003).
Identifying an acceptable fixed threshold
As explained above, the extended headcount ratio works with two poverty thresholds, a fixed threshold which represents the same bundle of goods and services across time and space, and a floating threshold which varies with the average living standard in each country. As is the case with the at-risk-of-poverty indicator, the main purpose of our proposed indicator is to monitor levels and trends of poverty in the EU. Its primary purpose is not to identify a decent minimum income or the level of income support that specific households should receive so as not to be poor. Therefore, consistency of the indicator across countries and time is more important than validity at any one moment in time, and it is recommendable to vary the exact level of the thresholds in sensitivity analyses.
That being said, the thresholds should have an obvious connection with the definition of poverty and generate a sufficient level of acceptability. Given its widespread use within and beyond the EU, our floating threshold is therefore exactly the same as the at-risk-of-poverty threshold: 60% of the country and year-specific median equivalent disposable household income. In contrast, there is no readily available alternative for defining the level of the fixed threshold. Also in this case, consistency across time and space is key to give it a clear interpretation. Therefore, the fixed threshold is defined in terms of real incomes, by using the same sets of inflation factors and purchasing power parities as the ones used for converting disposable incomes in the microdata into real incomes. This implies that in terms of purchasing power standards (PPS), that is, the amount of goods and services that can be bought with an income at the level of the threshold, the fixed threshold is represented by a single number that is the same for all countries and all years under study. It only varies by household composition, in the same way as the floating threshold does.
To derive this number and give it an intuitive interpretation, we base the fixed threshold on an estimate of the cost of two basic goods for a reference family of two adults and two children: food for a healthy diet and minimum adequate housing. Carrillo-Álvarez et al. (2019) assessed the cost of a healthy diet in line with national food-based dietary guidelines for 24 EU capitals. We estimated the minimum cost of housing by regressing reported housing costs in EU-SILC on the size of the dwelling in m2, which is available in the special module of EU-SILC 2012, and using the regression coefficients to predict the cost of renting an apartment of 56 m2 in the private sector in each country. We increased the sum of both budgets with 10% to cover other basic needs at a minimal level. However, the budgets so computed cannot be readily used for identifying the fixed threshold. First of all, we would like a threshold that can be applied to all EU Member States, so we should try to find some way to extrapolate it to countries for which no data on the cost of a healthy diet is available. Second, these budgets are expressed in national currency and vary across countries. Therefore, we first convert the budgets into PPS using the Eurostat PPPs. Subsequently, we compute the unweighted country-average of the budgets in PPS to identify the fixed threshold (for a similar approach in another context, see also Ferreira et al., 2016). The national budget estimates can be affected by errors and idiosyncrasies that are not necessarily related to relevant national circumstances (see Goedemé et al., 2015). Therefore, using national-specific fixed thresholds would probably not improve the validity of the results, while making interpretation of the cross-country patterns more difficult. Also, as this ‘average’ threshold is expressed in real income, we can apply it to countries for which we have no estimate of the cost of the basic bundle of food and housing, and to the entire period under consideration. As a sensitivity test, we have also produced results with national-specific fixed thresholds. These results as well as more details on the derivation of the fixed threshold are included in the Supplementary material.
The fixed threshold for a single-person household is equal to about 5950 PPS a year (2012 real prices). Two points can be noted. First, as mentioned above, this threshold is in equivalent disposable household income, which implies that we use the modified OECD equivalence scale also when applying the fixed threshold. An alternative equivalence scale could be derived, but we believe this would unnecessarily complicate matters, and make the results less easily interpretable. Second, although the threshold is the same for all countries in PPS in 2012, it is not the same in actual current country prices. In 2017, in EUR, about three times as much is necessary to meet the fixed threshold in Denmark as compared to Bulgaria (see Supplementry Figures A2 and A3 in the Supplementary material).
Results
We first discuss the level of poverty in Europe as measured by the new poverty measure in 2017. Subsequently, we look into how the new poverty indicator sheds another light on changes in poverty levels between 2007 and 2017.
The distribution of poverty in 2017
Living standards across countries are very different, and it will prove useful to geographically categorise countries into three groups: • North-Western EU: AT, BE, DE, DK, FI, FR, IE, LU, NL, SE and UK. • Southern EU: CY, EL, ES, IT, MT, PT. • Eastern EU: BG, CZ, EE, HR, HU, LV, LT, PL, RO, SI, SK.
Distribution of poverty in the EU in 2017.
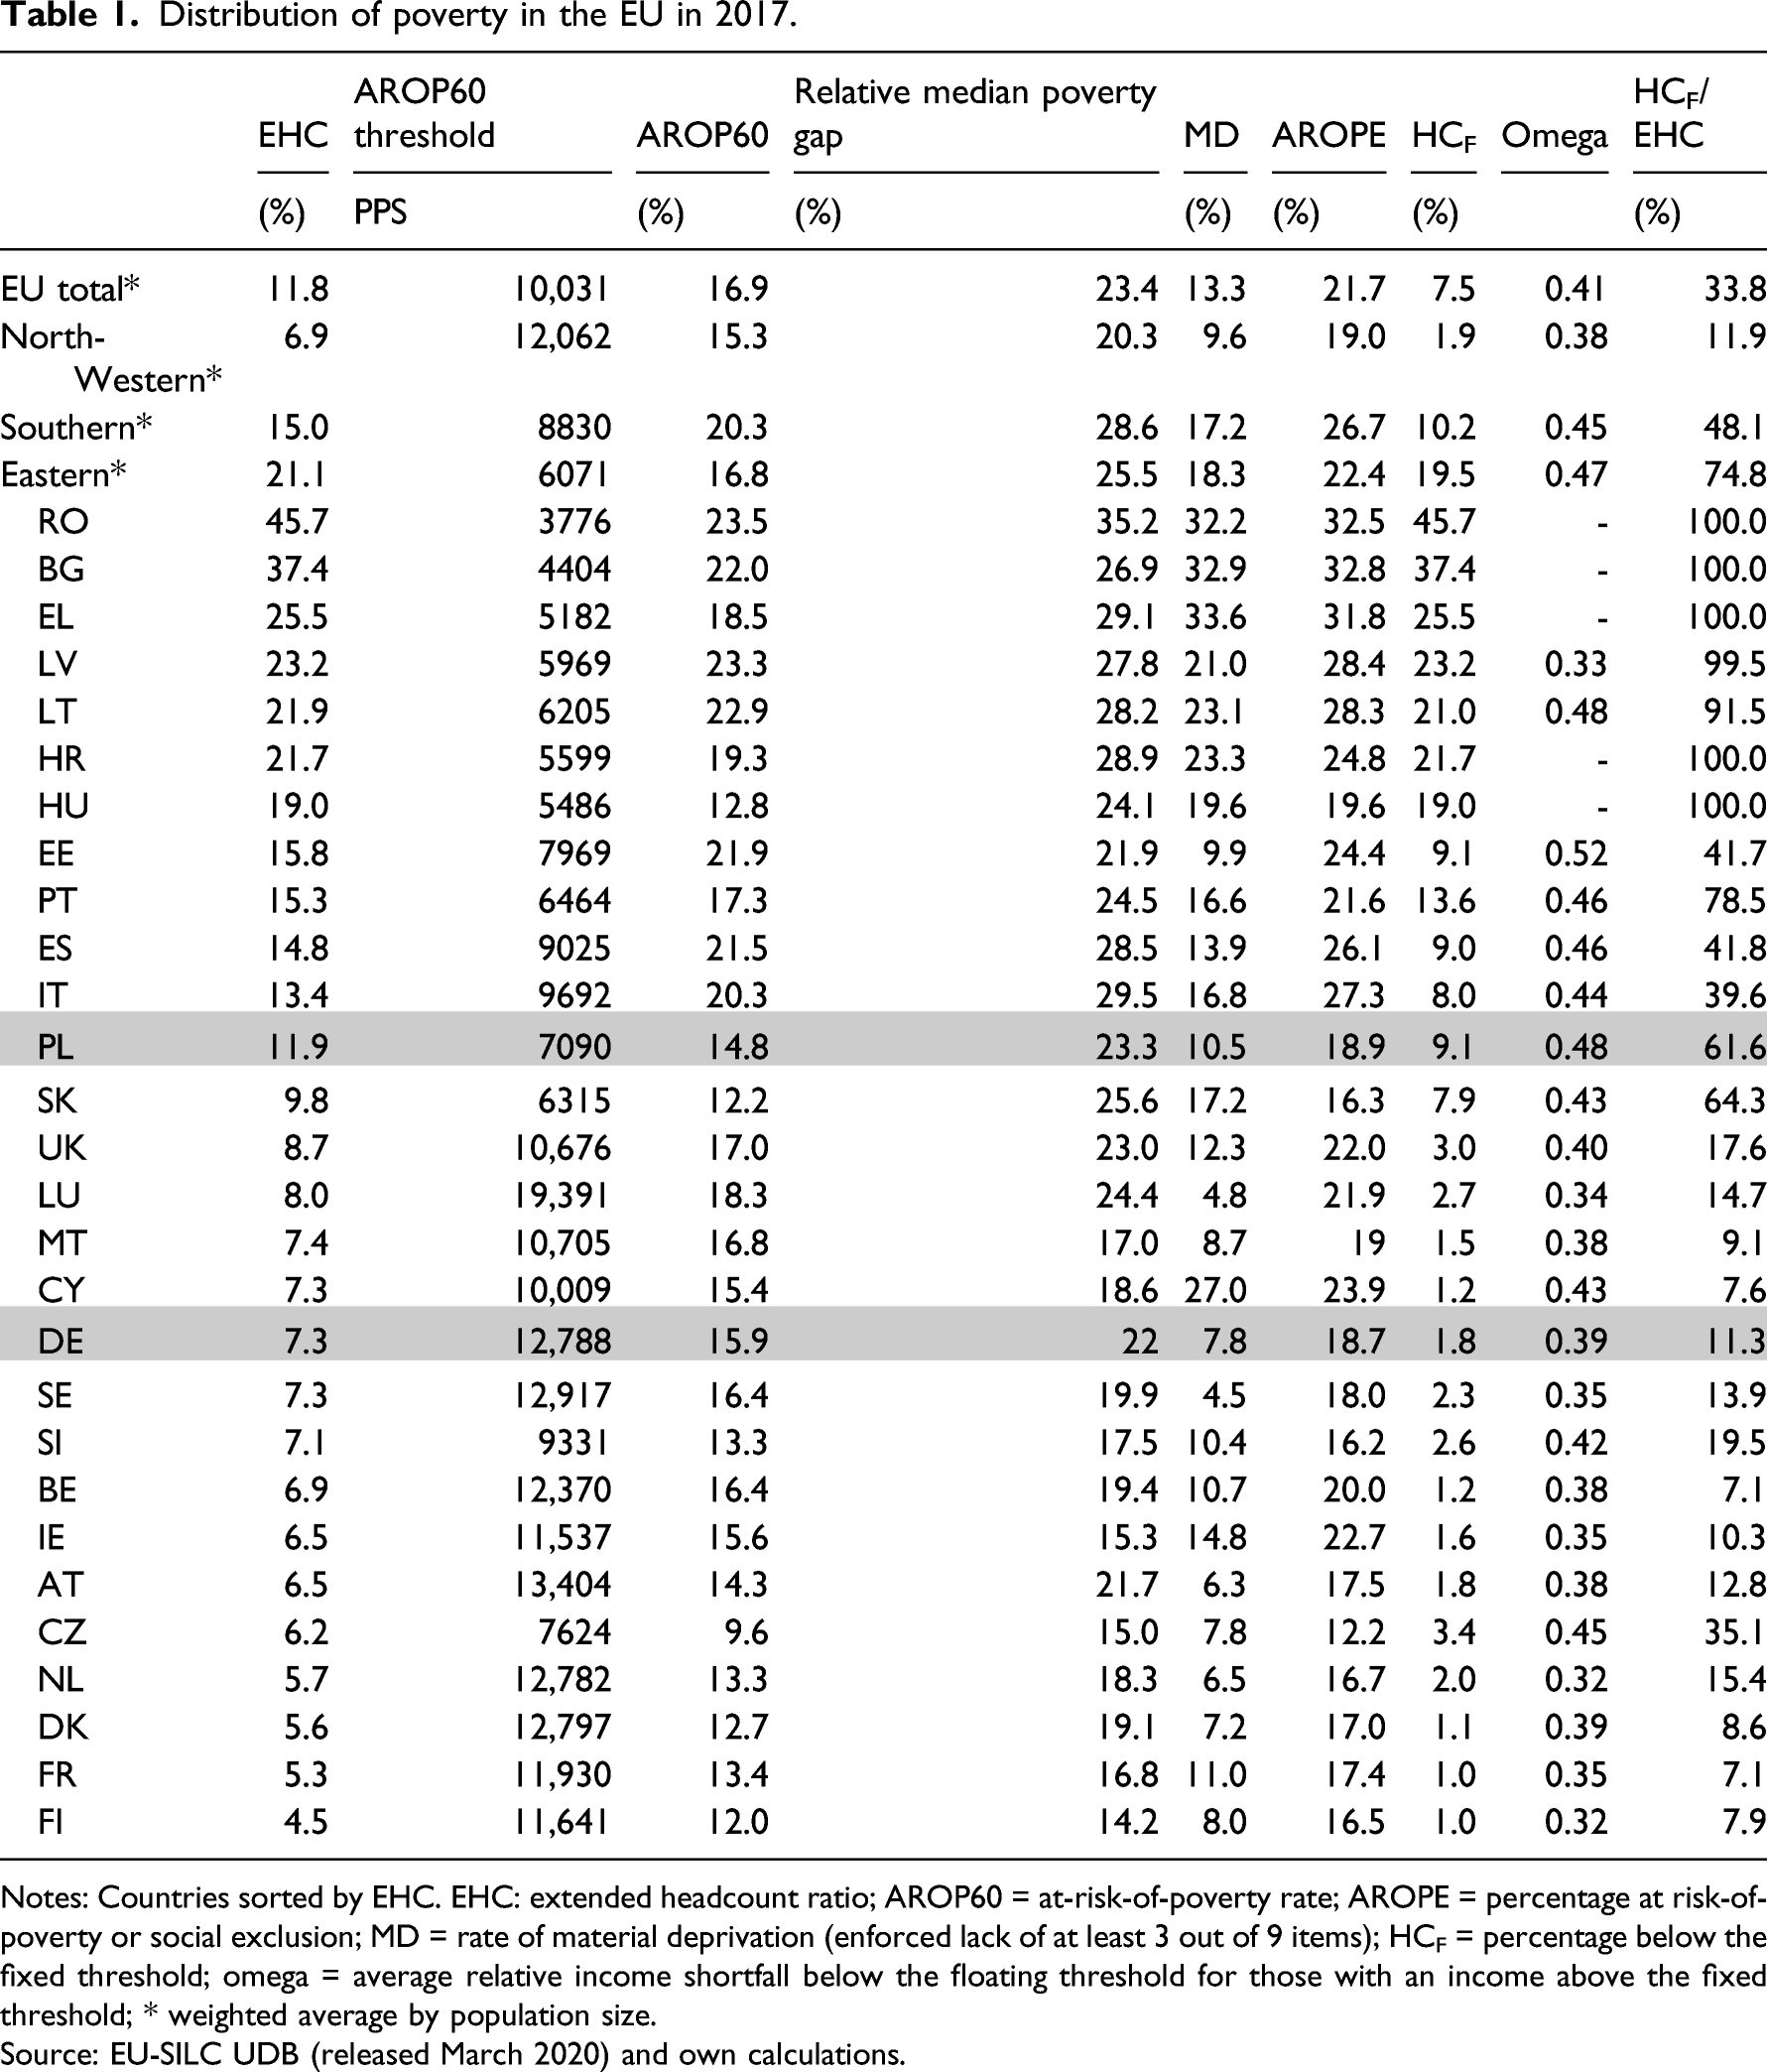
Notes: Countries sorted by EHC. EHC: extended headcount ratio; AROP60 = at-risk-of-poverty rate; AROPE = percentage at risk-of-poverty or social exclusion; MD = rate of material deprivation (enforced lack of at least 3 out of 9 items); HCF = percentage below the fixed threshold; omega = average relative income shortfall below the floating threshold for those with an income above the fixed threshold; * weighted average by population size.
Source: EU-SILC UDB (released March 2020) and own calculations.
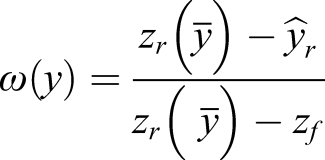
At first sight, some results of the EHC seem to align better with more intuitive understandings of the distribution of poverty in the EU. Compare, for instance, Poland and Germany, which are highlighted in Table 1. Both countries have a floating threshold that is higher than the fixed threshold, very similar AROP60 rates, and very similar AROPE rates. However, the fraction of severely poor individuals is much larger in Poland (9.1%) than in Germany (1.8%). This implies that the fraction of the poor who are not severely poor is much smaller in Poland (5.7%) than in Germany (14.1%). Since those who are exclusively at-risk-of-poverty are weighted down in the EHC, the EHC is considerably higher in Poland (11.9%) than in Germany (7.3%). Another contributing factor, which plays a secondary role in this comparison, is that the poor who are not severely poor get a larger weight in Poland (0.48) than in Germany (0.39), because they are closer to the severe poverty threshold in Poland. This gives

Likewise, while both AROP60 and AROPE are relatively similar for France and Hungary, the EHC is remarkably lower in France as compared to Hungary. In both pairs of countries, the contrast between the EHC rates is in the same direction as, though clearly larger than, the difference between the material deprivation rates.
More generally speaking, it is interesting to see how the EHC is substantially higher for Eastern Europe (21%) than for Southern Europe (15%), while also highlighting that poverty in both regions is substantially higher than in North-Western Europe (6.9%). The reason for these marked comparisons is again that they reflect the very different fractions of individuals below the fixed threshold in Eastern Europe (20%), Southern Europe (10%) and North-Western Europe (2%), but also that income is more unequally distributed in Southern Europe than in North-Western Europe, which is implied by the higher share below the 60% threshold in Southern Europe (20%) as compared to North-Western Europe (15%). Observe also that the variation across countries is considerably smaller for AROP60 (range: 10–24) and AROPE (range: 12–33) than it is for EHC (range: 4–46). Note that both AROPE and AROP60 are higher in Southern than in the Eastern European countries, while the reverse is true for material deprivation (although the difference in the MD rate is much smaller than that of the EHC). While moving from average to national fixed thresholds leads to important differences for some countries (Bulgaria stands out), the overall pattern by European regions changes little (see Supplementry Tables A6 and A7 in the Supplementary material).
In the introduction, we claimed that the EHC combines in a consistent way aspects such as the level of the at-risk-of-poverty threshold, the notion that the poverty threshold should, at least to some degree, increase with living standards (AROP60), the intensity of poverty (the poverty gap) and the need for a pan-European perspective of poverty. Figure 1 illustrates that the new income measure indeed incorporates all these aspects from a comparative perspective for the situation in 2017. The EHC succeeds in being clearly correlated with the level of the 60% at-risk-of-poverty threshold, the at-risk-of-poverty rate, the median relative at-risk-of-poverty gap and the severe poverty headcount (HCF) as indicators of the four notions mentioned above. It is noteworthy that the EHC correlates more strongly with the level of the poverty threshold, the median poverty gap and HCF than AROP60 does (see Supplementry Table A3 in the Supplementary material). Therefore, we believe that it is safe to conclude that the EHC does a good job in capturing key dimensions of the poverty concept and summarising them in a consistent way to allow for meaningful cross-country comparisons. The bottom graphs in Figure 1 also show that EHC correlates fairly strongly and in the expected positive direction with the AROPE and material deprivation rates. Yet, the correlation is far from perfect, suggesting that EHC has added value relative to those indicators (compare, for instance, results for Greece, Bulgaria and Romania). The relation between the Extended headcount ratio (%) and other indicators of poverty, 2017.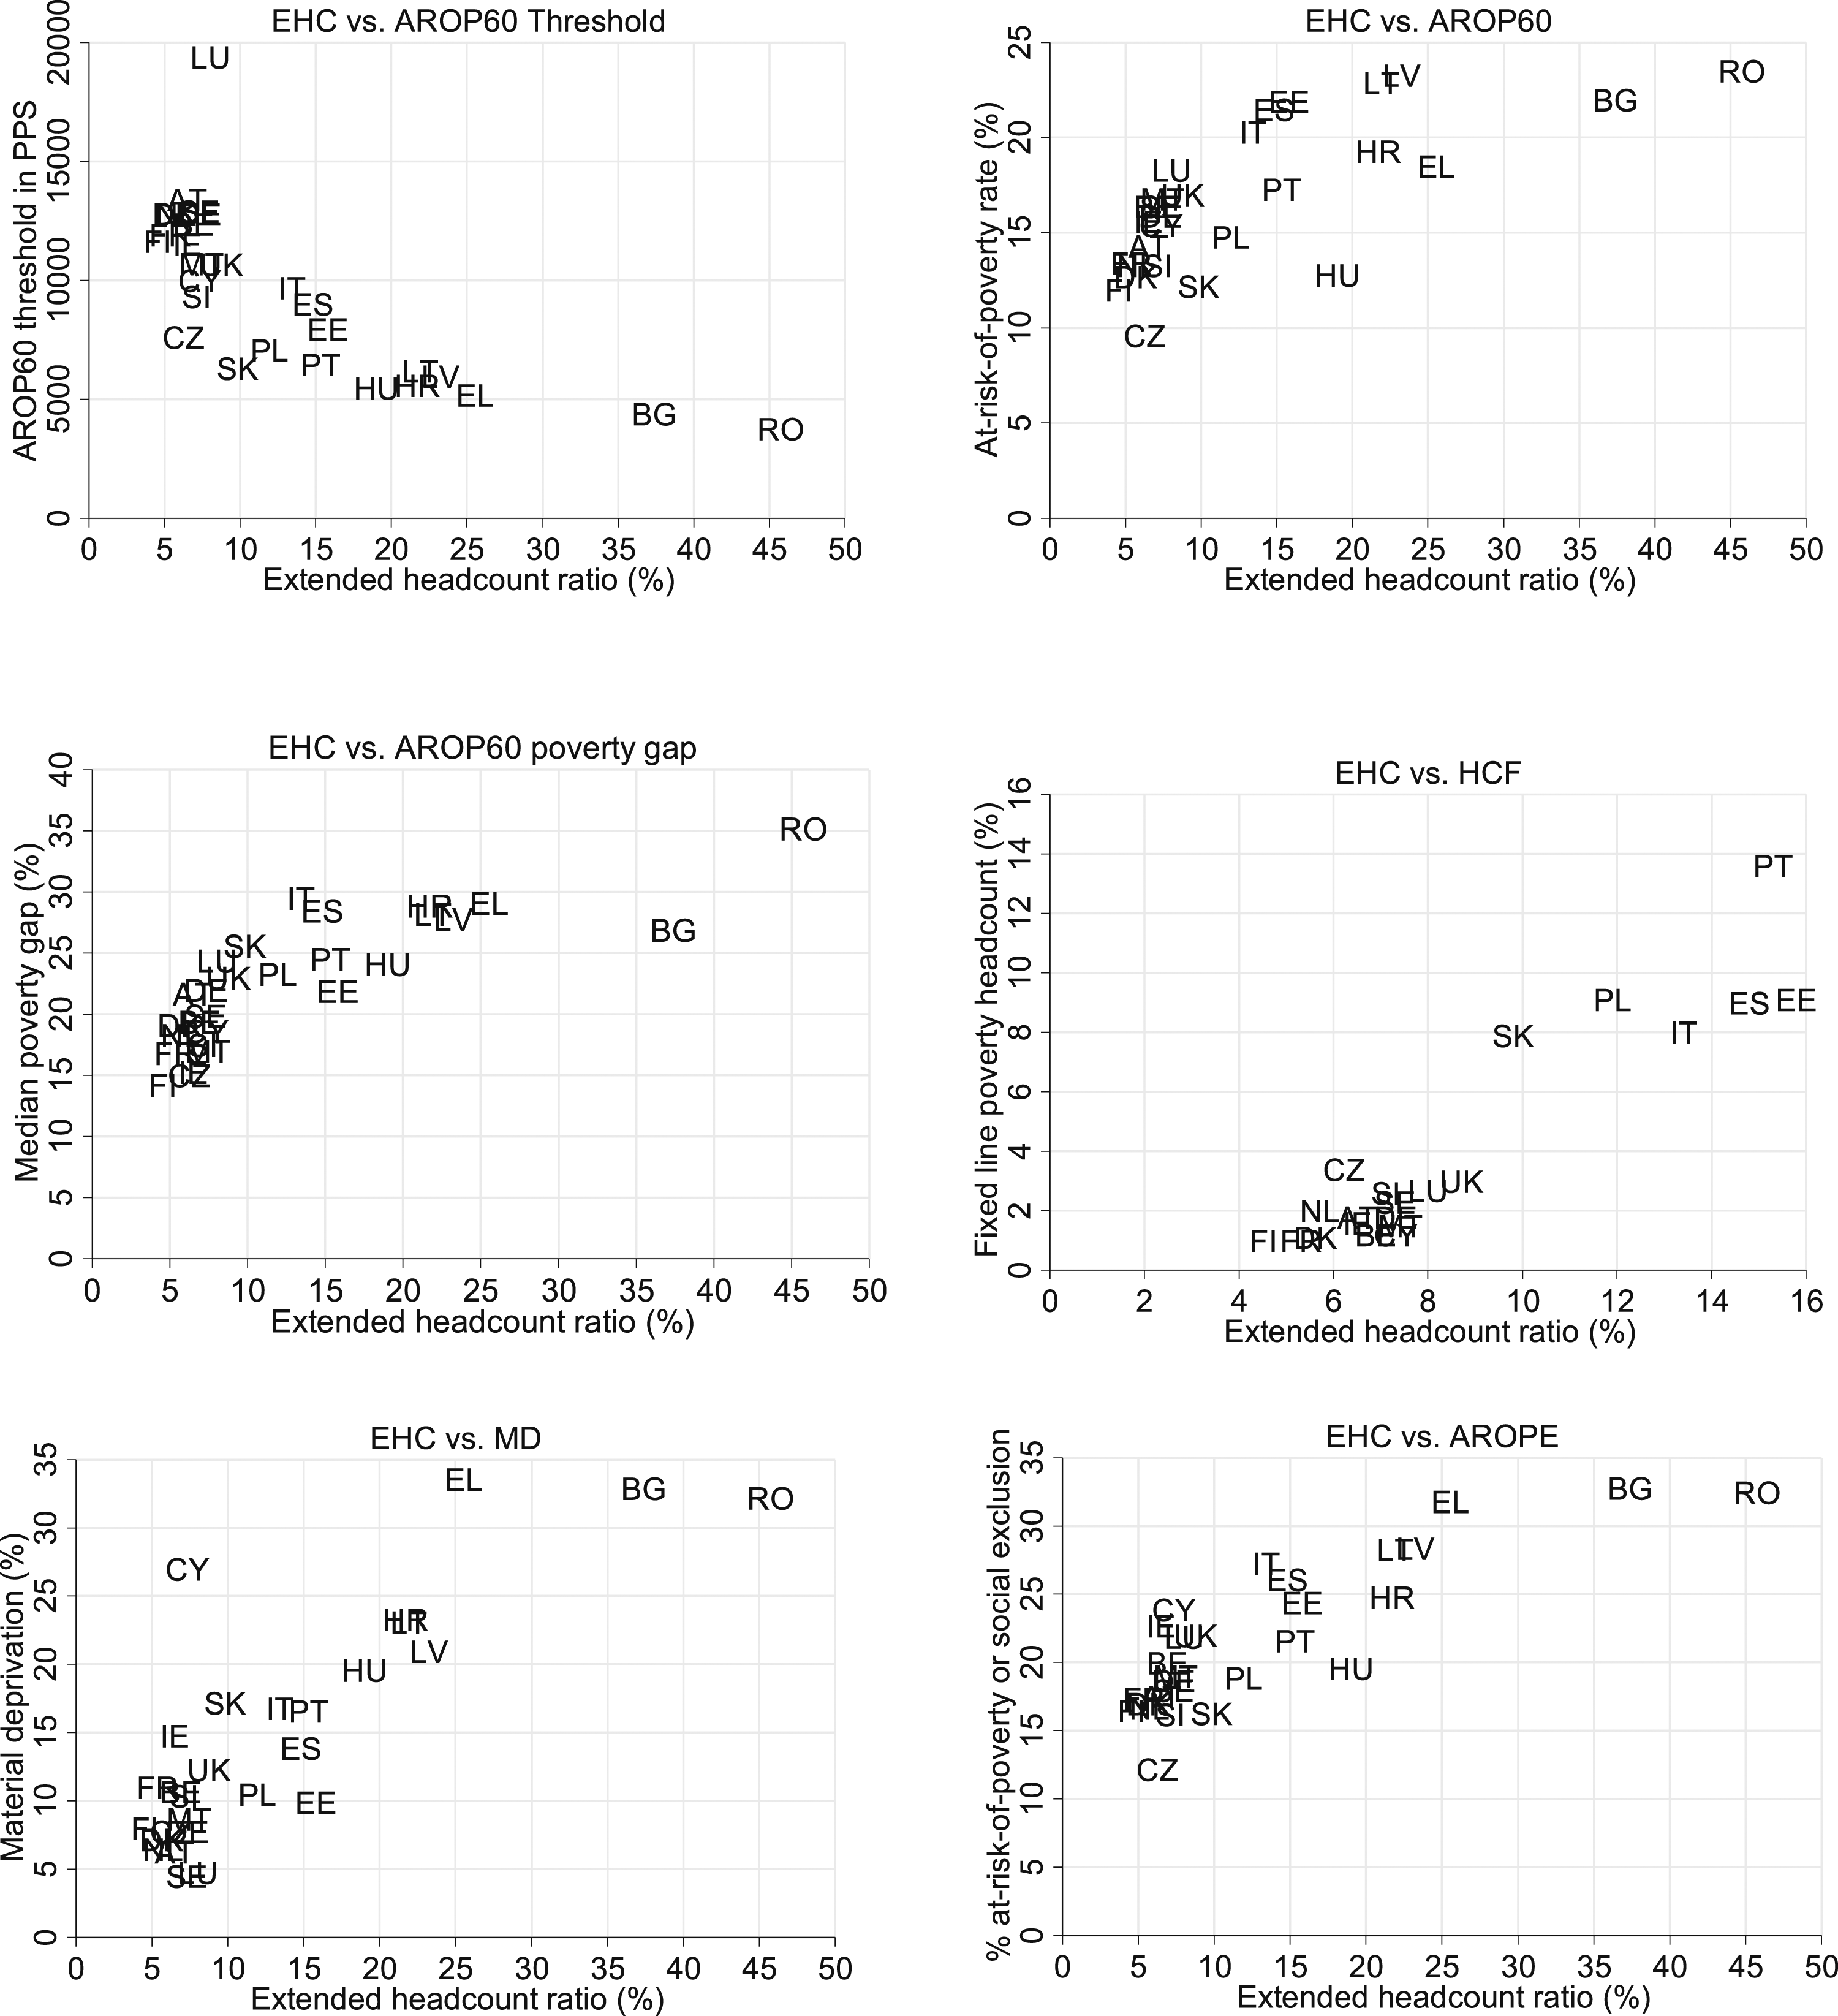
Evolution of poverty in the EU between 2007 and 2017
Evolution of poverty measures over the period 2007–2017.
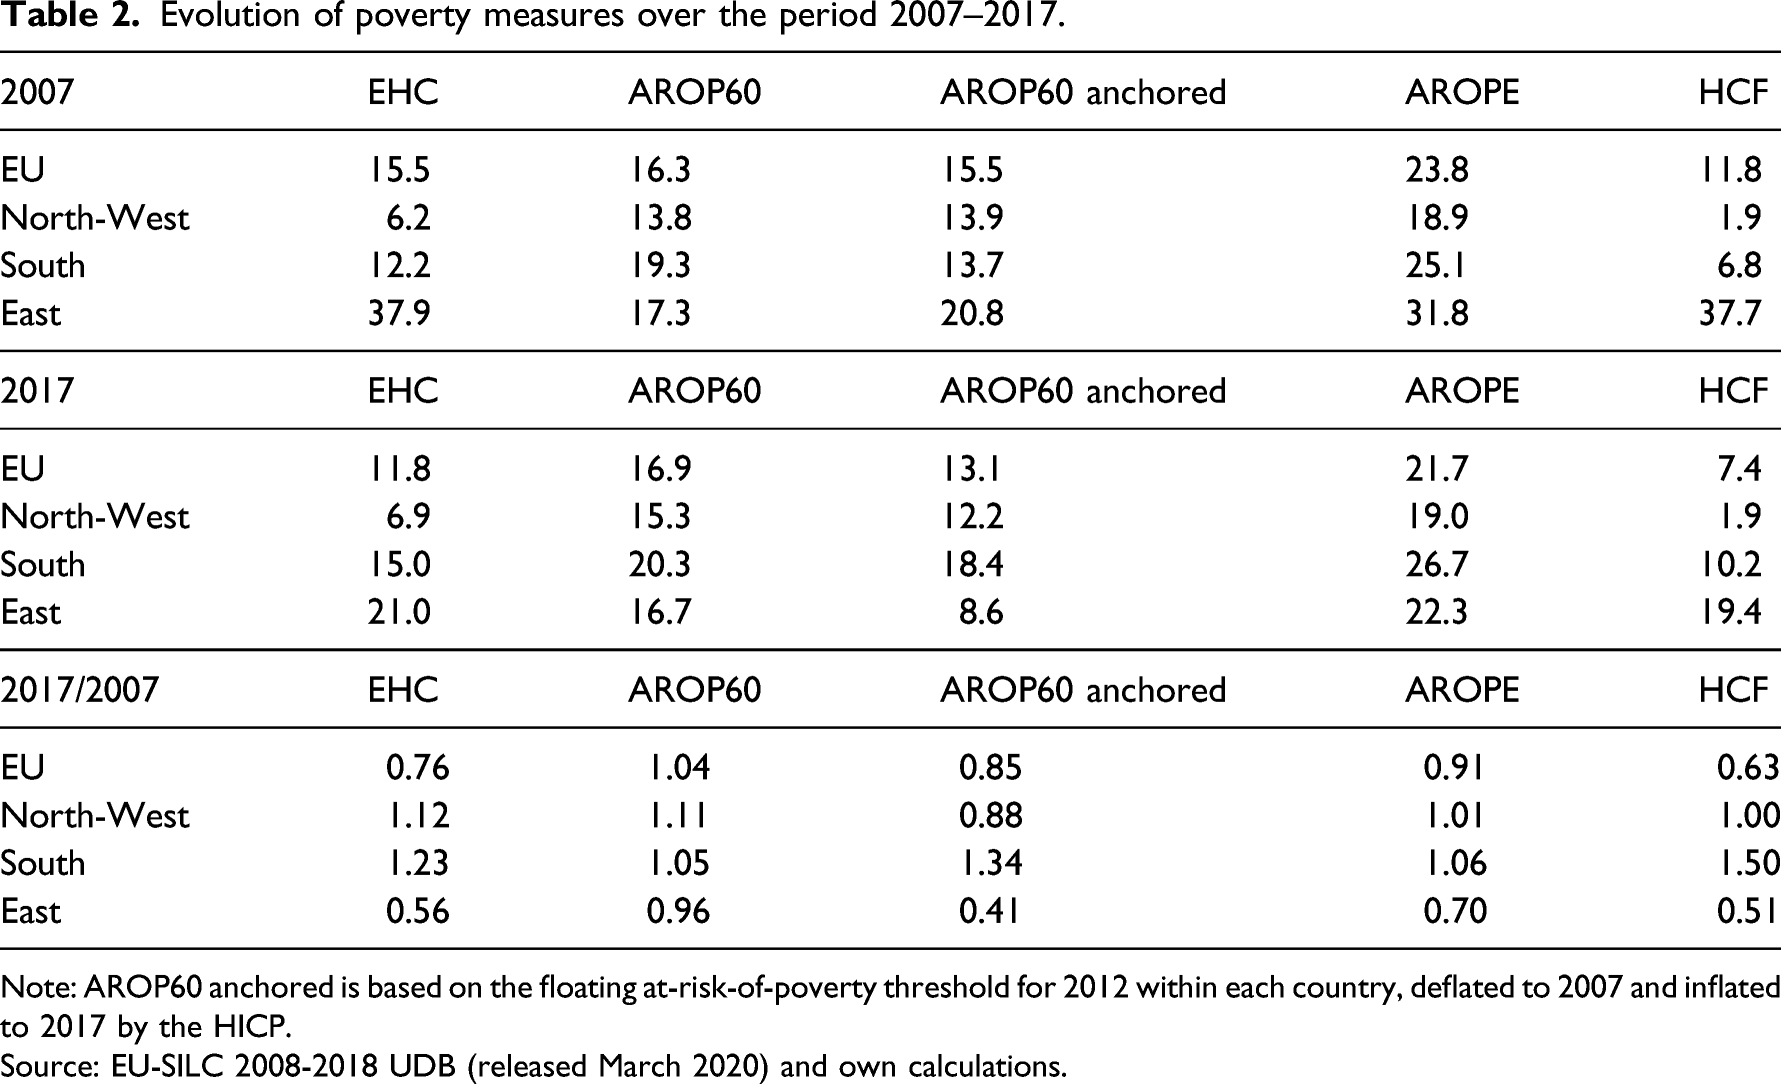
Note: AROP60 anchored is based on the floating at-risk-of-poverty threshold for 2012 within each country, deflated to 2007 and inflated to 2017 by the HICP.
Source: EU-SILC 2008-2018 UDB (released March 2020) and own calculations.
Correlation coefficients of the relation between the EHC and other poverty measures across all years 2007–2017 by group of countries show that the EHC correlates relatively strongly with AROP60 in the north-west of the EU, somewhat less in the south, and not at all in the east. By contrast, in the latter two regions, EHC correlates very strongly with the anchored AROP60 and also with AROPE. Although at a lower level, also in the north-west of the EU, the EHC correlates more strongly with anchored AROP60 than AROP60 does. Yet, it is clear that the EHC correlates most strongly with AROP60 in ‘higher-income’ countries (where severe poverty, as defined here, is not very common) and correlates more strongly with anchored AROP60 in ‘lower-income’ countries (where severe poverty is the dominant issue) (see Supplementry Table A4 in the Supplementary material for detailed correlations and Supplementry Table A5 for trends by country).
This general point is illustrated further in Figures 2 and 3 for specific countries in which poverty followed a very outspoken pattern, Greece and Poland. Greece was hit hard by the economic crisis, while Poland experienced an economic boom. In Greece, median income dropped after 2009, while the severe poverty headcount and the EHC increased strongly. In contrast, AROP60 changed only by a few percentage points. The anchored AROP60, based on a threshold fixed at its 2012 real value, increased from 6% in 2009 to nearly 25% in 2013, and moved virtually parallel to EHC, though at a lower level. AROPE also increased but to a much lesser extent than HCF and EHC. Evolution of poverty measures for Greece over the period 2007–2017. Evolution of poverty measures for Poland over the period 2007–2017.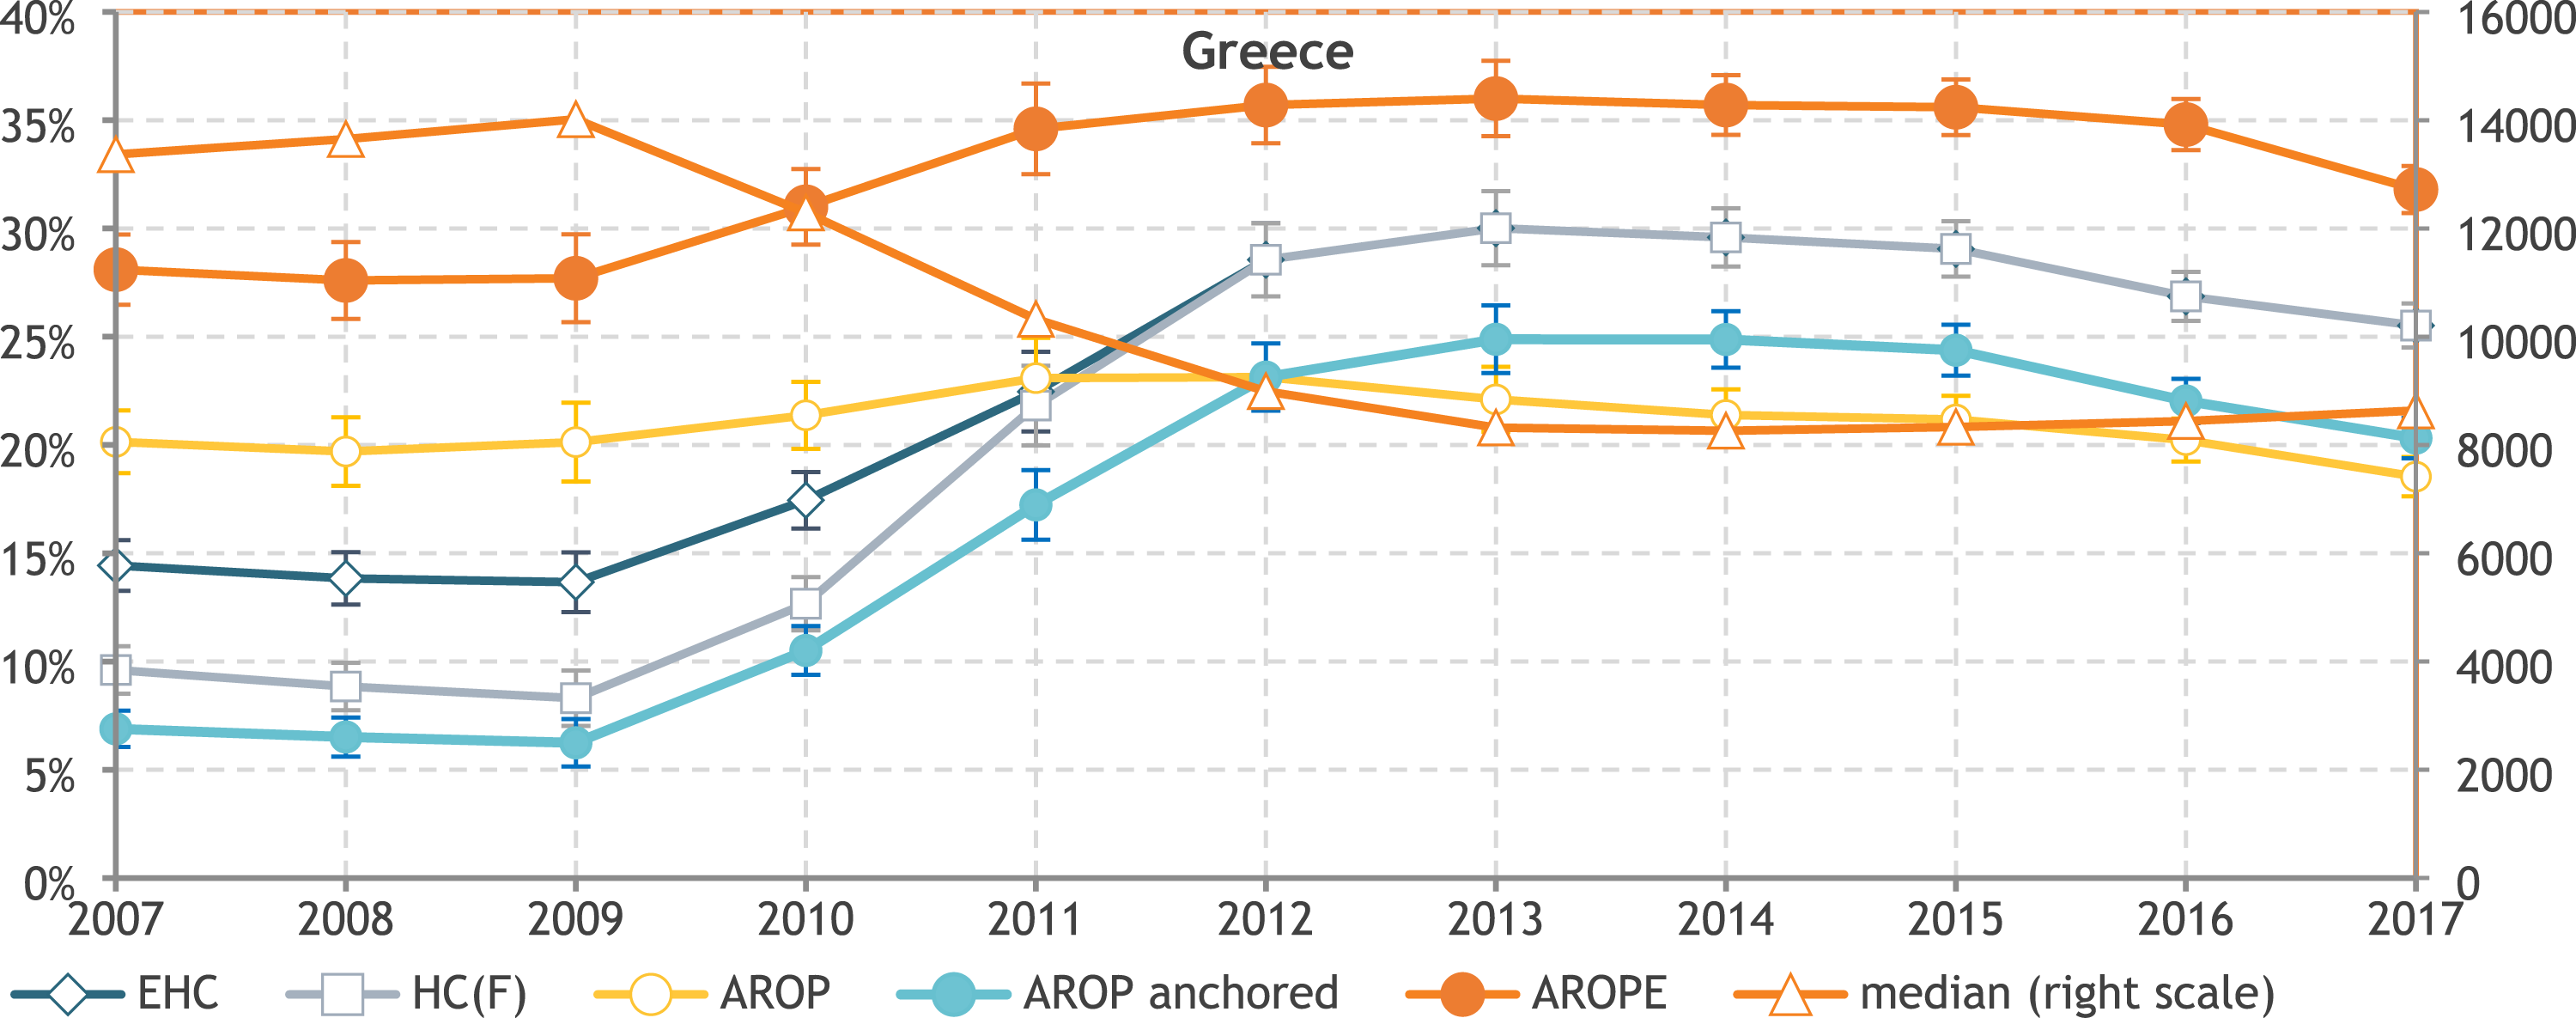
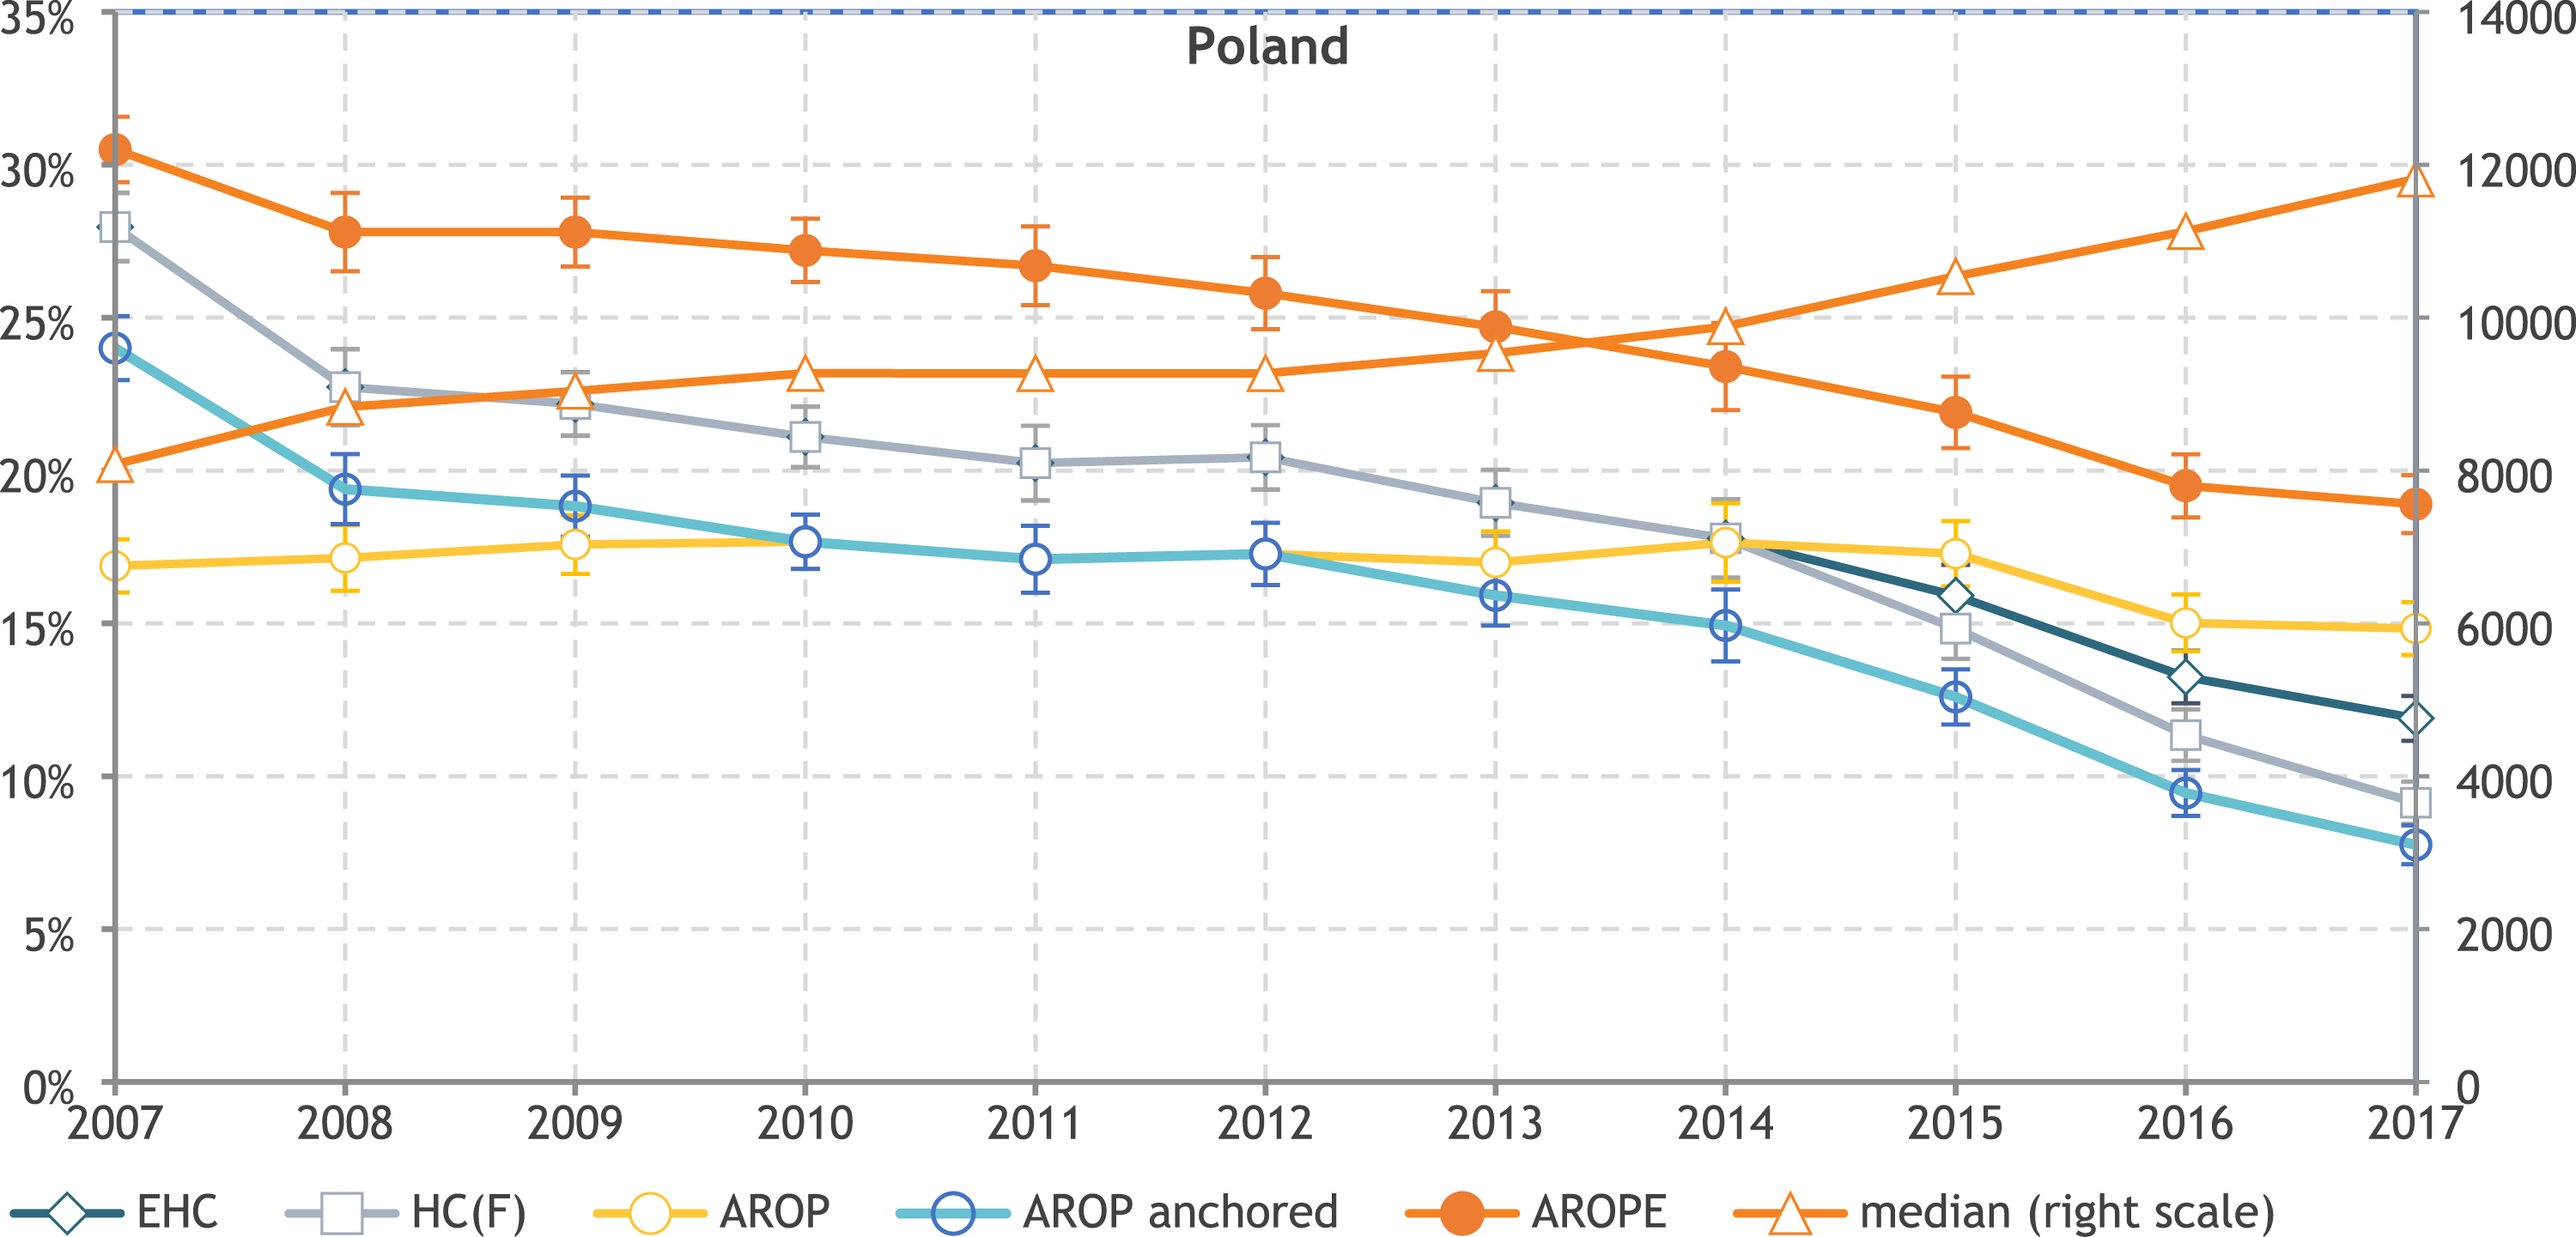
In contrast, in Poland, median income increased continuously between 2007 and 2017, which strongly decreased the population share below the fixed threshold. At the same time, AROP60 remained nearly stable during almost the whole period 2007–2017, except for a slight decline between 2015 and 2016. Before 2015, the fixed threshold is higher than the floating threshold, and our measure EHC is equal to HCF, but after that year, the floating threshold is higher, and EHC does not decrease as fast as HCF because individuals who escape severe poverty become (exclusively) at-risk-of-poverty. As in the case of Greece, the anchored AROP60 follows the EHC rather closely. AROPE also falls during the whole period, though in relative terms its decline (−38%) is smaller than that of EHC (−53%).
Discussion and conclusion
Poverty is a complex phenomenon. In the EU, discussions about how it should best be measured in a context of widely varying living standards and during periods of strong economic change remain part of the poverty debate. This issue is currently solved by having a dashboard of indicators, which often tell conflicting stories about the distribution of poverty in the EU and how it is evolving over time. The dashboard of indicators includes the level of the at-risk-of-poverty threshold corrected for price differences across countries, the at-risk-of-poverty rate, the median relative at-risk-of-poverty gap, and the at-risk-of-poverty rate with the poverty threshold anchored at a point in time. Each of these stand out for capturing a particular notion of the poverty concept: the notion that the level at which one’s income is judged to be low matters, the notion that more income in a context of high living standards is required in order not to be poor, the notion that the intensity of poverty matters, and the notion that when living standards change very quickly, the income required for having a minimum acceptable way of life may not change as quickly as changes in the median income suggest. We show that our new indicator is able to integrate all these concerns in a coherent way in a single poverty metric. Furthermore, our indicator responds to calls for also including a pan-European benchmark for measuring poverty, as well as indicators of real income growth at the bottom of the income distribution. The result is an indicator which, we believe, is better suited for monitoring poverty in the EU, both across countries and across time, and which probably, by simultaneously aligning with all four notions mentioned above, will also have higher face validity. This does not invalidate the usefulness of the dashboard approach for monitoring social trends. However, there is a clear demand for a very limited number of headline indicators to keep track of the general trend in poverty, as is exemplified by the social scoreboard indicators. We suggest that the EHC would serve this purpose better than the current at-risk-of-poverty rate (AROP) or AROPE. It may foster more consensus about the distribution of poverty in the EU.
There are other advantages to our poverty measure. Given that poverty policies mainly work through increasing and redistributing incomes, an income-based measure is most suitable for guiding concrete policies and ex-ante policy evaluations. Furthermore, when the floating threshold is higher than the fixed threshold, poverty is not measured in a binary way. While having an income just above or just below the threshold makes a big difference with AROP60, our measure takes a much more nuanced view. At the national level, this may help to focus anti-poverty policies on those with very low incomes. In particular, it would show more clearly the impact of increasing guaranteed minimum incomes even if these remain below the floating poverty threshold. At the EU level, the EHC shows a different regional distribution of poverty across the EU than the AROP60 or AROPE indicator, revealing a higher level of poverty in Eastern Europe than in Southern Europe. It also points to a faster improvement in living conditions in Eastern Europe, as well as a stronger deterioration of living conditions in Southern Europe in the wake of the Great Recession, than the AROP60 or AROPE indicator suggest. The EHC may therefore help to allocate resources to where they are needed most, and lead to new insights into the relation between growth, redistribution and poverty, which may help to hone the EU’s inclusive growth strategy.
Although we are convinced that the new measure that we propose has many benefits, the extended headcount ratio has several limitations. First, the identification of the fixed threshold may be improved. A continuation and streamlining of the pilot projects on constructing comparable reference budgets in the EU would be very beneficial in this regard. We believe that for the purposes set out in this article, the development of complete reference budgets in all EU Member States covering all relevant spheres of life is not an absolute requirement. In contrast, renewed reference budget research in relation to the cost of a healthy diet, housing and some other basic amenities could result in a higher credibility and acceptability of the level of the fixed threshold.
Second, as we tried to follow as much as possible current practice with measuring poverty in the EU, our indicator has the same limitations as the at-risk-of-poverty rate with regard to assumed economies of scale, the level of the floating threshold, the exclusive focus on disposable household income, the neglect of economic inequalities within the household and so on. All these factors are important, and our indicator could be adjusted in a similar way as the at-risk-of-poverty indicator should be adjusted when new ways are established and accepted for dealing with these issues. For instance, the modified OECD equivalence scale, which determines the assumed economies of scale, is no more than a convention in international comparative research on income poverty and inequality and ignores many differences between countries in, for example, availability of free or subsidised housing, education and healthcare. Further development of reference budgets could shed light on this important issue. Another limitation is inherent to the new poverty index itself: the result is not a percentage. This might be somewhat harder to interpret by some policymakers and the broader public. However, the possibility of interpreting its value as an equivalent percentage of severely poor individuals may go some way in mitigating this limitation. This also implies that it cannot be aggregated as easily into a combined measure such as AROPE or measures of consistent poverty. However, this comes at a significant benefit of having an income-based measure of poverty which results in poverty estimates that are likely to have a higher level of face validity both among policymakers and the general public, while also complying in a consistent and more valid way with common notions of how poverty varies across time and space.
Supplemental Material
sj-pdf-1-esp-10.1177_09589287221080414 – Supplemental Material for A new poverty indicator for Europe: The extended headcount ratio
Supplemental Material, sj-pdf-1-esp-10.1177_09589287221080414 for A new poverty indicator for Europe: The extended headcount ratio by Tim Goedemé, Benoit Decerf, and Karel Van den Bosch in Journal of European Social Policy
Footnotes
Acknowledgements
We are grateful to Tess Penne for providing the data with regard to the low-cost food baskets. For comments and suggestions, we would like to thank two anonymous reviewers as well as Gianni Betti, Mark Fransham, Brian Nolan, Marii Paskov, Juan Palomino and David Weisstanner and the other participants of various seminars at the Department of Social Policy and Intervention and the Institute for New Economic Thinking at the University of Oxford, and the In-GRID 2 Expert workshop on measuring and monitoring regional multidimensional poverty and cost of living, organised by the University of Pisa. The EU-SILC microdata were made available by Eurostat under contract RPP 77/2017-EU-SILC-HBS. Neither the funders, nor the data providers can be held responsible for the content of this article and any remaining shortcomings or errors, which are the sole responsibility of the authors.
Declaration of conflicting interests
The author(s) declared no potential conflicts of interest with respect to the research, authorship, and/or publication of this article.
Funding
The author(s) disclosed receipt of the following financial support for the research, authorship, and/or publication of this article: This study is supported by Citi through the Oxford Martin Programme on Inequality and Prosperity.
Supplemental Material
Supplemental material for this article is available online.
Notes
References
Supplementary Material
Please find the following supplemental material available below.
For Open Access articles published under a Creative Commons License, all supplemental material carries the same license as the article it is associated with.
For non-Open Access articles published, all supplemental material carries a non-exclusive license, and permission requests for re-use of supplemental material or any part of supplemental material shall be sent directly to the copyright owner as specified in the copyright notice associated with the article.