
Abstract
How has housing wealth inequality changed for young-adult households in the post-financial crisis period, and what is driving such change? We chart a path for subsequent studies by analysing the previously unexamined post-crisis housing wealth profile of young adults via different angles and using multiple inequality measures. Using household micro-data for 11 European countries (Household Finance and Consumption Survey, 2010–2017) and the United States (Survey of Consumer Finances, 2010–2016), we find that the accumulation of housing assets for 22–44 year olds is unevenly concentrated among high-income homeowners, over and above what would be expected given the well-known decline in homeownership. We describe and assess several potential drivers for these wealth profile changes, finding that the current explanations offered in the literature do not adequately account for the unequal wealth profile of young people. We conclude that a mix of dynamics, including housing market volatility, housing market configurations leading to uneven capital gains and losses, and the increased social selectivity of homeownership intersect to shape the ways that young adults navigate the housing market in post-crisis times.
Introduction
How has housing wealth inequality changed for young-adult households in the post-financial crisis period, and what is driving such change? Despite the role of housing in the global financial crisis (GFC) 2008–2009, despite housing serving as the primary asset for most households, and despite younger cohorts experiencing a housing market that is more volatile and expensive, we know surprisingly little about recent housing wealth developments. In this article, we find that accumulation of housing assets for a growing part of young adults has become slow or even impossible, while returns on housing investments for homeowners became more unequal and increasingly concentrated at the top of the income distribution.
These developments might, first, be explained by ‘across-the-board’ increased social selectivity unrelated to specific housing market configurations – that is, selection into homeownership of fewer households, but with a comparatively stronger socio-economic profile – or second, by developments within the housing sector, specifically uneven price trends based on housing type or location. We explore these two potential explanations and find that social selection into homeownership may only explain part of the observed trends in housing wealth accumulation. When considering the full pool of owners and renters, young adults with fewer economic resources fall out of homeownership, resulting in a trend towards a more unequal distribution of wealth. Increased inequality and concentration of wealth among ‘remaining’ homeowners in most countries under consideration is, however, most likely driven by meso- and macro-level housing market factors associated with uneven capital gains or losses, intersecting with socio-economic position.
These potential drivers are important because of the changing nature of the economy and its link to wealth inequality. While those at the top own significant financial wealth, housing wealth is the primary form of wealth for most other households. Adding to growing economic gaps across education levels, the GFC hit young people hardest in terms of their ability to accumulate housing wealth. The concurrent social policy shift towards risk privatization and asset-based welfare places young people on a precipice.
In this article, we seek to describe and offer a preliminary explanation for that precipice. To do so, we analyse trends in housing wealth inequality and concentration for a representative sample of young-adult households (reference person aged 22–44). We use data (2016/17 compared to 2010) from the Household Finance and Consumption Survey (11 European countries: Austria (AT), Belgium (BE), Germany (DE), Finland (FI), France (FR), Greece (GR), Italy (IT), Luxembourg (LU), Netherlands (NL), Portugal (PT) and Slovakia (SK)) (ECB, 2020) and the Survey of Consumer Finances (United States) (Federal Reserve, 2020). While highlighting cross-country differences, we select a variable – gross housing wealth – that accounts for idiosyncratic differences in mortgage markets (for example, loan-to-value ratios). We use multiple measures capturing different aspects of the wealth distribution, and offer a preliminary assessment of potential drivers of increased inequality and concentration in housing wealth.
The article proceeds as follows. The first section provides contextual and theoretical background. The second section introduces our data analysis strategy. The next section outlines two potential dynamics – social selection and housing market configurations leading to uneven capital gains and losses – that shape the ways that young adults navigate the housing market in post-crisis times. The fourth section presents our findings, and the final section concludes.
Contextual and theoretical justification
Whereas economic globalization was associated with rising labour market, wage and income inequalities, the recent rise of global finance and its consequences for the functioning of institutions and firms, as well as the ‘financialization of everyday life’ (for example, Ansell and Cansunar, 2021; Van der Zwan, 2014), have moved the spotlight to wealth inequality. The current state-of-the-art, however, mostly tends to describe general trends over time or overall differences between countries. A particular lacuna pertains to housing wealth. In a recent study on wealth inequality, Cowell et al. (2018: 332), for instance, report that ‘the biggest share of cross-country differences is not attributable to the distribution of household demographic and economic characteristics but rather reflects strong unexplained country-effects’. Part of these unexplained effects is obviously due to housing tenure structures. To the extent that property wealth is more widespread, the overall wealth distribution tends to be more equal (Soaita et al., 2019). Further variegation flows from institutional arrangements pertaining to the modes in which homeownership expanded during the post-war period, as well as recent changes in the political economy of housing, that is, the deregulation and globalization of housing finance (Wind et al., 2017). Pfeffer and Waitkus (2021) indeed confirm that between-country differences in net wealth inequality are centrally driven by differences in inequality and concentration of housing equity.
Regarding young adults, delayed entry into homeownership – the route to housing wealth accumulation – has been a concern since the mid-1970s. Long-term deterioration of employment opportunities and income security disproportionally affected each new cohort of labour market entrants. Flynn (2020) reports that over the last 30–40 years fewer 18–34 year-olds left the parental home, of which fewer formed traditional households, of which again a declining number entered homeownership. Within-cohort education, class and income differentials widened, as young adults of lower socio-economic backgrounds became relatively less likely to enter homeownership (Kurz and Blossfeld, 2004).
Mortgage market deregulation leading up to the GFC promoted low-income and even ‘subprime’ homeownership. In an attempt to spread the risks of including more financially insecure households, a global chain of ‘securitized’ mortgage-related investment products was construed. In this process, not only housing finance but also (urban) land and housing itself were transformed into such commodities, for example, as securities for financial instruments traded and sold on global markets (Aalbers, 2016; UN, 2017: 7). These developments, however, culminated in asset destruction across the globe, resulting in house price volatility, increased socio-spatial differences and the rise of new exploitative strategies across housing market sectors (Forrest and Hirayama, 2015; Maclennan and Miao, 2017). Housing market entrants, ‘by default’ young adults, suffer disproportionally. Cross-European variation in deteriorating homeownership opportunities (for example, access, affordability and quality) since the GFC is more strongly associated with the extent of housing and mortgage market turmoil, presumably through risk mitigation and credit constraints, than with declined employment and income security (Dewilde, 2020). In this article, we contribute by investigating post-crisis developments in young adults’ housing wealth.
Shifting the focus from homeownership to housing wealth also makes sense from a social policy perspective. For many middle-/lower-class households, homeownership is the only significant form of wealth accumulation. Compared with income, wealth is a distinct marker of social prestige, power, opportunity and material and subjective wellbeing (Killewald et al., 2017). Creeping trends towards ‘property-based’ welfare (Crouch, 2009; Malpass, 2008), whereby households draw on accumulated housing wealth to supplement pensions, finance long-term care or support children through higher education, are justified by the belief that such wealth is within reach of and equally rewarding for all. Our study shows that such assumptions are unjustified, not least for young adults.
Explanations regarding post-crisis developments in young adults’ housing wealth put forward in the third section pertain to trends affecting various sample selections (all young adults versus young homeowners), as well as to intersections between housing wealth and socio-economic (income) position. We therefore approach trends in housing wealth inequality and concentration from different angles, using multiple measures. We first discuss our data analysis strategy.
Data, concepts and empirical strategy
Data
We analyse comparable data from the 2010 and 2016/17 waves of the Household Finance and Consumption Survey (HFCS) (11 European countries) and the Survey of Consumer Finances (SCF) (US). Both collect representative wealth data for private households. Our main focus is on ‘independent’ young-adult households (reference person aged 22–44) not in full-time education. Opportunities to accumulate housing wealth are obviously driven by changes in access to homeownership; we therefore sketch the overall context by describing trends in the inequality and concentration of housing wealth across the wealth and income distributions for all young owners and renters. However, as the main drivers of housing-wealth related inequalities might pertain to housing market dynamics that generate uneven capital gains or losses, we then move to the subsample of homeowners. The average sample size across European countries is 695 households. Respective US samples amount to 951 (2010) and 753 (2016). We use survey-provided weights (oversampling of wealthy households), as well as the five implicates resulting from the multiple imputation of missing income and wealth components (ECB, 2020; Federal Reserve, 2020).
Concepts
We took care to maximize the comparability of living arrangements and wealth measures. We consider a household as ‘independent’ when it is not co-residing. Co-residence occurs when there is more than one economic unit in the household (US only); 1 (in the HFCS only one economic unit is interviewed); 2 the household is multi-generational/contains extended family; the household has boarders, roommates, friends or live-in paid help. The most common case is a multi-generational household where adult children co-reside with parents.
Our main focus lies with gross housing wealth. This includes the value of the main residence and other real estate property, excluding property for business activities. Values are based on respondents’ judgement: ‘what is the value/price if you could sell it now?’ 3 Though this is no perfect measure, other indicators (for example, tax or administrative values) are also problematic as they are often out of date or pertain to a larger area and not to a property. Furthermore, we are interested in trends over time, rather than in the exact value; a trend towards ‘subjective’ overestimation would cancel out. Previous studies have proven subjective evaluations of housing wealth to produce reliable results (for example, Mulder et al., 2015).
Homeownership and inequality, owners and renters
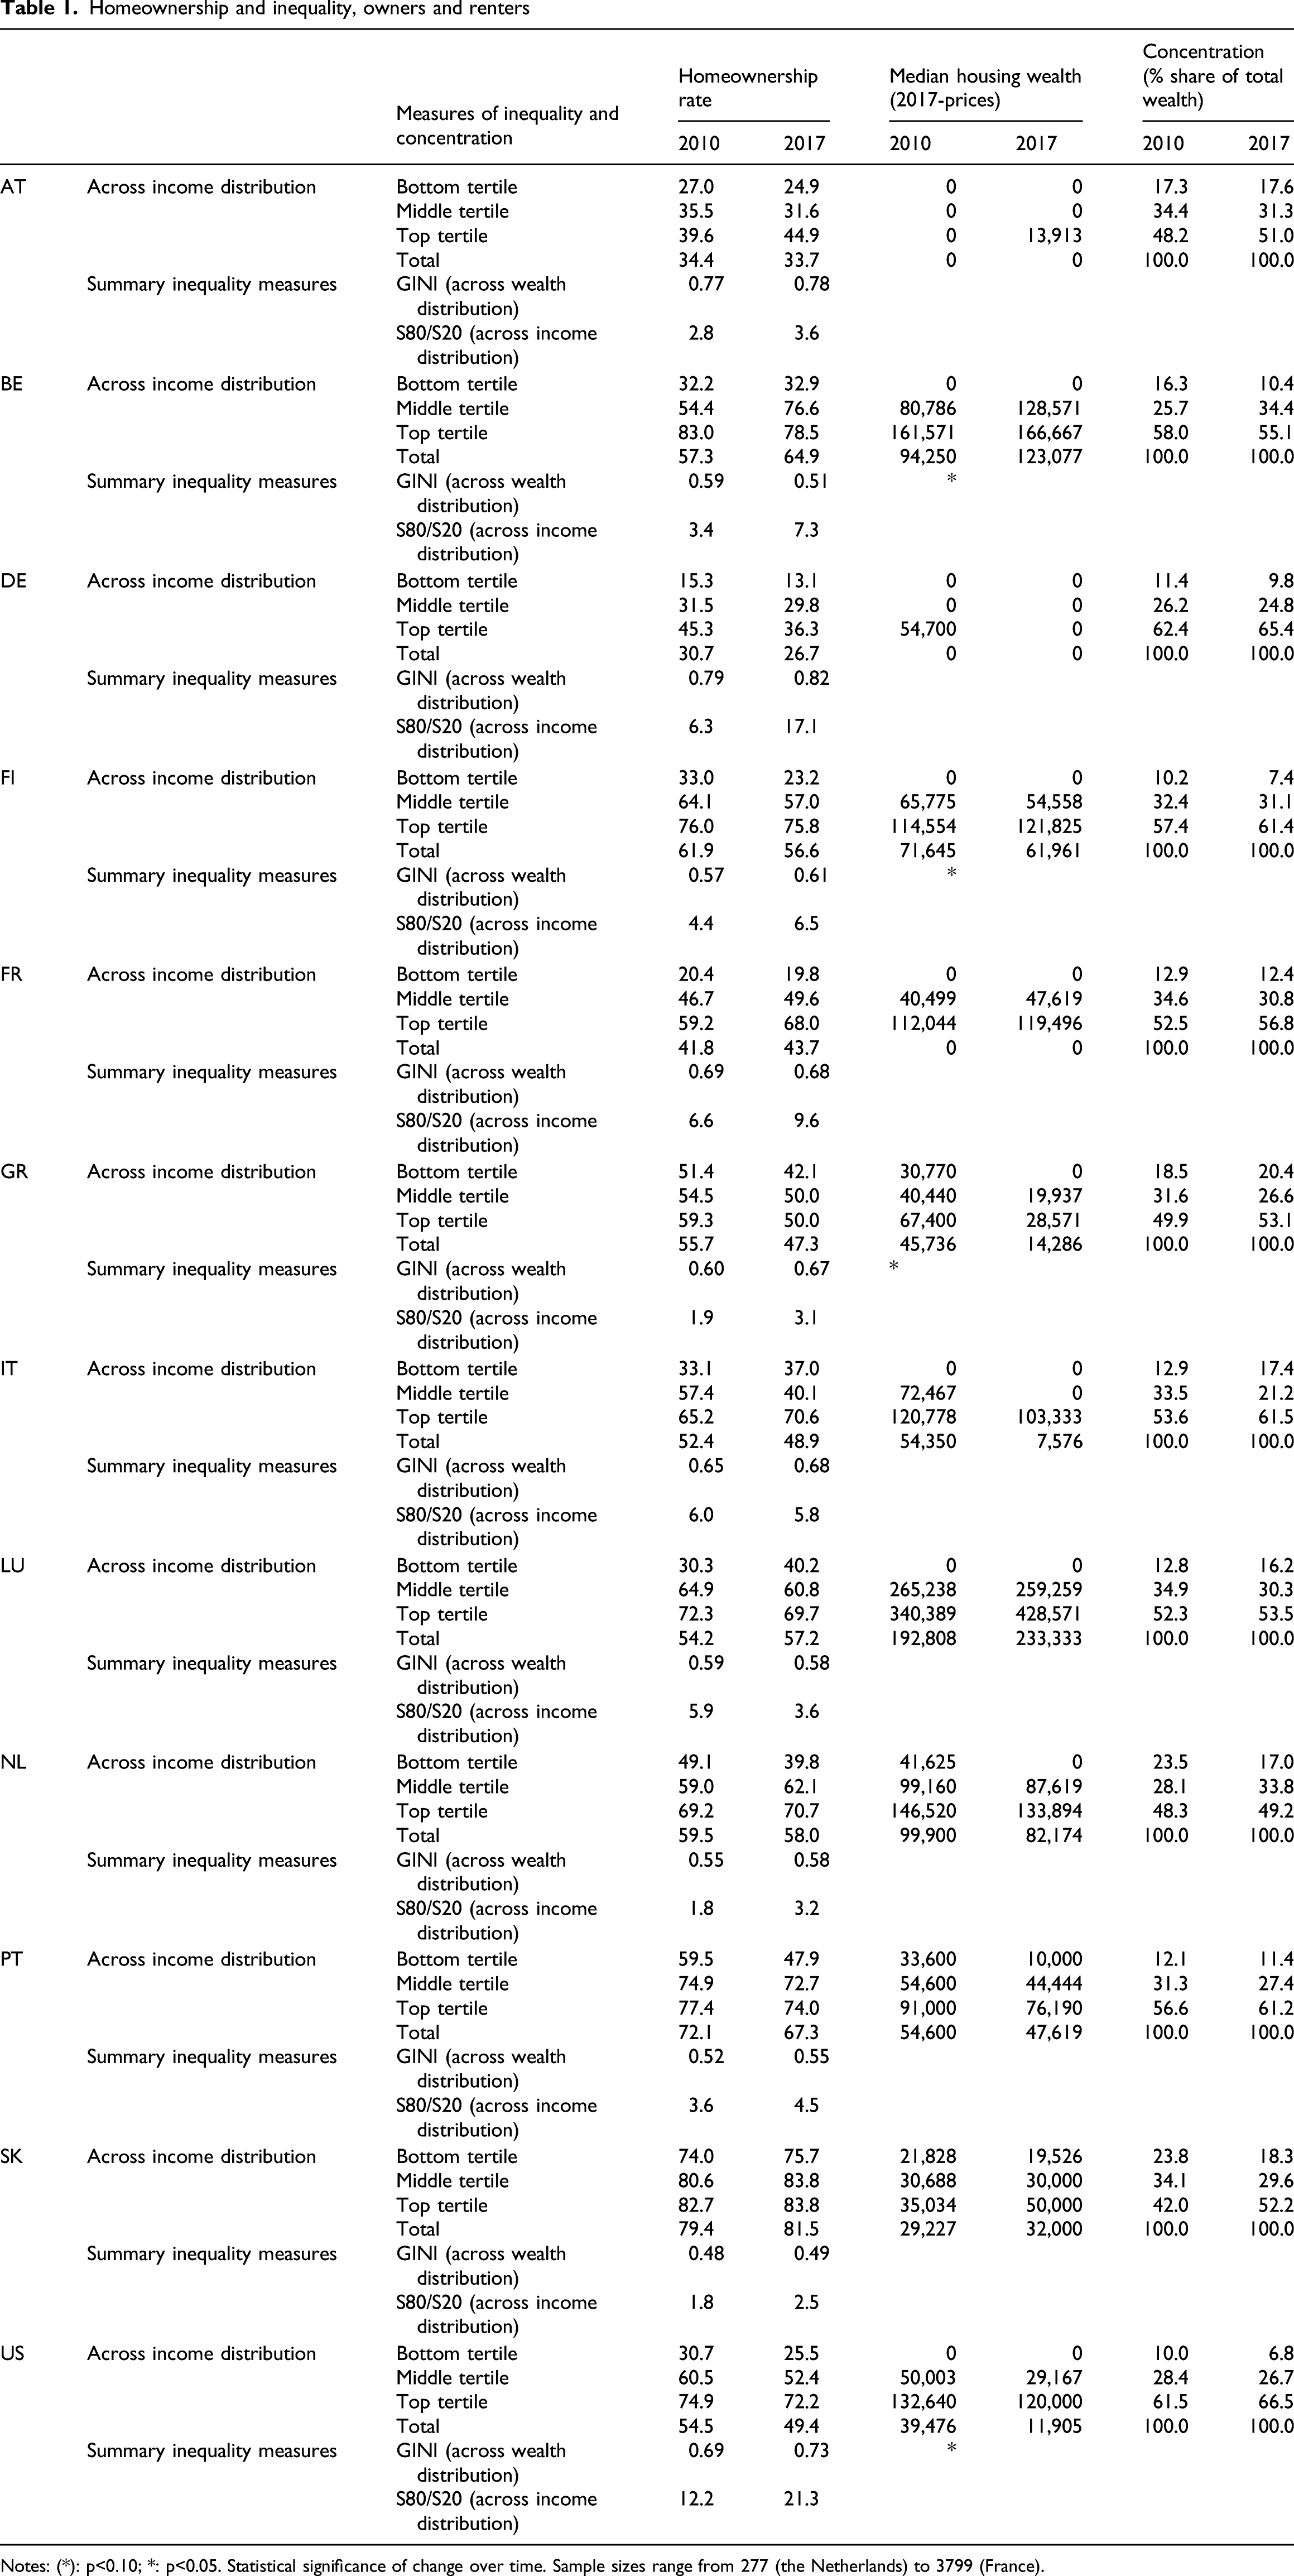
Notes: (*): p<0.10; *: p<0.05. Statistical significance of change over time. Sample sizes range from 277 (the Netherlands) to 3799 (France).
Where possible we calculate bootstrapped standard errors and provide tests of significance. Though changes may seem small and few of them reach statistical significance, our time window for assessing trends in wealth is short and sample sizes are smallish. By and large, all indicators however point in the same direction, which we consider of substantive significance.
Empirical strategy
Our approach is mostly descriptive, and we provide multiple measures and comparisons. We examine patterns and trends comparing 2017 to 2010, regarding inequality in and concentration of gross housing wealth, across both the wealth and income distributions, for a sample of all young-adult households and a subsample of homeowners. We nevertheless aim to disentangle some of the explanatory ‘drivers’ of changes in gross housing wealth. One important issue concerns the overall decline in access to homeownership and potentially increased social selectivity. We address the latter by comparing ‘initial’ 2017 results (for the sample of homeowners only) with a reweighted version that controls for changes in the income distribution of homeowners. 4 In other words, we account for the fact that homeownership potentially became more selective of higher-income households. Patterns and trends could additionally be explained by differential house price developments linked to housing type and location. Unfortunately, only HFCS contains information on the size of the main residence. We nevertheless also compare 2017 results with a reweighted version that additionally controls for trends in the size of housing across income bands. 5 We then assume that any substantive trend still discernable after these simulations might reasonably be caused by differential value developments by, for example, location. In a final step, we correlate ‘substantively significant’ trends at the country-level with some often-used macro-level indicators pertaining to the employment position of young adults (the ‘social selection’ driver, see below), as well as some housing market indicators commonly associated with turmoil before and after the GFC (the ‘housing market configurations’ driver).
Navigating the housing market in post-crisis times
Housing wealth trajectories of young adults during the post-crisis period are influenced by various factors. Next to overall volatility of different asset types, two important contributing factors concern changes in the selection into homeownership, and differential decreases or increases in house prices. The first is largely a question of which households have access to homeownership. The second is largely a question of which/whose housing assets gain and lose value.
Social selection: young adults’ access to homeownership
After the GFC, trends in labour markets combined with mortgage and housing market developments. Notwithstanding variation between countries with similar institutional arrangements, young adult homeownership declined across western societies (for example, Cigdem and Whelan, 2017; Dewilde, 2020; Flynn, 2020; Lennartz et al., 2016). To the extent that homeownership remains the majority tenure, summary measures of wealth inequality across all young households (for example, the Gini-coefficient) might move upwards as the tenure structure shifts towards a higher proportion of renters not owning any housing wealth. When renting is the majority tenure, declining homeownership may actually contribute towards lowering inequality across the wealth distribution. Declined access to homeownership however intersects with socio-economic position, which may contribute to increased inequality and concentration of gross housing wealth when considered across the income distribution.
Such social selectivity also partly drives trends in inequality and concentration across the sample of homeowners, that is, when ‘better placed’ young adults increasingly own higher-value housing. As indicated before, young-adult homeownership across Europe became increasingly stratified by education (Dewilde, 2020), which could be linked with tighter mortgage restrictions following the GFC. Declining homeownership opportunities are furthermore argued to spur family assistance (for example, gifts, loans or co-signing of mortgages) (Flynn and Schwartz, 2017; Mulder et al., 2015). Evidence across different contexts points at the contribution of such intensified intergenerational support towards increased social selectivity (Christophers and O’Sullivan, 2019; Cigdem and Whelan, 2017). As such support is associated with young adults’ income position, 6 we expect that the increased selection into homeownership of fewer households over time, but with a comparatively stronger economic profile, partly explains increased inequality and concentration of gross housing wealth across the wealth and particularly the income distribution.
Housing market configurations: uneven capital gains and losses affecting housing wealth of young adults
Changes in the inequality and concentration of housing wealth along the wealth and income distributions are not only driven by which households have access to homeownership but also by potentially uneven housing market developments affecting the value of housing, especially in turbulent times. Different literatures are not easily integrated. A common finding regarding financial wealth has been that prosperity is associated with increasing wealth inequality, while inequality tends to decrease during economic downturns (Keister and Moller, 2000). Housing as a ‘middle-class’ asset is, however, influenced by dynamics on housing rather than financial markets. From real estate-type research, often based on the analysis of price trends of housing of different types, one might also expect a decline in the inequality and concentration of gross housing wealth. 7 Larger housing in the luxury segment (for example, villas, where higher-wealth/-income households live) tends to experience stronger price declines during a recession and also picks up in house value later and at a slower pace when the economy improves. Because during a recession more middle- and higher-income households look for better-affordable properties (where lower-wealth/-income households normally live), one would furthermore expect that demand pressure on and price competition for lower-end properties increases. 8 For Flanders, for instance, Vastmans (2016) reports that since 2000, sale prices of houses on smaller plots have increased markedly more strongly compared to prices of housing on large plots. Though this could result in decreasing wealth inequality (particularly across homeowners), it was impossible to link these administrative data to the (income) profile of the buyers, so that intersections between selection into homeownership and value developments of different property types could not be accounted for. Nevertheless, we might infer that inequality in the distribution and concentration of housing wealth of homeowners may have decreased as those at the bottom end might have lost less and/or gained more during the post-crisis period of house price decline and recovery, compared with those at the higher end of the wealth and income distributions, who may have lost more and/or gained less.
Rather than on housing size/type, in regional and urban studies the focus lies with ‘location, location, location’. While cross-national surveys strongly focus on national arrangements, when it comes to inequality and (housing) wealth, regional, urban–rural and neighbourhood differences might be more influential. To the extent that different social groups live in more or less ‘rewarding’ locations (neighbourhood gentrification/decline), or navigate the housing market (residential mobility) in more or less profitable ways, housing market dynamics create uneven capital gains and losses, and consequent divergence in housing wealth accumulation trajectories. While some older studies found capital gains to reduce inequalities generated in the labour market (for example, Saunders, 1990), recent research found house price gains to be more likely for those in favourable socio-economic positions. Using population-wide register and neighbourhood data for Sweden, Wind and Hedman (2018: 625) established that housing wealth gains and loss are unevenly redistributed towards high-income native Swedes, who, in a context of strongly increased socio-spatial segregation, ‘use their economic and social capital to navigate the housing market in a more profitable way’. Similar findings have been reported for the US, where racial differences stand out. Newman and Holupka (2016) find that during the 2000s black first-time homebuyers did not profit from capital gains during the boom, while experiencing severe loss following the GFC; these differences mainly come about because black households purchased in predominantly black, less rewarding, neighbourhoods. Weighing up different factors influencing the value of housing, we would thus expect that during the period under consideration, low-income households lost ground while high-income households gained in terms of gross housing wealth. Depending on the nature of the intersection between housing wealth levels and aspects of socio-economic position, increased inequality could also be evident when looking only at the housing wealth distribution.
Overall expectations and potential cross-national differences
From the above, we might thus expect increased inequality and concentration of housing wealth during the post-crisis period. Such a trend across the total sample of young-adult households likely comes about from declined as well as more selective access to homeownership. Among homeowning households only, a similar trend most likely results from a combination of increased social selectivity versus differential – uneven – gains and losses in the value of houses owned by low-income/wealth versus high-income/wealth groups.
Given that our focus on gross housing wealth abstracts from country-differences in mortgage arrangements, we mainly expect differences in housing wealth inequality in the total sample to reflect the basic distinction in the literature between so-called ‘homeownership societies’ (BE, FI, FR, GR, IT, LU, PT, SK and US) and those countries with a more regulated, affordable and attractive unitary/integrated rental market, where more (young-adult) households rent rather than own (AT, DE and NL) (for comparative reviews, see for example, Dewilde, 2020; Flynn, 2020; or Wind et al., 2017). Notwithstanding variations in housing markets, during the post-crisis period (2010–2017) house prices fell in all countries bar Germany. Around 2017, however, prices had generally recovered to pre-crisis levels; exceptions are Greece and Italy. Although it is true that house price volatility was higher in more ‘financialized’ housing markets (the Anglo-Saxon ‘liberal’ world; Spain and to an extent Portugal; and social-democratic welfare states including the Netherlands) (for example, Lennartz and Ronald, 2017; Tranøy et al., 2020), price fluctuations were even higher across eastern Europe, which is notably the least ‘financialized’ (most households own outright). In the latter, lack of new housing supply combined with increased affluence and a strong homeownership preference to produce booms and busts (for example, Lux and Sunega, 2020).
Results
Young adults’ housing tenure and gross housing wealth across Europe and the US
Table 1 provides an overview of homeownership rates, housing wealth and inequality in housing wealth for the full sample of young-adult households in each country. Five important points can be discerned: (1) the decline in young-adult homeownership is mirrored in our data; (2) inequality of gross housing wealth has tended to increase; (3) differences in tenure structures partly explain cross-country differences in the often-used Gini-coefficient; (4) examining housing wealth across the income distribution provides useful insights; and (5) there is a trend towards increased concentration of housing wealth.
We see a consistent though not universal decline in homeownership for our sample of 22–44 year-olds from 2010 to 2017 (average homeownership rates increased in only four countries: Belgium, France, Luxembourg and Slovakia). Declining homeownership was furthermore felt unevenly: across all countries, homeownership declined by an average of 2.8 percentage points in the bottom third of the income distribution, 1.4 in the middle third and 0.8 in the top third. In many cases, the bottom and even the middle tertile had zero median housing wealth in 2010. This was even more likely in 2017. The change in homeownership by tertile between the two years is correlated with the change in median wealth for that tertile (r = 0.6, p < 0.01). In other words, the bottom third of the income distribution fell out of homeownership and lost housing wealth at a greater rate than the middle, and especially the top third.
The uneven decline in homeownership across the income distribution should be associated with greater housing wealth inequality. The Gini-coefficient indeed increased in nine countries, reaching statistical significance in Finland, Greece and the US. Summary inequality measures like Gini, however, can mask sizeable changes across different sections of the income distribution, given that income and wealth only partly overlap. In other words, changes in gross housing wealth might affect wealth and income bands differently. Thus, the S80/S20, which we adapt to measure the wealth distribution across income quintiles, provides a more nuanced picture while still maintaining the simplicity of a summary measure. The S80/S20 ratio increases in 10 countries, with average ratios nearly three times higher in 2017 than in 2010.
The case of France illustrates our point that housing wealth is best deconstructed by considering it across the income distribution, and by moving beyond the Gini-coefficient. The wealth-Gini in France remained stable from 2010 (0.69) to 2017 (0.68). The S80/S20, however, indicates that in 2010 average gross housing wealth of the top income quintile was over six times higher compared with the bottom quintile. By 2017, it was almost 10 times higher. The Gini, at least when it comes to the cross-country sample, mostly picks up differences in tenure structure across countries. Indeed, there is almost a 1-to-1 relationship between homeownership rates and the wealth-Gini. Those countries with the highest homeownership rates have the lowest gross wealth-Gini and vice-versa (r = -0.96, p < 0.01 for 2017).
Given the utility of considering the concentration of housing wealth across the income distribution, we next calculate the share of the total housing wealth that each third of the income distribution holds. In eight countries in 2010, and rising to 11 countries in 2017, over half of gross housing wealth is concentrated in the top tertile. The share the top third holds ranges from a low of 42% in Slovakia (2010) to a high of 67% in the US (2017). Where the top third holds more wealth than is equivalent to its proportion of the population in every country in both years, in no country does the bottom third approach an amount equivalent to its proportion of the population. The share ranges from a high of 24% in the Netherlands (2010) to a low of 7% in the US (2017). In other words, where the Gini remained more stable in many countries (an overall upward, but small trend) during the post-crisis period, housing wealth became increasingly concentrated within households at the top of the income distribution at the expense of households at the bottom. This can be seen with both the S80/S20, and by examining wealth concentration by income tertile.
While Table 1 enables us to see the full profile of housing market entrants by considering owners and renters, these changes are mainly driven by trends in homeownership rates. Moreover, both social selectivity and housing market configurations could plausibly explain the dynamics that we see, that is, those with higher socio-economic profiles were better equipped to remain in or enter the housing market, which itself saw price volatility as well as presumably differential price gains and losses by location and housing type. We can better unpack these two possibilities by narrowing our sample to homeowners only.
Changing housing wealth of homeowners and potential drivers
What does the wealth distribution look like for the subsample of homeowners? The overarching finding is that inequality in and concentration of wealth increased from 2010 to 2017. This is reflected in each of our four summary measures: the wealth-Gini (eight countries), the P90/P50 (seven countries), the P10/P50 (10 countries) and the S80/S20 (nine countries). Figure 1 illustrates this shift for the three ratio measures. Cross-country changes in inequality, 2010–2017.Note: 2017 (1) – constant income distribution.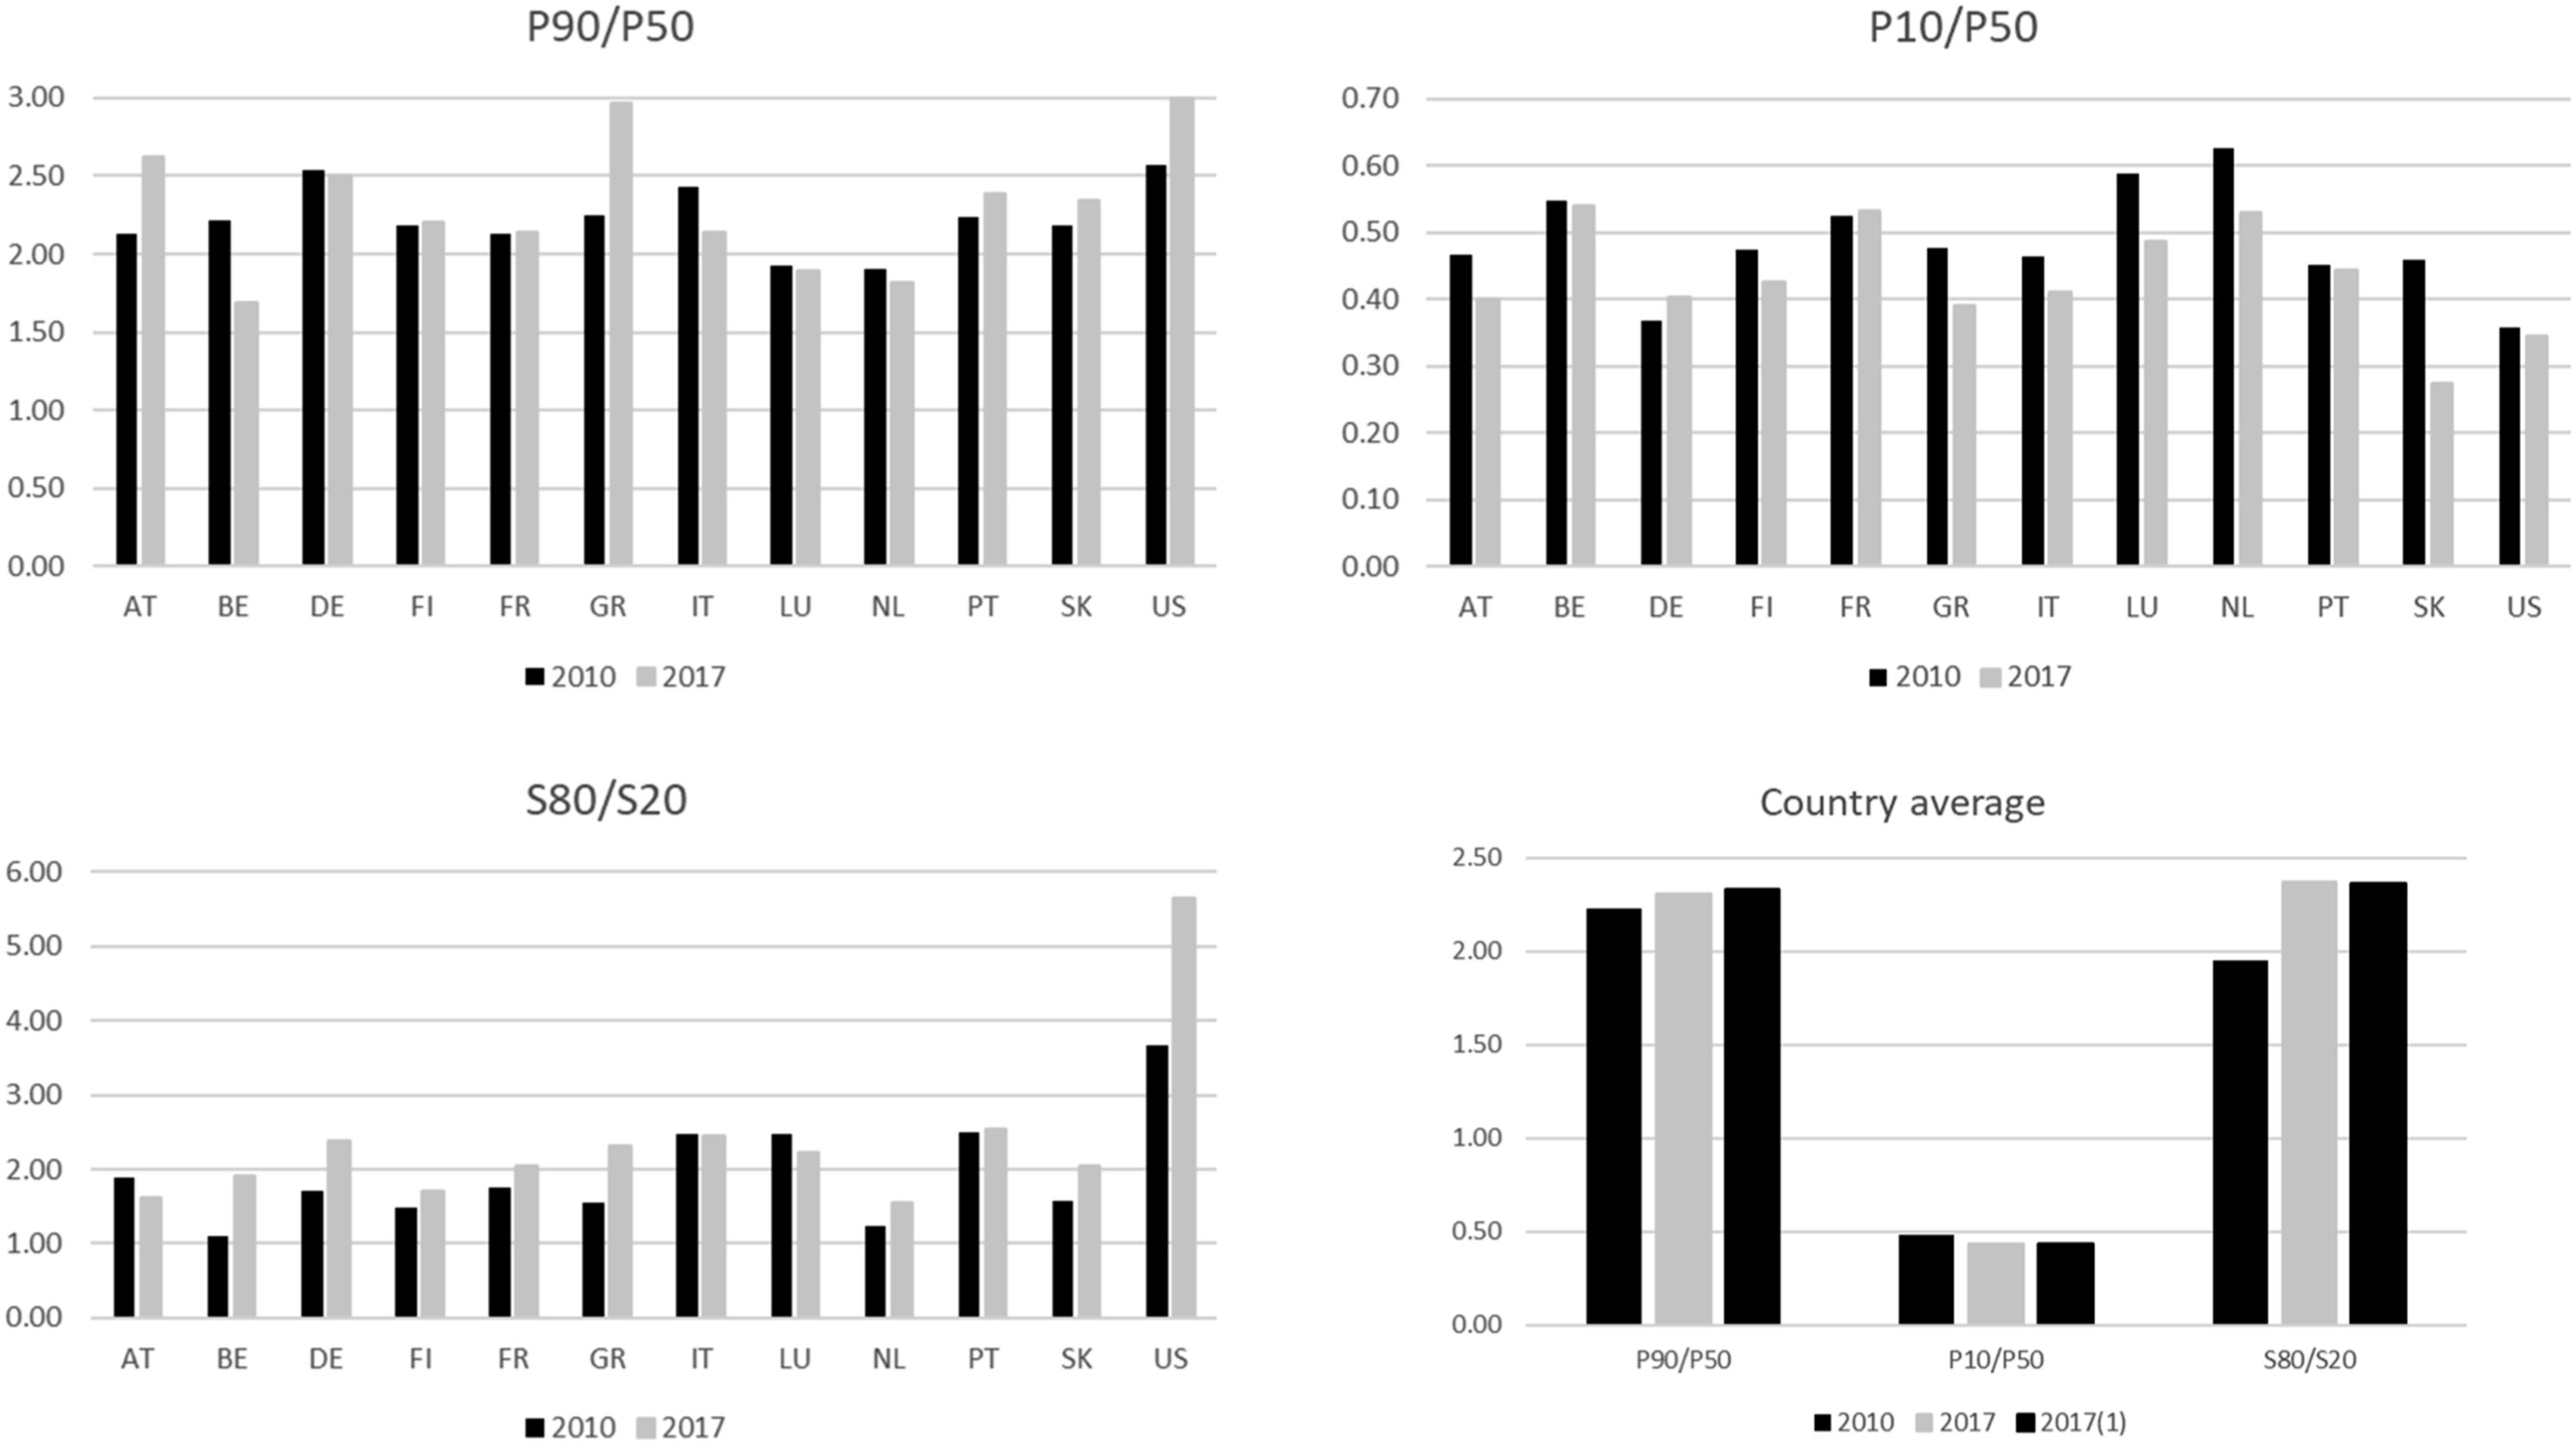
Across the summary measures, few of the changes are statistically significant (see Supplementary Appendix A1 for full results). Considering, however, our short time range, small samples and the similar trend across each measure, we consider the trend as substantively meaningful. This is especially true when we project it into the future, as disparities in housing wealth will likely further increase over time.
Summary measures for homeowners reflect less inequality as compared to the full sample. This is logical: all renters, and thus all households with zero housing wealth, are excluded from the analysis. Shifts are especially large for countries where a majority of households rent. The wealth-Gini in Germany, for instance, is halved when considering the subsample of homeowners versus the full sample. This underscores the need to interpret the Gini-coefficient and other summary measures with caution and in context when considering housing wealth. Moreover, all the changes we consider here only include the group that has been most successful in moving up the housing ladder; small changes should therefore not be overlooked.
Moving beyond single summary statistics, Figure 2 illustrates how the concentration of gross housing wealth has shifted for homeowners across income tertiles in each country. Housing wealth held by the top third of the income distribution increased by 3.8 percentage points on average from 2010 to 2017, increasing in every country except for Belgium and ranging from slight to sizeable (for example, a 0.6 percentage point increase in the Netherlands versus 9.9 percentage points in Slovakia). The increase comes on top of already high concentration: as in the full sample, the top tertile holds on average more than half of all housing wealth (53.4% in 2010 and 57.2% in 2017). And just as in the full sample, the wealth held by the bottom tertile does not reflect its population share (15.0% held in 2010 vs 13.7% in 2017). Changes in concentration of gross housing wealth.Note: 2017 (1) – constant income distribution; 2017 (2) – constant income distribution + size of main residence.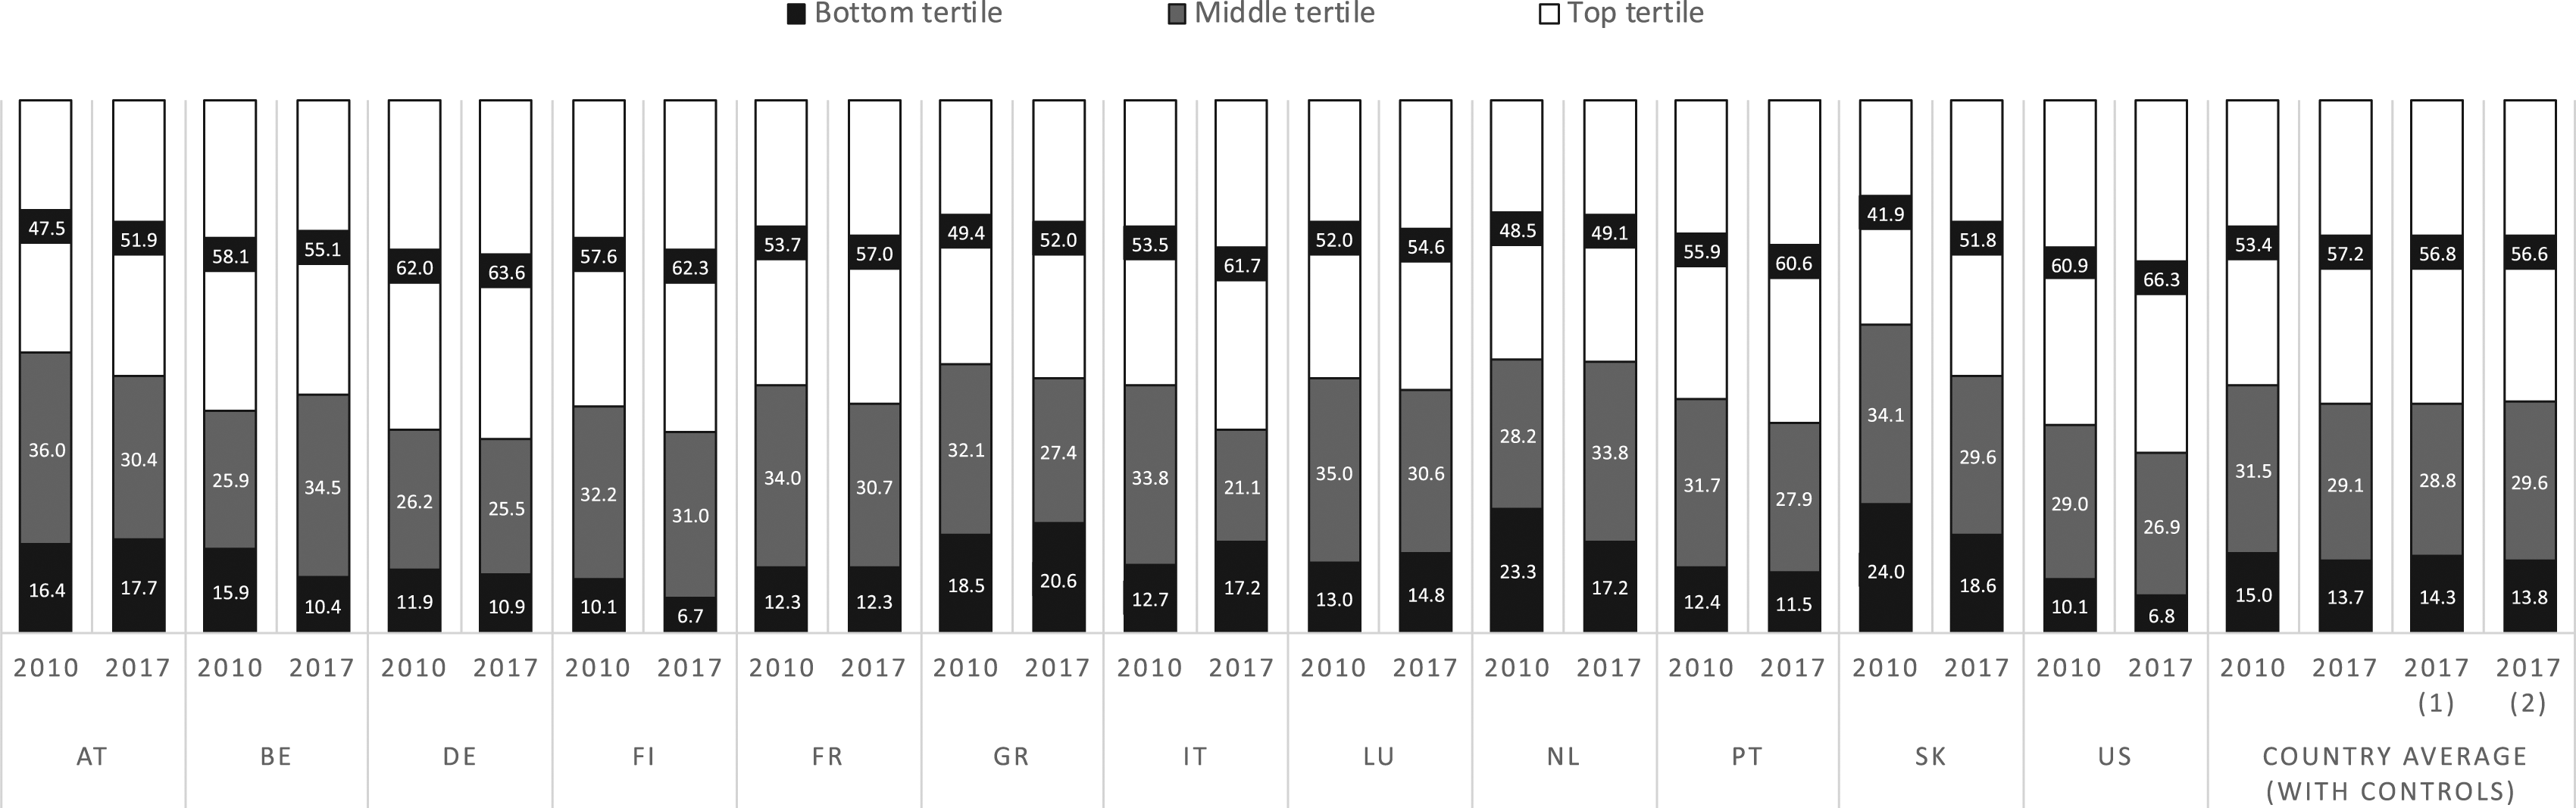
Increased concentration in the top tertile could correspond with a decrease in the bottom third only (a case where ‘the worst off suffer the most’), the middle third only (a case of ‘a hollowing-out of the middle class’), or both (a case where ‘the best off are the only group to prosper’). Only the Netherlands fits into the first case (in Belgium, the bottom tertile loses out, but so does the top tertile). We also note that across countries, the Netherlands has one of the most equal distributions of wealth concentration across the three income bands, and it remains comparatively more equal even with the decline in wealth at the bottom. The other countries are split evenly between the other two cases. Austria, France, Greece, Italy and Luxembourg experienced a hollowing-out of the middle. In the most extreme case of Italy, the middle third held 33.8% of the wealth in 2010 but only 21.1% in 2017. Germany, Finland, Portugal, Slovakia and the US experienced a similar decline in both the first and second tertile, indicating gains were fully concentrated at the top of the income distribution.
Could this increased concentration simply be a function of increased social selectivity into homeownership, where a smaller but better-resourced group of households purchase housing while the remainder seek housing in the rental market or remain in the parental home? Could it also be a function of a bundle of housing market characteristics that enable some housing types to grow in value faster than other types? The first of these potential explanations can be assessed by comparing the actual changes over time with a counterfactual: what would the change have looked like if homeownership across the income distribution had remained as it was in 2010? In this way, we control for the possibility that increased housing wealth concentration among homeowners is merely due to the fact that homeownership became more selective of higher-income households. To the extent that over time differences disappear, the selectivity explanation holds more weight.
Our second potential explanation pertaining to differential and potentially uneven housing value developments is harder to grasp because we only have information on housing size (and not on housing type or location) for 10 out of 12 countries. We nevertheless estimate a second counterfactual that tries to capture selectivity in terms of both income and housing size; changes in the latter might be related to ‘de-concentration’, for instance when middle- and higher-income young-adult households, given pressure on income, employment and housing affordability, look towards smaller properties of lower value. While we expect the first set of counterfactual results to display a less intense trend towards inequality and concentration of housing wealth compared with the original results (given that social selectivity based on income is accounted for), the second set of counterfactual results might display a somewhat more intense trend towards inequality and concentration (given that trends in housing size of different income bands are additionally taken into account).
The last four bars of Figure 2 control for each of these two possibilities, showing results for all countries combined (see Supplementary Appendix A1 for full results). Interpreting the adjusted values is best done by examining the difference of the difference. On average across countries, the social selectivity explanation accounts for 0.4 percentage points of the 3.8 percentage point difference, or 11% of the total change across the two years in the top quintile. It accounts for 0.6 percentage points of the 1.3 percentage point difference, or 46% of the change across the two years in the bottom quintile. In other words, social selectivity seems to account for more of the change at the bottom of the income distribution, as those with a lower economic profile fall out of homeownership, than it does at the top.
Additionally controlling for size of the main residence only has a minor impact on the averaged results across countries, with more variable country-specific changes underneath. Though it is the case that in all countries but Slovakia top-tertile households are less often found in ‘large housing’ versus ‘small housing’ in 2017 than in 2010 (results not reported), we are unable to pick up variable price changes of different types of housing with the limited information at our disposal. Much is therefore left unexplained. As such, and to assess future ways to account for the changing nature of wealth concentration, we consider the role of housing market volatility and other macro-level indicators in our final analysis.
Macro-relationships in housing, employment, and housing wealth inequality and concentration
Moving up a level we consider how each of our measures of inequality and concentration for homeowners relate to three country-level indicators: changes in mortgage depth and mortgage market turmoil (an index reflecting change in debt to GDP ratio, 2009 to 2016 and mortgage debt in 2009, the highest point for mortgage debt in many countries); 9 changes to employment structures (changes in the unemployment rate of 25–54 year-olds 2010–2017); and a measure of house price volatility (the absolute sum of the highest yearly real house price increase and the highest yearly real house price decrease from 2005 (the high-point of house prices in many countries up to the GFC) to 2017). Many of these correlations are not statistically significant, which is unsurprising given an N of 12, but some do meet traditional levels of significance (see Supplementary Appendix A2 for full results), and additionally trend in the way we would expect.
The correlations represent the relationship of the changes of each measure, not the value for a specific year. Changes in the mortgage debt index are correlated with changes in the S80/S20. A positive mortgage index value indicates more turmoil and therefore more credit restrictions. A positive S80/S20 value indicates that, over time, the share of wealth at the top increased relative to the bottom. Hence, countries where mortgage access decreased experienced greater concentration of housing wealth at the top of the income distribution (r = 0.51, p < 0.1, though this relationship is driven largely by the US). Countries with greater increases in the unemployment rate have larger increases in P90/P50 ratios, meaning the wealth of the 90th percentile grew faster than the wealth of the 50th percentile (r = 0.51, p < 0.1). Countries with higher price volatility have a higher change in the concentration of wealth in the top tertile of the income distribution (r = 0.55, p < 0.1), a larger change in the decline of housing wealth in the bottom decile compared to the median (r = -0.56, p < 0.1), and larger increases in the wealth-Gini (r = 0.52, p < 0.1, although these relationships are driven largely by Slovakia). Even though these correlations are in line with – or perhaps, rather, do not contradict – our theoretical framework explaining increased inequality in and concentration of gross housing wealth, they are weak at best. Future research should either include a much wider range of countries, and/or try to develop indicators that capture the regional or local housing market dynamics that impact housing values.
Conclusion and discussion
Using representative data from comparable surveys, we explored post-crisis developments (2010–2017) in gross housing wealth inequalities among young adults in Europe and the US. Drawing on various strands of literature, we overall expected increased inequality and concentration of housing wealth, following from two potential drivers: the increased selection into homeownership of ‘better off’ young-adult households; and developments within the housing sector pertaining to differential price trends based on housing type or location, partly intersecting with socio-economic position. In order to disentangle these various influences, we approached trends in housing wealth inequality and concentration from different angles (for example, for all young adults versus homeowners only) and based on multiple measures pertaining to either the distribution of gross housing wealth itself, or its distribution across income bands.
Considering our short time frame and smallish sample sizes, it comes as no surprise that few changes are statistically significant (though some are). However, across multiple measures, a surprisingly similar and substantively significant cross-country trend towards increased inequality in and concentration of young adults’ gross housing wealth can be discerned – akin to the almost universal decline in homeownership itself and its macro- and micro-level drivers. Regarding the full sample of owners and renters, we find that those with fewer economic resources fall out of homeownership, contributing towards intensified inequality and concentration of housing wealth at the higher end of the income distribution. These patterns however persist when the sample is limited to young homeowners only, also when accounting for changes in the income profile of homeowners. Social selectivity, furthermore, seems to account for more of the change at the bottom of the income distribution, as those with a lower economic profile fall out of homeownership, than it does at the top. Together, these findings support our suggestion that increased inequality and concentration of gross housing wealth ‘at the high end’ among ‘remaining’ homeowners in most countries under consideration is most likely driven by meso- and macro-level housing market factors associated with uneven capital gains or losses, intersecting with socio-economic position. This conclusion is strengthened by the fact that a similar pattern of ‘uneven’ trends in the inequality and concentration of housing wealth can also be discerned for older age cohorts and, in fact, the general population, 10 which we plan to address in more depth in future research.
This study only made a start with exploring cross-national variations in inequality and concentration of housing wealth concentration patterns, and has several limitations. In order to abstract from country differences in mortgage finance, we focused on ‘subjectively estimated’ gross housing wealth as an approximation of the total housing wealth young adults may eventually acquire. In some countries (for example, with high outright ownership or more stable house prices) such approximations will be closer to reality than in others (for example, countries with deeper mortgage markets), where it is also less sure that highly leveraged households or low-income households with interest-only mortgages will ever own their property. We were also constrained by data limitations (for example, location and housing type) regarding our second explanatory framework putting forward the impact of uneven capital gains and losses intersecting with socio-economic position, particularly in a context of a more volatile housing market – the latter aspect is hard to capture with currently existing cross-national indicators that cannot account for regional or local housing market dynamics. Our (admittedly indirect) findings nevertheless suggest that studies focusing on country differences and trends in overall (net) wealth should start paying more attention to the contribution of housing wealth towards explaining their findings. A similar observation is made by Pfeffer and Waitkus (2021).
What does this research mean for social policy? Even though historically housing wealth – a ‘middle-class asset’ – tends to be more equally distributed than financial wealth, in recent decades housing researchers have pointed out time and again that commodification and financialization of housing provision, along with increased reliance on property assets as an ‘implicit’ form of social policy, might ultimately result in more, not less, inequality (Maclennan and Miao, 2017; Malpass, 2008). Institutional arrangements that promote a higher ‘investedness’ in the accumulation of (housing) assets, furthermore, drive a tendency towards increased concentration of those assets, not only by locking out ‘poorer’ young-adult households, but also by creating – through various channels – more stratified ‘housing wealth experiences’ for those who acquire homeownership. Other articles in this issue highlight the lowered potential for wealth accumulation for important subgroups (for example, Gornick and Sierminska, 2021 for single women). If we project our findings into the future and consider the many groups that are already disadvantaged when it comes to wealth accumulation, we can expect the increased concentration that we find among young people in the post-crisis period to only intensify over time. Lower potential for housing wealth accumulation may lead to greater material hardship, especially when people experience ‘disruptive’ events (Rodems and Pfeffer, 2021).
Given continued low interest rates, residential real estate will remain an important asset class in the post-crisis world. Recent house price recovery has not been led by a credit revival, and therefore indicates (partly foreign) inflows of capital from other domains to housing, contributing to demand pressure and price competition, particularly in attractive (urban) locations (for example, Rogers and Koh, 2017). Policy solutions could therefore look beyond the idea that housing is a welfare provision or that all young people need to be assisted in order to enter homeownership, for example, by subsidies or tax-favourable arrangements encouraging ‘advance’ inheritances. These solutions could create further unsustainability. More sustainable policies could focus on strengthening the (private) rental sector (for example, in terms of quality and affordability for renters, and profitability for landlords), allowing for tenure choice and building financial wealth. Alternatively, partially re-decommodifying homeownership would help to curb (socio-spatial) volatility in house values. Ryan-Collins (2021), for instance, suggests reducing the potential for speculative profits by a land value tax and regulatory reforms to banking (for example, favour ‘productive’ investments in real/local economies). Such decoupling of land and housing from global finance would be particularly beneficial for housing market entrants, as they would face less competition from other, sometimes foreign, buyers/investors with more financial power, helping them to build up housing wealth in a more level playing field.
Supplemental Material
sj-pdf-1-esp-10.1177_09589287211040443 – Supplemental Material for Post-crisis developments in young adults’ housing wealth
Supplemental Material, sj-pdf-1-esp-10.1177_09589287211040443 for Post-crisis developments in young adults’ housing wealth by Caroline Dewilde and Lindsay B. Flynn in Journal of European Social Policy
Footnotes
Acknowledgements
We thank Frank Vastmans and Peter Boelhouwer for sharing insights regarding value developments of residential real estate. We also thank two anonymous reviewers for their comments.
Declaration of conflicting interests
The author(s) declared no potential conflicts of interest with respect to the research, authorship, and/or publication of this article.
Funding
The author(s) disclosed receipt of the following financial support for the research, authorship, and/or publication of this article: This study is supported by Fonds National de la Recherche Luxembourg (FNR-ATTRACT project 14345912).
Notes
Supplementary material
Supplementary Material for this article is available online.
References
Supplementary Material
Please find the following supplemental material available below.
For Open Access articles published under a Creative Commons License, all supplemental material carries the same license as the article it is associated with.
For non-Open Access articles published, all supplemental material carries a non-exclusive license, and permission requests for re-use of supplemental material or any part of supplemental material shall be sent directly to the copyright owner as specified in the copyright notice associated with the article.