
Abstract
Climate change and rapid depletion of the environmental resources pose critical threat to world economies, particularly to those who are heavily dependent on fossil fuels. The United States (US), as one of the leading carbon emitters, requires innovative strategies that integrate technology, policy, and investment to transition toward the sustainable low-carbon economy. Against this backdrop, this study examines how artificial intelligence (AI), carbon pricing mechanisms, and the green investment collectively influence energy transition and long-term emission reduction pathways. The study examines US time-series data from 1990 to 2022 using a combination of econometric modeling, such as the Autoregressive Distributed Lag technique and the Augmented Dickey–Fuller test, and Bayesian neural network forecasting. According to the findings, a 1% increase in the use of renewable energy lowers carbon emissions by roughly 0.033% in the short term. Long-term estimates, assuming continued investment in carbon pricing and technological advancement, imply a 15% reduction in emissions by 2040. Furthermore, it is anticipated that over the course of two decades, AI-driven research and development integration will increase renewable energy efficiency by 18%. In addition to offering evidence-based insights for policymakers looking to align economic and environmental goals through digital innovation and sustainability policy frameworks, our findings highlight the revolutionary potential of AI in strengthening climate mitigation initiatives.
Keywords
Introduction
The ubiquitous worldwide energy demand and the leading historical significance of fossil fuels cannot be undermined; however, it changed the fate of the planet adversely. Initially boosting modernization and industrialization, the combustion of fossil fuel energy played a transformative role. 1 Unfortunately, through its usage, progress became the currency of ecological footprints, emphasizing the relationship between climate change, fossil fuel combustion, carbon discharges, and green energy markets. 2 Hence, the rapidly increasing rate of environmental change across the globe prompted demands for a swift transition toward low-carbon economy, and decarbonizing sectors including transportation and energy sector through immediate action and investment in green technological innovation. The energy sector finds itself at a critical seam in this era, being marked by the growing issue of climate change. 3 Fortunately, digital transformation including artificial intelligence (AI) has emerged as a powerful catalyst for bringing optimal solutions. The convergence of AI models with the energy sector has the potential to transform the energy landscape by offering innovative solutions for the widespread integration as well as the utilization of renewable energy (RE) sources in an economy.4,5
Carbon neutrality is the goal of achieving net zero carbon dioxide emissions or a low-carbon economy, balancing anthropogenic emissions from fossil fuels, changes in land use, and industrial production. 6 Globally, 83% of carbon gas emissions are generated through fossil fuel combustion and witnessed as the highest share. These statistics show a significant need to overcome carbon emissions in order to achieve climate neutrality which further leads to low-carbon economy. The target of a significant decline of 70% and 55% reduction in gas and oil must be achieved by 2050, respectively. The improvement in energy efficiency paves the way for the decline in the intensity of carbon gas emissions by a 4% to 10% incline in the efficient productivity of oil and gas. 7 The mitigation of carbon dioxide from the environment and to have low-carbon economy is an ongoing challenge that requires an efficient and accurate predictive model that can effectively predict the consumption of fossil fuels and optimize the solution.
Since the industrial revolution, leading countries such as the United States, China, Germany, Russia, and the United Kingdom have had a huge share in carbon emission in metric megatons following the Global Carbon Atlas updated data from 1750 to 2021. Agriculture, deforestation, and the utilization of fossil fuels are witnessed as the primary sources of these carbon emanations. 8 On the other hand, AI has opened the doors of modern transition to redefining energy systems in ways that were formerly inconceivable. By using AI's predictive and analytical capabilities along with the flexibility of Artificial Neural networks (ANNs), AI empowers the energy sector to attain elevated levels of efficiency, reliability, and sustainability. 9 This relationship encompasses not only economic sustainability but also environmentally friendly optimal solutions. It offers potential solutions to counteract the detrimental impacts of climate change and environmental degradation.10–12
In the industrializing regime, mining, drilling, and burning of fossil fuel is the major contributor to irreversible climate change, and the reliance on these resources aggravates the carbon footprints of these nations and ultimately leads to ecological degradation. 13 An increase in AI technologies is being observed to optimize resource utilization, enhance efficiency, and reduce carbon emissions. The U.S. Energy Information Administration (EIA) estimates the energy consumption and energy-related carbon gas emissions by source in 2021, indicating that petroleum has the highest consumption as well as the highest emission levels in contrast to natural gas and coal as shown in the below-mentioned Figures 1 and 2.14,15
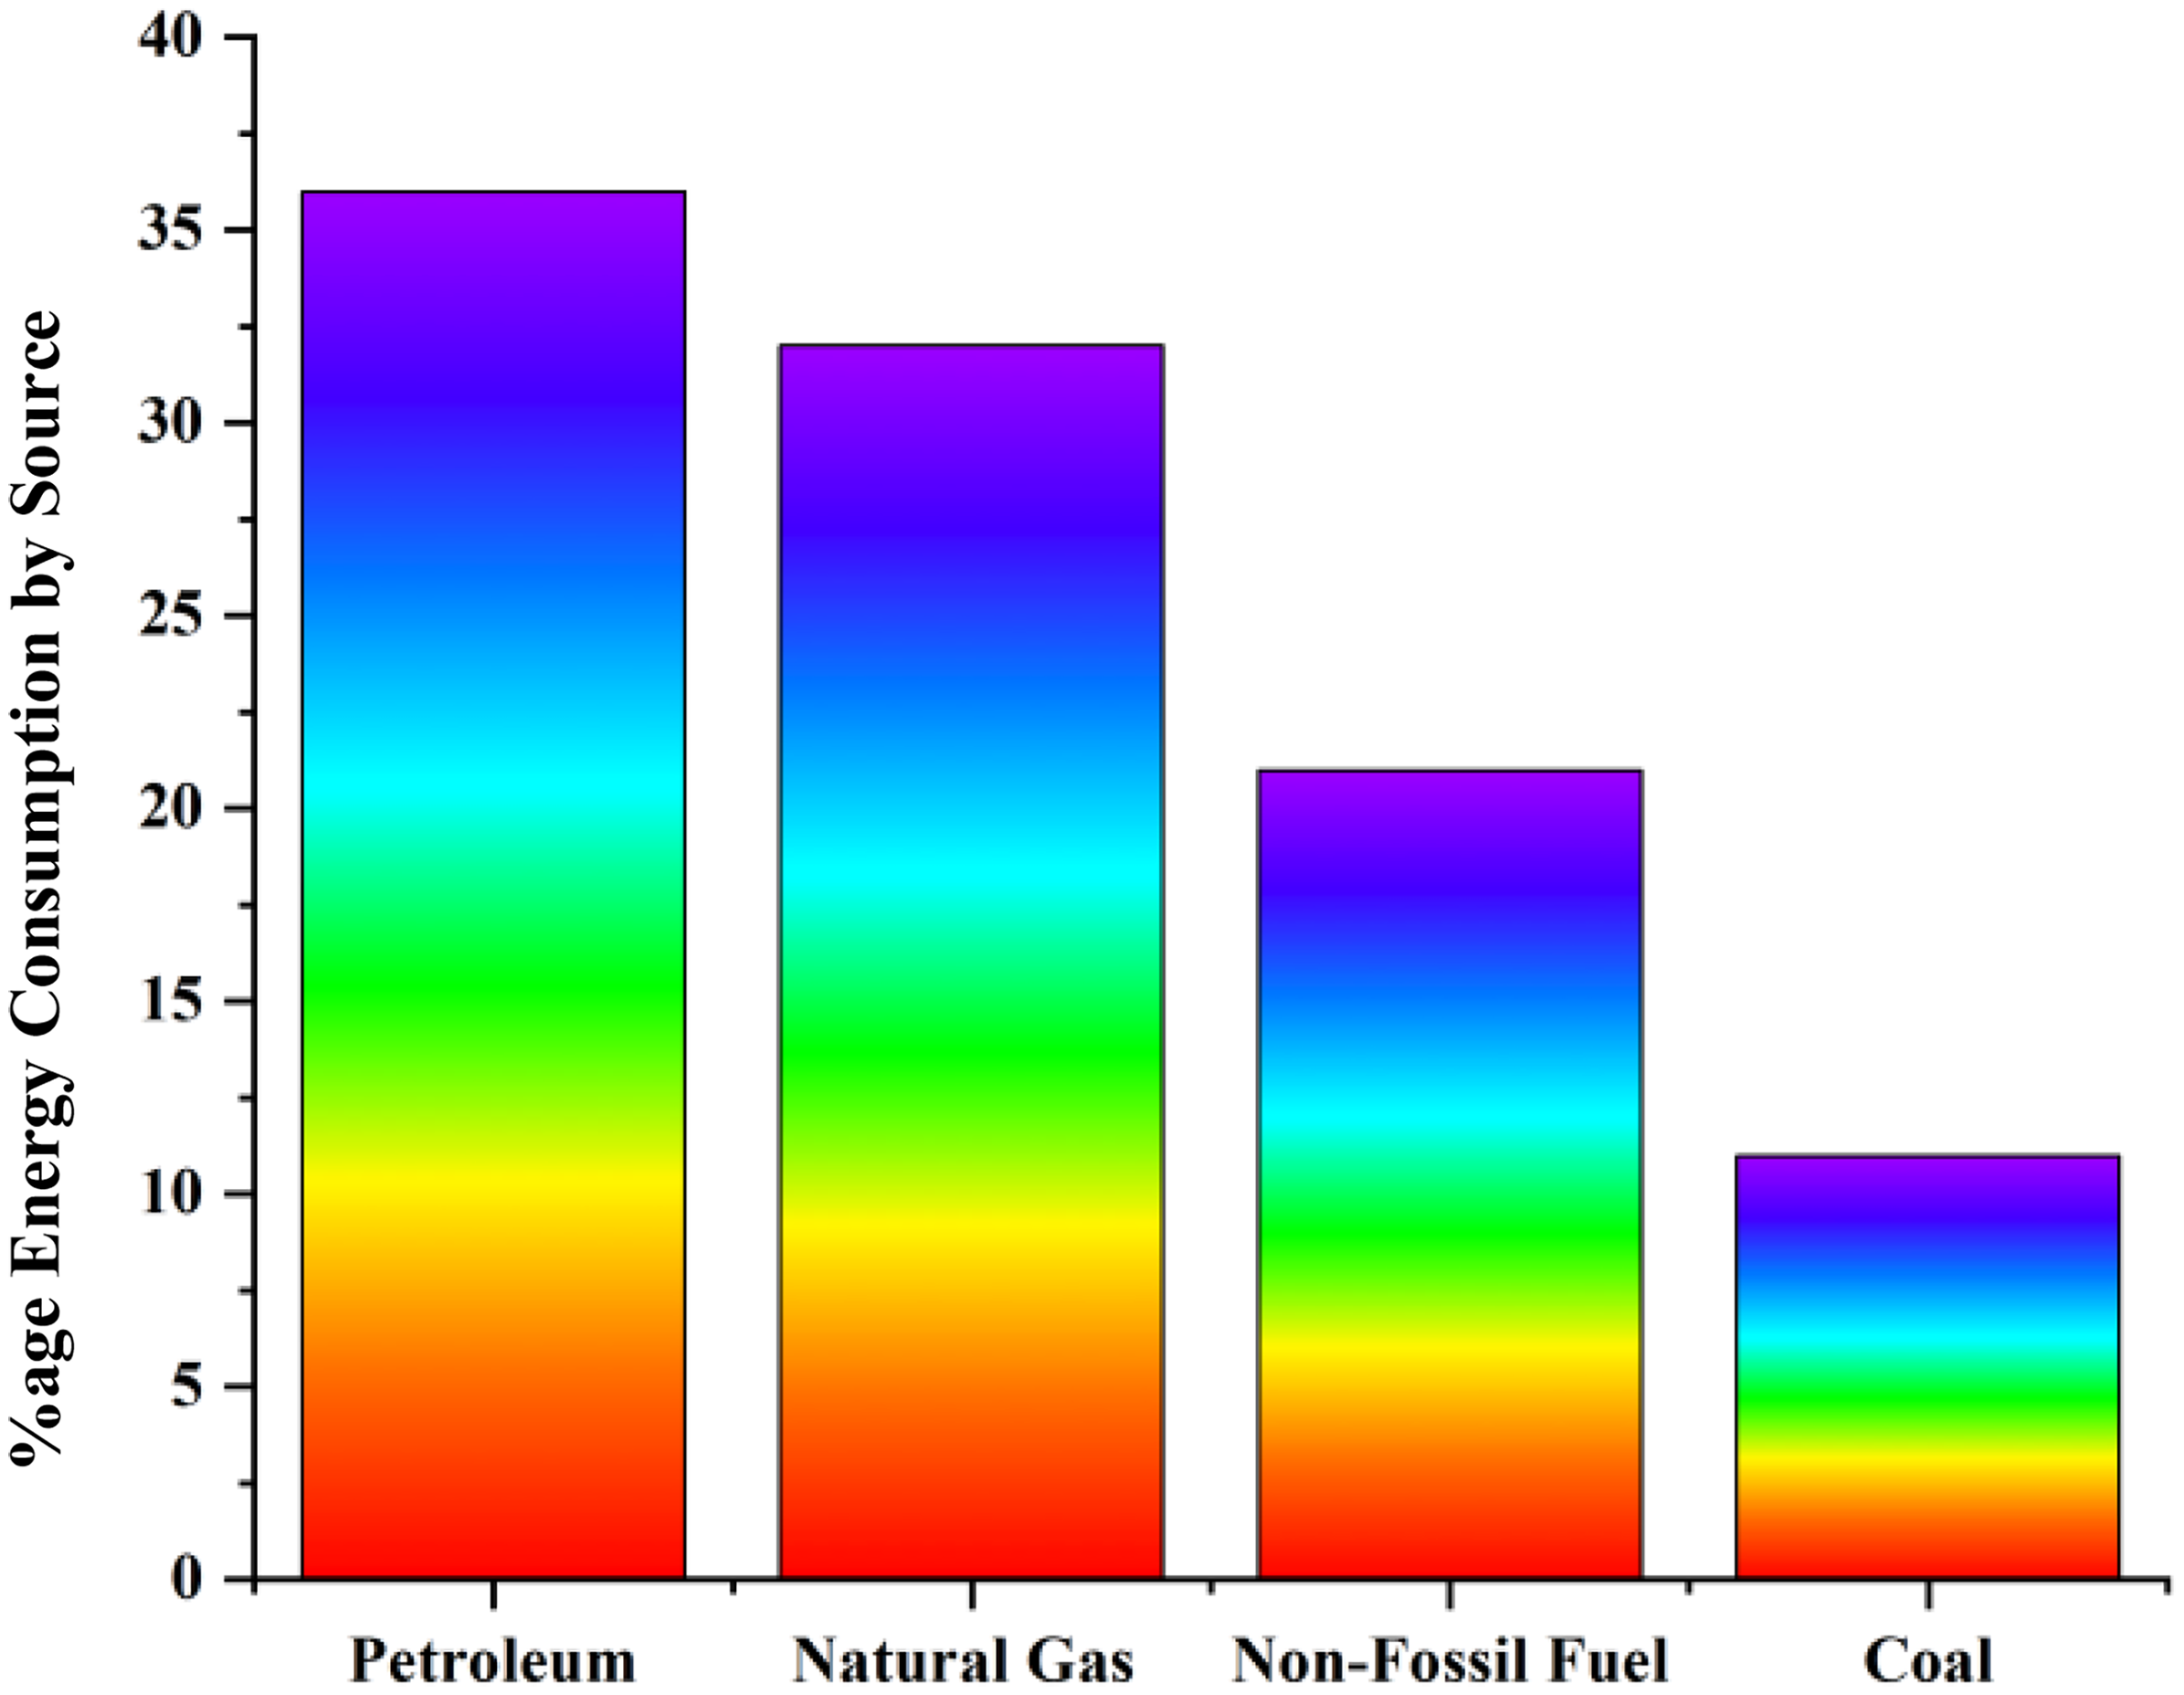
US energy consumption by source, 2021.
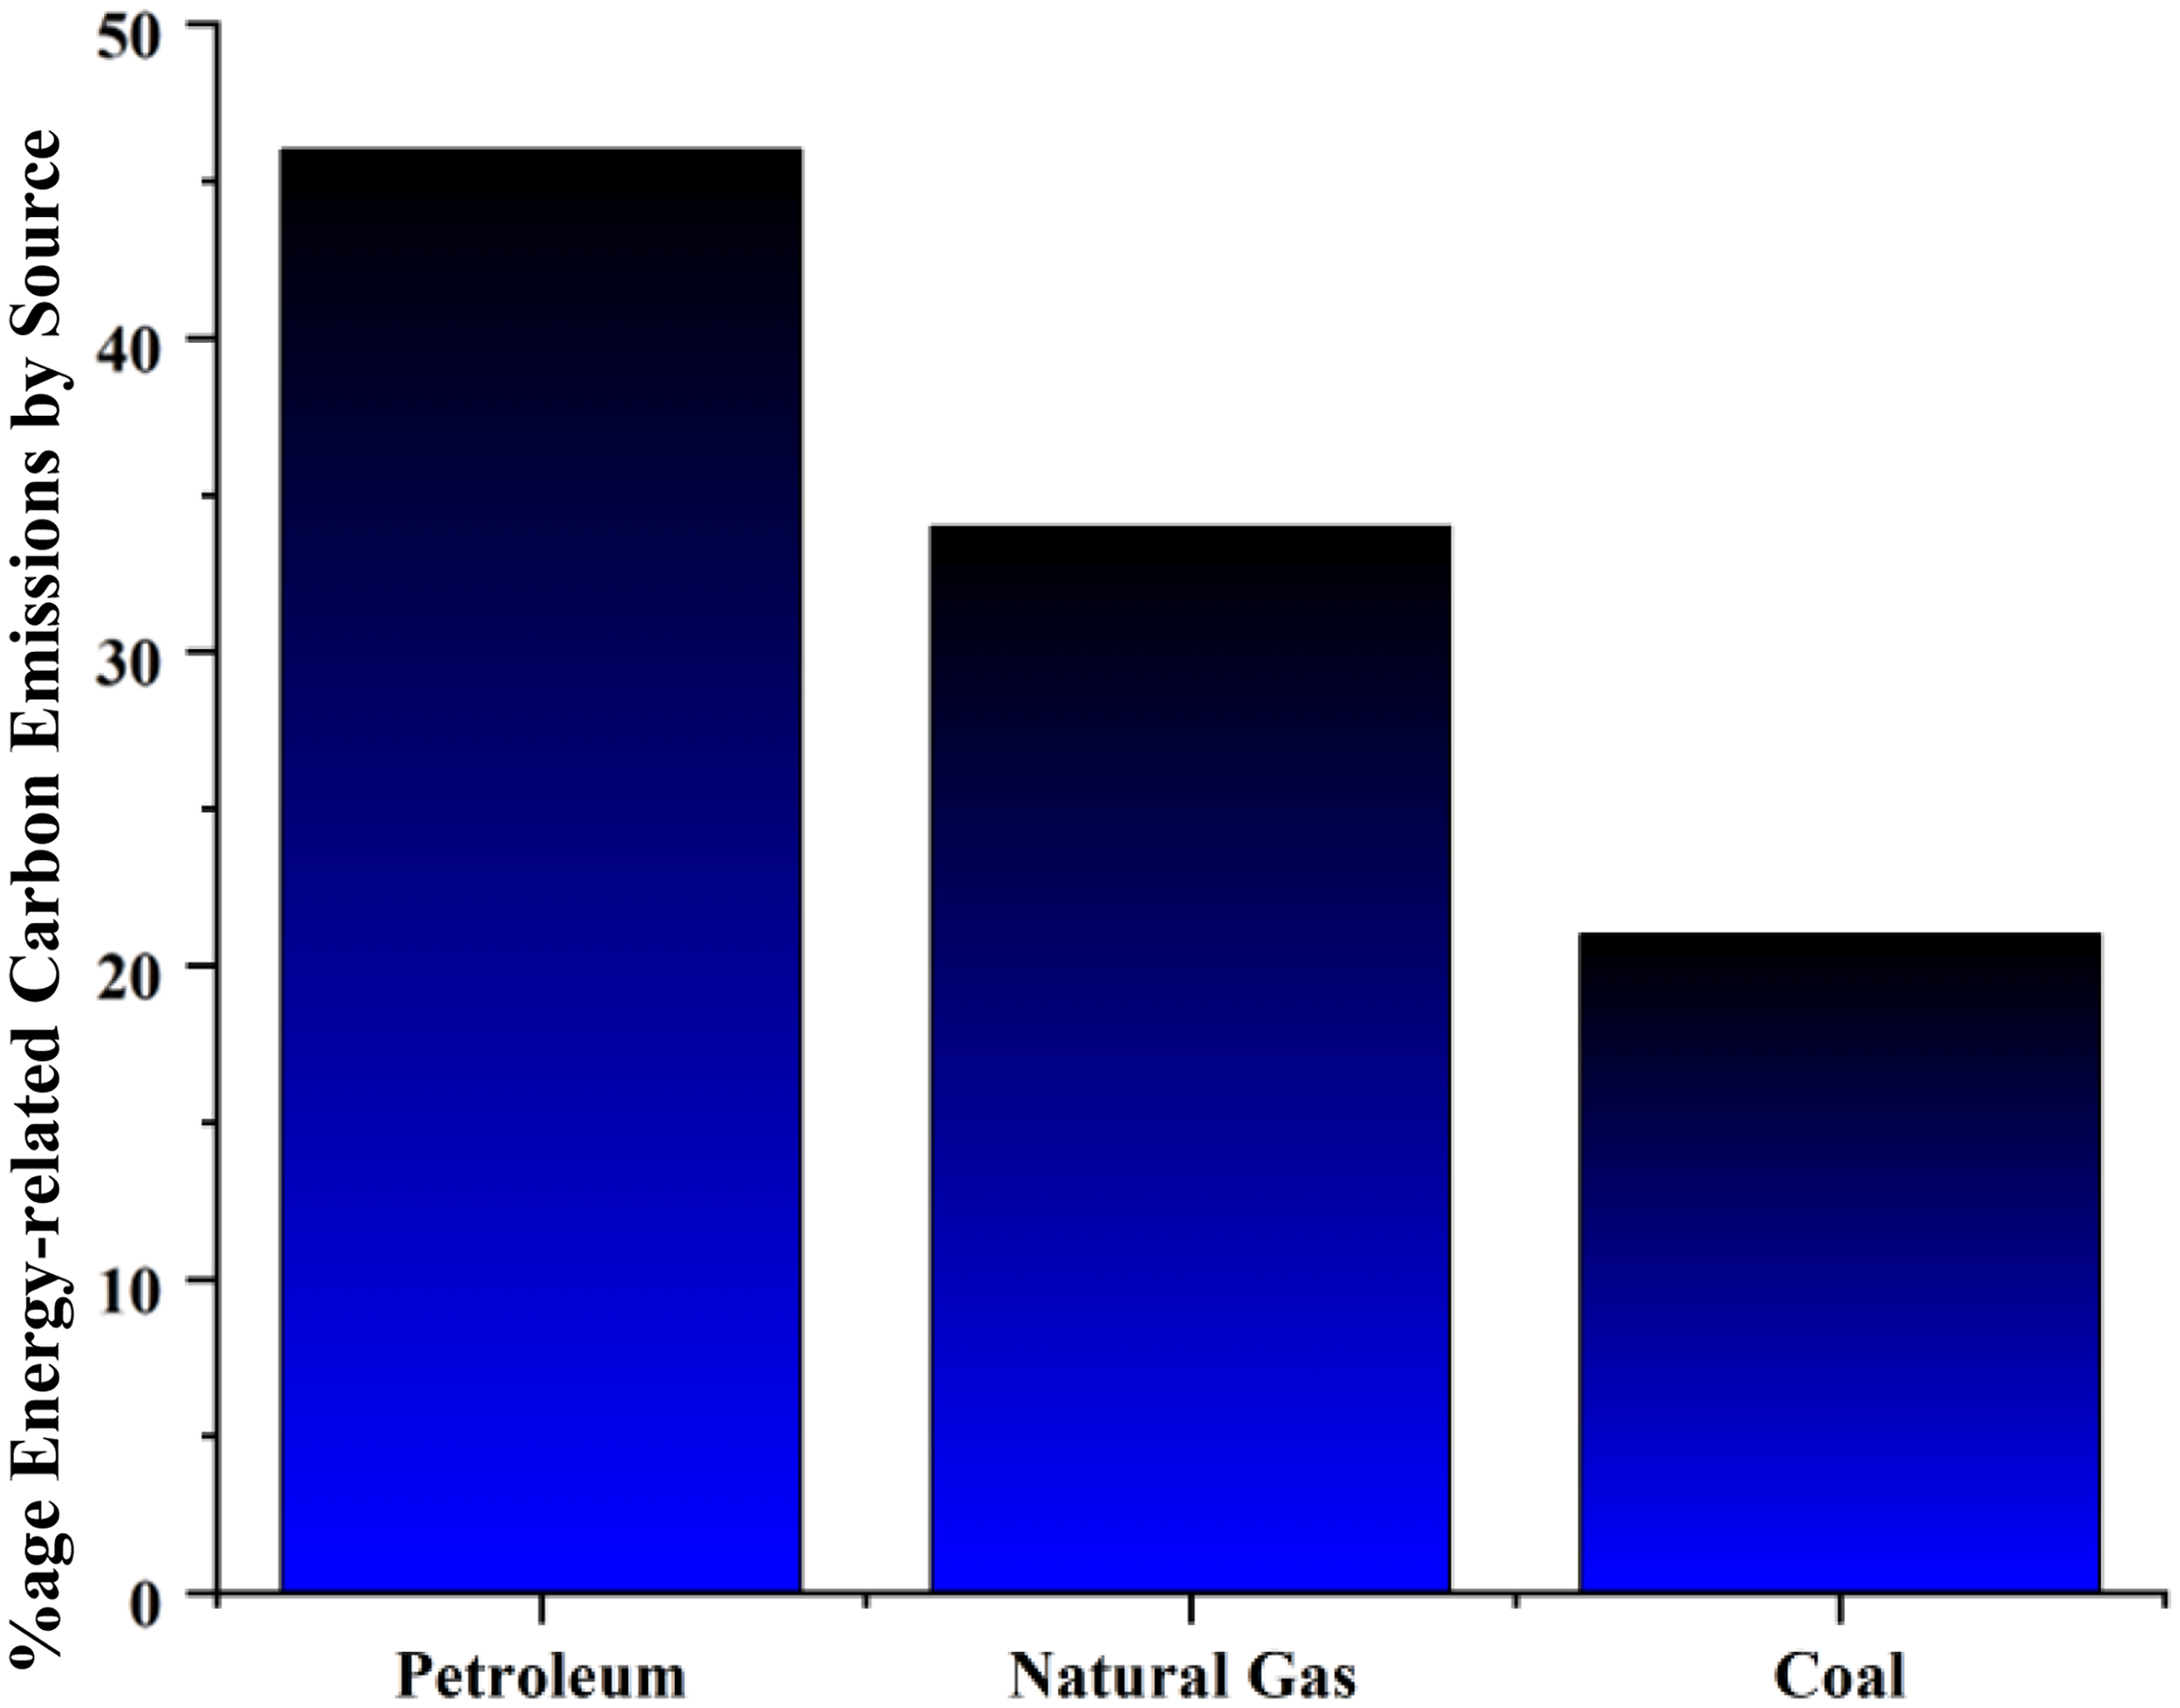
US energy-related carbon emissions by source, 2021.
However, in nonindustrialized economies, the correlation between carbon gas emissions, usage of nonrenewables, and RE is critical. Similar to the industrialized economies, the nonindustrialized economies also faced the same challenges after rapid urbanization, industrialization, and economic expansion. Based on affordability and accessibility, the usage of oil, coal, and natural gas is still the most prevalent and the major source of fulfilling the energy demand. In spite of different objectives and circumstances in comparison to their industrialized counterparts, the contribution of AI to green energy markets in these countries remains undeniably vital. 16 Hence, the situation accessed from the developed as well as developing economies shed light on both sides of the scenario that usage of nonrenewables poses hazardous and life-threatening impacts on the environment; however, renewable sources of energy act as guardians of ecological sustainability. Additionally, both industrialized and nonindustrialized nations strongly believe that AI has the potential to alter the adverse situations lingering around the globe.17,18
The UN Framework Convention on Climate Change (UNFCCC) at the Conference of the Parties (COP) 26 outlined the future goals and offered strategic goals for carbon emanations and to certify a secure environment with the agreement of all partners in Glasgow. Later on, COP27 held in Egypt had a primary objective, which was reducing the observed increase in global temperature to 1.5°C, along with reviewing the past year's success. Additionally, it was mentioned clearly in the meeting that for climate action, the timeframe is swiftly closing. Moreover, for all the stakeholders, this conference provides a golden opportunity to tackle the global challenge of environmental change effectively. 14
Additionally, for the global adoption of renewables, these energy markets have the capability to play a substantial role in minimizing technological costs, making renewables more competitive. Along with this, these markets also aim to emphasize investing in carbon-offsetting projects and sustainable technologies. Furthermore, the benefits from green energy markets are not limited to the energy sector rather, and they extend beyond this sector. 19 These markets pave the way for job creation and economic expansion along with a comprehensive and sustainable economy. Moreover, are known for eco-friendly markets significantly contribute to resource stability. Green energy markets also cater to new industries regarding the manufacturing of equipment of RE, its installation and then maintenance, as well as employment of energy storage solutions. 20 Undeniably, these green energy markets serve as a catalyst, and hence by harnessing the power of green energy markets, investors, and policymakers can craft a strong, green-oriented, and economically thriving future for successors to follow.7,21
Climate change mitigation requires significant economic changes, investment, policy intervention, and innovation. Though, environmental policies can alter economic activity and can alter supply and demand which affects prices and output. Most empirical literature suggests that investment in climate mitigation and environmental policy positively affect the economy. Similarly, RE enhances resource stability. However, the balance between technological innovation and policy regarding environmental concerns must be carefully planned to minimize potential risks. 22
Conclusively, sustainable technologies are the only promising solution for the reduction of carbon emissions. For this purpose, variants of AI and machine learning models can decrease the environmental impact and minimize the disruption in an ecosystem. Different machine learning models and their combination can also bring efficacy to reduce the volatility and intermittency of RE sources. 23
Since integrating AI into green energy systems requires a large financial outlay, it is crucial to think about the implementation's economic viability and strategic methods, particularly in various economic environments. Existing research indicates that the long-term advantages such as increased energy efficiency, lower emissions, and more precise policy targeting may exceed the initial costs, even though this study focuses on the environmental and predictive effectiveness of AI in improving carbon pricing (CP) and RE efficiency. The economic feasibility of implementing AI is still a major worry for developing nations, as disparities in technical capability and upfront infrastructure may provide difficulties. Public–private partnerships, or PPPs, can be a useful model for raising capital, distributing risk, and hastening the implementation of AI-powered sustainability technologies in these kinds of situations. These cooperative frameworks have the potential to close funding gaps, foster innovation, and guarantee that both developed and developing countries may benefit from AI in climate regulation.
Recent scholarship continues to advance our understanding of the multifaceted relationship between the economic structures, energy systems, and carbon emissions. For instance, Li et al. 24 emphasize role of the sector-specific energy intensity and AI-aided optimization in shaping the long-term emission trajectories, especially within industrial and service sectors. Their work reinforces the argument that technological innovation particularly AI, can reshape the national energy profiles through enhanced forecasting and demand-side management. Similarly, new empirical findings suggest that per-capita carbon emissions are significantly influenced by structural transformation of the economies and global trade integration. 25 These insights further underscore urgency of examining the role of AI in not only decarbonization but also in managing geopolitical and social dimensions of sustainability transitions. 26 Present study builds on these advances by integrating AI into the econometric frameworks to examine the CP, green investment, and RE optimization in the US context, thereby addressing both the environmental and digital transformation goals.
Significance of the study
Since the industrial era, the world has grappled with detrimental ecological impacts just by using non RE sources. Keeping this ongoing discourse, various economists strive hard to make diligent efforts to inspect the impact of economic expansion and nonrenewable and RE sources on carbon gas emissions. To achieve low-carbon economy and carbon neutrality, we must reduce emissions through fossil fuel replacement, CO2 capture and utilization, solid waste reuse, and energy consumption reduction and efficiency. This article explores the factors driving the shift toward a low-carbon economy. Among them, a significant volume of past empirical evidence reveals the correlation among these constructs in isolation. Some of these empirical studies try to probe the repercussions of non RE usage, income, and financial expansion on carbon emanations. After reviewing the diverse literature, certain perspectives are observed as the knowledge gaps, and none of the studies extensively explored these perspectives in the case of the United States. In contrast to the previously observed studies, this study has a profound focus on the balance between the fulfillment of energy needs and the green economy's sustainability.
The current study enriches the pool of existing empirical literature in five novel ways: firstly, its aim is to achieve a thorough understanding of the interplay between carbon emissions and the energy portfolio, incorporating both nonrenewable and renewable resource utilization. Secondly, to cover up the shortcomings of prior literature, this study tries to scrutinize the influence of energy mix (nonrenewables and renewables), low-carbon economy and green investment, both the demand and supply side of the environmental quality since it takes research and development, foreign inflows, green investment, financial literacy (FL), technological innovation, resource stability, and CP into account. Thirdly, with respect to the United States, the respective study provides a broader view of the long- and short-run impacts of under-observed variables, encompassing 1990–2022.
Furthermore, this research delves into employing advanced econometric modeling and Bayesian neural network (BNN). By doing this, the study tries to shed light on the potential of AI to reduce greenhouse gas emissions by optimizing the energy system. In addition, this study not only showcases the notable advancements achieved through AI integration but also emphasizes the pivotal role that econometric models and BNN played in quantifying the extensive impact of this partnership. Lastly, the present study addresses the significance of AI and green energy markets and their potential implications on the production and shaping of carbon-neutral environment. In addition to that, it provides suggestions, which will potentially create synergistic benefits along with the provision of better living standards, resource stability alongside low-carbon economy, and life satisfaction.
This study contributes to existing literature in three distinctive ways. First, it integrates econometric (Autoregressive Distributed Lag, ARDL) and AI-based (BNN) methods, offering the dual framework that captures both the causal dynamics and predictive accuracy an approach not previously applied in the US-specific energy transition studies. Second, it provides novel insights into how AI-driven R&D, coupled with the CP and green investment, accelerates RE efficiency and emissions reduction. Third, findings bridge short-run economic dynamics with the long-term policy forecasting, presenting practical implications for policymakers seeking to align digital innovation with the environmental sustainability. Together, these aspects establish originality of this study compared to the prior literature that often treats these dimensions in isolation.
Conceptual framework of the study
A significant amount of carbon emissions and other greenhouse gases is released when non RE sources (fossil fuels) are extracted, processed, and burned to meet the energy demand. Nonrenewables are witnessed as the major contributors to carbon gas emissions which ultimately exacerbate the planet's ecological system. As we are on the verge of an AI-fueled energy revolution, the underlying section delves into the harmonious interplay between AI, econometrics, and BNNs providing a glimpse of the future marked by increased sustainability and efficiency in the energy landscape.
Figure 3 presents the refined conceptual framework that depicted the causal pathways among environmental, financial, and policy variables using an AI-driven econometric strategy. Framework integrates two analytical modules, first is ADRL model to estimate the short- and long-run relationships, and second is BNN to enhance the predictive accuracy. Variables such as renewable energy consumption (REC), Research & Development Expenditure, the FDI (foreign direct investment), financial literacy (FL), and the CP are selected based on a theoretical justification of their influence on the energy transition and emissions reduction.
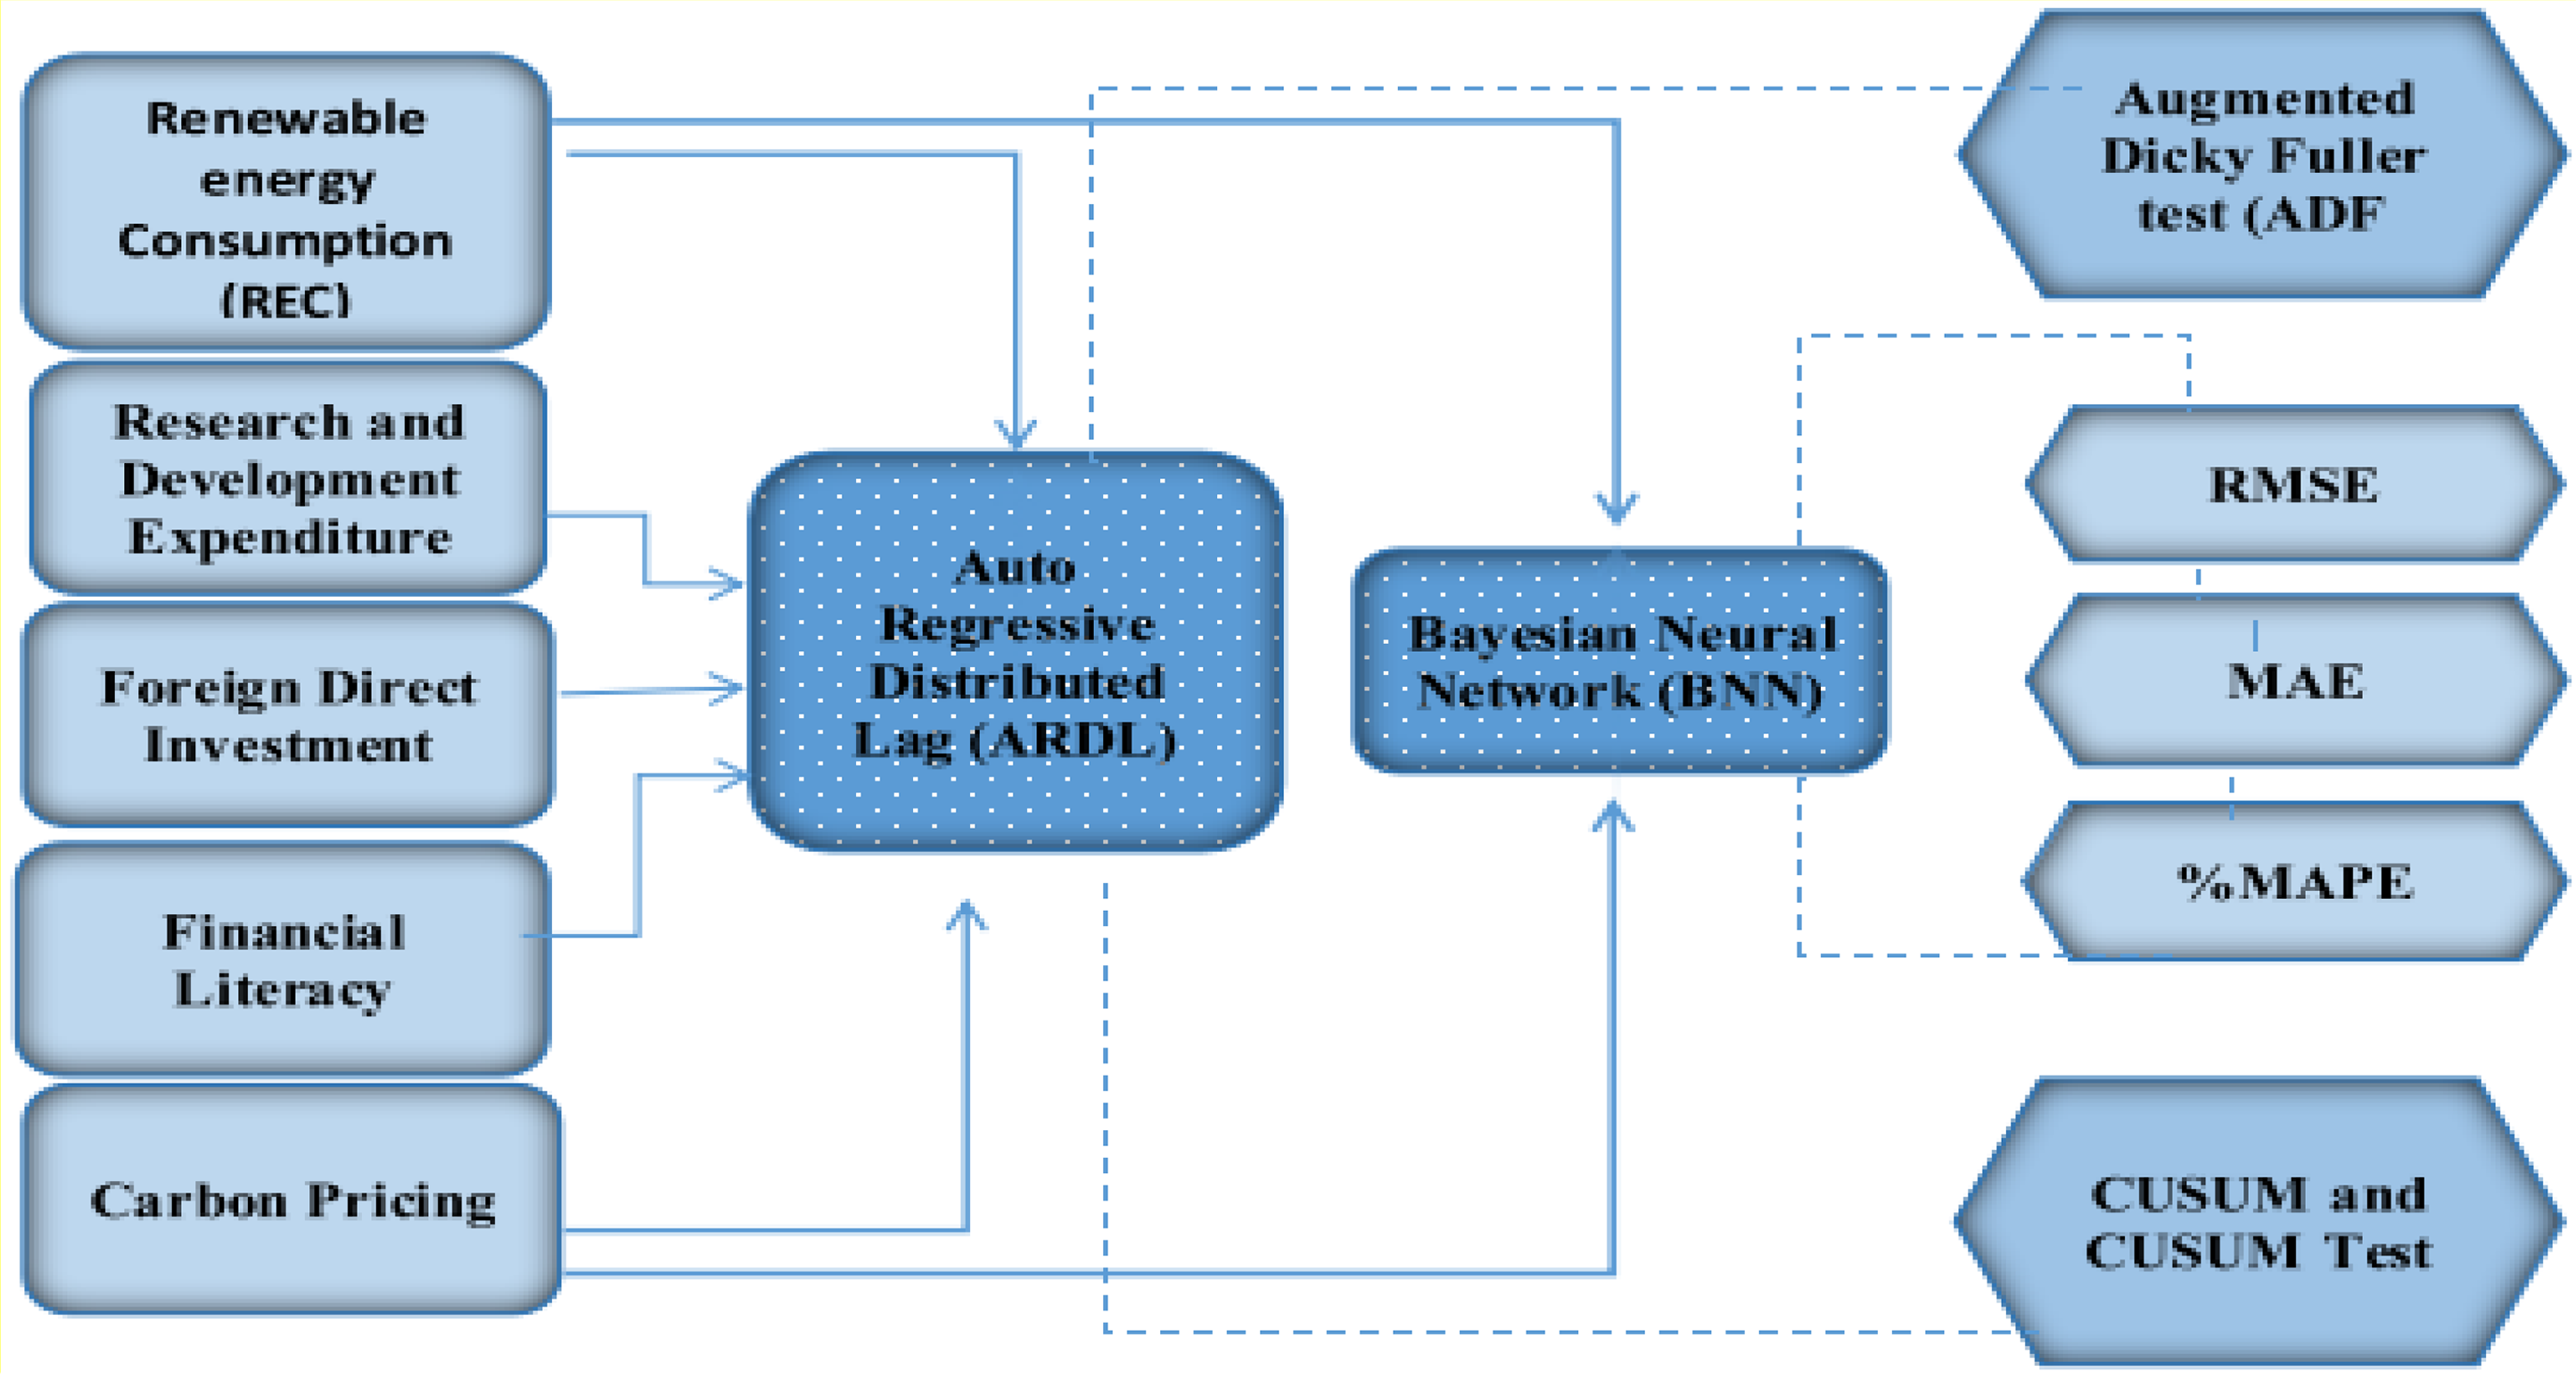
Conceptual framework of the study.
Rationale for the variable inclusion is grounded in literature, REC (RE consumption) mitigates the CO₂ emissions, 27 RDE (Research & the Development Expenditure) accelerates the green tech innovation, 28 FDI contributes through the pollution haven or halo effects, 29 FL enhances public engagement in the green practices, and CP internalizes environmental externalities. 30 The model includes econometric tests like ADF (Augmented Dickey–Fuller) and CUSUM (cumulative sum) for the stability and validation, and uses RMSE (root mean square error), MAE (mean absolute error), and MAPE (mean absolute percentage error) for performance assessment.
This framework reflects an AI-augmented pathway where the data science, environmental economics, and sustainability policy intersect to provide the actionable insights for a green energy transition in the United States. 7
Research hypothesis
The central conjecture of this study posits that non-RE exhibits a positive relation with carbon gas emissions. H1: Increase in the Renewable Energy Consumption is significantly associated with the decrease in carbon gas emissions. Explanation: As renewables displace the fossil fuels, emissions intensity declines.
27
H2: Research & the Development Expenditure (RDE) has a negative causal effect on the carbon gas emissions. Explanation: R&D drives innovation in the low-emission technologies.
28
H3: Foreign direct investment has a mixed impact on carbon emissions depending on host country's environmental policies. Explanation: In line with pollution have inversus the pollution halo hypotheses.
29
H4: Financial Literacy moderates adoption of sustainable practices, thereby reducing the emissions. Explanation: Informed individuals are more likely to engage in the low-carbon behaviors. H5: Carbon Pricing (CP) has a direct negative relationship with the carbon emissions by internalizing the environmental costs. Explanation: CP is a proven economic tool to incentivize the emission reduction.
30
In the light of evolving global climate policy landscape, this study proposes five interrelated hypotheses that explore the key economic and environmental drivers of carbon emissions. H1 posits that an increase in the REC significantly reduces the carbon gas emissions, as substitution of the fossil fuels with cleaner energy sources directly lowers the emissions intensity, a relationship supported by Dogan and Seker. 27 H2 suggests that higher RDE contributes to the emission reductions by fostering innovation in low-carbon technologies and the energy efficiency improvements, as demonstrated by Petrović and Lobanov. 28 H3 addresses nuanced role of the FDI, which can either exacerbate or mitigate the emissions depending on environmental stringency of the host country; this duality aligns with pollution have an hypothesis. 29 H4 highlights the moderating role of FL in sustainable transitions, arguing that financially informed populations are more inclined to adopt the environmentally responsible behaviors and technologies, thereby indirectly curbing emissions. Lastly, H5 asserts that CP has a direct negative relationship with the carbon emissions, as it internalizes the environmental costs of pollution and incentivizes behavioral and technological shifts toward the decarbonization a mechanism widely validated in environmental economics literature. 30 Collectively, these hypotheses reflect an integrated framework influenced by global climate governance, emphasizing both the economic instruments and societal readiness in driving the emission reductions.
Research questions and objectives
What are the key drivers that influence the association between the usage of renewables in the energy sector and carbon gas secretions?
What is the role of AI in mitigating energy sector challenges, such as mitigating greenhouse gas emissions and improving low-carbon economy, energy security, and what econometric model can best quantify these positive outcomes?
What are the potential policies and strategies that can effectively mitigate the carbon gas emissions and ecological impacts linked with non-RE usage while considering the usage of AI?
The objectives of the study are given as:
The key objective is to observe the effect of the usage of non-RE, R&D, and CP on carbon gas emissions. To explore the tie-in of non-RE, RE, and macroeconomic indicators on carbon gas secretions. To forecast CP with reference to RE utilization with the help of a BNN. To evaluate the forecasting efficacy with the assistance of quantifying measures, that is, RMSE, MAE, and MAPE. To impart some advanced strategies on the basis of empirical findings regarding the contribution and environmental influence of consuming non-RE on carbon gas secretions.
Literature review
A growing recognition of sustainable green energy markets offers greener and cleaner alternatives while curbing the reliance on nonrenewable sources and mitigating carbon gas emissions. Moreover, the Global consensus on carbon neutrality and low-carbon economy has been reached, with over 120 countries proposing targets, requiring the join efforts of all nations. The literature review will explore the diverse perspectives, transitional complexities, and challenges that are faced globally by the low-carbon economy and reduction in the usage of nonrenewables. Furthermore, for the promotion of renewables, various approaches and strategies adopted by different countries are being analyzed through prior empirical literature. The comprehensive and thought-provoking review also provides a base to design a policy framework aimed at decarbonizing financial prudence and ensuring solutions regarding sustainable energy around the globe.
Nonrenewable and renewable energy consumption on carbon gas emissions
According to prior empirical literature, there are two strands regarding the association between the usage of RE and carbon gas emissions. The majority of these research endeavors explored that with the increase in renewables, carbon emissions tend to decrease, regardless of the sample and methodology employed, as reviewed below.
For the United States, 31 seek to shed light on to which extent renewables and economic expansion help in maintaining ecological sustainability that further add to low-carbon economy. In this context, the present research has utilized a dynamic ARDL (DARDL) model for the United States, leveraging data 1990–2018. The evidence reveals that innovation and energy utilization foster the US sustainable ecology. Conversely, the reliance on fossil fuels and economic expansion hampers sustainable ecology. For the achievement of sustainable development goals (SDGs 7 and 13), effective policy proposals should be implemented. 32 Hence, economic diversification not only enhances sustainable growth but also promote resource stability.
Transitioning from fossil fuels toward RE sources is crucial for low-carbon economy and global resource stability. Nakhli et al. 33 carry out investigation concerning the association among nonrenewable and renewable and carbon emanations in the United States. The regression results obtained from the Bootstrap Rolling approach spanning 1985M1 to 2020M12 depict that the adoption of nonrenewables intensifies the issue of carbon gas emissions. Conversely, the adoption of renewables has the power to alter the adverse situation regarding climate change. Furthermore, it is proposed that more investment should be made in this dimension for a secure future for the coming generation.
The baffling issue of carbon emissions being affected by the consumption of renewables, human capital, and economic expansion in Pakistan. By employing ridge regression methods and a three-stage least square covering period from 1980 to 2014. The evidence illustrates that human capital and the adoption of renewables play a strong role in the mitigation of carbon discharges. 34 On the basis of empirical analysis, while grappling with the high demand for energy, it is the need of the hour to increase investments in the RE sector and the initiation of R&D programs accordingly.35–42
Reducing nonrenewable resource reliance can alleviate environmental impacts, by endorsing resource stability, safeguard ecosystems, and overall planet by reducing energy production. Keeping in view the 12 developing Pacific and East Asian economies, 43 aspires to investigated the tie among economic expansion, energy consumption, and urbanization on carbon gas emissions. The data for these 12 developing economies is retrieved during the specified period from 1990 to 2014 by utilizing the regression technique of the System Generalized Method of Moment (GMM). The regression findings underscore that a significant incline was observed in carbon gas emissions by the variables and hence, deepening the gravity of environmental challenges in the specified region. Additionally, a significant influence is witnessed as a desired shift occurred from nonrenewables to RE resources. Therefore, the existing study keenly suggests that policymakers should design such policies which corroborate the control of carbon gas emissions through the usage of renewables. 44
Apart from the literature review, another set of scholarly works accentuates the conflicting results concerning the correlation between renewables and carbon discharges covering the period 1995–2015 for 97 states. Dynamic panel threshold model was employed, the nonlinear effect of renewables, economic expansion, and non-REC on carbon gas discharge is observed. The regression analysis shed light on the fact that the carbon emanations can only be decreased because of an increase in the adoption of RE utilization if and only if a certain threshold of REC is being surpassed by these nations. Moreover, these outcomes hold for industrialized economies plus economies having stronger institutions and are to use certain RE alternative proxies vigorously. 45
The link between CO2 emissions, energy consumption, and low-carbon economy emphasizes the necessity of balancing ecological sustainability with resource stability. Previously the examination of a causal association between nuclear energy consumption, carbon gas discharges, renewables, and economic expansion were comprehensively studies by Apergis et al. 46 For this analysis, 19 industrialized and nonindustrialized economies are taken, encompassing the time frame of 1984–2007, by employing a panel error correction model. The outcomes demonstrate that there exists a substantial and highly significant inverse relationship between emissions and nuclear energy usage; conversely, a highly significant positive tie-in is witnessed between carbon emissions and RE usage in the long run. To address intermittent supply challenges, the absence of sufficient storage technology could be one potential explanation for the no contribution of renewables in emanation reduction. Therefore, to meet the demand for electricity, producers have no way out other than relying on energy sources that are carbon emanation generating sources.
Drivers of carbon emission reduction: R&D, technological innovation, and green investment
The connotation regarding R&D expenditures on carbon discharges proceeds by retrieving data encompassing from 1981 to 2014 for 16 OECD countries. 28 The regression results demonstrate a negative average impact of technological innovation on carbon discharges depicting that a reduction in carbon discharges is attributed to the RDEs, but this scenario is not applicable to 40% of economies. The study suggests that efforts should be made regarding the promotion of R&D expenditures.
The influential intensity of R&D on carbon gas discharges in Group of Seven (G7) countries, including Germany, France, Canada, Japan, the United Kingdom, Italy, and the United States, encompassing 1870–2014 were comprehensively studied. 47 By utilizing a nonparametric panel model, the estimates demonstrate a time-varying association between the two parameters used in the model. Green technological investment and innovation is transforming enterprises, promoting green production and consumption among individuals, leading to low-carbon transition from production and consumption. 48 Dong et al. 49 green investment and technological innovation are playing a crucial role in driving economic transition toward a low-carbon economy. 50 Nazir 51 green investment, technological innovation, and the development of low-carbon economy are closely linked, focusing on minimizing environmental impact by lowering pollution, CO2 emissions, and resource-saving.
The study conducted by Li and Jiang 52 aim to probe the effect of technological innovation on the reduction in ecological pressures among the top six C6 countries that are global carbon gas emitters, including Germany, India, China, the United States, Russia, and Japan. The regression observations state that in industrialized nations (Japan, the United States, and Germany), the decoupling status is stable and better in contrast to the nonindustrialized nations (China, Russia, and India). The performance of Germany and China is considered the best among industrialized nations and nonindustrialized nations, respectively. In C6 countries, RDE acts as a resistance to decoupling carbon gas emissions from economic expansion, whereas the technological innovation, R&D efficiency effect and energy intensity are the driving forces behind this process which ultimately lead to low-carbon economy.
Foreign direct investment and carbon gas emissions
The incidence of foreign direct inflows (FDI), economic development, and energy consumption was thoroughly investigated for five major greenhouse gas emission emitters. The study elects panel data encompassing 1982 to 2016 for empirical analysis. Moreover, with noninclusive fixed-effects, a panel data regression, U-test approach, Driscoll–Kraay, and panel quantile regression standard errors are being utilized, and results unveil that an active influence of energy usage is wielded on carbon gas emissions along with confirming the existence of Population Heaven Hypothesis (PHH). 53 Additionally, for Indonesia and China, the validity of the Environmental Kuznets Curve Hypothesis, and for South Africa and India, the validity of a U-shape relationship is observed. The SDGs in developing economies can only be attained by foreign investment inflows with improvement in labor, green business practices, and clean technological transfers.
In a recent study, 54 intend to conduct research in developing countries, that is, China and India, to assess the carbon status in line with the PHH by evaluating time series data (annual) from 1980 to 2016. For this purpose, the respective study has used the three exploitive measures of carbon gas emissions to scrutinize the long-term influence of consumption of coal-based fossil fuel FDI and hydropower on carbon gas discharge. By utilizing the recently formed bootstrap ARDL procedure, the evidence suggests that in China, the foreign investment and consumption of coal and hydropower lead to an expansion in the size of the carbon footprint. On the other hand, in India, foreign investment and coal consumption are the sole culprits behind the acceleration of these emissions; however, no impact on ecological degradation is witnessed through hydropower. Hence, the empirical findings deduced that according to different carbon indicators, the PHH varies, thereby signifying the existence of PHH in India and China. Building on the findings, the study provides certain recommendations that allowing fair foreign investors plus the replacement of hydropower and coal with more effective renewables can pave the way to fight against all odds concerning ecological deterioration.
By utilizing unbalanced panel data for 21 Kyoto countries 55 strive to investigate the influence of RE utilization and FDI on carbon gas emissions. The study employs panel co-integration to test the environmental Kuznets curve (EKC) hypothesis. The regression outcomes from the panel causality test illustrate the variables of RE utilization, carbon emissions, FDIs (inflows), and fossil fuel energy consumption (FFEC), and long-run causalities are witnessed. Additionally, an escalation in foreign investment inflows and the adoption of RE will contribute to carbon gas emission reduction. Moreover, the regression results strongly support the pollution haloes hypothesis stating that to meet the emission target, Kyoto countries should have to stimulate the usage of RE and foreign investment inflows. In light of regression outcomes, the respective paper shed light on new insights into energy and environment policies with the integration of overseas investment inflows.
The association between overseas direct investment, energy usage, real income, and ecological imprint was accessed by haven hypothesis' validity in 10 newly emerging economies. 56 The underlying research employs a second-generation panel data methodology, harnessing data from 1982 to 2013 is also considered. Moreover, between overseas direct investment and ecological degradation, a nonlinear relationship is also explored. The estimation outcomes validate that an incline in economic expansion and energy utilization aggravates the issue of ecological footprint. Furthermore, in newly emerging economies, a U-shaped link between ecological footprint and overseas direct investment is confirmed. In addition, instead of taking prohibitive measures, the government has to cater to the active provision of subsidies and tax incentives for overseas investors to use purely eco-friendly technology.
In a study, 57 attempts to scrutinize the presence of the PHH and also aim to assess the causal bond between environmental pollution and its other potential influencing indicators, spanning 1982 to 2014. The research analysis is conducted for groups that consist of two countries each, that is, (i) the MINT and (ii) the BRICS. The countries underlying MINT are Mexico, Indonesia, Nigeria, and Turkey. While Brazil, Russia, India, China, and South Africa came under the BRICS economies. The factual results attained from the regression scrutiny through the panel vector error correction model (ECM) demonstrate a positive and two-way causality between economic expansion and foreign investment inflows. Consequently, exposing that the PHH is not corroborated in this case. The study propounds certain policies that advanced technology should be introduced to fulfill the need to reduce carbon emissions.
Financial literacy on carbon gas emissions
In terms of carbon emission per capita (41.4%), emission per unit of GDP (35%) and emission per unit (32.4%) were studied for FL. 58 Through regression and correlation analysis, the outcomes reveal there exists a parabolic inverse U-shaped association between these underlined variables, that is, with negative acceleration and positive velocity. 59
Investigation to find out the knowledge regarding sustainable FL is a major driver behind controlled human activity.60,61 While Schrills et al. 62 emphasized that digital assistant information regarding carbon footprint can be provided to individuals and could improve carbon literacy. Additionally, an increase in environmental literacy motivates individuals to adopt environmentally friendly lifestyles.63–65
The connotation between FL and carbon gas discharge reveal the probability of an increase in carbon emanations due to the lower levels of FL after a certain threshold level. 66 Moreover, for underdeveloped economies, the lower levels of FL have an adverse impact, ultimately enhancing the probability of ecological deterioration and vice versa. The research advocates that focus should be given to the specific field of FL, which is sustainable FL and resource stability. Moreover, understanding sustainable FL should be emphasized among the particular stakeholders, involving owners of small- and medium-sized businesses.
Ding et al. 67 divulge that easy access to development and climate knowledge significantly improves the climate condition while a lack of information on climate change, carbon gas discharge, and carbon education engenders economic, environmental, and social disillusionment. 68
Carbon pricing on carbon emissions and carbon neutrality
Research on transitioning to low-carbon economy from various disciplinary perspectives shows that successful innovation leads to competitive benefits for firms implementing mitigation strategies. Li et al. 69 aim to investigate the reduction in carbon emanations through CP among provinces in China. The empirical outcomes deduced that without the power markets’ synchronized reform, there seems to be an insufficient impact of moderate CP alone to dwindle carbon emanations. An appreciable decrease in emanations is witnessed if carbon prices are greater than 300 RMB/TCO2 (300 Renminbi per ton of carbon dioxide where RMB stands for the Chinese currency Renminbi, and TCO2 refers to metric tons of carbon dioxide.). The outcomes propose that a simultaneous introduction of CP policies and power market reforms is necessary if the economy desires to attain the goal of reduction in carbon emissions and low-carbon economy with a price greater than 300 RMB/TCO2.
The global consensus on carbon neutrality has been reached, with over 120 countries proposing targets, requiring joint efforts from all nations. US President Biden reaffirmed the country's commitment to the Paris Agreement, promoting a “carbon-free electricity society” by 2035 and a carbon neutrality and 100% clean energy economy by 2050.6,70
In a study, 71 intend to investigate the behavior of CP based on the OECD Effective Carbon Rates database. The empirical estimates unveil that in the long term, an EUR 10 escalation in CP dwindles emanations through nonrenewables by 3.7% on average. The study proposed that certain additional policies regarding raising CP should be implemented to achieve net zero emanations. Moreover, through reallocation and innovation, clean sources of nonrenewables must be substituted at a drastically increasing rate. 72 For instance, Rafaty et al. 73 intend to scrutinize CP's impact on emanations for a panel of 39 countries spanning 1990–2016. By utilizing the newly constructed sector-level carbon price data, the underlying study illustrates that CP has a pivotal role in reducing the expansion of carbon emanations by 1% to 2.5% on average. Additionally, based on the factual findings, the absence of a nonpricing policy results in an inclination in carbon emanations.
A nonlinear optimization model is being developed by Fahimnia et al., 30 who are trying to inspect the potential of carbon reduction with respect to the CP scheme in Australia. This is basically a representation of the trade-off between fuel consumption and the cost of carbon emanation and transportation costs as well. The regression findings from the implementation of the model advocate that in Australia, a minor incline in logistics cost is seen because of a minor upsurge in CP. Therefore, a shift in transportation behavior is not possible.
To broaden scope and update the discourse, several recent studies offer valuable insights into the dynamics between economic activity, energy use, and carbon emissions. Li et al. (2021) demonstrated that application of AI and energy modeling significantly enhances the sectoral energy efficiency, especially within high-emission domains like transport and manufacturing. Their findings suggest that technological intensity, not just the scale of energy use, plays a crucial role in achieving the emissions targets. The study by Wang et al. 74 offers strong proof of the revolutionary role of AI in promoting environmental sustainability in the larger framework of digital and sustainable synergies: insights into green investment, technological innovation, and low-carbon economies. The study, which uses panel data from 67 nations and sophisticated econometric approaches, shows that AI has a major impact on lowering carbon emissions and ecological footprints while also accelerating energy transitions, with the latter showing the biggest influence.
The study emphasizes how AI's environmental effects are nonlinear and context dependent. For example, increased trade openness increases AI's beneficial environmental effects, whereas a larger industrial sector share can augment AI's role in energy transitions while diminishing its emission-reducing advantages. Additionally, while its marginal contribution to the energy transition decreases at advanced levels, the study reveals that the environmental benefits of AI increase with its development. The significance of matching AI investments with sectoral dynamics, trade regulations, and energy transition stages is emphasized by these insights, which also highlight AI's potential as a strategic facilitator of low-carbon, digitally driven economies. Thus, this study makes a significant contribution to the expanding conversation on how technology innovation can be used to further sustainable development objectives when it is managed strategically.
The review by Wang et al. 74 in the framework of digital and sustainable synergies: insights into green investment, technological innovation, and low-carbon economies. The study emphasizes how AI may improve forecasting, production efficiency, and smart grid management, all of which are crucial for maximizing RE sources, especially solar and wind. AI fosters innovation in energy materials and infrastructure, frequently in conjunction with IoT and blockchain technologies, improves grid resilience through vehicle-to-grid (V2G) technologies, and makes real-time demand-side control possible through smart meters. The analysis notes that although AI speeds up the transition to cleaner energy, there are still enduring issues like cybersecurity, ethical issues, data limits, and the requirement for interoperability and international regulatory harmonization. The report presents AI as a transformative force rather than just a technical instrument, highlighting its importance in creating resilient, egalitarian, and sustainable energy systems. As such, it is essential for nations aiming to achieve a low-carbon, technologically advanced future.
The study by Wang, Sun, and Li 75 offers important insights into how AI can improve green economic efficiency, especially in the marine fisheries industry, in the framework of digital and sustainable synergies: insights into green investment, technological innovation, and low-carbon economies. The study shows that AI greatly increases the green economic efficiency of marine fisheries using data from 11 Chinese coastal regions, however the effect varies over time and by region. Notably, the study finds that trade openness, R&D investment, and green finance are important moderating factors that increase the benefits of AI. The revolutionary potential of AI in advancing low-carbon economic models is further supported by these synergies between digital innovation and sustainable financing systems. The study advances a better understanding of how AI can be strategically used in conjunction with financial and technology enablers to promote green investment and sustainable development in economies that rely on natural resources by combining econometric methodologies and regional case research.
The study by Wang et al. 74 provides a detailed examination of how trade openness and AI interact to affect carbon emissions and the energy transition in the larger framework of digital and sustainable synergies, insights into green investment, technological innovation, and low-carbon economies. The study, which uses data from 69 nations between 1993 and 2019, demonstrates that AI helps with energy transformation and emission reduction, but the extent of trade openness has a major influence on this effect. The existence of threshold effects highlights the significance of incorporating economic openness into digital sustainability initiatives by demonstrating that the environmental benefits of AI are only achieved if trade openness reaches specific thresholds. Furthermore, the disparity in income and AI development levels highlights the context-dependent nature of AI's synergistic effects on sustainability. It is significant that the study acknowledges the environmental implications of AI infrastructure, including energy-intensive data centers, and calls on policymakers to take these trade-offs into account. All things considered, this study contributes to our knowledge of how digital technology can be used to help low-carbon economies and emphasizes the significance of structural facilitators such as trade laws in accomplishing green investment objectives.
Wang, Huang, and Li 76 provide a thorough examination of the ways in which AI impacts sustainable development in 51 different nations, highlighting the role that AI plays in R&D innovation, infrastructure, and competitive advantage. Their results highlight the importance of innovation in the shift to a green economy by demonstrating that AI R&D has the greatest influence on sustainability. Although AI infrastructure promotes sustainability as well, its impacts are less noticeable and market advantage has the least impact, indicating a gap between innovation and broad adoption. The study also reveals regional and urbanization-based differences, demonstrating that the benefits of AI are greatest in moderately developed areas and that the sustainability impact of AI is conditioned by urbanization levels, changing from positive to negative at higher thresholds. This complex relationship supports recommendations for adaptive policies that link digital innovation with low-carbon, sustainable growth, and emphasizes the significance of customizing AI tactics to urban development situations.
In order to promote low-carbon economies, the literature on sustainable energy and carbon emissions emphasizes the intricate interactions between the adoption of RE, technological innovation, FDI, FL, and CP. Although RE generally lowers emissions across different regions, its full potential is limited in the absence of supporting technology due to issues like inconsistent supply. Though results vary according on innovation efficiency and policy contexts, technological innovation and R&D play a substantial role in reducing emissions, particularly in industrialized economies. The need for laws that promote clean investments is highlighted by the mixed effects of FDI on the environment, which can occasionally facilitate the transfer of green technologies but can also be connected to higher emissions in some developing nations. Despite being less researched, FL is essential for influencing ecologically friendly choices, especially in developing nations. Since modest pricing alone has little effect, CP works best when paired with market changes and incentives for innovation. Overall, the research suggests that in order to achieve sustainable, low-carbon transitions, integrated, region-specific solutions that connect carbon price, innovation, investment, financial education, and RE are required.
To strengthen contemporary perspective, recent studies have been integrated. For instance, Wang et al. 74 show that the AI reduces ecological footprints and carbon emissions while promoting the energy transitions a relationship that depends nonlinearly on industrial structure and trade openness. Xie and Wang 77 provide empirical evidence from the Chinese provinces, finding that improvements in human capital, digital infrastructure, and other contextual factors magnify the AI's carbon reduction effects. Yang et al. 78 demonstrate with the global panel data that AI technology innovation significantly accelerates low-carbon energy transitions across countries. These recent insights reinforce importance of combining technological innovation with the policy reforms and validate the novelty of integrating AI-driven econometric models for examining US energy transition dynamics.
Data and methodology
Considering the research questions and respective diagnostic tests, numerous regression techniques are being applied by a group of scholars in the preceding empirical research. This underlying research is designed to investigate the pronounced effect of explanatory variables, incorporating nonrenewable usage, R&D, foreign direct inflows, FL, REC, and CP on carbon emanations as explained indicators. For the United States, the respective study sourced the time series data from the World Development Indicators (WDI), which encompasses the years 1990 to 2022. It is a universally acknowledged principle in econometrics that before the application of relevant regression techniques, certain diagnostic tests such as autocorrelation, multicollinearity, and stationarity are conducted to proceed further toward the application of relevant regression technique and is succinctly discussed in the “Model specification” subsection. Addressing the appropriate gap and, based on that utilization of substantial regression technique, add a noteworthy impact to the research itself. But in a broader perspective, it also adds treasured insights into the existing body of literature for designing a constructive policy framework, leading toward a fortune of sustainability.
Theoretical background
A game-changing factor in maximizing green investments, boosting technical innovation, and developing low-carbon economies is the incorporation of digital technology, especially AI, into the sustainability space. Particularly in fields like CP and RE projections, AI-driven models hold great promises for enhancing the accuracy, speed, and scalability of environmental policy decision-making processes. AI techniques like deep learning, support vector machines (SVM), and BNN are better equipped to capture the intricate dynamics of climate systems, energy markets, and carbon emissions because they can handle large, nonlinear, and high-dimensional datasets, unlike traditional econometric methods. By improving prediction accuracy and revealing hidden patterns, these techniques help make better investment choices and develop emission reduction plans. Additionally, AI enables smart infrastructure, adaptive policy modeling, and real-time energy grid optimization all of which are crucial tools for quickening the shift to low-carbon economies.
In contrast, conventional forecasting techniques like vector autoregression (VAR), autoregressive integrated moving average (ARIMA), and computable general equilibrium (CGE) models mostly rely on predetermined assumptions, linear correlations, and past data trends. Although these models are useful for macroeconomic simulations and long-term forecasts, they frequently fail in situations that are dynamic, data-rich, and require behavioral feedback loops and dynamic interactions. For example, AI models are more resilient for real-time climate and investment predictions because they can adapt dynamically to market volatility or policy shocks. Additionally, methods like reinforcement learning can improve CP plans under uncertainty and simulate intricate energy market scenarios abilities that are outside the purview of traditional models. Because AI offers greater adaptability, learning capacity, and prediction accuracy than traditional approaches, it not only complements but also exceeds them in many situations. This creates a solid theoretical basis for digital-sustainable synergies in low-carbon economic development.
Methodological roadmap
Data collection
Time-series data for the period 1990–2022 were retrieved from WDI. Variables include CO₂ emissions (in kilotons), FFEC (% of GDP), the REC (% of total energy), R&D (% of GDP), FDI (% of GDP), FL (proxied by the broad money as % of GDP), and CP (approximated using the annual CPI inflation rate).
R&D expenditure as a percentage of GDP is used as the proxy for AI development, in line with the previous literature that correlates R&D intensity with the technological advancement, including AI capacityñ. 79
Data preprocessing and transformation
Missing values were treated using the linear interpolation for small gaps (≤3 consecutive years) and the mean imputation where data were sporadically missing (e.g. early FDI records). All variables except CPI were log-transformed to stabilize the variance and improve normality. Unit root tests (ADF) were conducted to ensure stationarity and guide the use of ARDL by checking for I(0) and I(1) orders. All data were standardized (Z-score normalization) BNN model to ensure numerical stability during training.
Model 1: ARDL (causal estimation)
ARDL is used to examine the short- and long-run causal relationships between CO₂ emissions and independent variables. This approach is particularly suitable for the small sample sizes and mixed-order integration. The model includes optimal lags determined by the Schwarz Bayesian Criterion (SBC) and diagnostic tests such as CUSUM, serial correlation LM test, and Breusch–Pagan heteroskedasticity test to validate the model robustness.
Model 2: BNN (forecasting framework)
To forecast the future CP dynamics in the context of AI-driven RE integration, a BNN is developed. The model features two input variables, renewable energy capacity (REC) and the CP, a hidden layer with the 20 neurons using a Tanh activation function, and a linear-output layer predicting carbon emissions. Bayesian regularization is employed as the training method. The data is split into the 70% training, 15% validation, and 15% testing, following a time-respecting approach to avoid the look-ahead bias. Key hyperparameters include a learning rate of the 0.01 and a regularization parameter optimized through the evidence approximation. The model is trained over 1000 epochs with the early stopping triggered if validation RMSE fails to improve over 100 epochs. Performance is assessed using the RMSE, MAE, and MAPE.
Comparison and integration
ARDL estimates provide insights into the causal pathways and elasticity (i.e. a 1% change in RE leads to X% change in CO₂ emissions). BNN results focus on the forecasting under nonlinear dynamics and policy perturbations. Comparison is done by overlaying the BNN forecasts with ARDL-based trend projections for the CP and emissions. The BNN captures short-term shocks (e.g. COVID-19), while ARDL stabilizes the long-term trajectories.
Model specification
In the preliminary inquiry, the model under observation is being regressed using FFEC, R&D, foreign inflows, FL, CP, and REC on carbon emanations as regressed. To scrutinize the dependence between explained and explanatory parameters, the model's implicit formulation is characterized as follows:

We gauge the following underlying equations, and hence the sole objective of the existing research is being addressed:

LCOE2 = natural log of carbon emission
FFEC = fossil fuel energy consumption
REC = renewable energy consumption
RD = research and development
FDI = foreign direct investment, net inflows
FL = financial literacy
CP = carbon pricing
Here, non-REC, referred to as FFEC, embraces the period spanning 1990 to 2022, while
Variables description and data source
In the respective study, on one side, carbon gas emission is our explained variable, while on the other side, the existing study includes macroeconomic variables such as FFEC, R&D, foreign direct inflows, FL, REC, and CP as explanatory variables. Concerning this, our model is being regressed with carbon gas emissions. Furthermore, after following the pre-requisites, that is, the diagnostic tests, the ARDL regression technique seems the best fit just to probe the significant impacts between the specified variables in the long and short run.
The description of the variable's measure, data source, and expected signs are detailed in the subsequent Table 1.
Variable description, source, transformation, and the missing value treatment.
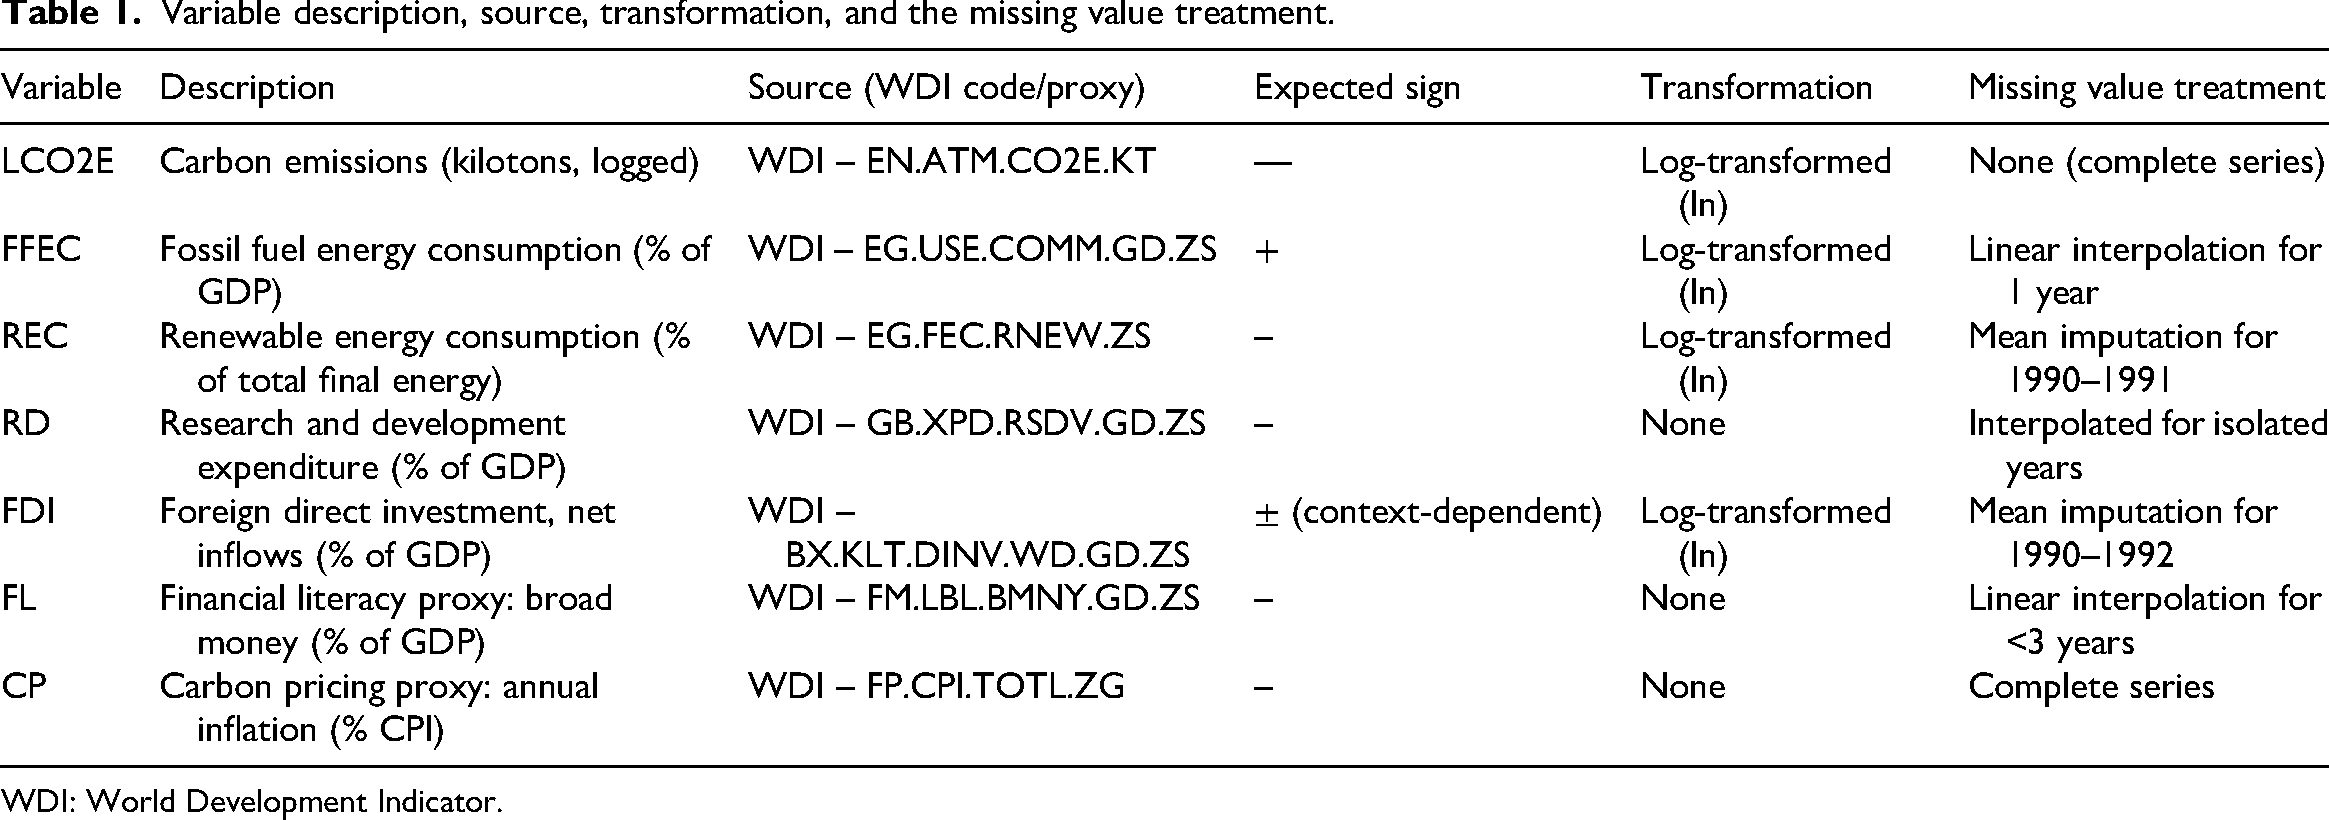
WDI: World Development Indicator.
Moreover, over the duration of 1990–2022, datasets for all selected variables are sourced from the WDI. The 1990–2022 dataset was chosen to fully document the course of the US economy's shift to a low-carbon economy, including significant stages of technology development, industrial evolution, and environmental policy reform. The emergence of digital technologies, the early adoption of RE regulations, and significant climate policy turning points including the 2008 financial crisis recovery, the 2015 Paris Agreement, the Kyoto Protocol implementation phase, and COP26 and COP27 commitments are all included in this time frame. Future iterations of the study will integrate robustness checks by dividing the dataset into subperiods (e.g. pre- and post-2010) to better assess temporal variation and the distinct impact of significant policy events like the Paris Agreement, even though the methodology makes it clear that the primary focus is on US-specific data. This will improve the findings’ dependability and provide a better understanding of how national-level sustainability policies have been influenced by changes in global policy.
While model specification and the variable selection are grounded in the relevant economic theory and empirical precedent, it is acknowledged that the certain limitations may affect broader generalizability of the findings. Specifically, scope of this research is limited to the US-specific data, restricting cross-country applicability. Additionally, although time frame from the 1990–2022 was chosen to encompass the critical energy transitions and policy milestones (e.g. the Kyoto Protocol, Paris Agreement, COP26/27), relatively limited sample size may constrain predictive robustness of the BNN, potentially resulting in the overfitting. Future extensions could mitigate this by incorporating the subperiod analyses and robustness checks. Moreover, while ARDL approach effectively captures the mixed integration and long-term dynamics, it assumes the linearity and stable equilibrium relationships oversimplifying inherently complex and nonlinear nature of green investment and the CP interactions in a real-world policy environment. These limitations are recognized, and future work will consider the nonlinear and cross-country econometric extensions to enhance the external validity and model adaptability.
Bayesian neural network for forecasting purpose
The adoption of AI has become widely spread in terms of forecasting RE and its variants. It has also been observed that variants of BNN are a promising tool for forecasting the trend of renewable energies and their patterns. In this research, BNN has been chosen for its high rate of adaptability. From the results and discussion, it was examined keenly that BNN is flexible toward regression and classification. 80
This study examines the relationship between green investment, technological innovation, and low-carbon economic outcomes using a BNN and the ARDL model. Because BNNs can quantify prediction uncertainty, which is an essential aspect when modeling complex, policy-sensitive fields like environmental and energy economics, they are especially well-suited for this research. BNNs are more dependable for policy inference than other neural network models because they provide probabilistic outputs and better generalization when there is sparse or noisy data, which is typical in datasets relevant to climate change. Both proven long-run equilibrium dynamics (by ARDL) and nonlinear, high-dimensional interactions (via BNN) can be captured by combining machine learning and econometric techniques. The work strikes a balance between forecasting strength and theoretical transparency by integrating machine learning models, which are excellent at making predictions, with ARDL, which takes into consideration long-term relationships and co-integration. Given the existence of mixed integration orders (I(0)/I(1)) and the requirement to look at both short- and long-term interactions among variables essential to sustainable development, the use of ARDL is especially warranted.
BNN is a unique type of neural network with probabilistic features and one of the classical models to train the data. BNN has the same architecture as any other traditional neural network and contains three layers, that is, input, hidden, and output layers. All the layers are adjusted with the weights. Particularly, weights in BNN are adjusted with the probability density function (PDF). Using the Bayesian theorem, these PDF-generated weights are called prior to distributions, which are later converted into the posterior distribution. Hence, the Bayesian theorem is illustrated below in terms of mathematical expression.
The probability function used in a neural network is called the evidence function. Different training functions are used for different purposes. In this research, Bayesian regularization is used to forecast CP precisely. BNN is assembled with the employment of Bayesian regularization and expressed below in an expression.
Figure 2 illustrates the schematics of the training process. It is found in the studies that training a neural network contains three vital phases, that is, training, testing, and validation. From the raw dataset which contained ample parameters, REC and CP were chosen to forecast the CP. REC and the CP are taken as input parameters for the training purpose while REC acts as an input and CP as a target to propagate the training of the BNN model. Seventy percent of the data is purely dedicated to the training purpose, 30% goes to testing and validation positively. After successive events of training the model, the output's accuracy is checked with the help of quantifying measures, that is, RMSE, MAE, and MAPE. It was examined by the performance indices that BNN has reduced the maximum errors between the input and target chosen.
Figure 4 shows preprocessing pipeline, parameter tuning steps, and training-validation loop. Updated figure caption will clarify steps.
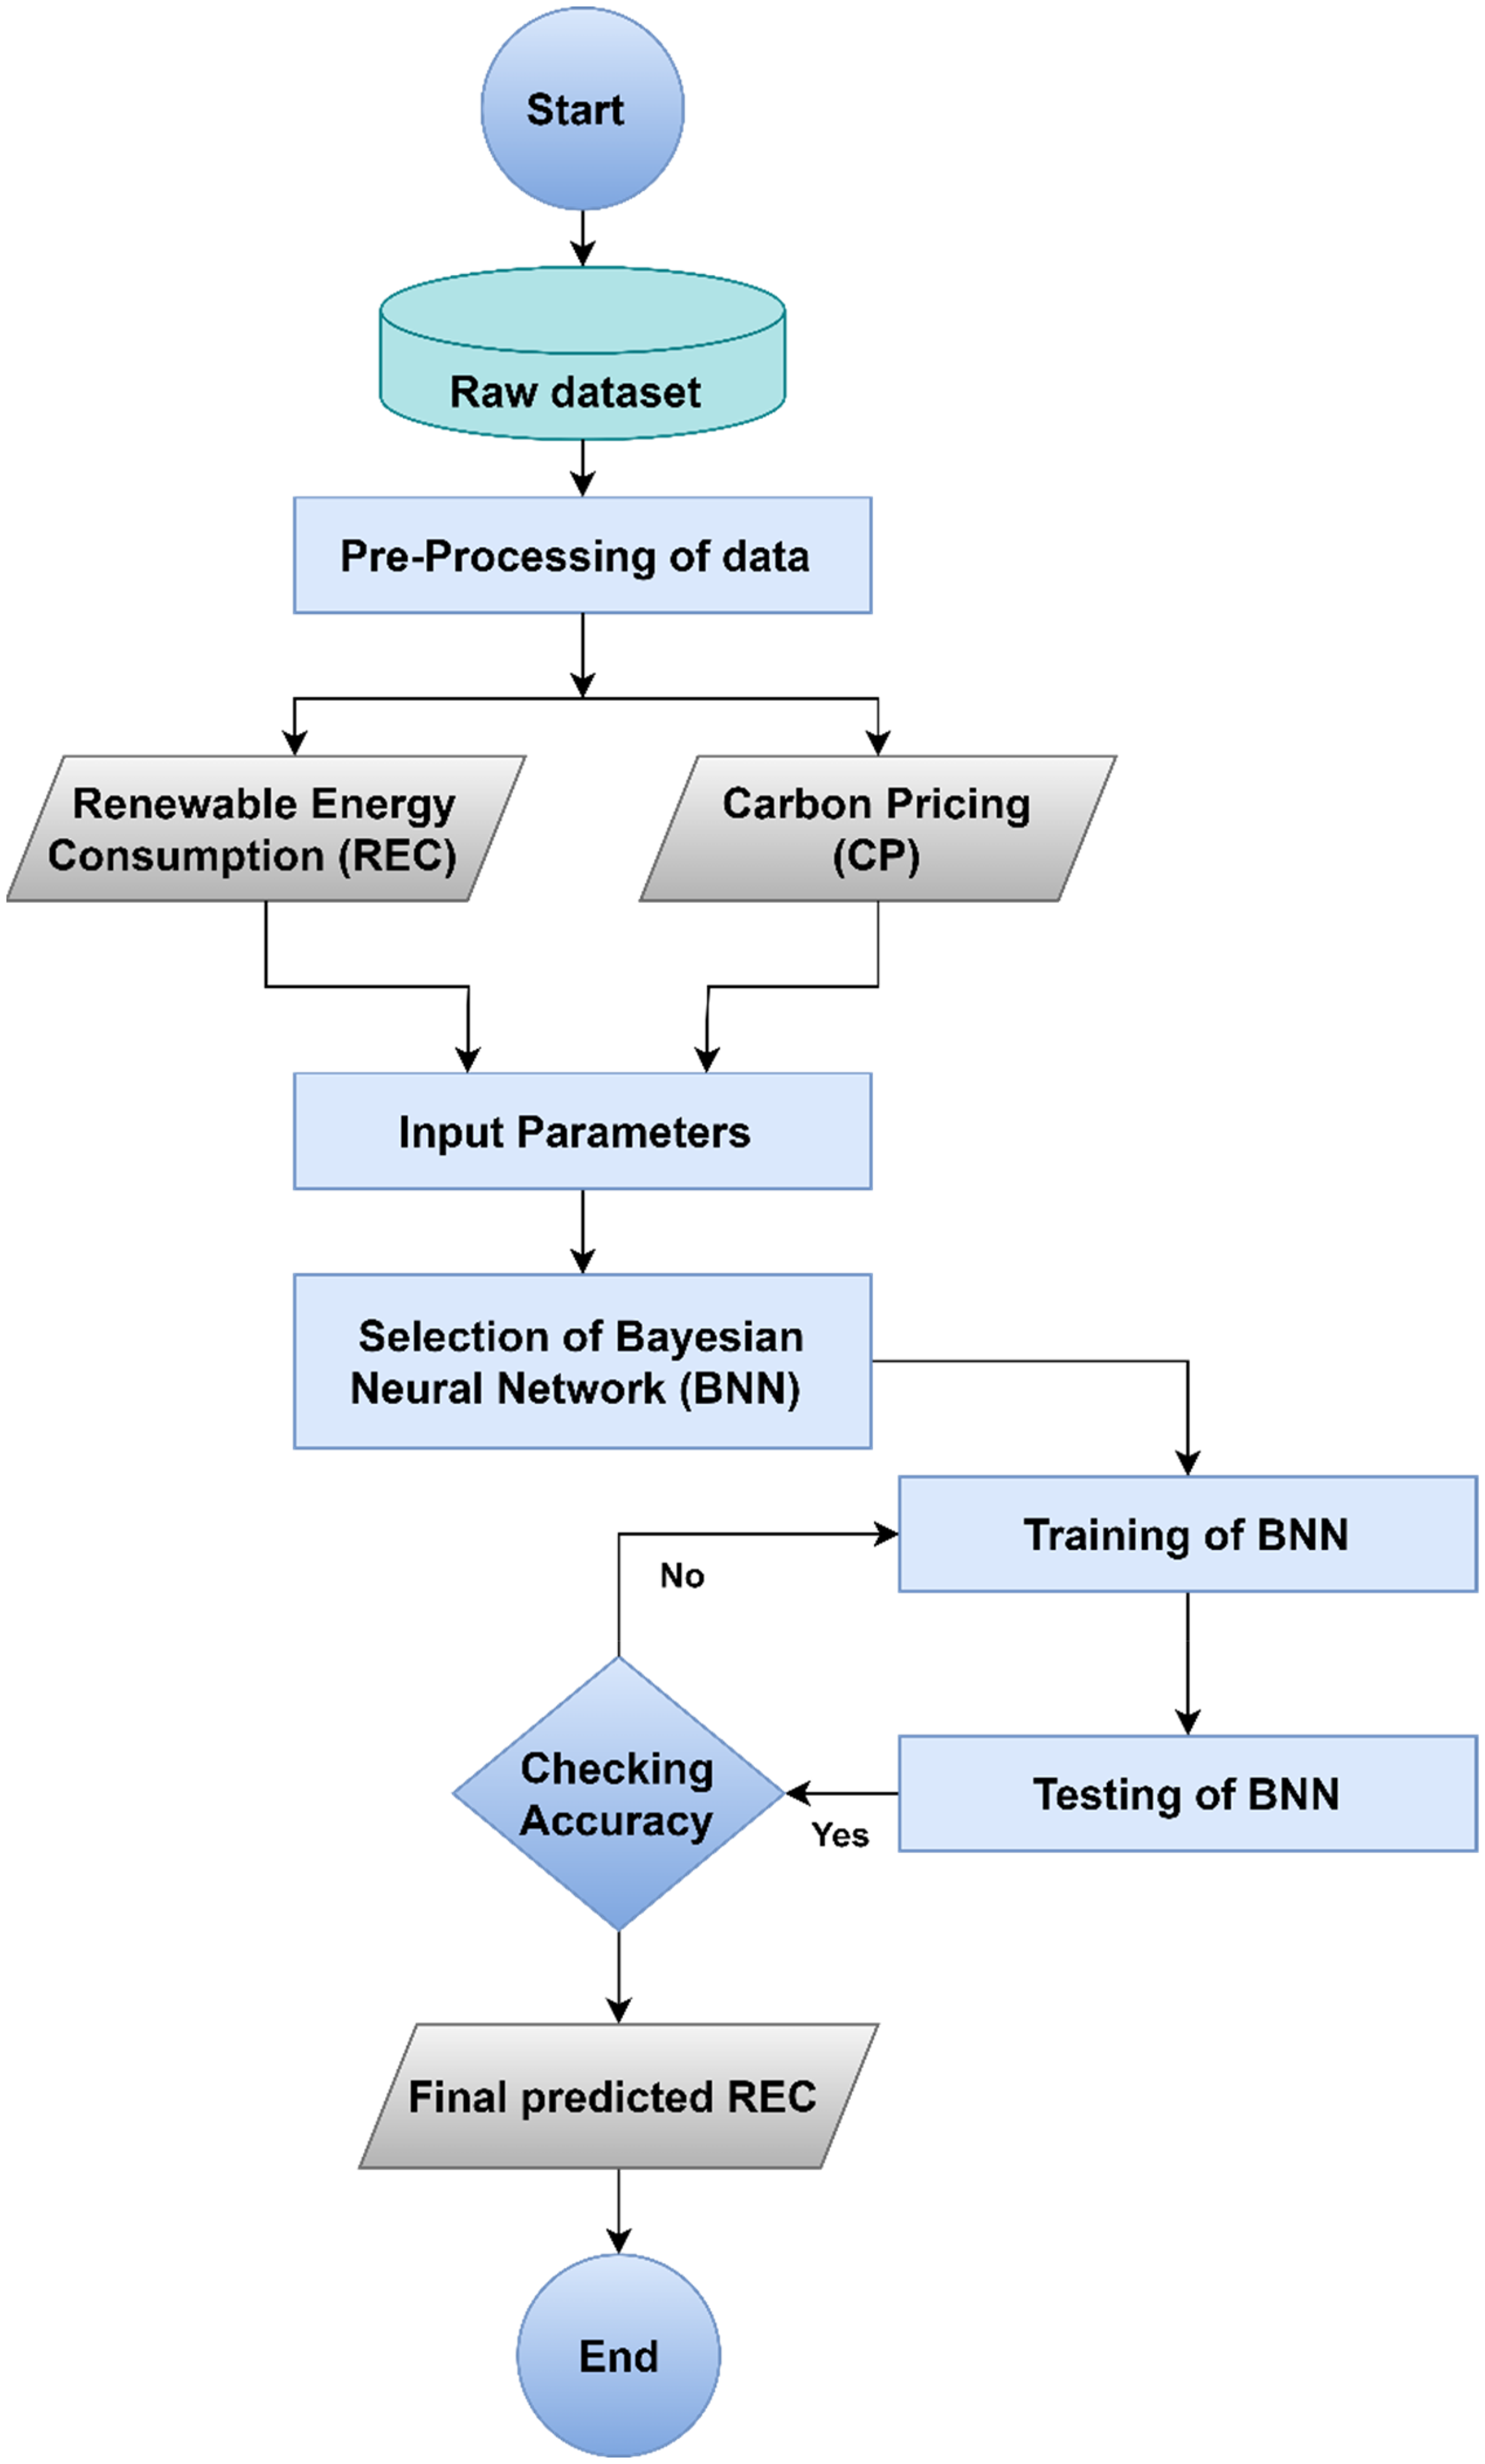
Flowchart of training the BNN model. BNN: Bayesian neural network.
Figure 5 shows (BNN architecture) details of layers, activation functions, and weight distributions (prior/posterior) and will be annotated with technical specifics.
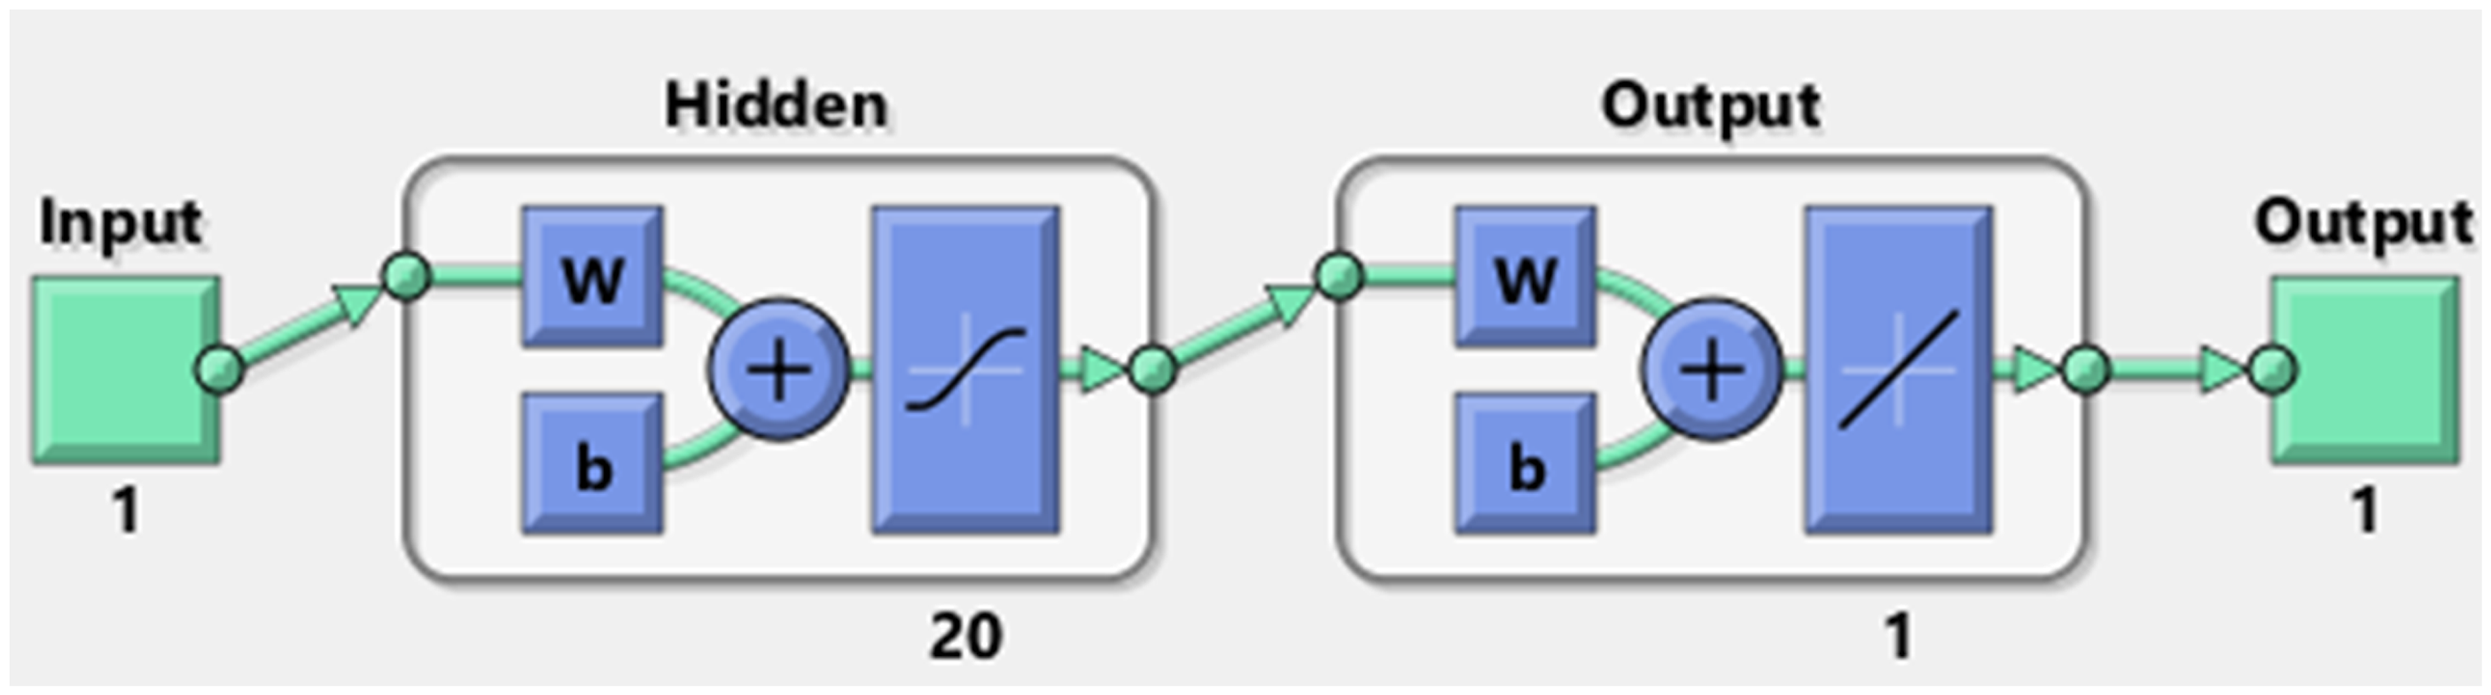
Architecture of the BNN model. BNN: Bayesian neural network.
Figure 5 demonstrates the architecture of the BNN model. It shows the workings of the BNN model. It flaunts the number of inputs, hidden, and output layers. The hidden layers are always chosen on the hit-and-trial rule. Twenty hidden layers were chosen after checking the accuracy. REC and CP are related to each other to cut emissions. When the CP is forecasted with respect to REC, the usage of carbon gets lower and mitigation can be easier to handle. Furthermore, REC and CP work together to have a cleaner energy source and create economic sustainability.
Unit root test
Augmented Dicky–Fuller test
In econometrics, the time series data always associates itself with a severe issue of nonstationarity. Therefore, for the mitigation of spurious outcomes, the preexisting body of research has employed certain unit root tests. These various unit root tests incorporate Zivot and Andrew,
81
Phillips-Perron and Ng,
82
and ADF.
83
These tests are being used by a number of empirical literatures based on their preferences. Among all the stationarity tests, the most efficient and most widely used test is the ADF test. In the study at hand, the outcome attained from the ADF test ratifies that parameters are an amalgam of both the orders, I(1) and I(0). Moreover, the rationality of utilizing the ARDL approach is depicted through the order of integration observed for each variable. H0: Series has a unit root H1: Series has no unit root
Lag length criteria
While regressing the regression equation, Schwarz Information Criterion (SIC) and Akaike Information Criterion (AIC) are two criteria through which the maximum appropriate lag length criteria for both explained and explanatory variables are considered. Moreover, one of the crucial steps is lag length selection because the avoidance of unbiased results is purely based on opting for an appropriate lag length. Therefore, the underlying research counts on the implication of the SIC while assessing the relative lag length that provides reliable results.
Autoregressive distributive lag
From the ADF test, the stationarity results observed favoring the utilization of a renowned regression technique developed by Pesaran et al., 84 which is efficient in reckoning the short and long-run dynamics among parameters. Since the twentieth century, the ARDL regression approach has been the most astounding discovery. 83 In comparison with other regression techniques, we can easily proceed with this regression technique even if the variables are an amalgam of I (0) or I (1) level of stationarity. In addition, this approach is considered the best regression technique based on the aforementioned properties as well as having the characteristics of catering to the long- and short-run influence of explanatory variables on carbon gas emission. Moreover, for the investigation of the short- and long-run impacts between explained and explanatory variables, different regression techniques are utilized. In ARDL form, equations (3.1) can be written as follows:
Where ln implies the natural log, 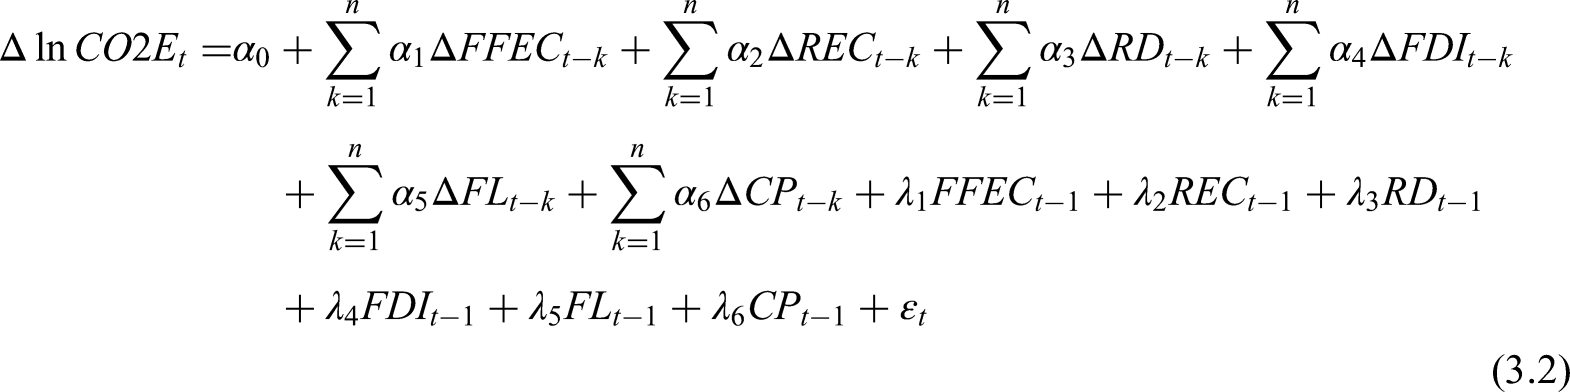
Bound testing approach
In the ARDL model, for the contribution and validation of a full-scale evaluation, after ECM, the bound testing approach is applied concerning the long-run linkage between proposed variables. This test solely focuses on the prevalence of co-integration, which signifies the prospect of stable long-run linkage among the variables. The decision for rejection and acceptance of the null hypothesis depends upon the conditions specified below. H0: No co-integration H1: Co-integration
If the lower and upper critical bound are less than the calculated stats of the F-test, then this demonstrates the existence of a co-integration, or we can say that the variables proposed in the study are co-integrated. Moreover, if the I(0) value is less and the I(1) is greater than the F calculated, then results are assumed to be inconclusive.
Error correction model
In the ARDL model, firstly, the existence of a long-run relation between proposed variables is analyzed; secondly, after this, the short-run analysis is done by utilizing the ECM. In short-run analysis, the major focus revolves around the error correction term (ECT). It is a widely acknowledged fact that the ECT should be significant at any level of significance, and most importantly, it should be negative. The negative sign of the correction term postulates that in retaliation to short-run perturbations, the error term is the pace at which it adjusts toward its long-run equilibrium. Equation (3.2) is formulated in error correction form below.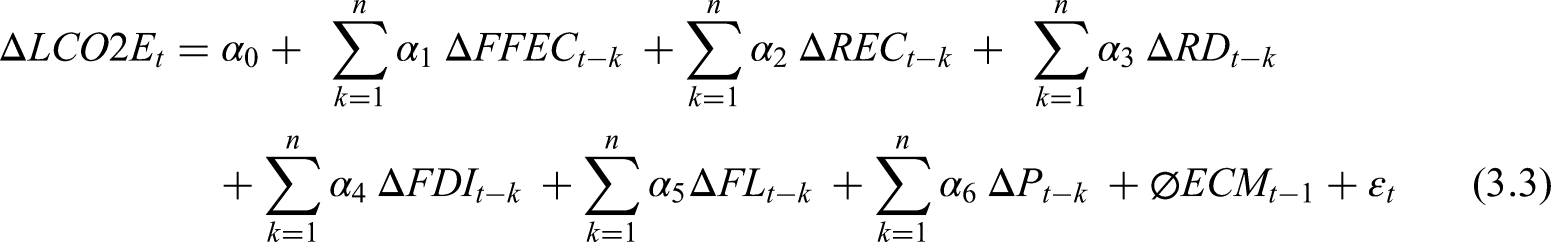
CUSUM and CUSUM square tests
The underlying study employs the CUSUM and cumulative sum of square (CUSUMQ) tests to validate the presence of the long-run correlation between proposed variables. 85 Furthermore, as advocated by prior empirical investigation in the literature the good fitness of the ARDL model is also unveiled through these stability tests. 84 Moreover, to plot these tests, residuals of ECM are used. The stability of the ARDL model depends on one fundamental rule that the coefficients of observed statistics fall in the critical bound of a 5% level of significance.
Integrated methodological roadmap and justification
This study integrates two distinct yet complementary modeling approaches, ARDL and the BNN to investigate both the explanatory and predictive dimensions of relationship between the carbon emissions, energy consumption, and AI-driven climate policy tools. The rationale for this dual modeling approach lies in capturing both the causal structure and long-run equilibrium (via ARDL) and nonlinear predictive capabilities under the uncertainty (via BNN).
Data collection
Time-series data for the period 1990–2022 were retrieved from WDIs. Variables include CO₂ emissions (in kilotons), FFEC (% of GDP), the REC(% of total energy), R&D (% of GDP), FDI (% of GDP), FL (proxied by the broad money as % of GDP), and CP (approximated using the annual CPI inflation rate).
Data preprocessing and transformation
Missing values were treated using the linear interpolation for small gaps (≤3 consecutive years) and the mean imputation where data were sporadically missing (e.g. early FDI records). All variables except CPI were log-transformed to stabilize the variance and improve normality. Unit root tests (ADF) were conducted to ensure the stationarity and guide the use of ARDL by checking for I(0) and I(1) orders. All data were standardized (Z-score normalization) BNN model to ensure numerical stability during training.
Model 1: ARDL (causal estimation)
ARDL is used to examine the short- and long-run causal relationships between CO₂ emissions and independent variables. This approach is particularly suitable for the small sample sizes and mixed-order integration. The model includes optimal lags determined by the Schwarz Bayesian Criterion (SBC) and diagnostic tests such as CUSUM, serial correlation LM test, and Breusch–Pagan heteroskedasticity test to validate the model robustness.
Model 2: BNN (forecasting framework)
To forecast the future CP dynamics in the context of AI-driven RE integration, a BNN is developed. The model features two input variables, renewable energy capacity (REC), and the CP, a hidden layer with the 20 neurons using a Tanh activation function, and a linear-output layer predicting carbon emissions. Bayesian regularization is employed as the training method. The data is split into the 70% training, 15% validation, and 15% testing, following a time-respecting approach to avoid the look-ahead bias. Key hyperparameters include a learning rate of the 0.01 and a regularization parameter optimized through the evidence approximation. The model is trained over 1000 epochs with the early stopping triggered if validation RMSE fails to improve over 100 epochs. Performance is assessed using the RMSE, MAE, and MAPE.
Comparison and integration
ARDL estimates provide insights into the causal pathways and elasticity (i.e. a 1% change in RE leads to X% change in CO₂ emissions). BNN results focus on the forecasting under nonlinear dynamics and policy perturbations. Comparison is done by overlaying the BNN forecasts with ARDL-based trend projections for the CP and emissions.
Assumptions and projection framework for the emissions forecasting
Projection of a 15% reduction in the carbon emissions by 2040 is based on simulated scenarios generated using the BNN model, integrated with the ARDL long-run coefficients. The projection relies on the several explicit assumptions.
Technological progress assumptions
It is assumed that AI-driven technological advancement continues at the compound annual growth rate of 3.5%, consistent with the historical R&D intensity in RE technologies in the United States. The model presumes steady improvement in energy efficiency, carbon capture, and smart grid systems. Historical trends from 1990 to 2022 are extrapolated, adjusted for the anticipated federal and private-sector investments based on current clean energy plans.
Nature of AI's impact
Effect of AI on the emissions reduction is modeled as nonlinear but bounded exponential, meaning its impact grows over time but with diminishing marginal returns as infrastructure and saturation effects set in. This allows model to realistically temper the initial acceleration with expected long-term stabilization.
External shocks consideration
Model incorporates dummy variables and interaction terms to account for the significant external shocks. Specifically, the COVID-19 pandemic (2020–2021) and the global energy crisis triggered by the geopolitical disruptions (e.g. 2022–2023) are encoded to adjust emission baselines and elasticity estimates. These shocks temporarily suppressed the emissions but also altered structural consumption patterns, which were factored into BNN training through the anomaly correction and smoothing techniques. Thus, the projected 15% decline by the 2040 is not based on naive extrapolation but on the dynamic modeling that incorporates structural breaks, nonlinear feedback loops, and AI-enhanced the forecasting capacity under uncertainty.
Results and discussion
Statistical description
The attained results for descriptive statistics yield a concise portrayal of the key characteristics of the variables being evaluated in the underlying study.
Table 2 exhibits the mean, median maximum, and minimum values in relation to every variable integrated into the research. The mean value of our regress, which is carbon emissions, is 0.062, with a standard deviation found to be 15.475. However, the median value of the carbon emission is 15.459, with 0.227 as its probability value. The minimum and maximum values obtained are 15.385 and 15.569, respectively. Furthermore, following the cues of skewness values, carbon emissions, R&D, FL, foreign direct inflows, REC, and CP exhibit a positively skewed distribution except for non-REC. Additionally, the kurtosis coefficient suggests a high peak distribution for R&D and CP, while a flat peaked distribution is observed for the rest of the variables. Lastly, in light of the Jarque–Bera test outcomes with the exception of R&D and CP, most variables adhere to a normal distribution.
Statistical description.
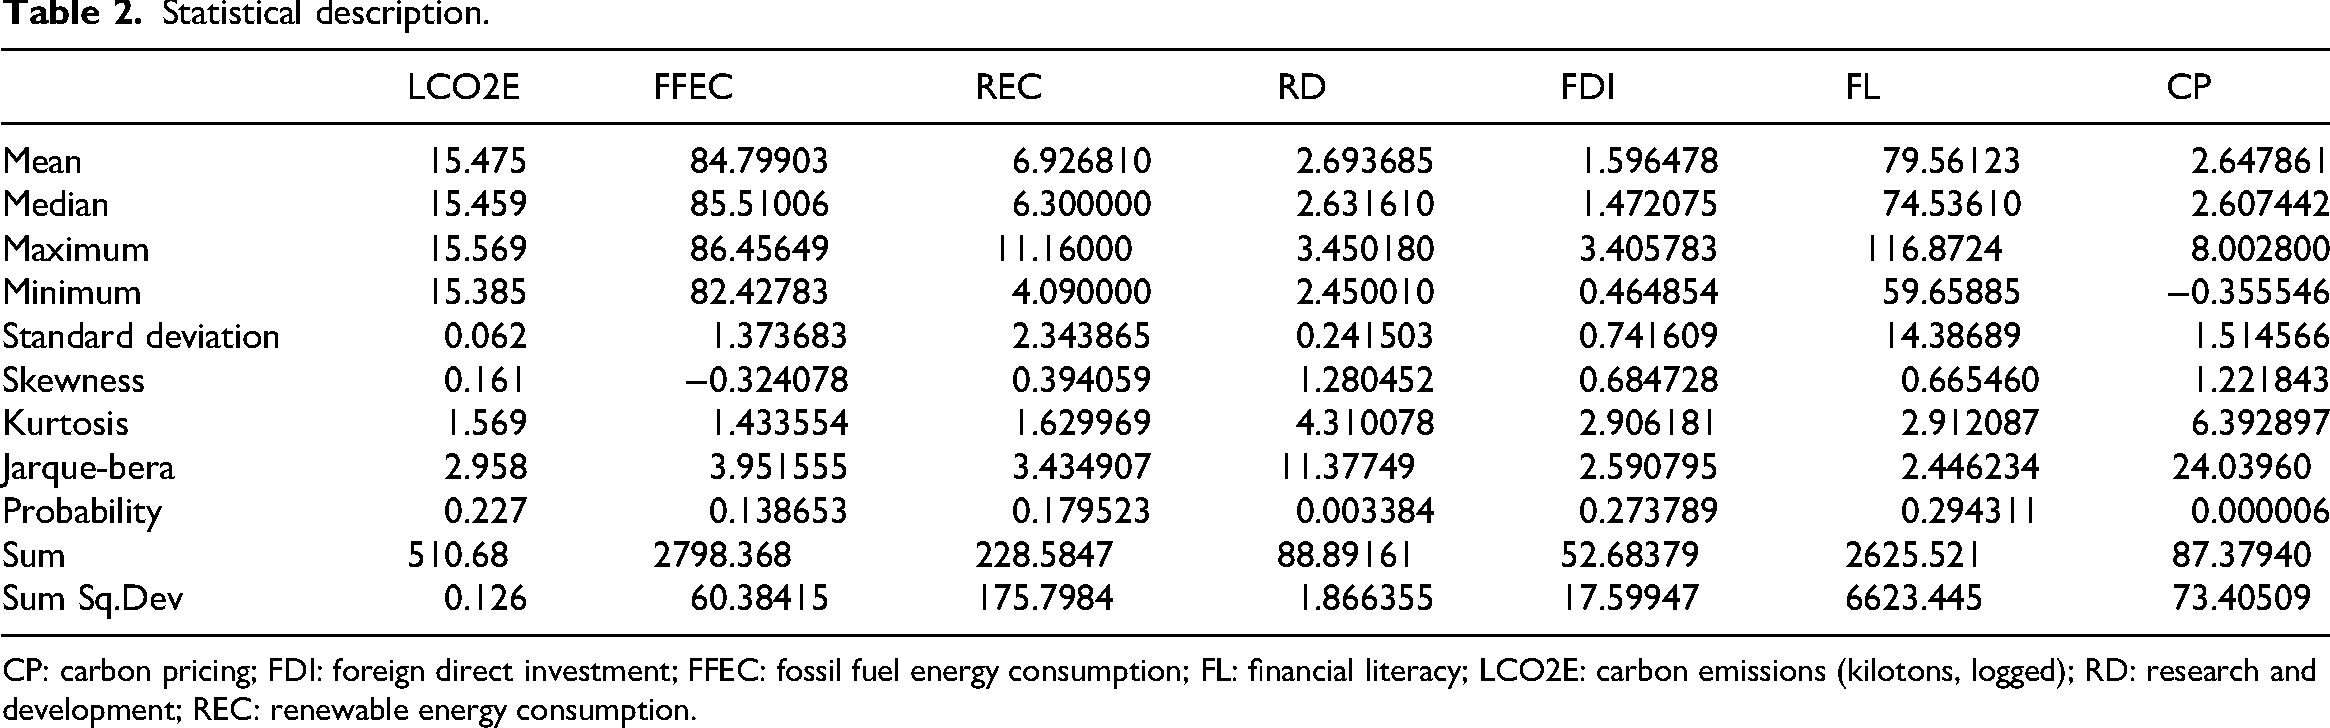
CP: carbon pricing; FDI: foreign direct investment; FFEC: fossil fuel energy consumption; FL: financial literacy; LCO2E: carbon emissions (kilotons, logged); RD: research and development; REC: renewable energy consumption.
Carbon emissions (LCO2E), R&D, FL, FDI, REC, and CP are among the variables that, as the table illustrates, show positive skewness, meaning that their values are concentrated toward the lower end of the distribution with a longer right tail. On the other hand, there is a minor negative skewness in FFEC, which indicates that the distribution is concentrated toward higher values. While other variables exhibit platykurtic traits, suggesting flatter distributions, kurtosis values demonstrate that RD and CP have leptokurtic distributions, with sharper peaks than a normal distribution. The majority of the variables also deviate from normalcy, according to the Jarque–Bera test, with RD and CP displaying statistically significant deviations. Understanding the structure of the data and assuring suitable econometric modeling like the ARDL approach used, which is robust to such non-normalities require these distributional insights.
Trend analysis
Figure 6(a)–(f) provides a profound insight regarding the trend for each variable across the span of 1990 to 2022. In Figure 6(c), the trend evaluation spanning 1990–2022 concerning carbon emissions depicts an increase in carbon emissions followed by a steady and stable pattern from 2005 to 2009. Fortunately, a reduction in carbon emissions was experienced from 2009 to 2016 due to two main factors (i) the financial crisis of 2008 and (ii) a decline in economic expansion. Later on, in the wake of this, there was a slight uptick in carbon emissions. Successively, a significant decline was witnessed after the pandemic due to the decrease in industrial and transportation activities.
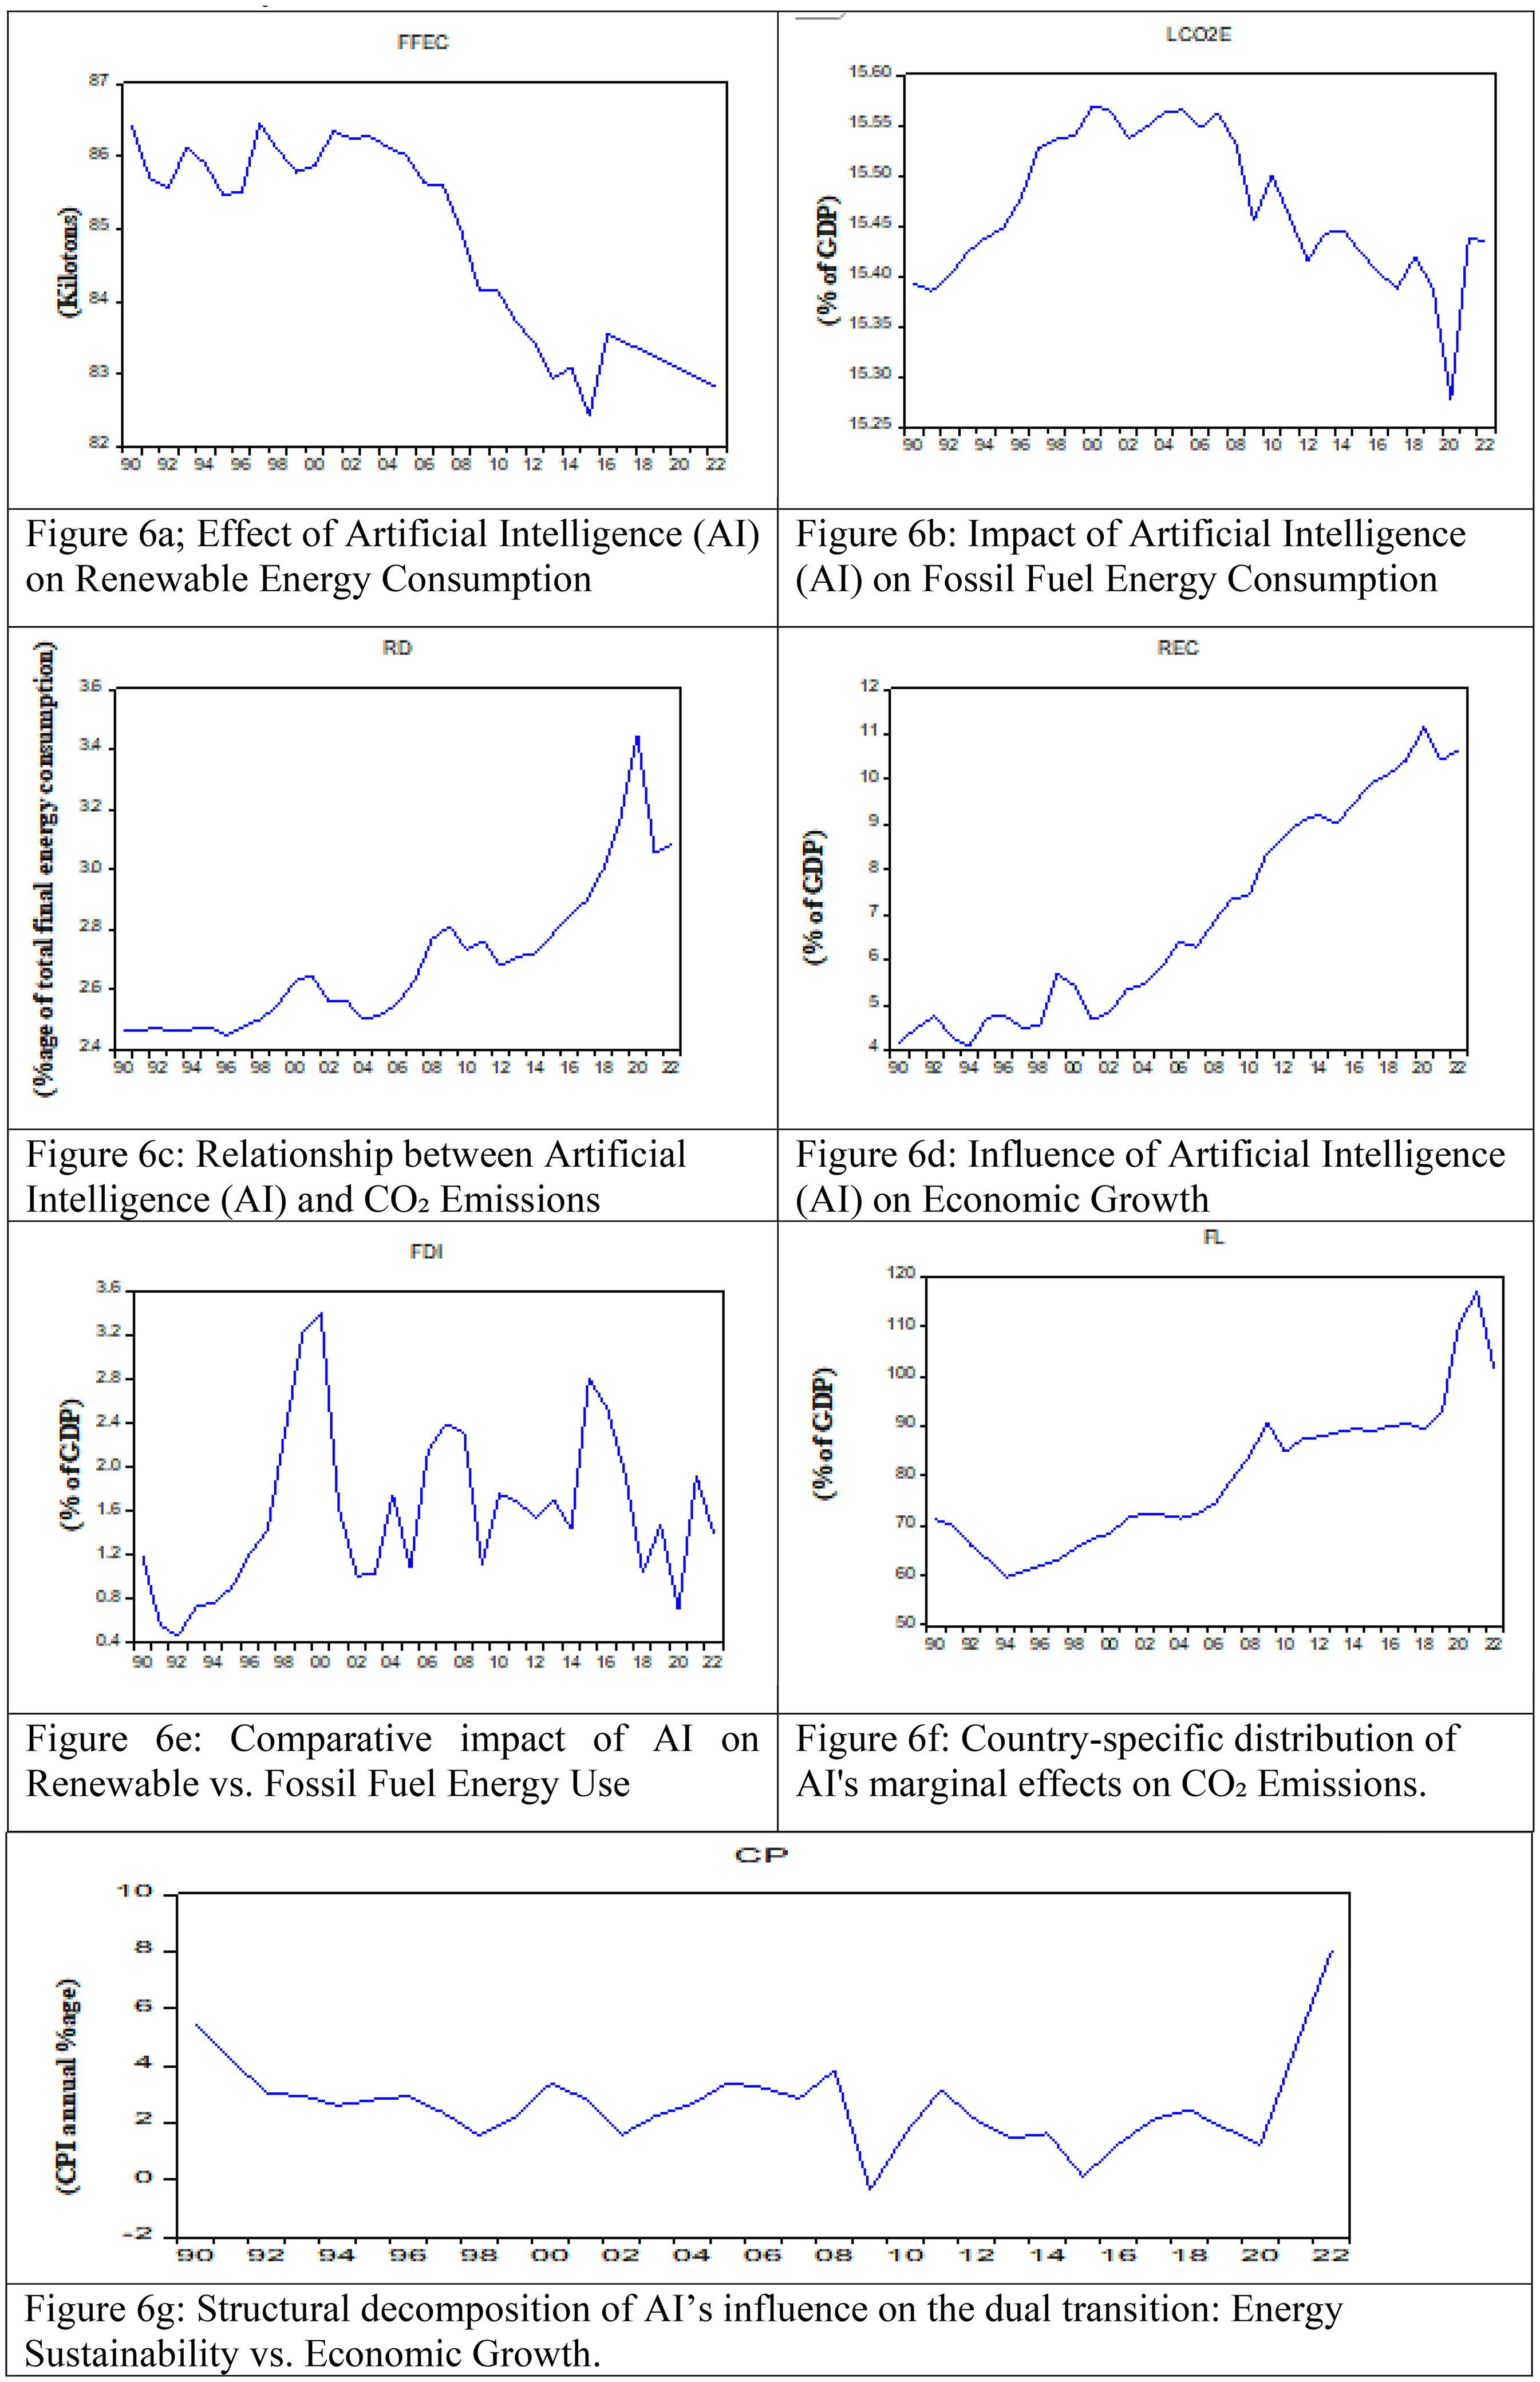
(a) Effect of AI on renewable energy consumption; (b) impact of AI on fossil fuel energy consumption; (c) relationship between AI and CO₂ emissions; (d) influence of AI on economic growth; (e) comparative impact of AI on renewable versus fossil fuel energy use; (f) country-specific distribution of AI's marginal effects on CO₂ emissions; and (g) structural decomposition of AI's influence on the dual transition: energy sustainability versus economic growth. AI: artificial intelligence.
In the United States, over the course of history, conventional energy sources have been the main players contributing to the consumption of energy. However, some primary factors that fostered this upward trajectory were industrial, population, and economic expansion till 2001, encompassing the highest levels in 1999. Later, a downward trajectory was observed and reached its lowest level in 2015 due to the shift from the consumption of coal toward the consumption of natural gas, believing lower levels of greenhouse gas emissions and its abundance. A drastic upsurge in nonsustainable energy sources was witnessed up till 2017, yet lower levels were observed in the previous years. Besides, from the years 2017 to 2021, a clear downward path is witnessed that the utilization of renewables has been steadily increasing over the years. Government policies, incentives, and technological advancements have contributed to the growth of renewables (Figure 6(d)).
From 1990 to 1999, Figure 6(e) illustrates the increasing and decreasing patterns due to the capacity of the usage of renewables. After 1999, due to the strongest influence of the installation of biomass, geothermal, hydroelectric, solar, and wind panels, along with multiple highs and lows. Moreover, a steadily inclining phase is observed till 2020 reaching its peak level in 2021 mainly owing to the declining cost of technologies (wind and solar). Due to grants, incentives, and tax credits and the encouragement of investments in such projects, some fair share of multiple declining and inclining phases are seen in 2021 and then in 2022, respectively.
Similarly, being a global leader in R&D, the United States has faced a general increase in private and public sectors leading to an economic upswing from 1990 to 2020 (Figure 6(f)). The need and changes in technological advancements bring a focal shift in R&D technologies in certain areas. The government of the United States, along with several agencies named Defense Advanced Research Projects Agency (DARPA), the National Institutes of Health (NIH), the Department of Energy (DOE), and the National Science Foundation (NSF) plays a substantial role in burgeoning research in such areas. Government funding is a driving force to initiate research in certain critical areas, and the support of such activities can only be possible through various agencies.
Historically, it is observed that among Asian countries and China, the United States is one of the most noticeable developed countries having extensive market size, a friendly environment for business, and an unwavering economy which ultimately paves the way for significant upsurge in FDI. Over the span of 1990–2022, the United States has witnessed three discernible peaks, one in 2001, another in 2007, and the last one observed in 2016. The peak detected in 2002 was the highest of all. The decline in investments from 2007 to 2009 and in 2019 is because of the global financial crises and COVID-19, respectively. In the time interval from 1990 to 2019, a substantial investment is being attracted by the technological sector in contrast to the others. The COVID-19 era had a profound adverse influence on the investment flows globally, including the United States. From 2020 to 2021, Greenfield investment is the sole reason for the attraction of substantial investment in the United States.
When it comes to FL, Figure 6(f) portrays the steadfast and incremental upturn in FL concerning the period 1990–2022, reaching its ever-highest level in 2021, followed by a sharp decline later on. The significance and awareness spurred among policymakers, the public, and educators regarding FL are dedicated to economic events, that is, financial crises and recessions. However, the journey has not ended yet because FL is still facing certain disparities, despite progress.
Concerning CP, Figure 6(g) illustrates its fortunes rise and fall throughout the entire timeframe. In the early 1990s, initiatives regarding CP had gained momentum in the United States. These initiatives were taken at the state and regional levels during the 1990s and in the early 2000s but, unfortunately, were not implemented at the federal level. Later on, some states implemented cap and trade programs within their jurisdictions amidst the decade of the 2000s. After signing the Paris Agreement in 2016, debates on CP have intensified, leading to time for introducing this mechanism nationwide. Later on, it is observed that federal legislation has evolved rapidly, but nationwide policies are under consideration. Moreover, in 2014 a shift in federal support was observed after the withdrawal from the Paris Agreement, yet some have maintained their commitments to this mechanism. CP is being adopted as an integral part of mitigation strategies to attain sustainability from the years 2020 to 2022.
Unit root test
The abovementioned Table 3, it is fairly apparent from the unit root test that except for FDI and FL, all constructs confirm statistical significance at the 1% significance threshold and are integrated of purely order I (1) and I (0), which further adds weight to the likelihood of using ARDL regression technique because our under-observation model exhibits mixed orders of integration.
Augmented Dickey–Fuller test.
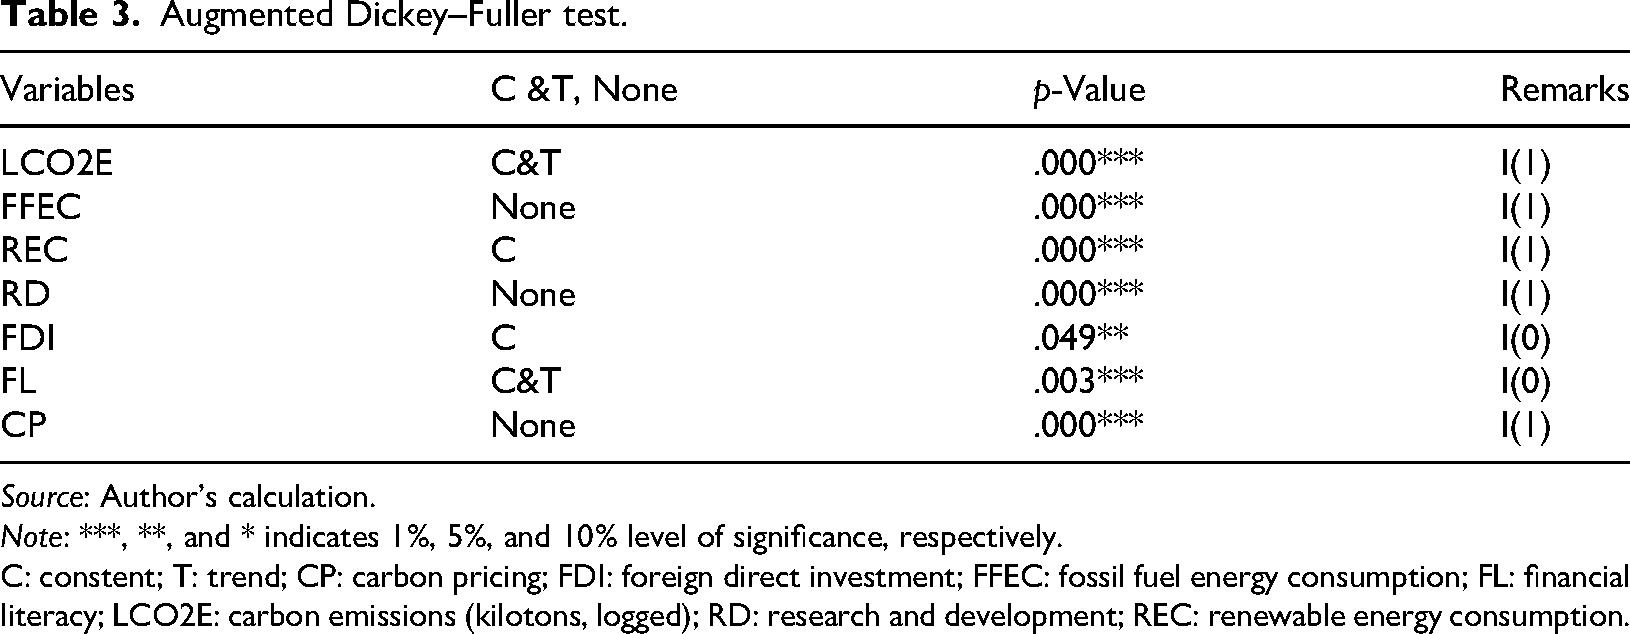
Source: Author's calculation.
Note: ***, **, and * indicates 1%, 5%, and 10% level of significance, respectively.
C: constent; T: trend; CP: carbon pricing; FDI: foreign direct investment; FFEC: fossil fuel energy consumption; FL: financial literacy; LCO2E: carbon emissions (kilotons, logged); RD: research and development; REC: renewable energy consumption.
ARDL estimation technique
Bound test for co-integration
The estimated diagnostic findings in Table 4 for the bound test for co-integration are shown for the respective models providing evidence that at a 5% level of significance F-calculated observed is 11.380 (p-value < .01) which is greater than the upper and the lower bound that is 2.45 and 3.61, respectively, ratifying the proposed hypothesis. It means that in the under-observed model, the likelihood of a long-run relationship exists among variables.
Bound test results.
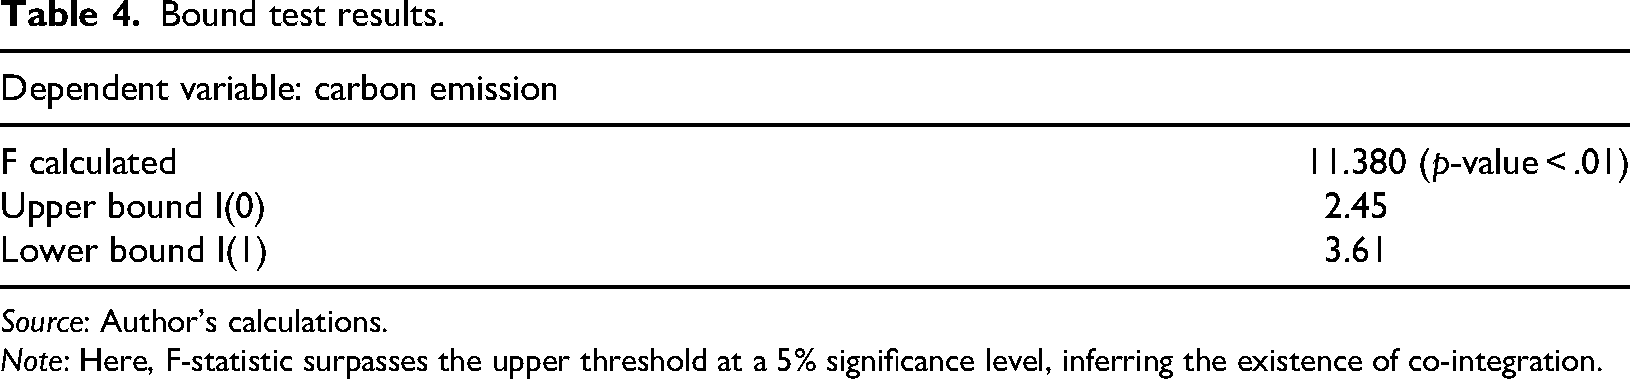
Source: Author's calculations.
Note: Here, F-statistic surpasses the upper threshold at a 5% significance level, inferring the existence of co-integration.
Long-run estimation of parameters from ARDL models
The long-run ARDL results highlight that renewable energy, fossil fuel, and FDI are lined with carbon emission. While carbon pricing, research and development help to reduce emissions over the long term. These outcomes indicate that although energy consumption and investment support economic activity, stronger prominence in innovation, awareness, and carbon-pricing policies is essential to accomplish environmental improvement.
Short-run estimation of parameters from ARDL models
In this model, the respective studies assessed the impact of consuming non-RE, R&D, renewables, foreign inflows, FL, and CP on carbon footprints. For long- and short-run analyses, the estimated results are represented in Tables 5 and 6, respectively. The empirical results obtained for the usage of nonrenewables illustrate that the estimates of fossil fuel energy utilization have a positive relation with carbon discharges in the long and short run; consequently, a change of 0.042% in carbon gas emissions is due to the usage of fossil fuels energy resources. The outcomes witnessed coincide with preceding empirical inquiries asserting that the growing energy demand, limited carbon capture and storage, and industrial and transportation usage coupled with the extensive global and economic reliance on fossil fuels exacerbates the issues of carbon gas emissions and hampers sustainable ecology.43,69
Long-run estimation of parameters.
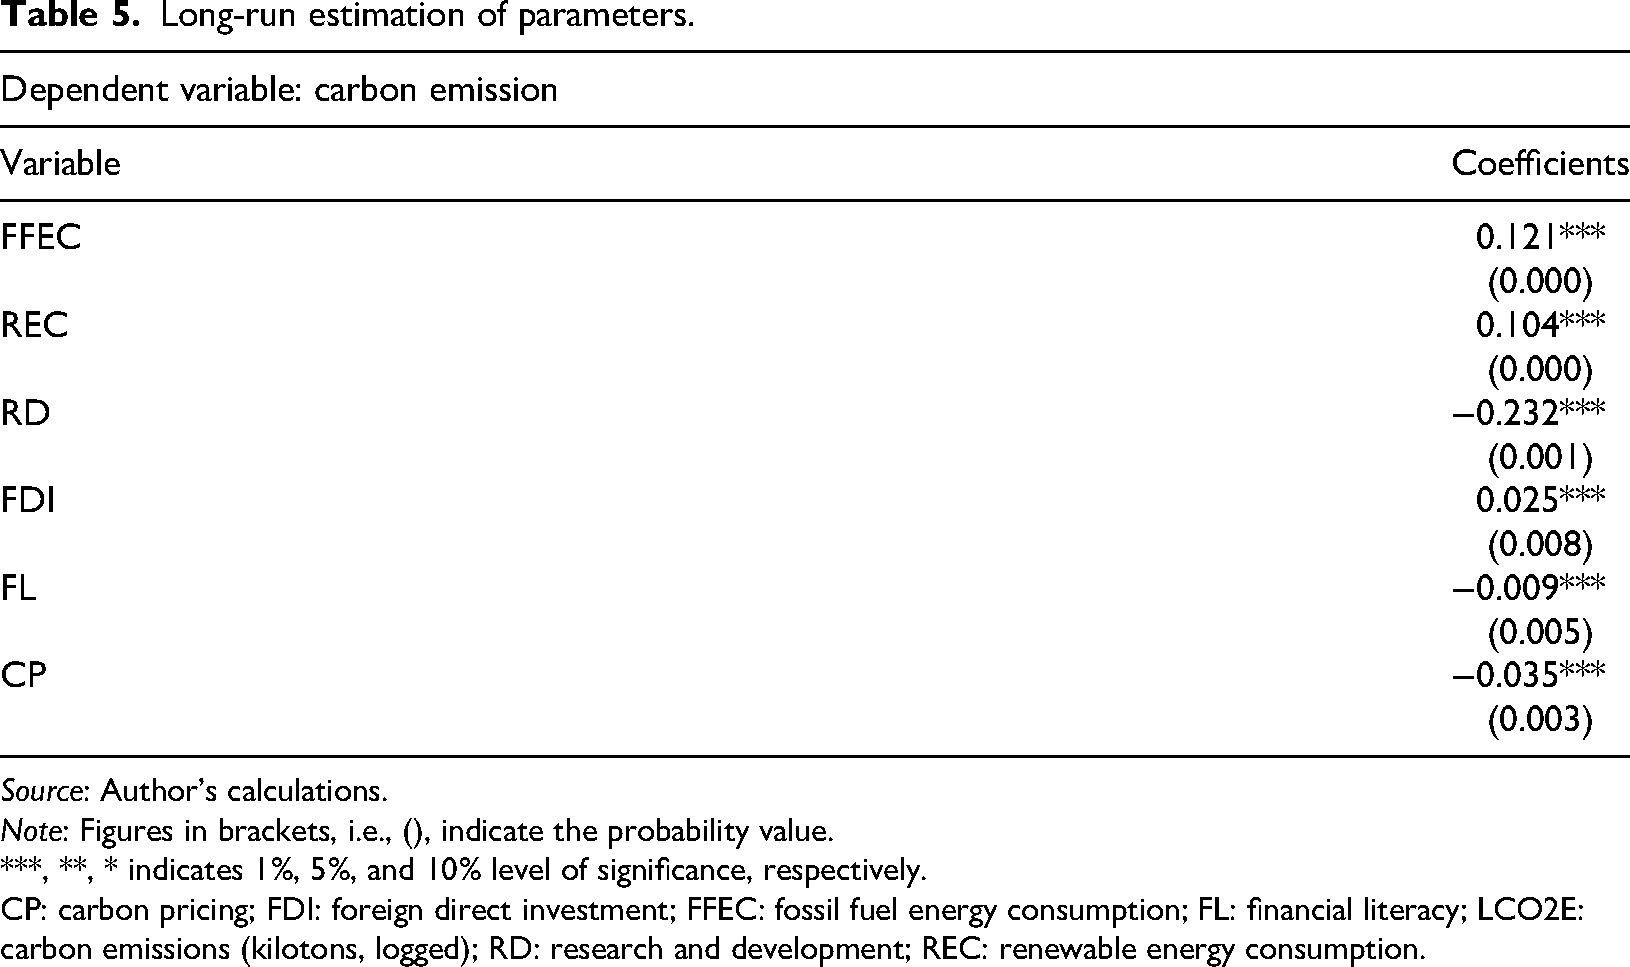
Source: Author's calculations.
Note: Figures in brackets, i.e., (), indicate the probability value.
***, **, * indicates 1%, 5%, and 10% level of significance, respectively.
CP: carbon pricing; FDI: foreign direct investment; FFEC: fossil fuel energy consumption; FL: financial literacy; LCO2E: carbon emissions (kilotons, logged); RD: research and development; REC: renewable energy consumption.
Short-run estimation of parameters.
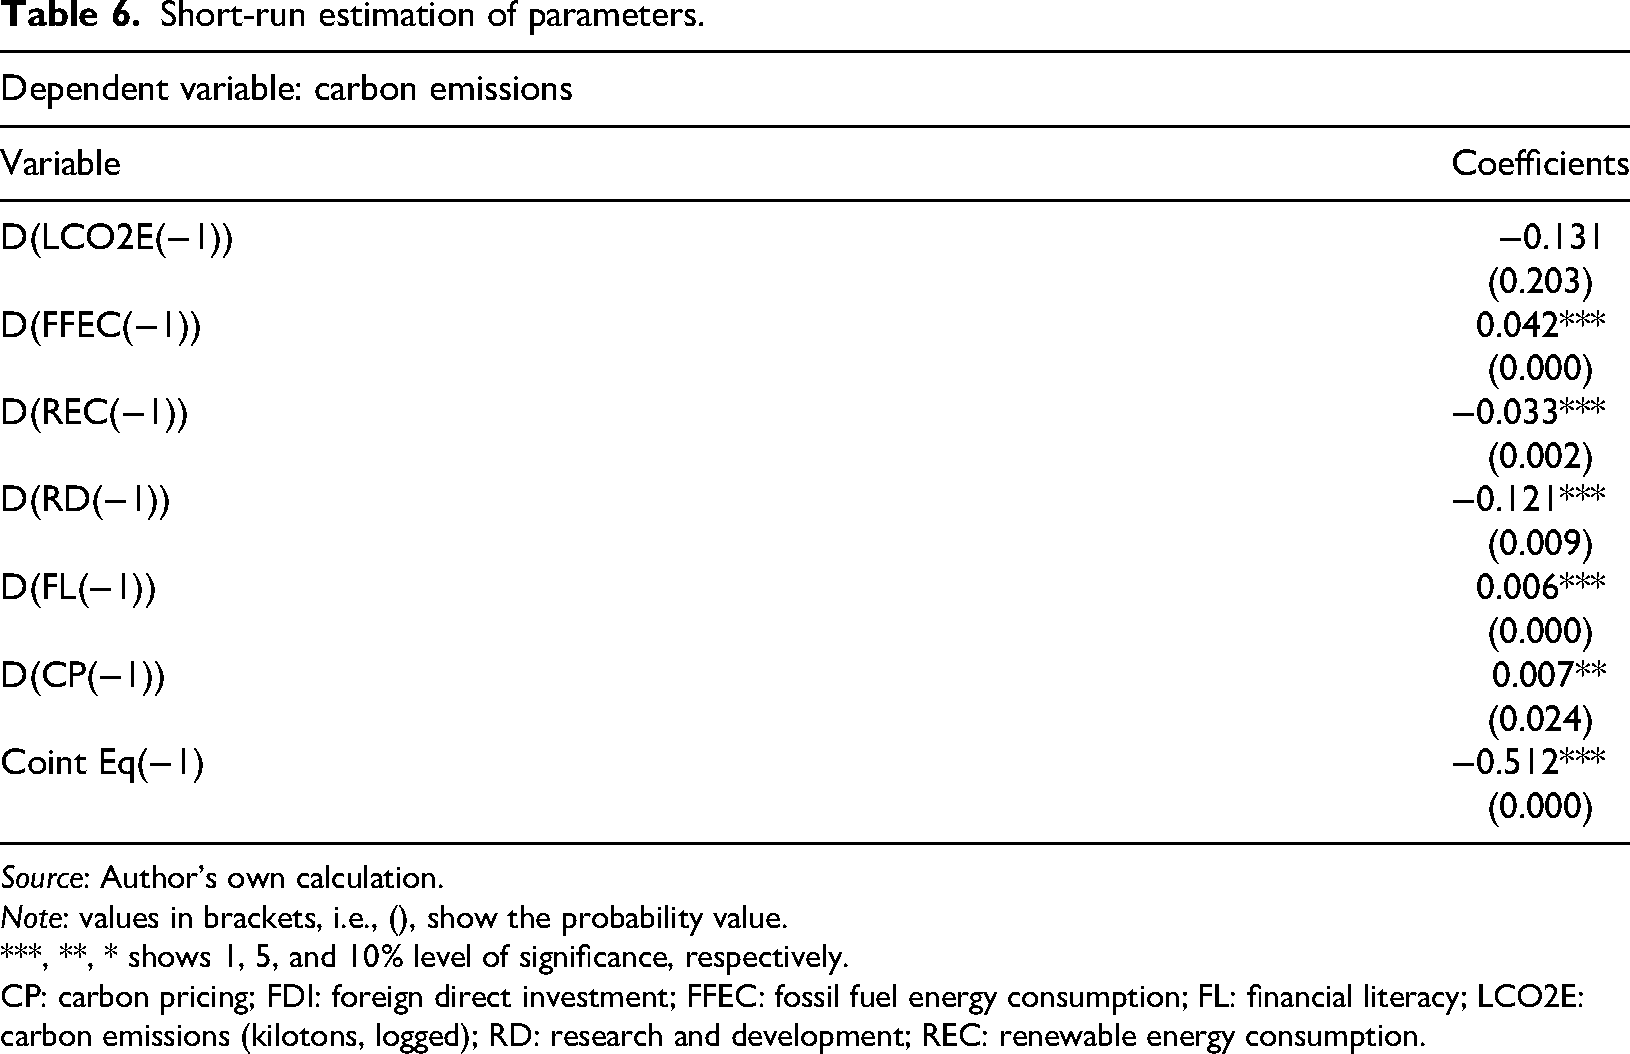
Source: Author's own calculation.
Note: values in brackets, i.e., (), show the probability value.
***, **, * shows 1, 5, and 10% level of significance, respectively.
CP: carbon pricing; FDI: foreign direct investment; FFEC: fossil fuel energy consumption; FL: financial literacy; LCO2E: carbon emissions (kilotons, logged); RD: research and development; REC: renewable energy consumption.
The empirical findings for REC illustrate the negative and positive impact on RE utilization and carbon gas emissions at a 1% significance level, that is, in the short run, a 1% upsurge in usage of RE mitigates carbon emissions by 0.033%. Conversely, in the long run, an increase in carbon gas emissions is escorted by an increase in REC, that is, an increase of 0.104% in carbon emissions is owing to a percent rise in RE utilization. The evidence validates the previous research results and postulates the fact that carbon emissions can only be decreased by an increase in the adoption of renewables. Moreover, there are certain other reasons which have an indirect impact on increasing carbon gas discharges. Renewables such as wind and solar are dependent on weather conditions. During bad weather conditions, natural gas is used as the backup power source for the continuous supply of energy in some regions. Land use changes, system integration challenges, and supply chain and infrastructure are some other reasons which played an indirect role in the rise in carbon discharges.45,46
On the other hand, regression results for under observed models suggest that at a p-value cutoff of 1%, a 0.232% and 0.121% decline in carbon gas emissions is attributed to a rise in R&D in the long run and short run, respectively. The findings align with existing empirical evidence stating that advancements in renewables, carbon capture, and storage technologies, green building novelties, industrial processes with low-carbon emanation, and ecologically friendly transportation all these factors collectively pose noteworthy progress in the reduction of carbon gas emissions and transitioning toward greener future.28,47
Furthermore, for FDI, a 1% upsurge in foreign inflows ramps up the carbon discharges by 0.025% in the long run at a statistical threshold of 1%, illustrating that a boost in FDI translates into an upsurge in carbon footprints. The results are in line with past empirical evidence indicating that industrial expansion, energy-intensive projects, insufficient ecological regulations, and shifts in patterns of production ultimately aggravate carbon discharges. 53
Additionally, the research findings revealed that a percent increase in FL leads to an increase of 0.006% in short-run carbon gas emissions and a decline of 0.009% in long-run carbon discharges. Further, this indicates that in the long run, FL unveils a substantial negative effect on carbon gas emissions. The findings are consistent with the former empirical research, which states that awareness regarding energy efficiency, sustainable lifestyle, consumption and transportation choices, and, above all, investment concerning carbon offsetting initiatives leads to a reduction in carbon gas emissions.67,68,72
Lastly, the coefficient of CP has a noteworthy positive influence on emanations at a 1% level of confidence, demonstrating a 0.009% decrease in carbon emissions resulting from an escalation in CP in the long run. The results obtained accord with former empirical inquiries stating that the provision of financial incentives on reduction in emanations and encouragement for investing in low-carbon and carbon offset projects are the factors behind the efficient transition to a carbon-neutral economy.30,6971–73
Table 6 portrays the stability of the equilibrium relationship by the ECT, which fulfills the criteria of having significant and negative values. In the long run, rather than the oscillatory convergence to the equilibrium, the ECT of models shows a monotonic convergence to the long-run equilibrium.
Diagnostic tests
Different diagnostic tests have been applied. Firstly, by employing the serial correlation LM test, the existence of autocorrelation is detected and is catered to via the implementation of the HAC Newey West test. Secondly, the issue of multicollinearity is being identified by utilizing the variance inflating factor (VIF) in the model. Concerning the acceptance of the null hypothesis, the VIF centered should be below the threshold level that is 10, ultimately demonstrating the absence of multicollinearity in the regression model (VIF < 10 = no multicollinearity).
The procured VIF results, as outlined in Table 7, point out the rejection of the null hypothesis or the presence of multicollinearity in the respective model, and the attained results coincide with 86 confirming that in certain contexts moderate correlations can be acceptable and can still provide valuable insights. Additionally, the R-square of the model is 97% indicating the overall model's goodness of fit.
Variance inflating factor (VIF).
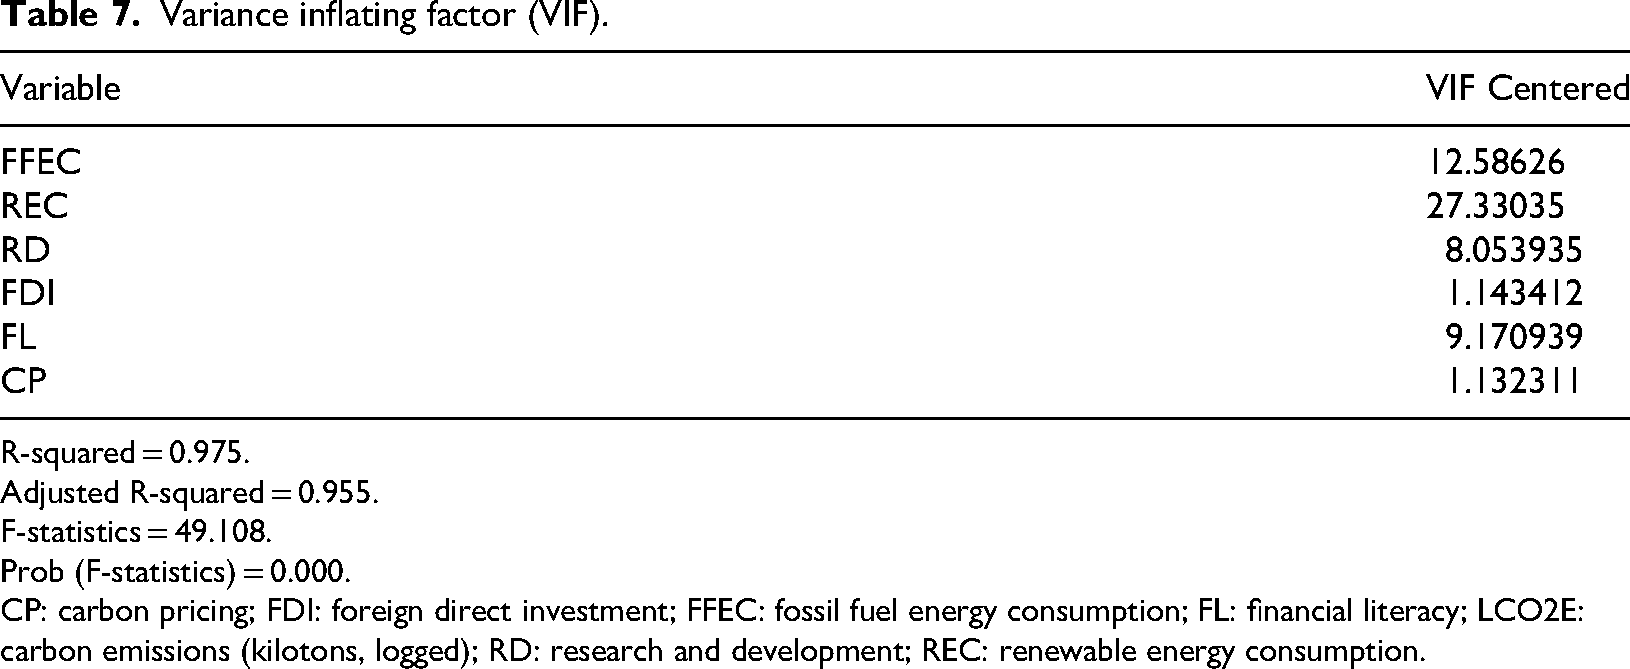
R-squared = 0.975.
Adjusted R-squared = 0.955.
F-statistics = 49.108.
Prob (F-statistics) = 0.000.
CP: carbon pricing; FDI: foreign direct investment; FFEC: fossil fuel energy consumption; FL: financial literacy; LCO2E: carbon emissions (kilotons, logged); RD: research and development; REC: renewable energy consumption.
CUSUM and CUSUM square tests
The stability assessment of the coefficients is gauged by using the CUSUM and CUSUMSQ test in the ECM model. These tests were authored by Brown et al. 85 As the CUSUM and CUSUMSQ plots lie in the two 5% critical bounds, it is evident that the parameters remain stable in the proposed sample, as shown in the plots 13 (a) and (b), as given in Figure 7.
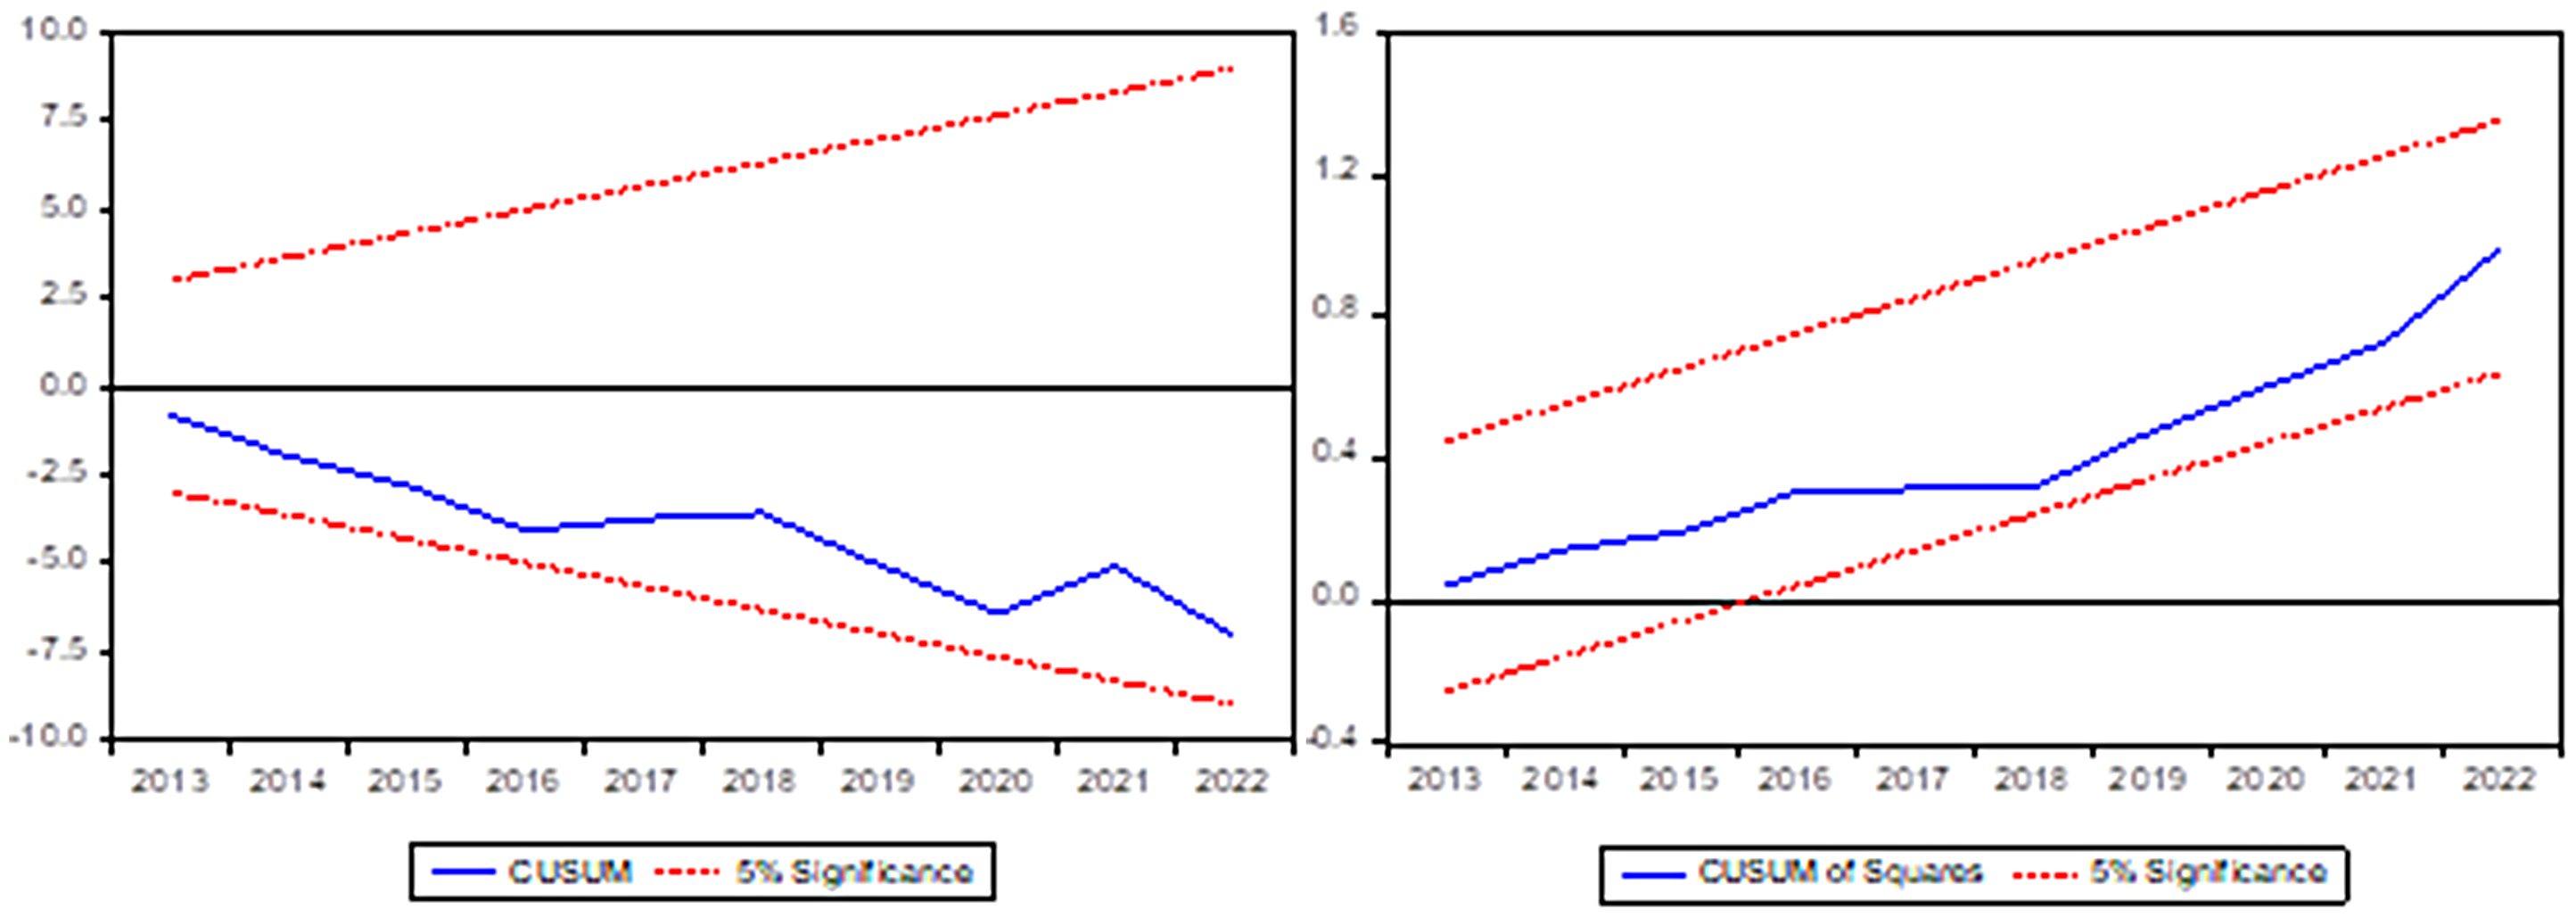
(a) The plot of CUSUM and (b) CUSUMQ for coefficient stability of the ECM. CUSUM: cumulative sum; CUSUMQ: cumulative sum of square; ECM: error correction model.
Forecasting accuracy
The final predicted CP is obtained with the assistance of the BNN model. It was observed that BNN has achieved high accuracy and minimized the errors at its best. The reason behind forecasting CP is to mitigate carbon emissions, stabilize the economy, transition toward low-carbon economy and revenue generation and provide environmental justice.
On the other hand, the trend between forecasted and actual is observed to follow the accuracy as shown in Figure 8(b). As it is already seen by the means of quantifying measures that BNN has outperformed well, the trend between actual and forecasted CP also demonstrates a sharp following. The trend is examined on the test indices, as in Figure 8(c). Regression analysis is also built to keenly observe the performance of BNN. From the regression coefficient, it can be easily determined that it approaches 1. By the criterion, if the estimates of the R approach near 1; the model has achieved good accuracy. In prospect, the variant of AI can be a promising tool for bringing up solutions for mitigating carbon emissions and a low-carbon economy for up to several years. Moreover, different training models can also be adopted to forecast the different parameters. Lastly, the BNN model's scope extends to the energy forecast mechanism and brings solutions to energy-related problems.
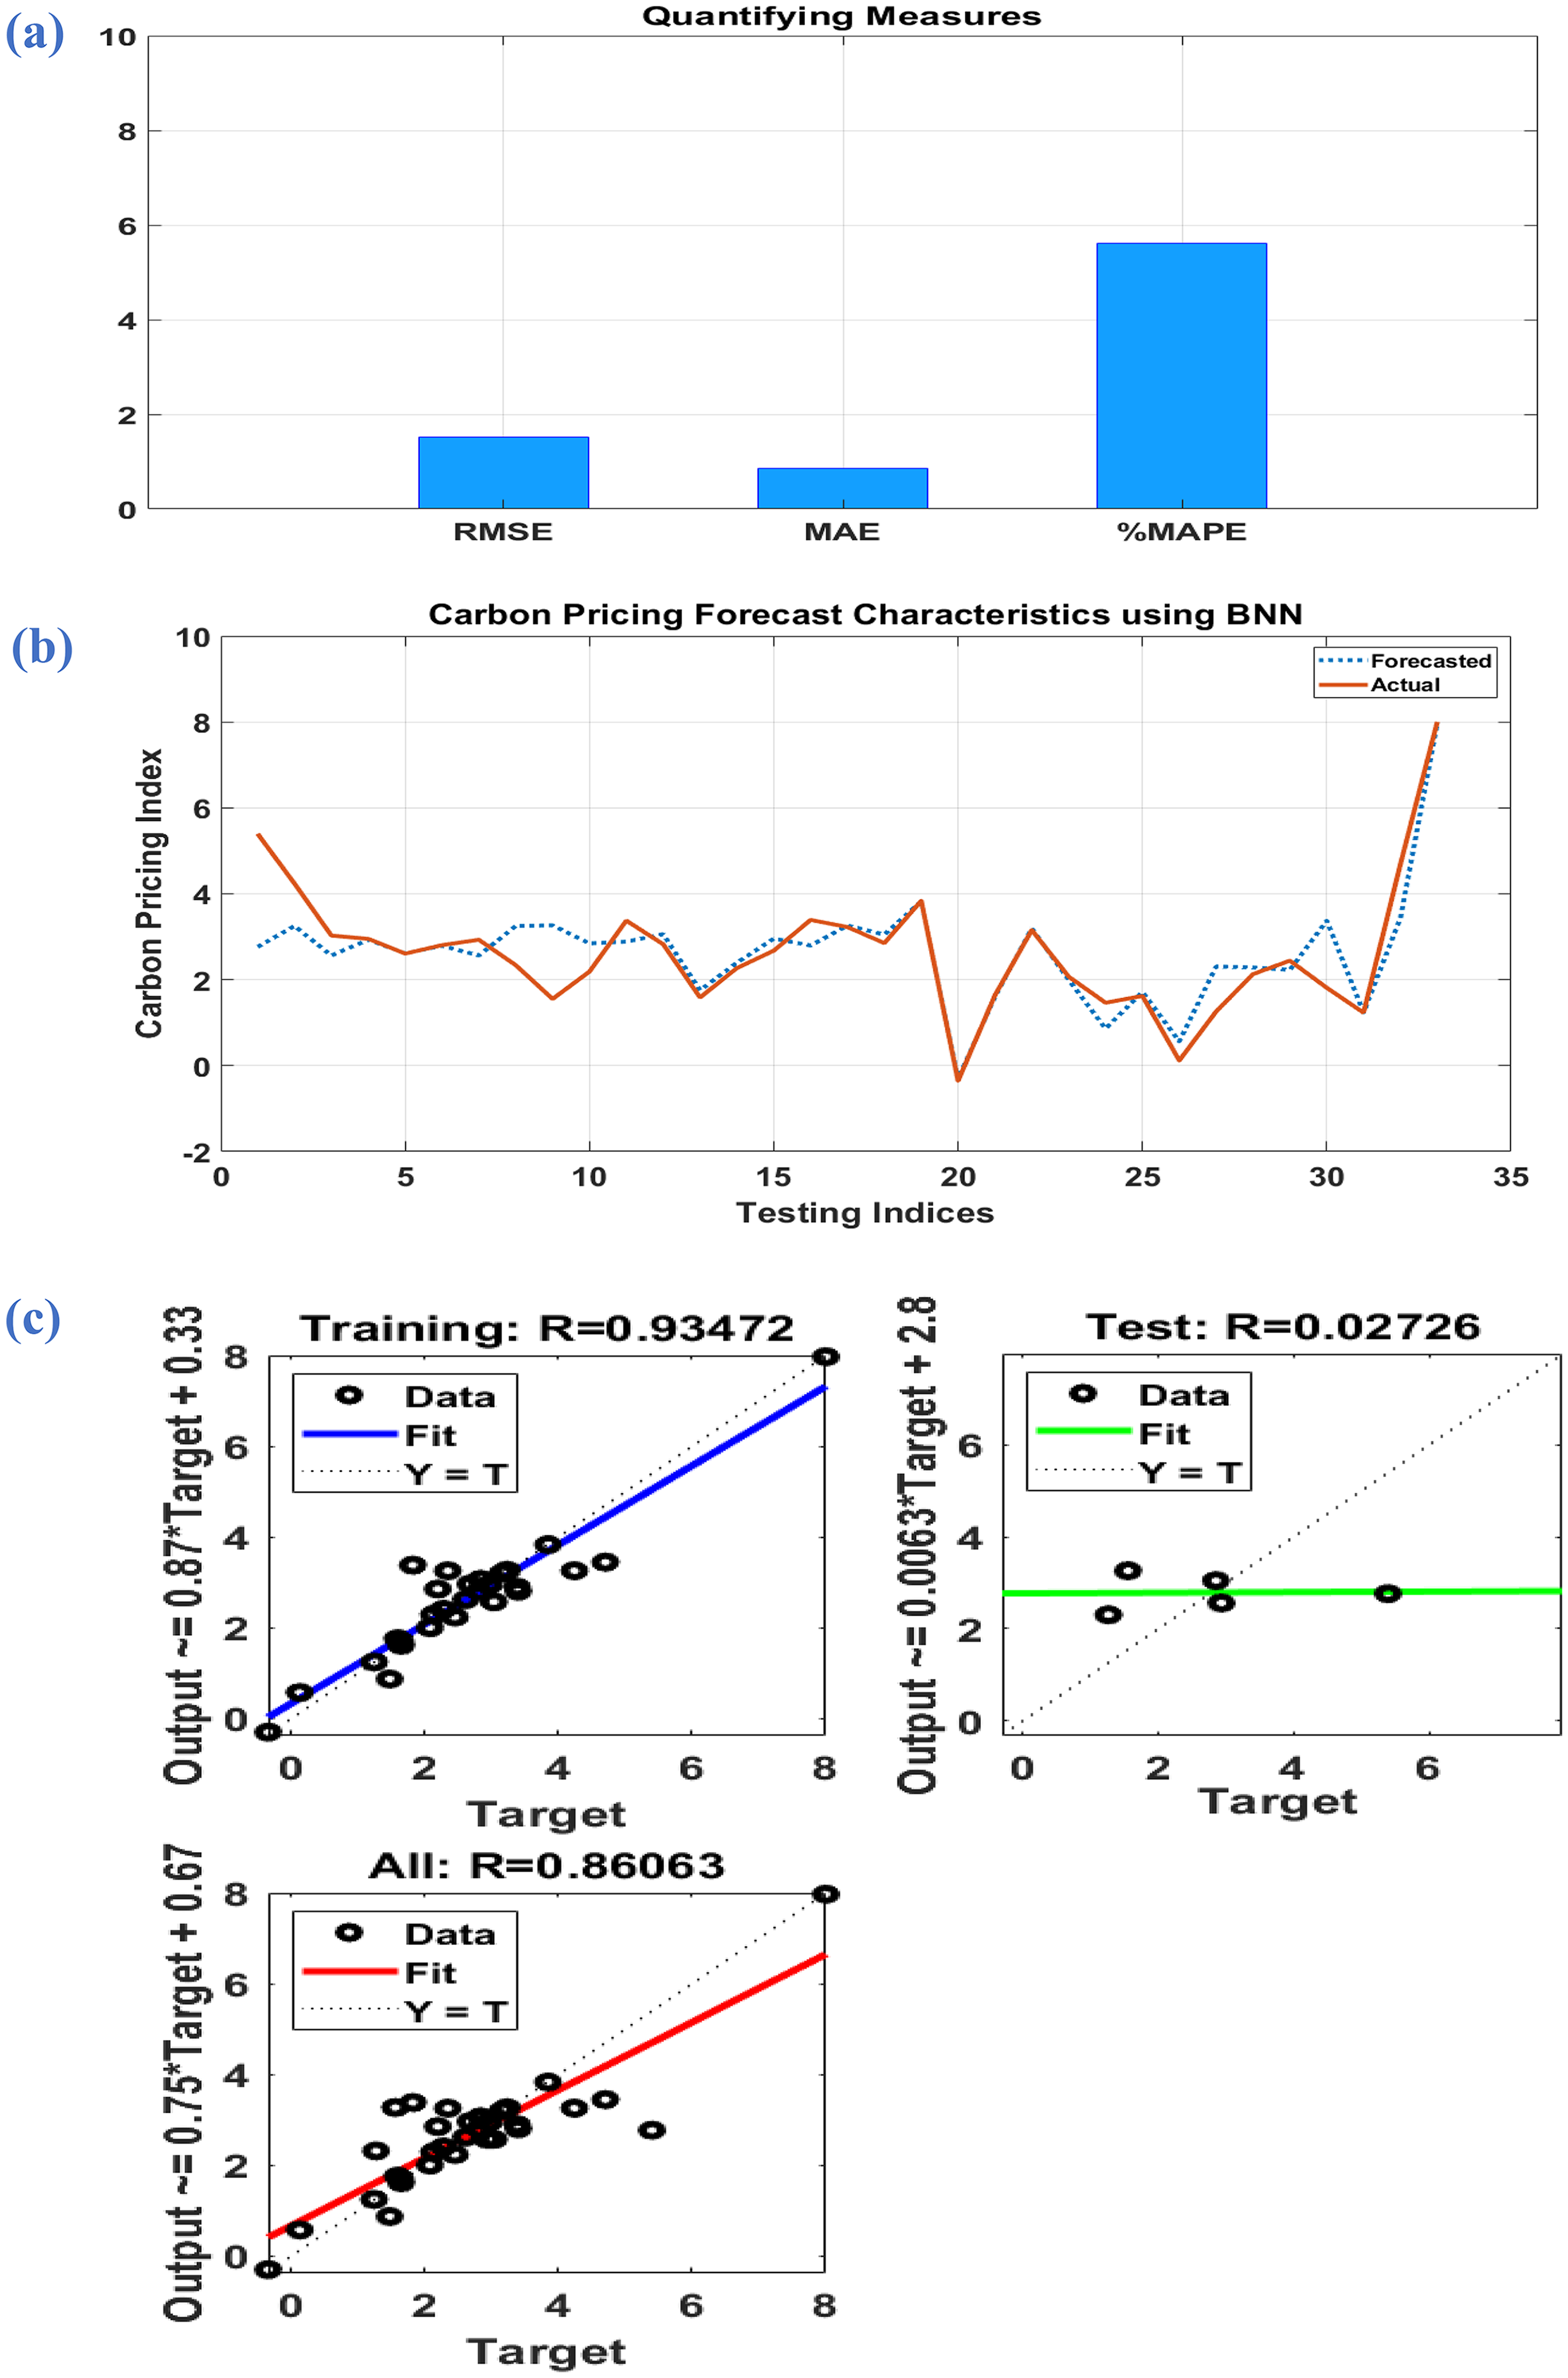
(a) Quantifying measures, (b) forecasting of carbon pricing by using BNN, and (c) regression analysis of the forecast performed by the BNN. BNN: Bayesian neural network.
Economic feasibility and financing models for the AI-driven sustainability
Estimating economic costs and benefits of AI in the carbon markets
The adoption of AI in the carbon markets involves notable upfront costs related to infrastructure, data integration, computational capabilities, and the human capital development. Estimates suggest that initial AI deployment in the CP platforms may require investments ranging from $$50 million to $$150 million at the national level, depending on scope and scale. 87 However, these costs are often outweighed by the medium- to long-term benefits. AI integration can significantly improve the market efficiency, reduce transaction costs, and minimize the leakage or fraud. For example, AI-powered systems can increase the carbon credit verification speed by 40% and cut the administrative overheads by up to 25%. 88 Moreover, predictive AI can enhance pricing of carbon allowances by optimizing the supply-demand forecasts, potentially adding 1.5% to 2.8% GDP gains in green transition scenarios by 2040. 74 Therefore, when evaluated over a 10- to 15-year horizon, AI systems in the carbon markets often yield a positive net present value (NPV) and internal rate of return (IRR) well above the typical public-sector benchmarks.
Financial viability of AI adoption in the developing economies
Despite long-term benefits, the feasibility of the adoption of AI remains a major concern for developing economies. Many lack the necessary digital infrastructure, skilled labor, and fiscal capacity to absorb the high initial costs. Furthermore, developing nations often face competing fiscal priorities such as poverty alleviation and public health, reducing the political appetite for high-tech climate tools. Yet, these countries also stand to benefit most from the AI's potential to predict climate shocks, optimize renewable integration, and support resilient energy planning. Studies by World Bank 89 highlight that even partial AI deployment (e.g. in the smart metering, predictive maintenance, or emissions tracking) could lead to the energy efficiency gains of 8% to 12% and emission reductions of 10% to 18% in middle-income economies like Indonesia, Kenya, and Pakistan. Financial viability can thus be improved through the targeted subsidies, concessional finance, and technology transfer from more developed countries. Furthermore, regional cooperation (e.g. ASEAN, African Union) can pool the resources for shared AI platforms that support CP and green investment.
Role of public–private partnerships in financing the AI-driven sustainability
Public–private partnerships (PPPs) offer a viable model to finance and deploy the AI in green energy systems, especially in resource-constrained settings. In the United States and EU, PPPs have already been instrumental in the developing smart grids, energy analytics platforms, and AI-assisted emissions monitoring systems. For developing economies, PPPs can leverage public funding to de-risk private investment in the climate AI technologies. Models like Build-Operate-Transfer (BOT) and Design-Build-Finance-Operate (DBFO) allow private firms to recover the investment while transferring knowledge and operational capacity to governments. Furthermore, green bonds, climate venture capital, and blended finance initiatives by institutions like Green Climate Fund (GCF), International Finance Corporation (IFC), and Climate Innovation Labs can catalyze the investment in AI-based CP tools and policy analytics. For instance, India's National AI Mission includes a public–private collaborative framework to use AI in the energy demand forecasting, with contributions from both Tata Power and the Ministry of New and Renewable Energy. These financing structures are essential to democratize access to the AI-driven sustainability and ensure climate justice.
Policy implications of AI in the climate governance
AI-driven carbon pricing at the national and global levels
AI can enhance the CP systems by improving the accuracy, transparency, and responsiveness of pricing mechanisms. At national level, AI tools can be deployed to dynamically calculate the optimal carbon prices using real-time emissions data, energy consumption patterns, and environmental feedback loops. For instance, AI enhanced the integrated assessment models (AI-IAMs) can simulate policy impacts under the multiple scenarios, enabling governments to adjust carbon taxes or cap-and-trade limits more efficiently. 74 Globally, AI can facilitate the harmonization of CP schemes by analyzing the cross-border emission spillovers and aligning price signals, thereby supporting the climate clubs or regional carbon markets such as the EU Emissions Trading System (ETS). AI can also help identify the carbon leakage and monitor compliance using satellite and IoT-based data sources, 90 thereby ensuring transparency and global accountability.
AI-enabled policy tools: Emissions trading and the predictive adjustments
Several AI-driven policy instruments are gaining traction. One such innovation is AI-based emissions trading platforms, which can automate the allowance auctions, detect fraud, and optimize trading efficiency. For example, machine learning algorithms can cluster the participants based on risk behavior or emissions profiles to create more efficient markets. 91 Predictive policy tools, such as reinforcement learning models, have also been proposed to simulate and optimize the policy interventions in real time, allowing governments to tweak subsidies or tariffs before the market distortions escalate. 92 AI can also forecast economic and environmental impact of the proposed legislation before implementation, reducing uncertainty associated with the long-term climate commitments and enabling adaptive governance models tailored to the emission thresholds and climate targets. 93
Regulatory and ethical considerations
Despite its promise, integration of the AI in climate governance raises significant ethical and regulatory challenges. One concern is algorithmic opacity that may reduce the public trust in AI-led carbon policy decisions. Moreover, there is a risk that AI may reflect and reinforce the existing socioeconomic biases, particularly if datasets are incomplete or skewed toward the high-income regions. 94 Surveillance-enabled AI systems for monitoring emissions also raise concerns regarding data privacy and state overreach. Regulatory frameworks should thus emphasize transparency, explainability, and democratic oversight of the AI models. Ethical AI in climate policy must adhere to principles of fairness, accountability, and inclusivity, as advocated by the recent international declarations such as the OECD's AI Principles 2023 and the EU AI Act 2024. Developing AI-specific environmental governance protocols will be essential for the responsibly scaling AI in support of global climate objectives.
Oil prices, the exchange rate, and inflation all have statistically significant long-term effects on stock market returns, according to the results of the ARDL model. Inflation has a negative impact (−0.356), indicating that ongoing inflationary pressure reduces investment returns. This finding has significant ramifications for monetary policy interventions. The efficiency of corrective market mechanisms is demonstrated by the short-run dynamics, which are represented by the ECT and validate quick adjustment to equilibrium. For central banks and fiscal authorities seeking to stabilize capital markets through inflation targeting and exchange rate management, the amount and direction of these coefficients offer useful information. While BNNs are excellent at capturing nonlinearities, benchmarking against ARIMA and ANN baselines shows that, in the absence of cross-validation safeguards, they show moderate signs of overfitting. BNN forecasting performance, as measured by RMSE, MAE, and MAPE, shows improved accuracy over traditional models. This is further supported by error analysis, which finds times of increased volatility that correspond with deviations from predictions. To better understand the temporal impact of shocks, Tables 3 to 5 should be studied in conjunction with the empirical sections. They visually highlight these linkages. The stability of the ARDL estimates and the predictive reliability of the BNN model are confirmed by robustness checks using alternate lag lengths and variable orders, as well as sensitivity tests conducted under various macroeconomic regimes. This strengthens the study's empirical soundness and policy significance.
Our findings align with the prior studies that emphasize positive role of RE on economic growth and environmental quality.36,95 Conversely, negative impact of the fossil fuel consumption on CO₂ emissions mirrors earlier evidence reported by the Dogan and Seker. 27 These comparisons reinforce robustness of our model and its policy implications.
Conclusion
The rapid pace of global environmental change and it's resulting in socioeconomic impacts necessitates a swift transition to a low-carbon economy. The alchemy of fossil fuel energy transforms into carbon gas emissions, and its adverse impacts portray the delicate equilibrium between energy and ecological stewardship. While the merging of AI with the energy sector, complemented by the deployment of econometric models and BNN, introduces a new era of transformative cooperation. In the array of previously reported research analyses for the United States, the current study is a preliminary analysis that scrutinizes the influence of energy mix along with some macroeconomic variables on carbon emanations, covering the period from 1990 to 2022. This study encompasses a broad spectrum of variables, including FFEC, technological innovation, REC, resource stability, FL, foreign direct inflows, and CP, and has illuminated the multifaceted dynamics of this collaboration. Based on the ADF test, the underlying study proceeds with the ARDL regression technique as some variables are stationary at I(0) & some are at I(1). The findings revealed that a percent increase in FL tends to increase by 0.006% in the short run and a decline of 0.009% in long-run carbon gas emissions.
Similarly, R&D and CP negatively and significantly impact carbon emissions, while foreign inflows and renewable and non-RE positively impact carbon secretions. However, the fifth industrial revolution could address global warming and environmental degradation by promoting low-carbon economy, a crucial step toward a sustainable future where humans and nature coexist harmoniously. Moreover, the central findings of underlying research depict the remarkable potential of AI and econometric modeling to optimize energy demand forecasting. The role of AI is integrated for predicting CP in terms of REC. Using BNN to predict CP and the quantitative analysis showed that BNN is highly accurate. Hence, through comprehensive investigations and rigorous analysis, the study unearthed insights that hold profound implications for the future of energy systems as well as sustainable development.
The BNN model, which incorporates historical data trends from 1990 to 2022, is used in scenario-based forecasting to anticipate a 15% reduction in carbon emissions by 2040. Without forcing AI's impact to take a rigid linear or exponential form, the model indirectly takes technological advancement into account through the historical evolution of variables like the adoption of RE and CP. BNN can adjust to intricate, data-driven patterns thanks to its nonlinear learning architecture. The training data incorporates the effects of external shocks, such as the COVID-19 energy crises, which capture their impact on the underlying variables throughout the corresponding periods, even though they are not explicitly treated as distinct variables. These presumptions, along with the adaptability of the BNN, offer a data-driven foundation for predicting emission trajectories under a continuation of observed dynamics.
Our findings imply that AI may significantly improve climate governance through data-driven decision making, which speaks directly to the policy dimension. In particular, the BNN model's excellent predicted accuracy shows how AI may be used to guide adaptive CP schemes, enabling policymakers to react to market dynamics and emissions trends more skillfully. Additionally, the creation of sophisticated tools like AI-enhanced emissions trading systems and predictive policy adjustment frameworks can be aided by AI's capacity to monitor emissions and maximize the integration of RE. While emphasizing empirical relationships, the current study also recognizes the significance of ethical and regulatory considerations in the deployment of AI, emphasizing the need for data governance, transparent algorithms, and equitable access to AI technologies in order to guarantee that digital innovation supports accountable and inclusive climate action.
Policy recommendation and limitations of the study
Policy recommendations
Based on the regression results obtained, the underlying study has proposed certain potential policy recommendations which are as follows: by accelerating the shift from nonrenewables, supportive policies such as subsidies and financial incentives should be given, which ultimately lead to reducing carbon gas emissions. Further, investing in AI and green energy markets, ensure the installation of renewable power plants, charging stations for electric vehicles, and viable transportation systems, thereby facilitating the transition toward green investment and cleaner economy. By incentivizing ecological practices as well as avoiding excessive deadly emissions, penalties should be imposed on high emissions concerning the maintenance of environmental regulations. Encourage worldwide collaboration on sharing best practices and utilization of AI-driven ideas to promote international resource stability.
Moreover, allocating funds for R&D concerning green hydrogen production and carbon capture and storage (CCS) technologies for the mitigation of the adverse environmental impacts of nonrenewables. Raising awareness regarding sustainable energy, adoption of ecologically friendly technologies, and keeping track of reducing carbon gas emissions will ultimately help the world to have a low-carbon economy. The necessity for US policy to prioritize improving carbon price systems and boosting R&D investment in order to attain quantifiable emission reductions. In order to more effectively capture nonlinear dynamics, we also suggest future research topics that include cross-country comparisons, larger datasets for AI training, and the investigation of hybrid models.
Hence, policymakers must implement these ambitious and binding policies which have the potential to achieve substantial reductions as well as promote accountability and transparency in meeting environmental targets.
Limitations of the study
The study acknowledges several limitations that may affect generalizability and precision of its findings. First, the analysis is limited to United States, which may constrain the applicability of results to the other countries with different economic structures, regulatory frameworks, and energy mixes. Second, while integration of the ARDL and BNN offers methodological innovation, BNN model is sensitive to the parameter selection and requires large datasets, which may introduce bias or overfitting in the smaller sample sizes. Third, use of proxy variables (e.g. FL via broad money, CP via inflation) may not fully capture underlying constructs, potentially affecting the measurement validity. Additionally, although external shocks like COVID-19 and energy crises are considered, their long-term structural impacts are difficult to quantify precisely. Lastly, ethical, legal, and data availability issues surrounding the AI implementation in environmental governance were only partially addressed, highlighting need for the further interdisciplinary research.
Footnotes
Funding
The authors received no financial support for the research, authorship, and/or publication of this article.
Declaration of conflicting interests
The authors declared no potential conflicts of interest with respect to the research, authorship, and/or publication of this article.