
Abstract
Energy efficiency (EE) is essential for sustainable development; nevertheless, Africa, which faces some of the most acute energy challenges globally, remains underexplored in this context. Although existing literature emphasizes technology, human capital, and institutional quality as crucial determinants of EE, their specific effects in Africa have received less attention. This study utilizes stochastic frontier analysis to investigate the influence of these factors on green total factor energy efficiency (GTFEE) in 33 African nations from 1990 to 2020 within a unified framework for precise estimation. We find that a 1% improvement in institutional quality or human capital is associated with a 4.7% and 4.5% increase in GTFEE, respectively. Technology has a significant impact at first, but it becomes statistically insignificant when all three variables are considered simultaneously. Nonetheless, technology improves efficiency in middle-income countries when income is disaggregated, but it exacerbates it in low-income settings, implying that the benefits of technological adoption have developmental limitations. These results are similar across different GDP measures and functional forms. EE remains unevenly distributed across the continent in terms of GTFEE performance. The average GTFEE is 0.80, with South Africa (0.95), Egypt (0.93), and Morocco (0.90) ranking highest and Mozambique and Rwanda (0.57) ranking lowest. Based on these findings, several policies are proposed.
Introduction
Africa's energy consumption has increased by 45% since 2000, nearly as much as its economy, signaling robust economic growth. 1 To sustain this trajectory, a reliable energy supply is essential. Yet, Africa remains the continent with the most limited access to energy, with over 85 million people annually requiring access to modern electricity through 2030 in Sub Saharan Africa. 2 This limit constraints economic growth and development 3 and has been exacerbated by climate change, the COVID-19 epidemic, and geopolitical upheavals like the Russia–Ukraine war. 4 According to the International Energy Agency (IEA), 5 these shocks have reversed processes, with the population without electricity rising by 4% between 2019 compared 2021, while globally household energy costs have nearly doubled (See https://theconversation.com/russia-ukraine-war-has-nearly-doubled-household-energy-costsworldwide-new-study-200104#:∼:text=The%20Russia%E2%80%93Ukraine%20war%20has,services%20throughout%20global%20supply20chains).
Addressing these energy insecurities requires Africa to prioritize affordability, security, and sustainability in its transition strategies. 3 Given infrastructure limitations, improving energy efficiency (EE) emerges as a critical and cost-effective pathway. 6 With its energy consumption per dollar of GDP higher than the developed regions, enhancing efficiency in Africa may be beneficial. 7 Although it is sometimes used to refer to technology, the concept of energy efficiency also has a behavioral aspect in practice, meaning it involves using less energy to achieve the same outcome. 8 Enhancing efficiency reduces energy import costs and overall economic costs 9 and mitigates carbon emissions in fossil fuel–dependent African countries. 3 Furthermore, it fosters competitive advantage, alleviates energy poverty, and creates employment opportunities, 10 with several studies documenting substantial growth and job creation benefits.11,12 Thus, advancing EE is vital for Africa's energy security and sustainable development.
The above prospect raises a critical question: what practical measures can improve EE in developing economies like those in Africa? Previous research highlights the importance of sound energy policies, 13 strengthening absorptive capacity14,15 and adopting energy-efficient technology. 16 In essence, EE hinges on three pillars: robust institutions to design and enforce policies; human capital to absorb innovations; and technology to improve energy utilization. Among these, technology presents the greatest challenge for African governments due to its high cost. As a result, many countries rely extensively on technology transfer through foreign direct investment (FDI), trade, and international partnerships. 6 The key challenge lies in adapting imported technologies to local contexts—where inconsistent power supply, infrastructure gaps, and limited finances often prevail. In this perspective, Africa's reliance on imported technologies presents both a challenge and an opportunity.
Beyond technology, human capital—the skills, knowledge, and experience embodied in the workforce—are fundamental to growth. This idea, articulated by Mincer 17 and later developed by Romer's 18 endogenous growth framework, remains central to long-term growth. Recently, studies have also demonstrated that a well-educated workforce contributes to reducing energy consumption and tackling climate change.15,19 For instance, Opoku et al. 20 emphasize that enhanced human capital fosters environmental awareness, while Sharif et al. 21 link it to innovation that reduces reliance on nonrenewable energy. Thus, human capital is not only a key driver of economic growth but also plays a critical role in addressing global challenges like climate change. Africa has achieved significant progress in human capital development over the last three decades, including increased university enrolment. Despite progress, Africa's human capital index remains at 0.40, below the worldwide average of 0.57. 22 With the labor force expected to grow by 12 million annually through 2035, targeted policies remain essential for both economic growth and climate mitigation.
Institutions also play a pivotal role by establishing the framework for policy implementation and enforcement. Hodgson 23 defines institutions as formal and informal rules governing behavior. Strong institutions influence public attitudes toward energy use and encourage efficiency initiatives.8,24 They also lower transaction costs and information asymmetries, improving market outcomes and environmental protection. 25 By internalizing externalities through mechanisms like taxes and subsidies, institutions can drive significant change. 26 While institutional reforms in Africa—often supported by international agencies such as the World Bank—have reshaped governance structures, 27 their effectiveness in tackling energy and environmental challenges remains uncertain. Legislation alone is insufficient; institutions must ensure that rules are effectively implemented, adaptable, inclusive, and resilient. Without strong institutions, achieving long-term EE and sustainability is a daunting task.
Despite a growing literature on the roles of technology, human capital, and institutions in EE (e.g.,8,14,28,29, 30 ), important gaps remain. First, most studies examine these factors in isolation or focus on developed and rapidly emerging economies (e.g.,31–35), leaving Africa—home to the largest energy poverty population relatively understudied. This study addresses that gap by synthesizing technology, human capital, and institutions within a unified framework tailored to Africa's unique context, enabling more precise estimation and interpretation of their impacts. Second, existing research often uses energy consumption or intensity as proxies for EE (e.g.,15,29,31,32,34–36) which may be limited. 37 Stochastic frontier analysis (SFA) and data envelopment analysis (DEA) offer more robust alternatives, 38 though prior SFA studies rarely incorporate environmental costs such as pollution and resource depletion (e.g.,4, 39 ). Our study advances the literature by estimating green total factor energy efficiency (GTFEE), which explicitly accounts for negative environmental externalities, offering a more comprehensive and environmentally sensitive measure. Finally, we highlight the importance of accounting for heterogeneity bias arising from differences in economic development and industrial structures across countries. Variations in GDP per capita, industrialization, and income distribution can distort cross-country comparisons and engender misleading conclusions about EE. By explicitly controlling for these factors, our analysis offers more accurate, locally relevant insights and policy recommendations.
The remainder of the paper is organized as follows: “Literature review” section reviews the relevant literature on the study. “Specification of model and variable selection” section outlines the model and data. “Discussion of empirical results and findings” section presents the empirical findings. “Conclusion and policy recommendations” section concludes with a summary and policy implications.
Literature review
EE has assumed a central role in the energy policies of various economies since the 1973 oil crisis. Energy prices soared during this time, piquing the interest of decision-makers and industry experts investigating how to increase productivity while reducing energy consumption. Later in the 1980s, worries about global warming due to human activities further highlighted the importance of EE. In this context, the IEA 40 reported that the energy sector is responsible for about 90% of all emissions. As the current trend in energy consumption is expected to increase emissions, the Paris Agreement required countries to increase EE to keep global warming below 2°C. 41 EE ensures that less energy is used to produce at least equivalent services or outputs, and it is crucial in mitigating environmental impacts while improving economic productivity.
Despite the growing importance of EE, accurately measuring EE is complex, as highlighted by Wei et al., 42 who categorized EE indicators into single-factor energy efficiency (SFEE) measures and total-factor energy efficiency (TFEE) measures. Traditional SFEE measures are based solely on the output-to-energy input ratio and do not account for other essential production inputs, such as labor and capital. 43 This method has been criticized for failing to reflect actual technical efficiency and may possibly overestimate EE due to input substitution effects. Furthermore, it makes the misleading assumption that energy use is the only production input, overlooking the value of other inputs such as labor and capital.
EE can be accurately estimated using a total factor framework considering all production-related factors. Therefore, Hu and Wang 44 developed total factor EE (TFEE) by considering labor and capital as inputs in addition to energy. The TFEE is more comprehensive than the SFEE as it considers additional production inputs. It separates energy inputs, determines whether the inputs are substitutable or complementary, and computes the technical efficiency of the inputs. The TFEE metric assesses EE more precisely. It can help identify areas for improvement in the manufacturing process by considering all production-related inputs. This metric helps compare the EE of different sectors or countries.
While TFEE has gained traction, methodological debates persist over how to measure it. Two dominant approaches—SFA and DEA—are frequently employed in EE studies. Charnes et al. 45 proposed the former, while Aigner et al. 46 and Meeusen and Broeck 47 proposed the latter, both of which use distance-based frontier functions. The non-parametric DEA approach emphasizes technical optimization, while the parametric SFA approach focuses on economic optimization. Selecting a method involves trade-offs, as each has its advantages and disadvantages. In the case of SFA, the residual is split into two distinct components: noise and inefficiency, which is the primary advantage of this method, as it can differentiate between random estimation errors or statistical noise and inefficiency. However, the efficiency levels of the efficient frontier need to be defined beforehand, including their shape and probability distribution, which can cause bias in the stochastic method if they do not fit the data. On the other hand, DEA does not rely on the shape of the efficient frontier or the probability distribution, so it avoids this specification problem. However, DEA does not account for random estimation errors, considering them inefficient, leading to deterministic frontiers analysis and no statistical foundation. Neither approach is superior to the other. Nevertheless, due to statistical noise in macroeconomic data, the current study uses a parametric SFA approach to measure African EE. SFA also permits statistical testing of alternative model specifications, making it widely used in evaluating the EE performance at both micro and macro levels.
With respect to the focus of the study, some studies have been carried out on the relationship between technological transfer, human capital, institutions, and EE. For instance, Chang et al. 48 provide empirical evidence that government ideology significantly determines EE in 23 OECD countries. In another study, Chang et al. 49 found increased EE due to greater government efficiency. Sun et al. 8 demonstrate how proximity to countries with solid institutional foundations positively impacts the domestic EE. Similarly, Sun et al. 28 show that proximity to countries with good institutional frameworks positively affects the domestic EE. Azam et al. 50 show that institutional quality positively affects energy use in 66 developing countries. However, not all studies support this view. For instance, Mayer 51 finds no evidence that democracy enhances sustainability, as measured by the energy intensity of well-being. Likewise, Ren et al. 30 examine the threshold effect of institutional quality on EE, and their results show that higher levels of institutional corruption reduce EE in Pakistan.
The interaction between human capital and EE has also garnered attention in recent literature. For instance, Edziah et al. 14 demonstrate the energy-saving effect of human resources in ten emerging countries, while Akram et al. 52 report that human capital reduces energy consumption in 73 countries. Conversely, other studies, such as those by Salim et al. 36 and Shahbaz et al. 53 in China, suggest a negative correlation between human capital and energy consumption, indicating that the relationship may vary depending on regional contexts. Ma 54 also investigated how human capital affected total factor EE in China and discovered a negative correlation. In a sample of OECD countries, Yao et al. 15 found that investing in human capital reduces overall energy intensity by 15.36%. Lastly, Awaworyi Churchill et al. 55 found a negative correlation between the UK's energy consumption and human capital.
Finally, for the technology and EE nexus, Adom and Amuakwa-Mensah 56 demonstrate the energy-saving effect of technology derived from FDI and trade in East Africa. Wang 57 reports that from 2001 to 2013, FDI-led technological transfer improved China's EE. Adom 58 uses the Markov-switching method to demonstrate that trade openness (a proxy for technology) can facilitate the transition from energy-inefficient states in Cameroon. Adom and Kwakwa 59 find that technical diffusion through trade has a more substantial effect on energy intensity in Ghana than through FDI. However, other studies present mixed findings. For instance, Ahmed 60 argues that trade liberalization increases the energy intensity of BRICS countries. Jiang et al. 61 report that the energy intensity of Chinese industries is generally 5–35% greater than that of foreign industries in China. Keho 62 noted that while trade cuts energy intensity in Cameroon, Côte d'Ivoire, and Togo, FDI increases it in Cameroon and Nigeria. Huang et al. 63 demonstrate that spillover effects from FDI and imports reduce energy intensity, except for exports in 30 Chinese provinces between 2000 and 2013. In addition, Liu et al. 64 examine the impact of economic globalization on EE in 141 countries, while Doğan et al. 65 investigate the impact of economic globalization on energy demand in 63 countries. Finally, Leal and Marques 66 evaluate how the three aspects of globalization (i.e., economic, social, and political) affect EE.
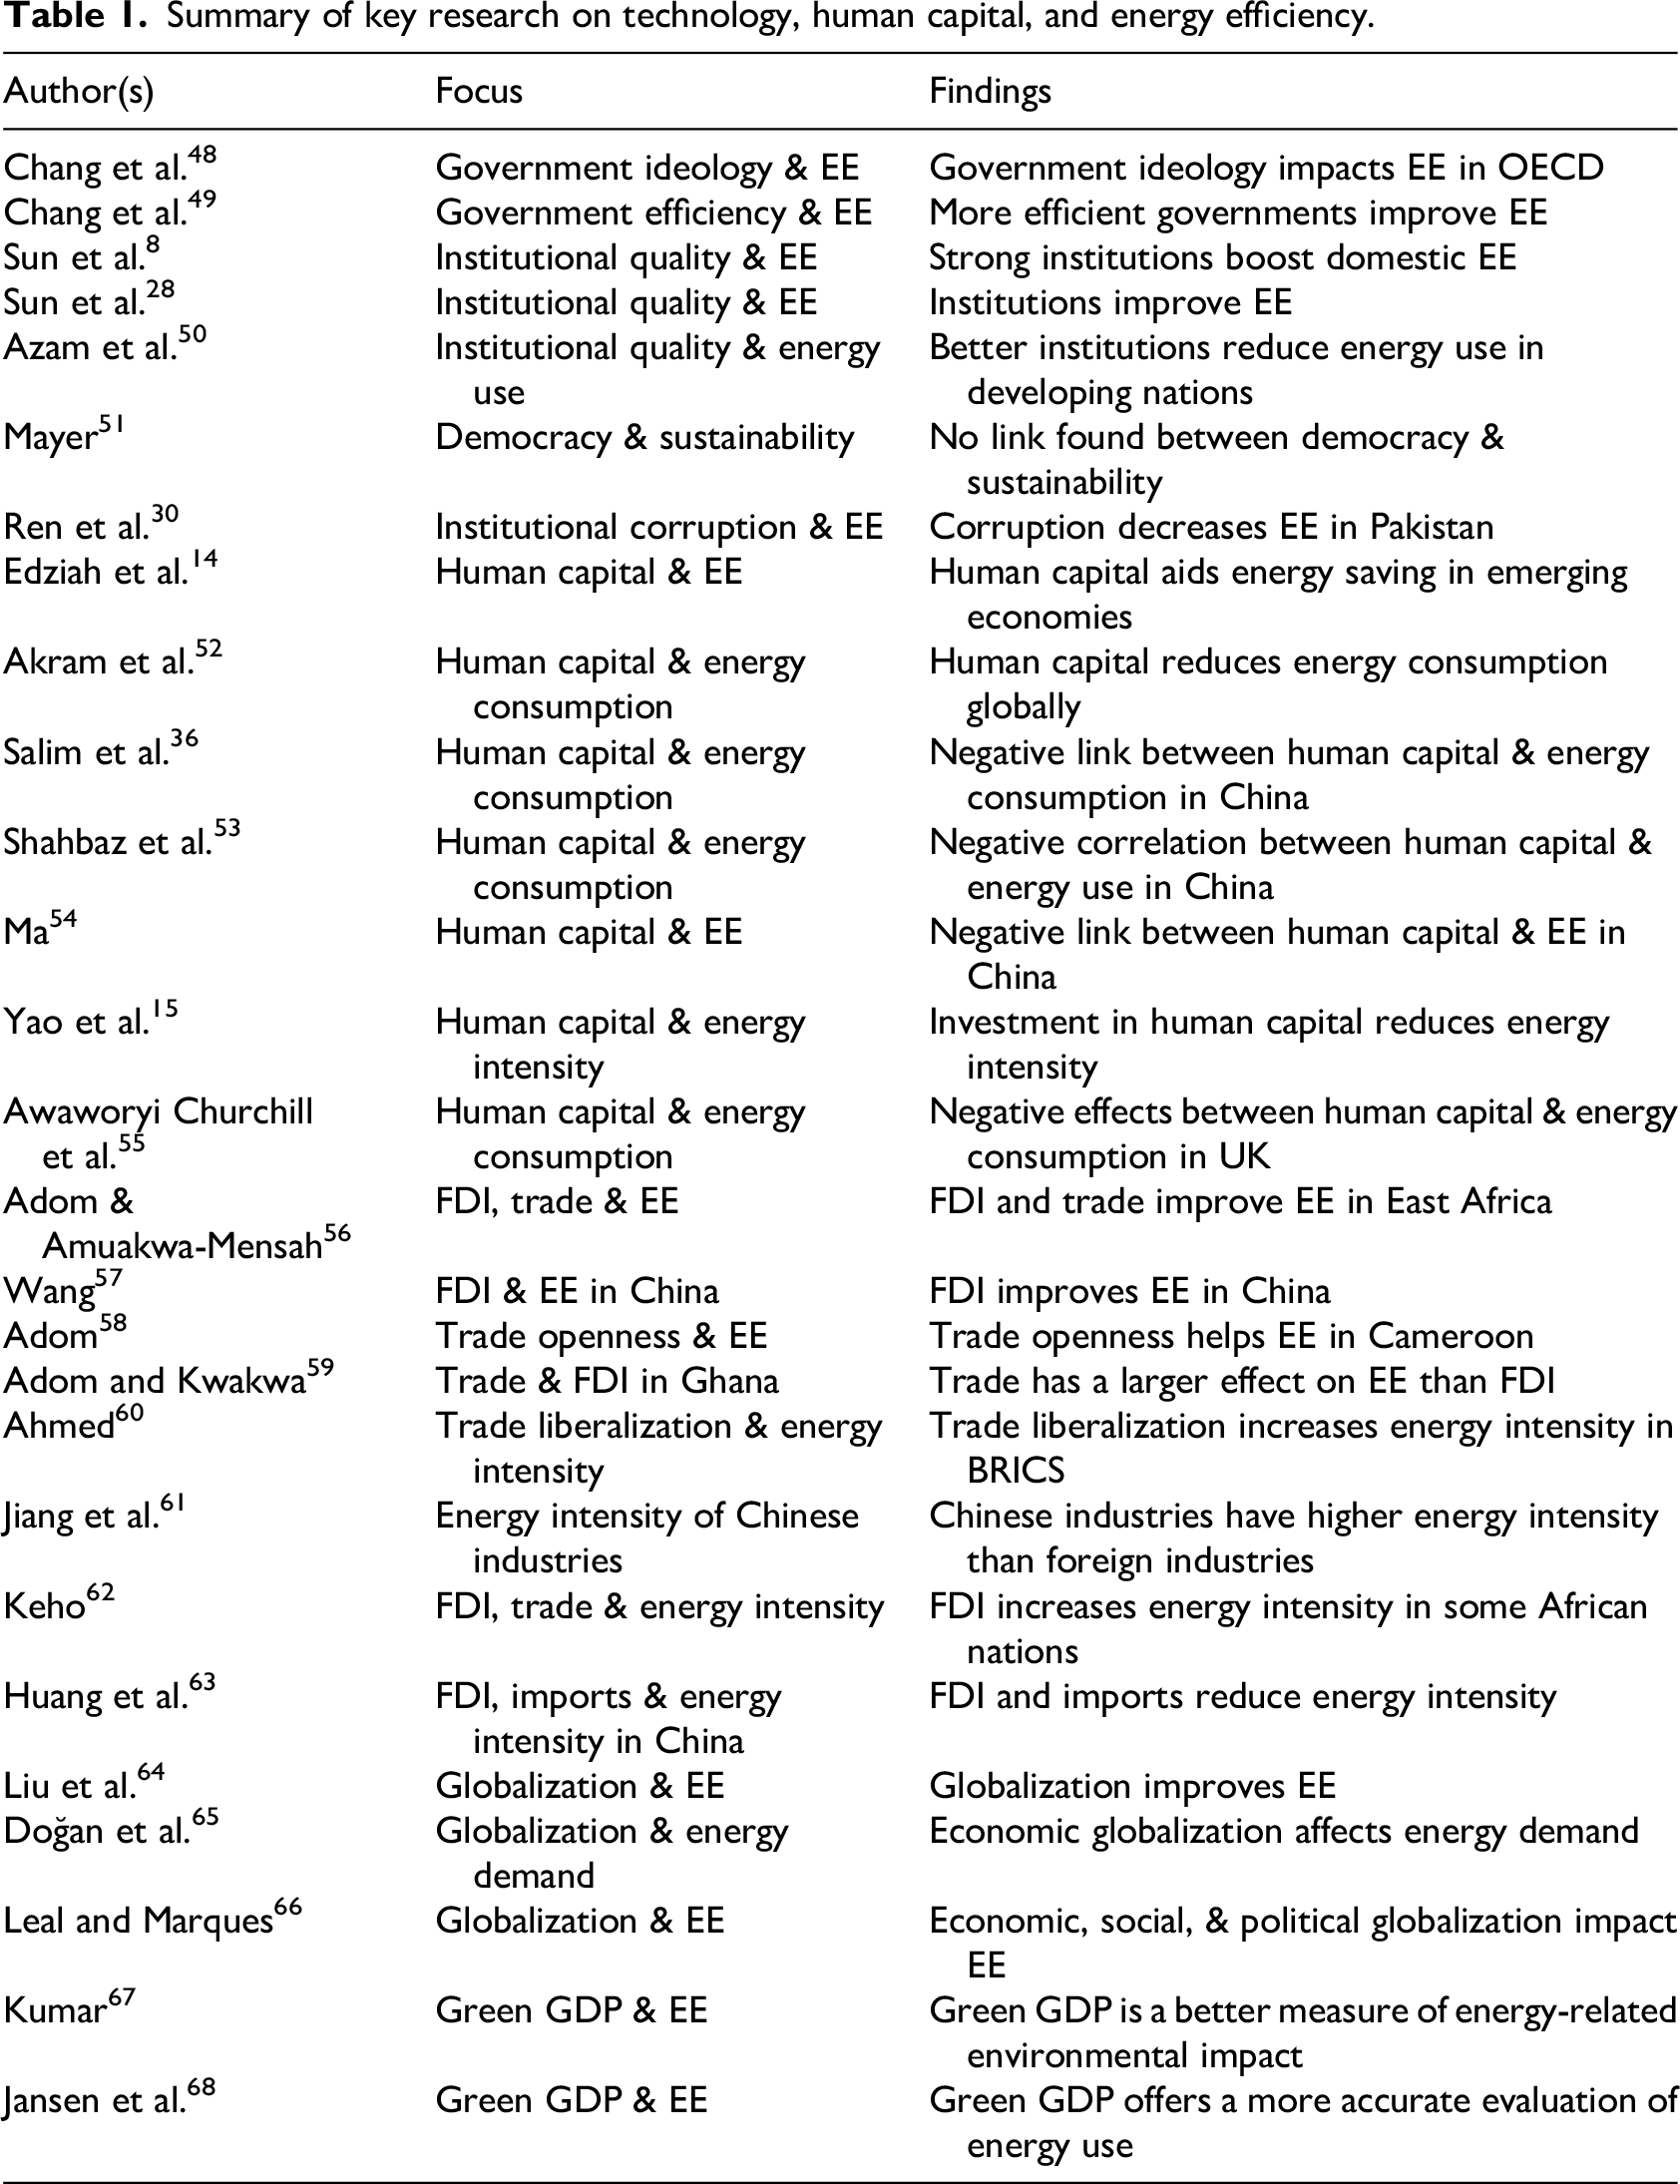
Lastly, the traditional reliance on GDP as the sole output of efficiency or production is increasingly being questioned. Although GDP helps measures economic health, it does not account for environmental impacts associated with energy use, like pollution or depletion of natural resources. Researchers have proposed using the green GDP (GGDP) as a more inclusive metric of natural economic well-being.67,68 GGDP is a metric that accounts for the economic benefits of energy consumption and the costs associated with adverse environmental effects and energy consumption, like pollution and resource depletion. This shift toward GGDP aligns with broader sustainability goals, offering a more holistic evaluation of energy consumption and conservation efforts. Considering these developments, unlike previous studies (e.g.,64,69,70) we adopt the GGDP measure proposed by Stjepanovic et al. 71 to better reflect the true costs and benefits of EE (Table 1).
Summary of key research on technology, human capital, and energy efficiency.
Specification of model and variable selection
Energy distance function
We estimate the GTFEE using the energy distance function, which was drawn from Farrell's
72
influential work on input-oriented production efficiency. Accordingly, we adopted a neoclassical production framework that assumes countries employ inputs such as capital (
Following Färe et al.,
73
Given the focus of the study, we adopt the Shepard energy input distance function
74
first suggested by Shepherd.
75
The function is expressed in Equation (2) as follows:
Equation (2) aims to determine the highest potential reduction in E while maintaining the input and output vectors constant, subject to the limitations imposed by the production process. As such,
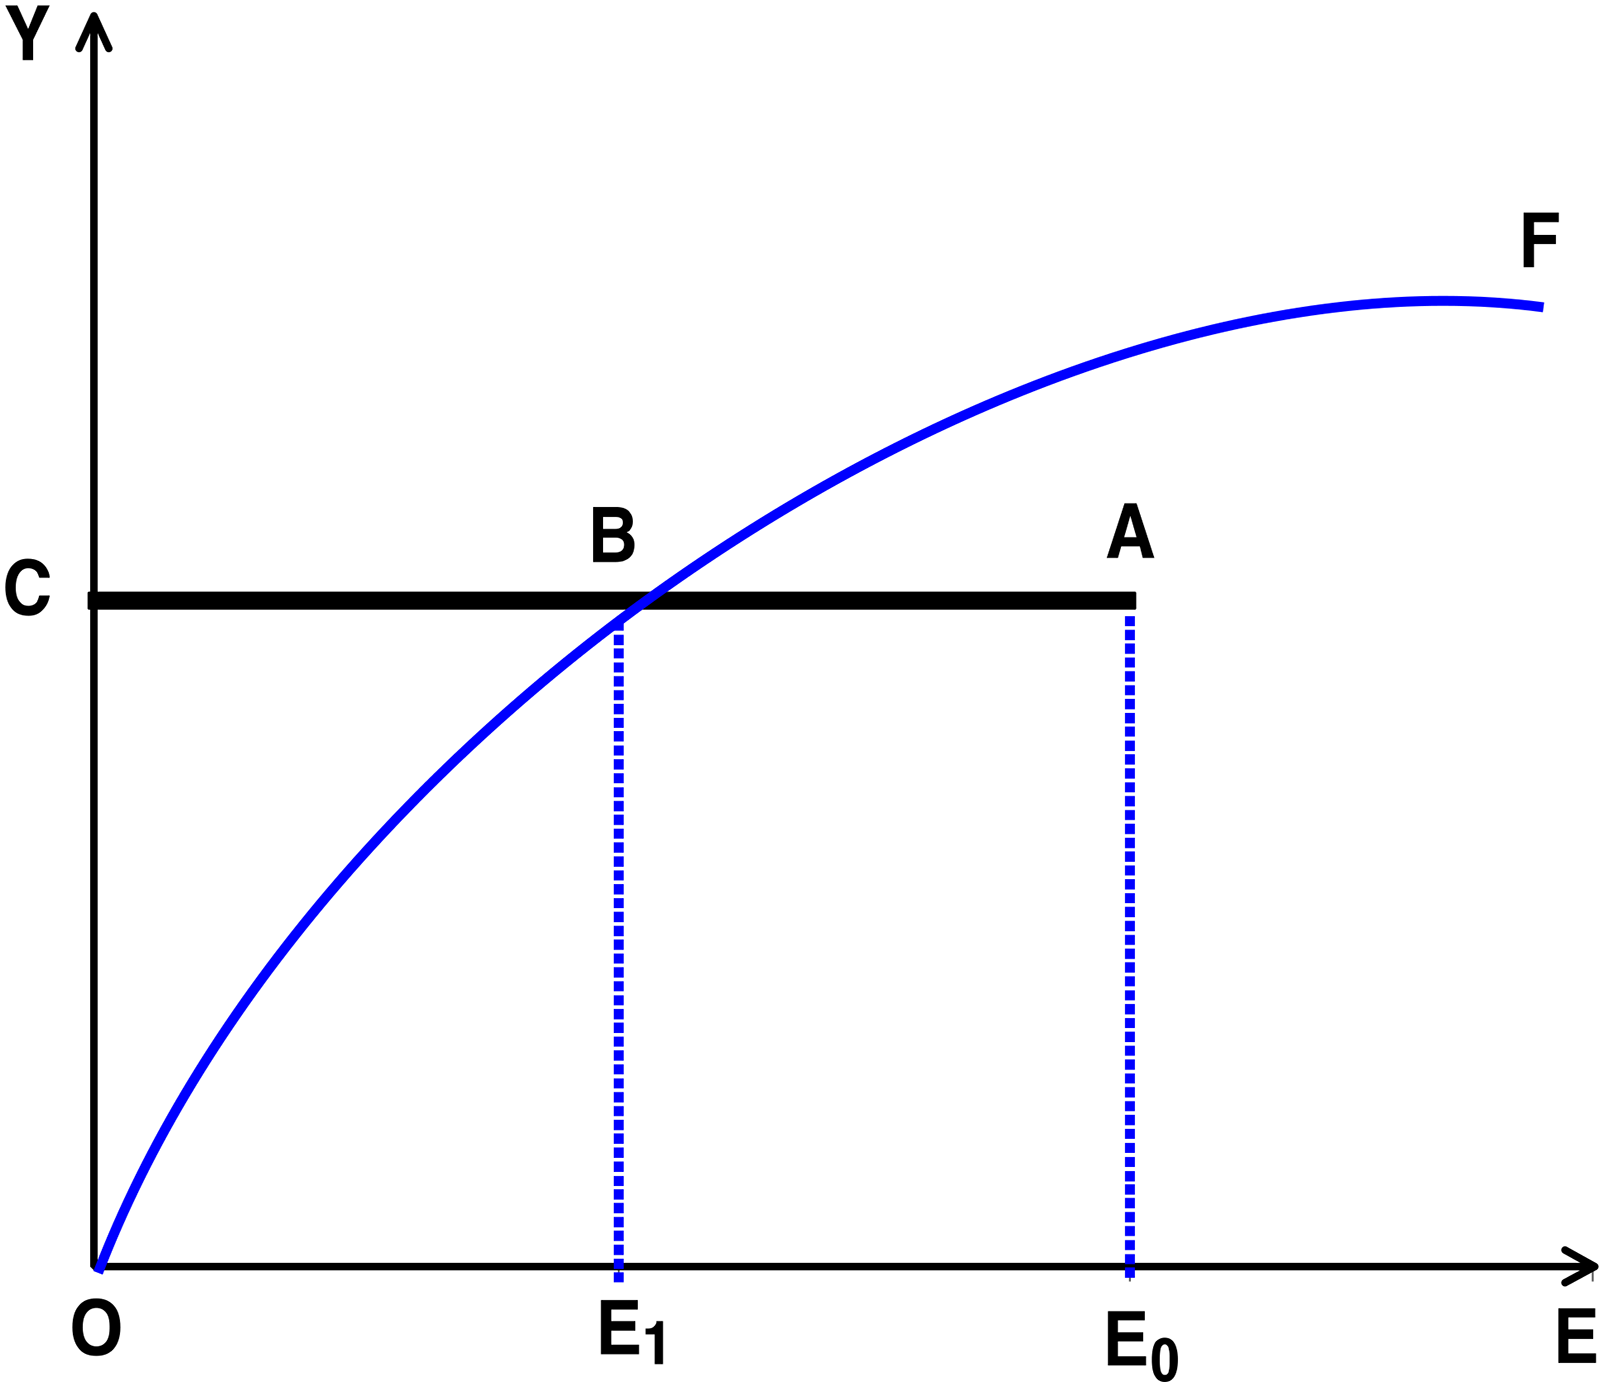
Graphical illustration of the Shepard energy distance function.
The curve line OF indicates the production isoquant for the energy (
EE measures how much a country's energy consumption differs from the optimal amount required for output. When a country lies on the frontier curve OF, and EE equals 1, it is deemed energy-efficient in its production. Conversely, if a country falls below the OF curve, it is considered inefficient energy production, and the EE value will be less than one.
Econometric estimation of the energy distance function
To estimate the Shepherd energy distance function, a particular functional form must be selected. In line with Sun et al.,
8
we opt for the trans-log function as it offers greater flexibility and does not impose technological limitations on production. Therefore, our econometric representation of the translog distance function for country (c) at time (t), given our inputs and outputs, is as follows: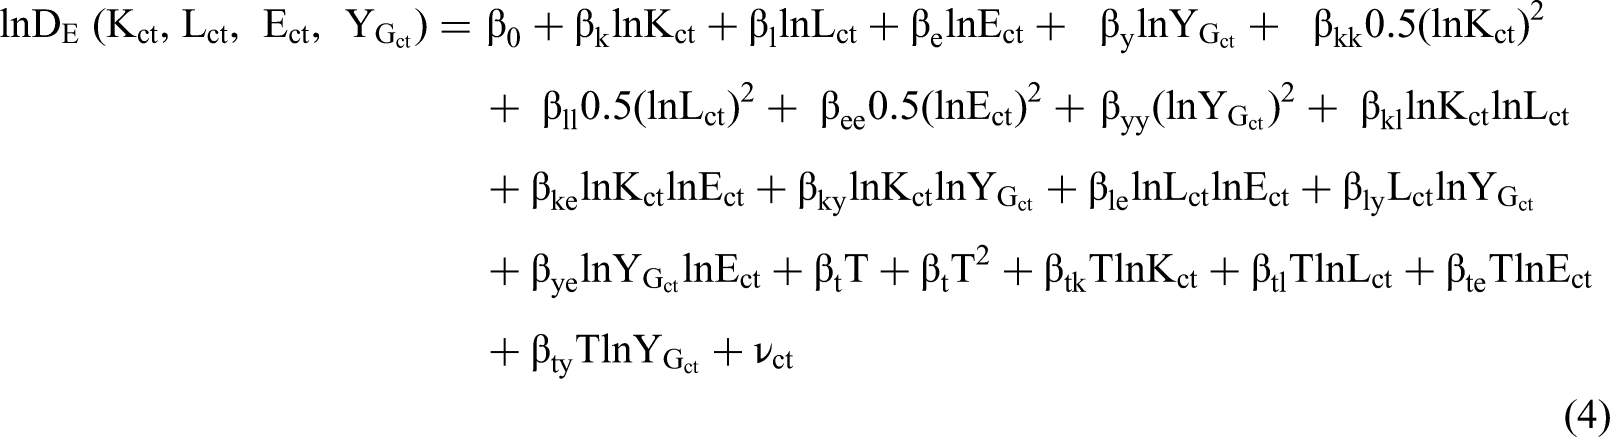
Since the function of Shepherd energy distance is linearly homogenous to the degree of one in the energy input, Equation (4) can be rewritten as:
Equation (5) is then expanded and substituted back into Equation (4); and after algebraic transformation, we obtain Equation (6):
Setting
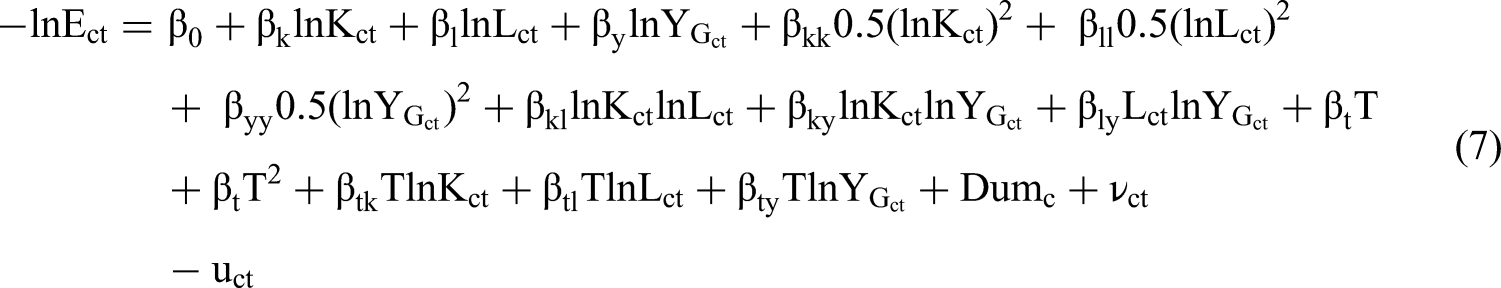
Using Equation (7), the EE for country c at time t is calculated by Equation (8):
Following Battese and Coelli,
77
we model the inefficiency term 
While SFA is useful for measuring efficiency, it can be limited by unobservable factors that influence the results but cannot be directly measured. Traditional SFA either ignores these country-specific effects or includes them in inefficiency. Battese and Coelli's 77 method ignores unobserved effects, while Schmidt and Sickles 78 incorporate them as technical effects. Greene 79 argued that separating country effects from inefficiency is important to avoid bias, especially if they correlate. Farsi et al. 80 addressed this by linking heterogeneity to average variables but allowed inefficiency to vary only over time. Greene 81 proposed the true fixed-effects model with country-specific fixed effects. To address unobservable country effects, we use Greene's true fixed-effect SFA model with country dummies.
Choice of variables
(i) The Production Frontier equation
This study uses an unbalanced panel of 33 African countries from 1990 to 2020, selected based on data availability. The production frontier is estimated using four variables: labor, energy use, and capital stock as inputs, and GGDP as output.
GGDP data are sourced from Stjepanovic et al.
71
and calculated as in Equation (10):
where 
The inputs are defined as follows:
Capital stock: Total capital invested, measured in millions of US dollars (2011 constant prices), sourced from Penn World Tables. Labor: Number of persons engaged (millions), from Penn World Tables. Energy Consumption: Total primary energy consumed, measured in British thermal unit (BTU), sourced from the Energy Information Administration. (ii) The inefficiency equation
The first key variable, economic globalization (used here as a proxy for technological transfer), is measured using the KOF Globalization Index developed by Dreher. 82 This widely recognized index captures multiple dimensions of international exchange, including trade, FDI, income outflows, and portfolio investments. Unlike traditional measures that focus solely on trade or FDI, the KOF index also accounts for barriers such as tariffs, import restrictions, foreign trade taxes, and capital flow controls. This makes it a more comprehensive indicator of technology and knowledge transfer. The index ranges from 0 to 100, with higher values indicating greater technological transfer. Table 2 summarizes the components used in calculating the index, including trade openness, FDI, income outflow, portfolio investments, and restrictions on trade and capital flows, along with their relative weights.
Components of economic globalization measure.
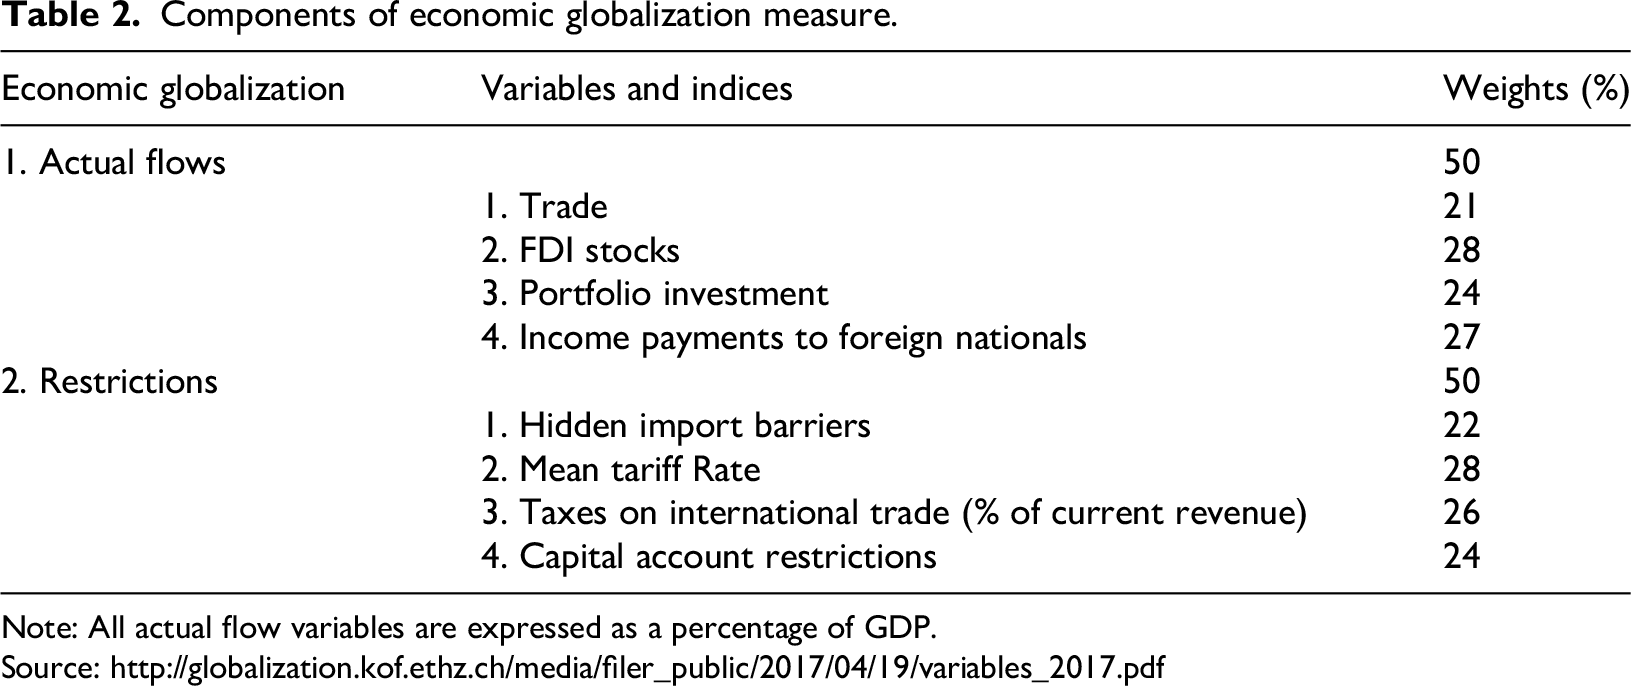
Note: All actual flow variables are expressed as a percentage of GDP.
Our second key variable—institutional quality, comes from the World Economic Freedom Index (EFW). The Fraser and Cato Institutes have collaborated to create a widely respected index of institutional quality. Since 1970, the index has been used to assess a country's policies and level of economic freedom across five dimensions: (i) government size (ii) legal system and property rights (iii) money and financial stability (iv) freedom to engage in international trade and (v) freedom to regulate credit, labor, and business. There are 24 components within each of these categories, making up 42 variables in the index. Each category is assigned a score between 0 and 10; higher scores denote better institutional quality, while lower score indicates poorer institutional quality. From 1970 to 1995, the data was available every five years, and from 2000 to 2020, it was available annually. Given that our study covers the period from 1990 to 2020, we encountered gaps in the data for the years 1991–1994 and 1996–1999, during which data were not reported annually. To address this, we applied linear interpolation between the available data points before and after these gaps. This method estimates missing yearly values by assuming a steady progression over time, allowing us to maintain continuity and consistency in the dataset while minimizing potential biases caused by missing observations.
Our third key variable is human capital, obtained from the Penn World Table. This database thoroughly assesses educational attainment by considering the various educational levels—primary, secondary, and tertiary—and their individual returns. The research of Hall and Jones 83 and Caselli 84 served as the foundation for the educational attainment indicator provided by the Penn World Table. The database has undergone extensive updating and improvement, making it a reliable and essential resource for scholars.
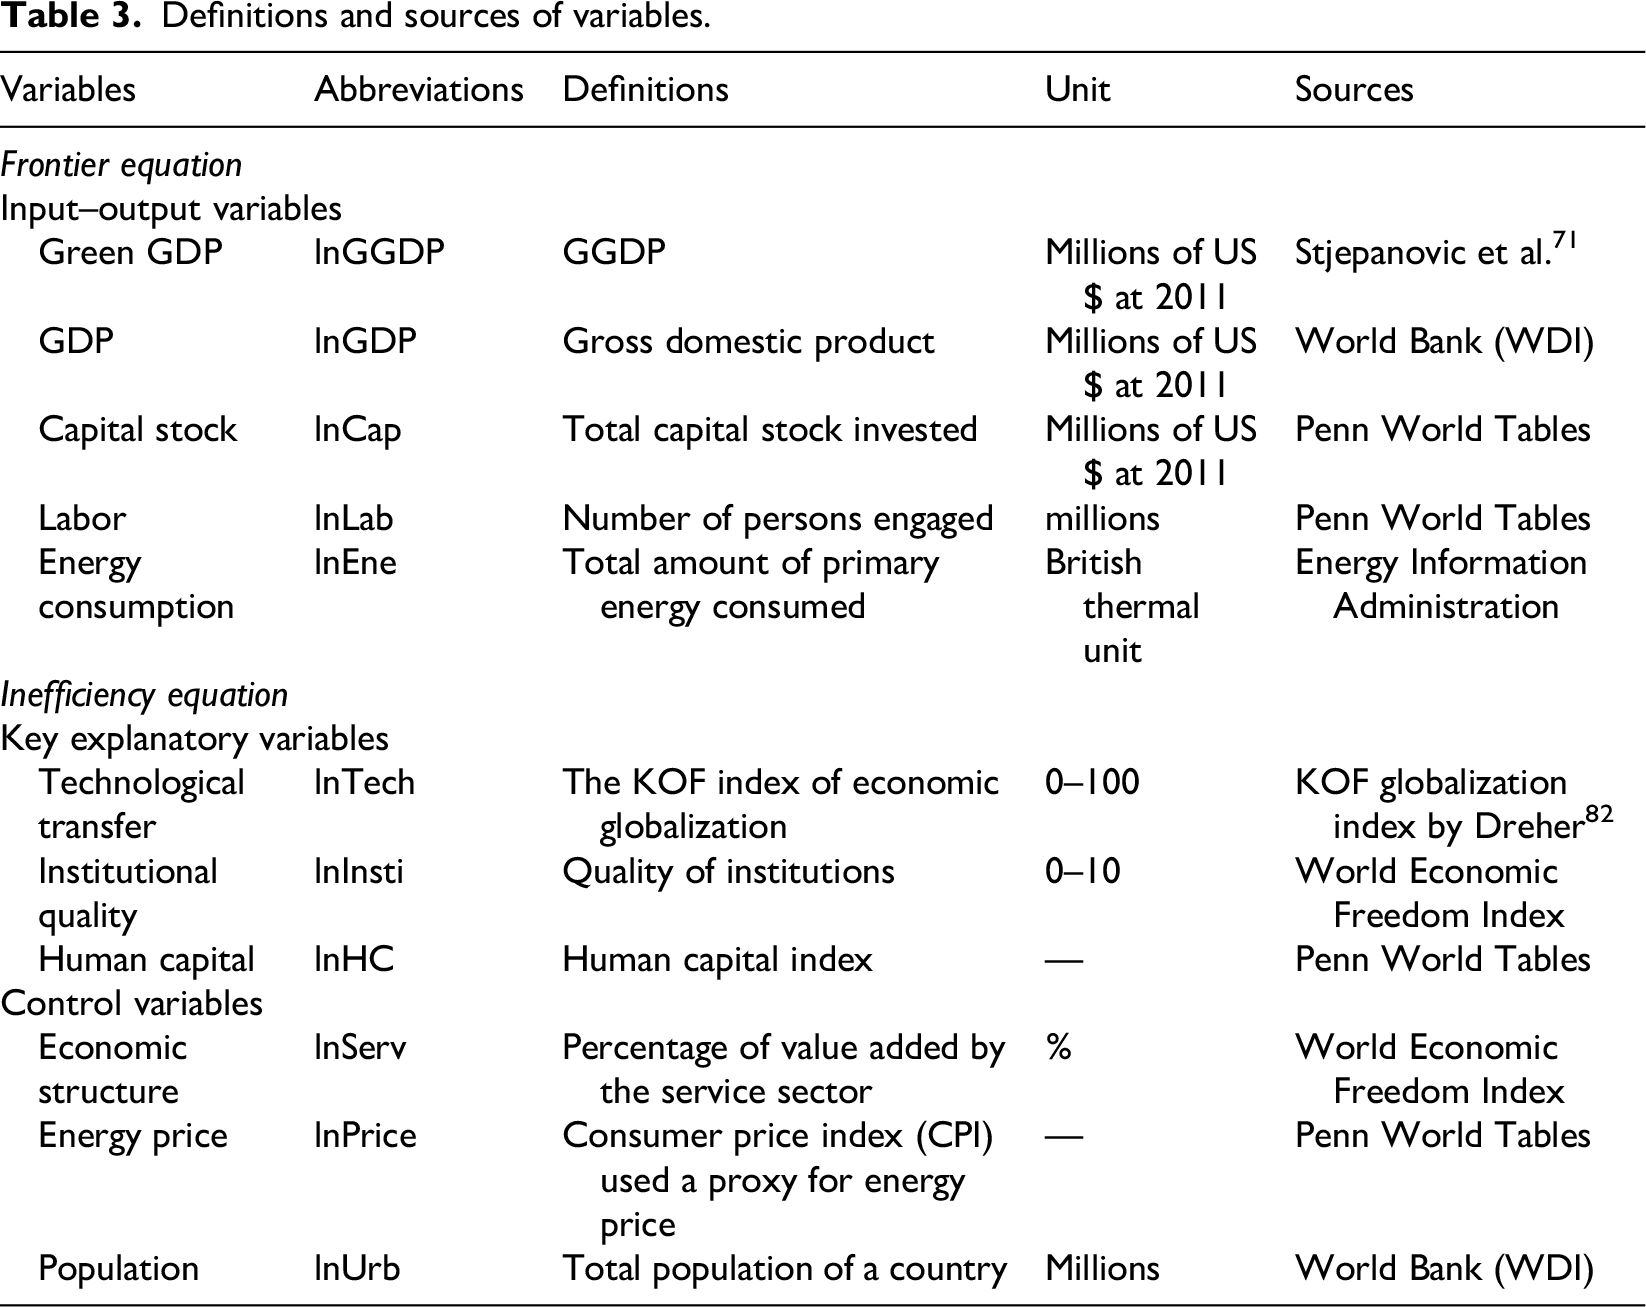
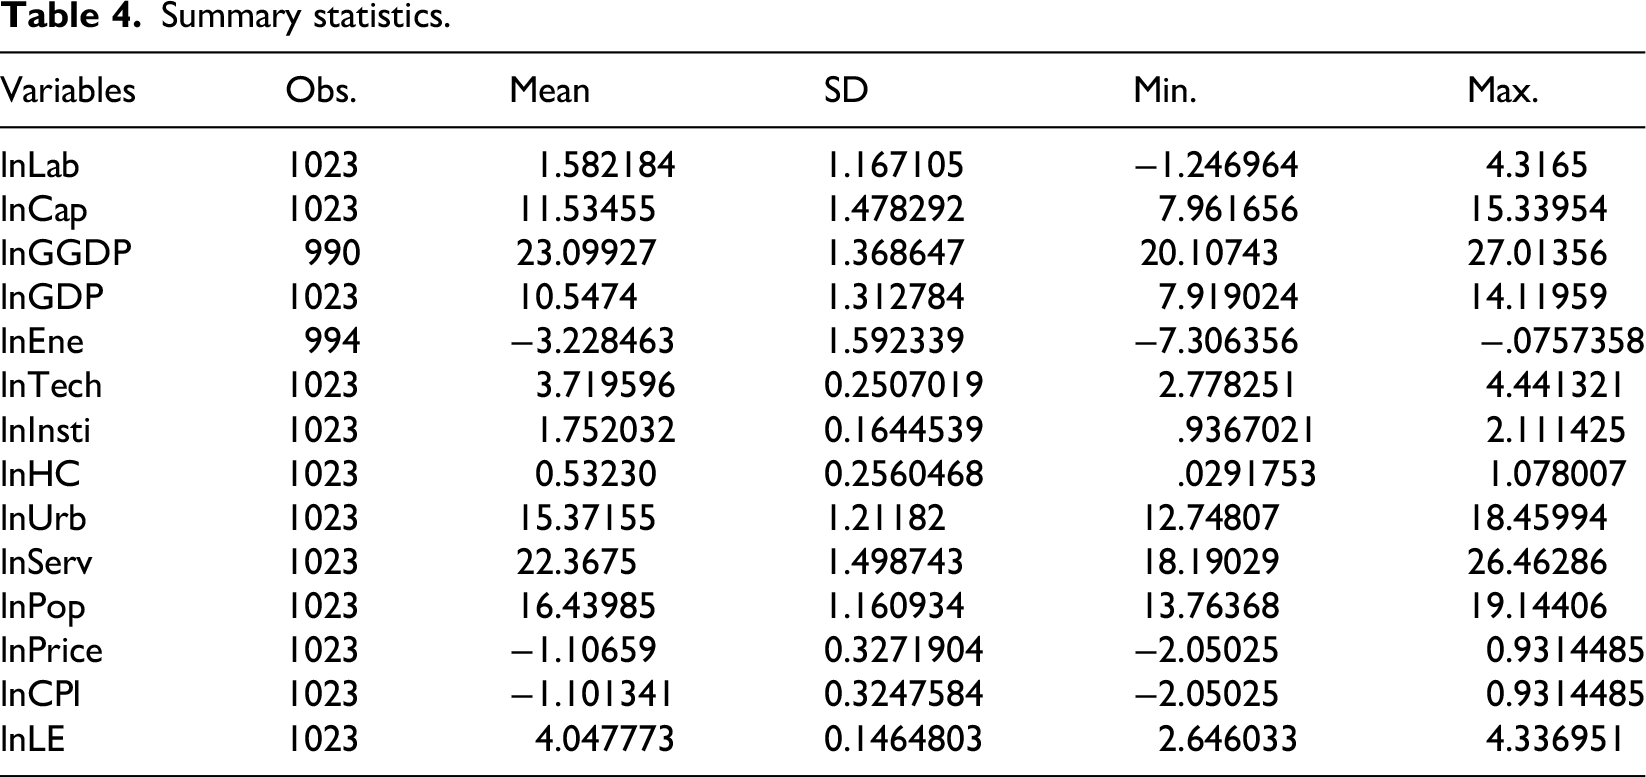
In addition to the variables mentioned above, we control for key factors such as economic structure (measured by the percentage of value added by the service sector), price levels (represented by the consumer price index), and demographics (indicated by the total population of each country) in the model. Table 3 provides definitions and data sources for each variable, and Table 4 provides summary statistics.
Definitions and sources of variables.
Summary statistics.
Discussion of empirical results and findings
This section first discusses the baseline results on the effects of key factors on EE from various estimation methods (Tables 5 and 6). We then present robustness and sensitivity tests (Tables 7–9) to validate these initial findings. Each table includes results for the production frontier and technical inefficiency in energy consumption. After examining the effects on GTFEE, we assess Africa's overall performance.
Inefficiency equation: Key variables introduced separately (Models 1–3) and with controls (Models 4–6).
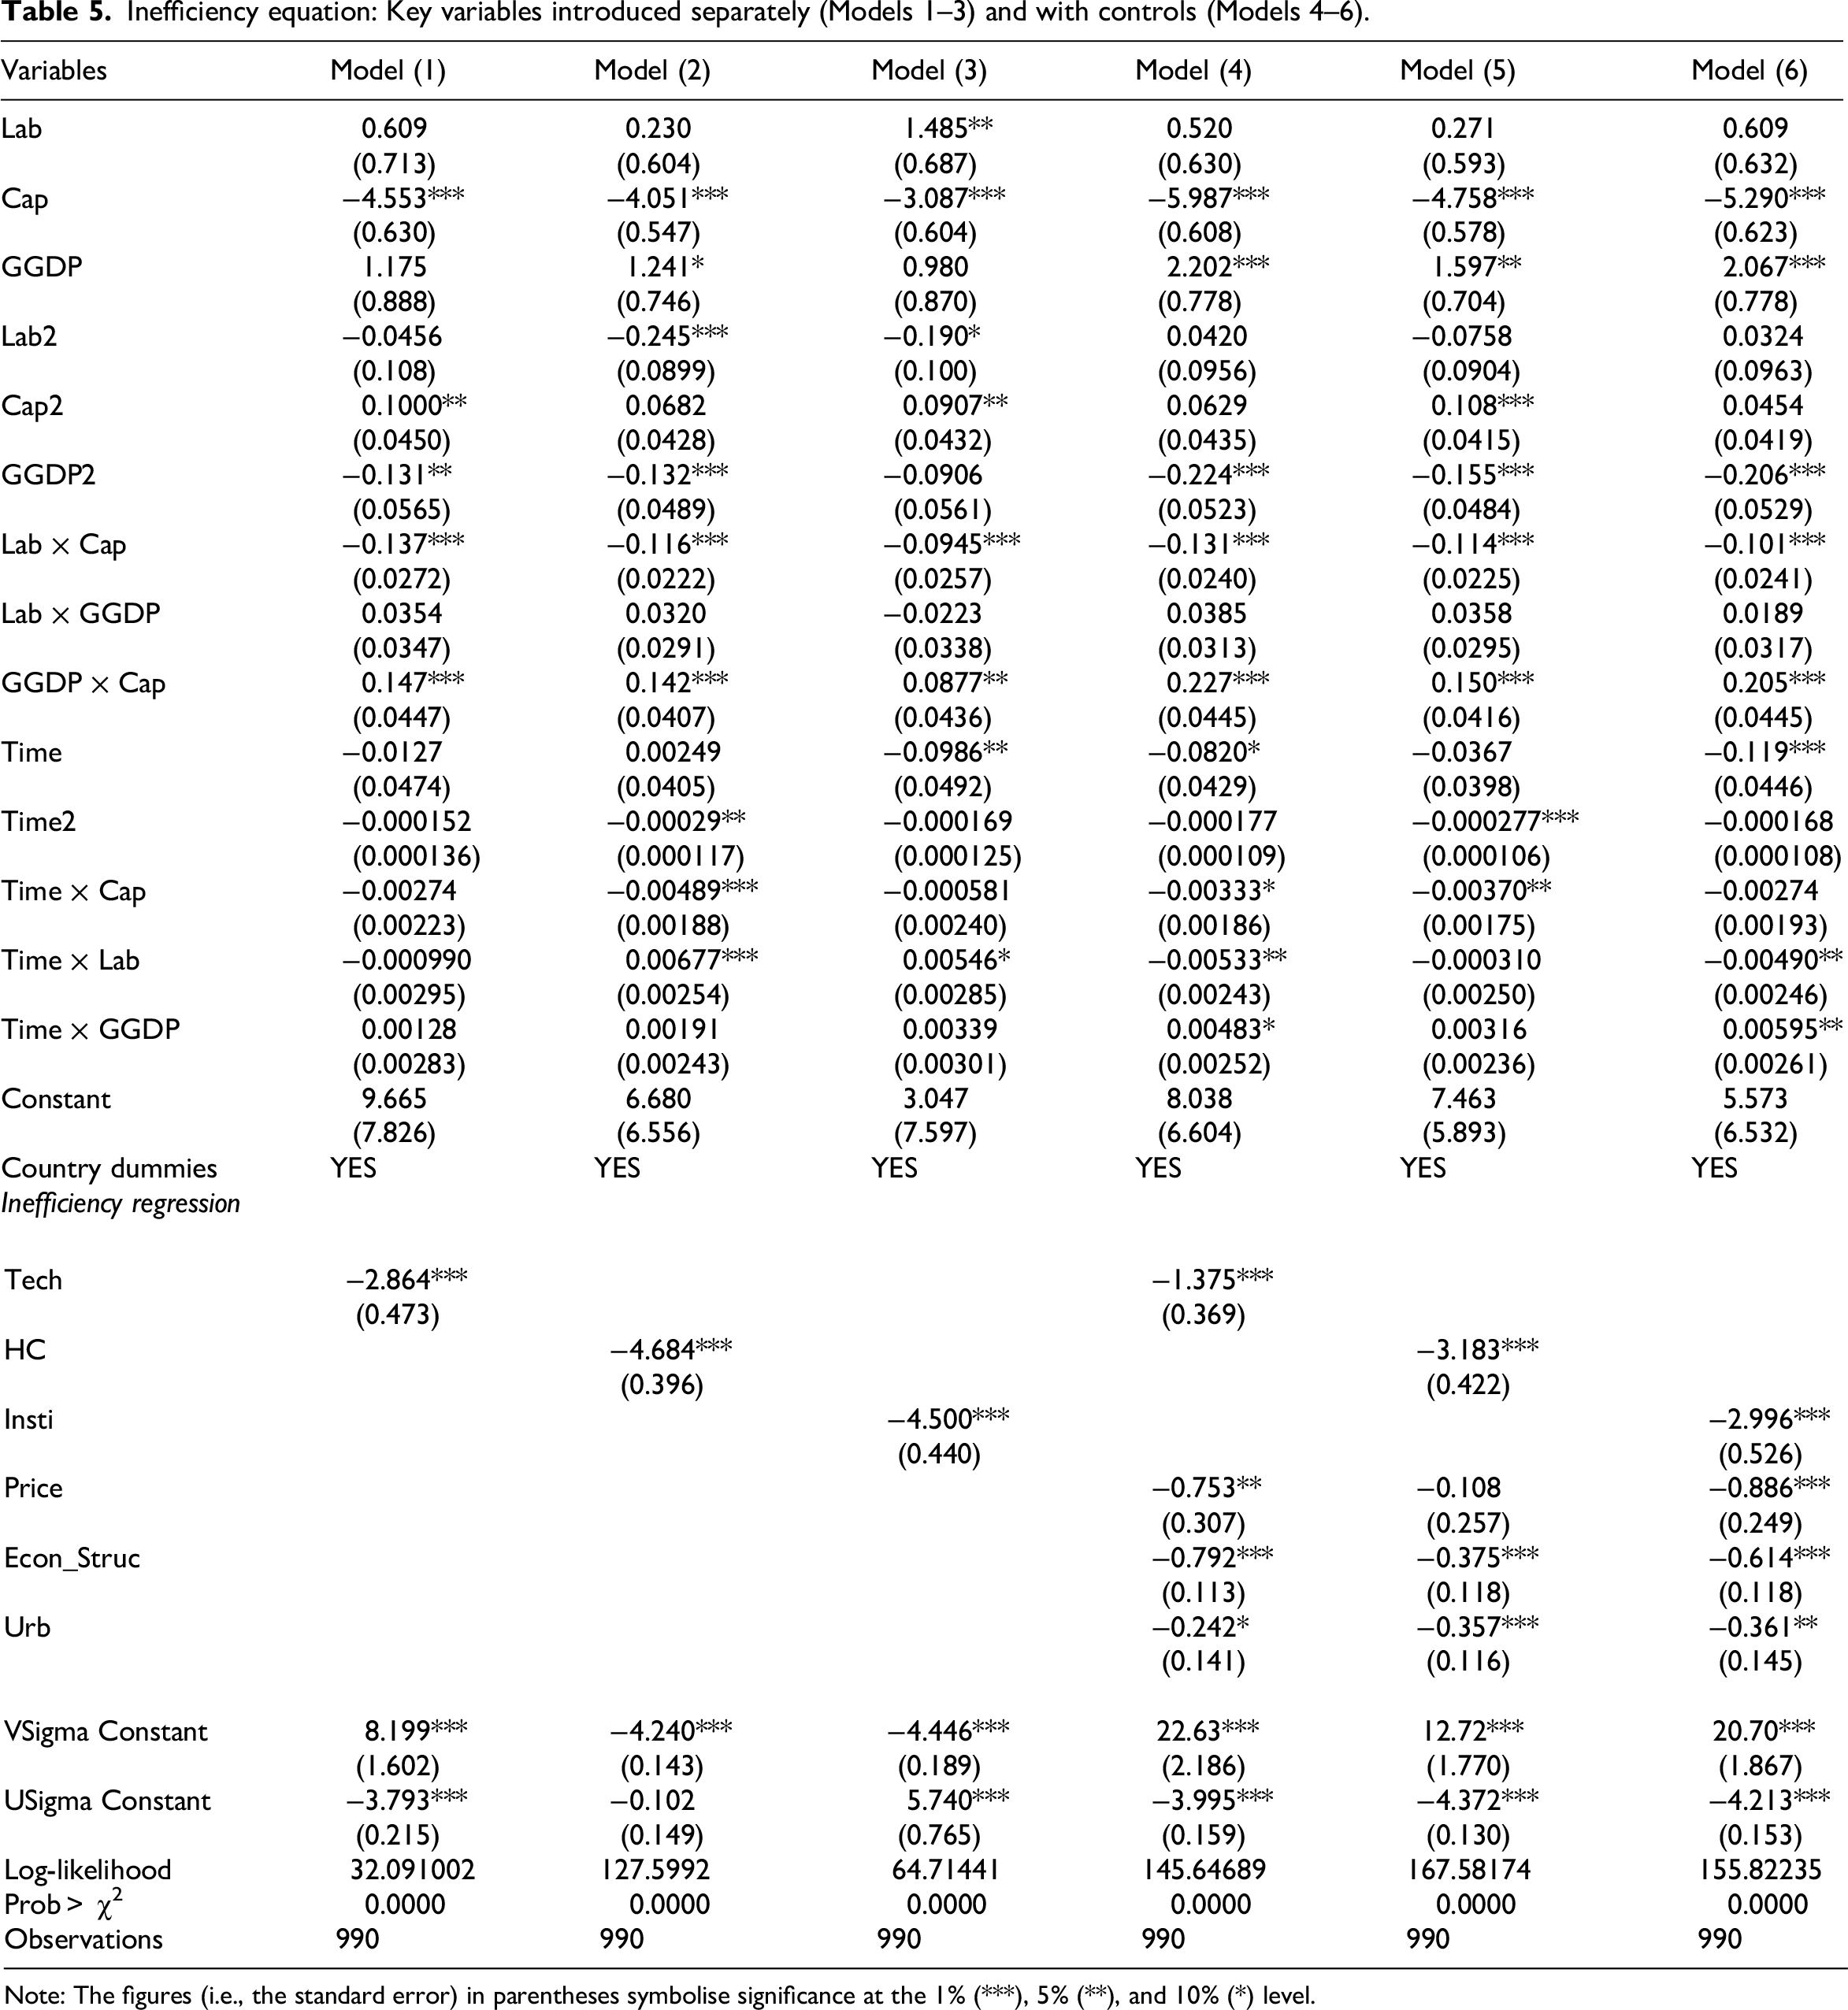
Note: The figures (i.e., the standard error) in parentheses symbolise significance at the 1% (***), 5% (**), and 10% (*) level.
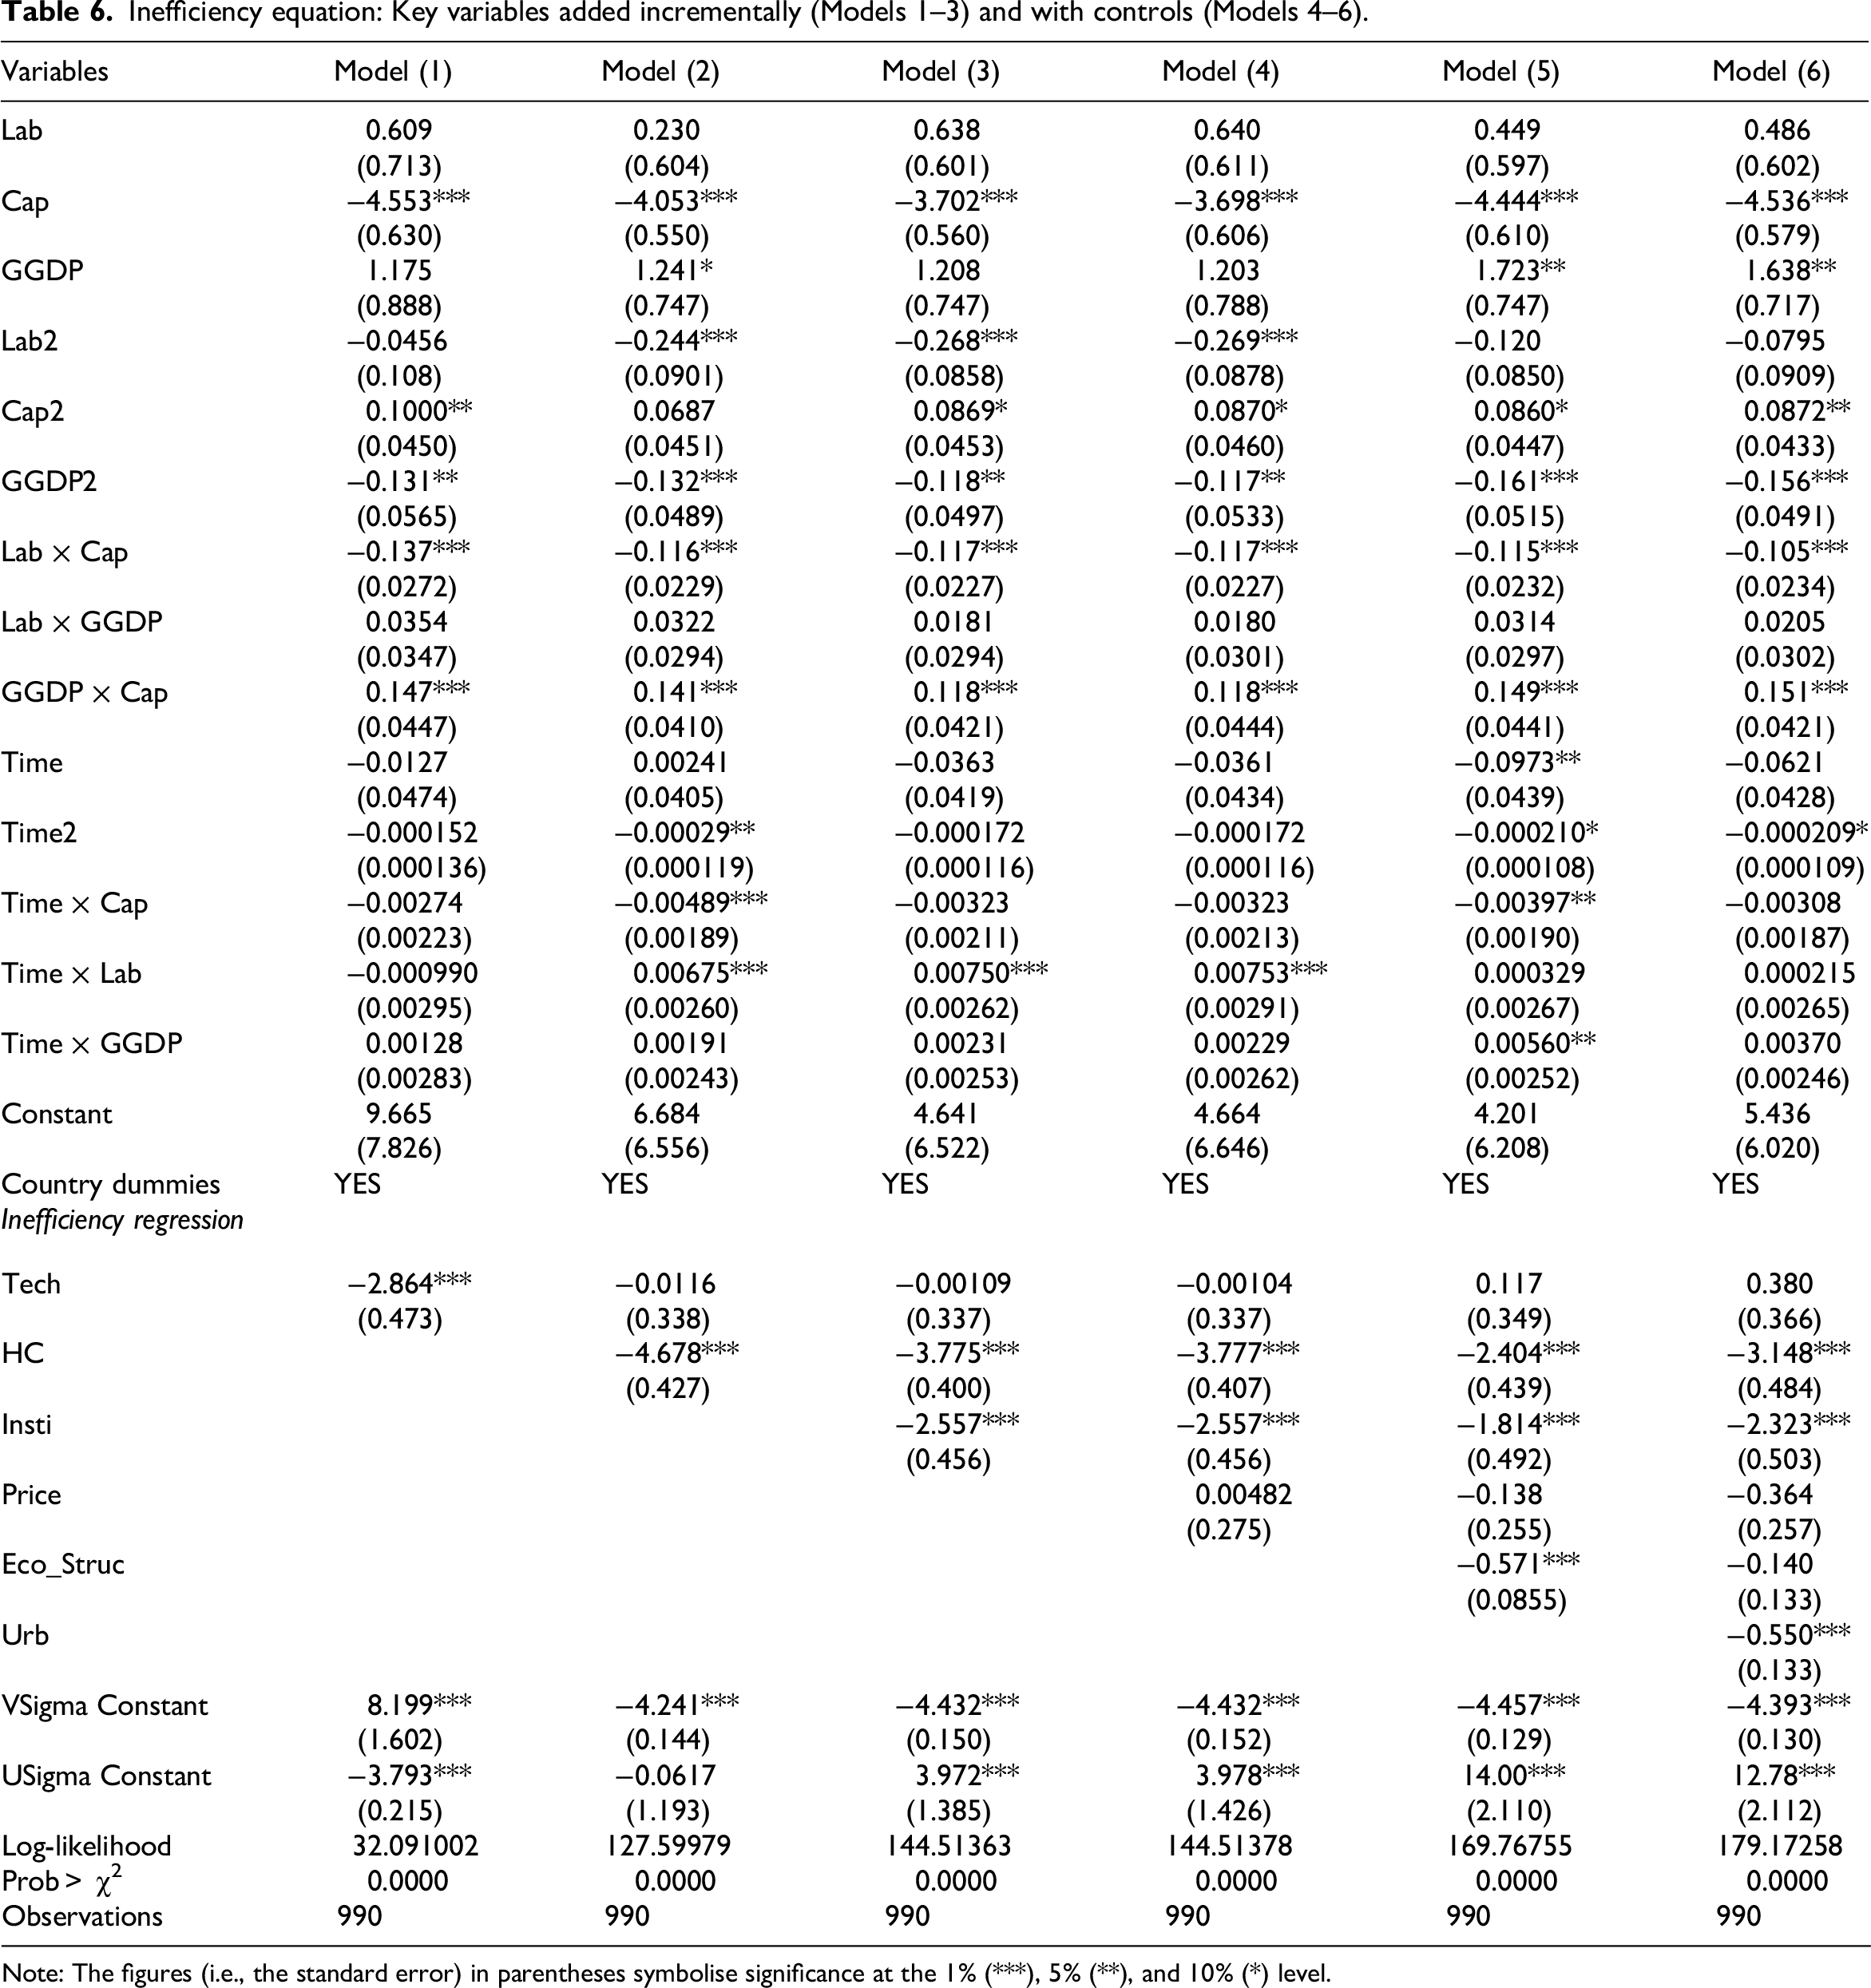
Inefficiency equation: Key variables added incrementally (Models 1–3) and with controls (Models 4–6).
Note: The figures (i.e., the standard error) in parentheses symbolise significance at the 1% (***), 5% (**), and 10% (*) level.
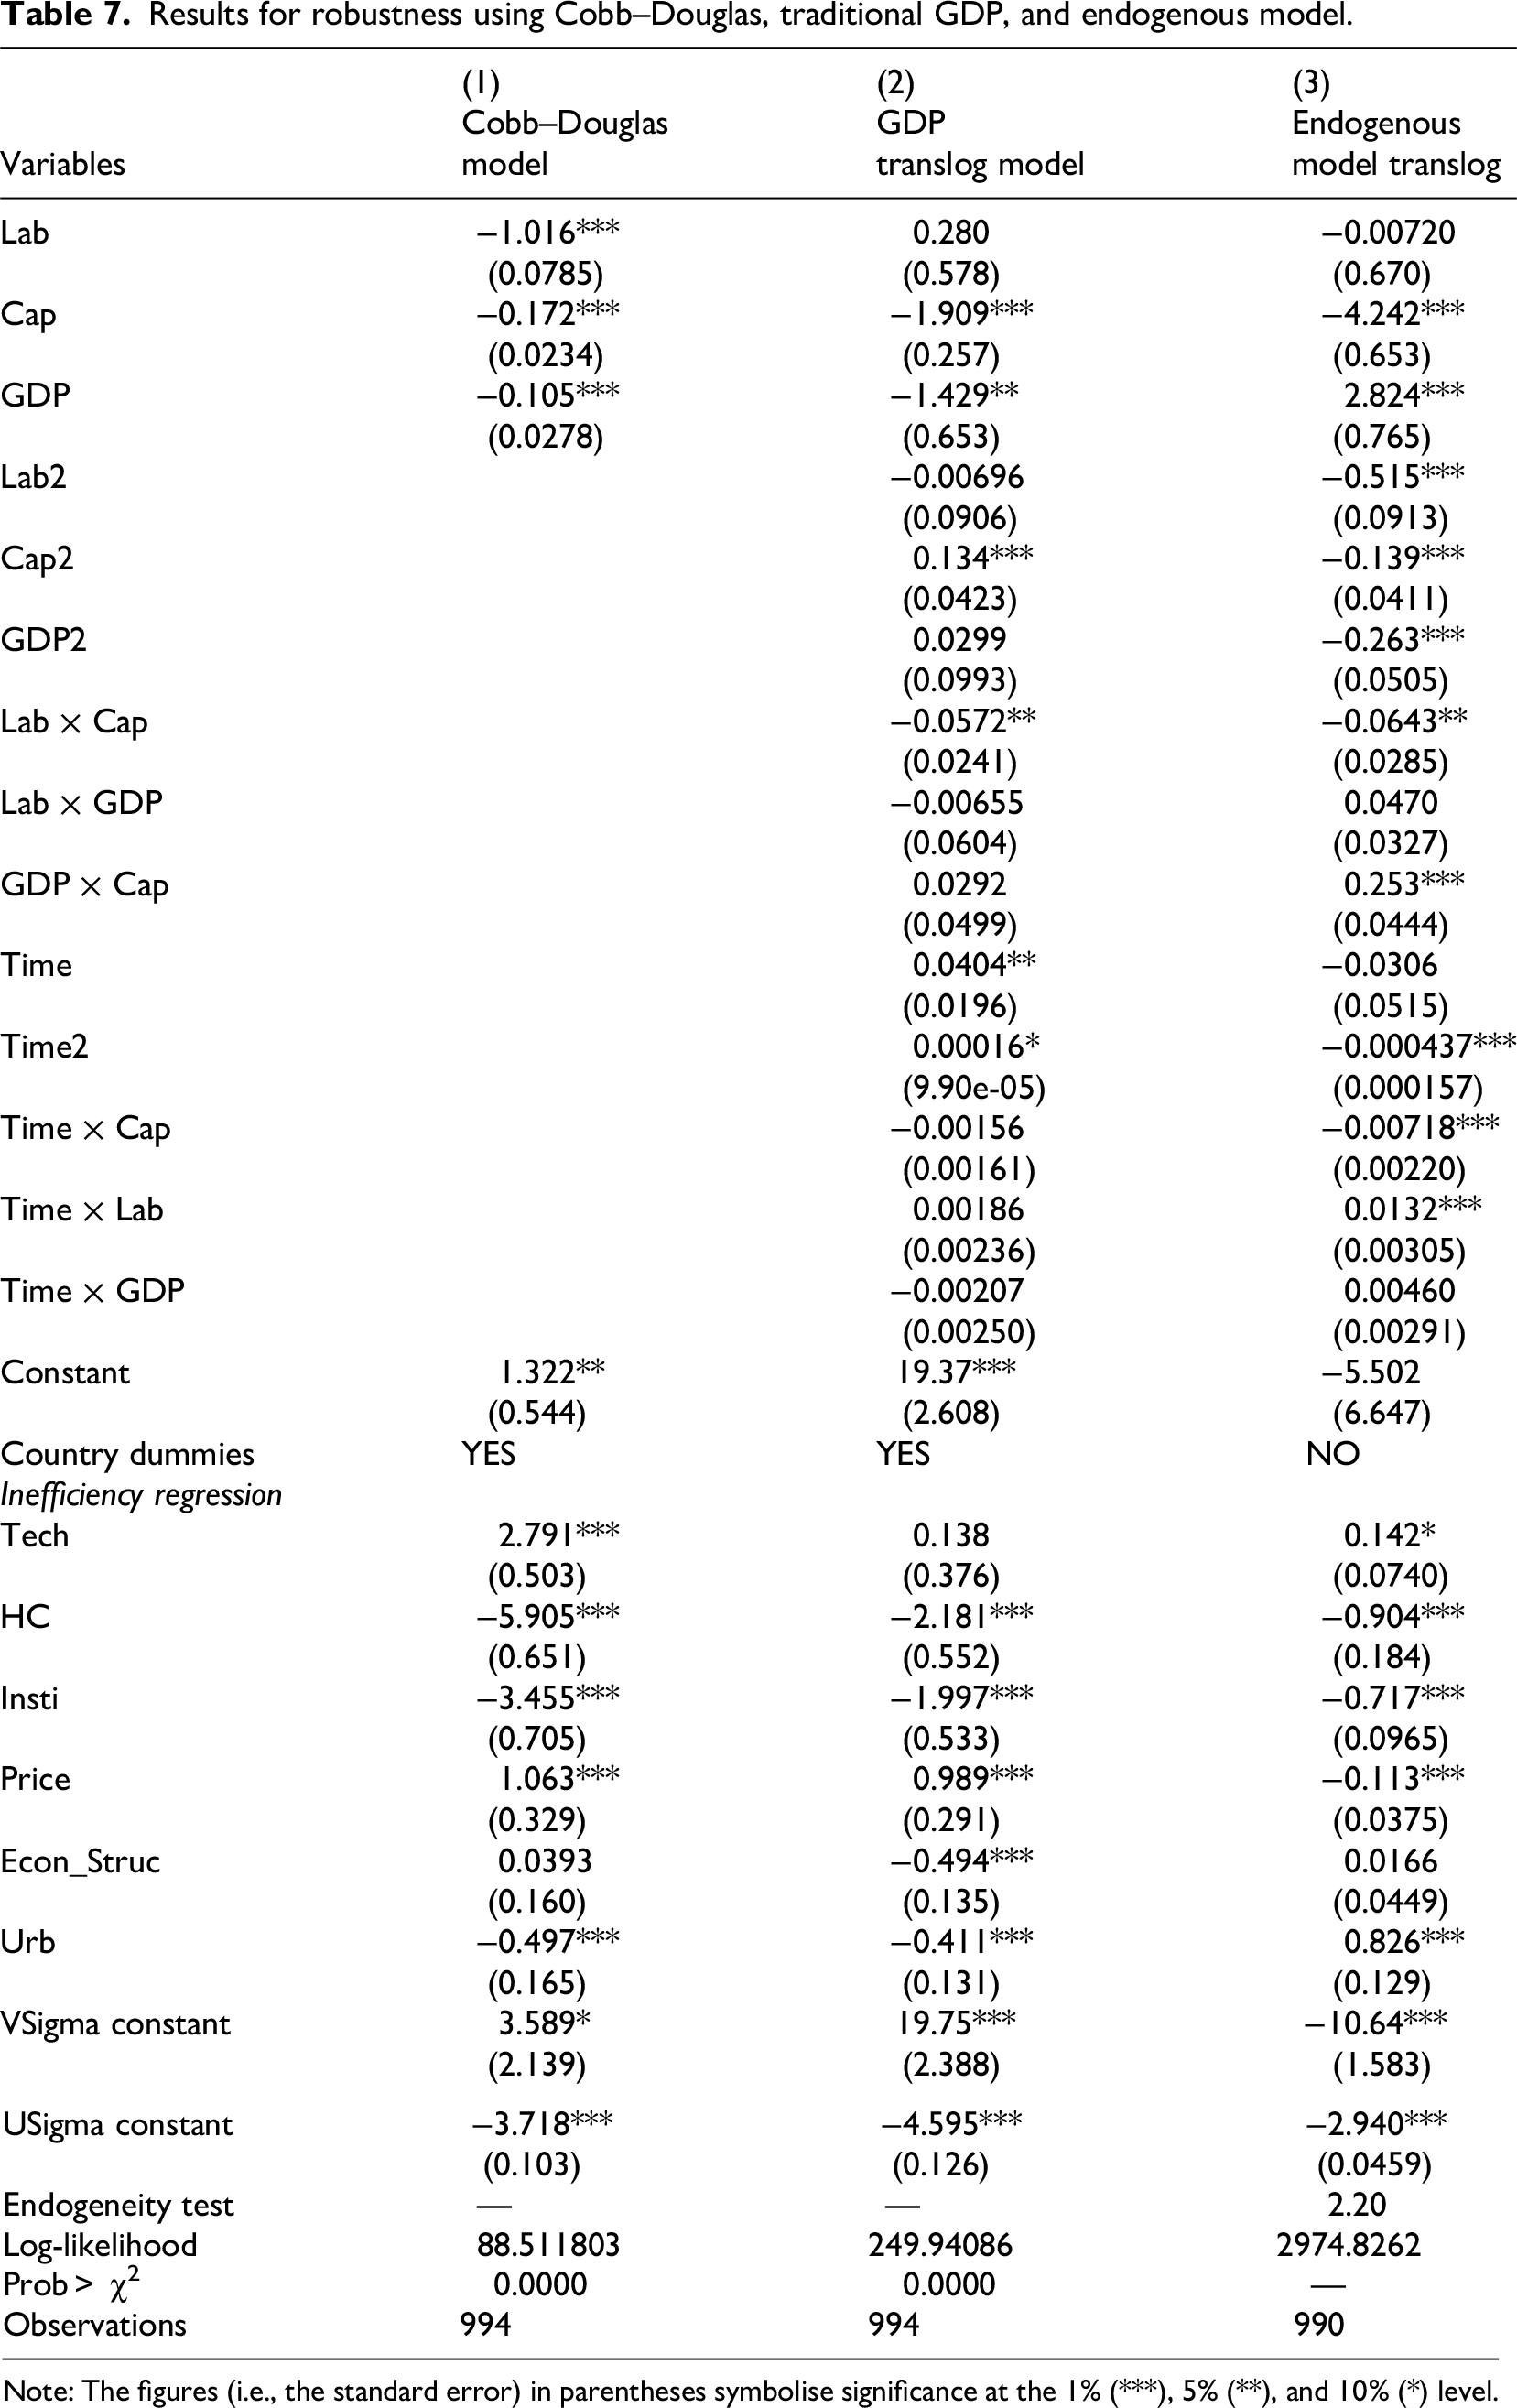
Results for robustness using Cobb–Douglas, traditional GDP, and endogenous model.
Note: The figures (i.e., the standard error) in parentheses symbolise significance at the 1% (***), 5% (**), and 10% (*) level.
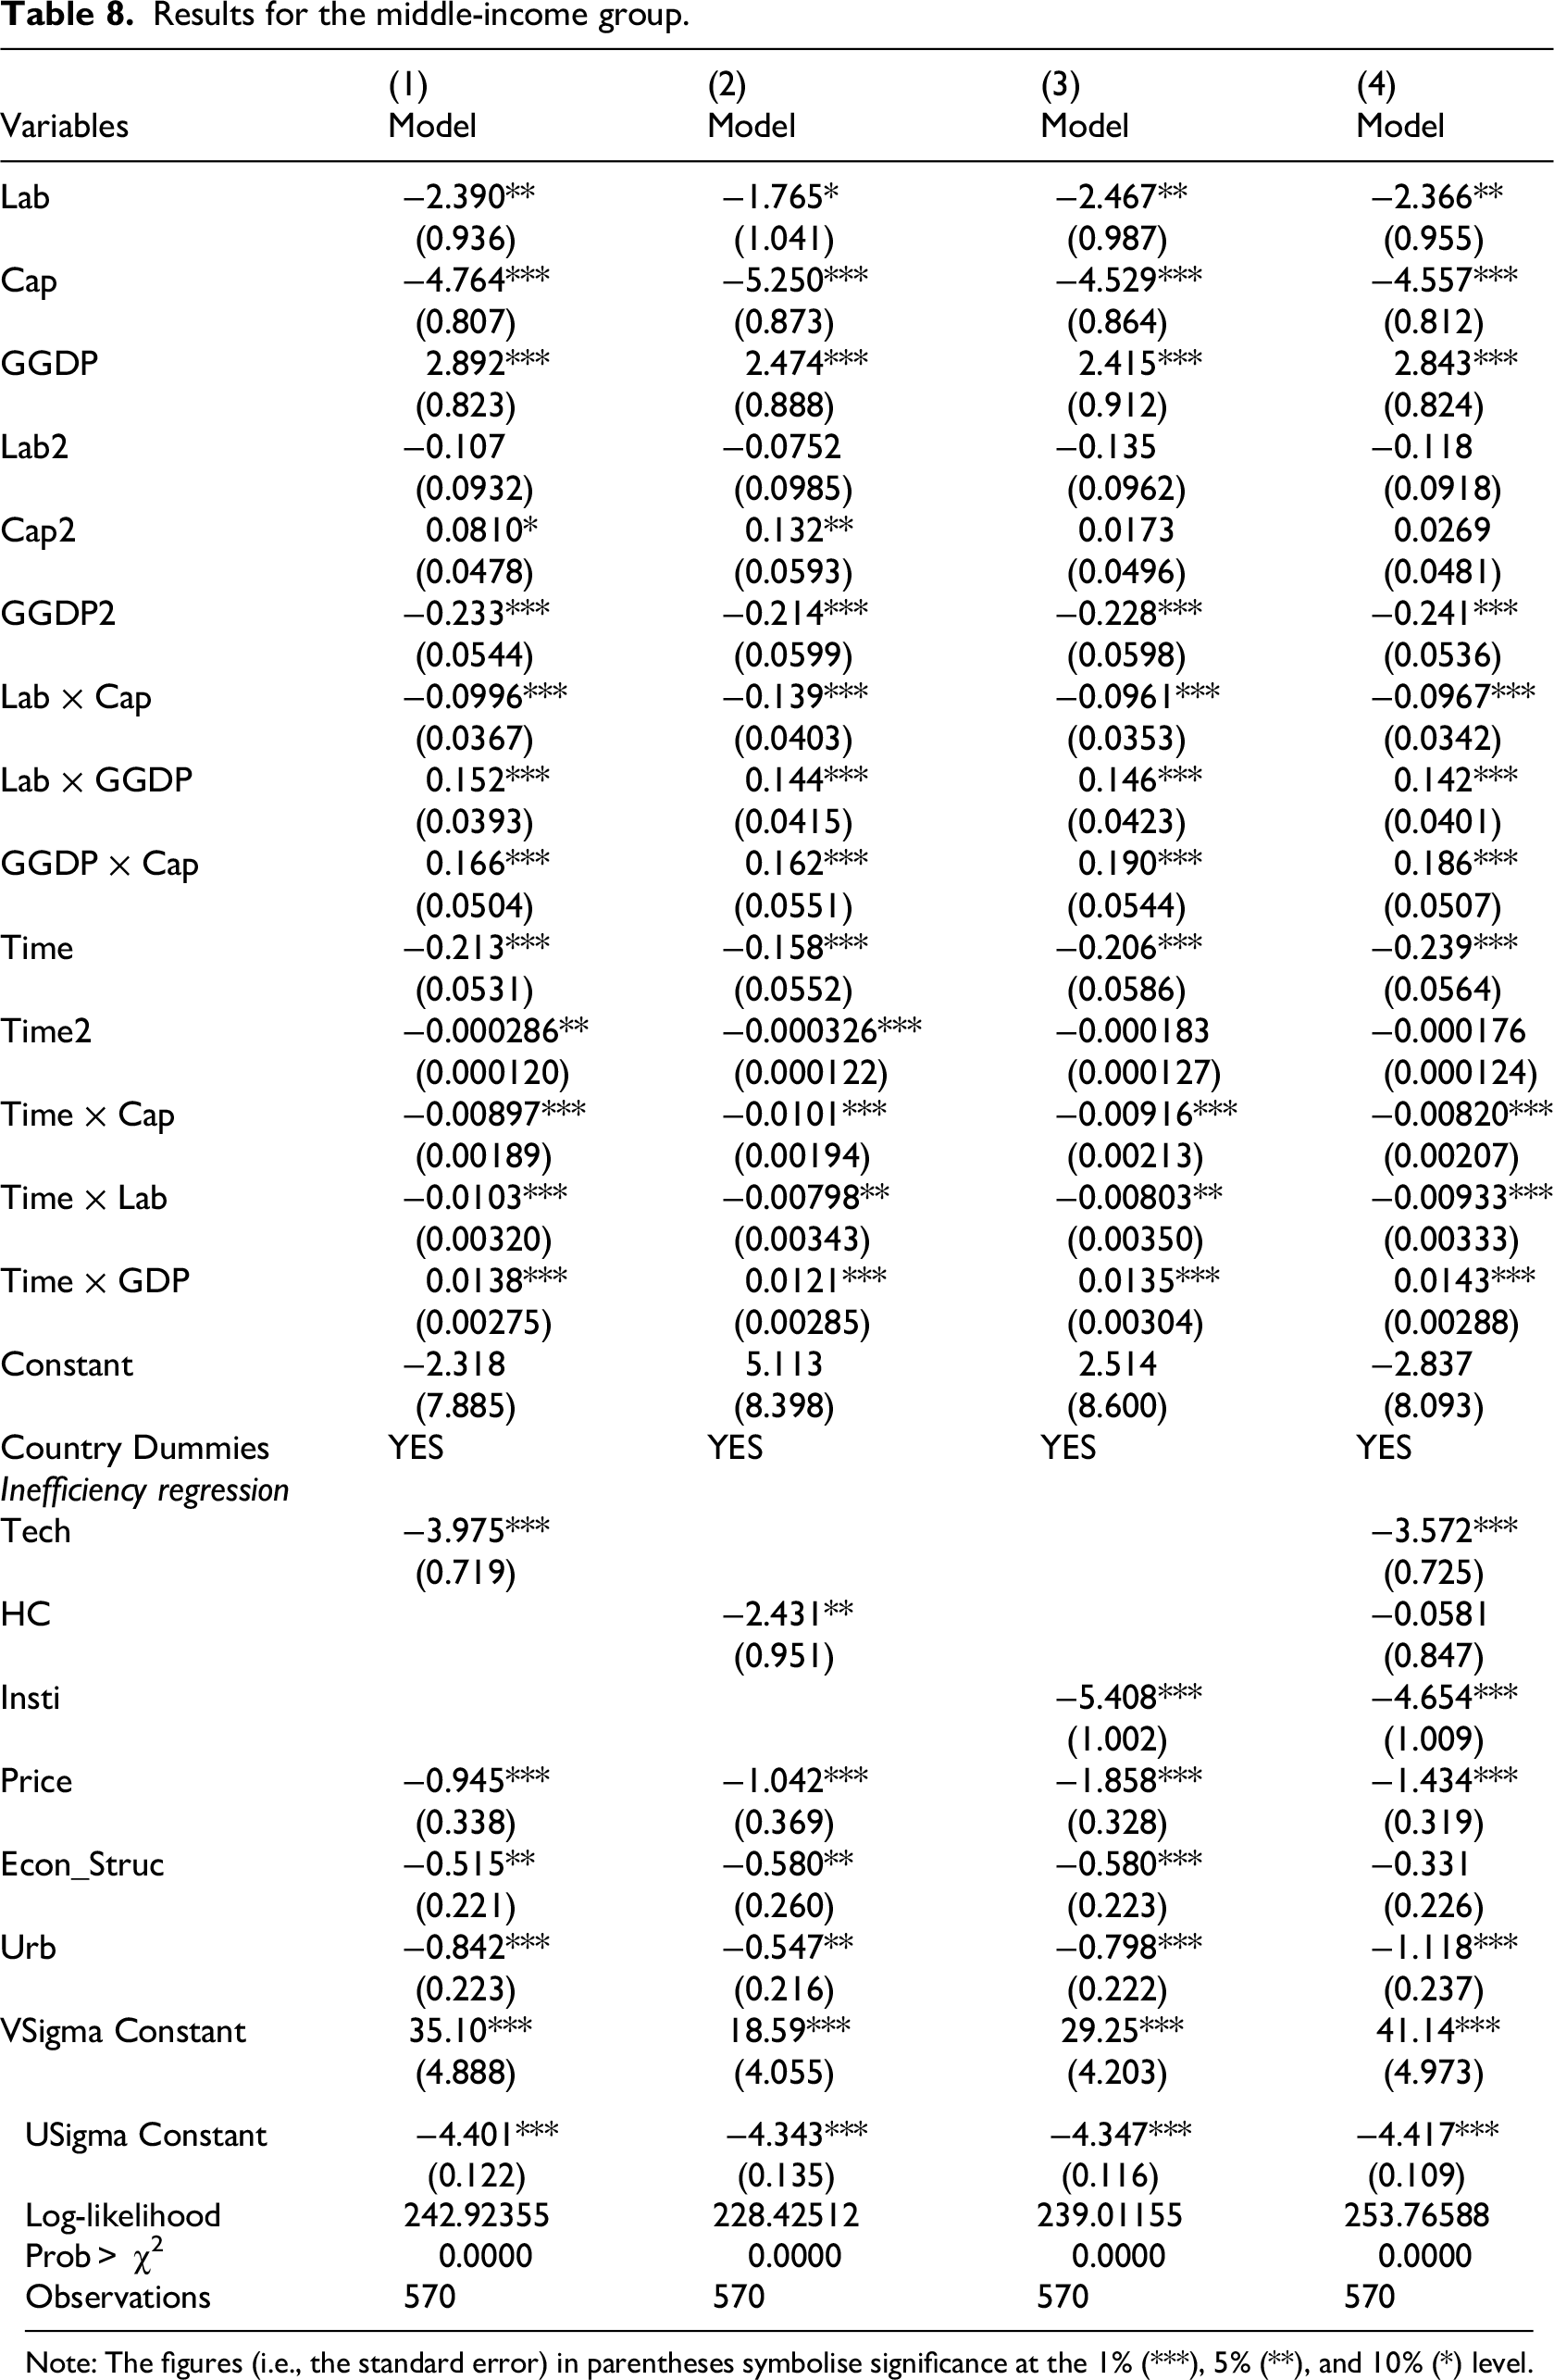
Results for the middle-income group.
Note: The figures (i.e., the standard error) in parentheses symbolise significance at the 1% (***), 5% (**), and 10% (*) level.
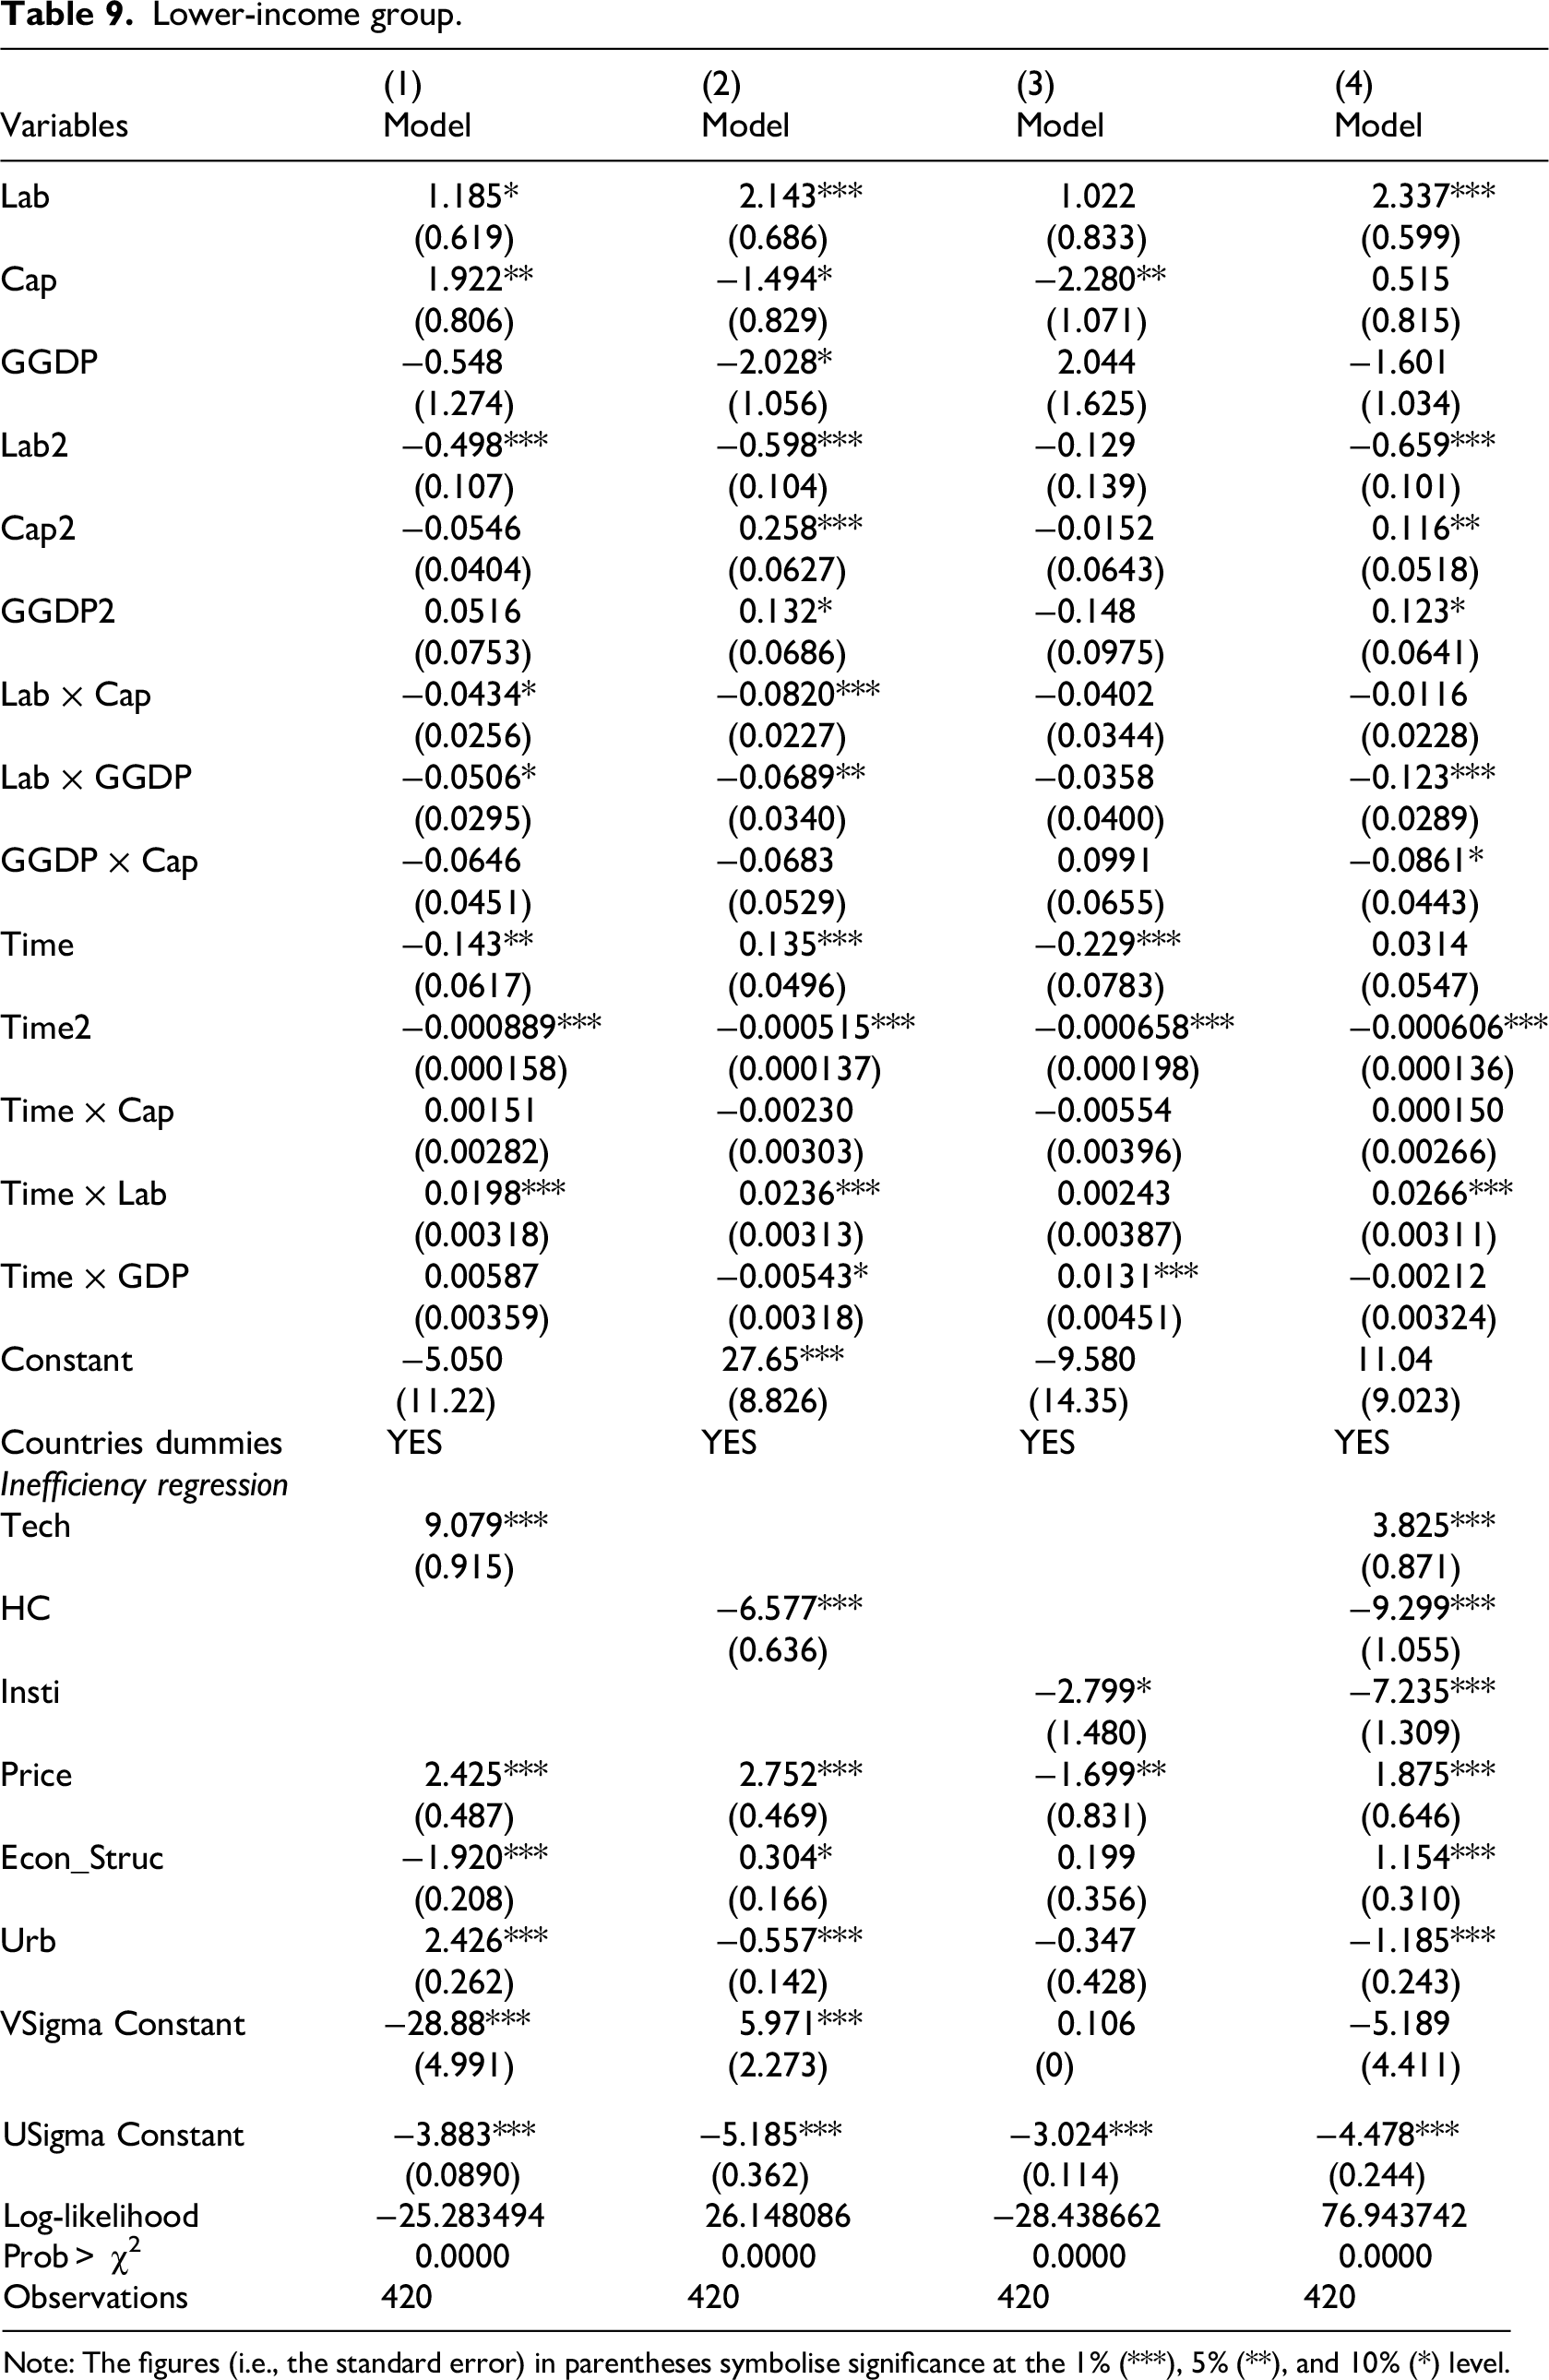
Lower-income group.
Note: The figures (i.e., the standard error) in parentheses symbolise significance at the 1% (***), 5% (**), and 10% (*) level.
Baseline results
Our primary goal is to understand how technology, human capital, and institutional quality influence technical inefficiency in African energy consumption. Tables 5 and 6 explore this using two approaches. In Table 5, Models (1) to (3) introduce each key variable separately into the inefficiency equation without controls. The results show that technology (−2.864, Model 1), human capital (−4.684, Model 2), and institutional quality (−4.500, Model 3) all have negative and statistically significant effects on technical inefficiency at the 1% level. This implies that increases in any of these variables reduce inefficiency, ceteris paribus. Even after adding control variables in Models (4)‒(6), the key variables’ coefficients remain negative and significant at the 1% level—technology (−1.375), human capital (−3.183), and institutional quality (−2.996). However, the magnitude of these coefficients declines compared to the initial models, indicating that factors like energy prices, economic structure, population, and urbanization may share positive correlations with the key variables. This underscores the importance of including relevant controls in the inefficiency equation to avoid bias and ensure reliable estimates.
In Table 6, the key variables are incrementally added to the inefficiency equation across Models (1)‒(3), followed by the systematic inclusion of three control variables in Models (4)‒(6) (This step-by-step and multidimensional approach helps us better understand the effects of the key and control variables on technical inefficiency). Our analysis focuses primarily on Table 6 to understand the combined effects of these variables.
As we progressively included technology, human capital, and institutional quality one at a time, the statistical significance of technology diminished, becoming insignificant in Model (6) when all three variables were included. Specifically, the technology coefficient dropped from −2.864 (Model 1, significant at 1%) to 0.380 (Model 6, not significant). This suggests that technology's direct effect on reducing inefficiency weakens once human capital and institutional quality are accounted for. This finding aligns with prior studies such as Danquah 85 and Liu et al., 6 indicating that technological advances alone have limited impact on EE in Africa. In other words, technological advancements may not be the most crucial factor in Africa for improving EE (Technology's impact in Africa may be limited mainly due to high costs, which prevent small farmers and businesses from adopting advanced systems).9,87 Additionally, cultural norms, like reliance on traditional biomass cooking may hinder the shift to energy-efficient alternatives despite their benefits.28,42 Instead, a more holistic approach, considering various factors, is more likely to succeed. For example, policies that foster human capital growth, strengthen institutions, encourage using renewable energy sources, and optimize systems and processes could significantly enhance EE.
However, the results for human capital and institutional quality remained negative and statistically significant throughout the model, albeit with a reduction in the magnitude of their coefficients. For example, human capital's coefficient declined from −4.684 (Model 2, Table 5) to −3.183 (Model 6), while institutional quality decreased from −4.500 (Model 3) to −2.996 (Model 6), both significant at the 1% level. This shows that high-quality institutions and human capital can increase EE and assist reach Sustainable Development Goal (SDG) 7.3, which calls for doubling EE improvement by 2030. The IEA 88 states that developing human potential is essential to accomplishing sustainable energy development goals including energy access, security, and climate change. Similarly, enhancing African institutions like the rule of law, openness, and accountability can increase EE. Thus, this research emphasizes the importance of human resources and high-quality institutions in sustainable growth, particularly in the energy sector.
For the control variables, energy prices show a negative but statistically insignificant effect on EE (e.g., −0.108 in Model 6). This suggests that price increases alone are unlikely to improve EE in Africa, possibly due to market rigidities or limited alternatives. On the other hand, economic structure (e.g., −0.375 in Model 6) and urbanization (−0.361 in Model 6) have significant negative impacts on efficiency.
Robustness and sensitivity analysis
To ensure the validity of our findings, we perform robustness tests using a different functional form and a model that accounts for endogeneity. Additionally, we conduct sensitivity analysis to assess how contextual differences may impact the results.
Robustness analysis
First, our analysis has so far assumed that energy sector production technology follows a flexible translog functional form. However, if this assumption is incorrect, it may bias our estimates of how technology, human capital, and institutional quality affect GTFEE. To test this, we re-estimate the model using a different functional form—the Cobb–Douglas model. The results, shown in Model 1 of Table 7, confirm that human capital and institutional quality significantly reduce energy consumption inefficiency, with coefficients of −5.905 and −3.455, respectively, both significant at the 1% level. Interestingly, technology shows a positive and significant coefficient of 2.791 (1% level), suggesting it may not enhance EE under this specification. The effects of control variables remain consistent with earlier findings.
Second, to verify the robustness of our results to the choice of output measure, Model 2 in Table 7 replaces GGDP with traditional GDP. Here, human capital (−2.181) and institutional quality (−1.997) again significantly reduce inefficiency (both at 1%), while technology's effect becomes insignificant (0.138). This consistency supports the robustness of our key findings across different GDP measures.
Third, recognizing potential endogeneity concerns—especially that GGDP may be endogenous—we employ the Karakaplan and Kutlu 86 endogenous SFA model in Model 3 (Table 8). Using life expectancy at birth as an instrument for GDP (following), 87 we find that the endogeneity test is insignificant (test statistic 2.20), indicating no endogeneity problem. Under this model, human capital (−0.904, 1%) and institutional quality (−0.717, 1%) remain significant in reducing inefficiency, while technology shows a small positive effect (0.142, significant at 10%). Control variables display similar patterns as before.
Sensitivity analysis of the results
Level of development
So far, our analysis has assumed that advances in EE are driven by improvements in technology, human capital, and institutions. However, economic growth plays a crucial role in enhancing these factors, and poorer countries may face challenges improving EE due to limited resources or weak institutions. To account for these differences, we divide countries into low- and middle-income groups, allowing for more accurate analysis. The results are summarized in Table 8 (middle-income) and Table 9 (low-income).
Table 8 illustrates that, in middle-income countries, technology significantly reduces technical inefficiency in energy use. For example, technology coefficients are −3.975 in Model (1) and −3.572 in Model (4), both significant at the 1% level, indicating its potential to improve EE. Human capital also negatively affects inefficiency, with a coefficient of −2.431 (Model 2, significant at 5%), though it becomes insignificant in Model (4) (−0.0581). Institutional quality consistently has a strong negative impact, with coefficients such as −5.408 (Model 3) and −4.654 (Model 4), both highly significant. Control variables including energy prices (−0.945 to −1.858), economic structure (−0.515 to −0.580), and urbanization (−0.547 to −1.118) show significant negative effects on the energy inefficiency, highlighting the importance of sustainable economic and urban policies.
However, Table 9 reveals that in low-income countries, technology increases inefficiency significantly, with coefficients of 9.079 (Model 1) and 3.825 (Model 4), both significant at the 1% level. This suggests that technology may exacerbate inefficiency in poorer contexts, likely due to adoption barriers. Human capital remains strongly negative and significant (−6.577 in Model 2 and −9.299 in Model 4). Institutional quality also negatively affects inefficiency, although with somewhat smaller and mixed coefficients (−2.799, Model 3; −7.235, Model 4). Interestingly, energy prices tend to increase inefficiency in low-income countries, with positive and significant coefficients such as 2.425 (Model 1) and 2.752 (Model 2). Urbanization effects vary, increasing inefficiency in some models (2.426 in Model 1) and decreasing it in others (−1.185 in Model 4).
These results indicate a potential heterogeneity bias in technology's effect on EE: it improves efficiency in middle-income countries but may hinder it in low-income countries due to restricted access and cultural barriers. Meanwhile, human capital and institutional quality consistently promote better EE across income groups, emphasizing the need to invest in education and institutional development to foster sustainable energy consumption in Africa.
GTFEE analysis
So far, we analyze the effects of technology transfer, institutional quality, and human capital on GTFEE. Next, we evaluated each country’s GTFEE. We then took a regional perspective by categorizing these countries into five distinct regions to assess their GTFEE performance. Finally, we compared the GTFEE results based on countries’ income levels. It is important to note that throughout the research we use GTFEE and EE interchangeably.
Country-level analysis
Using the sixth model in Table 6, we estimated the average GTFEE levels for each country over the study period, allowing for a relative performance comparison. The GTFEE values range from 0.57 to 0.95, with most countries scoring higher than 0.70 and an average of 0.80. Although no country has achieved the benchmark score of one, the average score of 0.80 suggests significant short-term progress toward this benchmark. South Africa (0.95), Egypt (0.93), Morocco (0.90), Ghana (0.89), Nigeria (0.89), Algeria (0.88), and Tunisia (0.88) recorded the highest EE scores, consistent with Liu et al. 6 On the other hand, Mozambique (0.57), Rwanda (0.57) and Burundi (0.59) are among the least-performing countries. Countries with low GTFEE could improve energy security by implementing short-term strategies to increase efficiency; without such adjustments, significant inefficiencies will persist. Figure 2 provides a visual representation of the estimated scores.
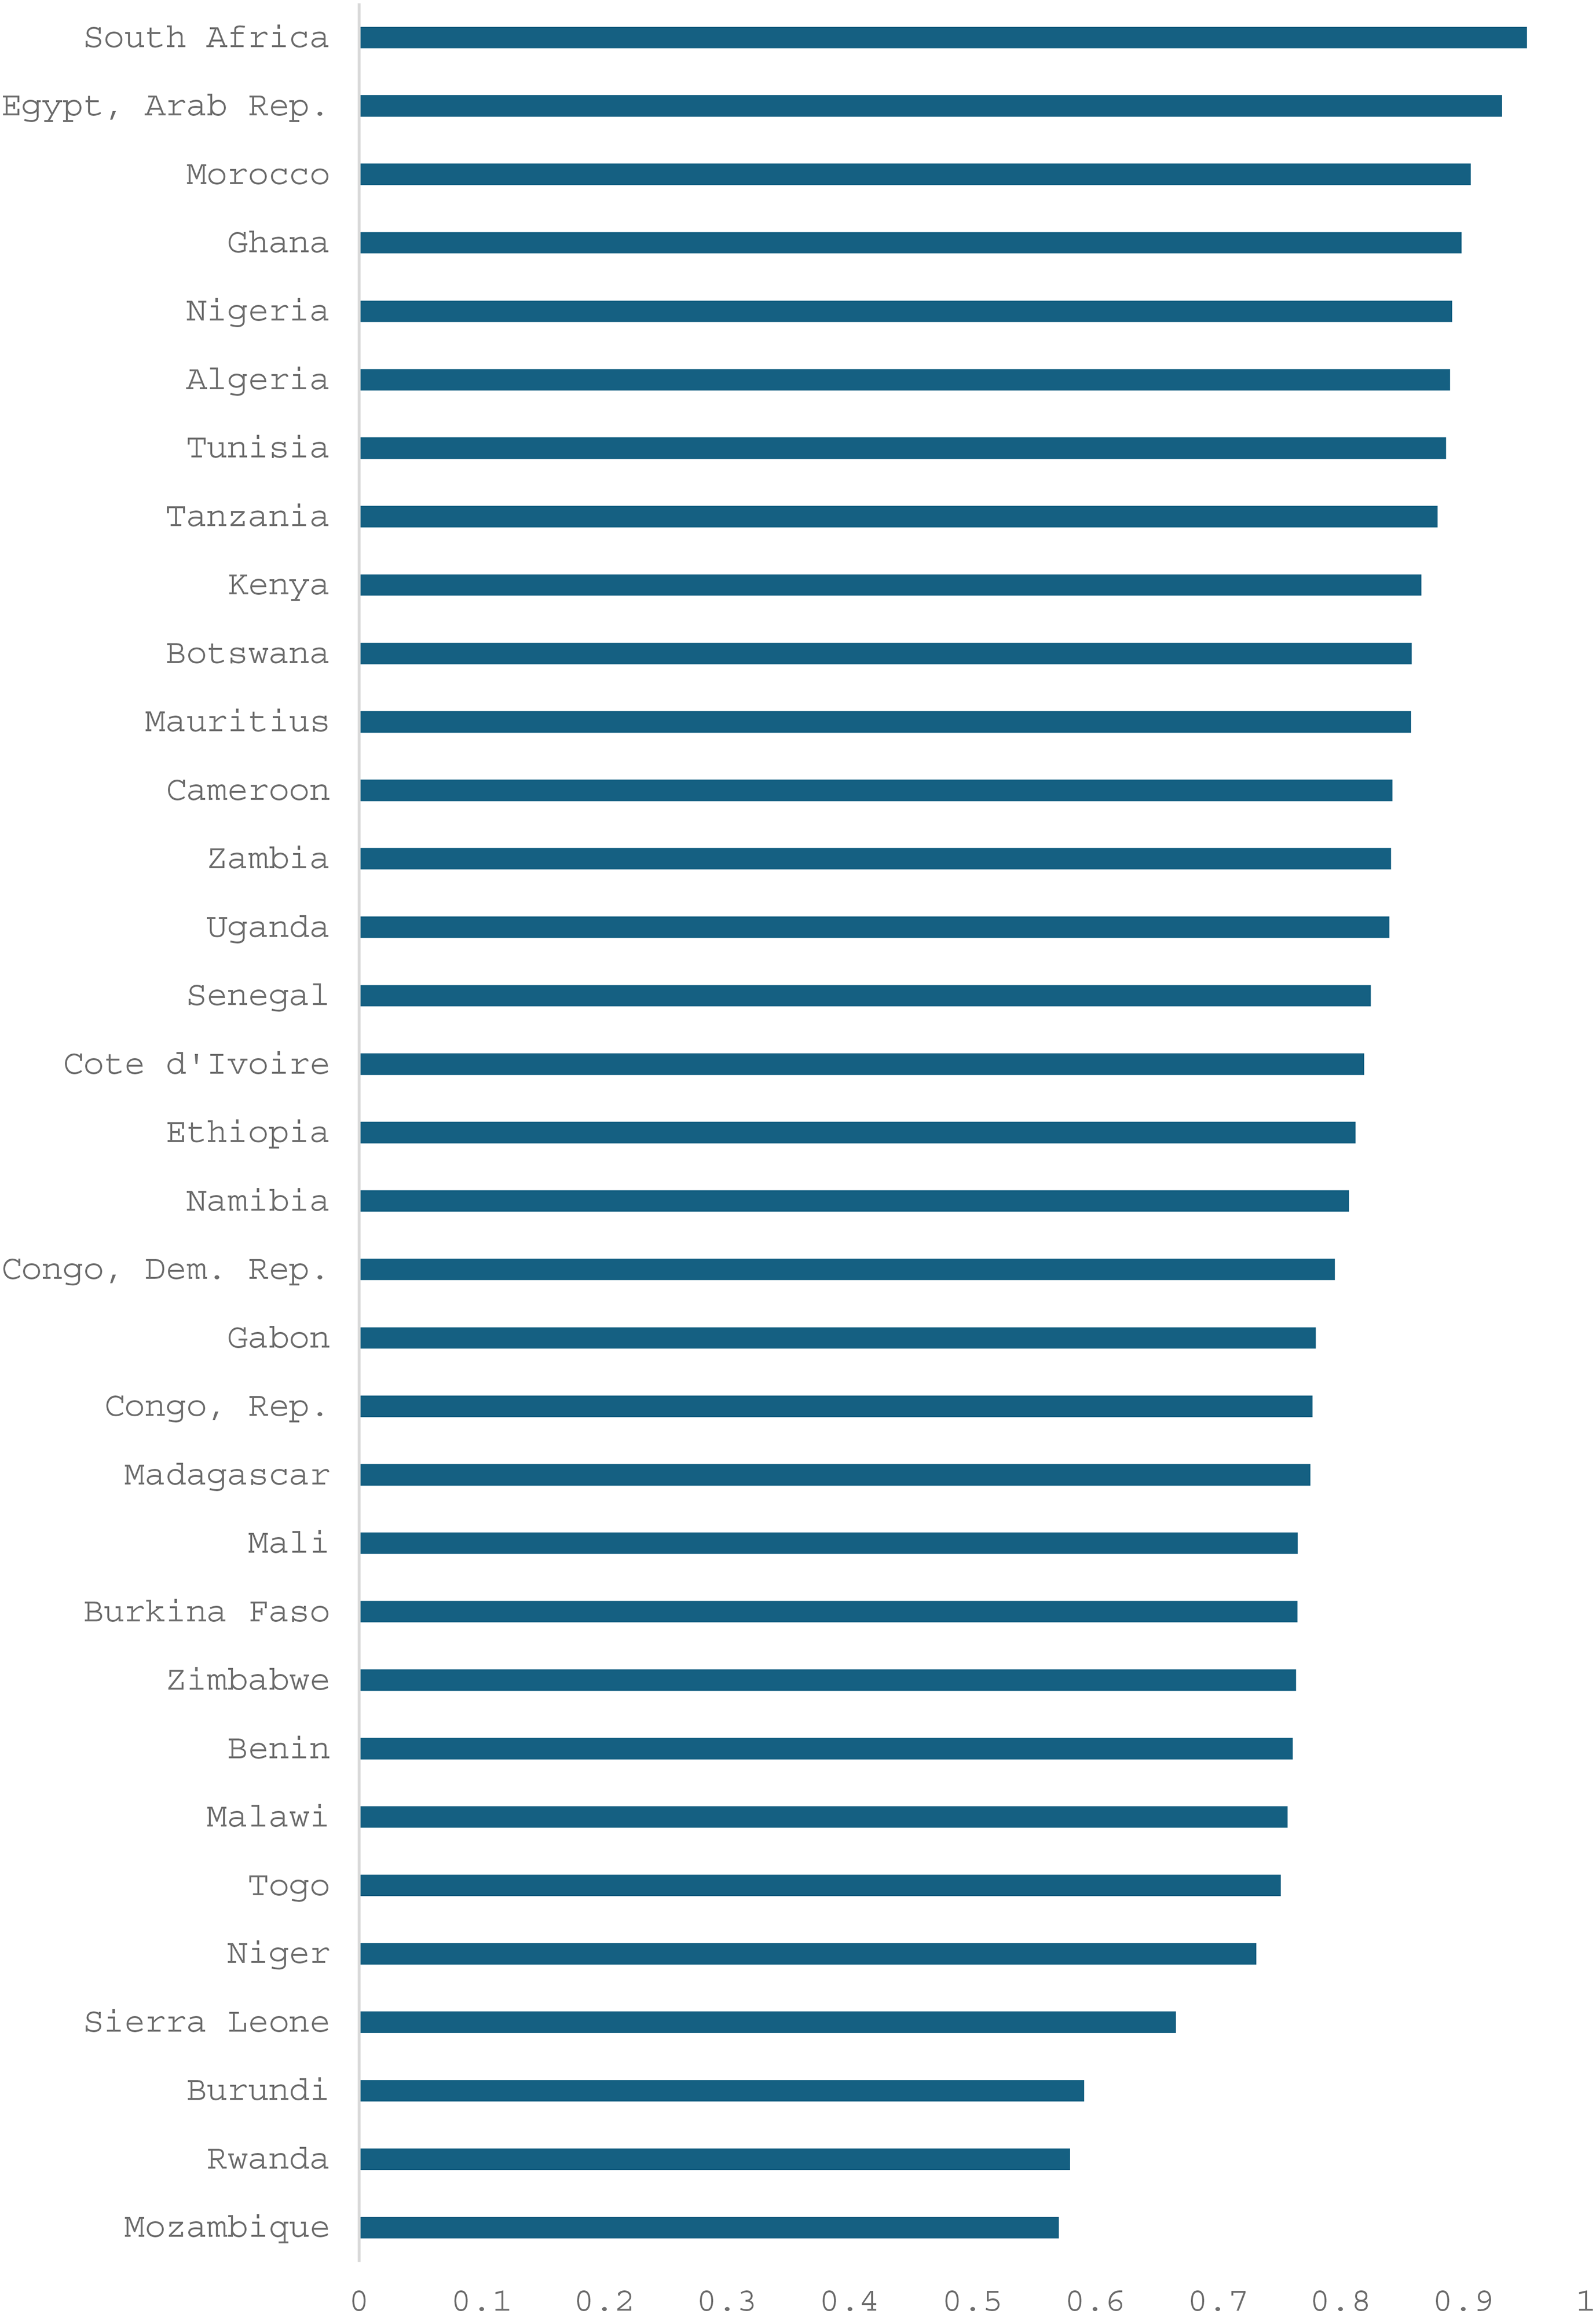
Green total factor energy efficiency (GTFEE) for African countries.
Figure 3 shows the projected GTFEE trends over time, ranging from 0.66 to 0.87. GTFEE generally increased from 1990 to 2008, declined significantly between 2008 and 2013, and rose again after 2013. The growth from 1990 to 2008 likely reflected economic growth and global climate change mitigation initiatives. The reduction between 2008 and 2013 could be attributed to the 2007/2008 global economic crisis, which heightened resource consumption, including energy. As economies recovered, GTFEE improved, aided by renewed emphasis on EE and emissions reduction. Overall, the figure reveals a positive upward trend in GTFEE, emphasizing the importance of sustained energy-saving efforts for Africa's environment and economy.
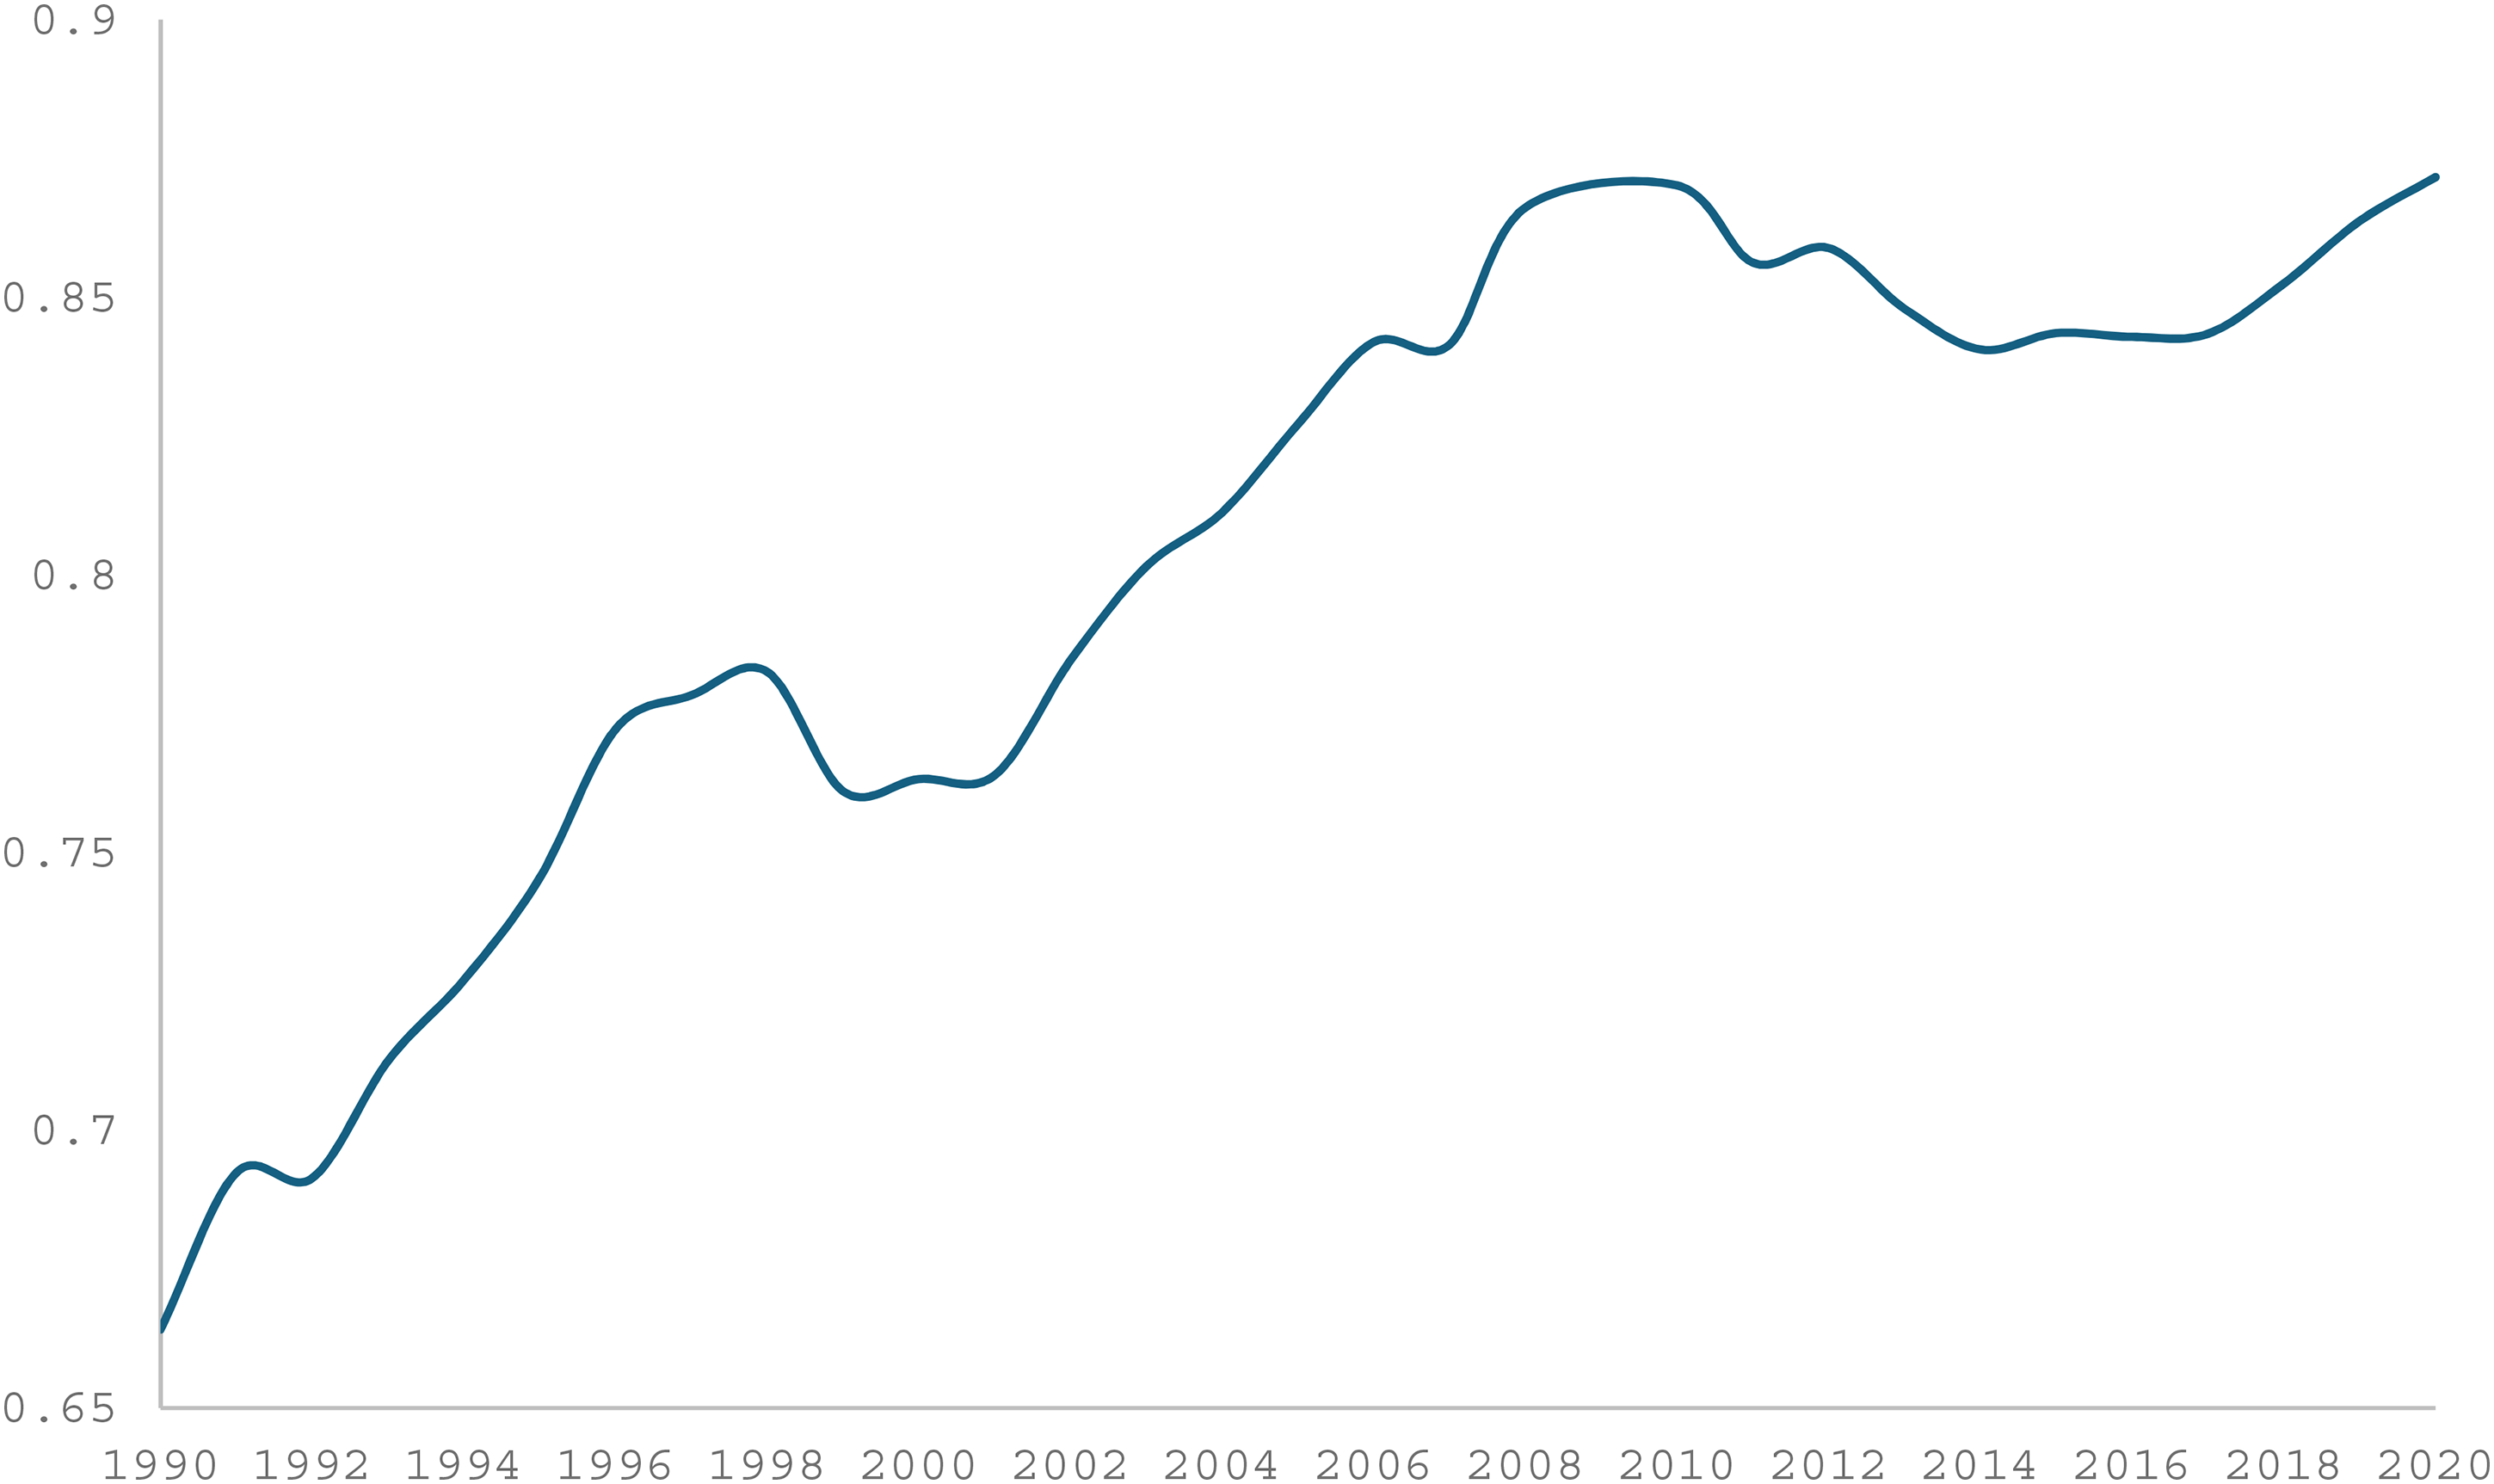
Time evolution of GTFEE for African countries from 1990 to 2020.
Regional-level analysis
To assess the average GTFEE level across five African regions—Southern Africa, Central Africa, Eastern Africa, Western Africa, and Northern Africa—we used the sixth model shown in Table 6. Figure 4 presents the results, showing that Northern Africa leads with the highest GTFEE, followed by Eastern Africa, while Central Africa ranks the lowest. Efficiency scores across the region show clear convergence over time, with most regions approaching values near 0.9 by 2020. The central region showed the sharpest improvement, catching up with the consistently high performing Northern and rebounding Eastern regions. In contrast, the Western region plateaued after the mid-2000s, remaining slighly below the other regions at approximately 0.82 by 2020.
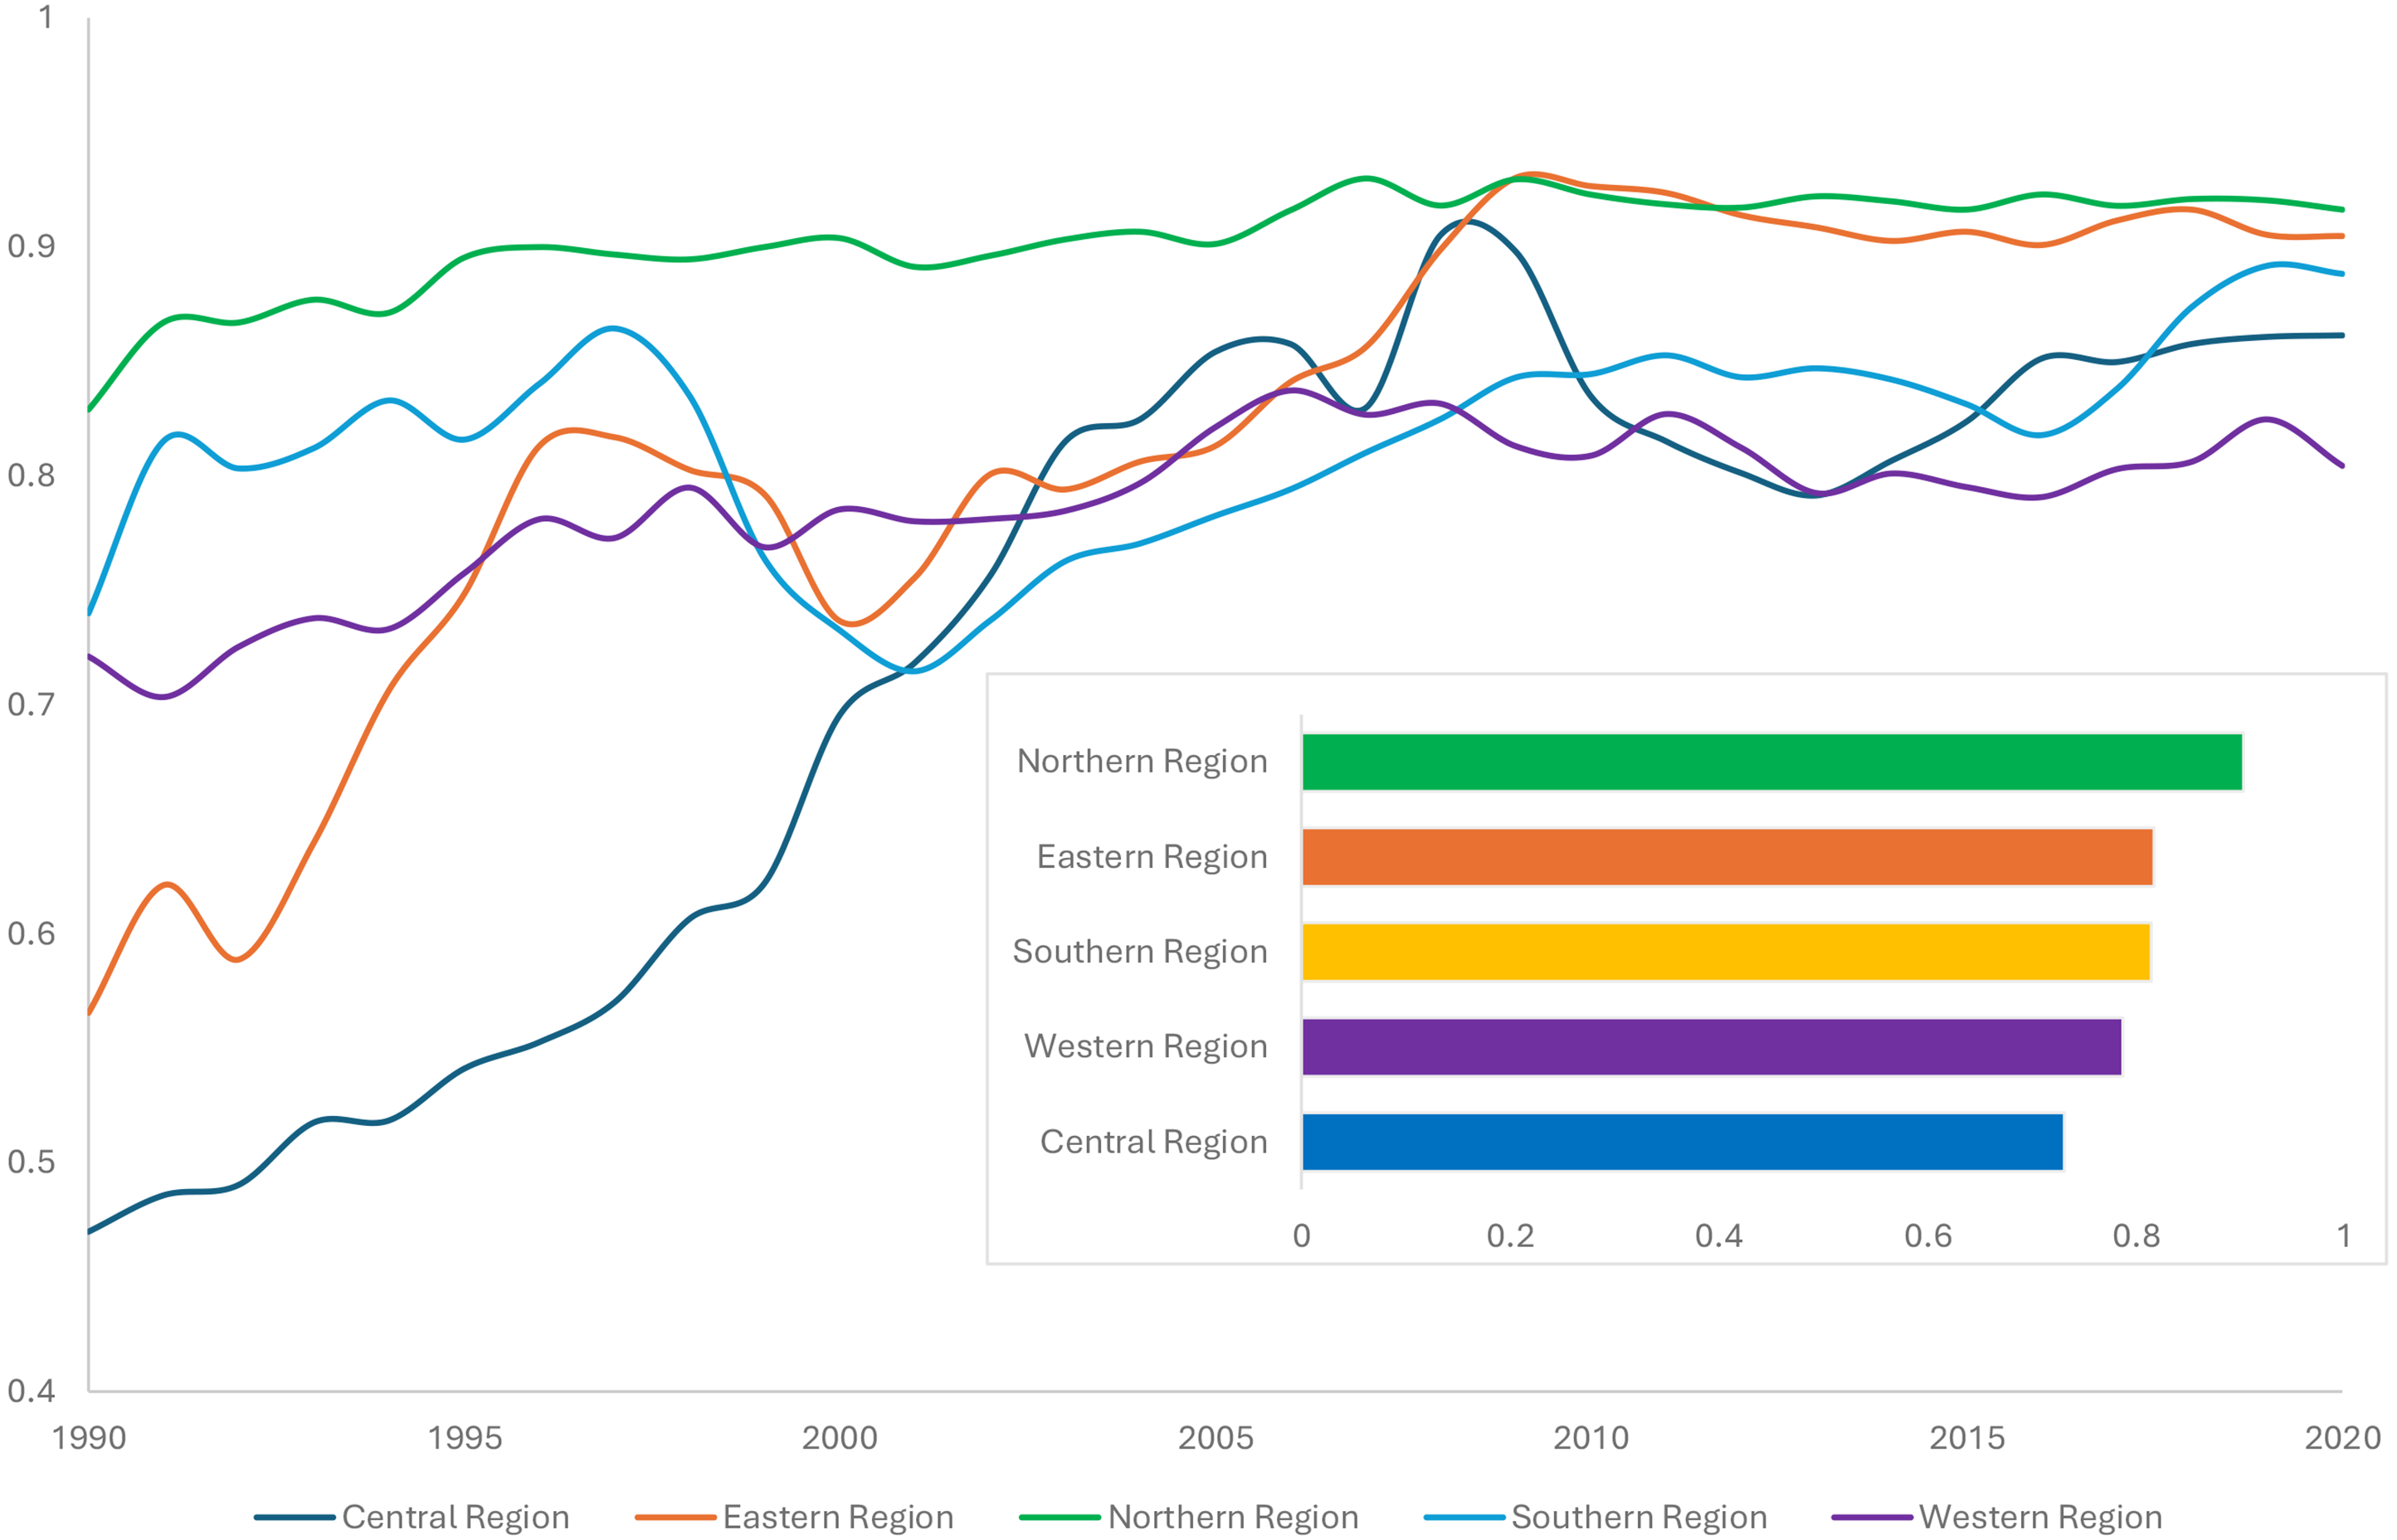
Time evolution of GTFEE from regional perspective.
Income-level analysis
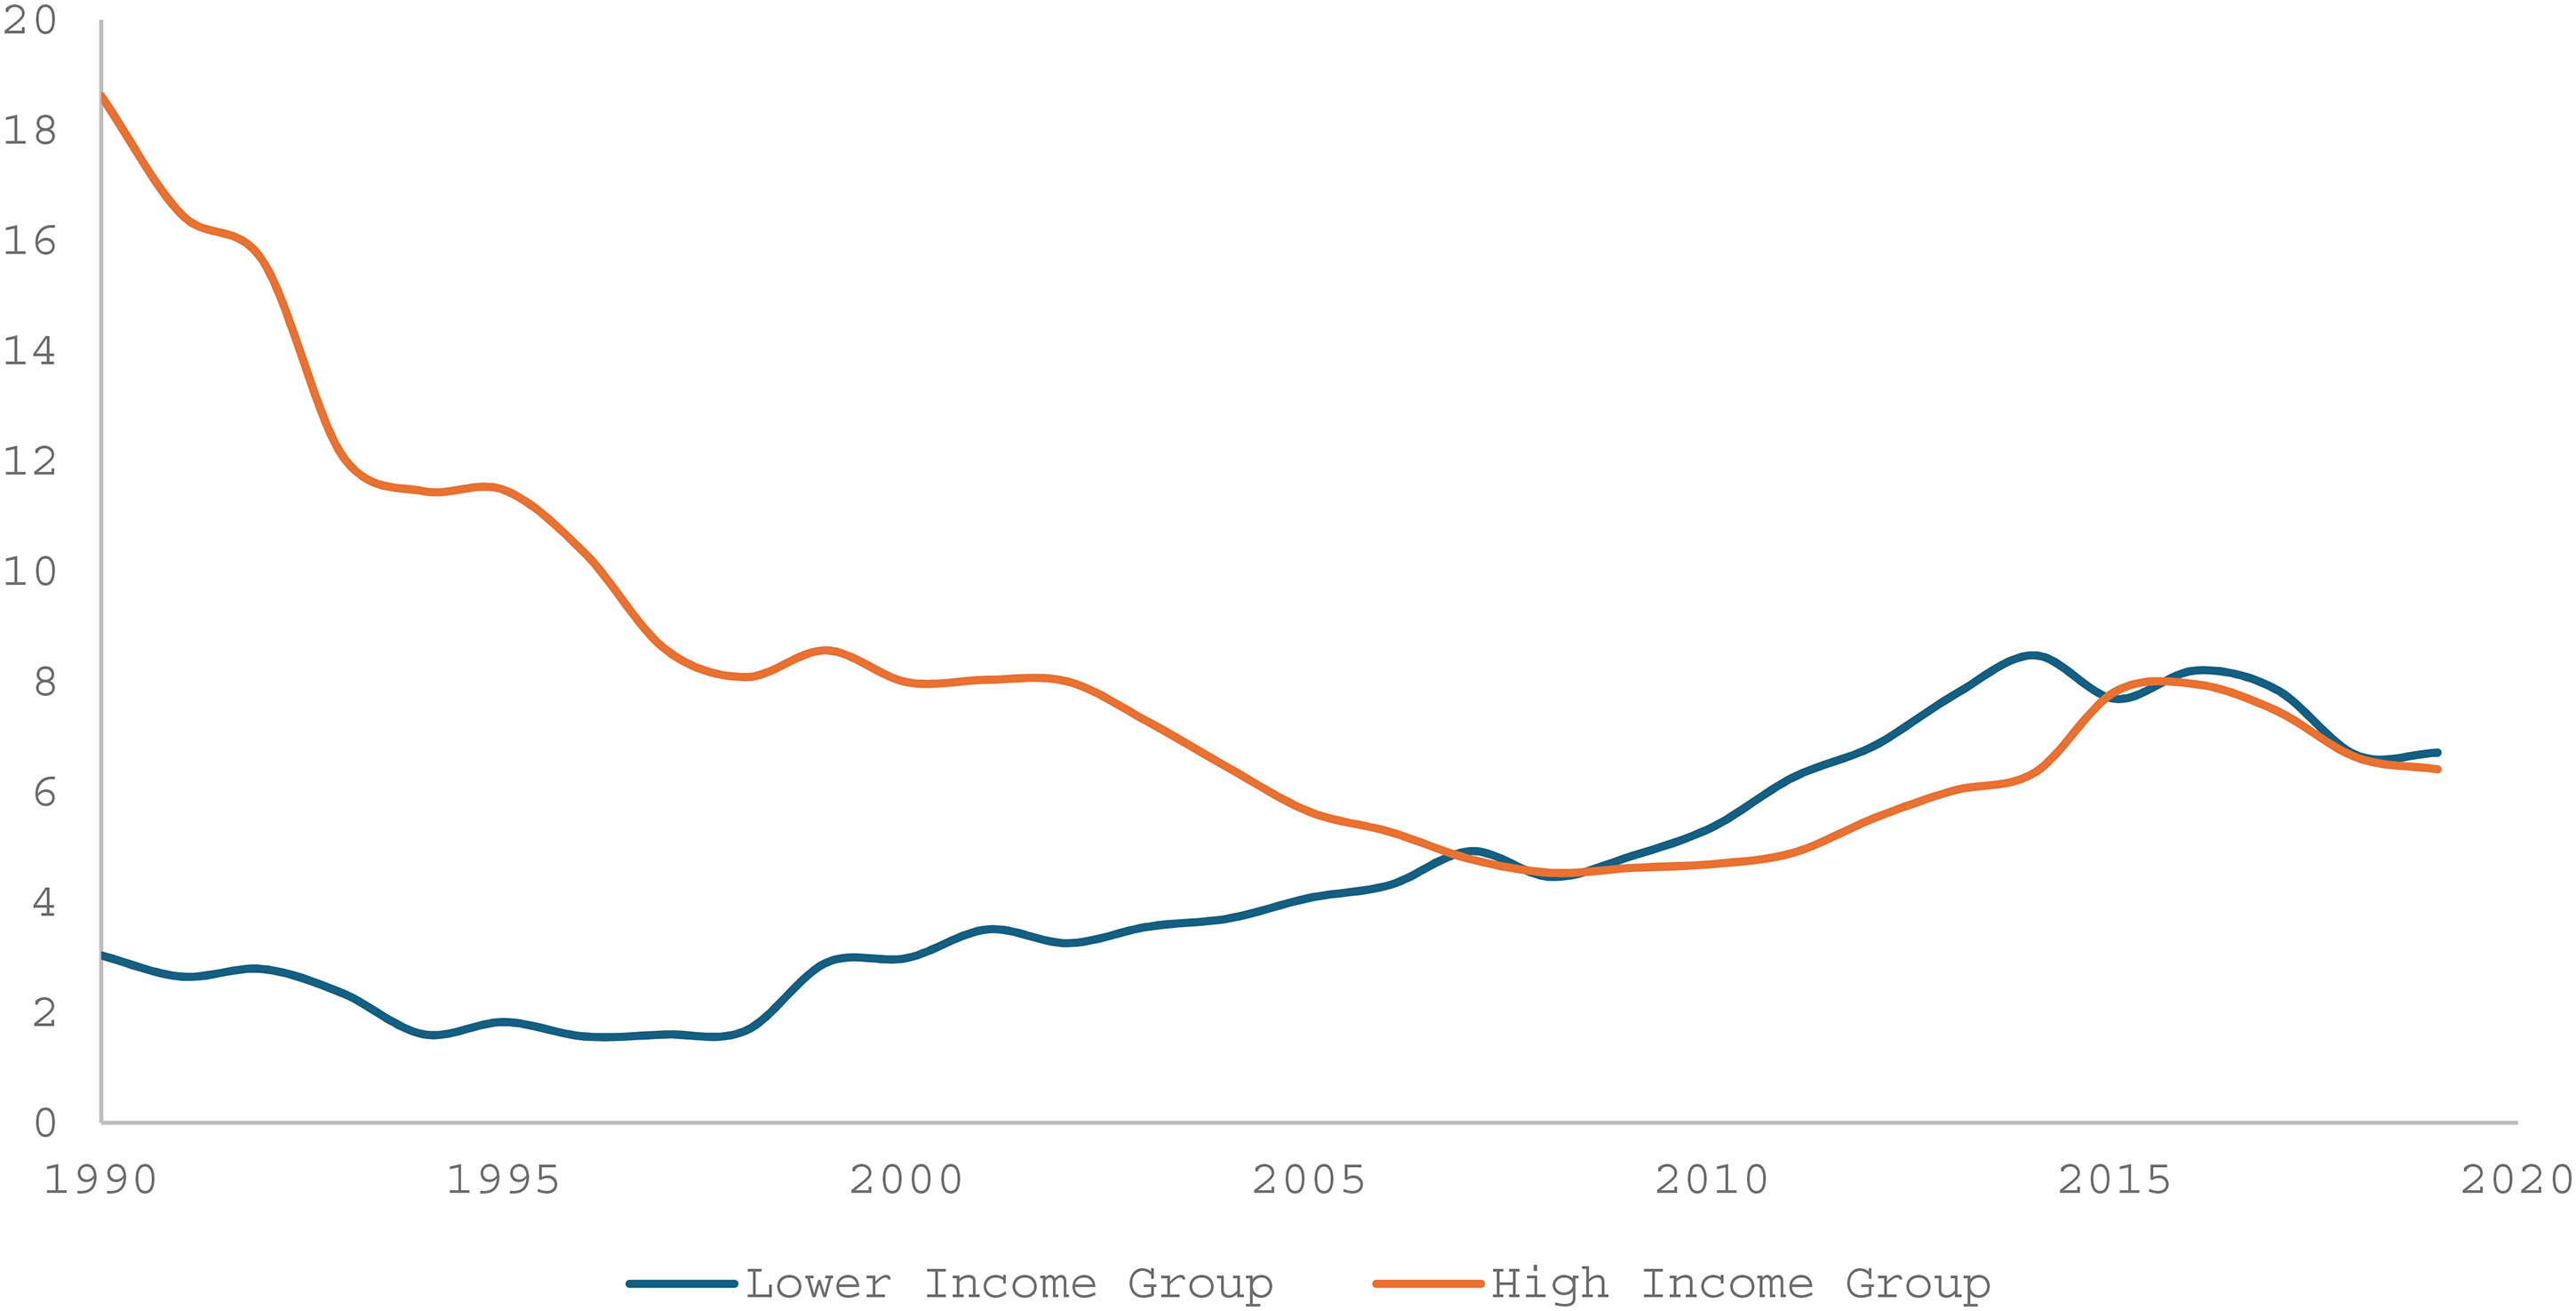
To deepen understanding of the GTFEE variation by income, we analyzed middle- and low-income country groups, as shown in Tables 8 and 9. Figure 5 illustrates GTFEE trajectories from 1990 to 2020 for these groups. Middle-income countries maintain GTFEE levels between approximately 0.71 and 0.95, with steady upward trends reflecting substantial progress toward efficiency goals. In contrast, low-income countries exhibit lower and more volatile GTFEE paths. From 1990 to 2008, their efficiency was close to that of middle-income countries but declined sharply around 2009, likely due to the 2007–2008 global economic crisis. Despite this volatility, some low-income countries have achieved relatively high GTFEE scores, indicating that significant efficiency gains are possible regardless of income level. These findings highlight the critical need for continued EE efforts, particularly in lower-income countries.
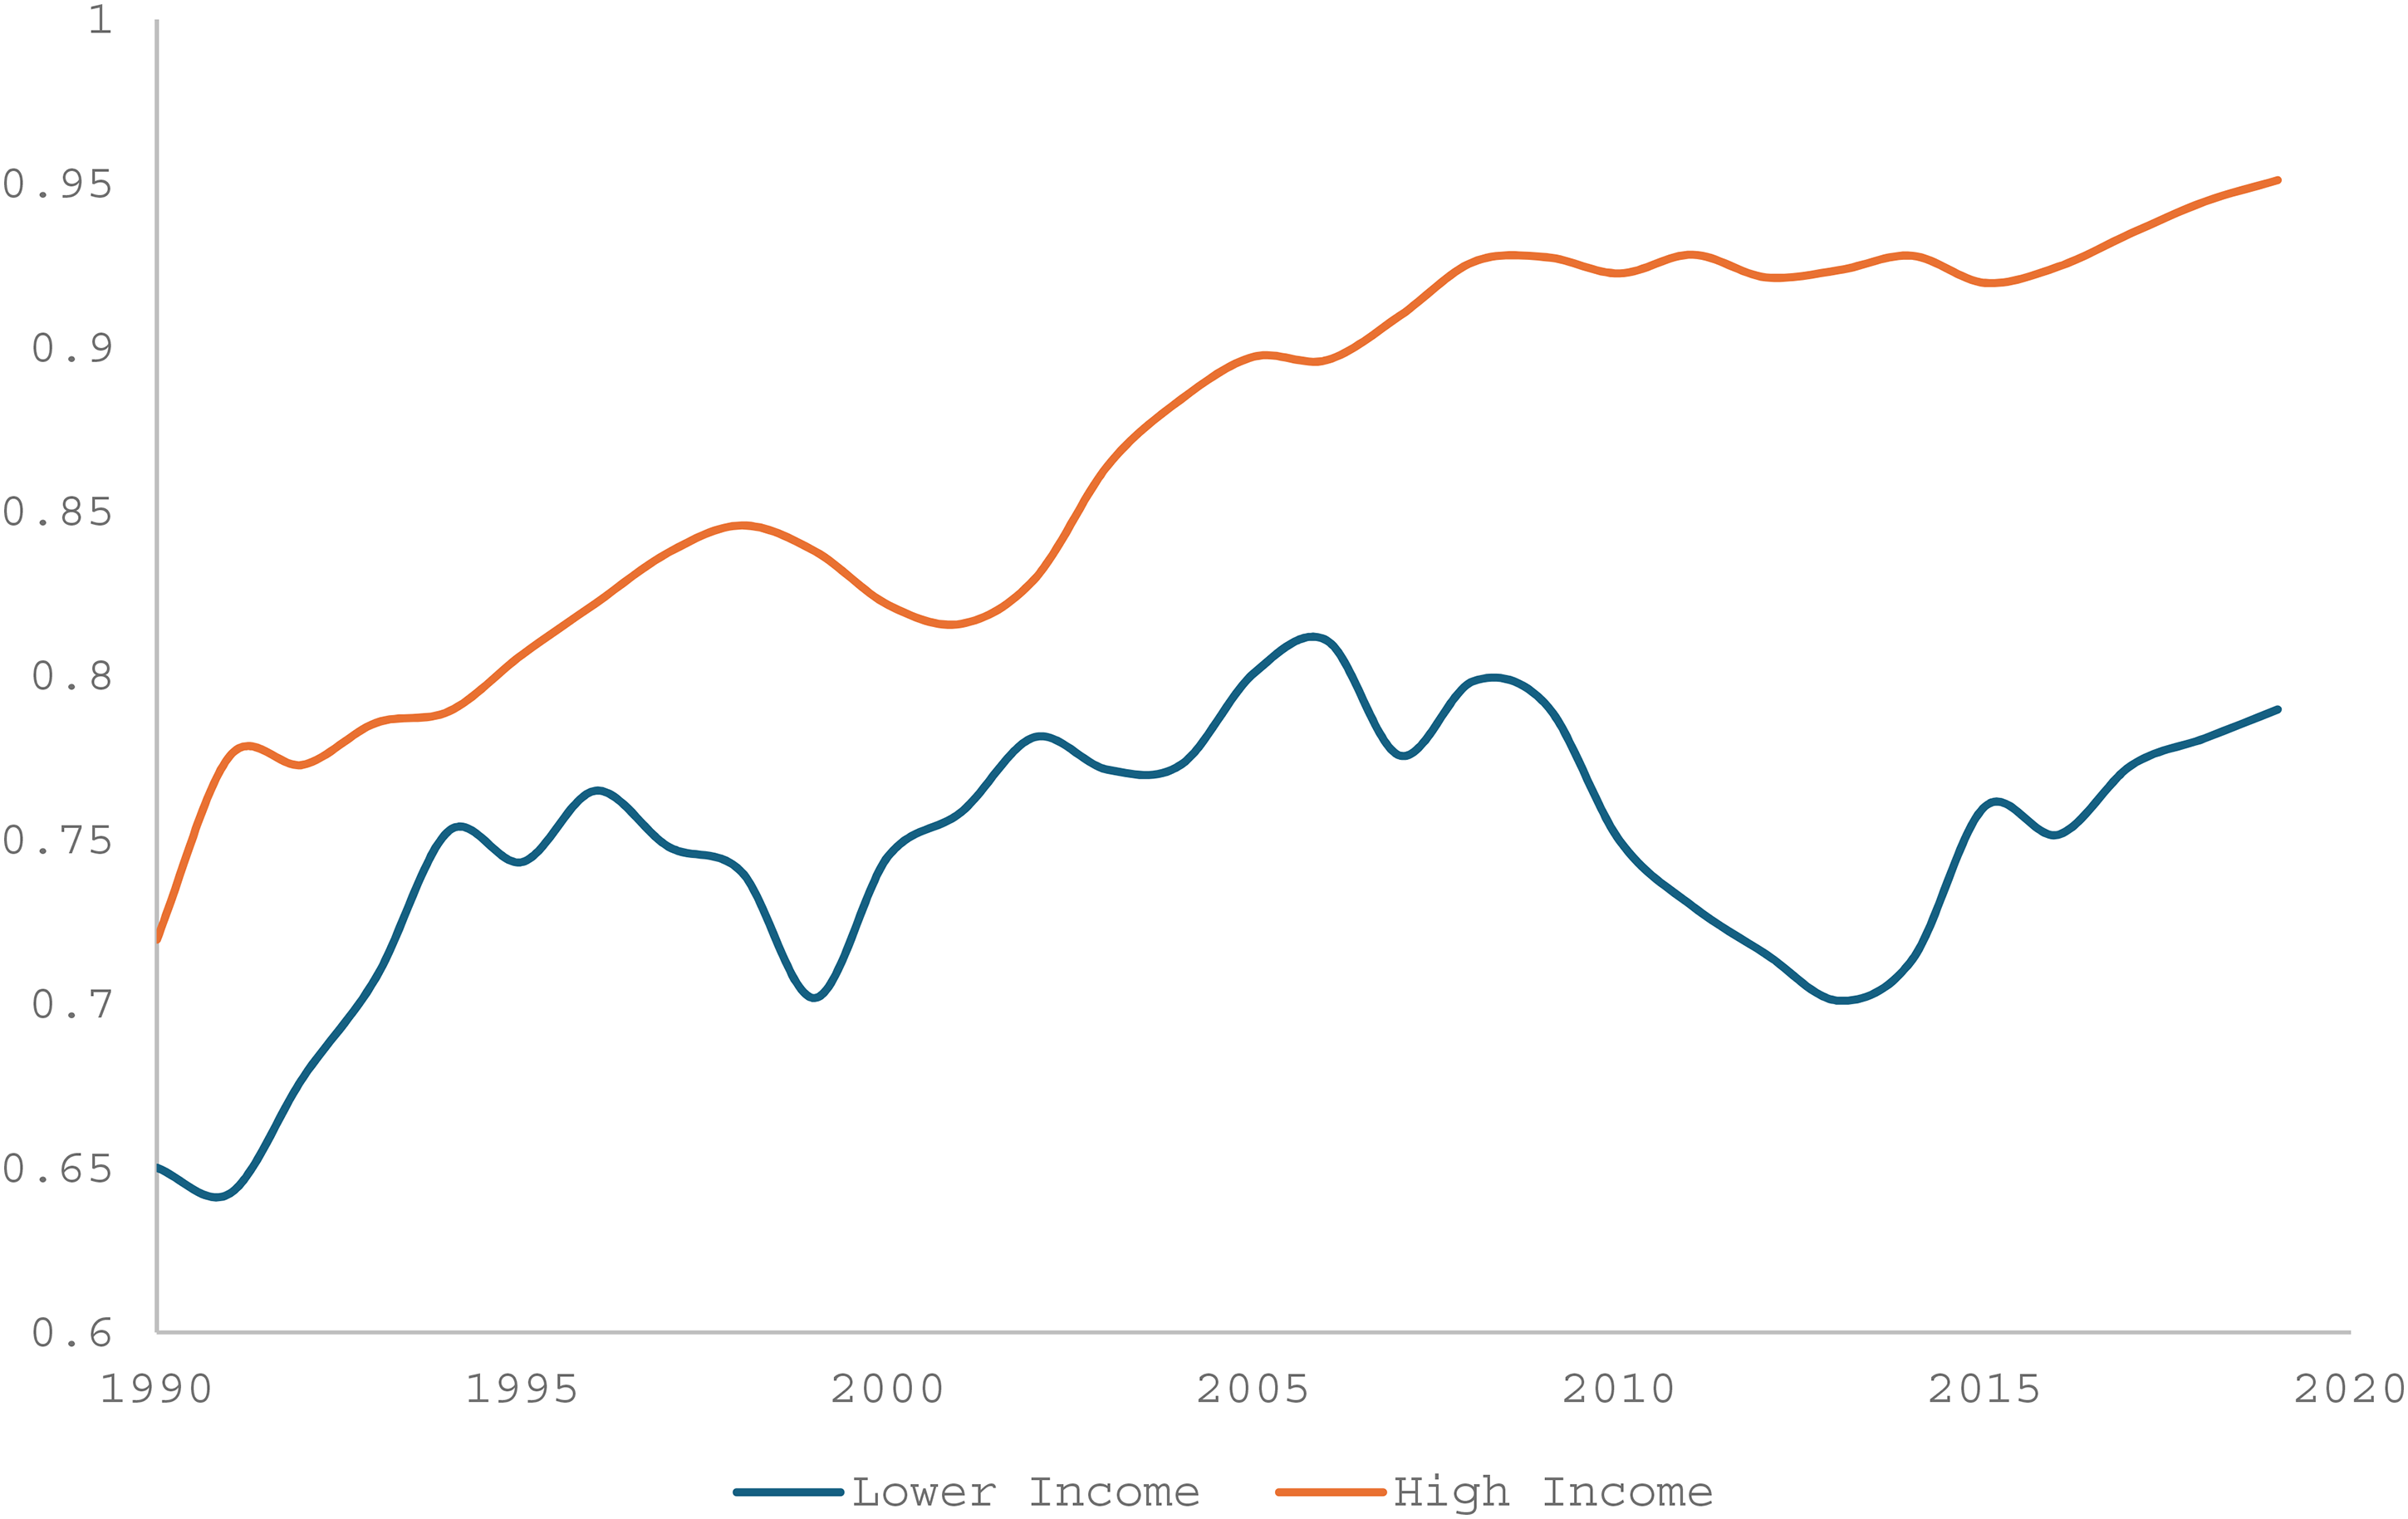
Temporal GTFEE performance of middle- and low-income countries.
Figure 6 depicts the energy-saving potential for middle- and low-income countries, calculated by multiplying the green total factor energy inefficiency ratings by the total energy consumption (measured in British thermal units). From the figure, in the 1990s, middle-income countries exhibited higher energy-saving potential than low-income countries. However, since the early 1990s, this potential has declined, likely due to improved environmental awareness and technology adoption. In contrast, low-income countries had lower energy-saving potential until 1998, after which it increased rapidly, peaking around 2013–2015. This increase may likely be driven by growing energy consumption and higher inefficiency levels. By 2020, both income groups converged at similar levels of energy-saving potentials. This convergence suggest that future energy policies sustain efficiency in high-income countries while prioritizing targeted efficiency investiment in lower-income groups.
Temporal energy-saving potential for middle- and low-income countries.
Conclusion and policy recommendations
Conclusions
EE is essential for sustainable development, yet African countries, facing some of the world's most severe energy challenges, remain understudied. Although previous research identifies technology, human capital, and institutional quality as key drivers of EE, their specific impacts in Africa have received limited attention. This study examines the effects of technology transfer, human capital, and institutional quality on GTFEE across 33 African countries from 1990 to 2020, combining these variables into a unified framework for more accurate estimates. It also provides a comprehensive measure of GTFEE by accounting for negative environmental externalities such as CO2 emissions and other wastes. Furthermore, by addressing economic development disparities, the study mitigates heterogeneity bias to deliver precise, context-relevant estimates of GTFEE. Key findings include:
The effect of technology on GTFEE in Africa becomes insignificant once human capital and institutional quality are included in the model. Progressive addition of these variables to the inefficiency equation showed that technology's significance decreased until it became statistically insignificant when all three variables were included. Technology improves GTFEE in middle-income countries but may increase inefficiencies in low-income countries. Human capital and institutional quality are key drivers of GTFEE across both income groups, highlighting their importance for GTFEE improvement in Africa. GTFEE performance varied widely among countries, from 0.59 to 0.95. South Africa (0.95), Egypt (0.93), and Morocco (0.90) perform best, while Mozambique (0.59), Rwanda (0.57), and Burundi (0.59) lag. GTFEE has generally increased over time, with high-income countries maintaining higher and more stable levels. Although energy-saving potential in high-income countries declined between 1990 and 2008, it rose in lower-income countries after 1998 converging by 2020.
Policy recommendations
Based on these findings, in the short term, the following policies can be adopted:
Governments should set clear EE targets and enforce standards for appliances, lighting, and building codes, supported by regulations and incentives. Promote public awareness campaigns, workshops, and training programs to encourage energy-efficient behaviors among individuals and businesses. Provide business incentives such as tax credits, subsidies, and grants for energy-efficient buildings and renovations to stimulate private sector involvement.
In the long-term, however, policy makers may:
Increase investments in renewable energy sources, including wind, solar, and hydropower, to enhance overall EE. Foster international cooperation where African governments collaborate on research, technology transfer, and sharing of best practices to accelerate EE improvements. Strengthen human capital development and institutional quality, as these are proven drivers of EE gains across Africa.
Future research
First, further research could benefit from employing time-series analysis to investigate the effect of technology, human capital, and institutions on EE in emerging African economies. This would provide valuable insights for policymakers to develop effective strategies to advance sustainable energy practices in these countries. Second, this study focused on transient EE; future work should distinguish between transient and persistent efficiency to deepen understanding of energy use dynamics. Finally, future research may explore in depth the specific mechanisms through which institutions, human capital, and technology influence EE.
Footnotes
Funding
The authors disclosed receipt of the following financial support for the research, authorship, and/or publication of this article: This research is supported by the National Natural Science Foundation of China (72350410488 and 72243009).
Declaration of conflicting interests
The authors declared no potential conflicts of interest with respect to the research, authorship, and/or publication of this article.