
Abstract
This article investigates the economic and technical feasibility of employing various photovoltaic (PV) tracking systems to electrify Western Pelee Island. The systems under consideration include horizontal-axis monthly adjustment (HMA), horizontal-axis continuous adjustment (HCA), vertical-axis continuous adjustment (VCA), and dual-axis tracker (DAT). The analysis includes a techno-economic assessment of these trackers, considering solar, bio, and diesel operation and two dispatch strategies: cycle charging (CC) and load following (LF). The results indicate that the optimal solution is a CC-controlled system equipped with a VCA tracker. The LF-controlled system with this tracker has a higher net present cost (NPC), cost of energy (COE), and renewable fraction by ∼$0.02 M, ∼$0.002/kWh, and 7.6%, respectively. NPC of HMA and COE of HVA-based systems with CC strategies are the most sensitive cases to SOCmin. In load variation, the largest and lowest decrease in COE, respectively, is observed in HVA and DA trackers controlled by CC dispatch strategy. In order for DA trackers to match the performance of VCA trackers, their costs must decrease by approximately 41% and 43% in CC and LF systems, respectively. The financial sensitivity of DA-based systems is higher due to albedo effects. This study provides valuable insights into optimizing PV tracking for the electrification of Western Pelee Island and enhances our understanding of the economic implications associated with dispatch strategies and tracking technologies in sustainable energy planning.
Introduction
With the global population continuing to grow and energy demand rising at an unprecedented rate, the need for sustainable development has become more urgent than ever. Accelerating industrialization, urbanization, and increasing consumption patterns have significantly heightened energy requirements. 1 However, the limited availability of fossil fuel reserves and the environmental damage caused by their extraction and use have underscored the necessity of transitioning to renewable energy sources. 2 The utilization of renewable energy is imperative to address the escalating global demand for energy and the associated rise in emissions. 3 Solar energy, propelled by economies of scale, has demonstrated notable progress and maturity in power generation within the realm of renewable energy alternatives 4 and solar photovoltaic (PV) systems stand out as one of the most rapidly expanding solar energy technologies on a global scale recently. 5
Although photovoltaic (PV) technology has proven its cost competitiveness, refining solar energy extraction methods remains an ongoing process. Various approaches have been incorporated into PV systems to enhance the efficiency of harnessing energy from solar photovoltaic panels. 6 One effective method to improve the efficiency of solar panels is to use solar tracking techniques that monitor the sun's path throughout the day. This ensures that the solar collector is correctly oriented during daylight hours. 7 Optimizing the movement of PV trackers is crucial to improving energy production, making it a top priority. Figure 1 shows how the panel aligns with the sun. The angle between the horizontal plane and the surface of the solar module is called the tilt angle, which is typically southward in the northern hemisphere. The horizontal offset from the surface to the south direction is known as the azimuth angle. Ground reflectance, also called albedo (not shown in Figure 1), refers to the ratio of reflected radiation to the total incident radiation on the ground. Ground albedo varies throughout the day and depends on surface material, sun position, cloud cover, snow, and vegetation. Albedo radiation affects the spectral distribution of incident radiation on solar modules, which in turn affects the performance of the PV system. 8
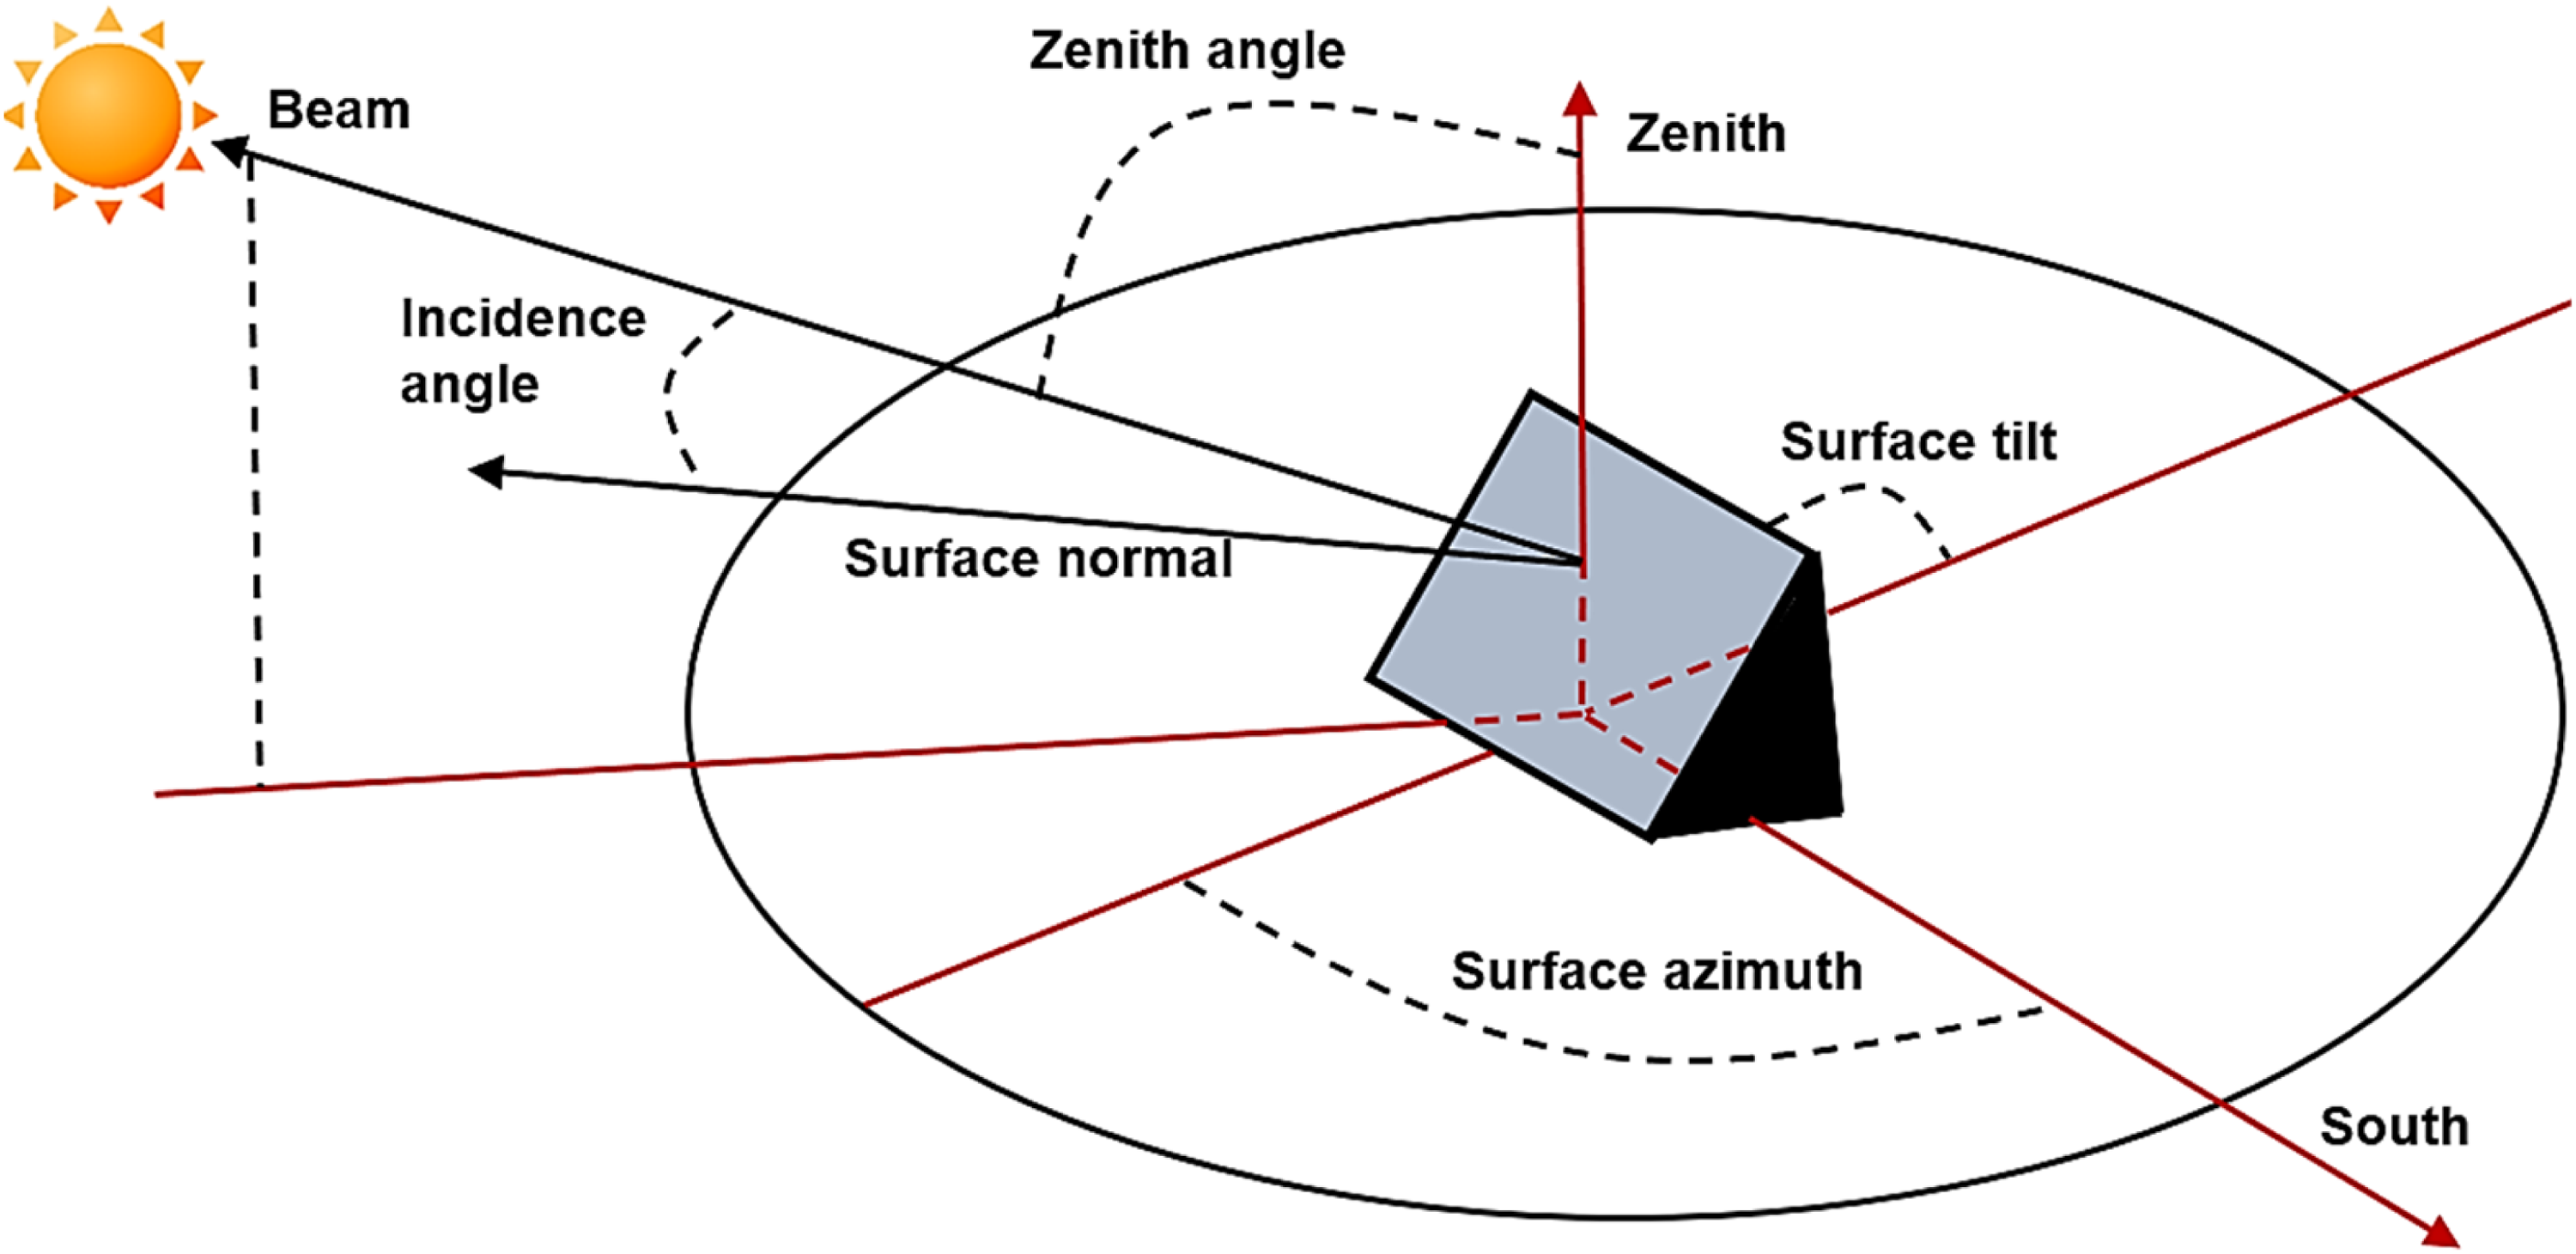
Illustration of solar and PV module characteristic angles.
PV systems are limited by intermittent availability and higher associated costs, such as COE and NPC. These challenges can be addressed through two primary strategies: the integration of energy storage systems to balance supply and demand fluctuations, and the incorporation of supplementary energy sources such as diesel generators, biogas systems, or centralized grids. Hybrid energy systems offer a comprehensive solution by reducing COE and NPC, enhancing grid flexibility, minimizing distribution losses, and increasing the share of renewable energy in the overall supply mix. 9 Additionally, the integration of BG and DG into such systems reduces operational hours, fuel consumption, and associated expenses, thereby improving efficiency and supporting environmental sustainability. 10
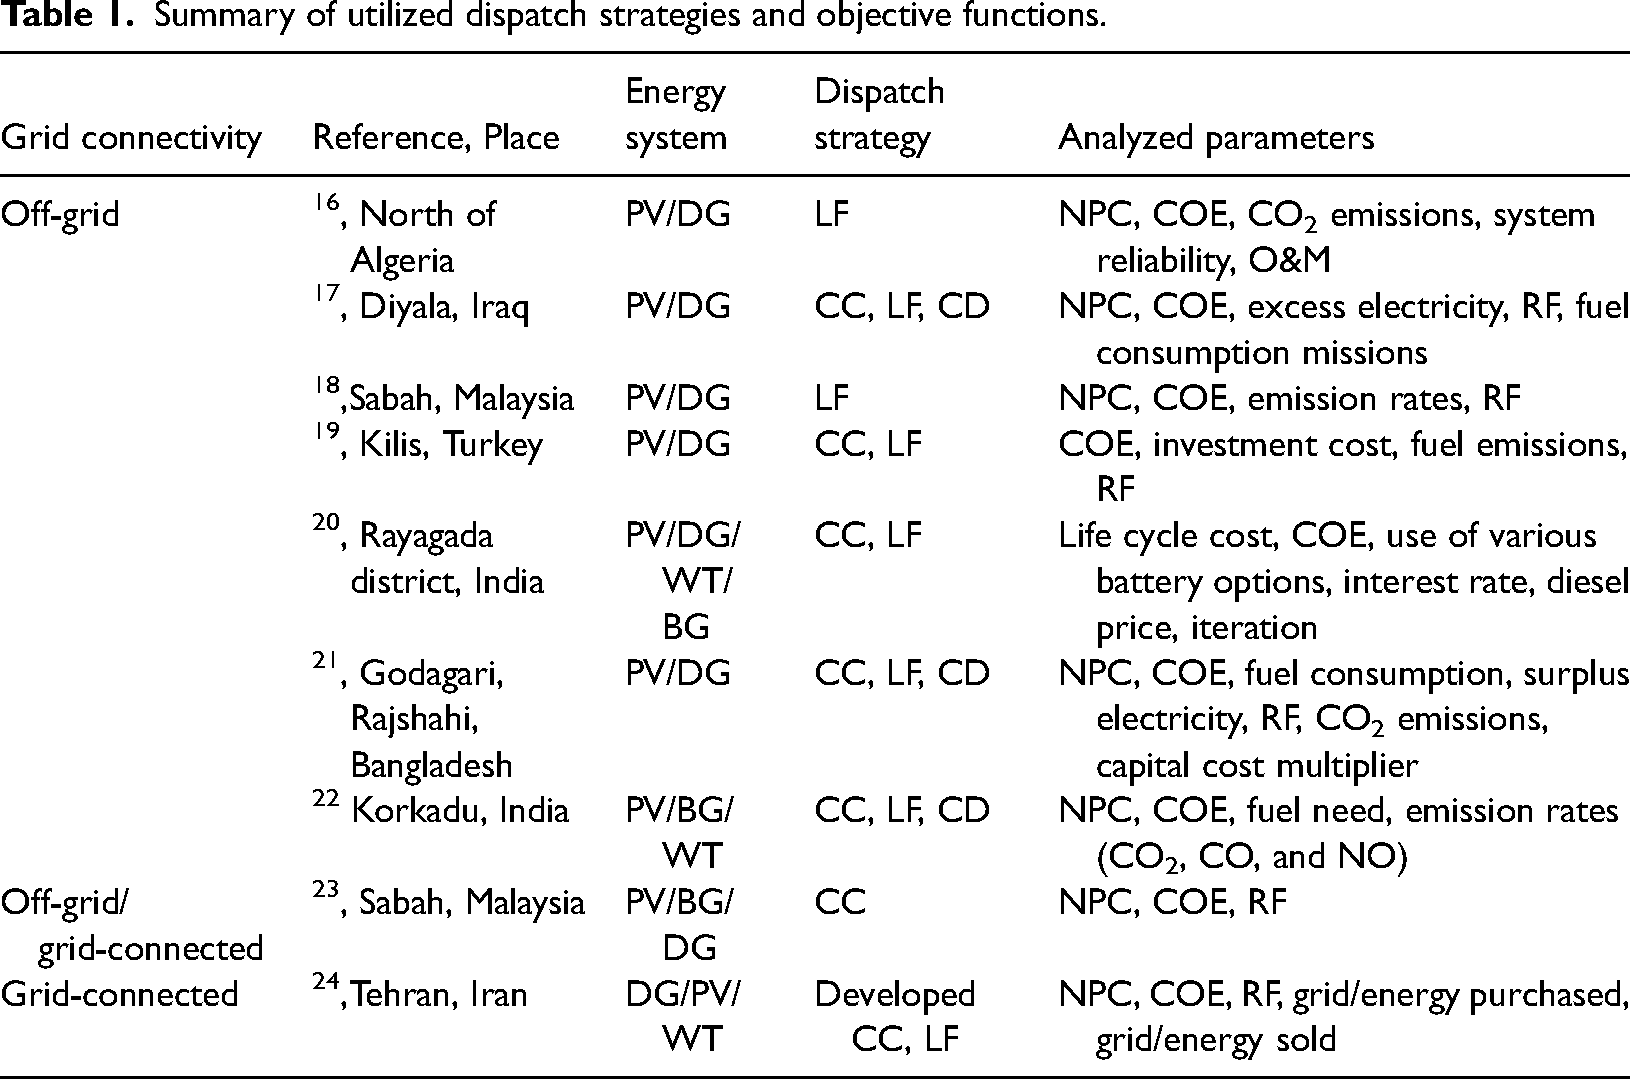
Design optimizations for HES begin at the component level but must maintain a holistic perspective. 11 Proper design and management of HES can enhance stability, reduce the cost of energy, and prevent equipment overload. Effective management is particularly crucial in grid-connected systems where energy is metered as it flows to and from the grid.12,13 Various renewable hybrid energy solutions require dispatch strategies based on economic and technical criteria. Dispatch strategies are control algorithms that manage battery units and DG/BG to satisfy a 24-h load with the available energy resources. The most common dispatch controllers to manage a system such as this are cycle charging (CC) and load following (LF). Under the CC dispatch strategy, the DG/BG works at its full-rated power to meet the required load, and any excess generation moves toward lower-priority purposes, such as charging the storage bank. On the other hand, under the LF dispatch strategy, DG/BG operates to generate only enough energy to satisfy the net load. Lower-priority purposes, including batteries, are left to be charged by renewable energy sources.14,15 Table 1 summarizes relevant studies using different optimization criteria to ascertain reliable and cost-effective solutions in various areas.
Summary of utilized dispatch strategies and objective functions.
Electrification roadmaps in remote or energy-poor localities that feature renewable sources are classified into four categories: optimization algorithm, 25 comparison procedures,26–28 design and planning, 29 and energy management strategies.30,31 Koussa et al. 32 evaluated multiple tracking systems, assessing their technical performance across diverse climatic conditions. The results showed that dual-axis tracking technology performed better on clear days, while the various trackers performed similarly on overcast days. In Ref., 33 an investigation was carried out to determine the effect of solar tracking modules. The results showed that single-axis sun trackers have the potential to increase power generation by approximately 12%–25%. On the other hand, two-axis systems could lead to a significant rise in power output, ranging from 30% to 45%. In Ref., 34 a comprehensive techno-feasibility evaluation was carried out across eight Iranian cities to assess various tracking modules. Among these modules, the dual-tracking system emerged as the most efficient, augmenting power generation by an average of 32% compared to the no-tracking scenario. Additionally, the vertical tracking device demonstrated cost-effectiveness, as it increased power output by an average of 23% while only elevating the levelized cost of electricity (LCOE) by a modest 1.6%. In Ref., 35 an investigation was carried out to assess the performance of vertical-axis tracker technology under varying solar irradiation conditions. The study revealed that in regions with ample irradiation, the PV output experienced a remarkable increase of approximately 28%, while in areas with limited irradiation, the boost in PV output was still significant, reaching approximately 16%. In Ref., 36 a study was conducted to assess the life cycle of fixed and single-axis trackers, and it was observed that the tracking system exhibited superior performance across various environmental variables. In contrast to the fixed system, the single-axis tracking module displayed a higher potential for CO2 mitigation, ranging from 3.4 to 14.5 tonnes/kW. In Ref., 37 an assessment was conducted to evaluate the economic feasibility of a large-scale solar facility on Iran's southern coast. The study found that the vertical axis tracker had the highest performance, resulting in a COE range of $103 to $117.3/MWh. Additionally, an optimized 5 MW capacity system was projected to reduce CO2 emissions by approximately 5259 tonnes annually when compared to natural gas power plants. Ref. 37 conducted a simulation to evaluate the performance of hybrid solar systems in the southern coastal region of Iran. The study compared fixed-tilt, single-axis, and dual-axis configurations and found that a PV system equipped with a single-axis tracking device was financially viable in all selected cities. The levelized COE for fixed-tilt, single-axis tracking, and dual-axis tracking modes of PV plants in these cities ranged from $112.3/MWh to $125.6/MWh, $103.0/MWh to $117.3/MWh, and $107.2/MWh to $122.5/MWh, respectively. In Ref., 38 grid-isolated PV systems employing various tracking configurations, including east–west continuous, north–south continuous, azimuth, and dual-axis continuous, were investigated across eight Nigerian cities. The study revealed that the annual energy gain achieved with dual-axis trackers ranged from 12.5% to 29.5% when compared to the optimal design using fixed PV arrays. Additionally, it was found that the most cost-effective levelized COE, amounting to 0.221, was associated with the east–west continuous tracker mode.
A review of the existing literature identifies several significant research gaps. Notably, there is a lack of investigations into the compatibility of photovoltaic (PV) tracking technologies with cycle charging (CC) and load following (LF) dispatch strategies. While dispatch strategies have been analyzed in grid-connected systems, their integration with various PV tracking systems remains unexplored. Additionally, critical factors such as ground reflectance (albedo), tracking cost multipliers, and minimum state of charge (SOCmin)—which significantly influence PV capacity, cost indicators, and renewable energy contributions—have received limited attention. Furthermore, the operational and maintenance schedules of generators and gasifiers within hybrid systems have not been sufficiently studied, leaving important questions about their long-term sustainability and efficiency unanswered.
This study explores hybrid systems integrating gasifiers and generators to enhance both reliability and environmental sustainability while incorporating a realistic maintenance program to improve the accuracy of cost estimations. As the first study to propose a grid-connected hybrid PV tracker-based renewable energy system for Pelee Island, it focuses on three primary objectives. First, it aims to develop reliable and cost-effective designs for a grid-integrated, hybrid PV tracker-based renewable energy system. Second, it evaluates the performance of the optimal system under cycle charging (CC) and load following (LF) dispatch strategies. Third, it conducts sensitivity analyses to assess the impacts of financial variables, such as capital cost multipliers, and technical factors, including SOCmin, load demand, and albedo, on the system's economic feasibility. The contributions of the present study are to:
Represent Pelee Island's electrical grid model with all peak, outage, and off-peak hours. Analyze the effects of the albedo, SOCmin, capital cost multiplier, and load growth on the profitability and sustainability of renewable solutions. Compare the present results with the relevant tracker-based feasibility analysis worldwide.
This study offers practical applications in designing and optimizing hybrid renewable energy systems. It presents a grid-connected hybrid PV tracker-based system as a sustainable, cost-effective solution for Pelee Island, improving reliability and environmental performance. The findings include a detailed model of the island's electrical grid and an analysis of key variables like SOCmin, albedo, and load growth to assess system profitability and sustainability.
Methods and materials
The cost analysis of this study is centered around fixed costs ($/h) and the marginal cost of energy ($/kWh). The software considers various options based on operational requirements and the minimum expense. The primary goal is to meet the required load and reserve at any cost. Figure 2 illustrates the methodology used to determine the optimal hybrid energy design. The software identifies feasible solutions that can satisfy the intended load based on the hourly renewable resources under the CC and LF dispatch strategies. The cost-effective and reliable components are then sorted based on their NPC. The combination with the lowest NPC is identified as the winning option. First, a sensitivity analysis will be conducted to evaluate the impact of financial variables such as the capital cost multiplier of trackers and technical characteristics such as SOCmin, load demand, and albedo on the economic feasibility of the winning solution. Then, the accuracy of the findings will be compared with other studies worldwide based on the NPC and the tracking systems that were determined to be the most effective.
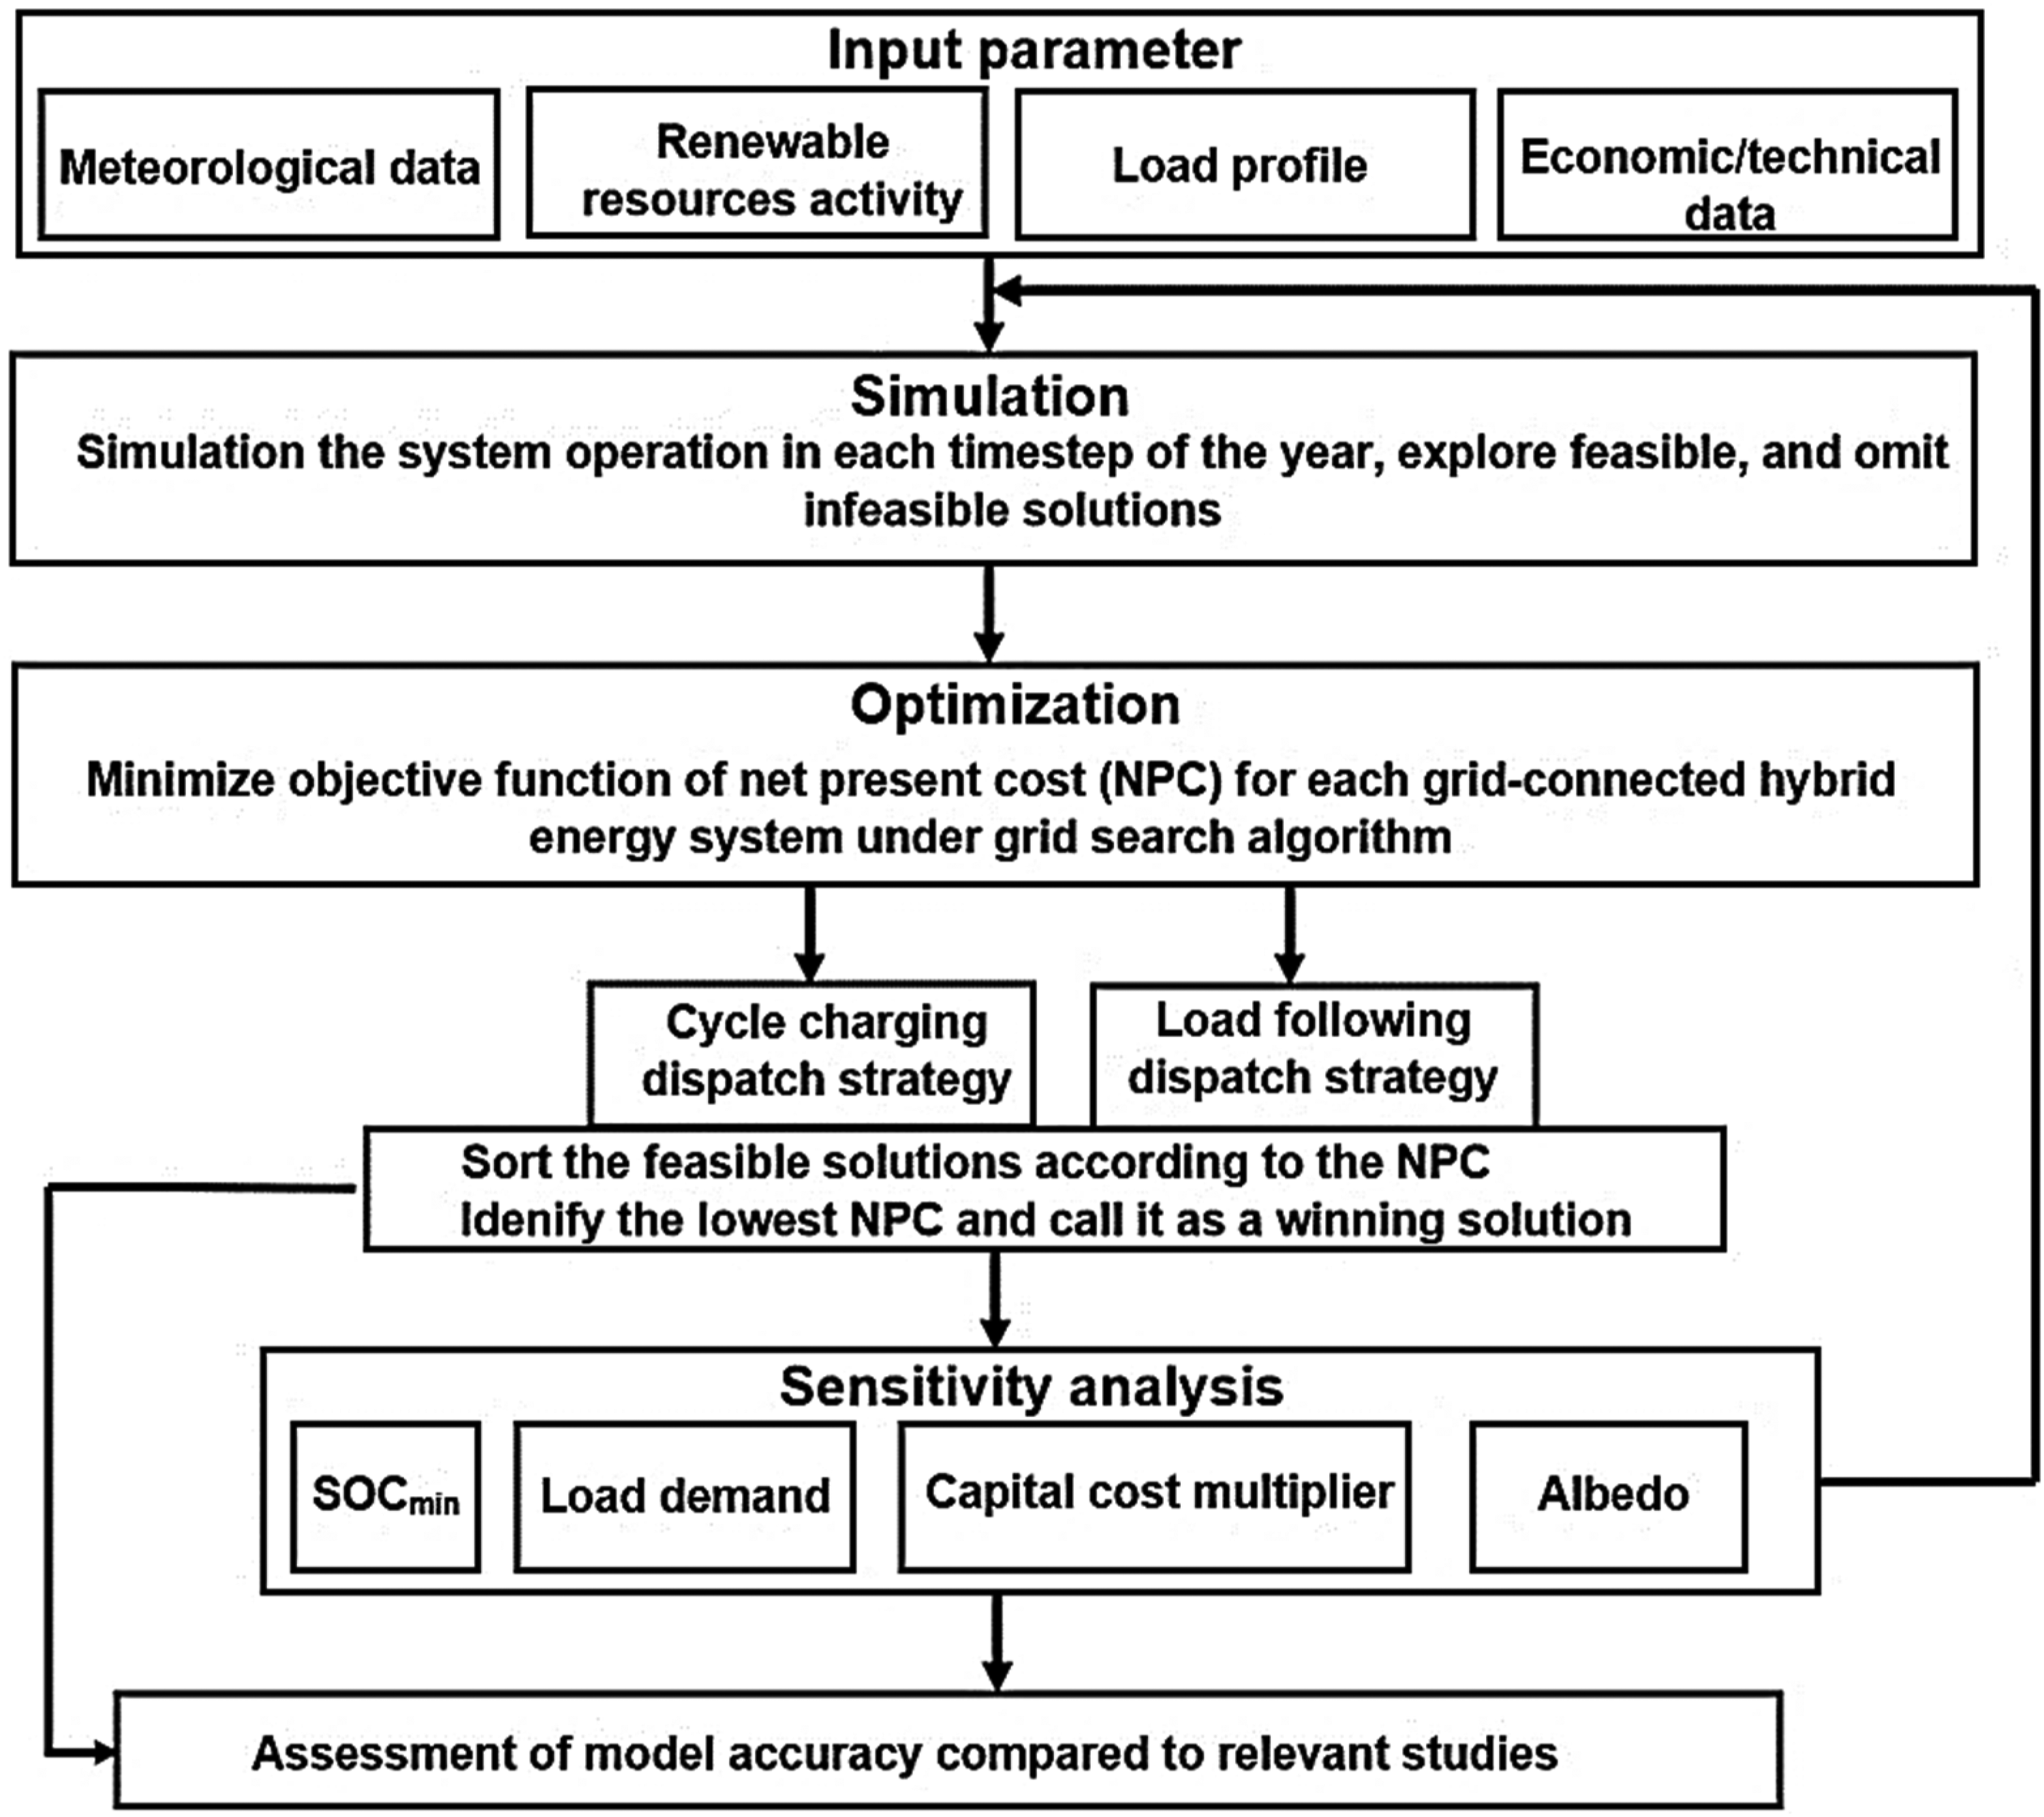
Flow chart of the main objectives of this study.
A dispatch control strategy outlines rules for generators, gasifiers, and storage battery operation when renewable energy is insufficient to meet the load requirement. 39 This article presents a comparative analysis of two dispatch control strategies—load following (LF) and cycle charging (CC)—for a hybrid solution that is connected to the grid. In an LF strategy, the central grid meets the load demand when other components are inadequate. 40 This article compares two dispatch control strategies—LF and CC—for a hybrid solution that is connected to the grid. The LF strategy utilizes the central grid to meet the load demand when other components of the hybrid solution are unable to provide sufficient power. 41 The system is designed to charge the battery only using the excess power generated by renewable energy sources and prevents the DG/BG from charging the battery. Thus, the DG/BG produces the power required only to meet the unmet load. LF dispatch strategy of the present analysis is displayed in Figure 3. In CC controlling system, the DG/BG is used to satisfy the electrical load at its maximum energy whenever the energy supplied by renewable resources and the stored energy is insufficient to meet the demand. Any surplus energy extracted from renewables is used to charge the storage units or sold to the central grid. The controlling algorithm of the CC-controlled system is shown in Figure 4.
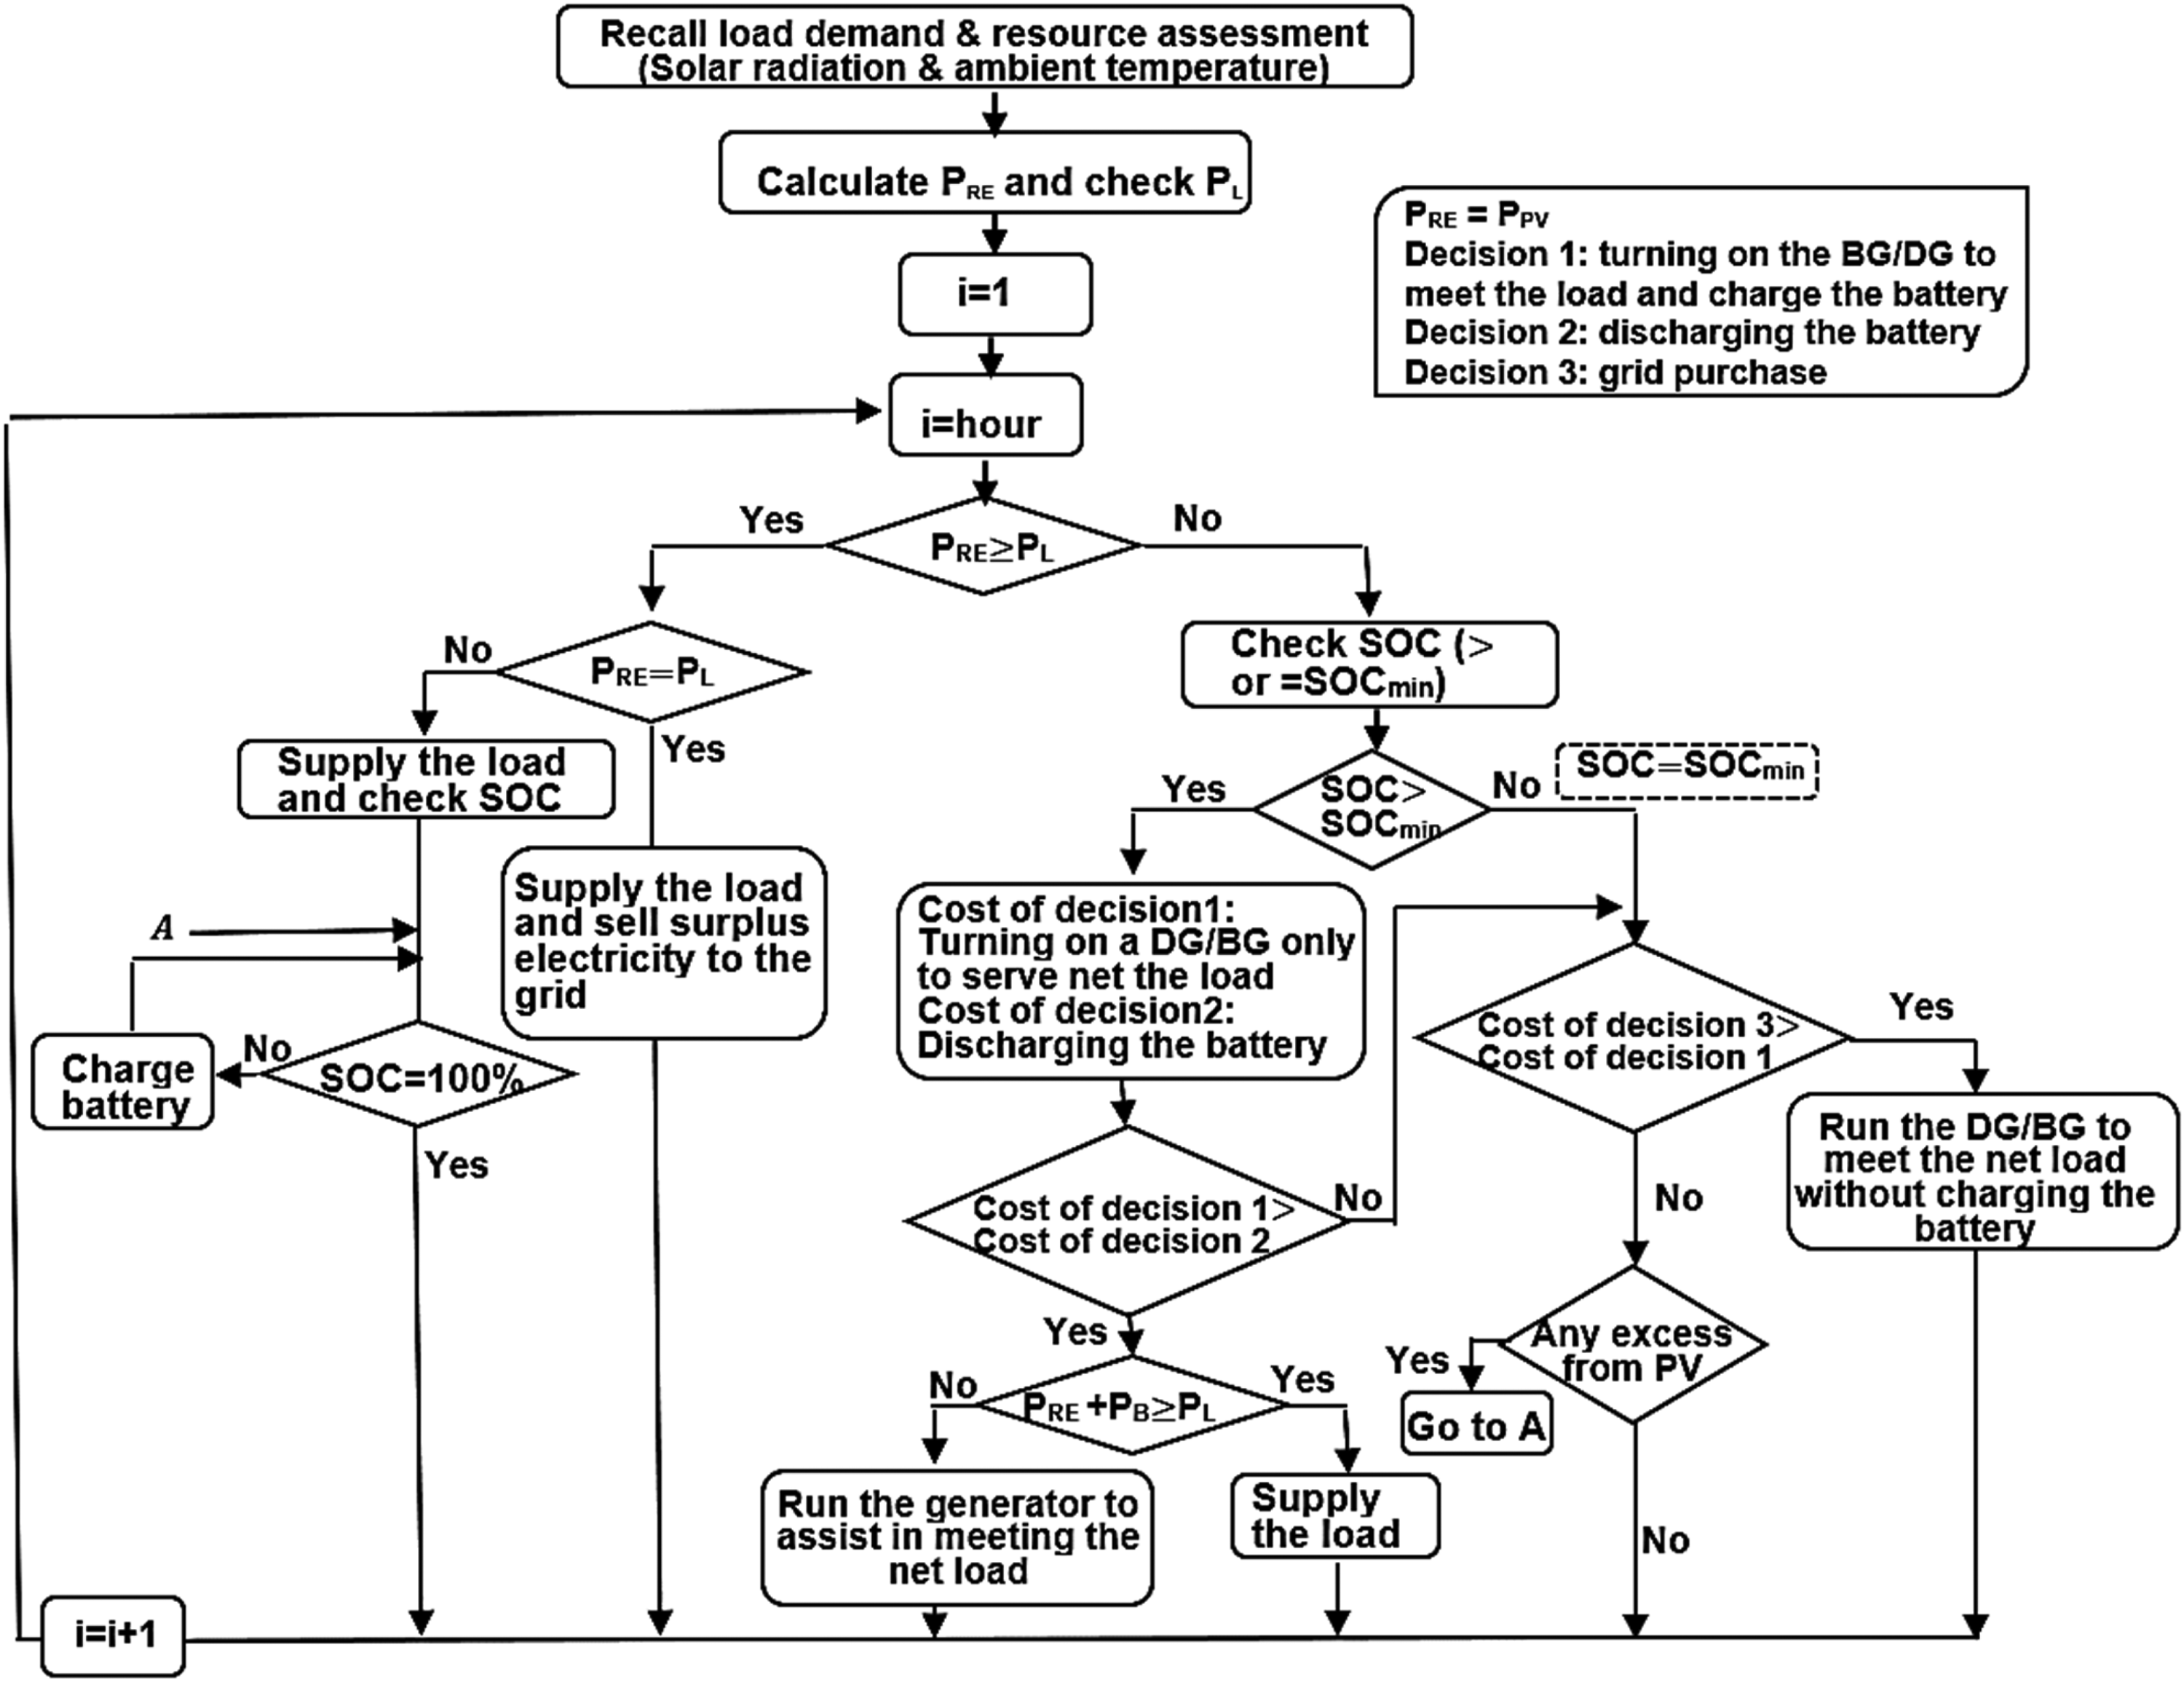
Load following (LF) algorithm of grid-connected DG/BG/PV/battery hybrid energy system.
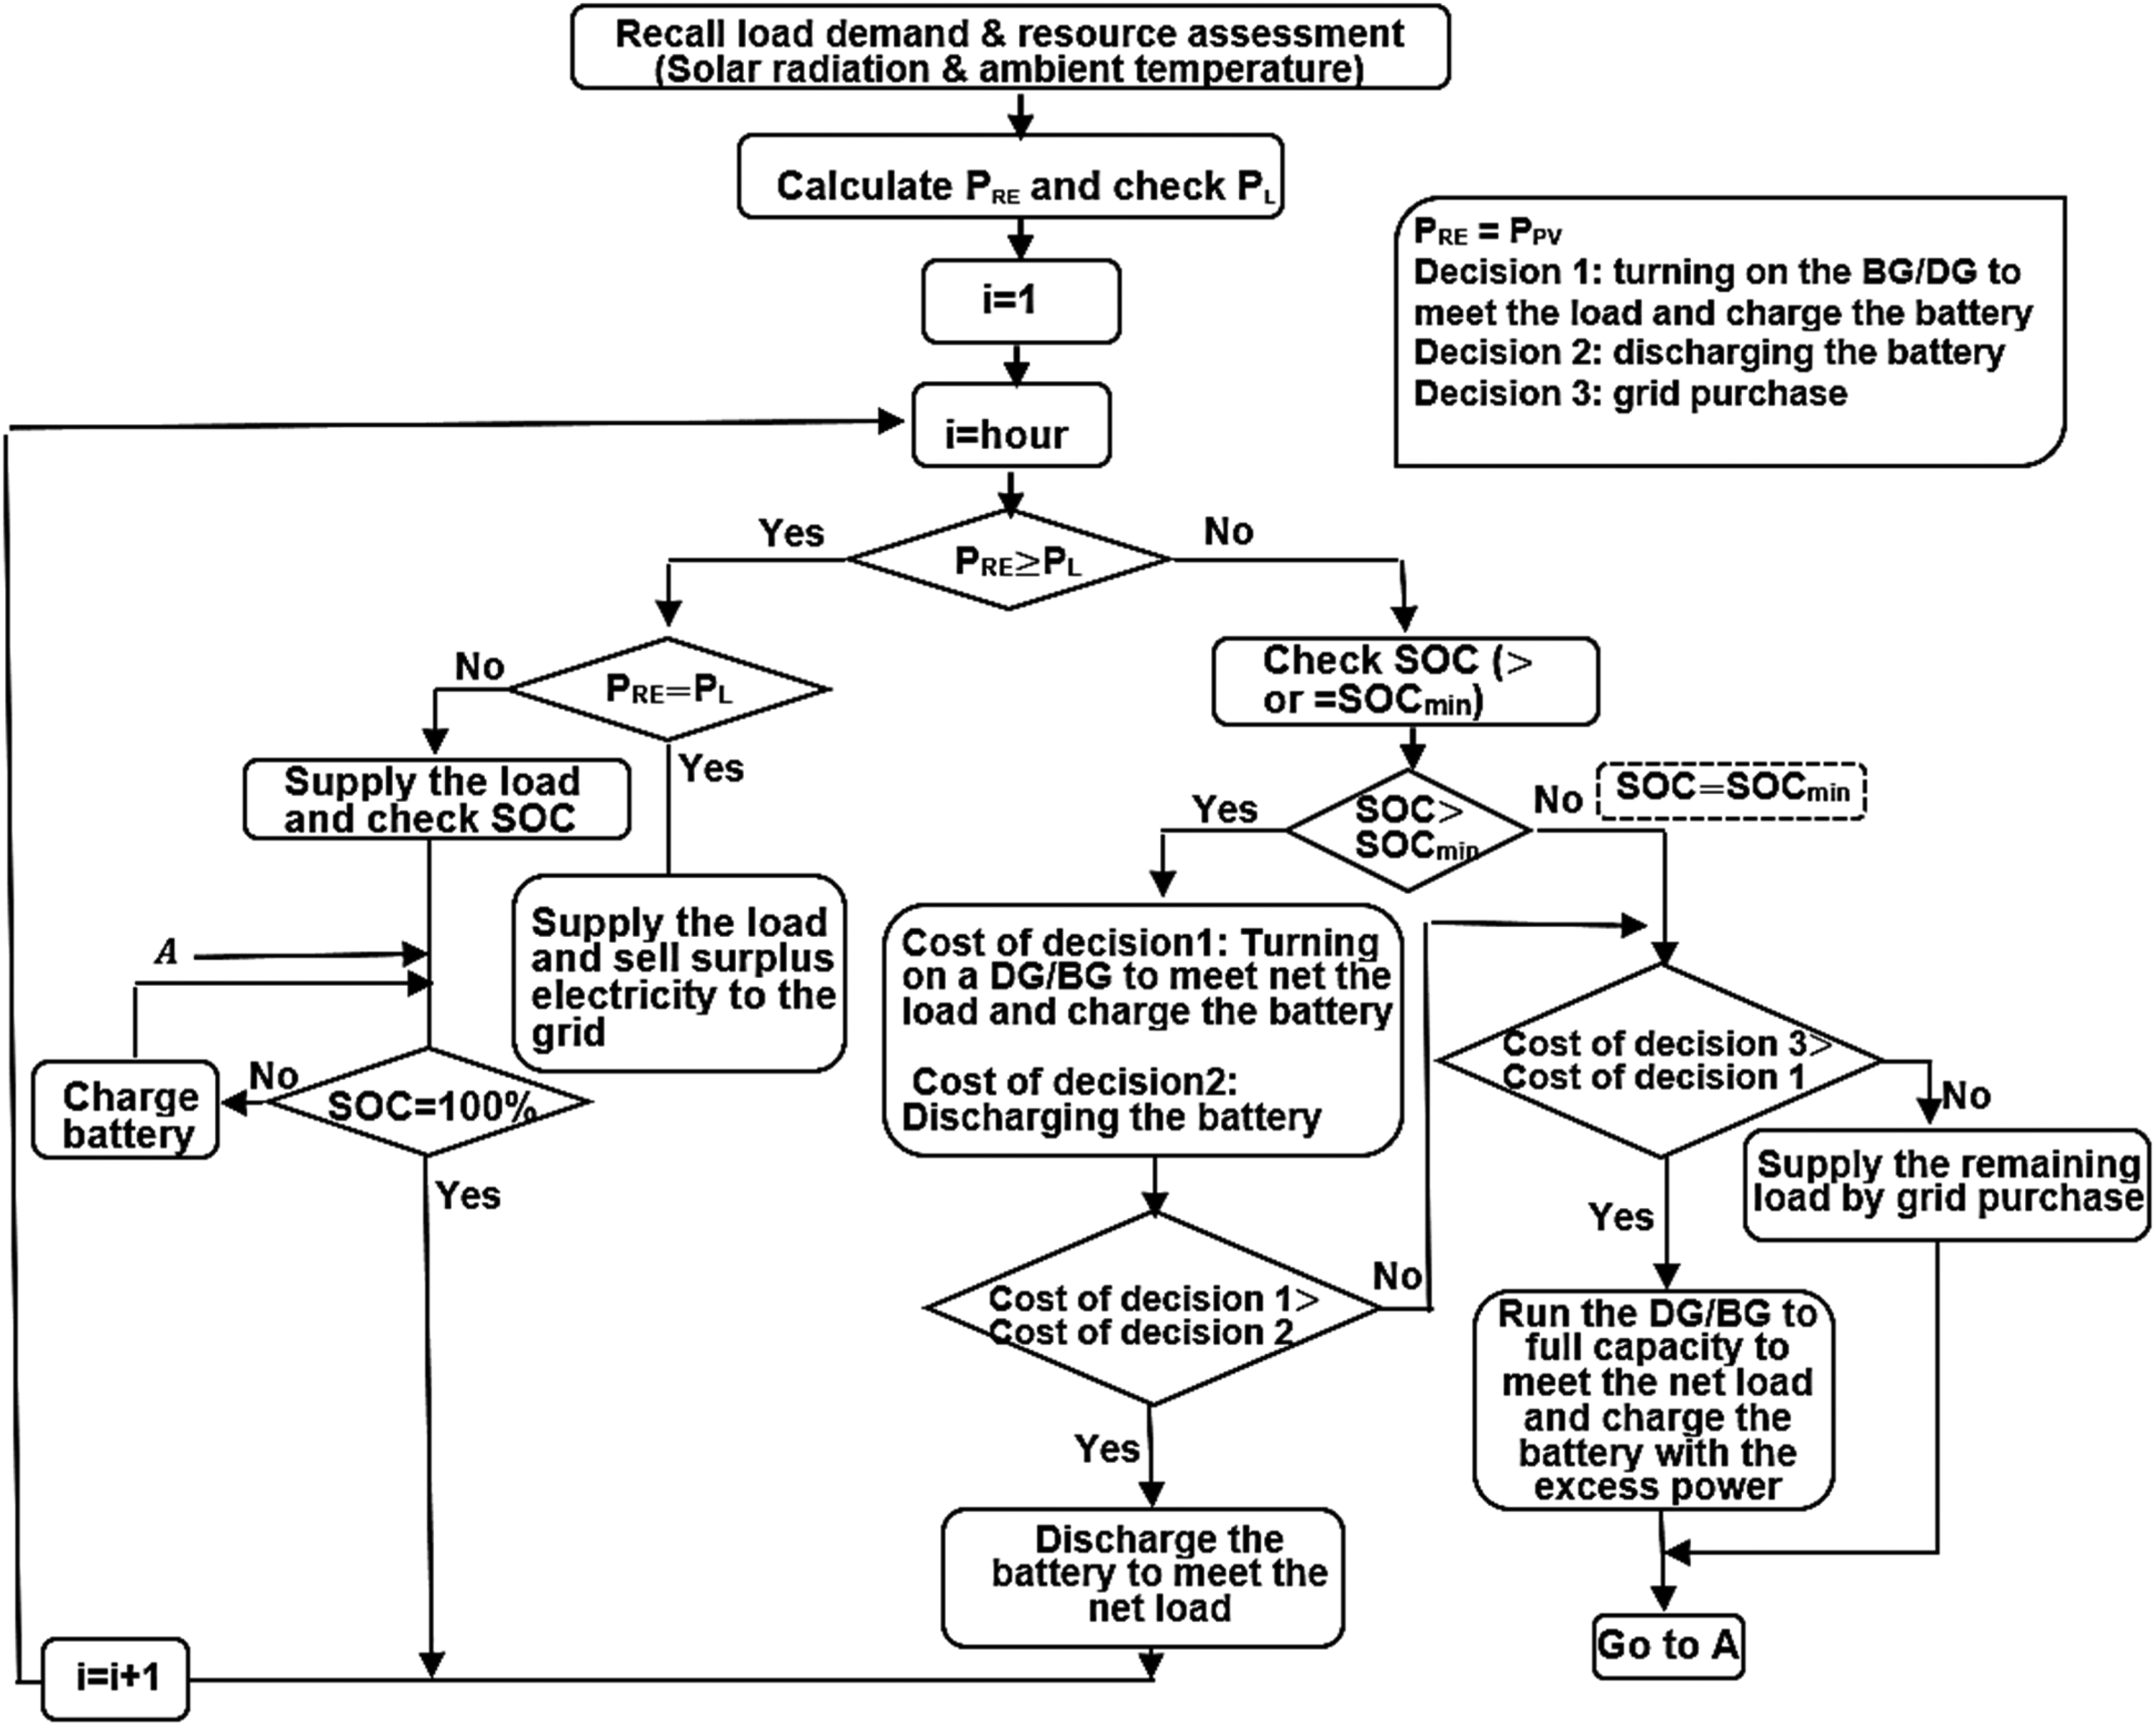
Cycle charging (CC) algorithm of grid-connected DG/BG/PV/battery hybrid energy system.
Area description
Description of the studied area
This study focuses on the western part of Pelee Island, located in Essex County, Ontario, Canada. The area is situated at coordinates 41.77° N and −82.65° W and covers around 11.2 square kilometers. The region has a population of about 300 permanent residents, but during peak tourist season, this number increases significantly to approximately 1500. 42 Pelee Island experiences an average temperature of around 10°C, with temperature fluctuations ranging from −3 °C to 22°C. The island benefits from the moderating effect of Lake Erie, resulting in a slightly milder climate and higher levels of solar radiation compared to the neighboring inland areas of Ontario. This unique geographical and climatic context highlights the importance of exploring renewable energy solutions to improve Pelee Island's energy resilience.
The residents of Pelee Island rely heavily on a 26-kilometer underwater cable to power their homes and businesses. Unfortunately, this cable is prone to failures, particularly during the high-demand tourist season. Additionally, the current cable only provides single-phase power to the island, despite the standard use of three-phase power in Canada's business and agricultural sectors. To address these challenges, a study explores the feasibility of implementing a reliable hybrid energy solution as an innovative alternative to upgrading the compromised underwater cable. The research focuses on the western side of Pelee Island, which hosts the essential loads that form the lifeline of this small community. 42 This study not only has significant value for Pelee Island but could also benefit similar small and remote communities worldwide that are seeking to enhance the resilience of their energy supply while addressing environmental concerns.
Electric load data
The electricity consumption on Pelee Island is mainly due to household appliances such as lighting, fans, televisions, refrigerators, washing machines, and other miscellaneous devices. Figure 5 shows the annual load profile. The total average daily load throughout the year is estimated at 2426 kWh. The day-to-day variation is 10%, and the time-step variation is 20%. During the summer months, when seasonal residents and tourists visit the island, the highest peak load is observed, reaching up to 400 kW. On the other hand, electricity consumption is at its lowest during the fall and winter seasons.
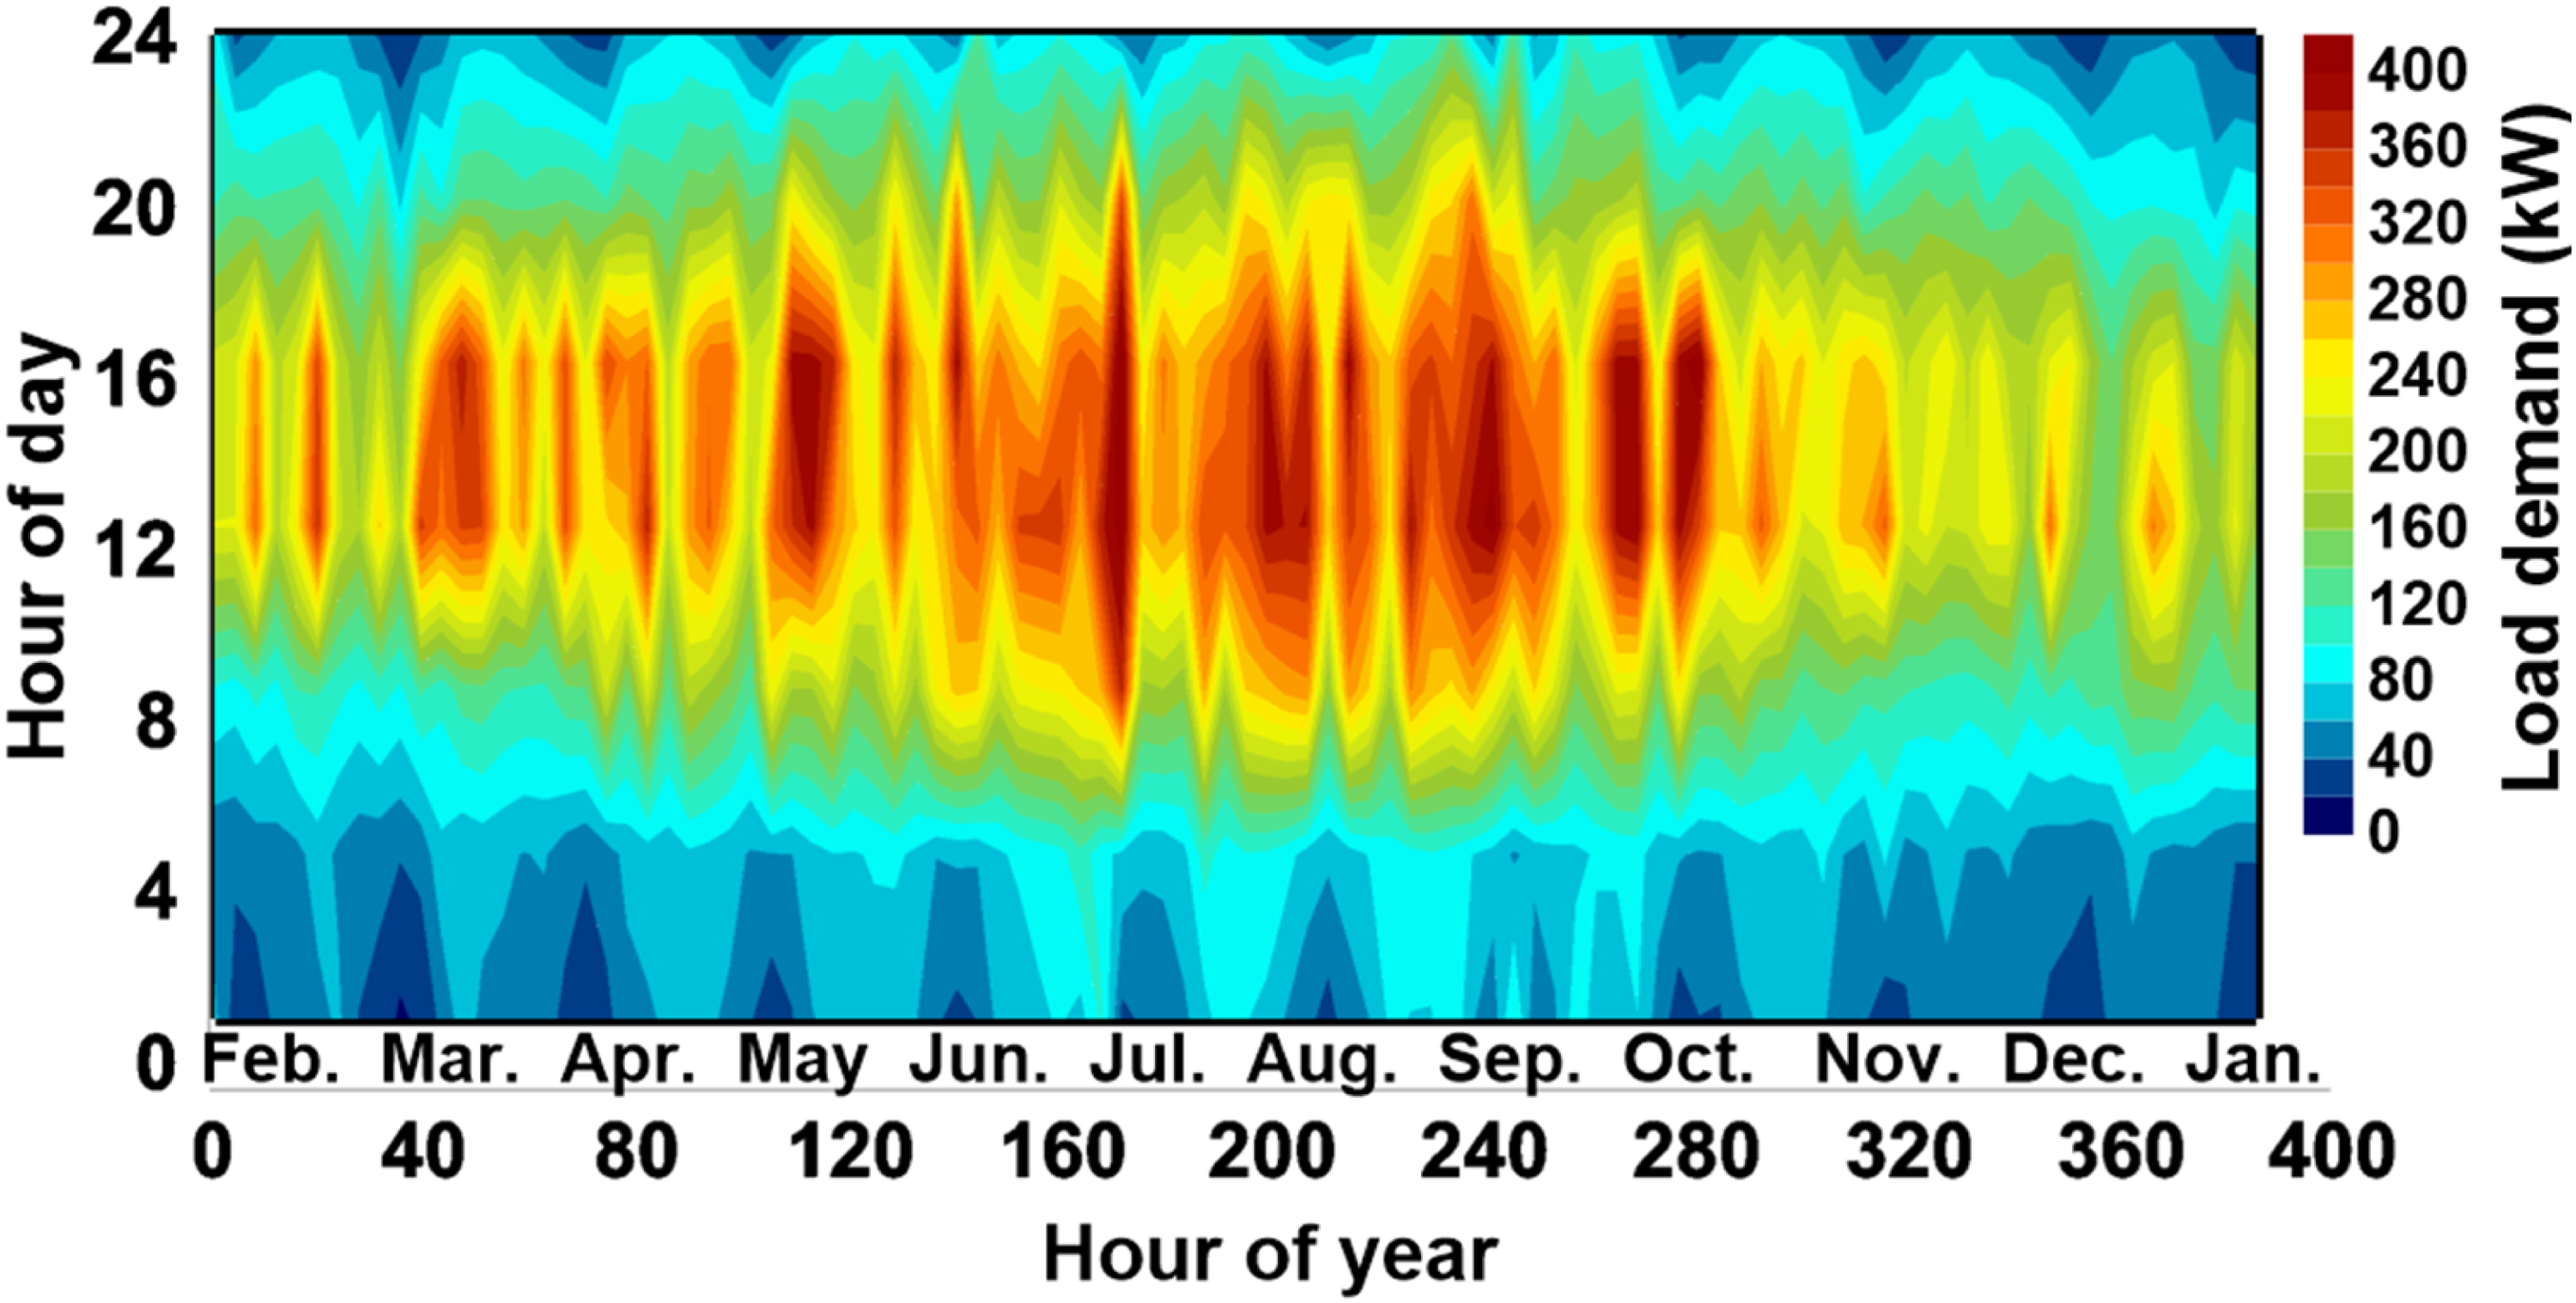
Electric load profile in Western Pelee Island.
Available renewable resources
Figures 6 and 7 underscore the significant seasonal variability of solar irradiance on Pelee Island and its implications for energy production. From May to August, average irradiance peaks between 5.28 and 6.01 kWh/m²/day, with July recording the highest value of 6.01 kWh/m²/day, demonstrating strong solar energy potential during summer. In contrast, from November to January, irradiance levels decline sharply, ranging between 1.44 and 1.8 kWh/m²/day, with December reaching the lowest value of 1.44 kWh/m²/day. Figure 7 further reveals that irradiance below 0.05 kWh/m²/day dominates, occurring approximately 55% of the time annually, while values below 3 kWh/m²/day are observed over 70% of the year. Such variability necessitates the integration of supplementary energy sources and efficient storage systems to complement solar PV, ensuring consistent energy availability during low-irradiance periods and maximizing utilization during peak solar months.
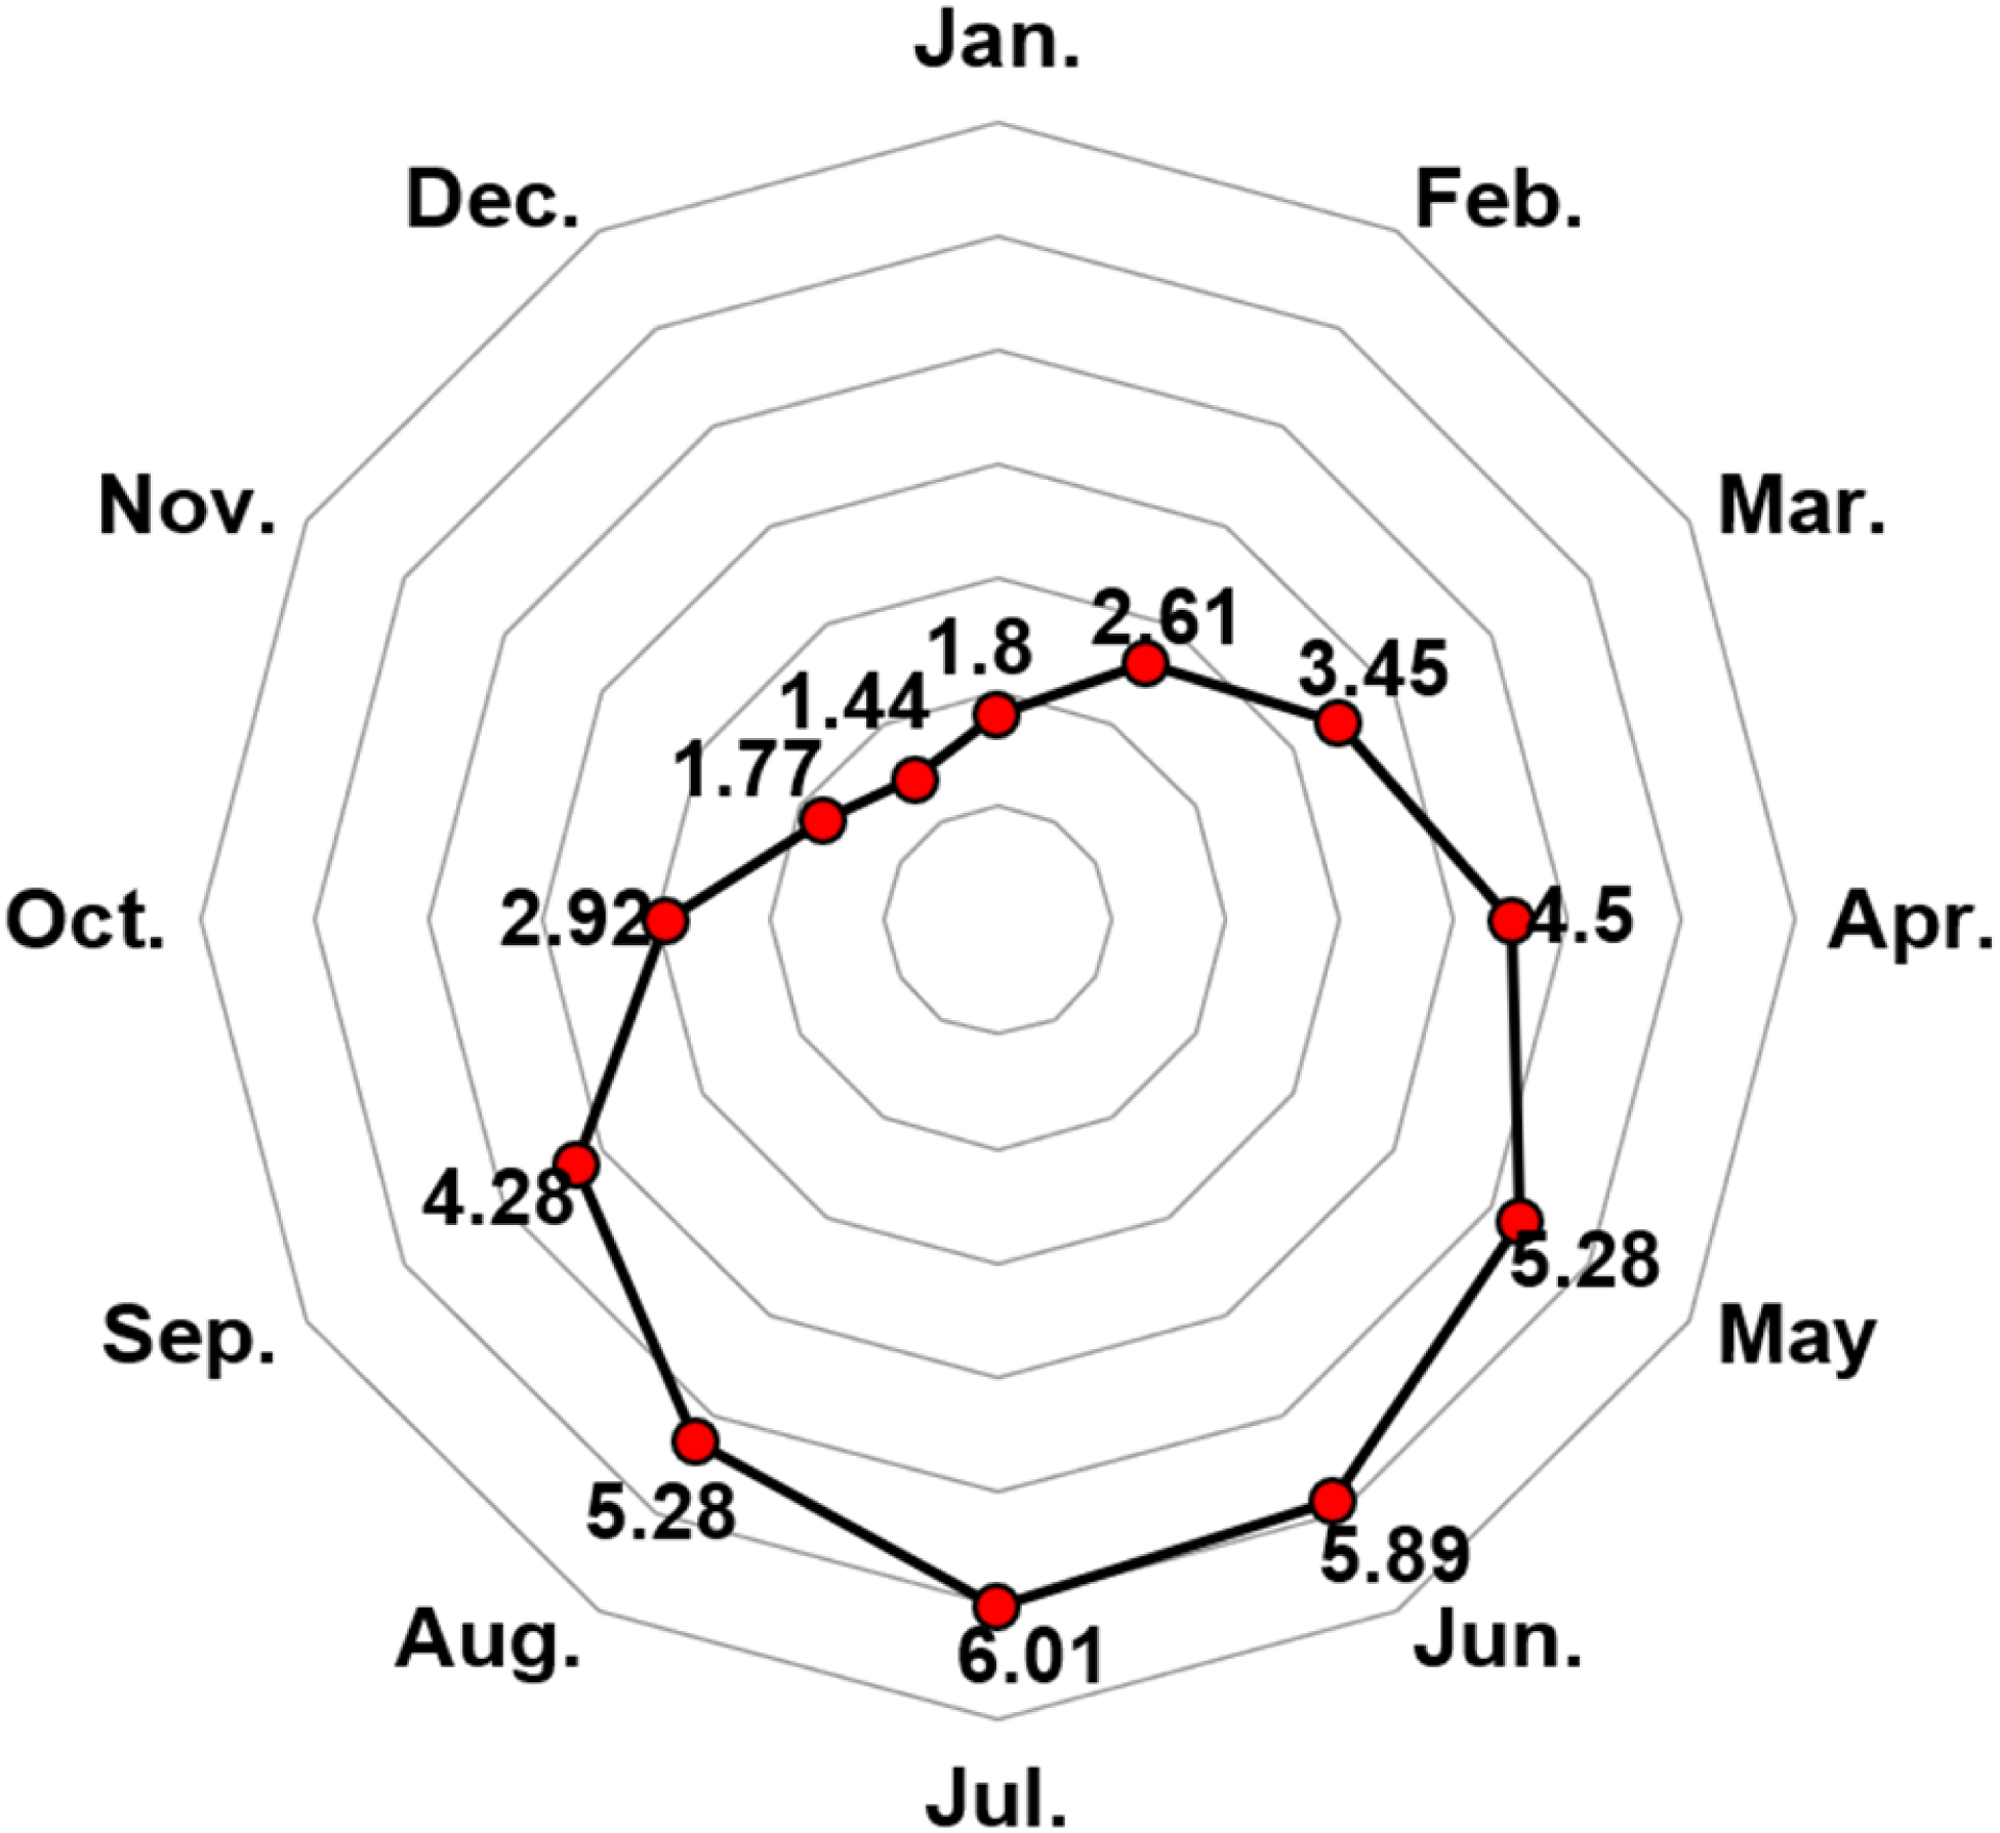
Profile of monthly solar irradiance in Western Pelee Island.
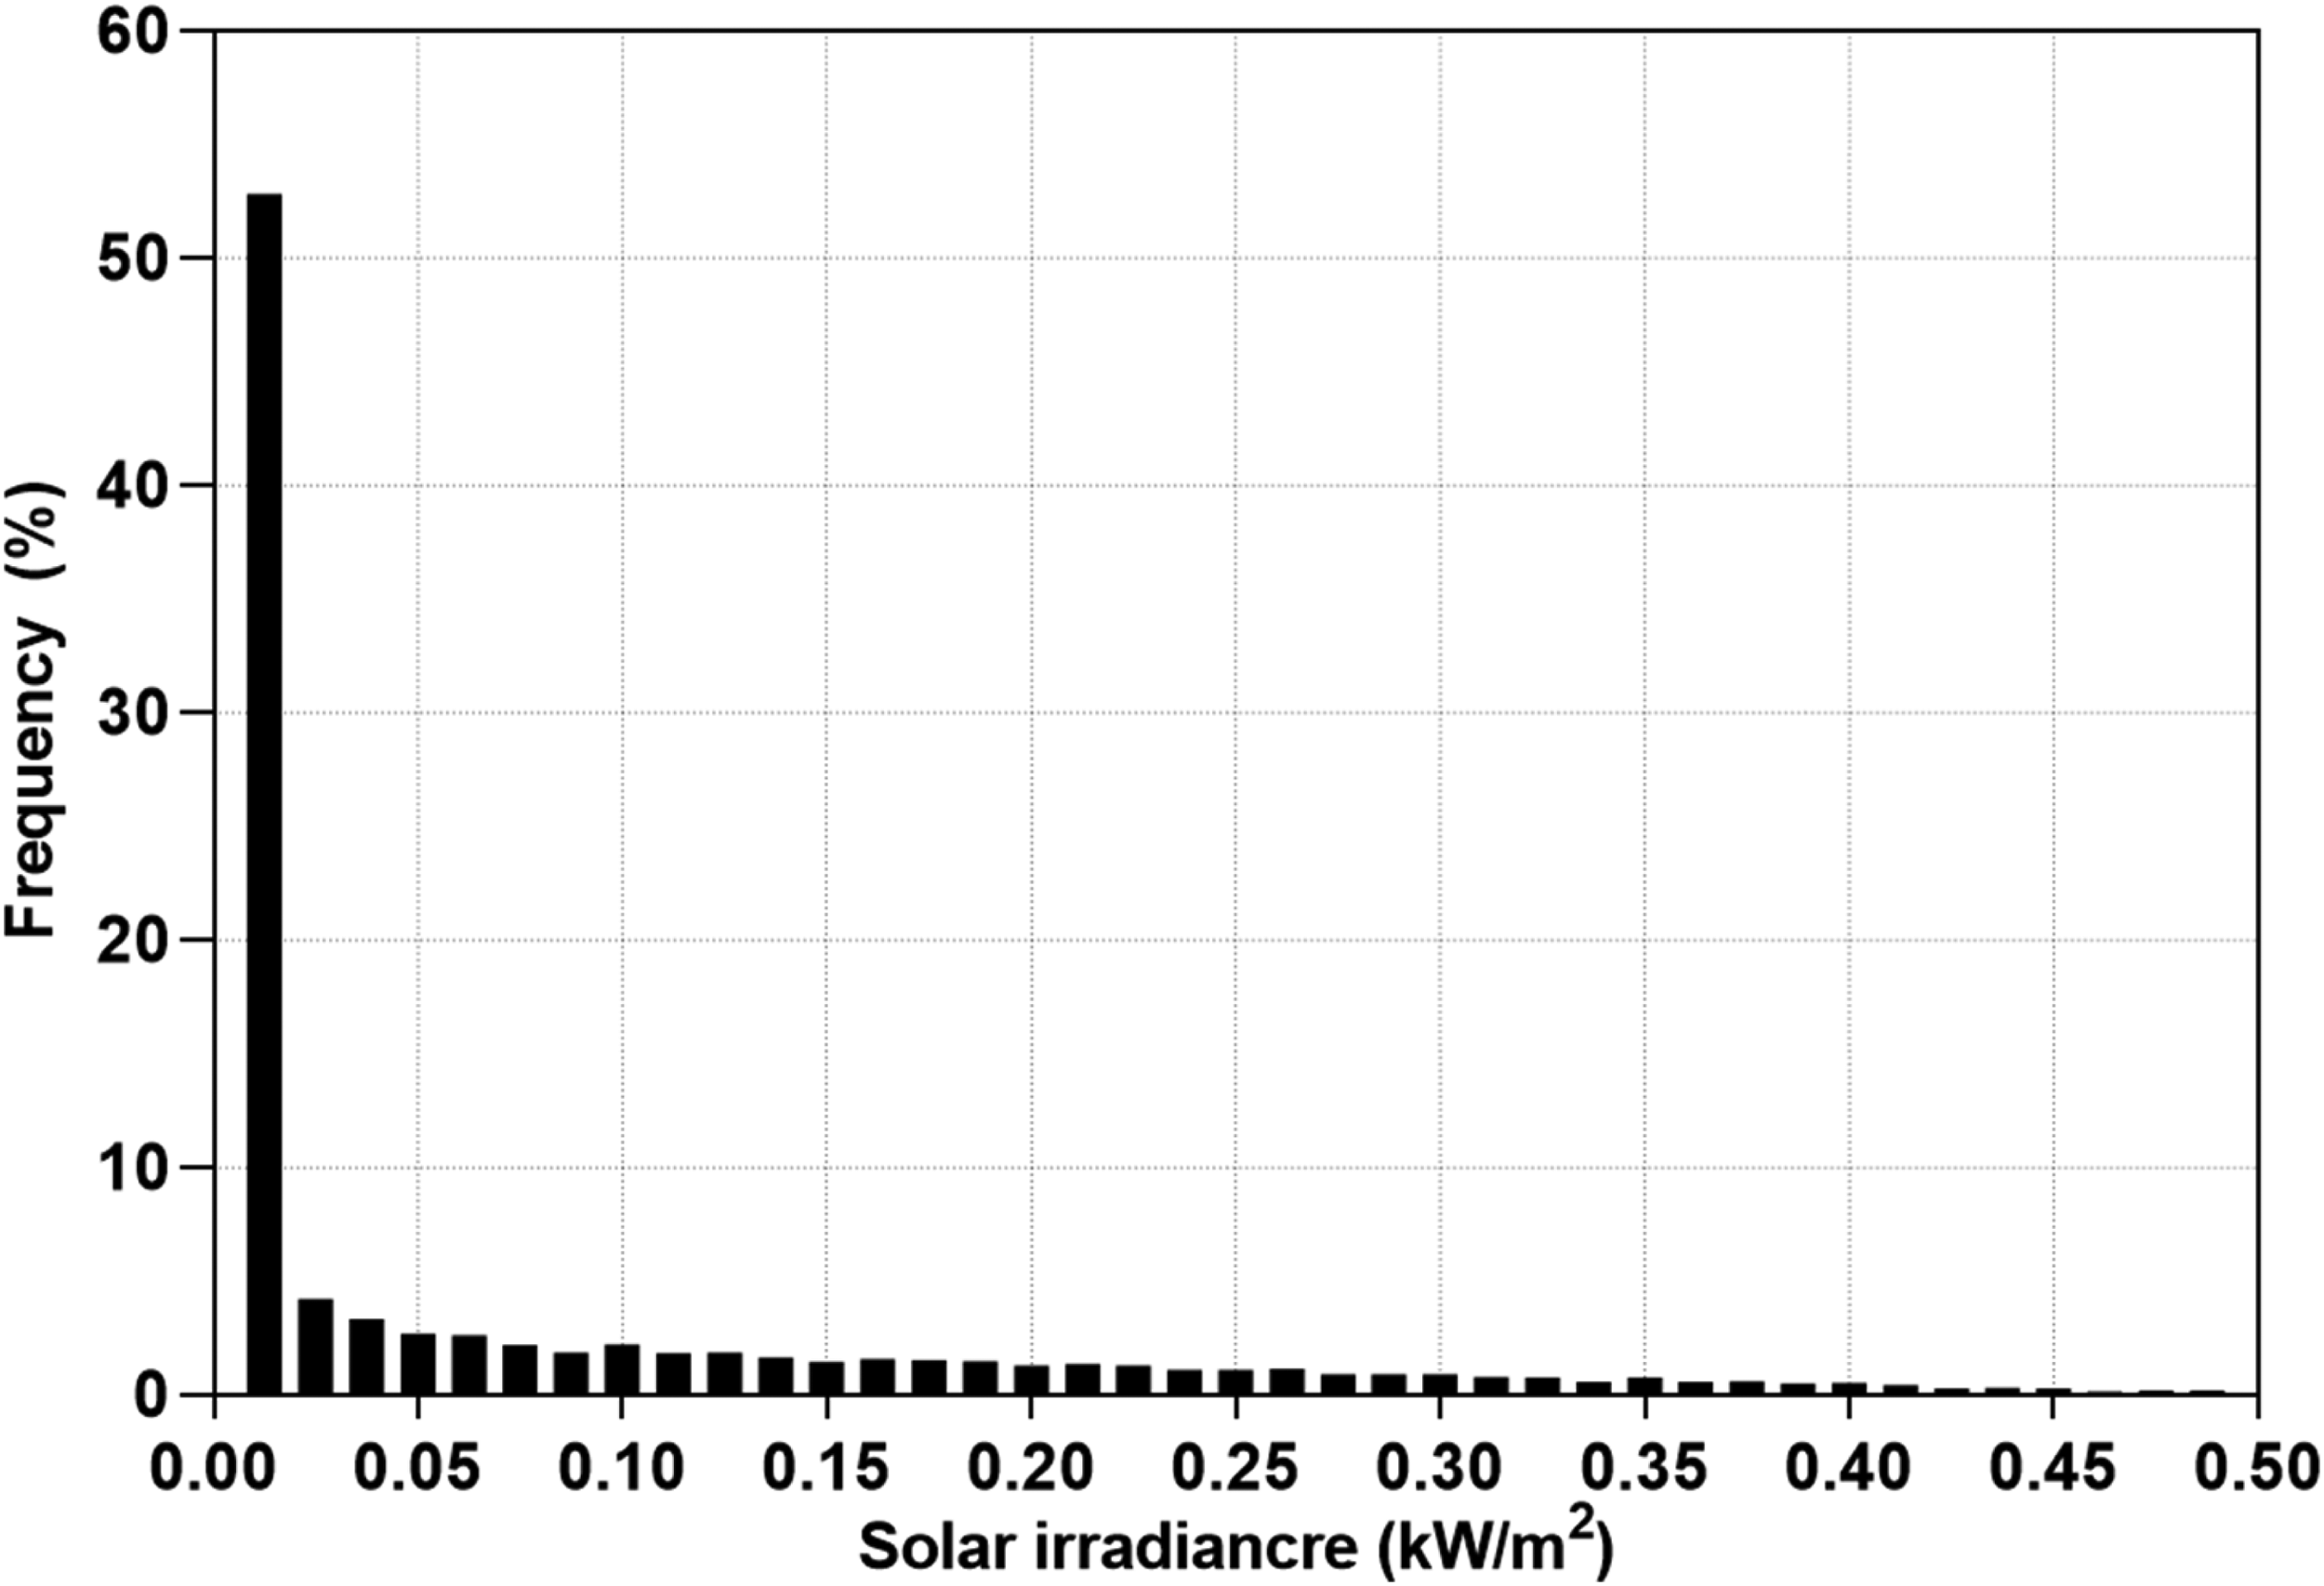
Frequency of average solar irradiance in Western Pelee Island.
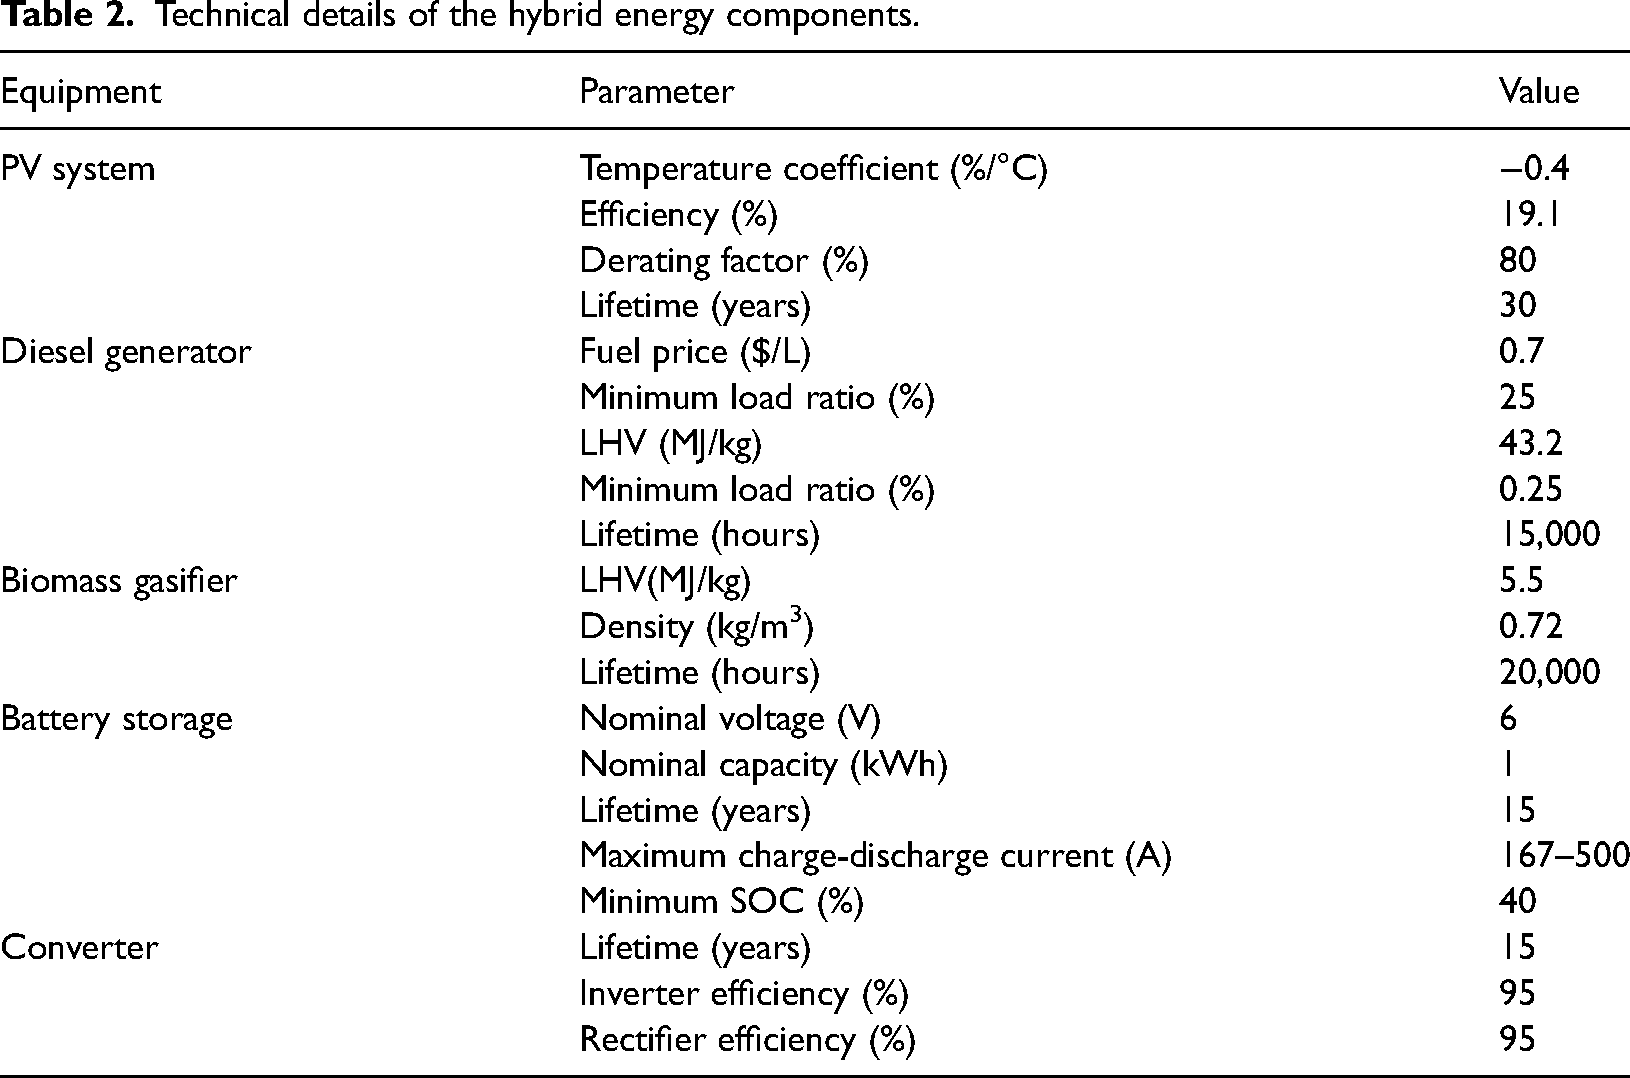
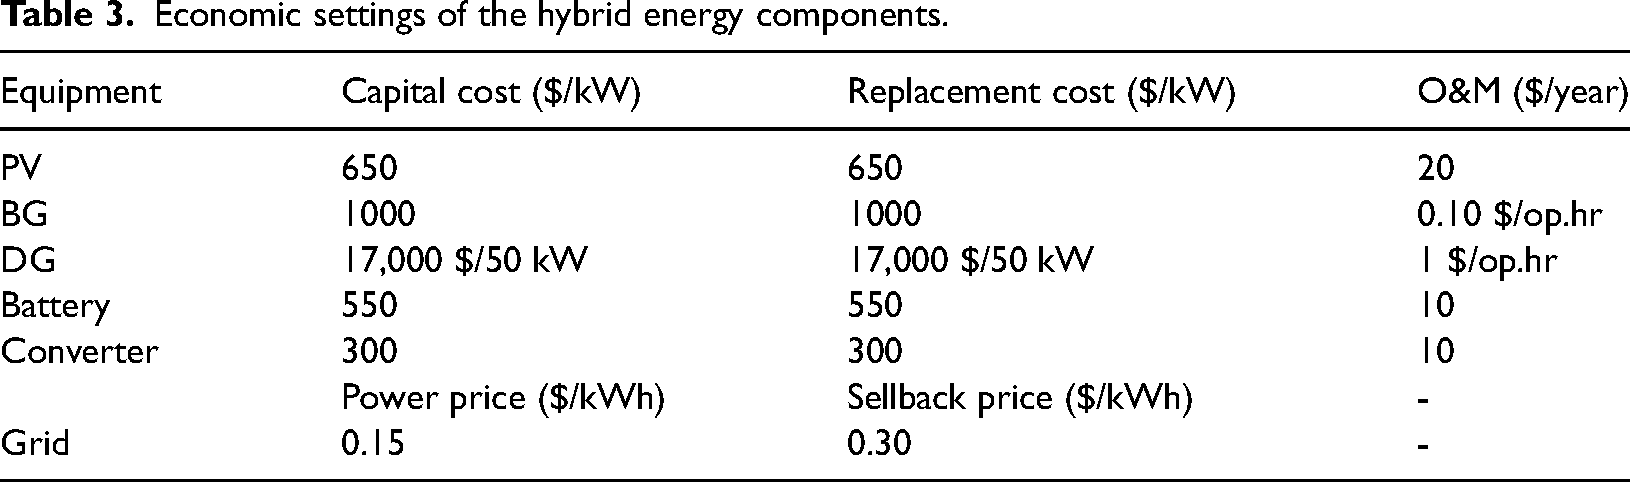
Configuration of the intended system
The proposed hybrid energy system (HES) is designed to cater to the energy needs of the site, which has an average load of 2426 kWh per day. Figure 8 gives a schematic representation of this system, which includes a diesel generator, a bio gasifier, a converter, a 1 kWh Li-Ion battery, and sun-tracking PV systems. You can find detailed technical and economic specifications for each component in Tables 2 and 3, respectively. It is worth noting that the HES has a lithium storage system integrated into it. According to local surveys, the rates for energy sold to and purchased from Ontario's grid system are established at $0.15/kWh and $0.30/kWh, respectively.
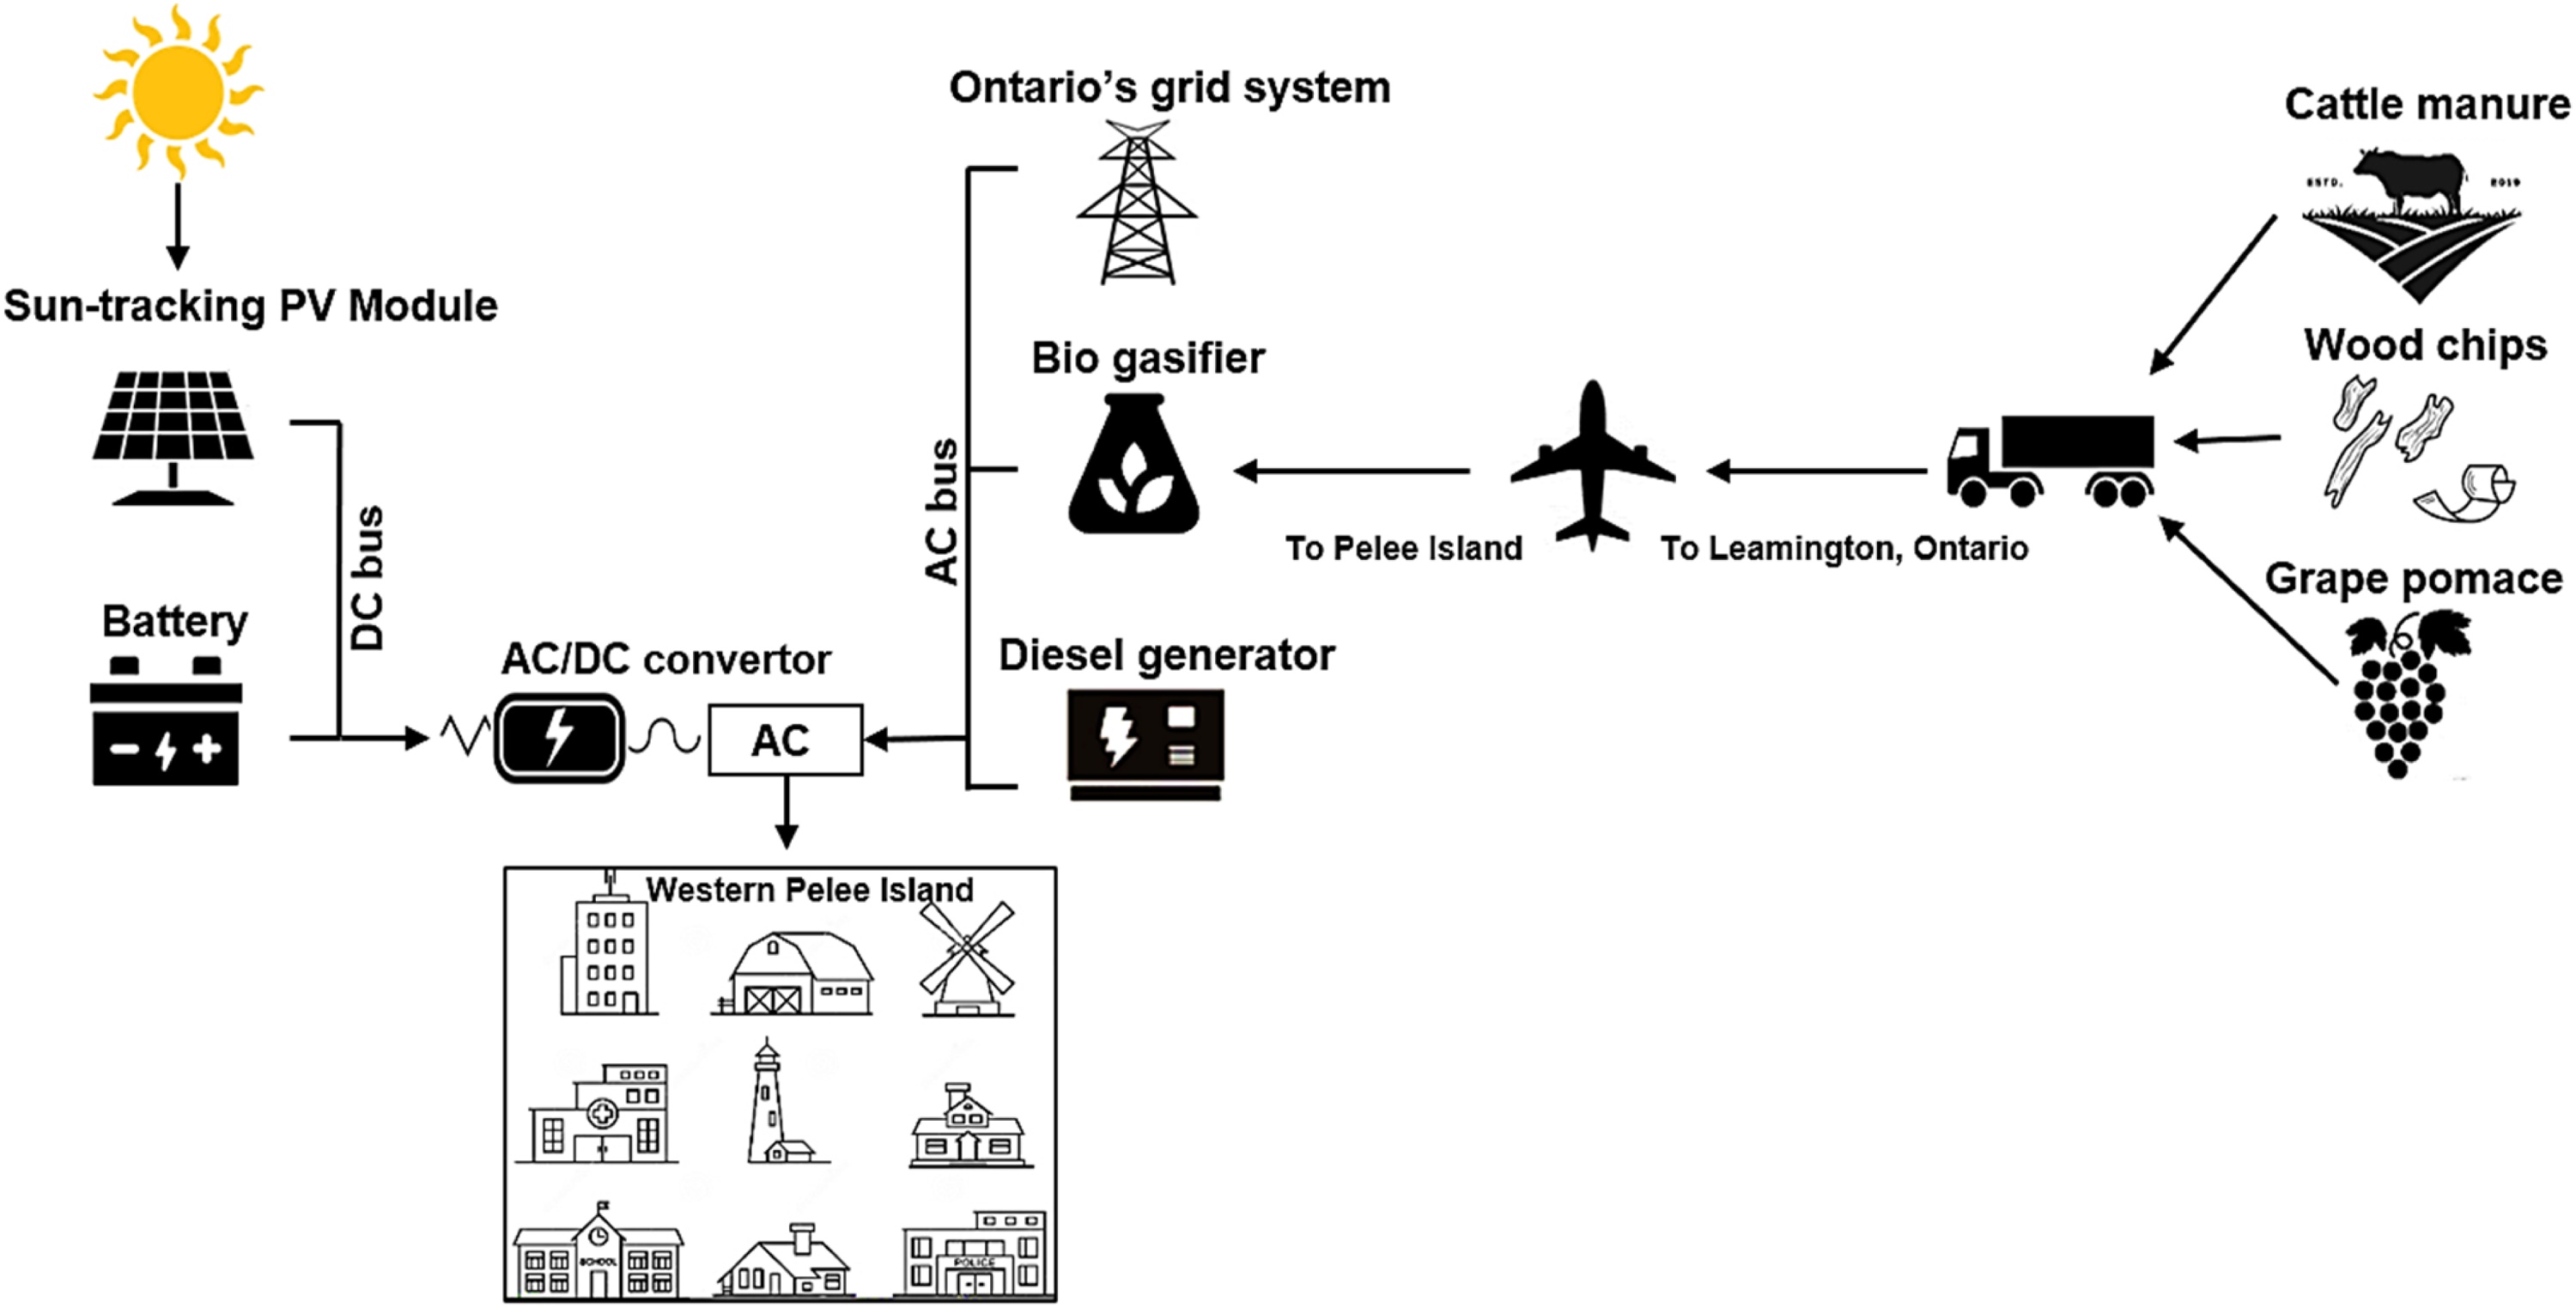
Schematic diagram of hybrid energy system configuration.
Technical details of the hybrid energy components.
Economic settings of the hybrid energy components.
Grid modeling
To analyze the unstable grid conditions on Pelee Island, a scenario incorporating unplanned power outages was simulated. In the absence of specific data on the timing of grid failures or maintenance schedules, average failure frequency, mean repair time, and repair time variability were used as input parameters. These parameters were employed to generate a pseudo-random outage profile over a full-year simulation, providing a realistic representation of grid instability. Figure 9 illustrates the annual grid outage profile, with black spots indicating outage events and green spots representing normal grid operation. During these outages, the PV/DG/BG system effectively meets the load demand, ensuring a reliable energy supply.
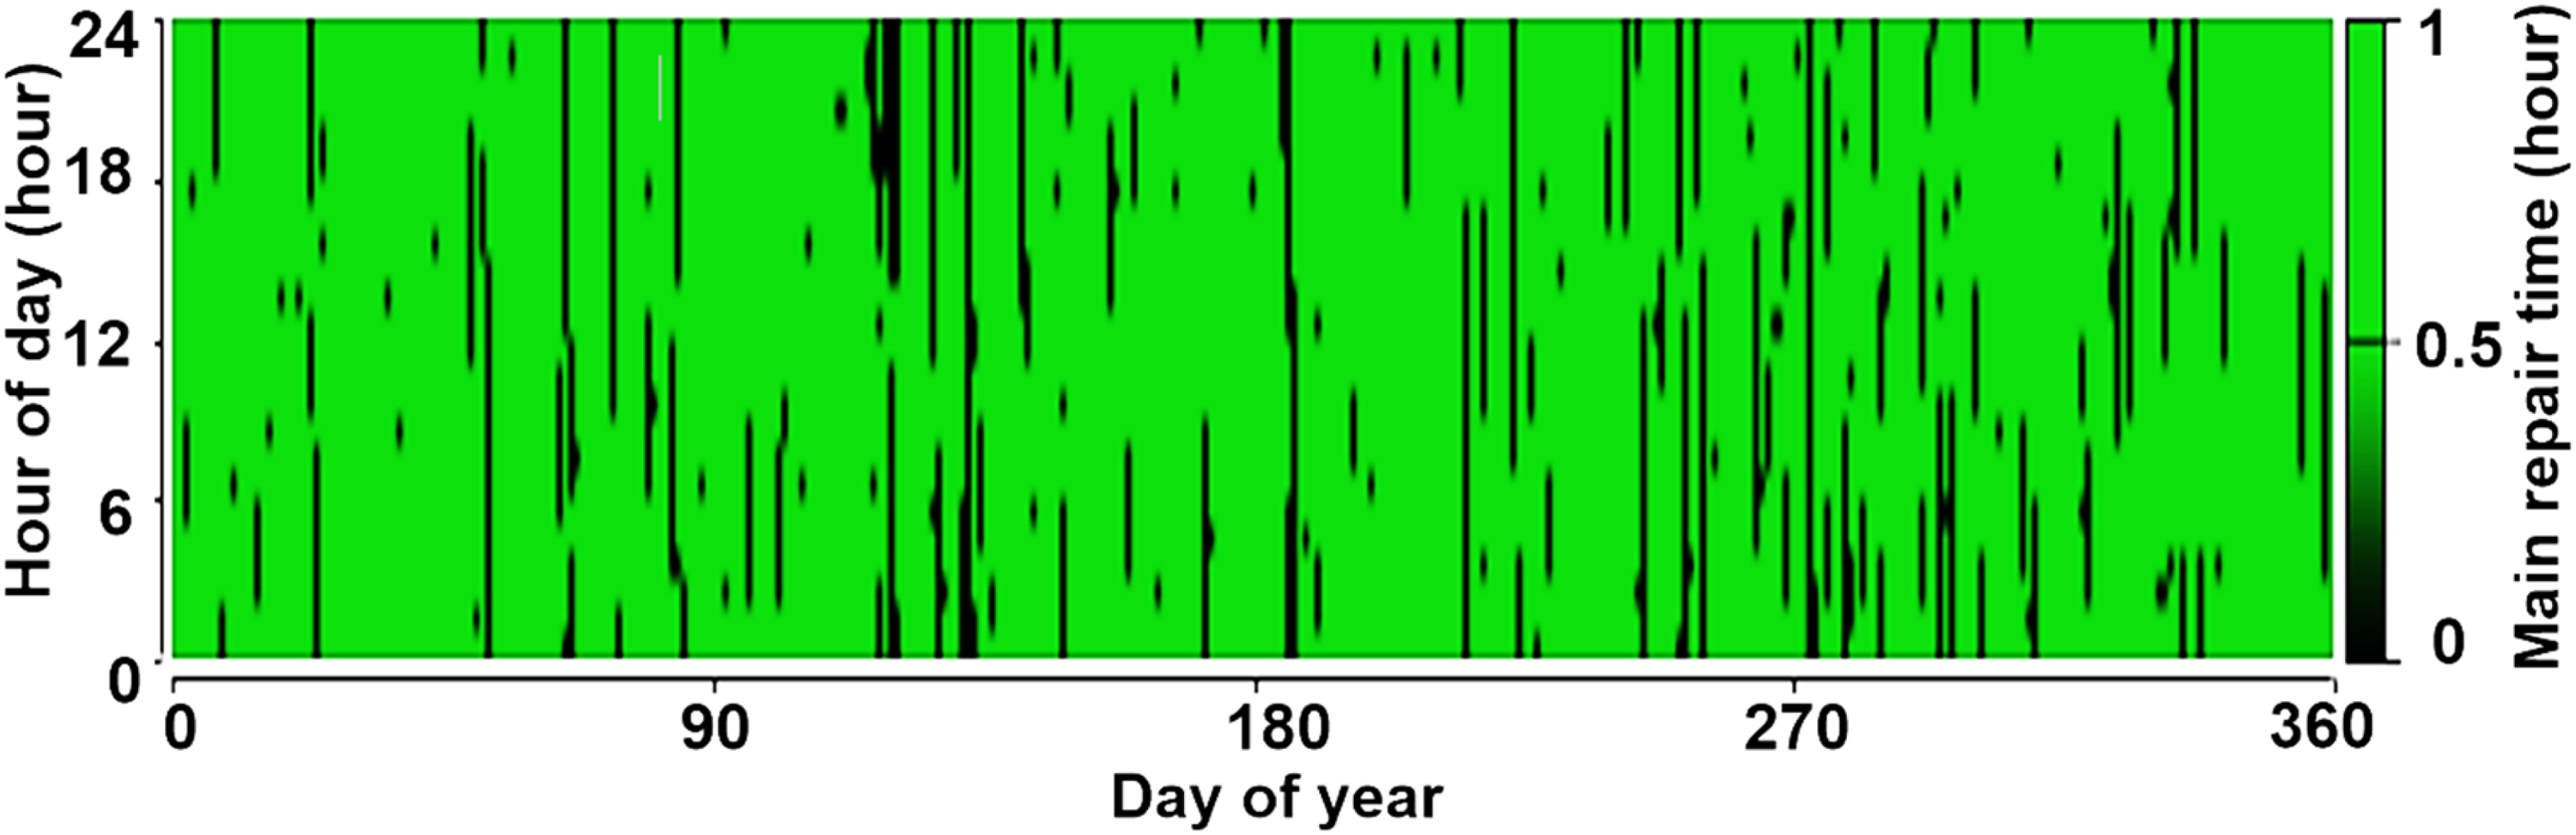
Profile of grid outage during a year in the target place.
Technical and economic formulation
Dispatch strategy
The cost of discharging in LF controller is calculated by using equation (1).
17


The cost of turning on the generator ($/kWh), in which the generator operates only to serve the net load in LF controller, is calculated using the following expression [58]:
The cost of discharging in CC controller is calculated by using equation (4).
17


The model analyzes the economics of various HES solutions using the parameters listed below:
Economic formula
Net present cost (NPC): The components’ optimal design is achieved according to the NPC, which is the sum of all expenditures and profits occurring over the project's lifetime.
43
To calculate the overall NPC of a project, the following equation is utilized:
44
Also, the following equation is used to estimate the yearly interest rate (%). where i is the annual inflation rate (%). Operating cost (OC): This parameter is determined by subtracting the total yearly cost from the capital cost, specified by equation (12)
24
Cost of energy (COE): One of the most important indicators for assessing the cost-effectiveness of HES. The COE is the average cost of a HES divided by the total served electrical energy (kWh), which can be determined by equation (13).
42
The straight-line depreciation method is employed in the calculation, with component values assumed to decrease evenly over their lifespan, ensuring consistency across all cost components in the LCOE assessment.
46
Here,


PV system equipped with tracking modules
The PV module harvests DC electricity in direct proportion to the solar irradiance incident upon it. The derating factor represents the lowered output in actual operating settings as a result of dust accumulation, shading snow cover, wiring losses, and aging. 45 To model PV system performance, several losses were incorporated, including soiling (5%), irradiance (3%), incident angle modifier (IAM) losses (2%), wiring losses (2%), and temperature losses (1%). An annual aging loss of 0.5% was also assumed to account for gradual PV module degradation over its lifespan. These losses collectively contribute to the 80% derating factor, ensuring a realistic and comprehensive representation of Pelee Island's conditions. 47
PV tracking systems are used to optimize the orientation of PV modules, thus improving their energy production efficiency. In many cases, fixed-tilt solar PV modules are designed with manually adjustable angles to balance simplicity and cost-effectiveness. However, as the sun's position changes throughout the day and across seasons, the fixed-tilt PV modules remain at a constant angle. As a result, the azimuth angle, which refers to the direction the PV module faces, receives a reduced amount of solar irradiance. This can result in suboptimal energy generation under changing solar conditions.
48
The major PV tracking techniques in this analysis are:
Horizontal-axis monthly adjustment (HMA): The panels are tilted each month to optimize sun exposure while the axis rotates around the east–west axis. Horizontal-axis continuous adjustment (HCA): The tilt angle is constantly being adjusted while the rotation revolves around the horizontal axis. Vertical-axis continuous adjustment (VCA): The tilt remains fixed, but the PV array constantly rotates along the vertical (north–south) axis. Dual-axis-tracker (DAT): To maintain a perpendicular angle between the PV panels and the sun's rays, the PV arrays constantly rotate in both horizontal and vertical axes.
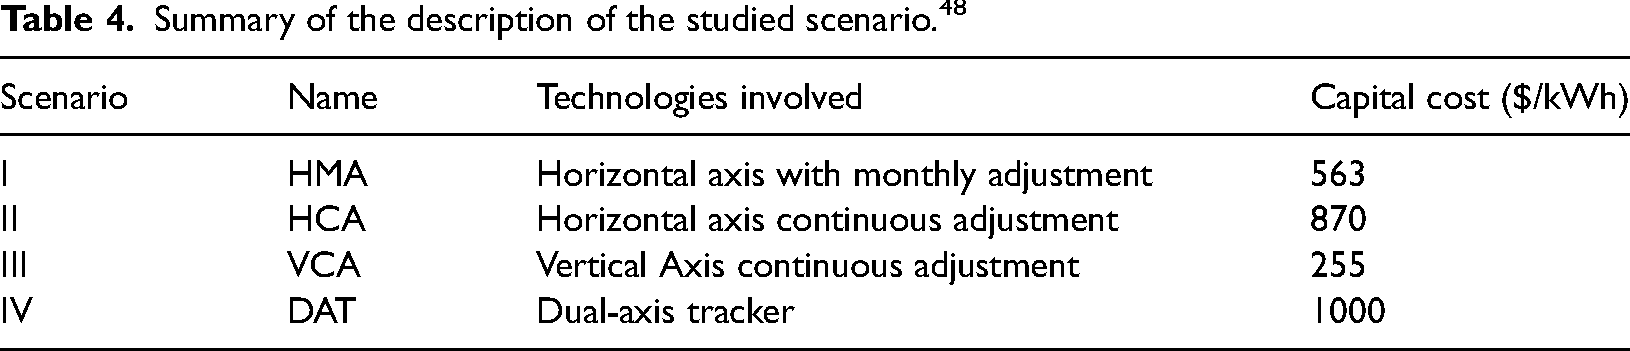
Single- and two-axis PV trackers require auxiliary components such as motors, gears, control units, and sensors, increasing their overall cost. Table 4 provides an overview of the market costs associated with sun-tracking PV technology, including horizontal, vertical, and dual-axis trackers, as considered in this study. It is important to note that these cost figures do not include the expenses related to the PV system itself. The table presents four distinct scenarios: Scenario I involves a horizontal axis with monthly adjustment (HMA), Scenario II employs horizontal axis continuous adjustment (HCA), Scenario III utilizes vertical axis continuous adjustment (VCA), and Scenario IV deploys two-axis tracking (DTA). These PV tracking systems are classified based on the number of rotation axes they have, as shown in Figure 10.
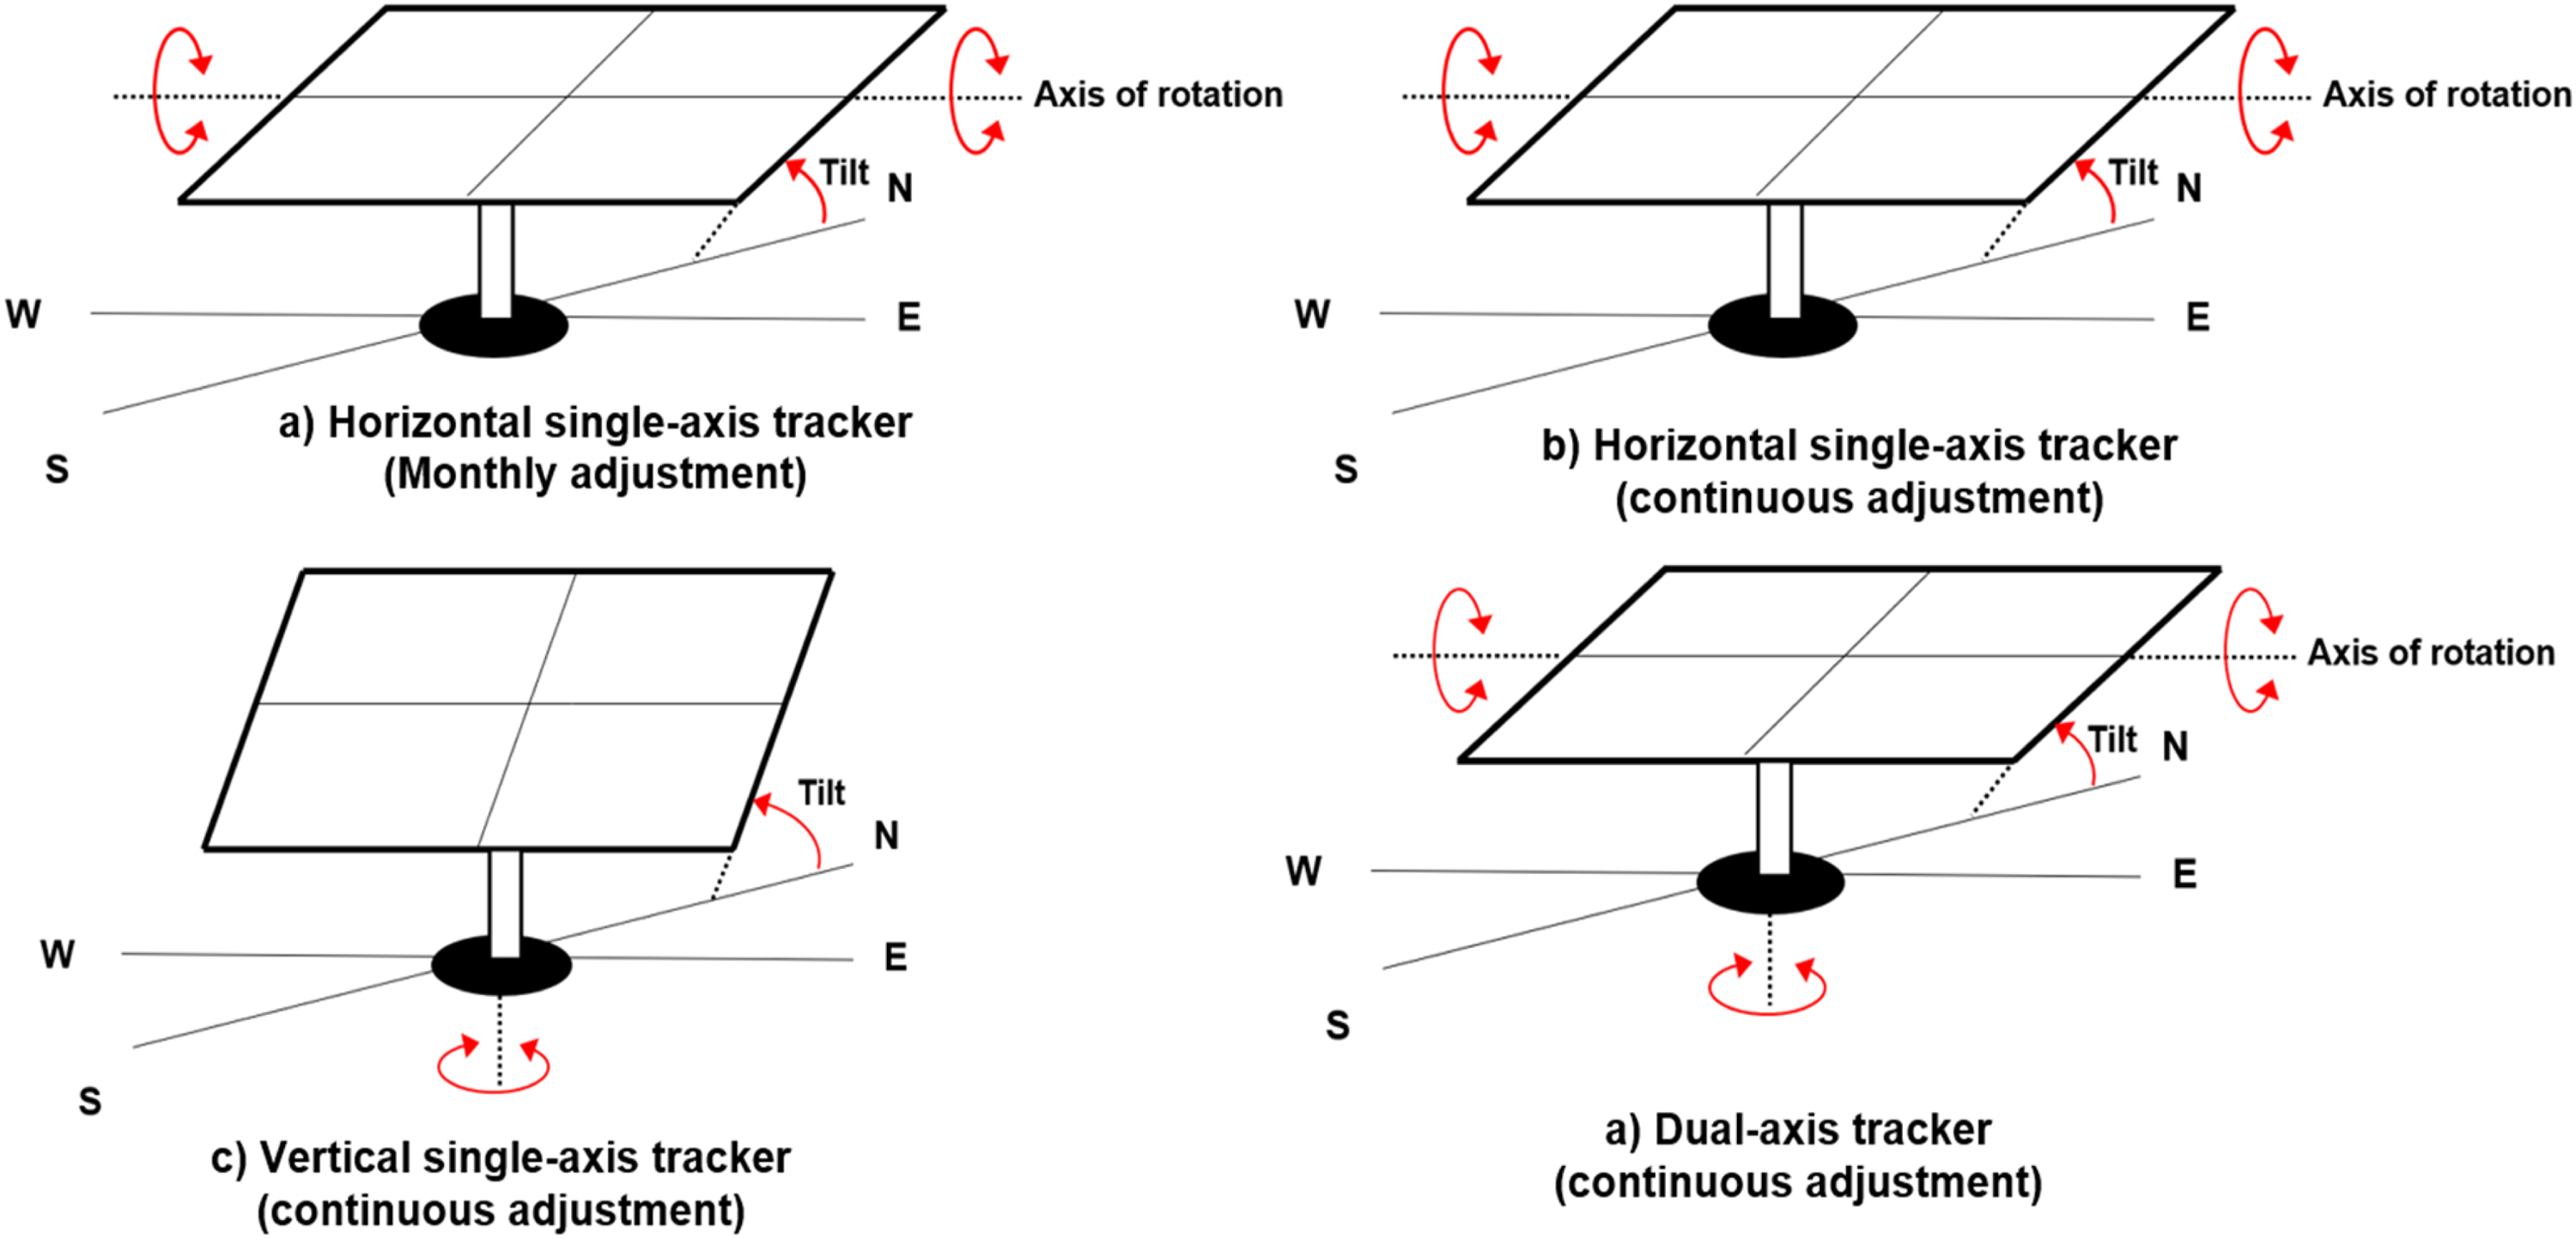
Illustration of tracking systems studied in this analysis.
Summary of the description of the studied scenario. 48
Biogasifier and diesel generator
The use of photovoltaic (PV) systems for energy generation is limited to daylight hours, which is why a combination of a biogas gasifier and a diesel generator was chosen to ensure a stable and reliable power supply. This gasification system utilizes biomass, which is made up of organic materials such as crop residues, wood, waste from animals and humans, and other sources, as its feedstock. The use of biomass as an energy source is becoming increasingly popular in the region and is easily accessible in Pelee Island and the wider southern Ontario area. This option provides a sustainable and locally available alternative to support the intermittent nature of PV energy production.
The efficiency of a diesel generator can be determined using the following equation:
The power output will not be similar for various biomass wastes. These wastes are combined to guarantee efficient anaerobic co-digestion, which improves biogas generation and process efficiency.
50

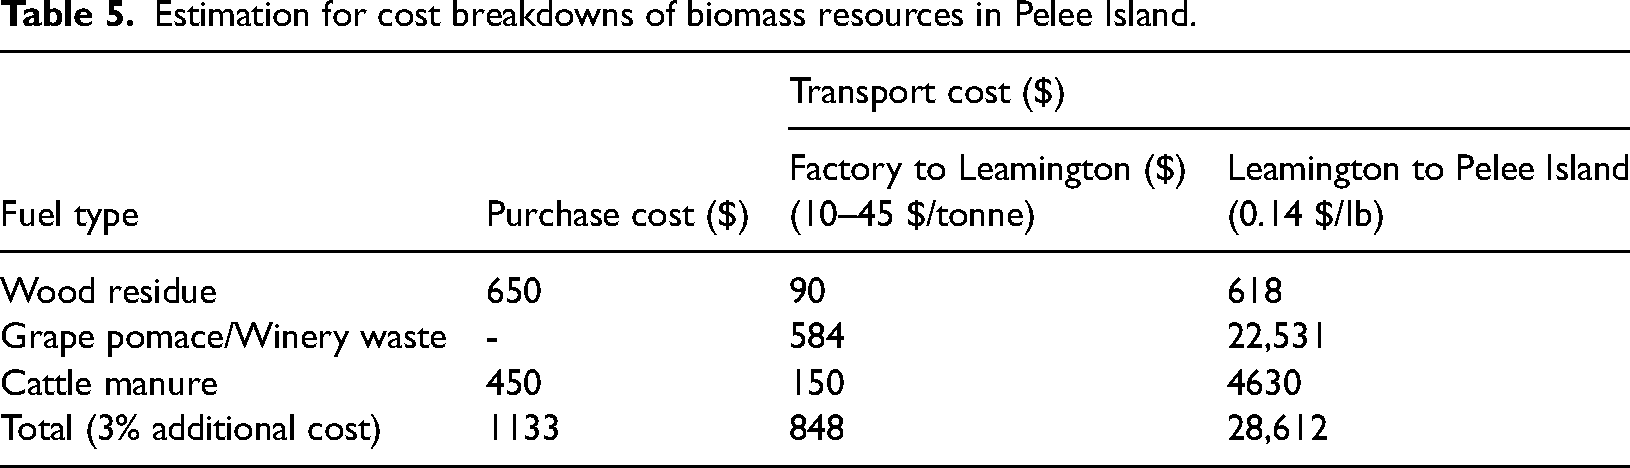
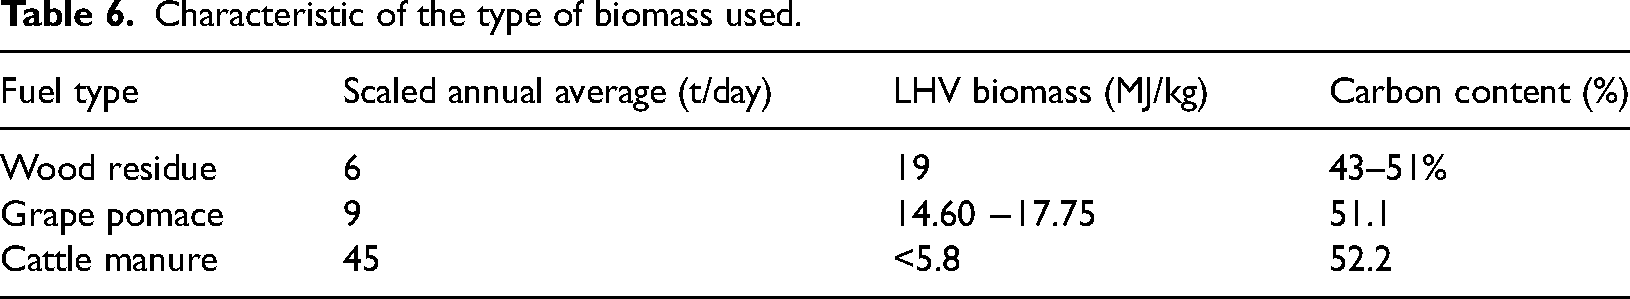
Table 5 provides information about the availability and affordability of high-quality bioresources collected from onsite and neighboring regions throughout the year. Moreover, Pelee Island has over 700 acres of Canada's warmest grape-growing region, which means that grape pomace biomass will be easily accessible. 51 The estimated average cost of biomass, including Pelee Island's collection and transportation expenses, is $340 per tonne. Table 6 provides the characteristics and measured parameters of each biomass type. The gasifier's performance plays a crucial role in biomass utilization efficiency, and we will discuss it further in the next section.
Estimation for cost breakdowns of biomass resources in Pelee Island.
Characteristic of the type of biomass used.
Battery and converter
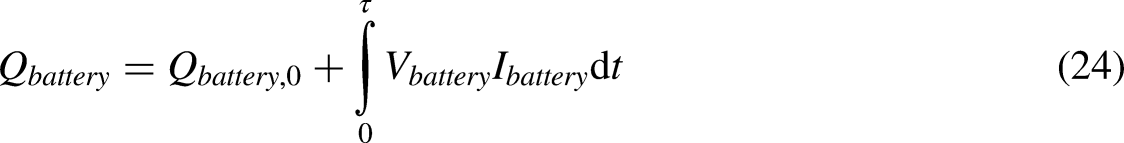
The battery stores electricity in a chemical form, and subsequently, this stored energy can be recharged and reused to supply continuous operation as required. Maintaining a battery charge of less than 20% is critical for the battery bank's long-term durability. The following equation shows how values of battery energy can be estimated.
52

The power rating of the converter, critical for ensuring seamless operation between energy generation, storage, and load, can be determined using the following equation:
54
Results and discussion
A comprehensive performance analysis will be conducted on cycle charging (CC)-based and load following (LF)-based systems, which will include various tracking configurations. The technical, economic, and environmental parameters of each approach will be evaluated to identify the optimal hybrid energy solution. The key attributes of the best-case scenarios will be illustrated using graphical representations, such as surface plots. The cost breakdown and energy distribution between the CC and LF dispatch strategies will be compared. A sensitivity analysis will also be performed to examine the effects of various factors on the economic and technical parameters associated with each tracker. These factors include load growth, minimum state of charge (SOCmin), tracking cost multiplier, and albedo. Finally, a comparison of the findings with those of previous studies will be made to represent the significance of the results in various locations with tracker technologies.
Optimization results
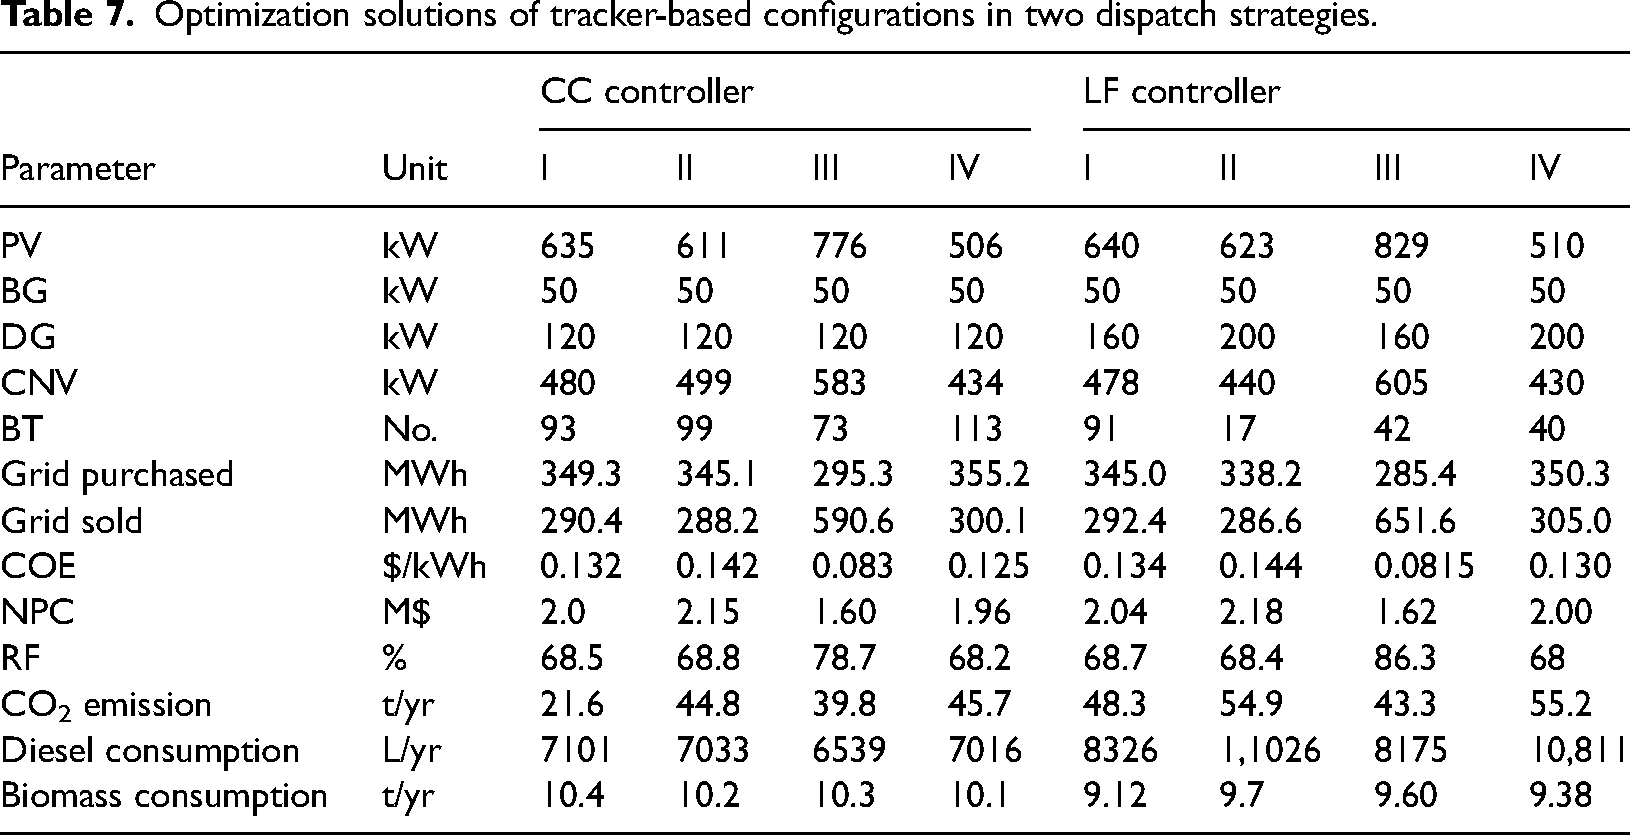
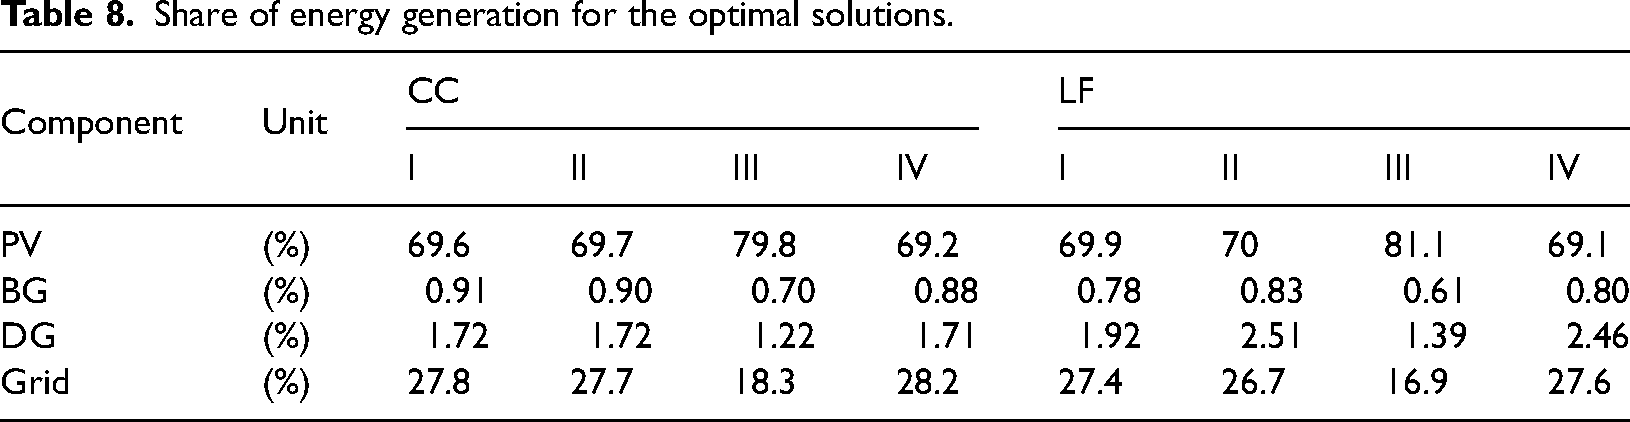
Different PV trackers under LF and CC were considered to find potential energy solutions that can meet the load demands of the area. Infeasible systems were eliminated, and feasible ones were sorted by their NPC. The optimal component capacity and the proposed properties based on the tracking device and dispatch strategy are shown in Table 7. Since the island's central grid option has limitations in capacity, performance, and reliability, the proposed hybrid options rely more on the PV/DG/BG system for energy generation. The table shows that the winning configuration is the CC-controlled one that uses 776 kW PV modules with a VCA tracker, 50 kW gasifier, 120 kW DG, 583 kW converter, and 73 units of 1 kWh Li-Ion, based on its capacity, performance, and reliability. The optimal case has an NPC, COE, and a renewable fraction of $1.60 M, $0.083/kWh, and 78.7%, respectively. This system also has ∼$0.02 M, ∼$0.002/kWh, and 7.6% lower NPC, COE, and RF, respectively, than the same case (scenario III) in the LF controller. The highest renewable fraction (86.3%) is observed in the VCA-based solution (scenario III) operating with an LF controller. The cleanest configuration is also the HMA-based option (Scenario III) under the CC controller, having 21.6 t emissions per year. Table 8 presents the share of energy generation by component under each tracker technology. The CC-based solutions, on average, have ∼0.5% lower use of PV and DG capacity as compared to LF-based systems. The contribution of LF-based options in the total generation of BG and central grid, respectively, is ∼0.1% and ∼0.8% higher than the CC-based system.
Optimization solutions of tracker-based configurations in two dispatch strategies.
Share of energy generation for the optimal solutions.
Surface plot of electricity to/from the central grid under optimal solution
The results of this analysis indicated that the energy production components (BG/DG/PV) can sell energy to the grid during daylight in winter at the maximum rate. In the summer, the energy production components can sell energy to the grid for a longer period of time. Figure 11(a) and (b) demonstrates the fluctuation of hourly energy flow from and to the grid during a year. In December, when solar availability is low, electricity purchases from the grid are needed at a rate higher than 100 kW. On the other hand, most of the load requirement in the spring and summer is supplied by the PV system, which results in grid purchase reaching its minimum values. As can be seen in Figure 11(b), Pelee residents can expect the highest energy sold to the grid during the daytime, mainly in the summer, at a rate higher than 200 kW.
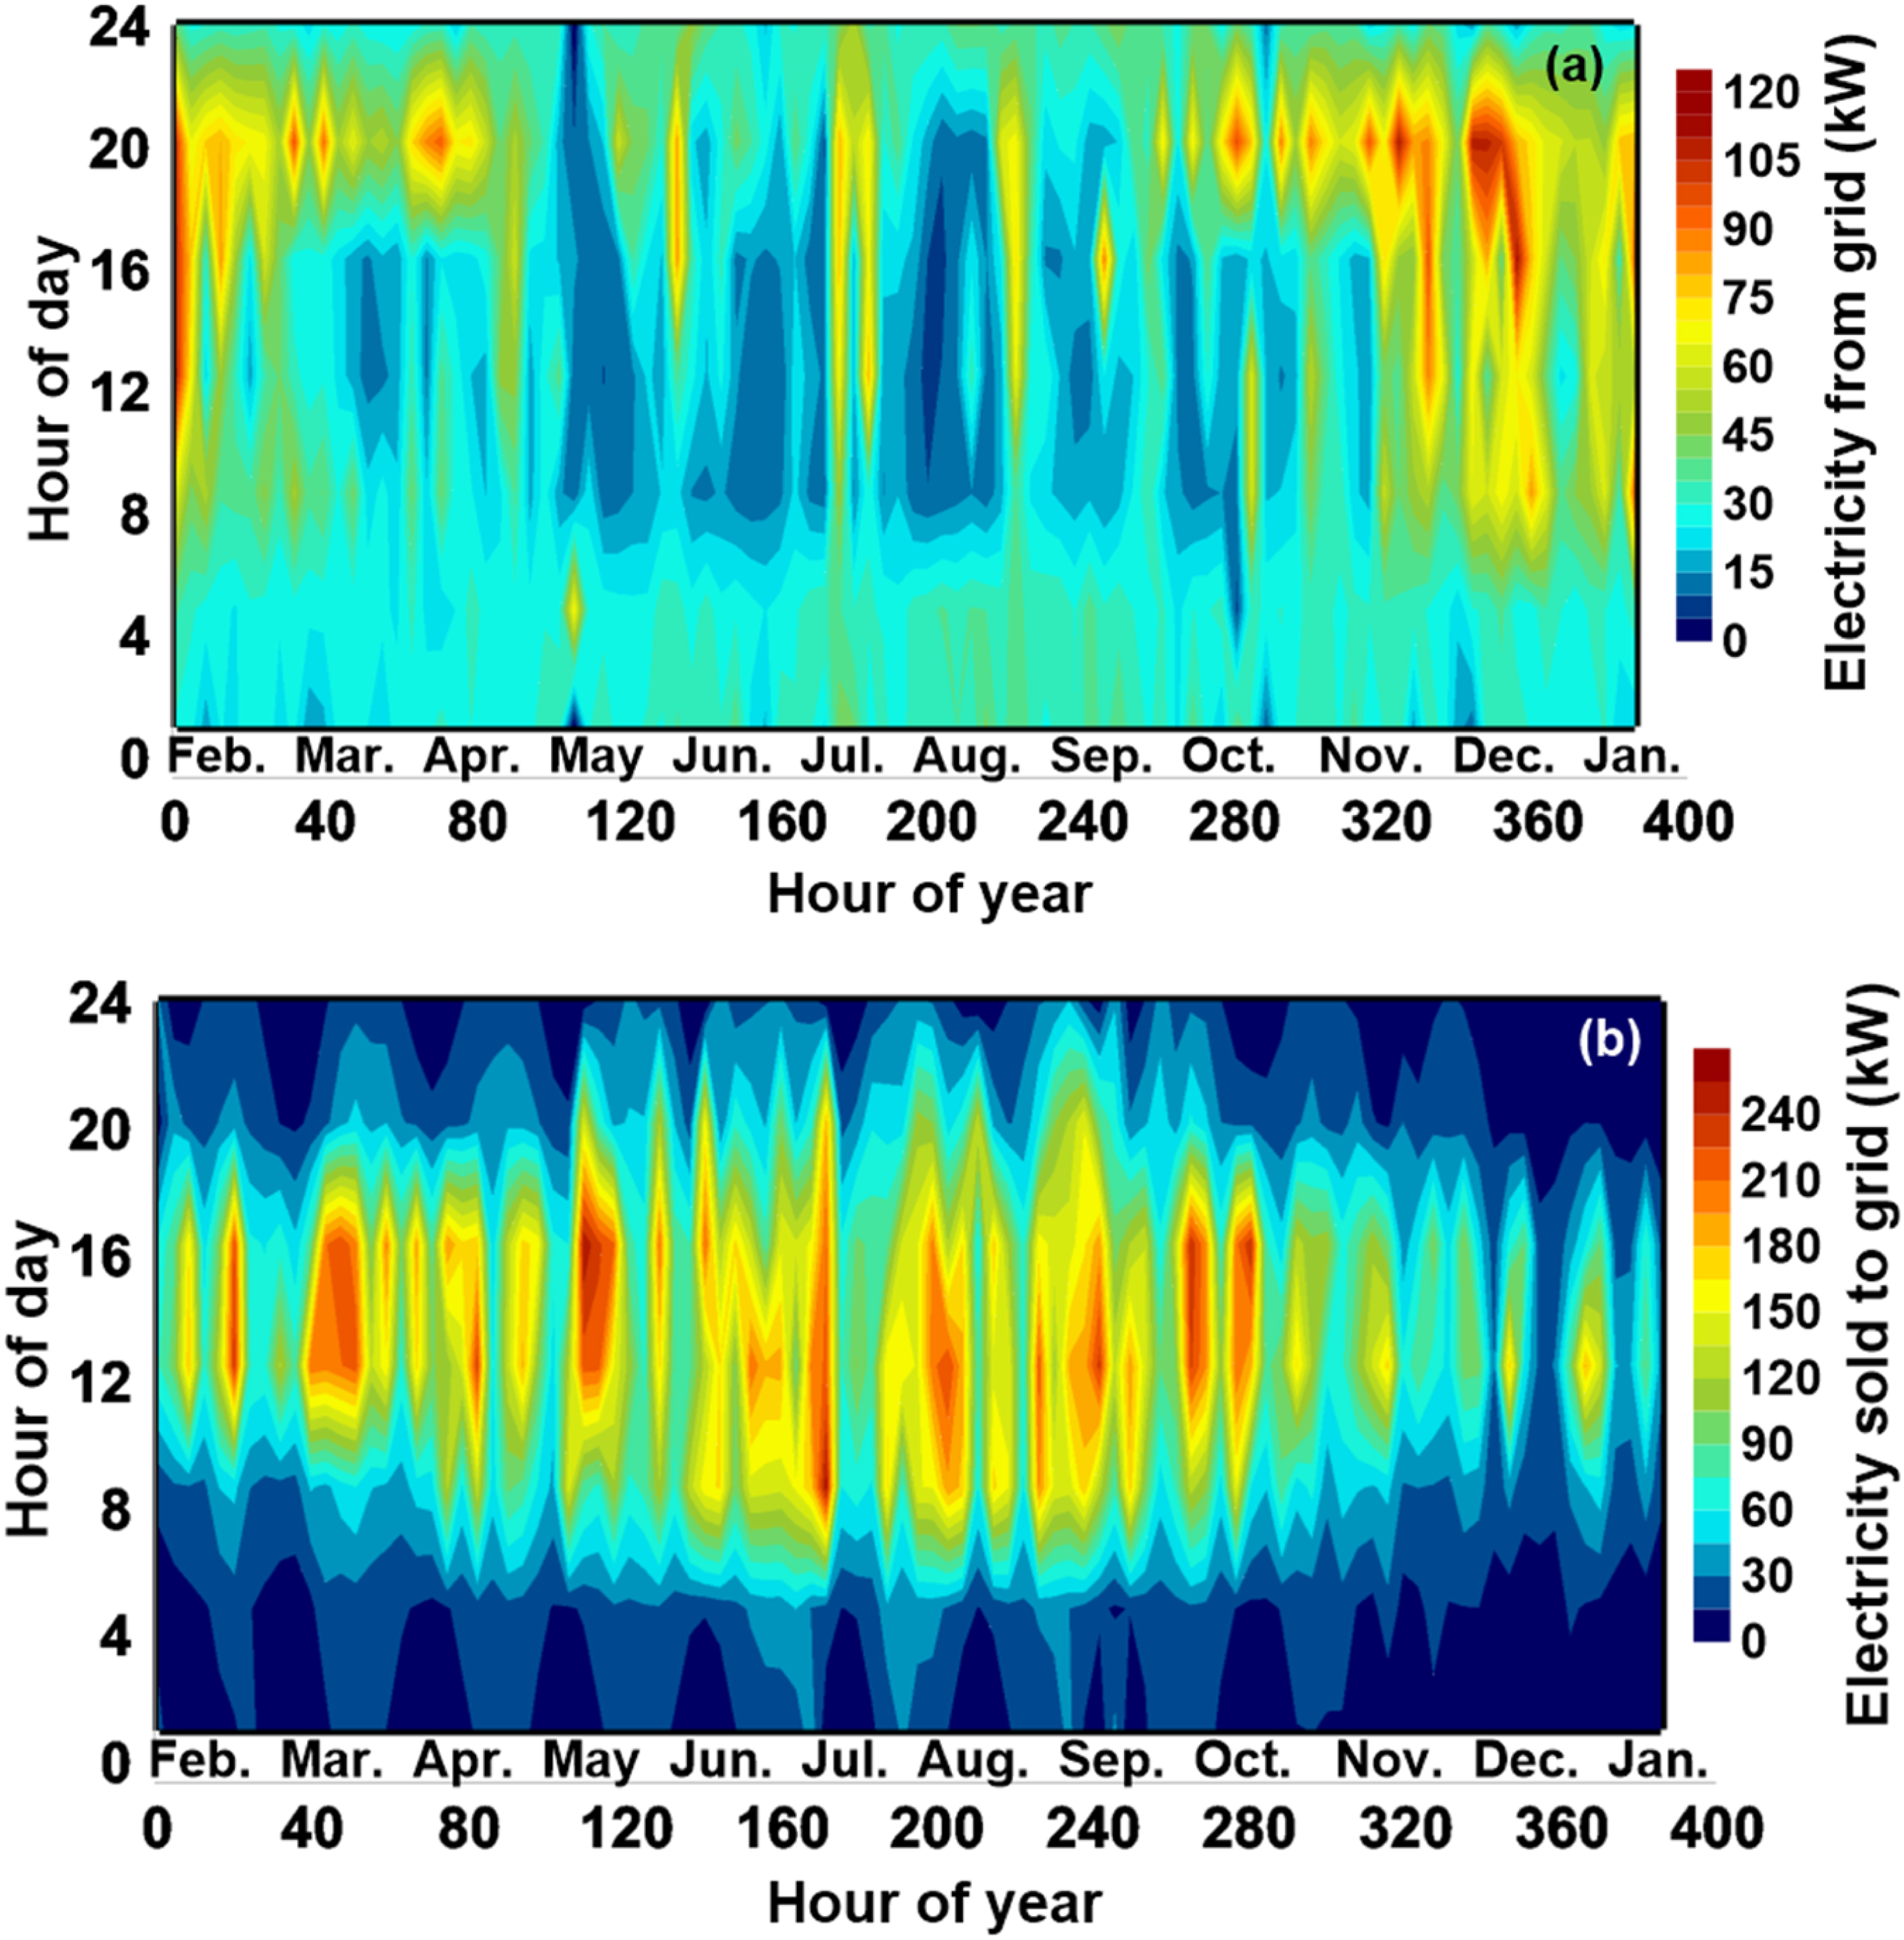
Annual surface plot of (a) energy purchased (b) energy sales to the grid under optimal scenario.
Surface plot of solar angles under optimal solution
In this analysis, it has been found that the energy production components, namely BG, DG, and PV, can generate more energy than required and supply excess energy to the grid. This is particularly true during the daylight hours of summer when solar generation is at its peak and for an extended period of time in the summer. Figure 11(a) and (b) illustrates the hourly energy flow dynamics to and from the grid over the course of a year. During December, when solar availability is limited, electricity purchases from the grid are necessary, and the amount of electricity purchased often exceeds 100 kW. During the spring and summer months, the PV system can meet a significant portion of the load demand, resulting in fewer grid purchases. According to Figure 11(b), Pelee Island residents can expect the highest energy exports during daylight hours, especially in the summer, and these rates can exceed 200 kW (Figure 12).
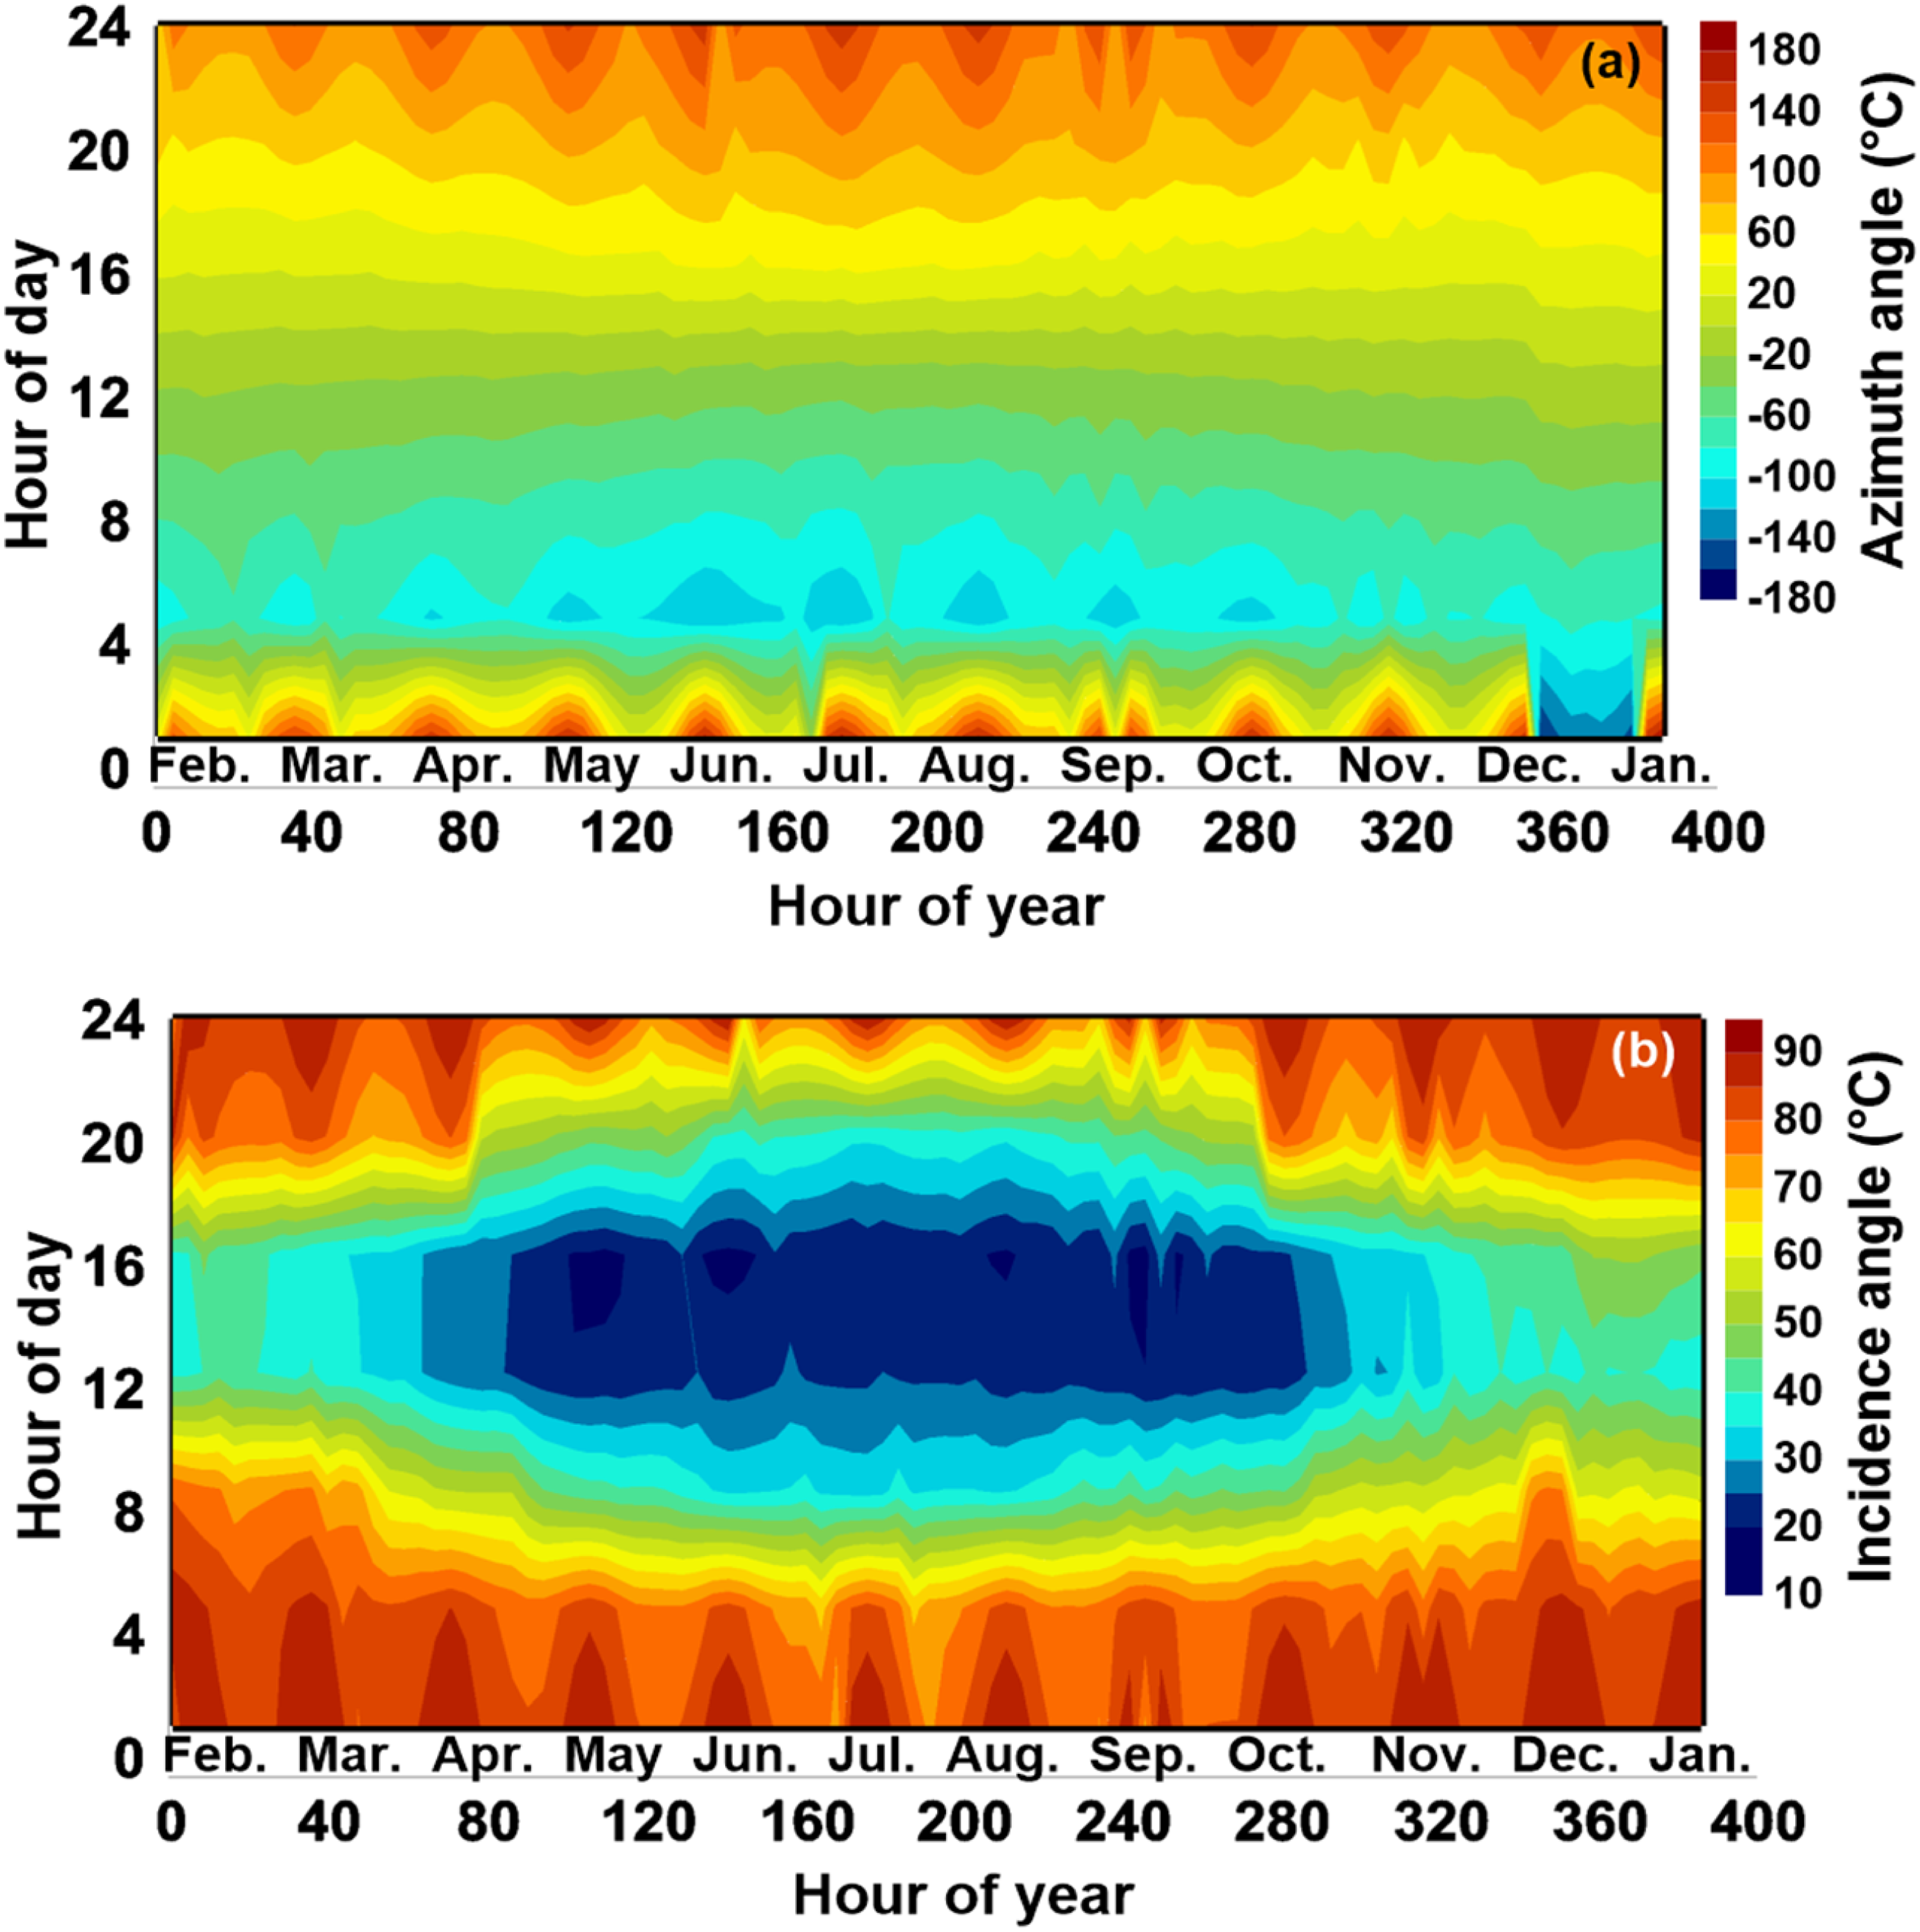
Annual surface plot of (a) solar azimuth and (b) incidence angle under optimal scenario.
Sample of system performance under optimal case
This section evaluates the performance of the optimal system configuration, demonstrating how various components respond to hourly load variations across different months. Figure 13(a) and (b) provides a detailed analysis of energy balances for weekdays and weekends under the optimal system. Figure 13(a) highlights the month of May, chosen for its favorable climate conditions, during which PV arrays generate a substantial energy surplus—approximately six times the electricity required by the central grid. As electricity demand fluctuates, the system prioritizes PV arrays to meet the load, deactivating the central grid for power generation. The combined output from the PV arrays and grid matches the total electrical load, ensuring minimal unmet demand and achieving high system efficiency. Figure 13(b) illustrates the division of energy generation among the gasifier (BG), diesel generator (DG), and battery system during weekends in January when PV performance is lower. During this month, the gasifier and diesel generator are used as backup sources, operating in scheduled time slots (7–9 a.m. for DG and 9–11 a.m. for BG). The production from DG and BG is significantly lower, about one-tenth of the PV output. Batteries supplement the load during low solar irradiance periods, such as early mornings and midnight on January 7th, enhancing system reliability.
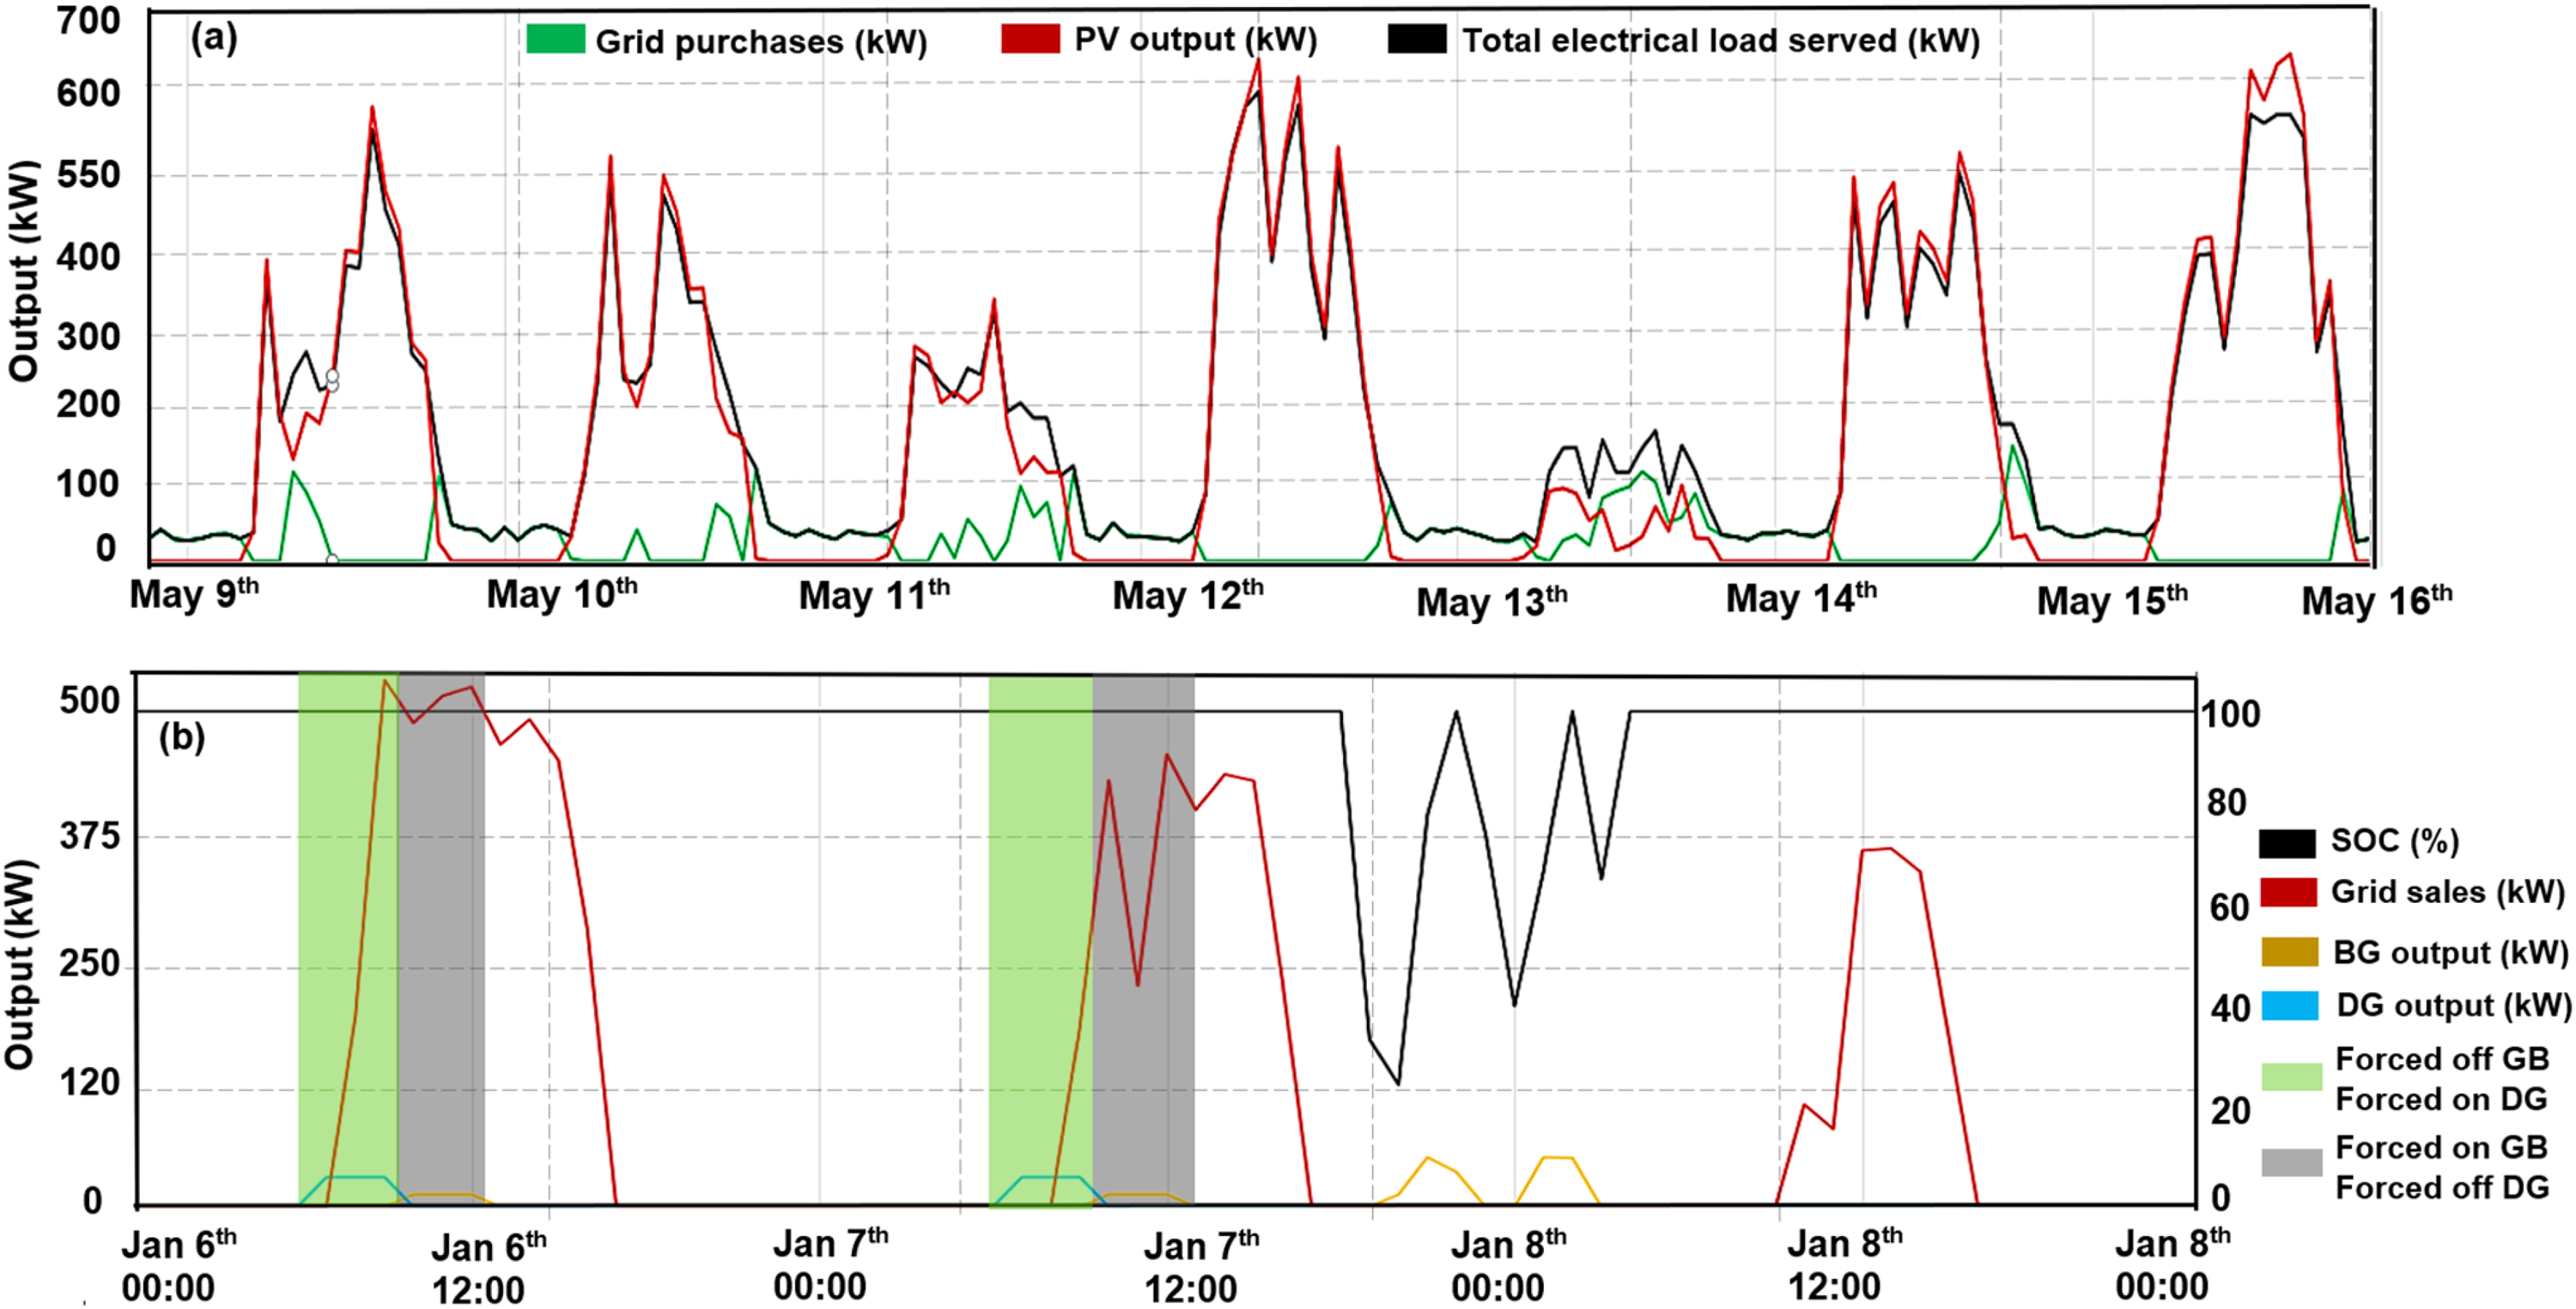
Sample of power outputs of the components for the optimal system under LF strategy on (a) weekdays and (b) weekend.
Figure 14 shows the annual battery state of charge (SOC) profile, offering insights into energy storage reliability and operational flexibility throughout the year. Additionally, Figure 15 depicts the PV output and cumulative frequency for the optimal configuration. It reveals that the most frequently recurring PV outputs fall within the 0–36 kW range, with less than 5000 h of occurrence annually, demonstrating the system's consistent performance under varying conditions. These analyses validate the system's ability to maintain energy balance and meet load requirements effectively across different seasons.
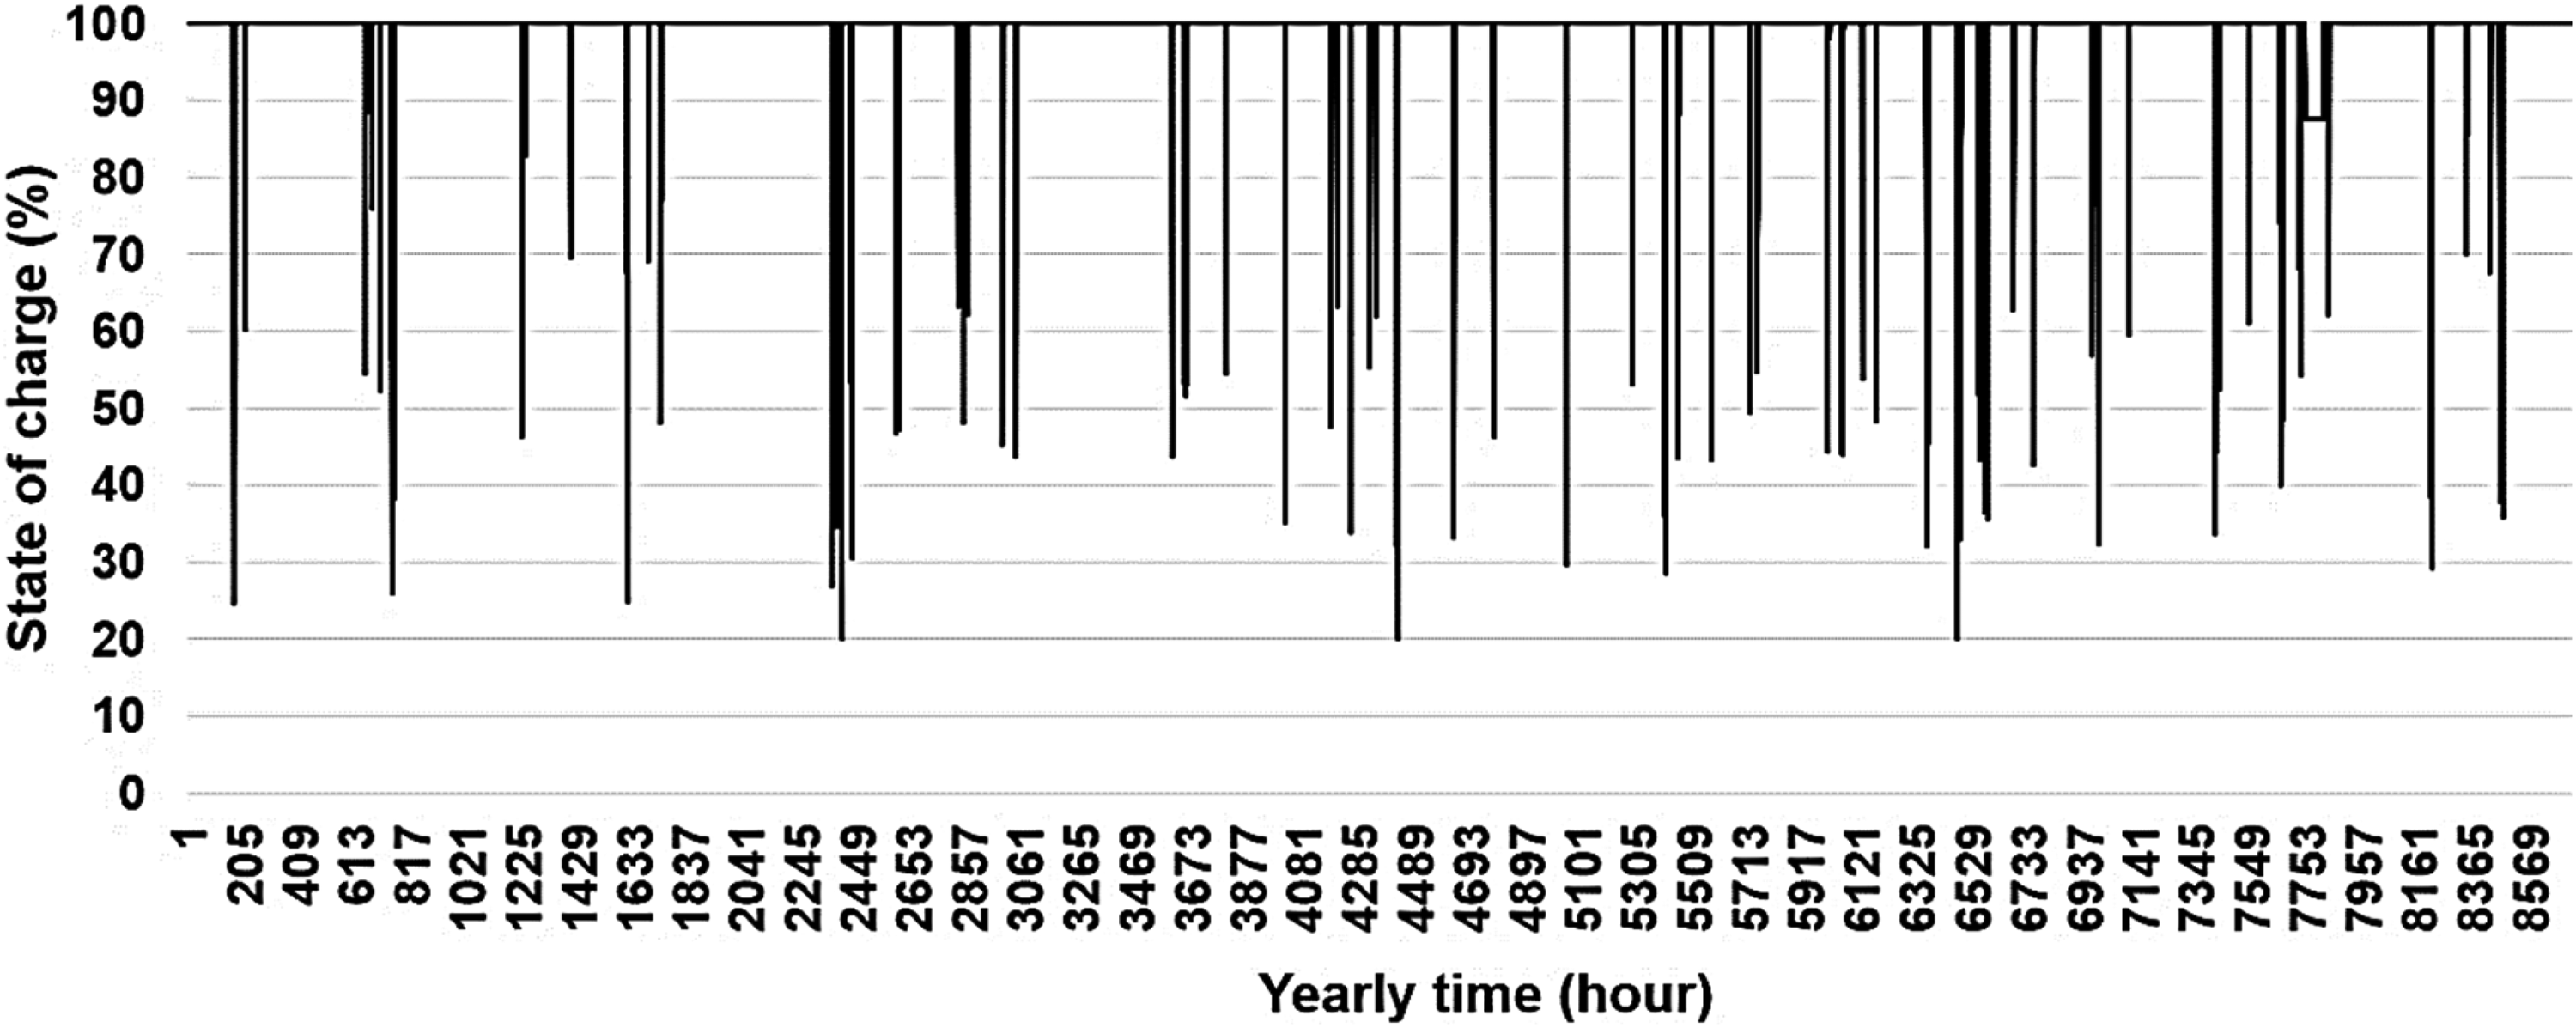
Yearly profile of the state of charge in the optimal case.
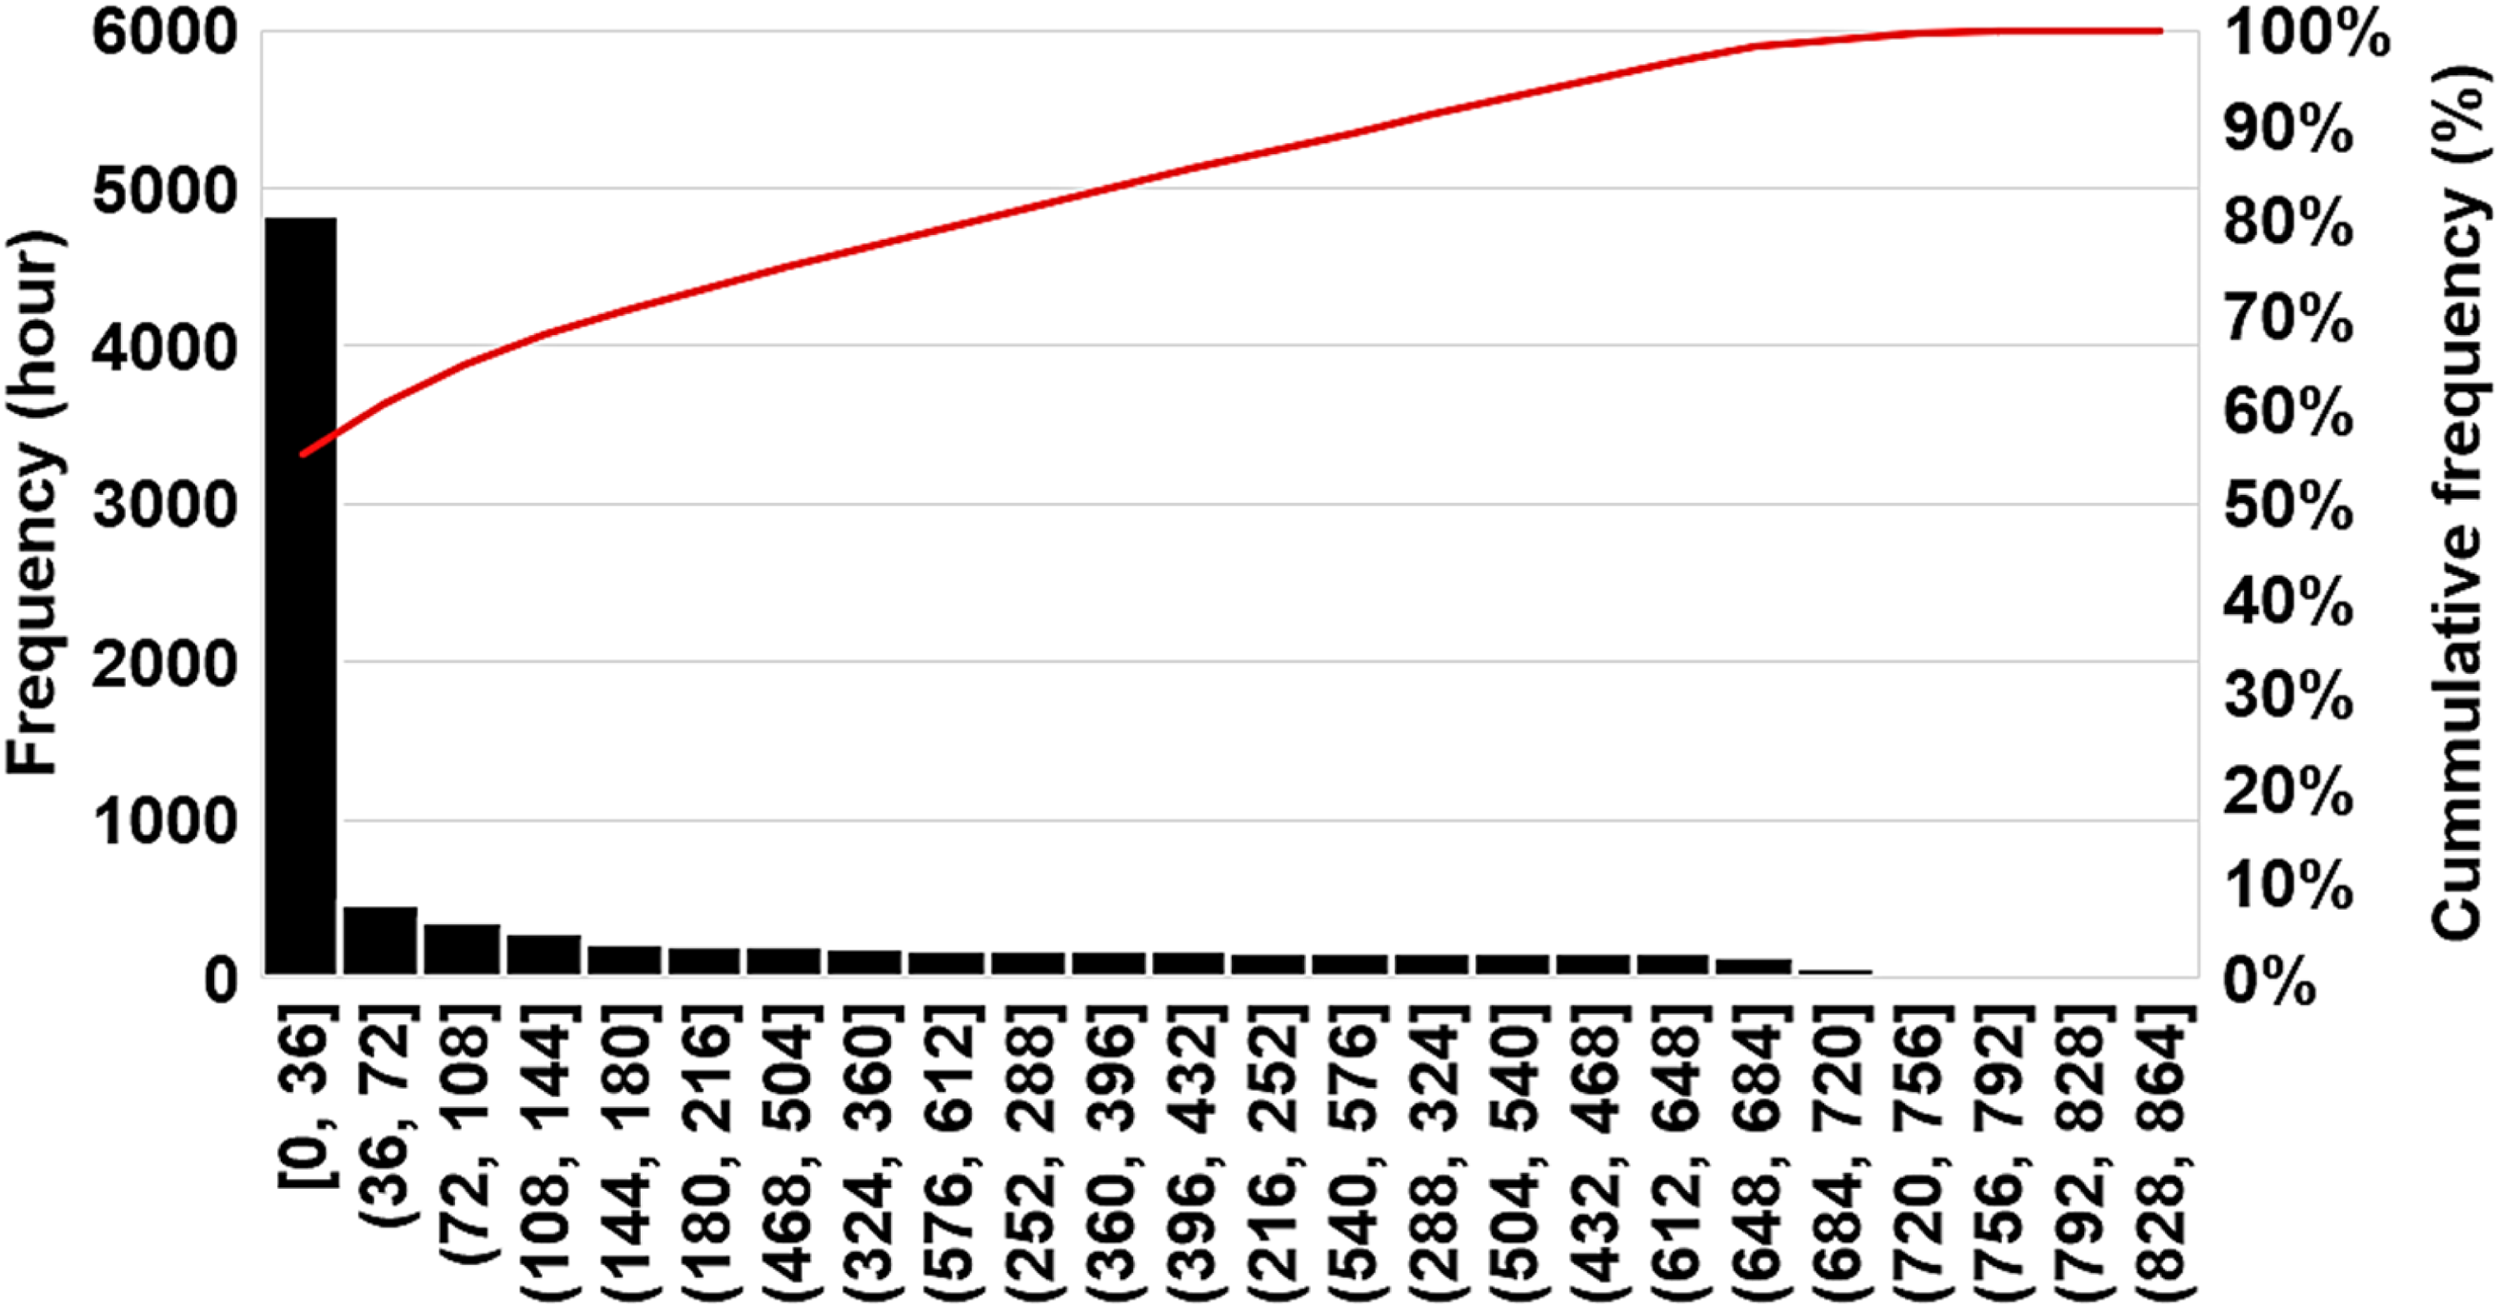
Pv output and its cumulative frequency in the optimal case.
Comparison of the optimal cases under CC and LF dispatch strategies
Figure 16 illustrates the cost breakdown of HES components under LF and CC controllers. DG costs, primarily driven by O&M expenses, account for approximately 10% and 13% of the total costs in LF and CC systems, respectively. The largest investment is allocated to CC-based PV arrays, which are 5% costlier than LF-based arrays, reflecting the higher emphasis on renewable energy capacity in CC systems. In contrast, BT and BG represent the least costly components over the system's lifespan, with BG costs remaining relatively stable due to its lower operational requirements and consistent fuel availability. Figure 17 shows the energy distribution for optimal LF and CC configurations, both achieving zero unmet load, underscoring their reliability in meeting energy demands. The LF system outperforms the CC system, producing 80 MW more energy and consuming 64 MW less over the project's lifetime. This performance difference can be attributed to the LF strategy's higher efficiency in dispatching energy resources, minimizing waste, and prioritizing renewable contributions. Additionally, the LF system demonstrates a better balance between energy production and grid reliance, further optimizing overall system performance and cost-effectiveness.
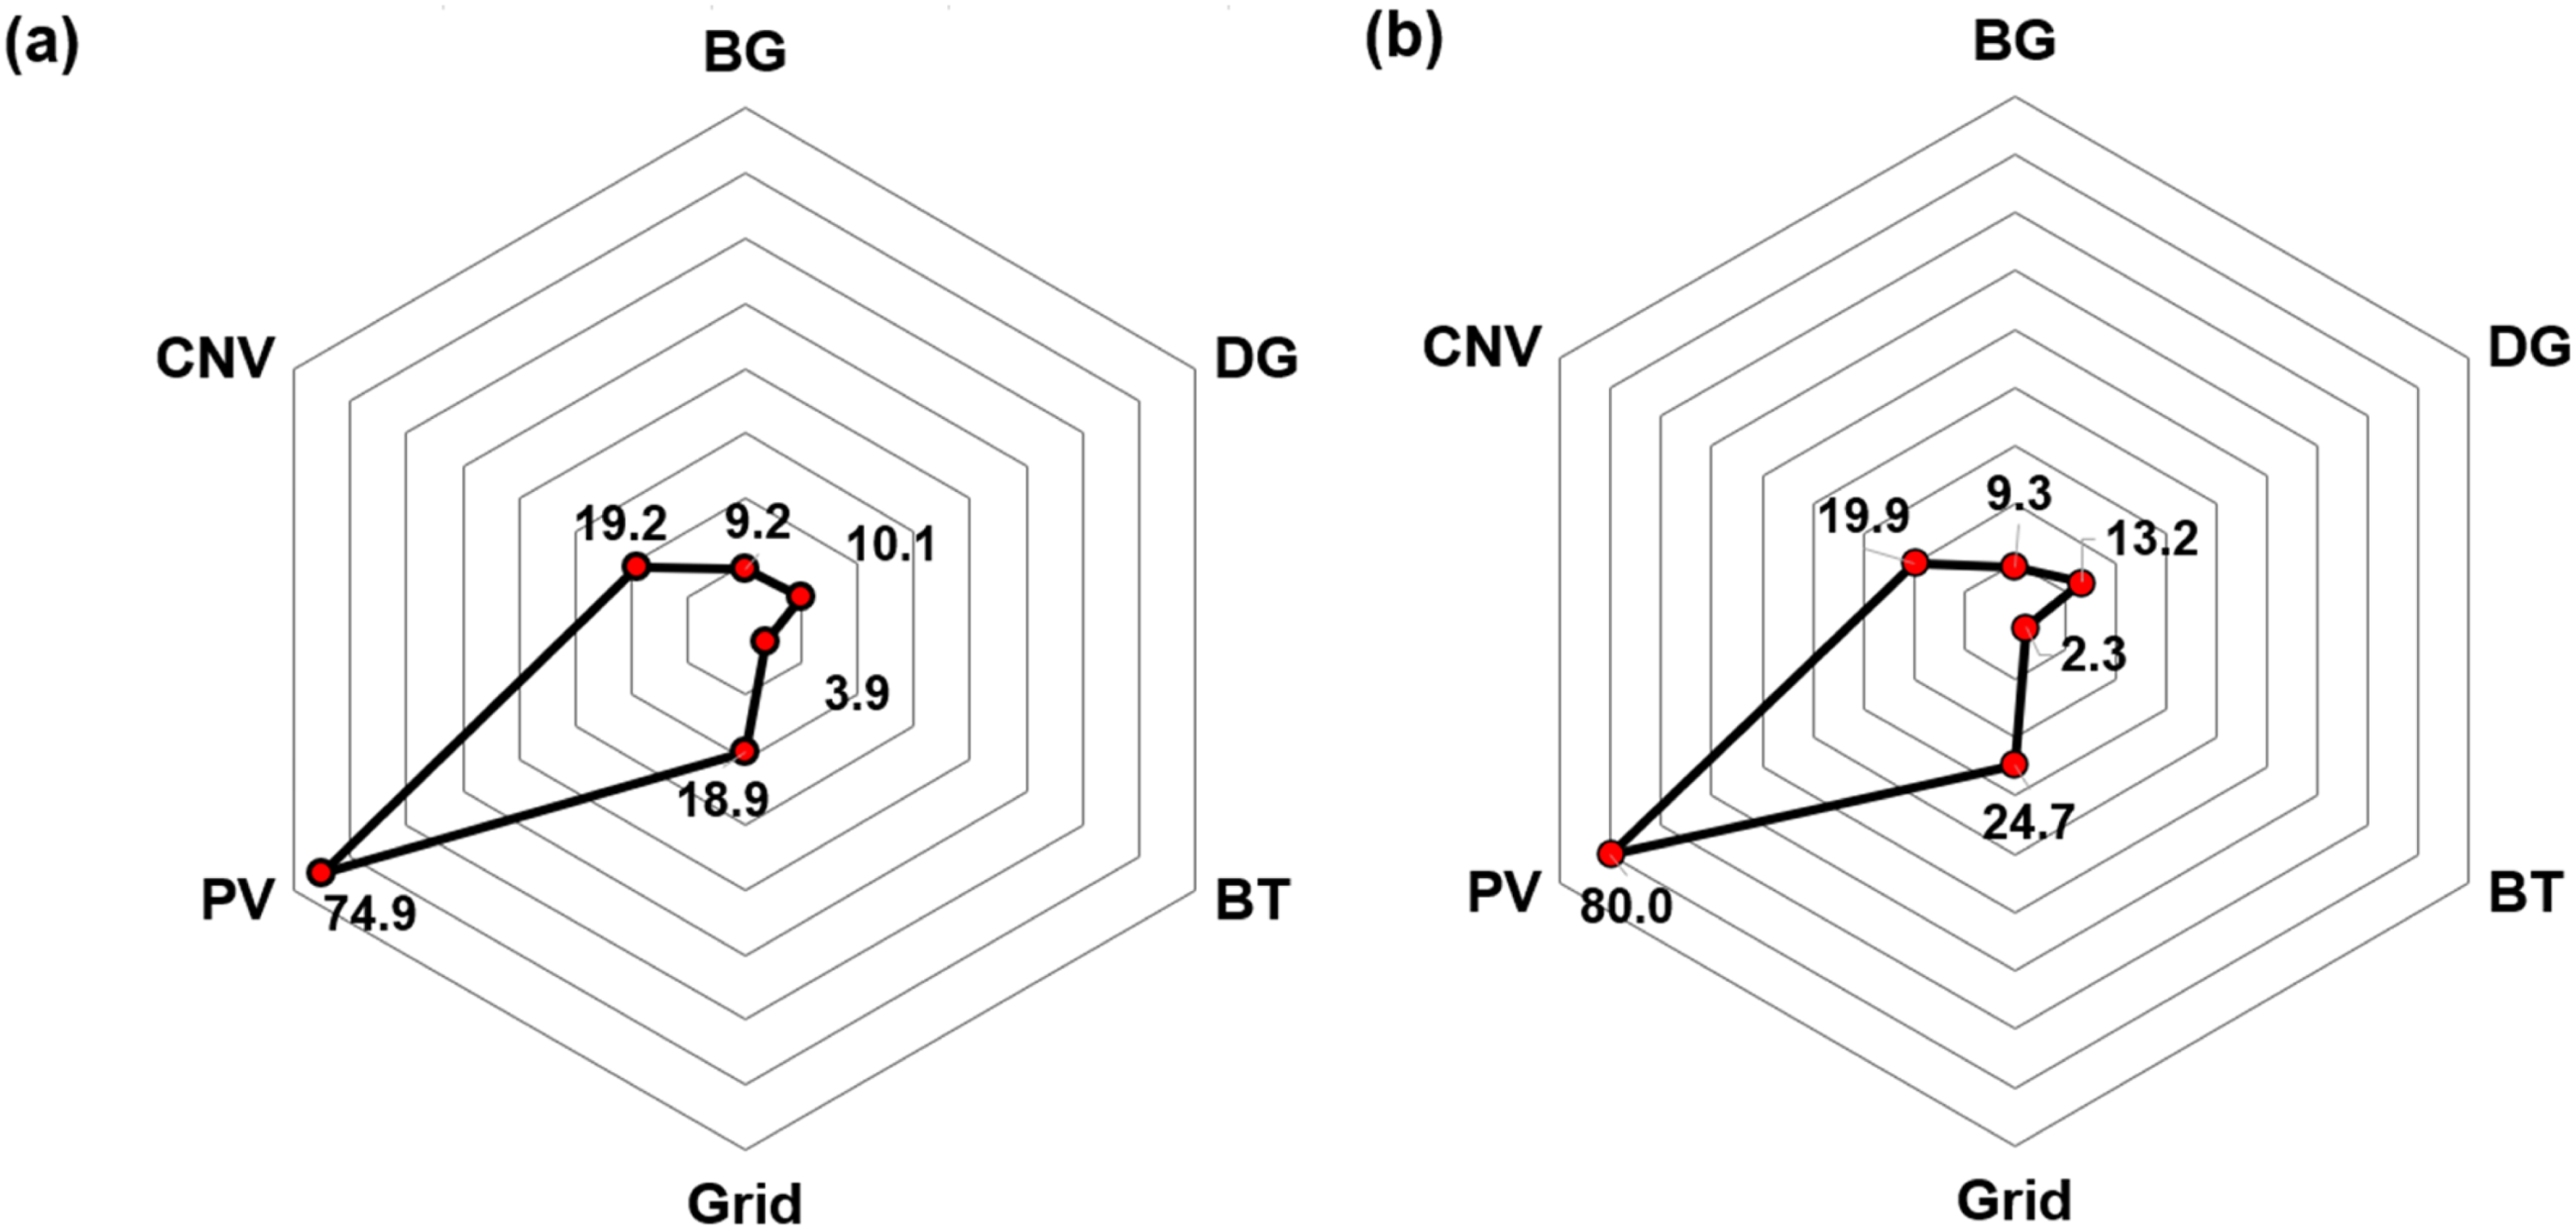
Cost breakdown of the optimal solutions of (a) LF and (b) CC dispatch strategies.
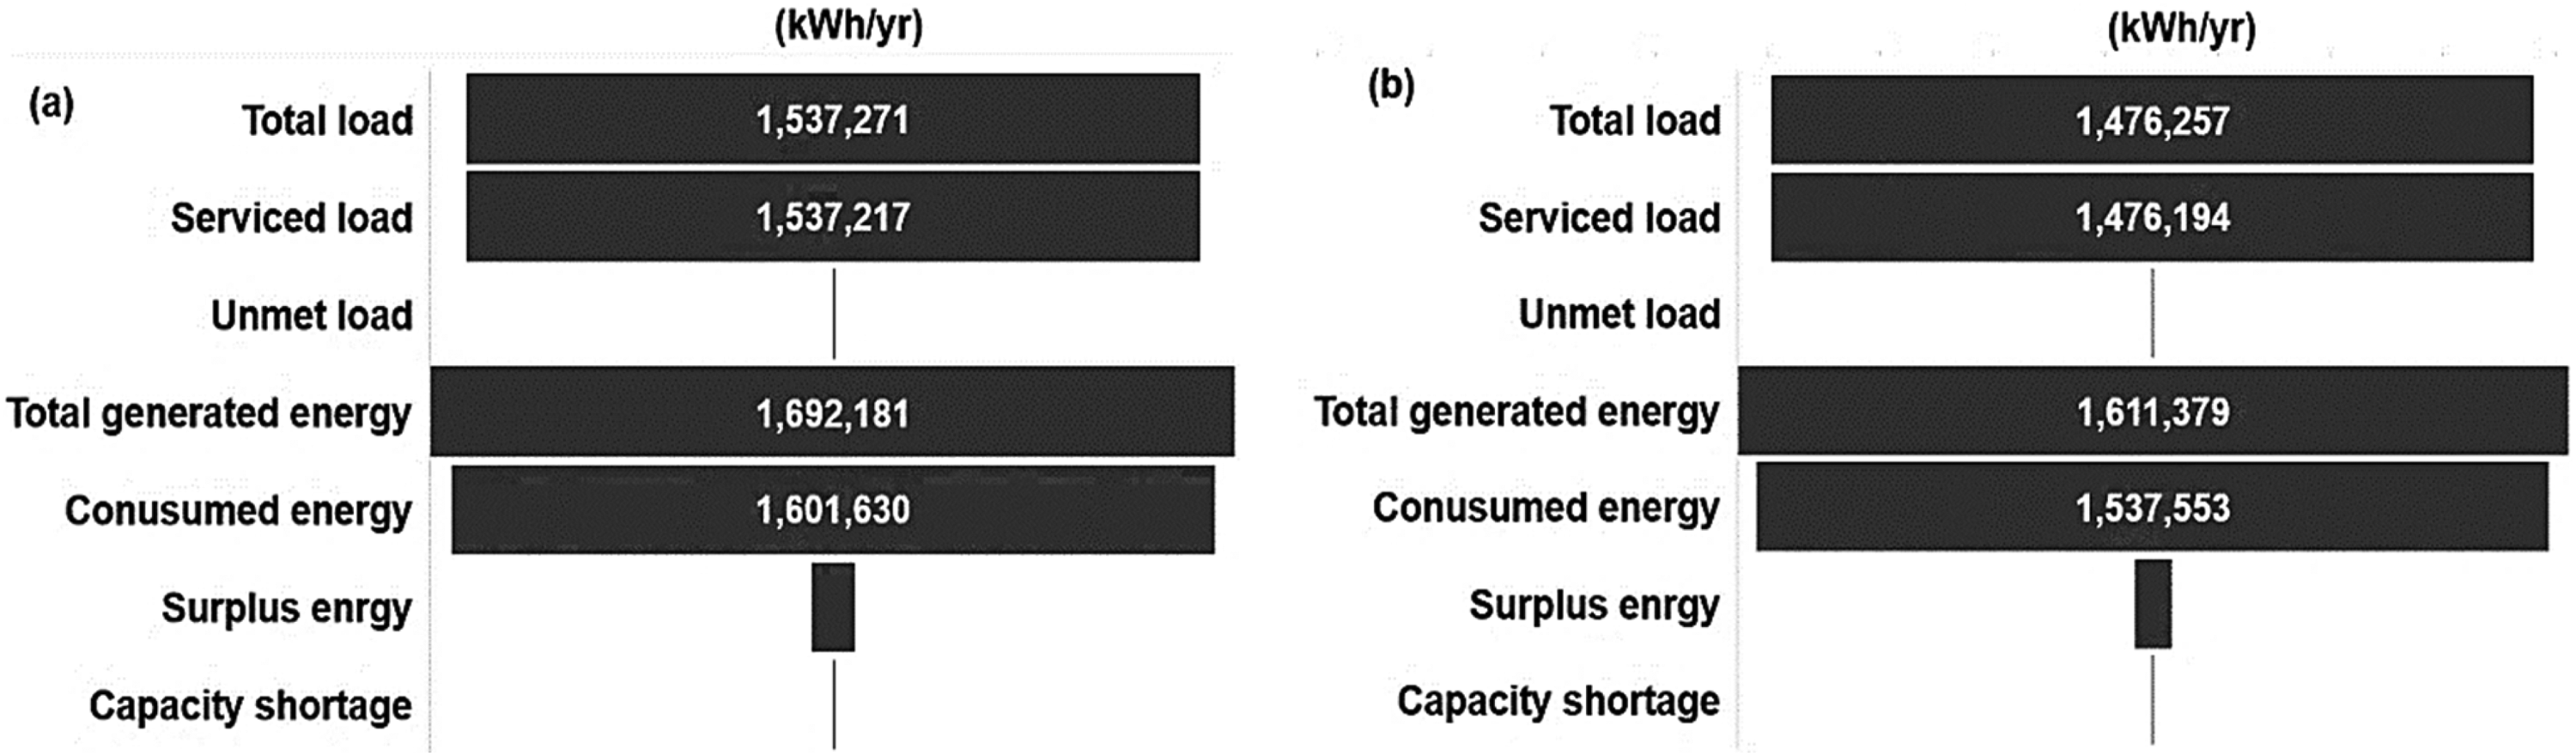
Energy contribution of the optimal systems under (a) LF and (b) CC dispatch strategy.
Sensitivity analysis
The minimum state of charge (SOCmin) is the lowest allowable battery charge level, expressed as a percentage of total capacity, to protect battery life and ensure reliability. Typically set between 20% and 50%, it balances longevity and energy availability. This study uses a SOCmin of 20%, maximizing battery use while preventing over-discharge.
Sensitivity analysis on SOCmin variation
Figure 18(a) and (b) presents a comparative analysis of the impact of SOCmin fluctuations on the economic performance of tracker-based systems under CC and LF control strategies. A 50% increase or decrease in SOCmin results in elevated NPC for both systems. Higher SOCmin values reduce battery capacity, necessitating greater reliance on BG, DG, and PV sources, which in turn increases fuel consumption, operational, and replacement costs, contributing to the NPC increment. The HMA-based hybrid system under CC control exhibits the highest sensitivity to SOCmin variations, while the DA-based hybrid system shows the least sensitivity. Additionally, HVA-based systems with CC controllers demonstrate the greatest dependence on SOCmin for energy costs, whereas DA-based systems with LF controllers are the least affected.
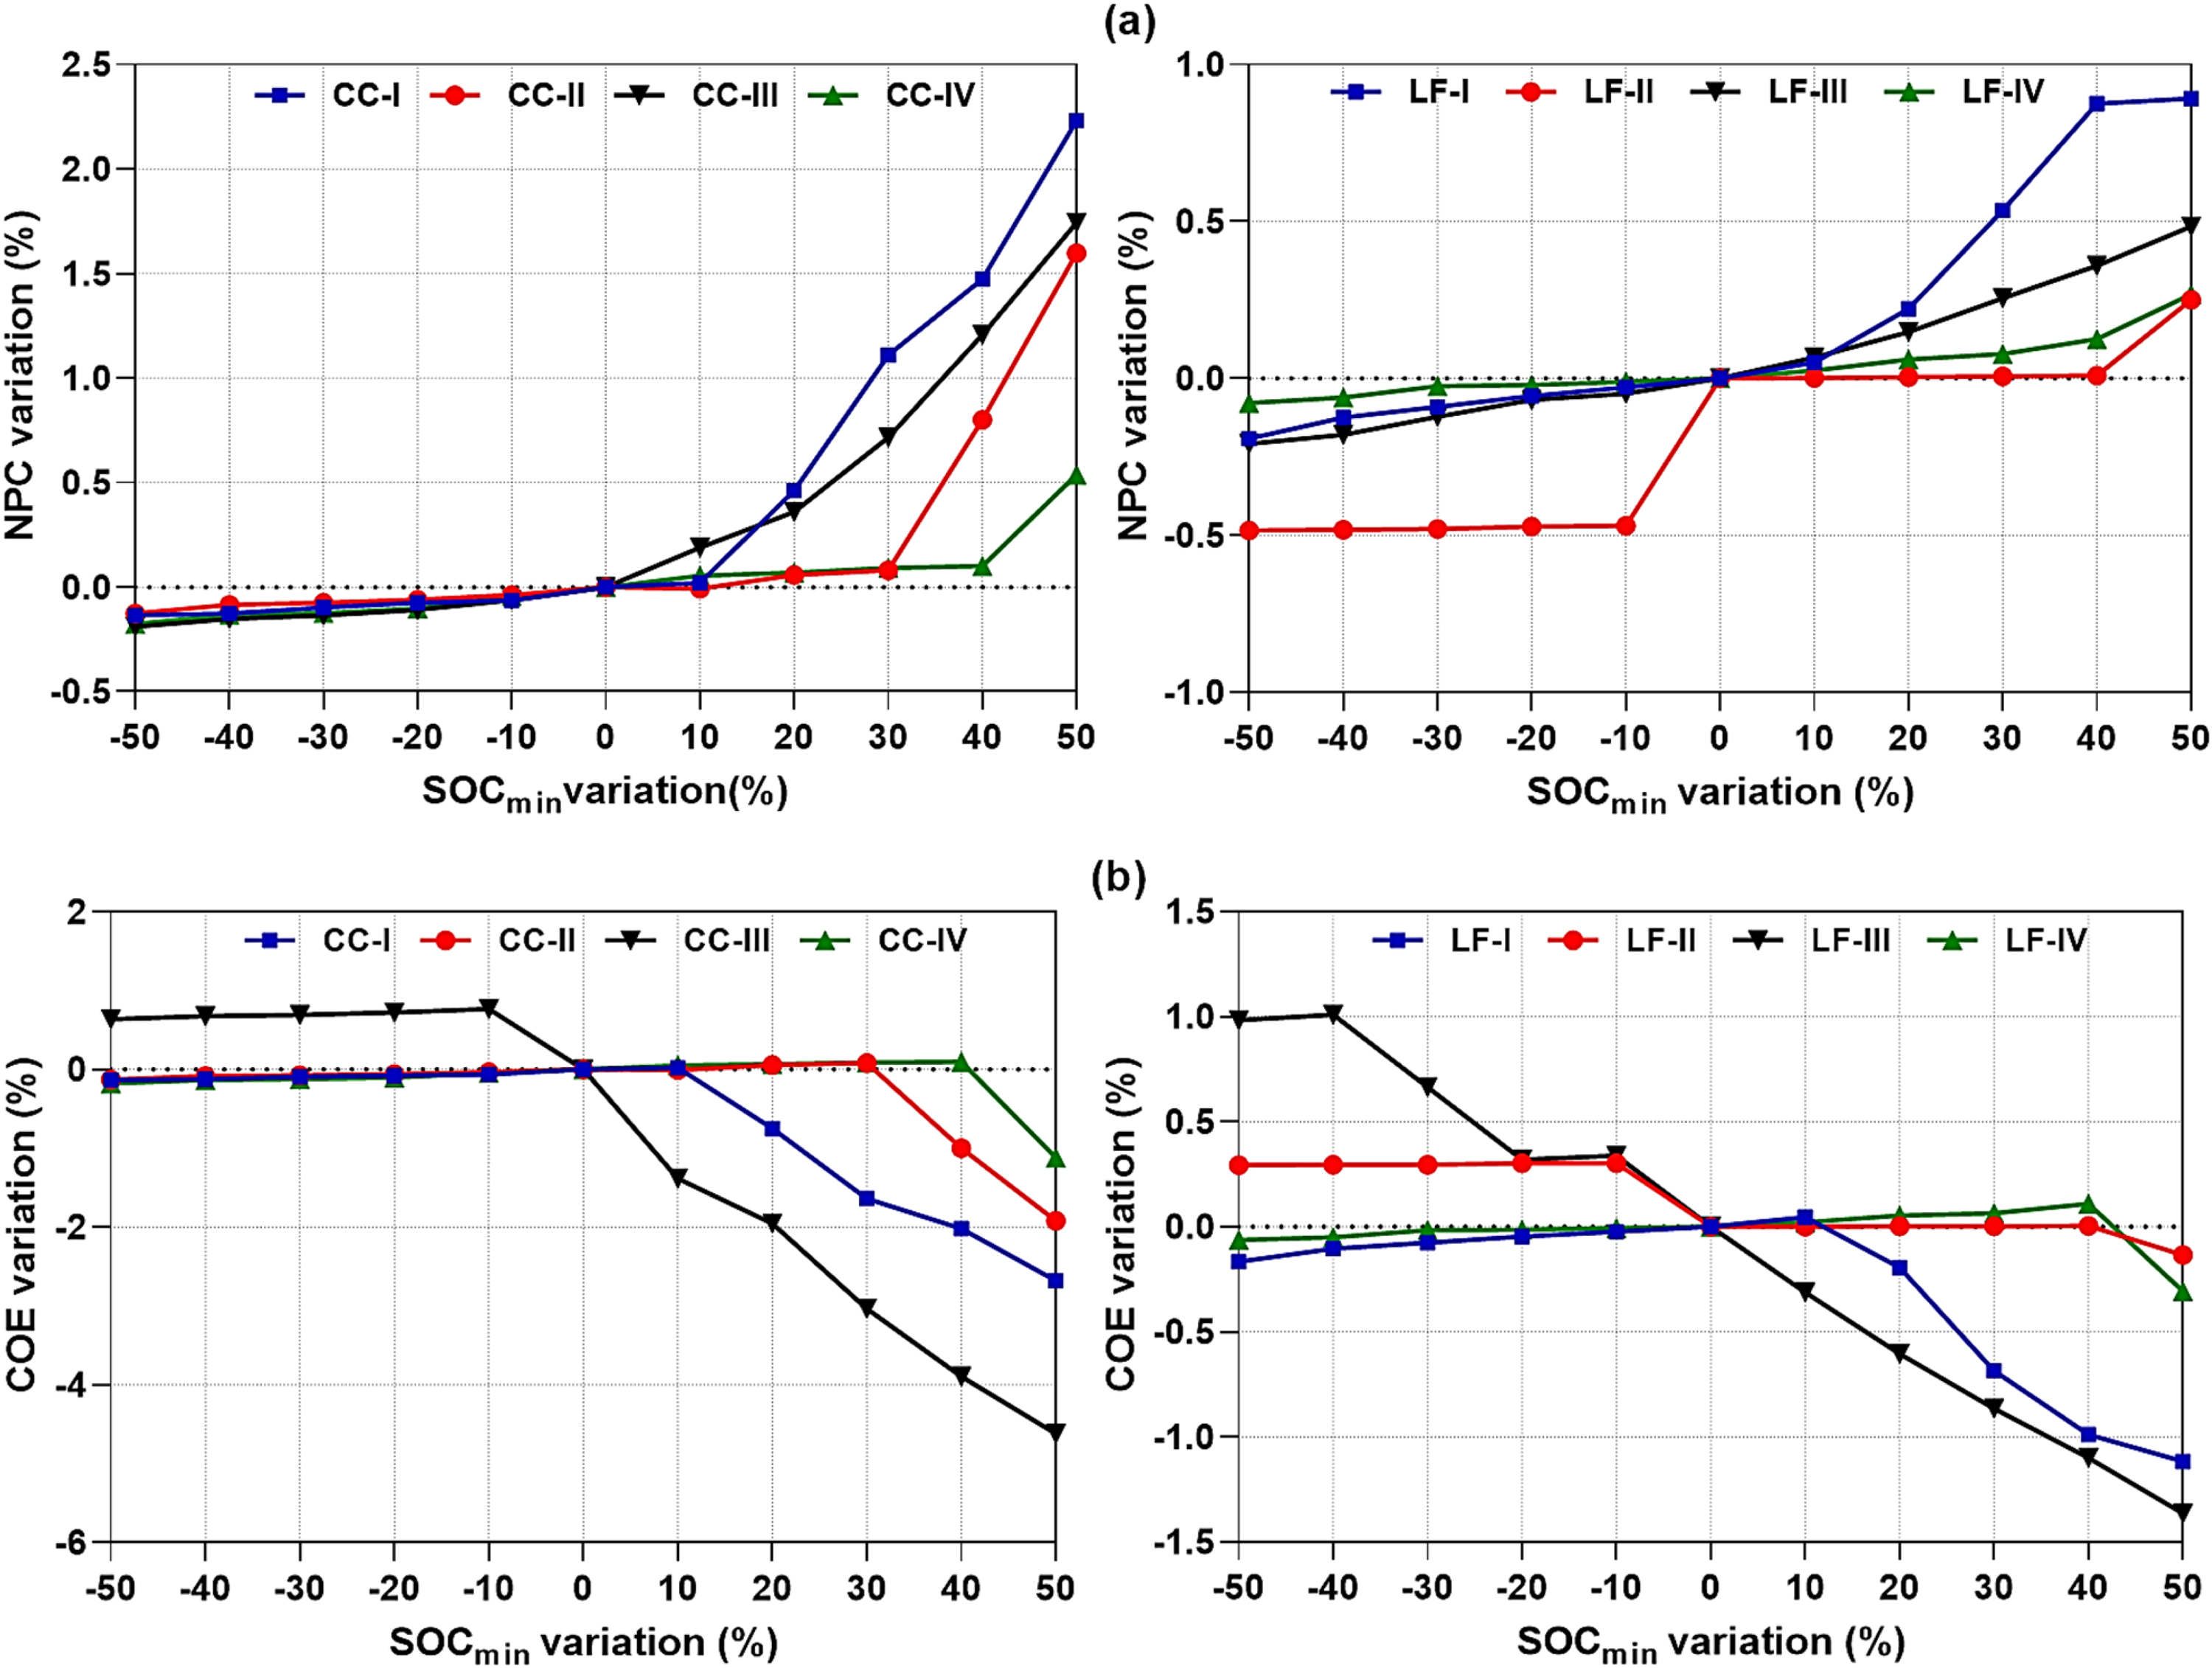
Impact of SOCmin on (a) NPC and (b) COE of optimal cases in both dispatch strategies.
Sensitivity analysis on load variation
The economic performance of proposed autonomous hybrid energy configurations, measured through metrics such as NPC and COE, is heavily influenced by the site's annual load profile. Figure 19(a) and (b) illustrates how variations in load demand impact NPC and COE under both control strategies. Increased load demand drives the need for larger storage capacities, higher operational and maintenance costs, expanded PV arrays, and extended operating times for gasifiers and diesel generators, leading to a rise in NPC. Despite this increase, the higher energy production reduces the COE under both control strategies. Among influencing factors, power demand changes exert a greater impact on economic metrics than variations in the minimum state of charge. The system employing HMA technology under the cycle charging (CC) strategy demonstrates the highest sensitivity to load fluctuations, with NPC varying significantly for load changes of ±50%. As shown in Figure 19(a), NPC increases steeply with load growth, particularly for systems with HMA (CC-I). In contrast, for cost of energy (COE) variations shown in Figure 19(b), the largest reductions are observed in HVA-based systems (CC-II), where COE drops by nearly 80% for a 50% decrease in load. DA systems (CC-IV) exhibit the smallest sensitivity to load changes, maintaining relatively stable COE values under both CC and load following (LF) strategies.
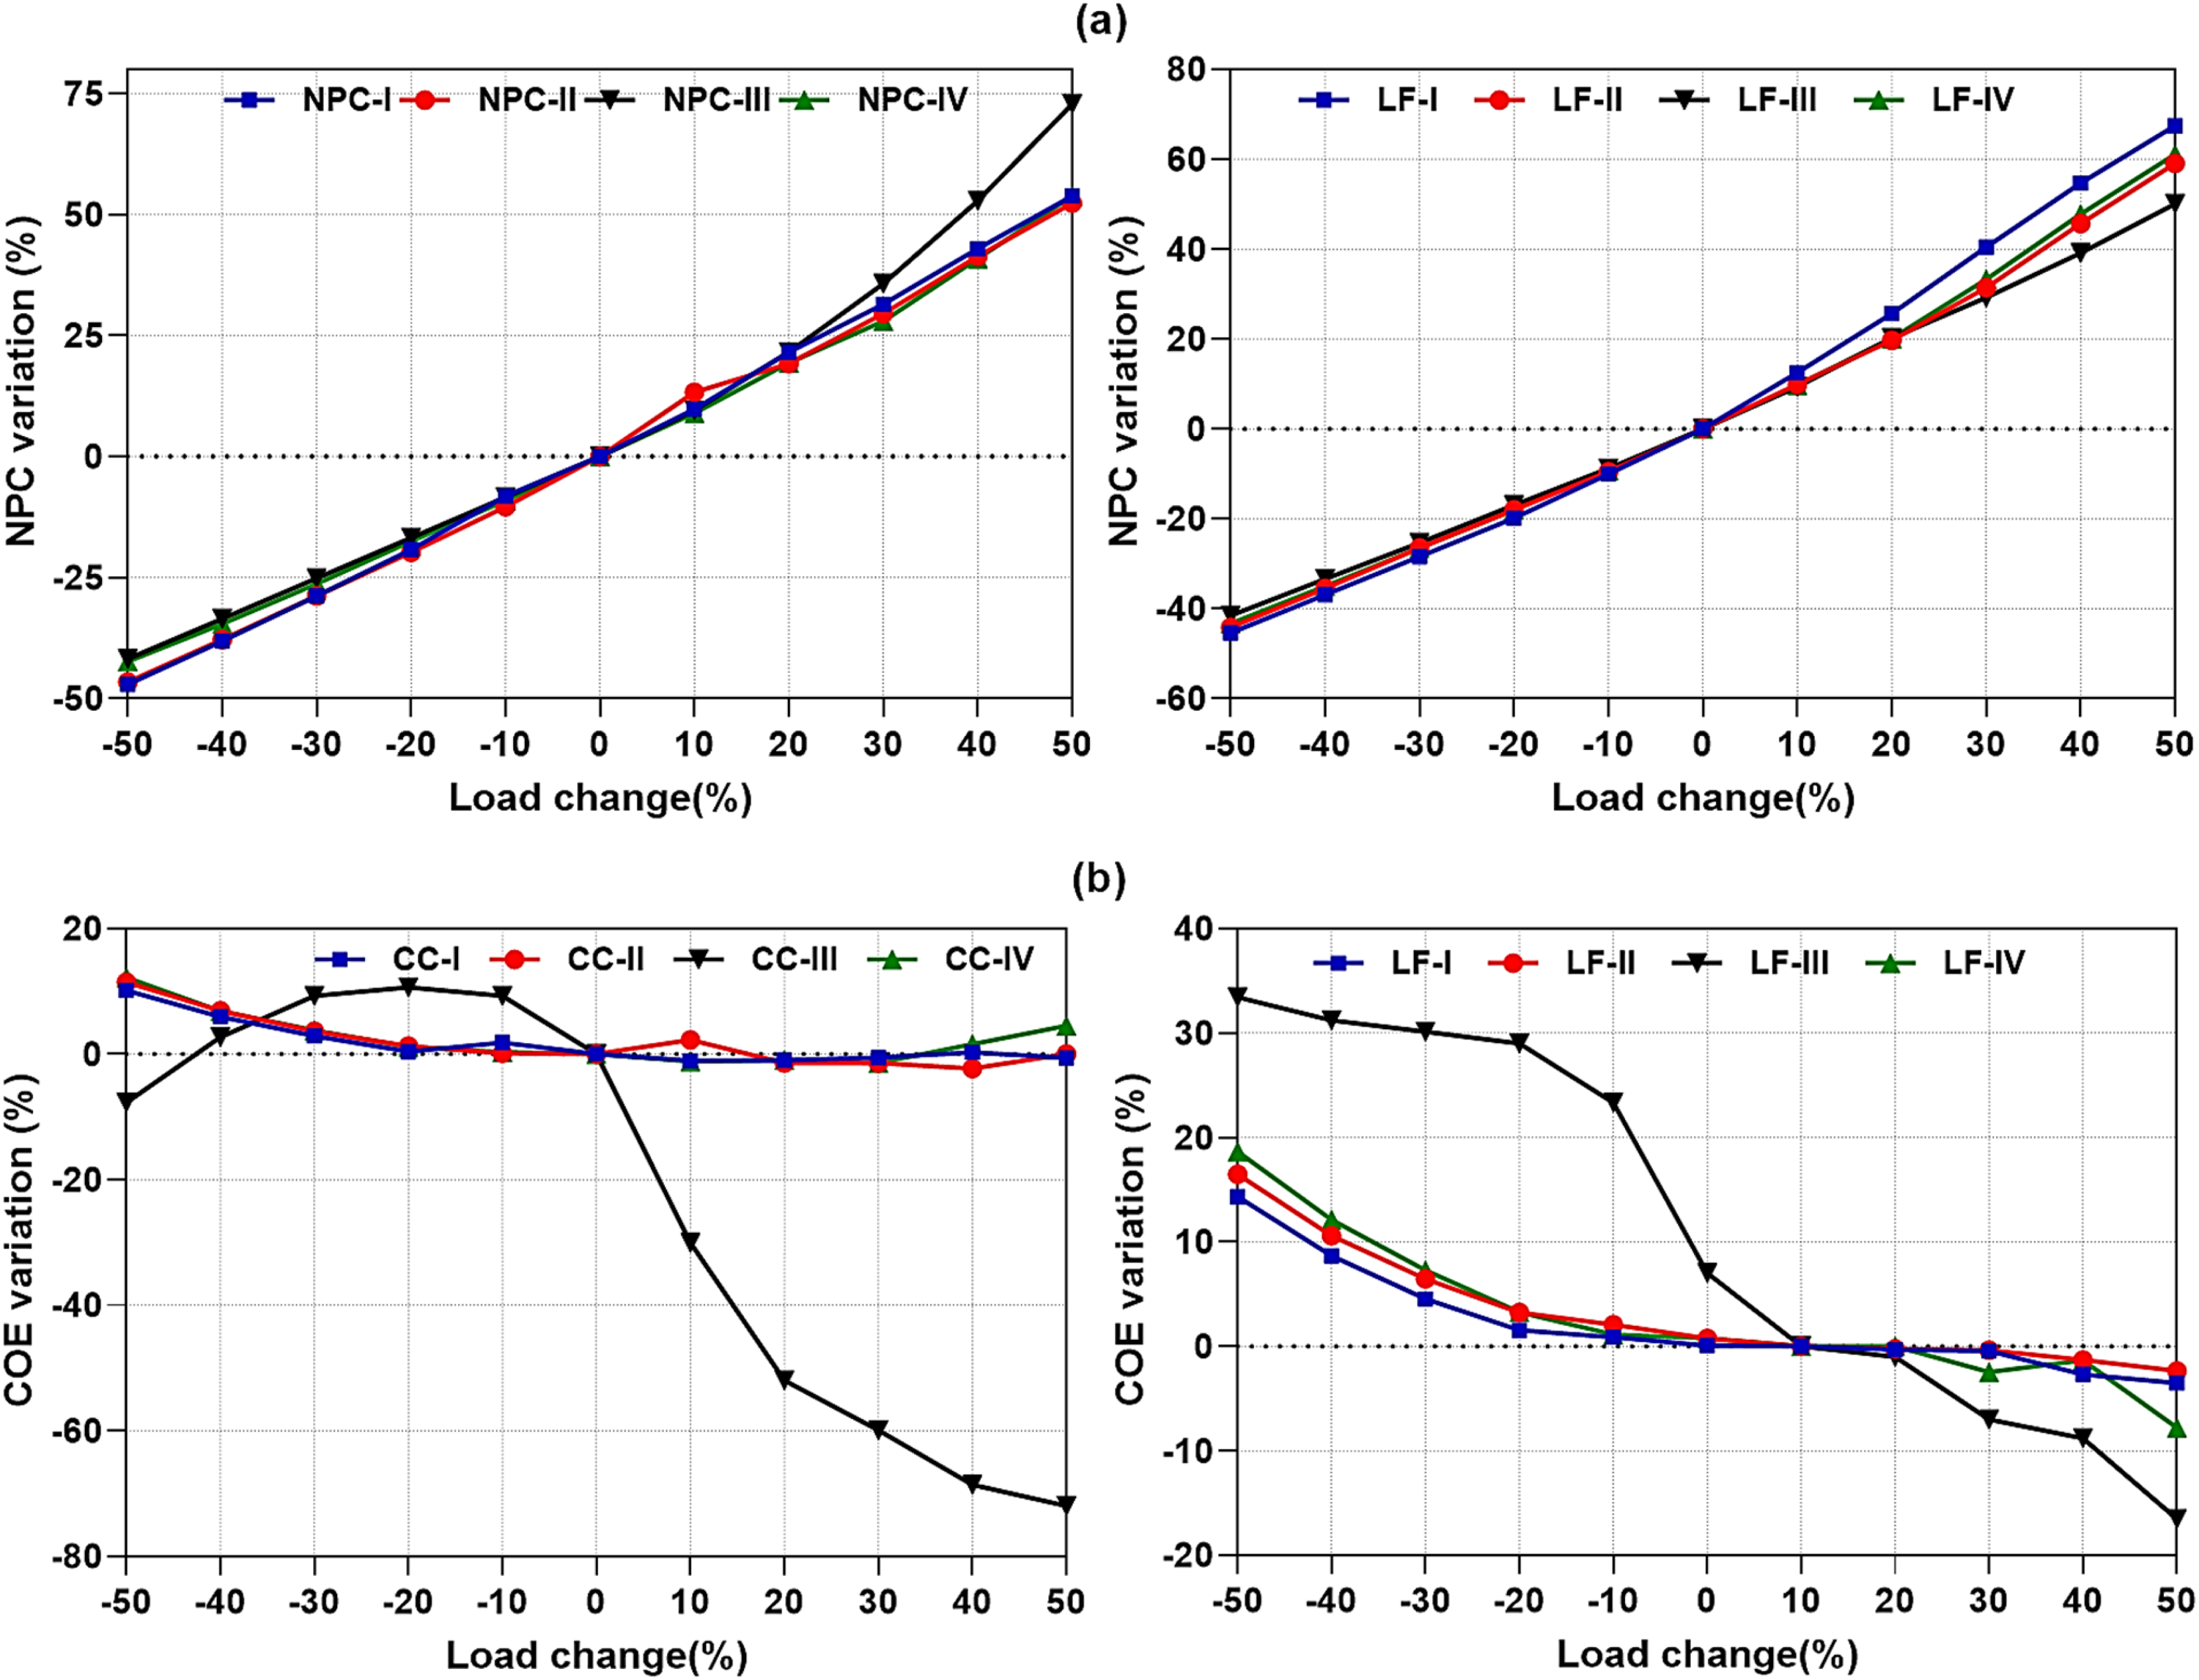
Impact of load growth on (a) NPC and (b) COE of winning systems.
Sensitivity analysis on capital cost multiplier of each tracking system
Figure 20(a) and (b) illustrates the relationship between the COE and variations in the capital cost multiplier for PV tracking systems across CC and LF dispatch strategies. The COE increases proportionally with the capital cost multiplier for all tracking technologies. Among the scenarios, DA (Scenario IV) systems exhibit the highest COE, with values reaching $0.164/kWh (CC) and $0.166/kWh (LF) at a capital cost multiplier of 1.5. In contrast, VCA (Scenario III) systems consistently demonstrate superior cost-effectiveness, with the lowest COE values of $0.0764/kWh (CC) and $0.0759/kWh (LF) at a multiplier of 0.8. To achieve comparable COE values, DA systems require a cost reduction of approximately 41% for CC and 43% for LF when compared to VCA systems. The results indicate that HMA (Scenario I) and HCA (Scenario II) systems perform moderately, with COE values ranging from $0.118/kWh to $0.181/kWh (CC) and $0.116/kWh to $0.184/kWh (LF), depending on the capital cost multiplier. These findings highlight the economic advantages of VCA systems and the significant cost reductions required to make DA systems competitive across both dispatch strategies.
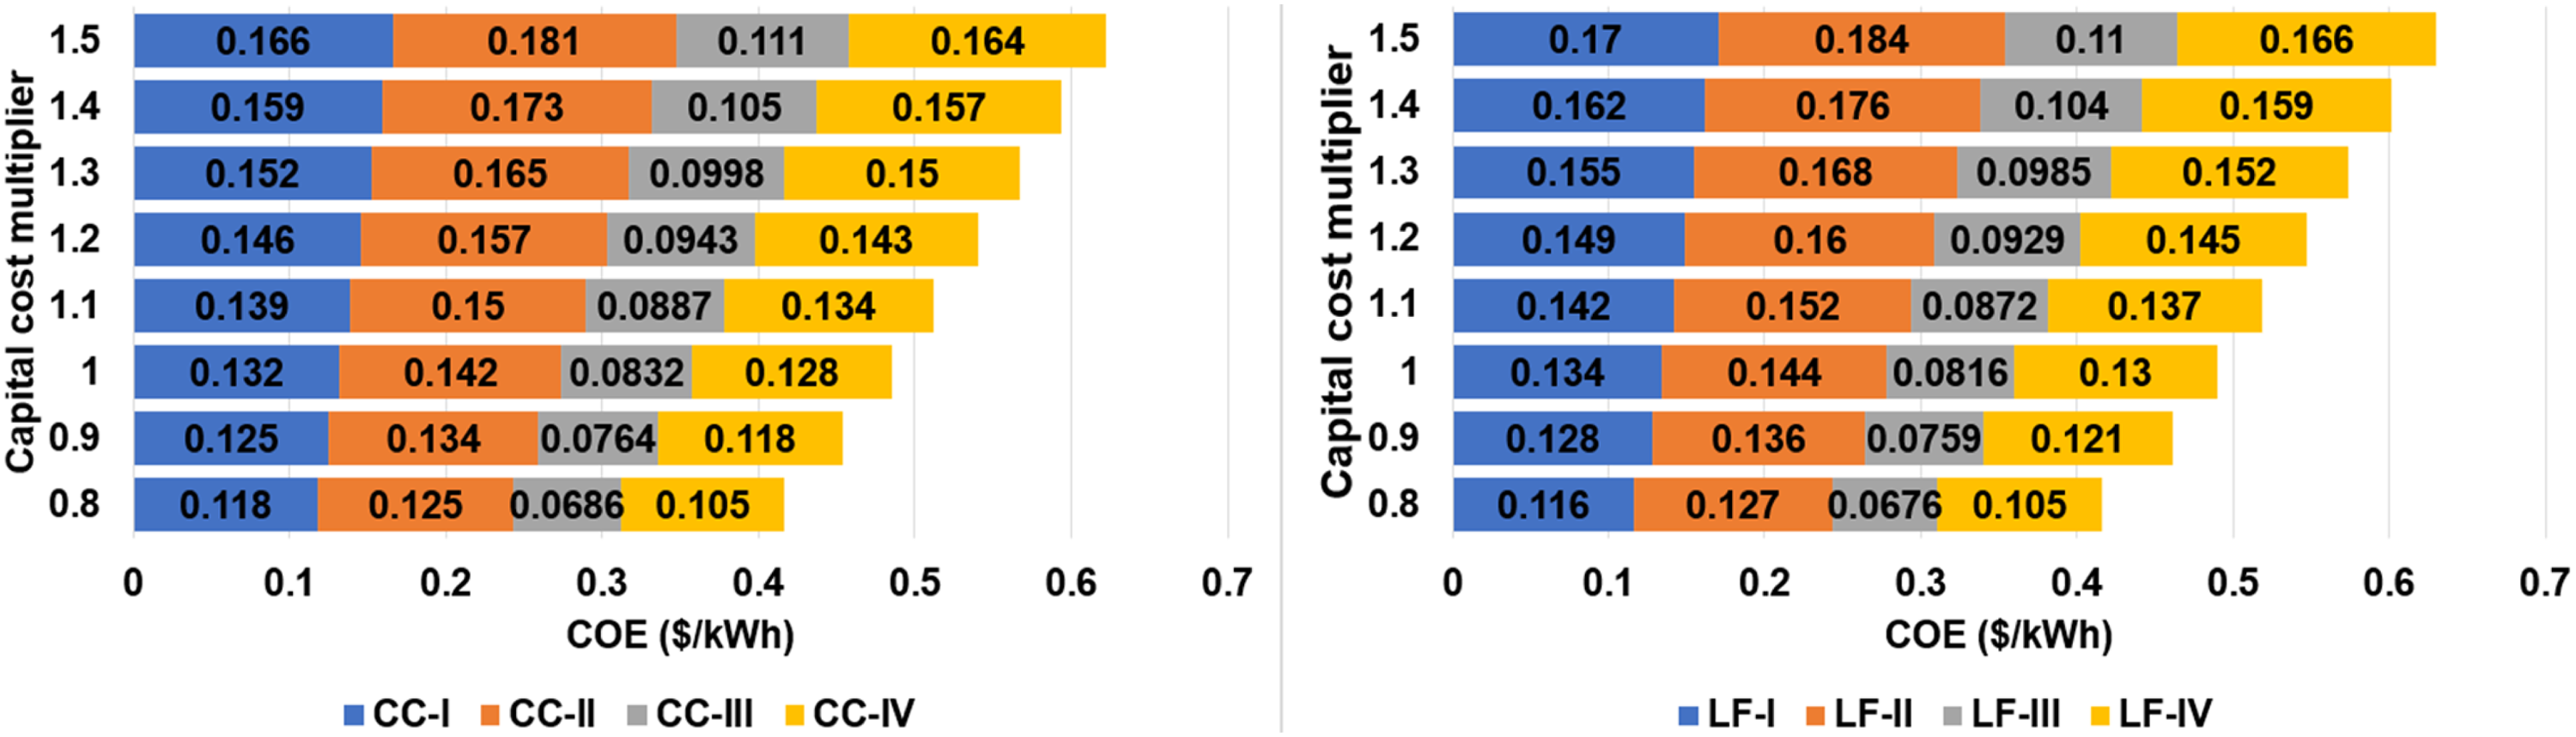
Variation of COE versus initial costs of trackers under two dispatch strategies.
Sensitivity analysis on albedo
Pelee Island experiences significant seasonal changes, with grass-covered ground in summer transitioning to snow-covered terrain in winter. This study evaluates the impact of ground reflectance (albedo) on the cost and efficiency of PV systems, as albedo measures the reflectivity of a surface, including sunlight reflection. Figure 21(a) and (b) demonstrates that higher albedo values, such as those from snow, enhance solar irradiation on PV arrays, improving energy output while reducing required PV capacity and renewable fraction (RF) in both CC and load following (LF) modes. However, LF-based systems are more sensitive to albedo variations compared to CC-based systems. Among these, LF-based horizontal vertical axis (HVA) and horizontal monthly adjustment (HMA) trackers exhibit the most significant reductions in PV capacity and RF. Increasing albedo also lowers net present cost (NPC) and energy costs, with dual-axis (DA) systems being the most sensitive due to their higher initial costs, leading to the largest reductions in energy and costs under both CC and LF modes. The study concludes that an albedo of 60%, typically associated with snow cover, provides the best results due to its high reflectivity. However, considerations such as wind and snow damage must be addressed when designing PV systems for high-albedo conditions (Figure 22).
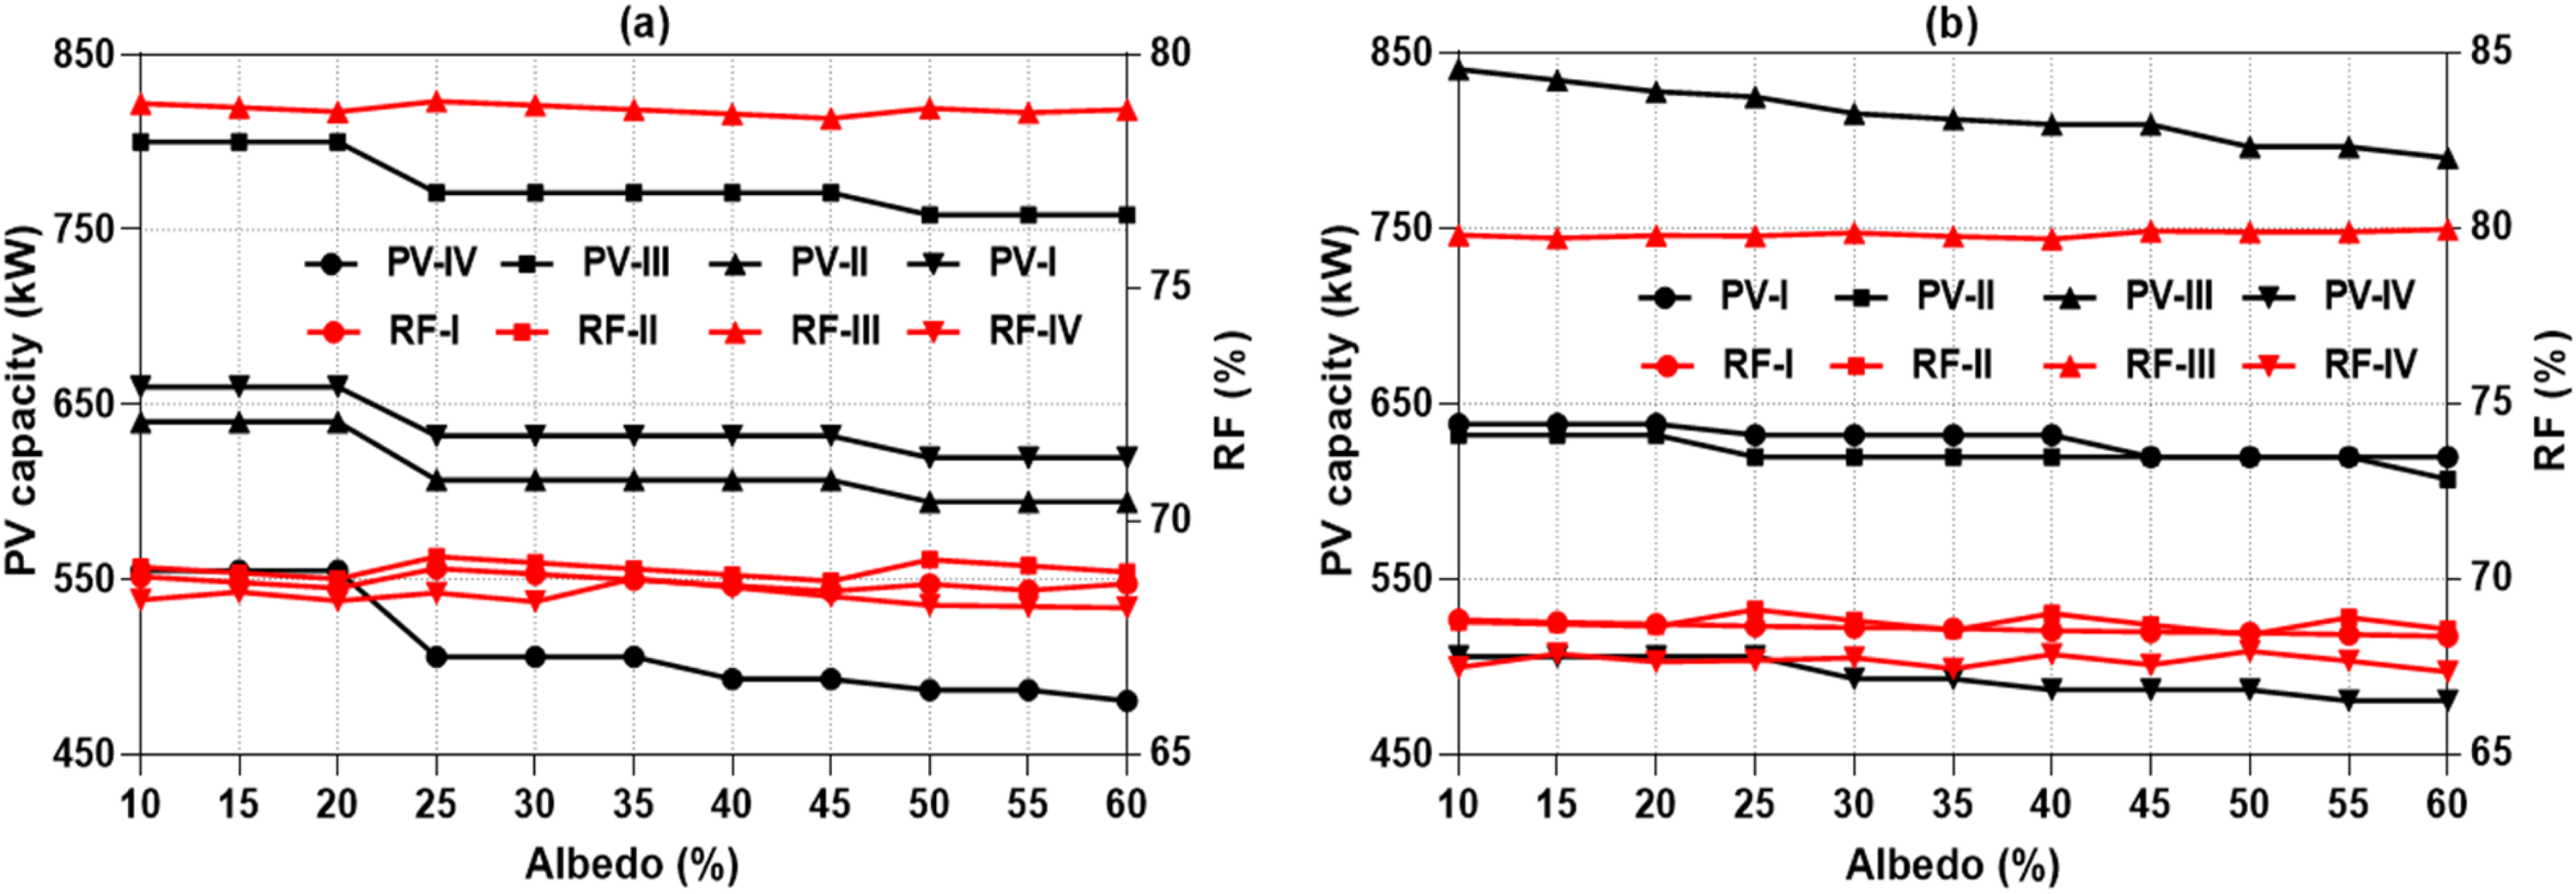
Effect of the albedo versus PV capacity and the renewable fraction of each tracker in (a) CC and (b) LF dispatch strategies.
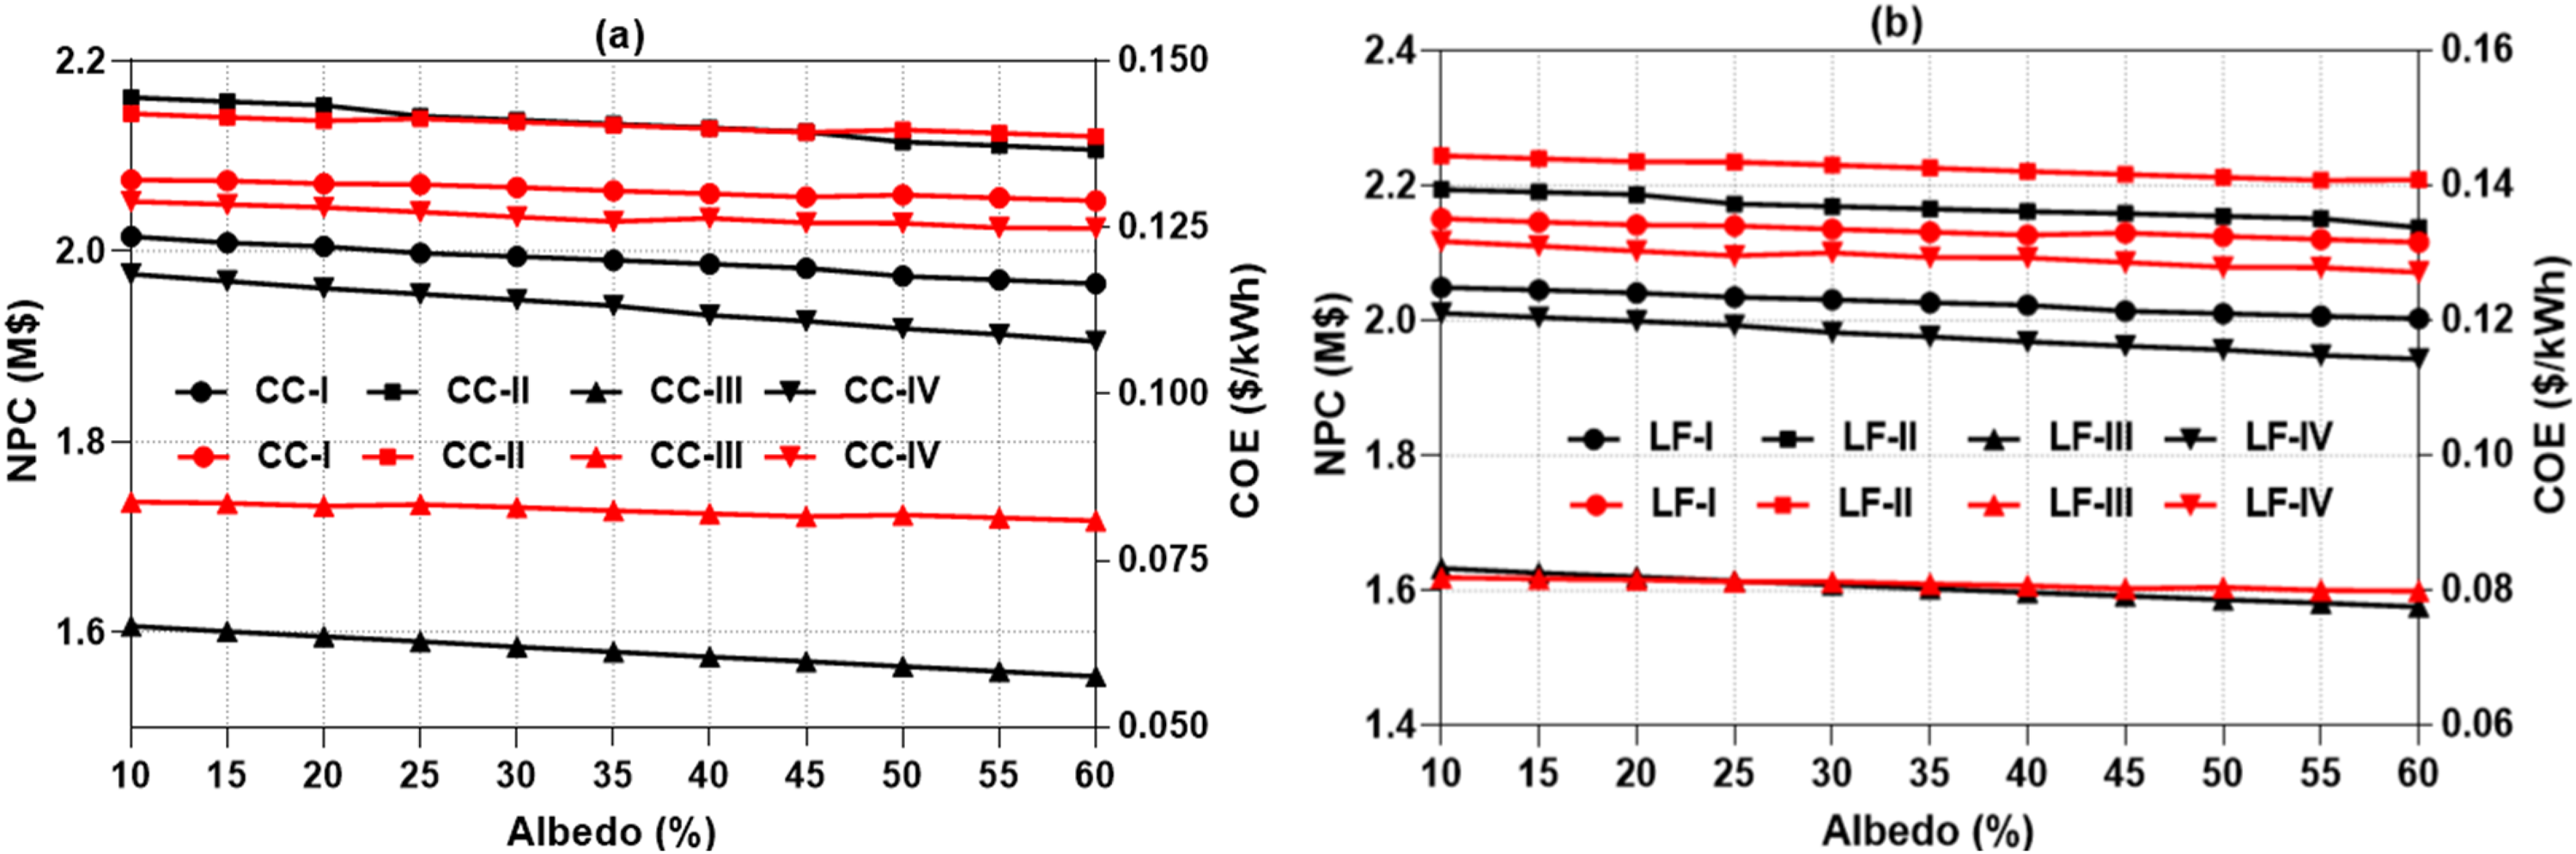
Effect of the albedo versus NPC and COE of each tracker in (a) CC and (b) LF dispatch strategies.
Assessment of model accuracy compared to relevant studies
The suitability of tracker technologies across diverse global locations can be better understood by comparing optimal tracker-based designs with insights from academic literature. However, using the net present cost (NPC) alone as a benchmark can be misleading, as NPC varies significantly based on factors such as local tracker costs, energy demand, and renewable resource availability. Instead, a more reliable approach is to evaluate the NPC growth rate across different tracker systems and analyze their optimal configurations. Table 9 summarizes the findings, showing that vertical-axis PV trackers (VCA) frequently emerge as the preferred option for efficiently meeting energy requirements in most locations. For example, in Eight Iranian Cities, the VCA system shows an almost negligible NPC growth rate of 0.70%, while in Alkharj City, Saudi Arabia, VCA still dominates but with a significantly higher NPC growth rate of 84%. Similarly, in Concordia University, Canada, VCA systems deliver optimal results with a growth rate of 16.14%, compared to the dual-axis tracker (DAT) at 17.70%.
Comparison of the present results with literature findings.
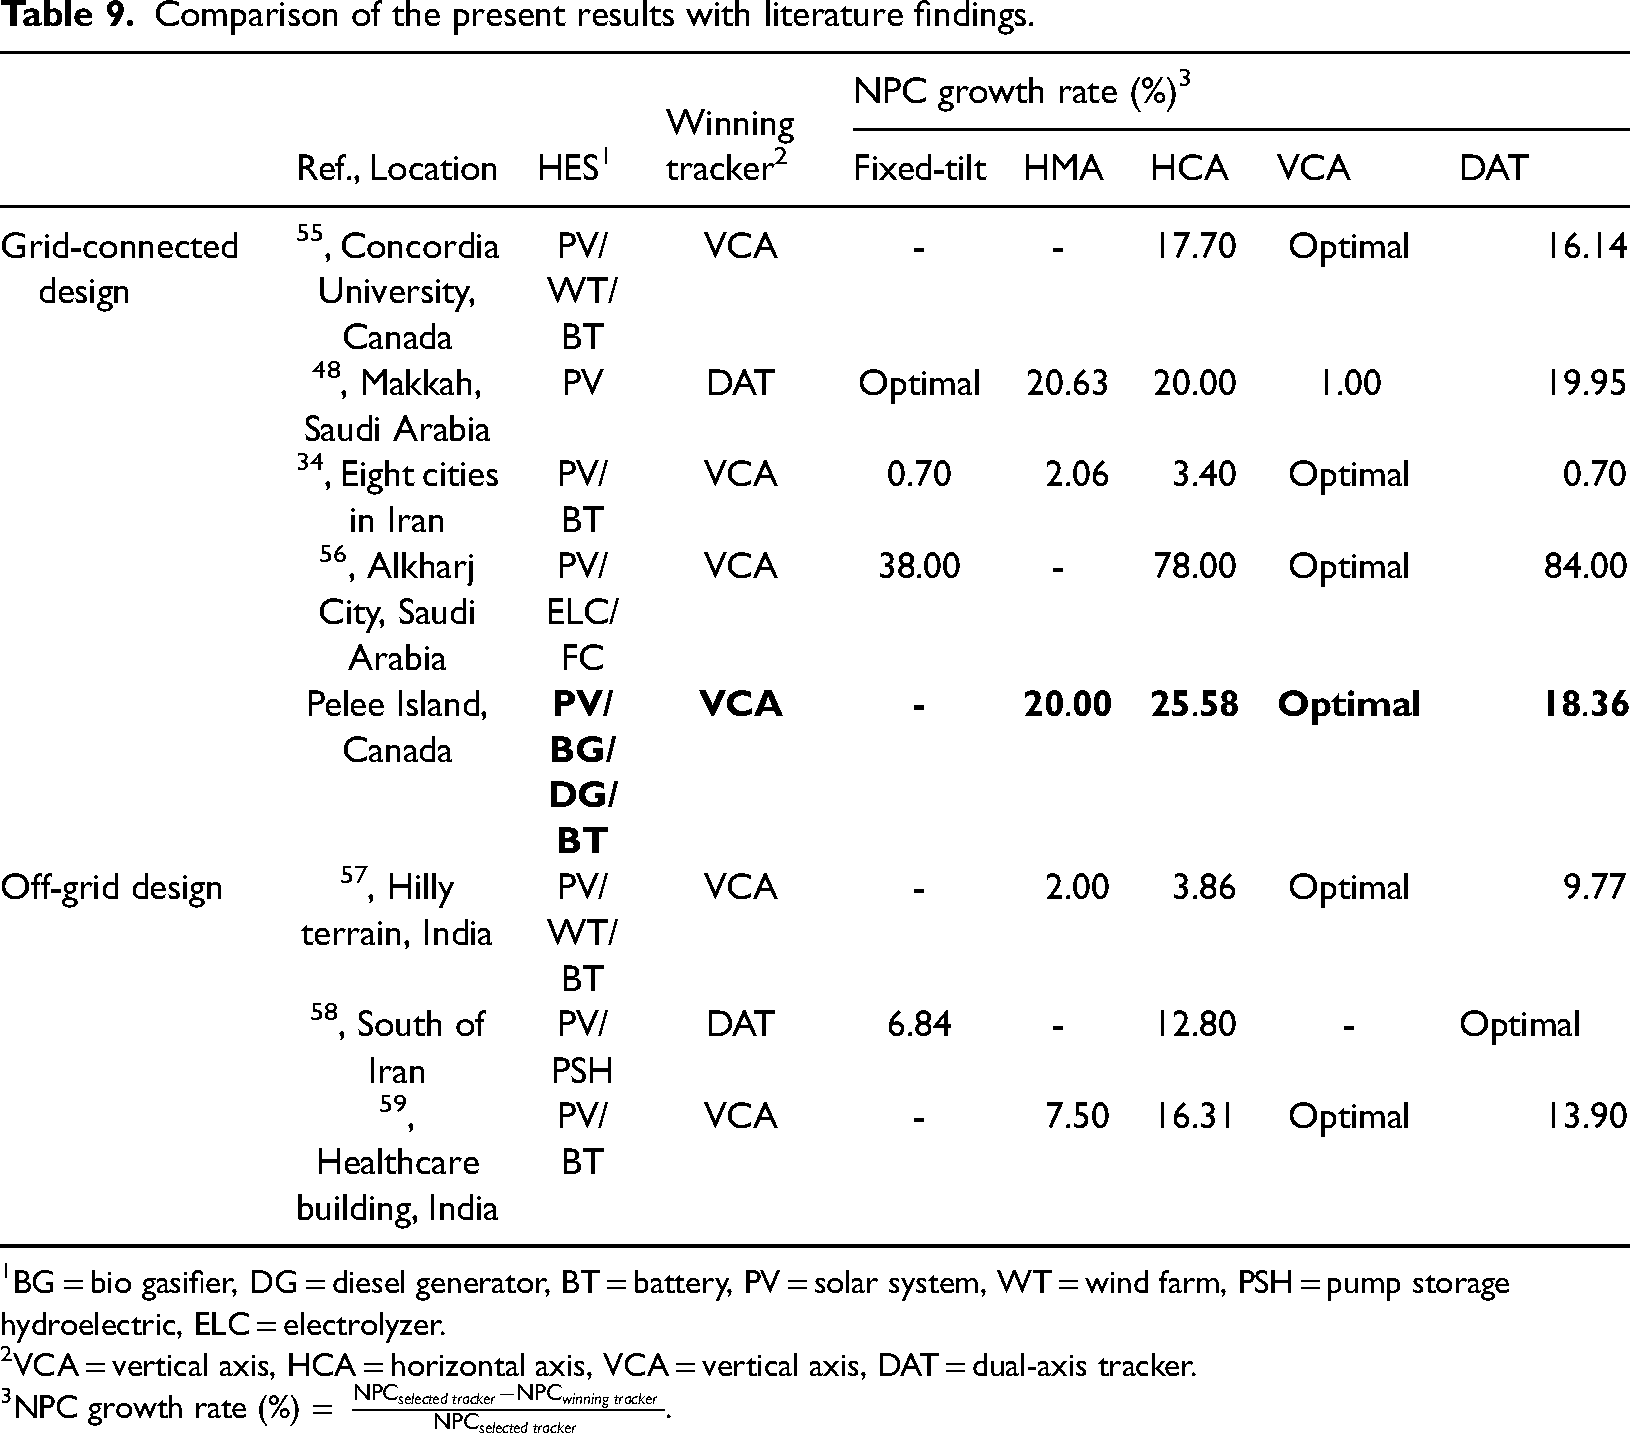
BG = bio gasifier, DG = diesel generator, BT = battery, PV = solar system, WT = wind farm, PSH = pump storage hydroelectric, ELC = electrolyzer.
VCA = vertical axis, HCA = horizontal axis, VCA = vertical axis, DAT = dual-axis tracker.
NPC growth rate (%) =
This study's findings are consistent with past research but also reveal important nuances. For instance, in Pelee Island, Canada, while VCA remains the most cost-effective choice with an NPC growth rate of 18.36%, horizontal-axis configurations (HMA and HCA) show slightly higher growth rates of 20.00% and 25.58%, respectively. This suggests that while VCA trackers are generally superior, climate-specific factors in Canadian regions could make DAT systems a viable alternative. In contrast, arid regions like Makkah exhibit a preference for DAT, where its NPC growth rate of 20.63% is slightly better suited to the local solar potential than the VCA system's 19.95%. These comparisons validate the current study's approach of evaluating NPC growth rates to identify optimal tracker technologies tailored to local conditions, reinforcing that a one-size-fits-all solution is not viable. Tailored analyses considering both NPC values and growth rates ensure practical, region-specific recommendations.
Conclusions
The primary objective of this research was to conduct a comparative analysis of different solar tracking technologies employed by households in Pelee Island, Canada. The research was carried out by evaluating four distinct scenarios that used various tracking configurations, all to provide a daily power supply of 2426.4 kWh. These setups relied on PV panels, generators, gasifiers, the central grid, and batteries to generate electricity. Subsequently, all the options were assessed, taking into account environmental, technical, and financial considerations. The study then determined the most cost-effective and high-performing solution based on each tracker-based approach's net present cost (NPC). A sensitivity analysis was conducted to ensure that the outcomes could be broadly applied to different economic and technical circumstances. The following are the findings of this investigation, based on the assumptions stated above:
The study determined that the optimal scenario for the energy system was the CC-based HES. This system includes 776 kW photovoltaic modules with a VCA tracker, a 50 kW gasifier, a 120 kW DG, a 583 kW converter, and 73 units of 1 kWh Li-Ion batteries. Compared to the LF-controlled optimal case, the CC-based system offers several benefits. It has a lower NPC of approximately $0.02 M, a reduction of around $0.002/kWh in the COE, and a 7.6% decrease in RF. The VCA-based solution, when operated with an LF controller, obtained the highest RF at an impressive 86.3%. Conducting a sensitivity analysis centered around the SOCmin unveiled the instances most affected by SOCmin fluctuations: NPC of HMA and COE of HVA-based trackers under the CC dispatch strategies. The highest and lowest reductions in energy costs were observed in the HVA and DA trackers, respectively, both controlled by the CC strategy. The variability of albedo has been found to have a greater impact on LF-controlled systems compared to CC-controlled systems. An albedo of approximately 60% produces the most favorable outcomes. Furthermore, a higher albedo has been observed to reduce PV capacity and RF values in LF-based systems equipped with HVA and HMA tracking options, respectively.
Footnotes
Declaration of conflicting interests
The authors declared no potential conflicts of interest with respect to the research, authorship, and/or publication of this article.
Funding
The authors received no financial support for the research, authorship, and/or publication of this article.