
Abstract
A grid-connected photovoltaic (PV) system with interleaved inverter using a hybrid approach is presented in the paper. Generally, high deviation of DC voltage causes severe damage to the grid-linked system generate power quality issues. Therefore, a hybrid technique called LA-HBO, which is a combination of Lichtenberg optimization algorithm (LA) and heap-based optimizer, is proposed. The proposed method works with the interleaved inverter to realize a multifunctional operation and improve the power quality efficiency of the system. Here, LA techniques improve the power generated from PV and self-charging of the DC-link voltage control loop. The reference current signal is generated through the self-charging DC-link voltage control loop to eliminate the power quality issues. The double band hysteresis current controller generated a minimum switching frequency to provide low switching losses. A MATLAB platform is utilized to implement the proposed system, and the performance of the system is compared with other existing techniques. The test result validated that the proposed system can able to perform multilevel functions and produce power with high quality compared to other techniques. The value for the THD that achieves the proposed hybrid technique is 21.22%. The elapsed time of the proposed hybrid technique is 2.09 seconds.
Keywords
Introduction
In recent days, the need for unconventional energy resources is increasing based on the continuous depletion of conventional resources. The photovoltaic (PV) system, wind power, and tidal energy are considered as unconventional energy resources.1,2 In unconventional energy resources, the PV system is the most chosen one due to its adaptability, availability across the world, and easy installation process. The maintenance of the PVs is very cheap. Due to these characteristics, many governments around the world give subsidies to admire people who install PV energy on the roof of its house. Therefore, solar panels are installed in many private companies and government buildings. From these installed PV plants, electricity is generated and given to the local grid.3,4 The power consumed by the customer and the power given to the grid are determined by the net metering specialty developed by electricity distributors. Generally, an inverter is utilized to feed the grid by the PV.5,6 Voltage source inverter is one with simple construction, development, and control.7–9 So it is the most preferable inverter. Even though, the conventional VSI has different limitations such as shoot-through problems. When the power switch of voltage source inverter (VSI) is in ON or OFF condition, and two switches of the same leg come close because of the delay in turning on the switches causes the shoot-through problem. Burning power switches happen because an enormous current flow takes place through the switches at a short duration time.
The shoot-through problem is neglected by inserting the dead band circuit to generate dead time among inverter power switching on the same leg for safe operation. The entire VSI power circuit10,11 is influenced by the enormous amount of power flow caused by the dead band circuit failure. 12 Hardware experiments probably do not support the introduced system. In the introduced system, the interleaved inverter is employed in wind energy conversion systems and uninterruptible power supplies. The efficiency of the PV system is calculated based on the tracking capacity of the MPP in conditions of solar isolation.13,14 The Perturb and Observe (P&O) maximum power point tracking (MPPT) algorithm has less complexity in the execution of low-cost digital signal processing (DSP) controllers. 15 The shunt APF is used in the process of eliminating power quality issues such as harmonics, excessive reactive power, and low power factor.16–18 The external disturbance present in the grid is the reason behind the disturbance of shunt APF operation. The reference current generation approaches mentioned earlier cannot provide an accurate reference current, which makes the APF unable to ignore power quality issues. 19 There are two closed loops present in the control techniques such as current control and DC-link voltage control loop. The reference current strongly affects the performance of the APF shunt. Simultaneously, reference current generation and harmonic compensation used to manage stability within the condition are influenced by DC-link stabilization. Proportional integral (PI) controllers are simple and reliable and may be executed using low-cost controllers.20–25
Objectives and contribution
A grid-connected PV system with interleaved inverter using a hybrid approach is presented. The proposed LA-HBO system is a combination of the Lichtenberg optimization algorithm (LA) and heap-based optimizer (HBO), and thus it is known as the LA-HBO method. At MATLAB/Simulink working platform, the performance of the proposed system is evaluated with existing systems.
The main innovation of the proposed work is to get the general optimal solution gathered as the search space.
LA techniques improve the power generated from PV and self-charging of the DC-link voltage control loop through double band hysteresis current controller (DBHCC) using the HBO technique.
The performance of the proposed system is accomplished on the matrix laboratory/Simulink working platform and the performance is evaluated with existing systems as particle swarm optimization (PSO), salp swarm algorithm (SSA), wild horse optimizer (WHO), and ladder spherical evolution (LSE)-WHO (LSE-WHO).
The organization of the work is shown in Figure 1.
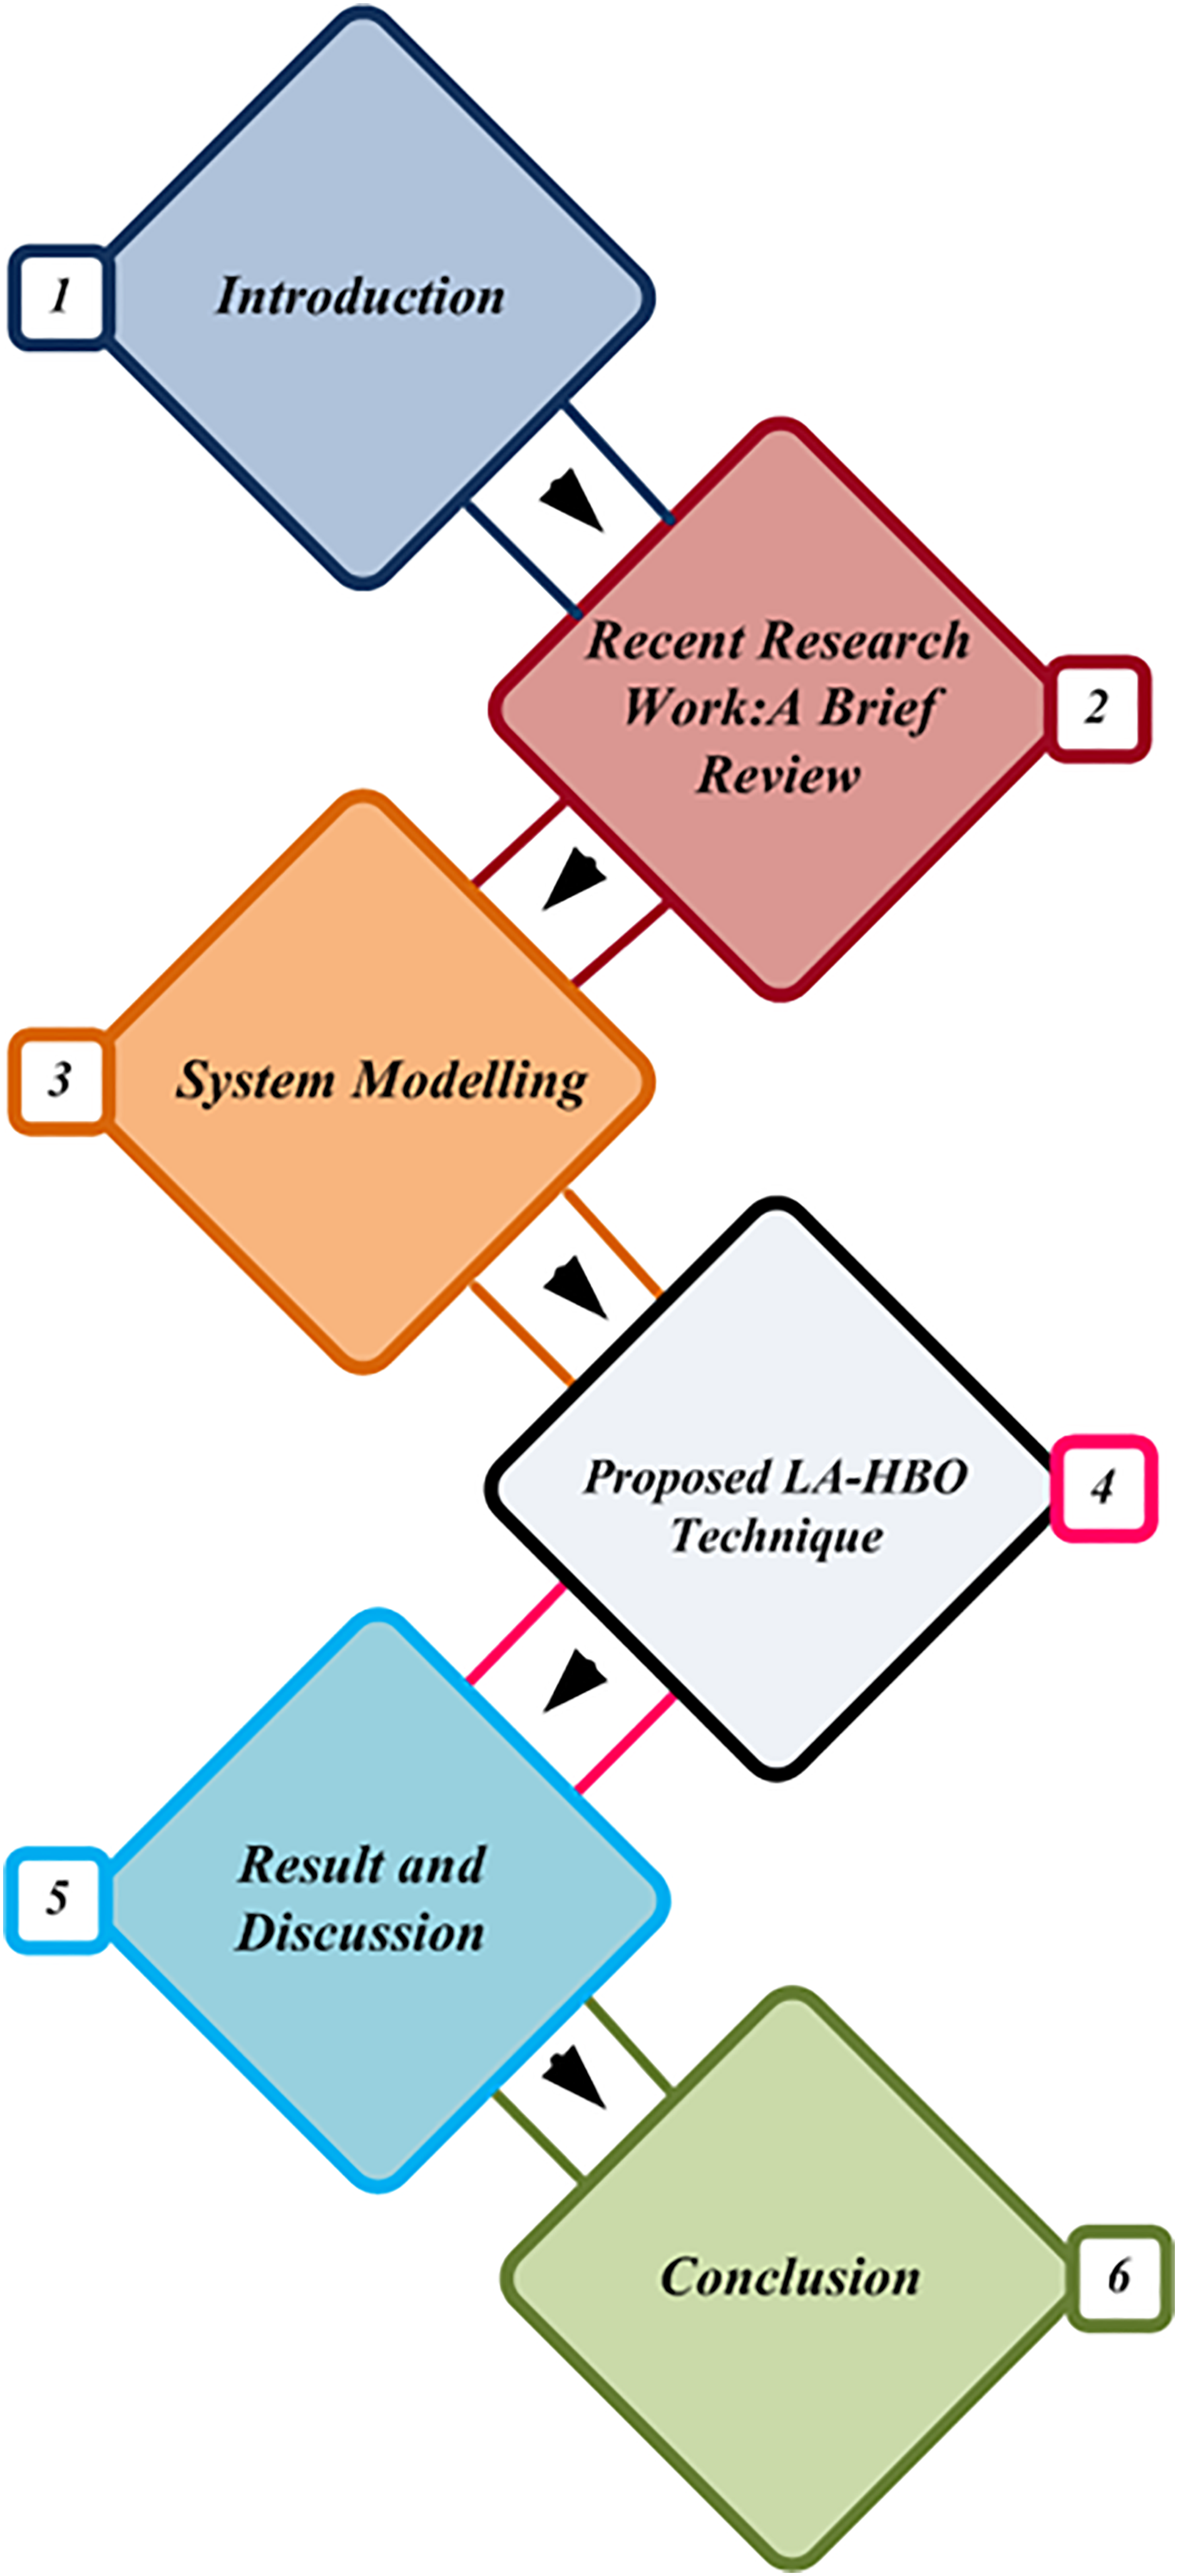
Organization of work.
Recent research works
Several investigation works have earlier existed in the literature that is based on the enhancement of power quality in renewable energy sources with various techniques and features. Some of them are reviewed here.
Sangari et al. 26 have illustrated the design and analysis of single-stage reduced-order sliding mode control (ROSMC)-fed Z-source inverter (ZSI) that uses sinusoidal pulse-width modulation (SPWM) system to improve the quality of output power. ZSI output voltage has been improved by executing the shoot-through mode. The matching method was used by the ZSI-reduced second-order model that was developed as the original sixth-order model. The investigation of the system dynamic response takes place by achieving closed-loop control with the cascade control technique. For outer voltage control, a genetic algorithm (GA) tuned PI controller was employed. The internal current control loop was developed by the sinusoidal reference signal. The result of right half plane zero was minimized by proportional integral derivative (PID) controller adjusted through the internal model control (IMC) and provides shoot-through duty ratio (STDR). Golla et al. 27 have provided a novel control system for the solar PV combined universal active power filter (PV-UAPF). The reference signal extraction for the shunt active filter (ShAPF) and the series active power filter (SeAPF) was achieved through instantaneous power balance theory (IPBT). To remove positive and negative sequence components and the phase angle, the modified reduced-order generalized integrator (MROGI) based on frequency locked loop (FLL) was used at the IPBT control scheme. Therefore, through the proposed system, benefits such as the generation of clean energy and the improvement of energy quality were obtained.
Gupta 28 has implemented the operational effect of distribution static compensator (D-STATCOM) and unified power quality conditioner (UPQC) at a cascaded H-bridge nine-level multilevel inverter (NL:MLI). The performance of the system at constant voltages of 200 V DC was investigated, and a comparative linear road PQ analysis was performed. Here, the control techniques of D-STATCOM and UPQC balance the power needs of the load and utility grid. At the coupling points, the distortionless current voltage was determined. Kumar and Raglend 29 have provided a versatile multi-objective control technique to control the PV microgrid-side multipurpose grid-integrated inverter (µ1G-MPGII). To restrict µG-MPGII, the envisaged system used the implemented synchronous reference frame (SRF) theory. The µG-MPGII was determined for the following concept, such as the investigation of control of real power of the network that depends on state of charge (SOC) of battery and operation to recover the quality of distributed power to ignore the harmonics formed through nonlinear loads at point of common coupling and manage the public grid in a balanced way according to the unbalanced load system. Iqbal et al. 30 proclaimed a novel controller for microgrid-connected UPQC. The UPQC VSC shift was performed by taking the derivative of the error at three dissimilar stages. By switching series or shunt compensators that were triggered by the fuzzy logic-based sensor. Savrun 1 has explained that the integrated z-source converter (zDCES) DCES topology achieved an extensive offset voltage range along with a lower duty cycle range in addition to a tremendous drop in nominal battery voltage compared to the conventional system. The existing full-bridge switches were developed, and a high gain z-source converter was obtained.
Motivation for the research work
In the review of the current investigation work, the power quality enhancement in renewable energy sources is considered as a major factor. The management of renewable energy sources involves different sources like PV, wind power generators, and battery storage. The presence of a power rating inverter produces the amount of compensation. Therefore, a PQ compensator with a good controller is needed for minimizing the quality problem. To overcome the power quality problem different techniques such as BSA, ANN, and fuzzy logic controller (FLC) were analyzed. Advantages of ANN include control of flow of power and switching loss in the MG system. Likewise, it has drawbacks such as hardware reliance, nonillustrated network features, exact network structure determination, and complexity of displaying the issue to the network. The FLC approach has advantages in improving reliability as well as efficiency. But the drawback of the FLC is not always accurate; hence, the outcome is only based on the consideration. So, it is not considered and requires optimal schemes for power quality improvement of hybrid renewable energy sources (HRES) to tackle these limitations.
System modeling configuration
The architecture of a three-phase grid-connected PV system depends on the interleaved inverter demonstrated in Figure 2, and the system consists of an interleaved inverter, 31 a three-phase power grid, an interface inductor, an MPPT controller, a nonlinear load controller, and PV solar array. The enormous power produced by PV sources is tracked using the MPPT method based on projected RIO. A cascaded H-bridge MLI on the grid system is controlled by the introduced controller method. The interleaved inverter circuit topology consists of four legs. Each leg consists of a power electronic switch and a diode. These circuit configurations are used to solve the limitation such as the shoot-through effect. During shunt active power filter (APF) operation, the electrolytic capacitor is linked to the DC side. The arrangement configuration is linked through the ripple filter, nonlinear load, and interface inductor. The MLI consists of a high switching ripple. Literally, the MLI connected to the interfaced solar phovovoltaic (SPV) network also generated current harmonics, and it is decaying by the interface inductor. 32
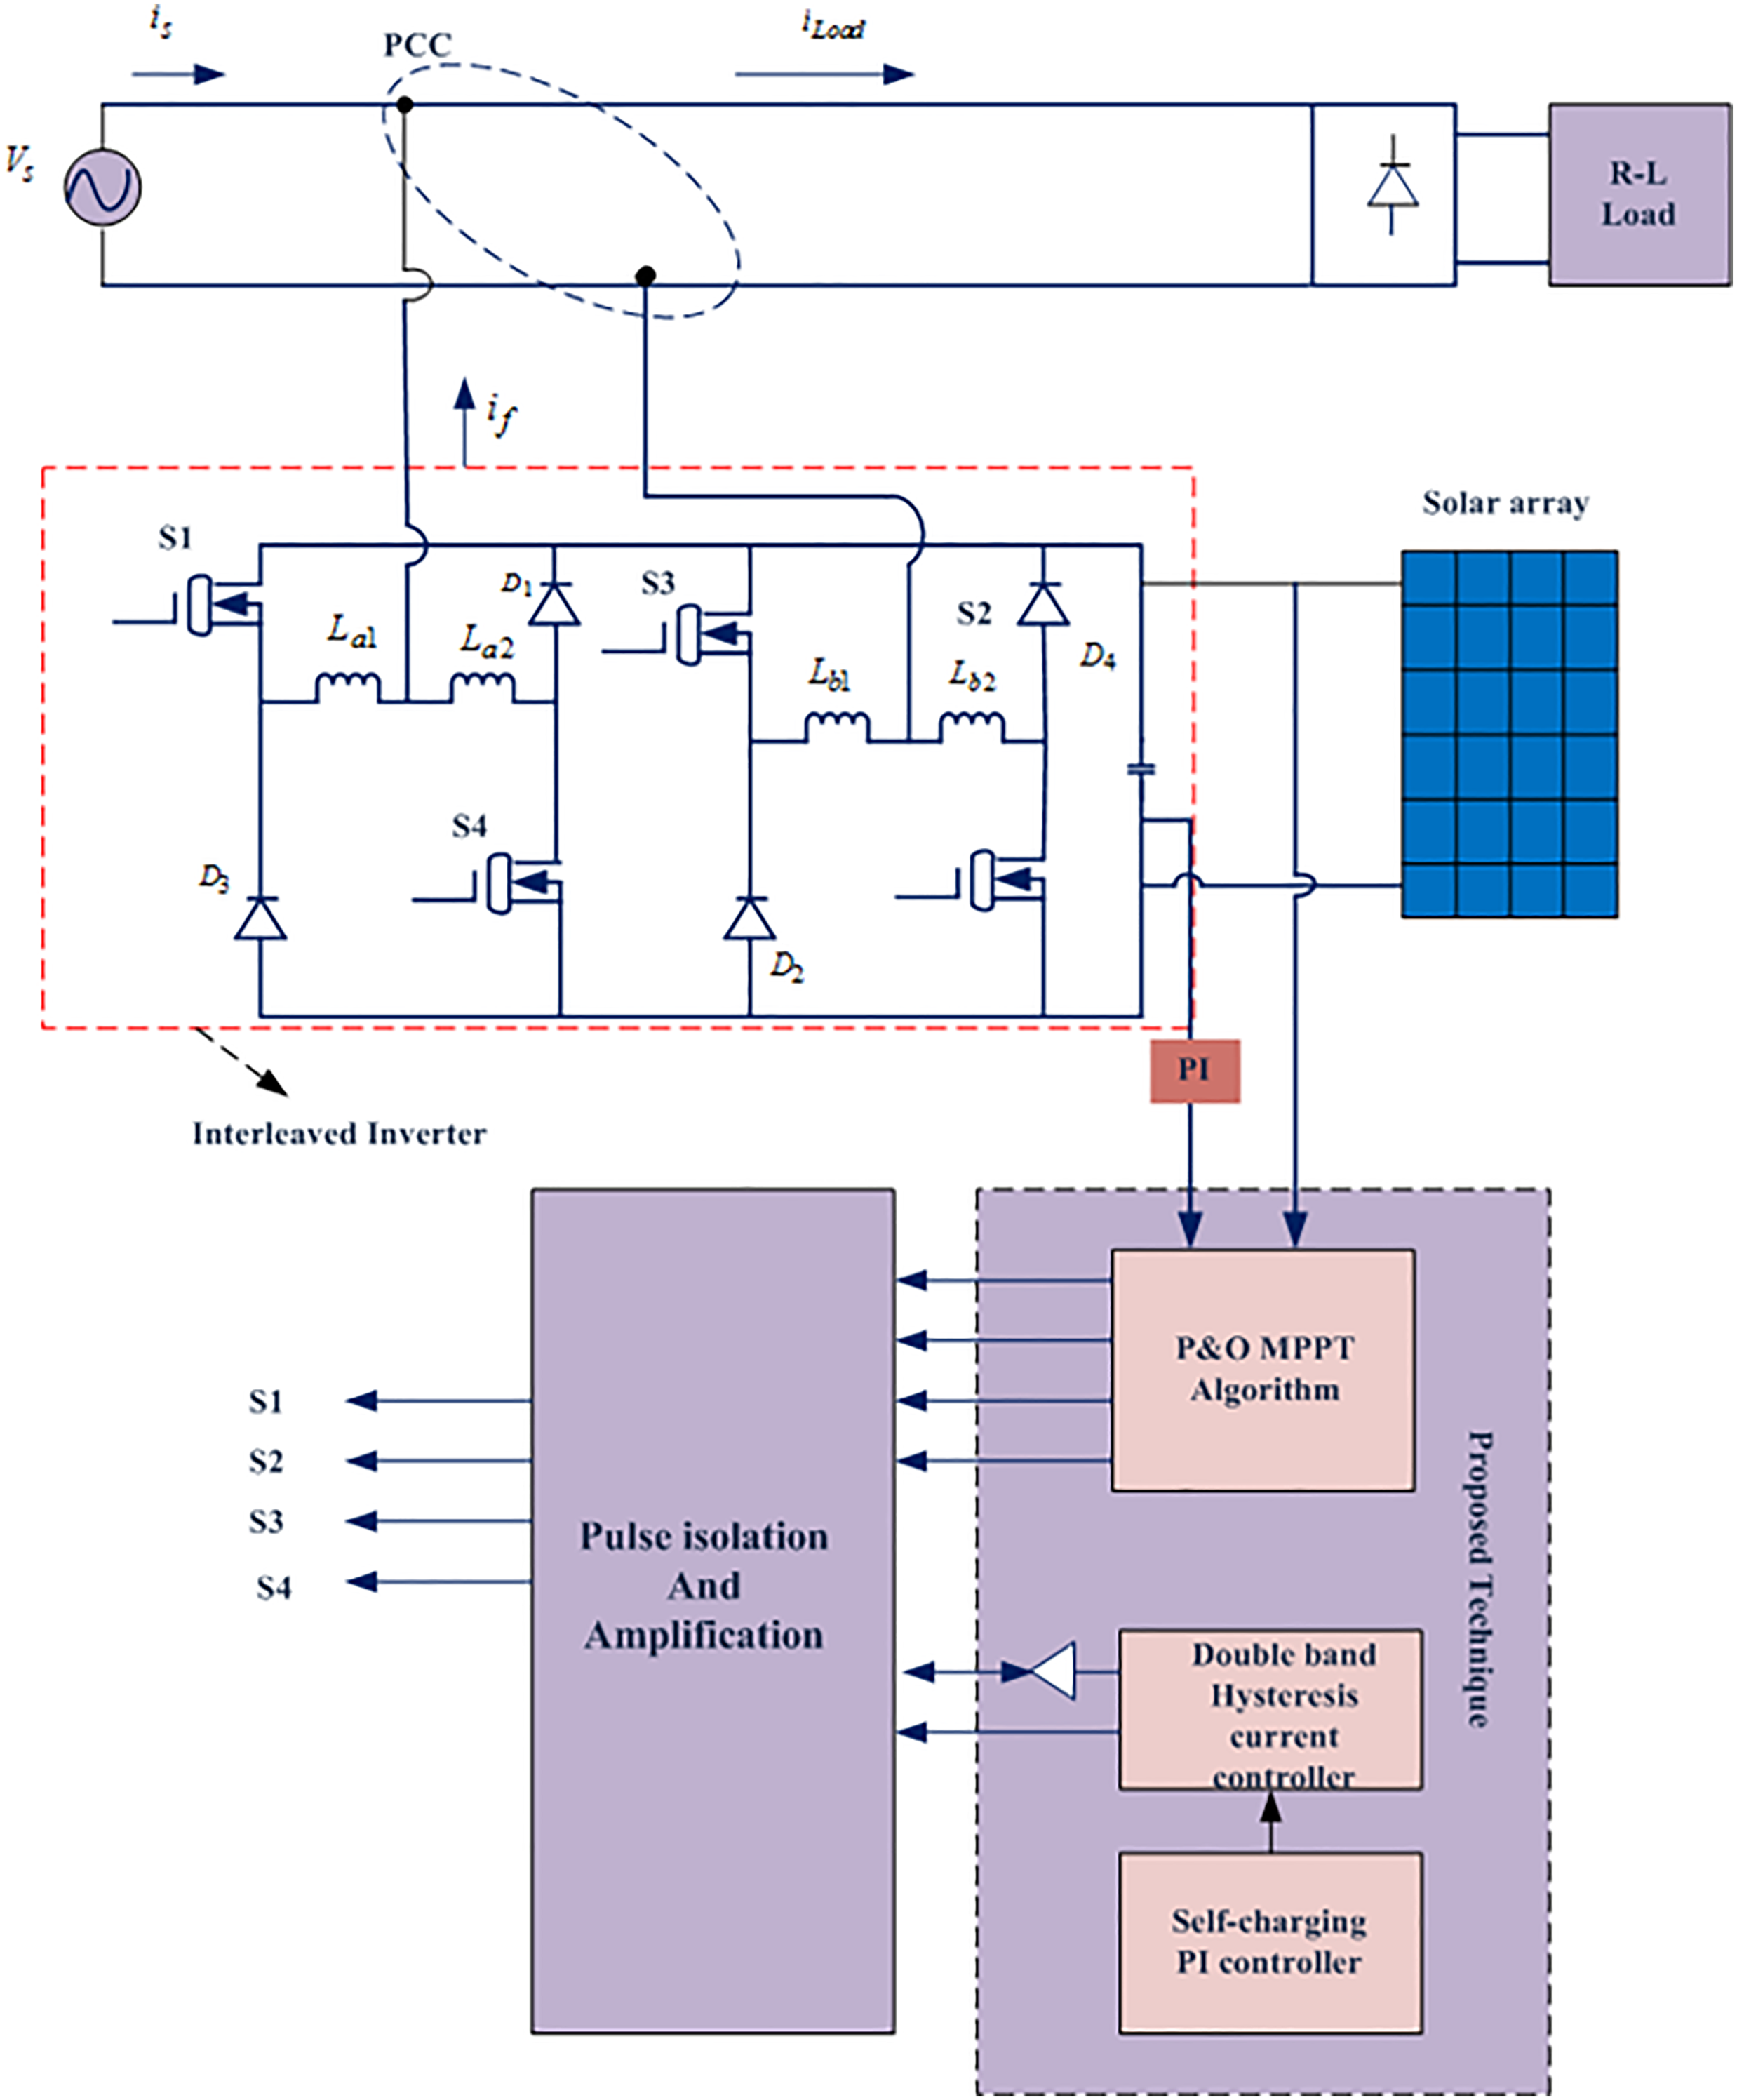
Overall block diagram of interleaved inverter fed PV system.
Modeling of system components
The hardware architecture of a PV system based on interleaved inverter involves different components. Each component of the system is illustrated in the following. The introduced system is developed in order to achieve multifunctional operation.
Solar PV array model
Photon energy from sunlight is converted into power using the PV cell and the cell material produces a constant open circuit voltage. The system modeling of PV is illustrated in Figure 3.
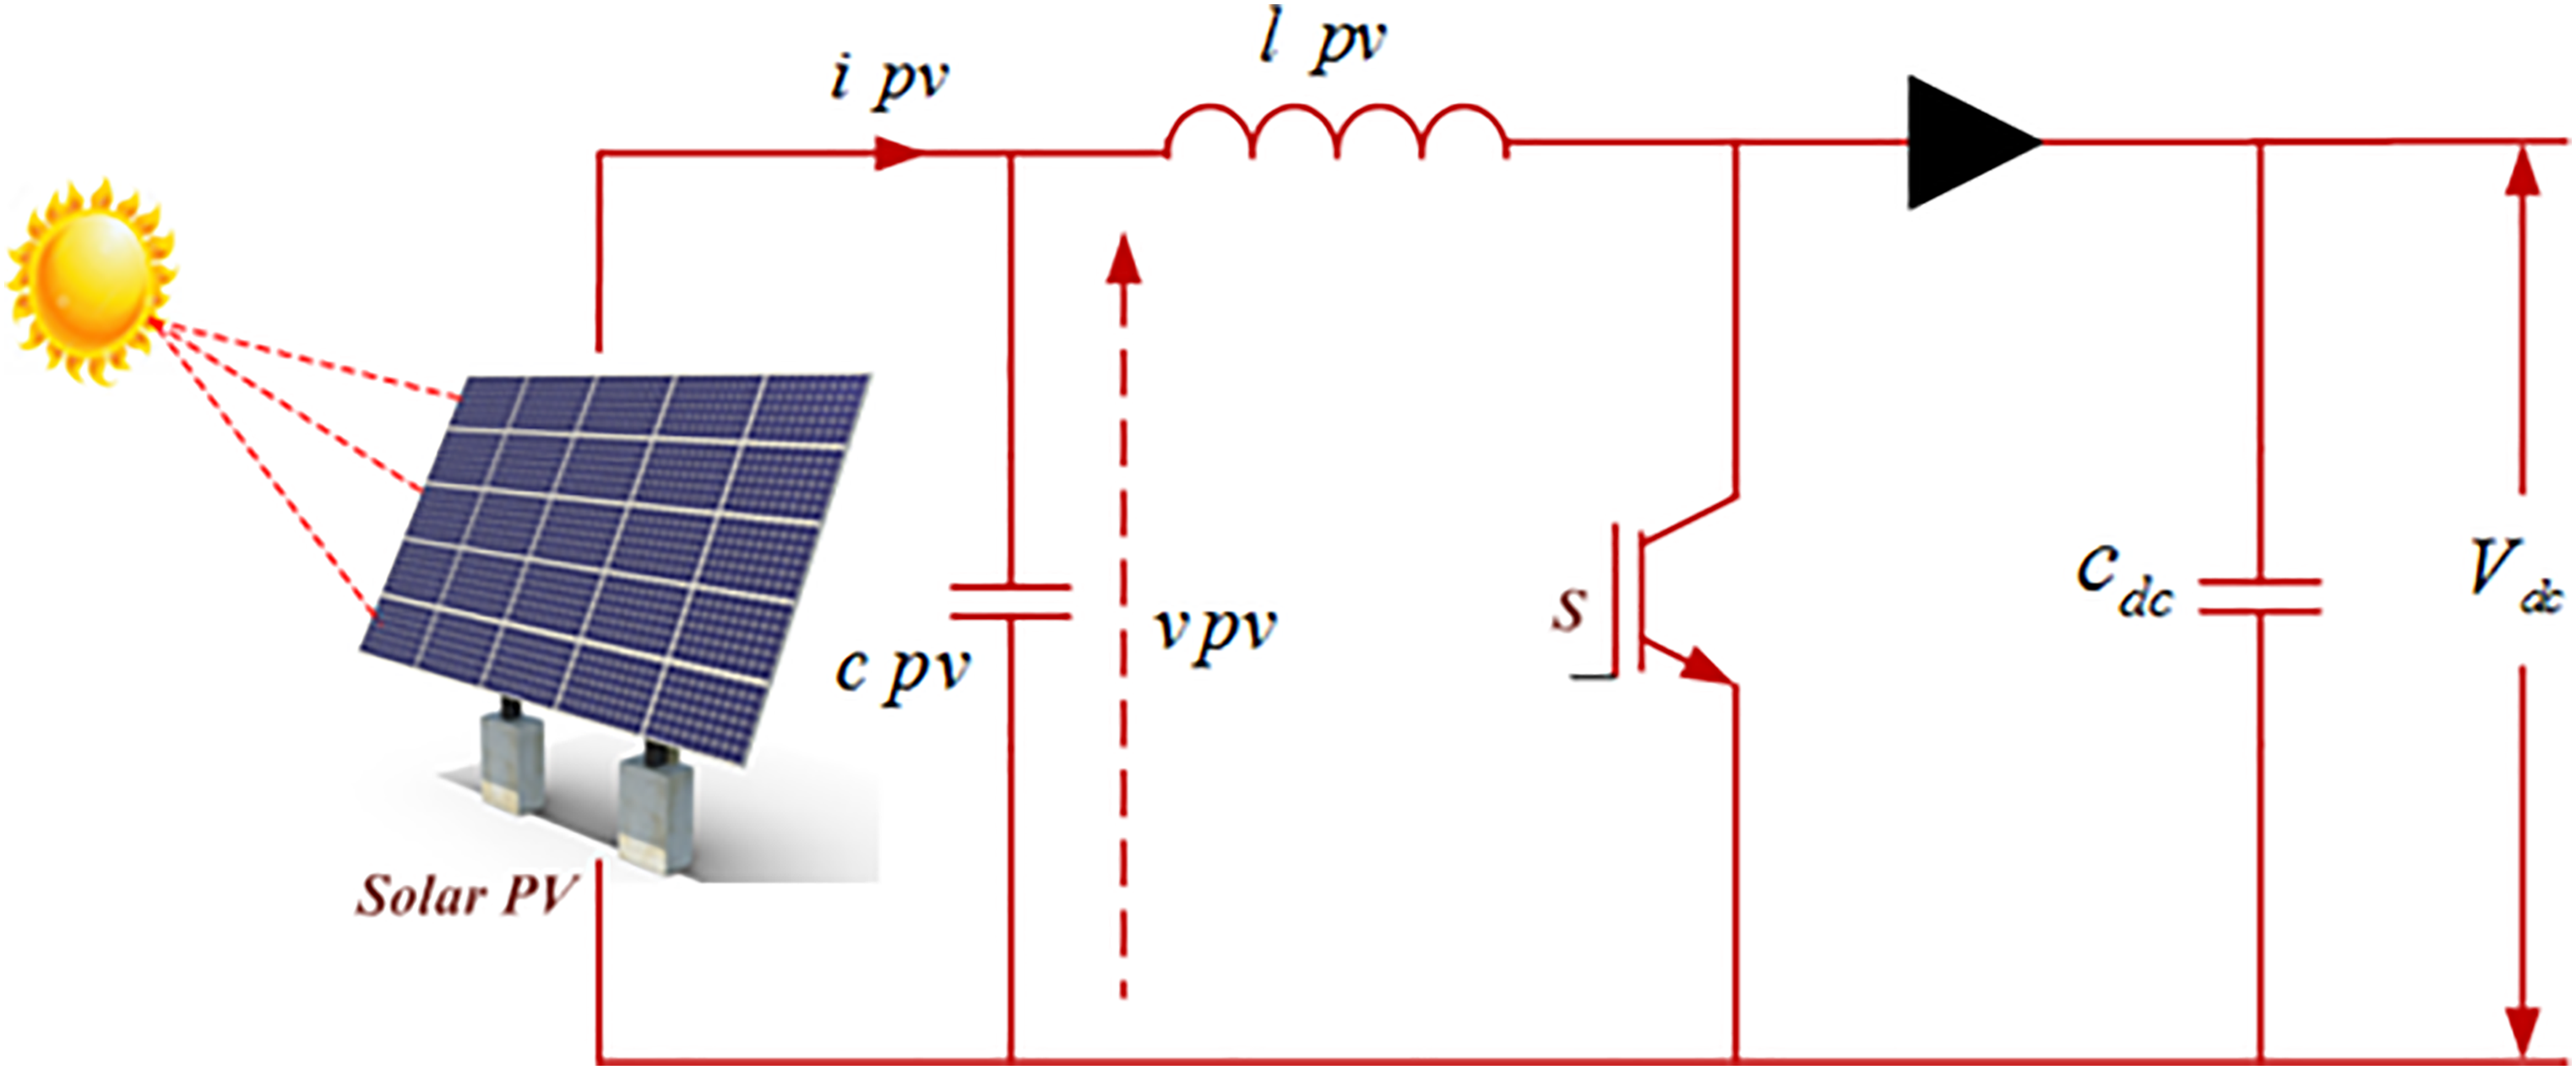
Pv system modeling.
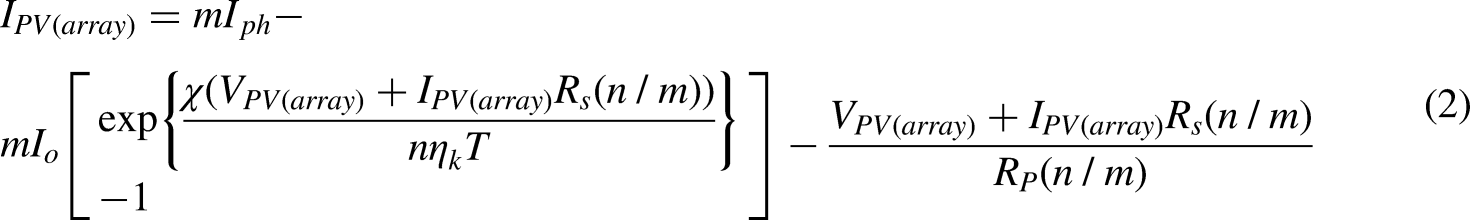
According to the light energy, the current (IPV(cell)) is flowing through the load, which is expressed as follows:


Boost converter
At continuous mode operation, the boost converter is employed to set this input voltage, the diode is off, and insulated gate bipolar transistor (IGBT) is on. The IGBT device is used to give the voltage produced by the PV to the inverter. The output voltage of the converter is managed by the duty cycle and is expressed as

DC-link capacitor
The DC link based on the capacitor is developed in order to rate the system and is expressed by

Interfacing inductor
The interface inductor that depends on ripple current, DC link, and switching frequency is designed and is stated as
Working principle of interleaved inverter
According to half-bridge topology, the operation of interleaved inverter is investigated, which is represented in Figure 4. Here, the compensating current
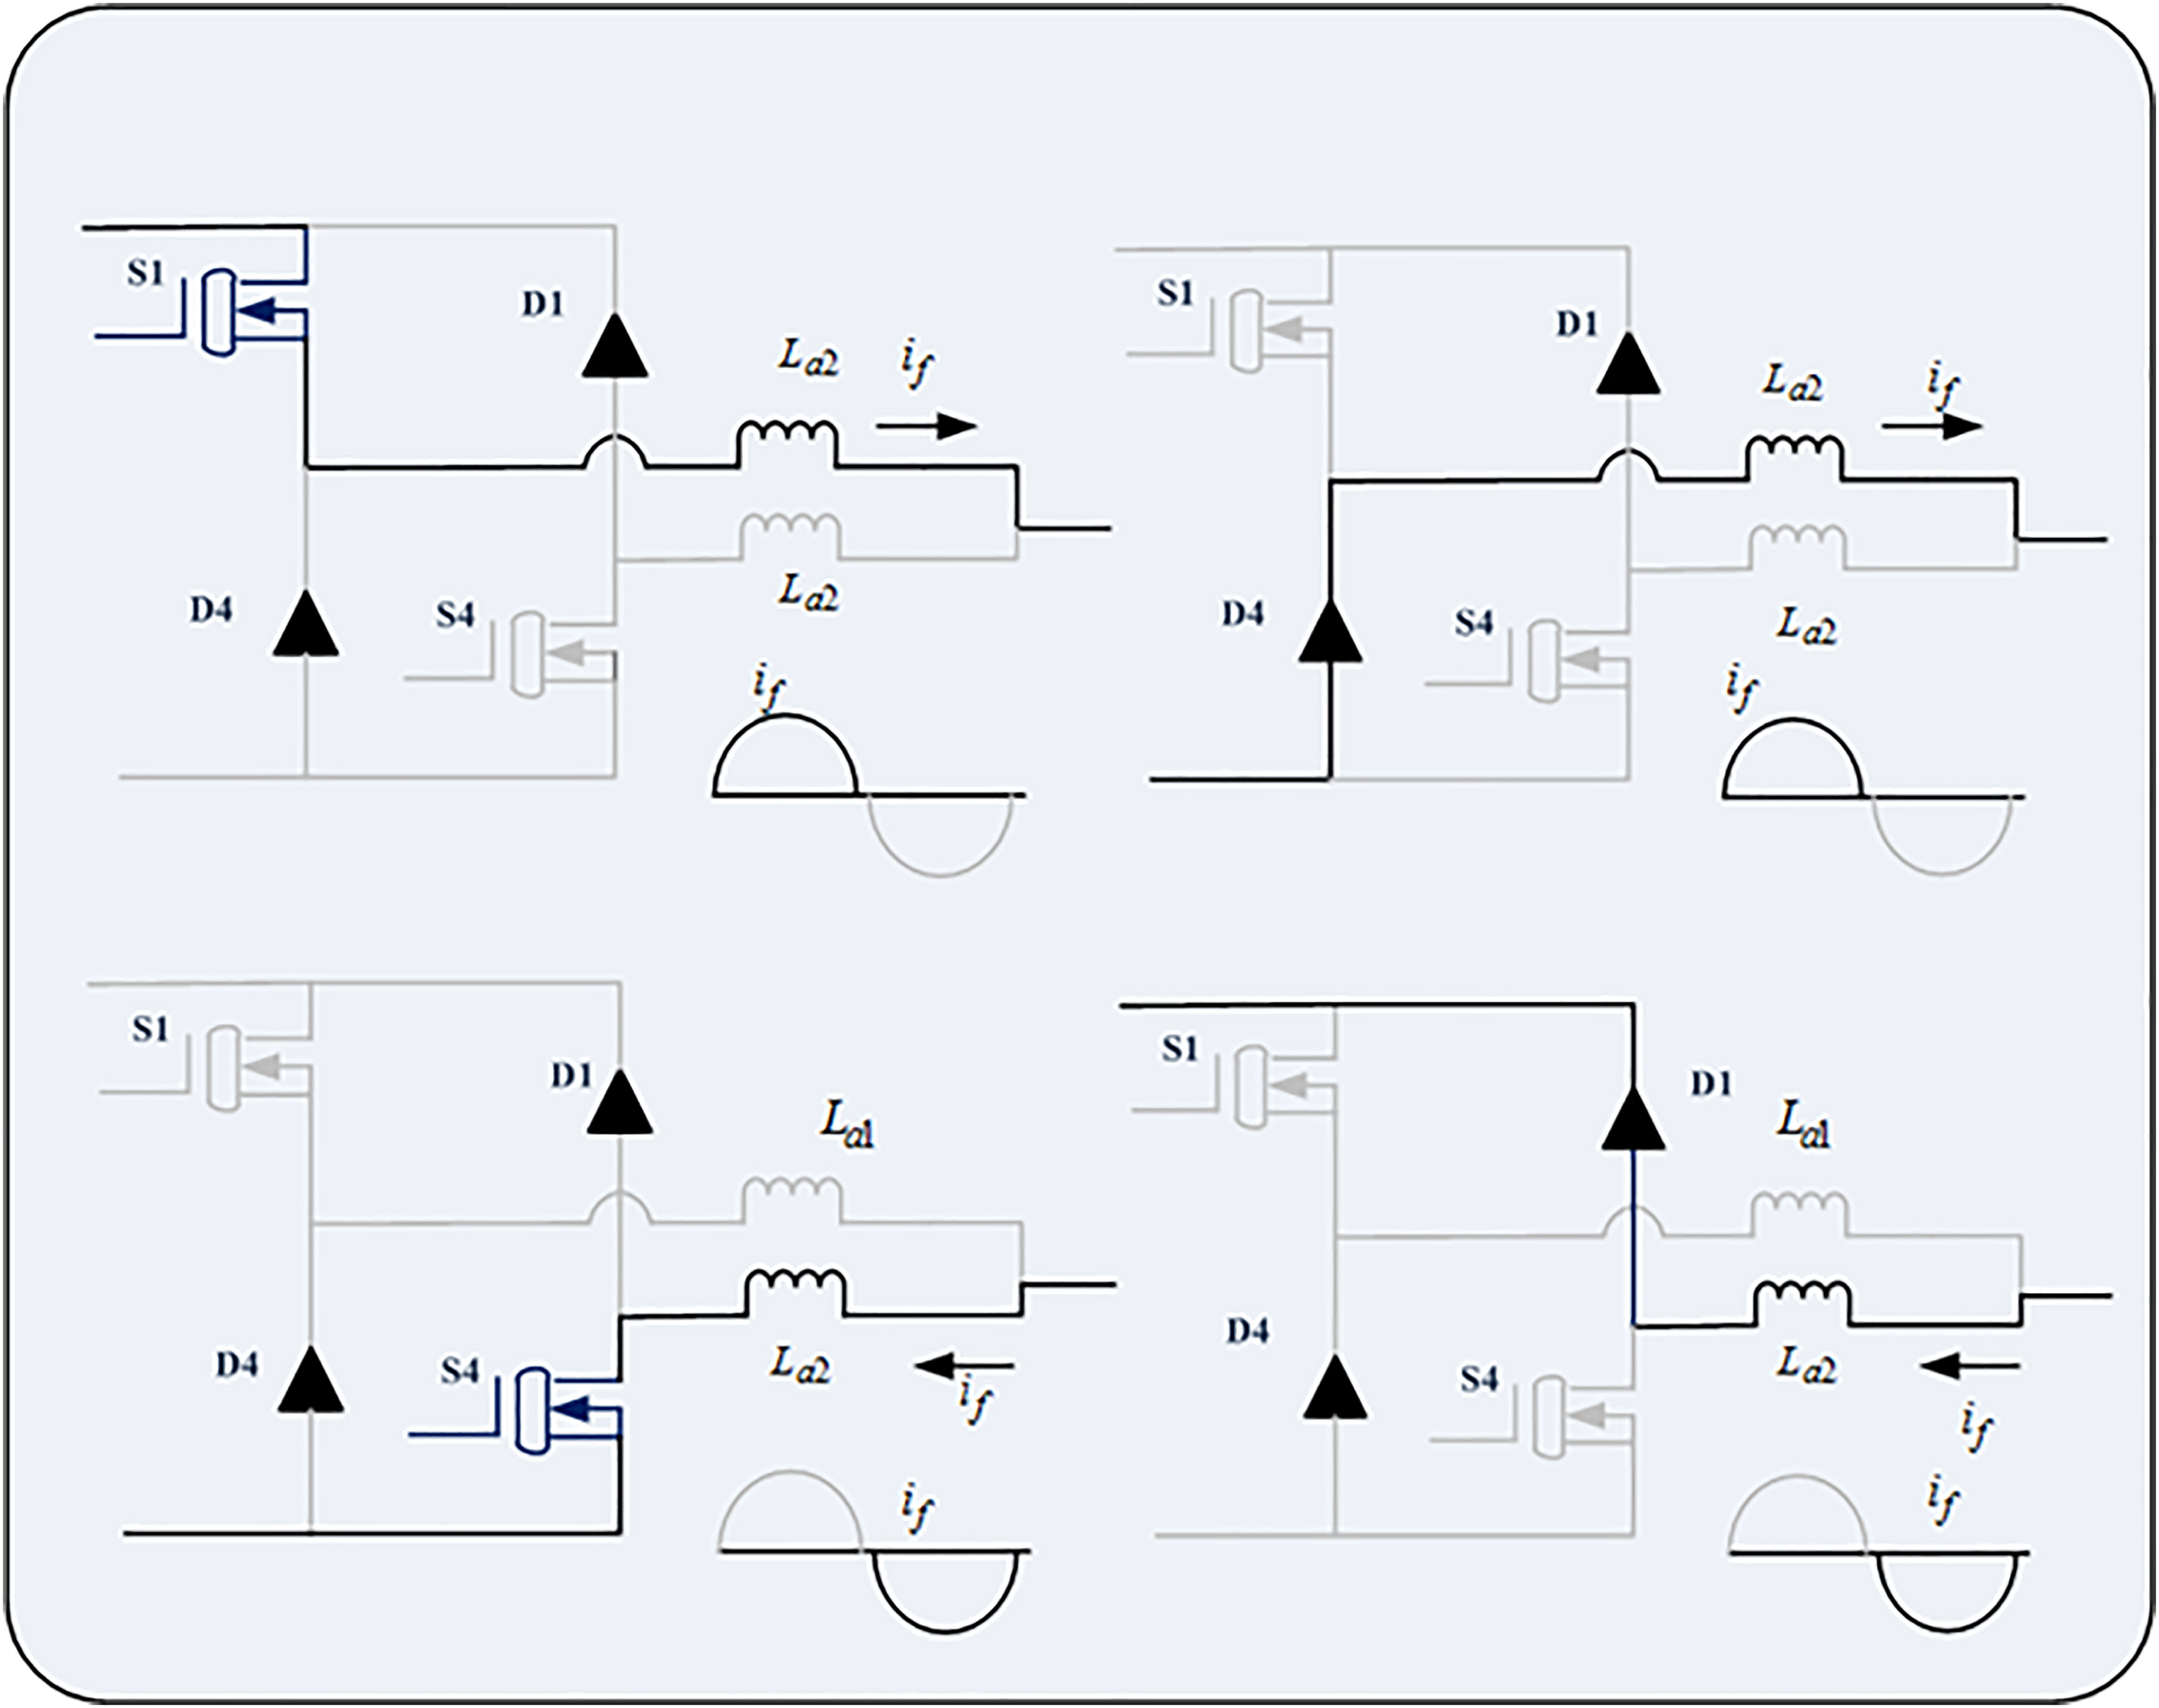
Working principle of interleaved inverter.
Control loop
MPPT control algorithm
According to variations in solar radiation and cell temperature, the generation of PV energy varies and the controller measures the maximum power point. Different power point measurement systems are used to observe the maximal power point present in the PV array. The MPPT P&O is a simple system to determine MPP. After finding the MPP, the perturbation is performed. The algorithm is designed with low-cost controllers and is very capable of tracking through changing solar radiation conditions. The P&O algorithm uses a power sample at each step to track the MPP and compares the power in different power samples.
DC-link voltage control algorithm
The DC-link voltage control loop is considered to address the shunt APF compensation capability. There are three sections in the proposed control technique. In the first section, self-charging of the DC link at the voltage control loop is carried out. In the second section, the improved PLL
34
extracts the essential component of the voltage signal. The third section involves minimizing the generation of switching pulses using a unipolar hysteresis current controller. During harmonic current compensation, the PI controller generates DC-link voltage by supplying an active component of current and sends a reactive power component to the load when loads demand excess reactive power. Finally, harmonic mitigation and reactive power compensation take place. There is little deviation in DC-link voltage during the charging and discharging state in the compensation principle. The stored energy of the capacitor is articulated as


Calculation of PI controller
The DC-link voltage is stabilized by controllers in the multifunctional operation of the interleaved inverter. According to the voltage control loop, the gain parameters are

The DBHCC acquires switching frequency, which is lower than the conventional hysteresis current controller system.
36
The upper and lower hysteresis band is used to control the upper


Proposed LA-HBO hybrid technique
The control approach is separated into two sections: one is to collect the maximal power as solar array and second is to regulate the DC-link voltage for a long time using DBHCC through shunt APF operation.
Lichtenberg optimization algorithm
Lichtenberg is defined as optimization algorithm (LA) and is developed based on the idea of radial propagation of intracloud lightning. Lichtenberg figures (LF) is the one which is obtained from the figure generated in the sky because of lightning. The superior configuration of LF has significant property 37 lichtenberg optimization algorithm (LOA) population is shared to small branches through the use of LF. By plotting the y values randomly, the exploration process is enhanced. The algorithm is utilized to provide its number to its branch. In this paper, cost minimization is achieved through the LOA approach. The flow chart of the LOA algorithm is shown in Figure 5, and the step-by-step method of LOA is defined as follows:
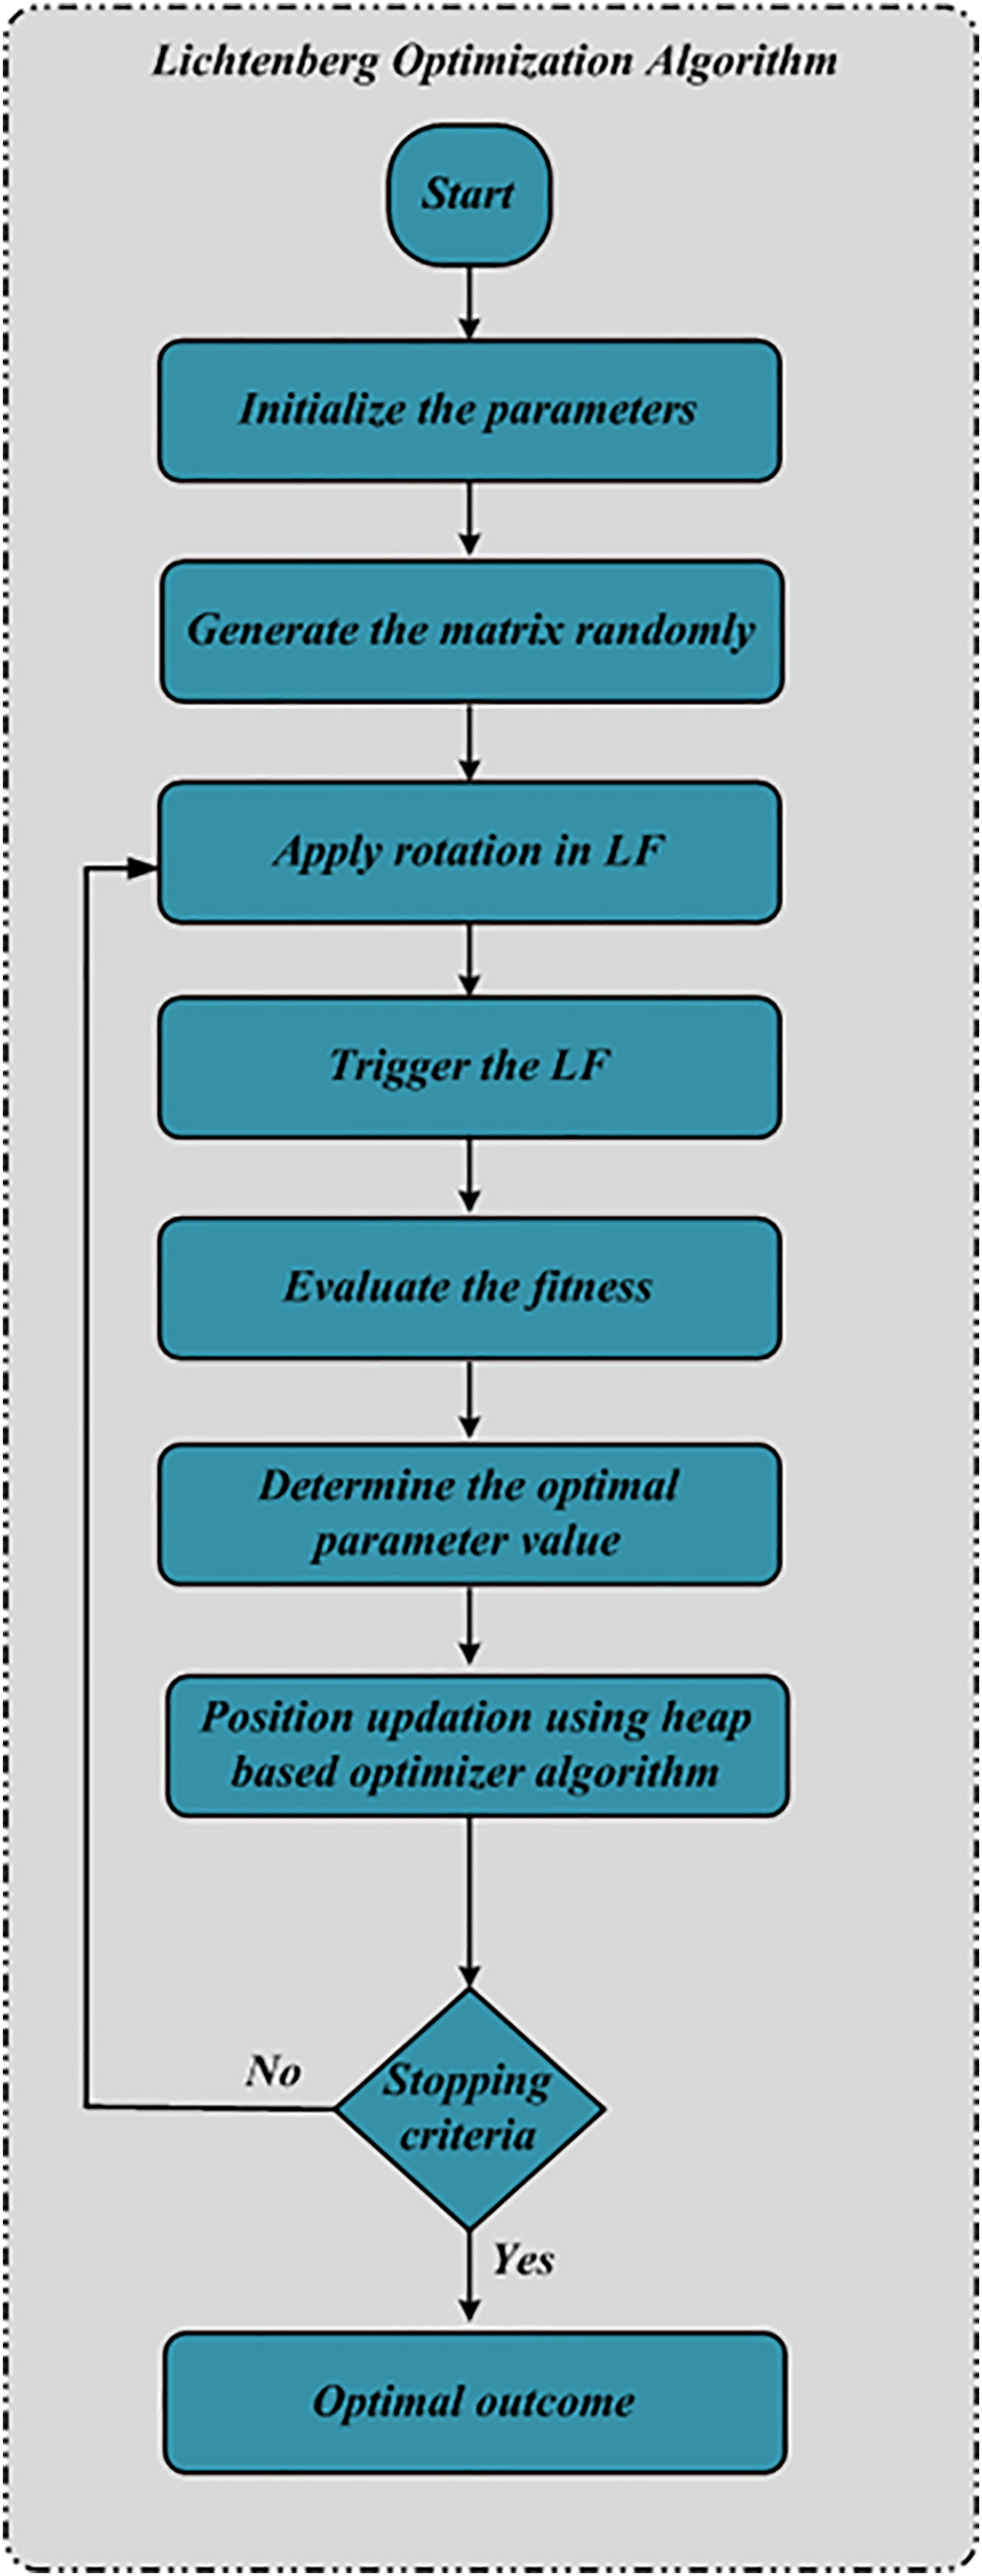
Flowchart of LA algorithm.
Step 1: Initiation
Initiate the prediction data of PV, WT, load data, and historic data of the system.
Step 2: Random generation
Create LF utilizing routine parameter mand population of Lichtenberg is created, which is illustrated as follows:
Step 3: Rotation on LF
According to rotation, the next LF is formed in which the speed of reference is not similar with zero.
Step 4: LF triggering
Trigger the LF for the initial time, and the optimum point of the earlier one is achieved. It is continued to get better fitness
Step 5: Evaluate fitness
The fitness is assessed at a certain point in LF. It depends on the objective function

Step 6: Determine minimal point
Calculate the best value at search space.
Step 7: Termination
In this step, termination of the process takes place after receiving the optimal outcome or else go to step 3. It is found by using the following equation:
Heap-based optimizer
Corporate position is one that is nominated to executives within a company or organization. The position is the one that defines the employee’s job descriptions and responsibilities. According to the company and business, the position will change but they are arranged in a hierarchical order, which is mentioned in different names such as Corporate Ranking Hierarchy (CRH), Organizational Chart Tree, or Corporate Hierarchy. 38 Based on the fitness present in the hierarchy, the algorithm enhanced the logic of search agents. Simultaneously, communication between co-workers and employee self-involvement takes place. HBO involves different levels such as (1) upper, (2) middle, and (3) lower levels. The approach proposed under this document is used to improve the power factor at the grid connection point. The flowchart of the HBO algorithm is demonstrated in Figure 6, and the step-by-step method of HBO is defined as follows.
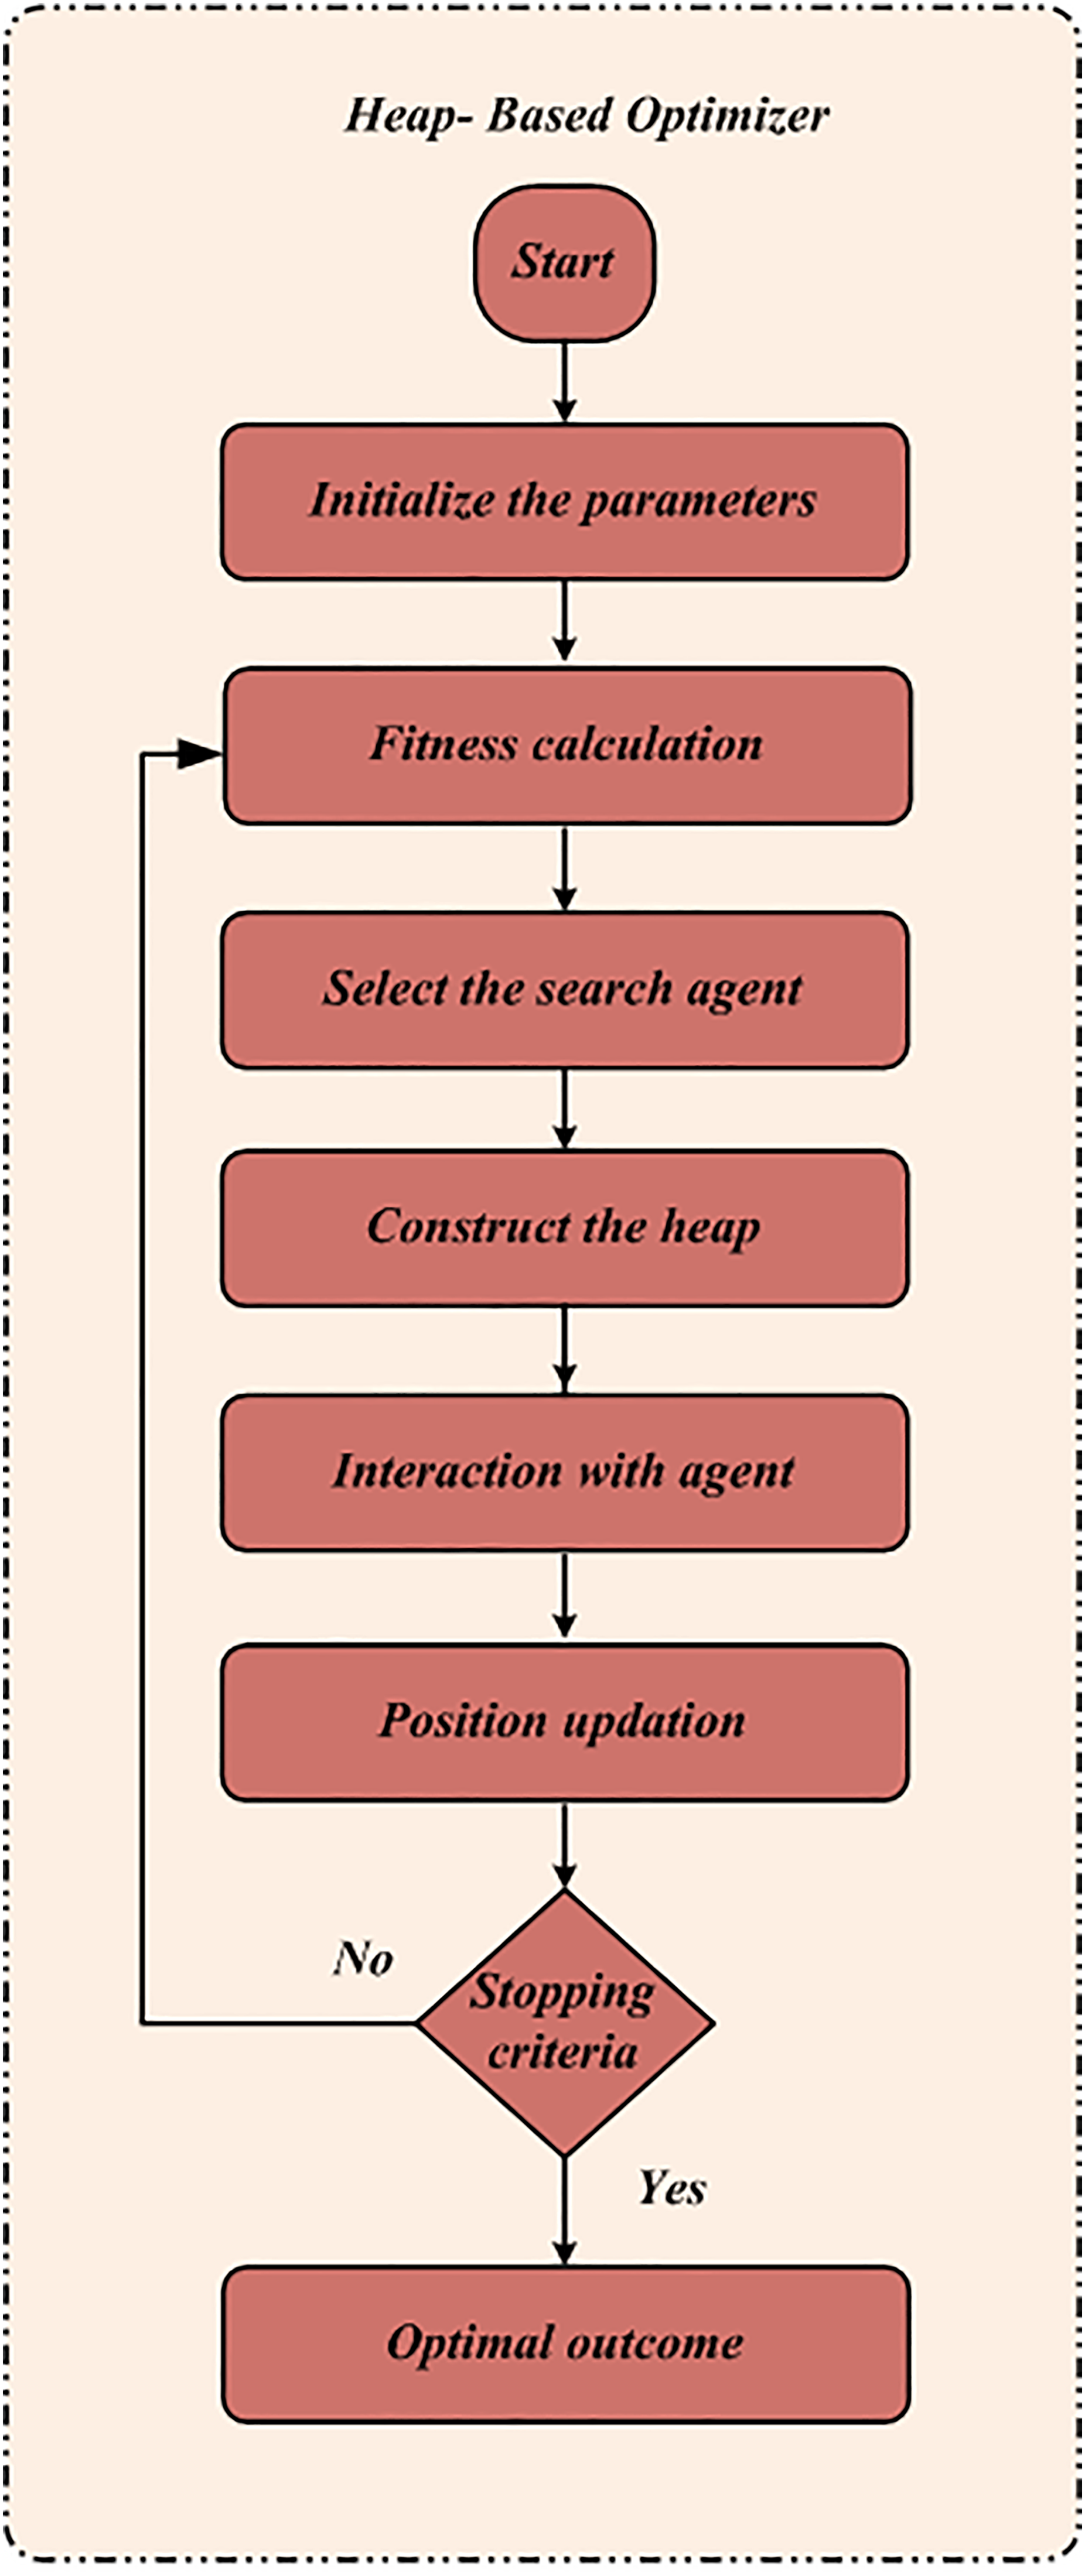
Flowchart of HBO algorithm.
Step 1: Initiation
In this step, the reactive power, the apparent power of the network, EV and energy storage system (ESS), the optimal cost, the system restrictions, and the balanced value are initialized.
Step 2: Random generation
Create population of search agents randomly defined by
Step 3: Fitness function
The fitness is used to regulate the best optimal value. The fitness functions are assessed according to the objective function

Step 4: Choose search agent
Assume that probabilities

Step 5: Construct heap
A tree-like data structure may be executed proficiently using an array, as it has properties of integrity. Heap is built with the below equation:


Step 6: Interaction with instant boss
Design parent node as an immediate boss to their children is illustrated by
Step 7: Position updation
Update position by utilizing the below equation,

Step 8: Termination
Once after receiving the optimal result the process is terminated otherwise go to step 3.
Result and discussion
This section explains about the result obtained by simulating the power quality enhancement of a grid-connected PV system using LA-HBO on MATLAB/Simulink working platform. The grid-linked PV system consists of DC link capacitors, interleaved inverter, MPPT controller, and nonlinear loads. The proposed system is authenticated under two cases such as PV irradiance change and PV constant irradiance change.
Case 1: PV irradiance change
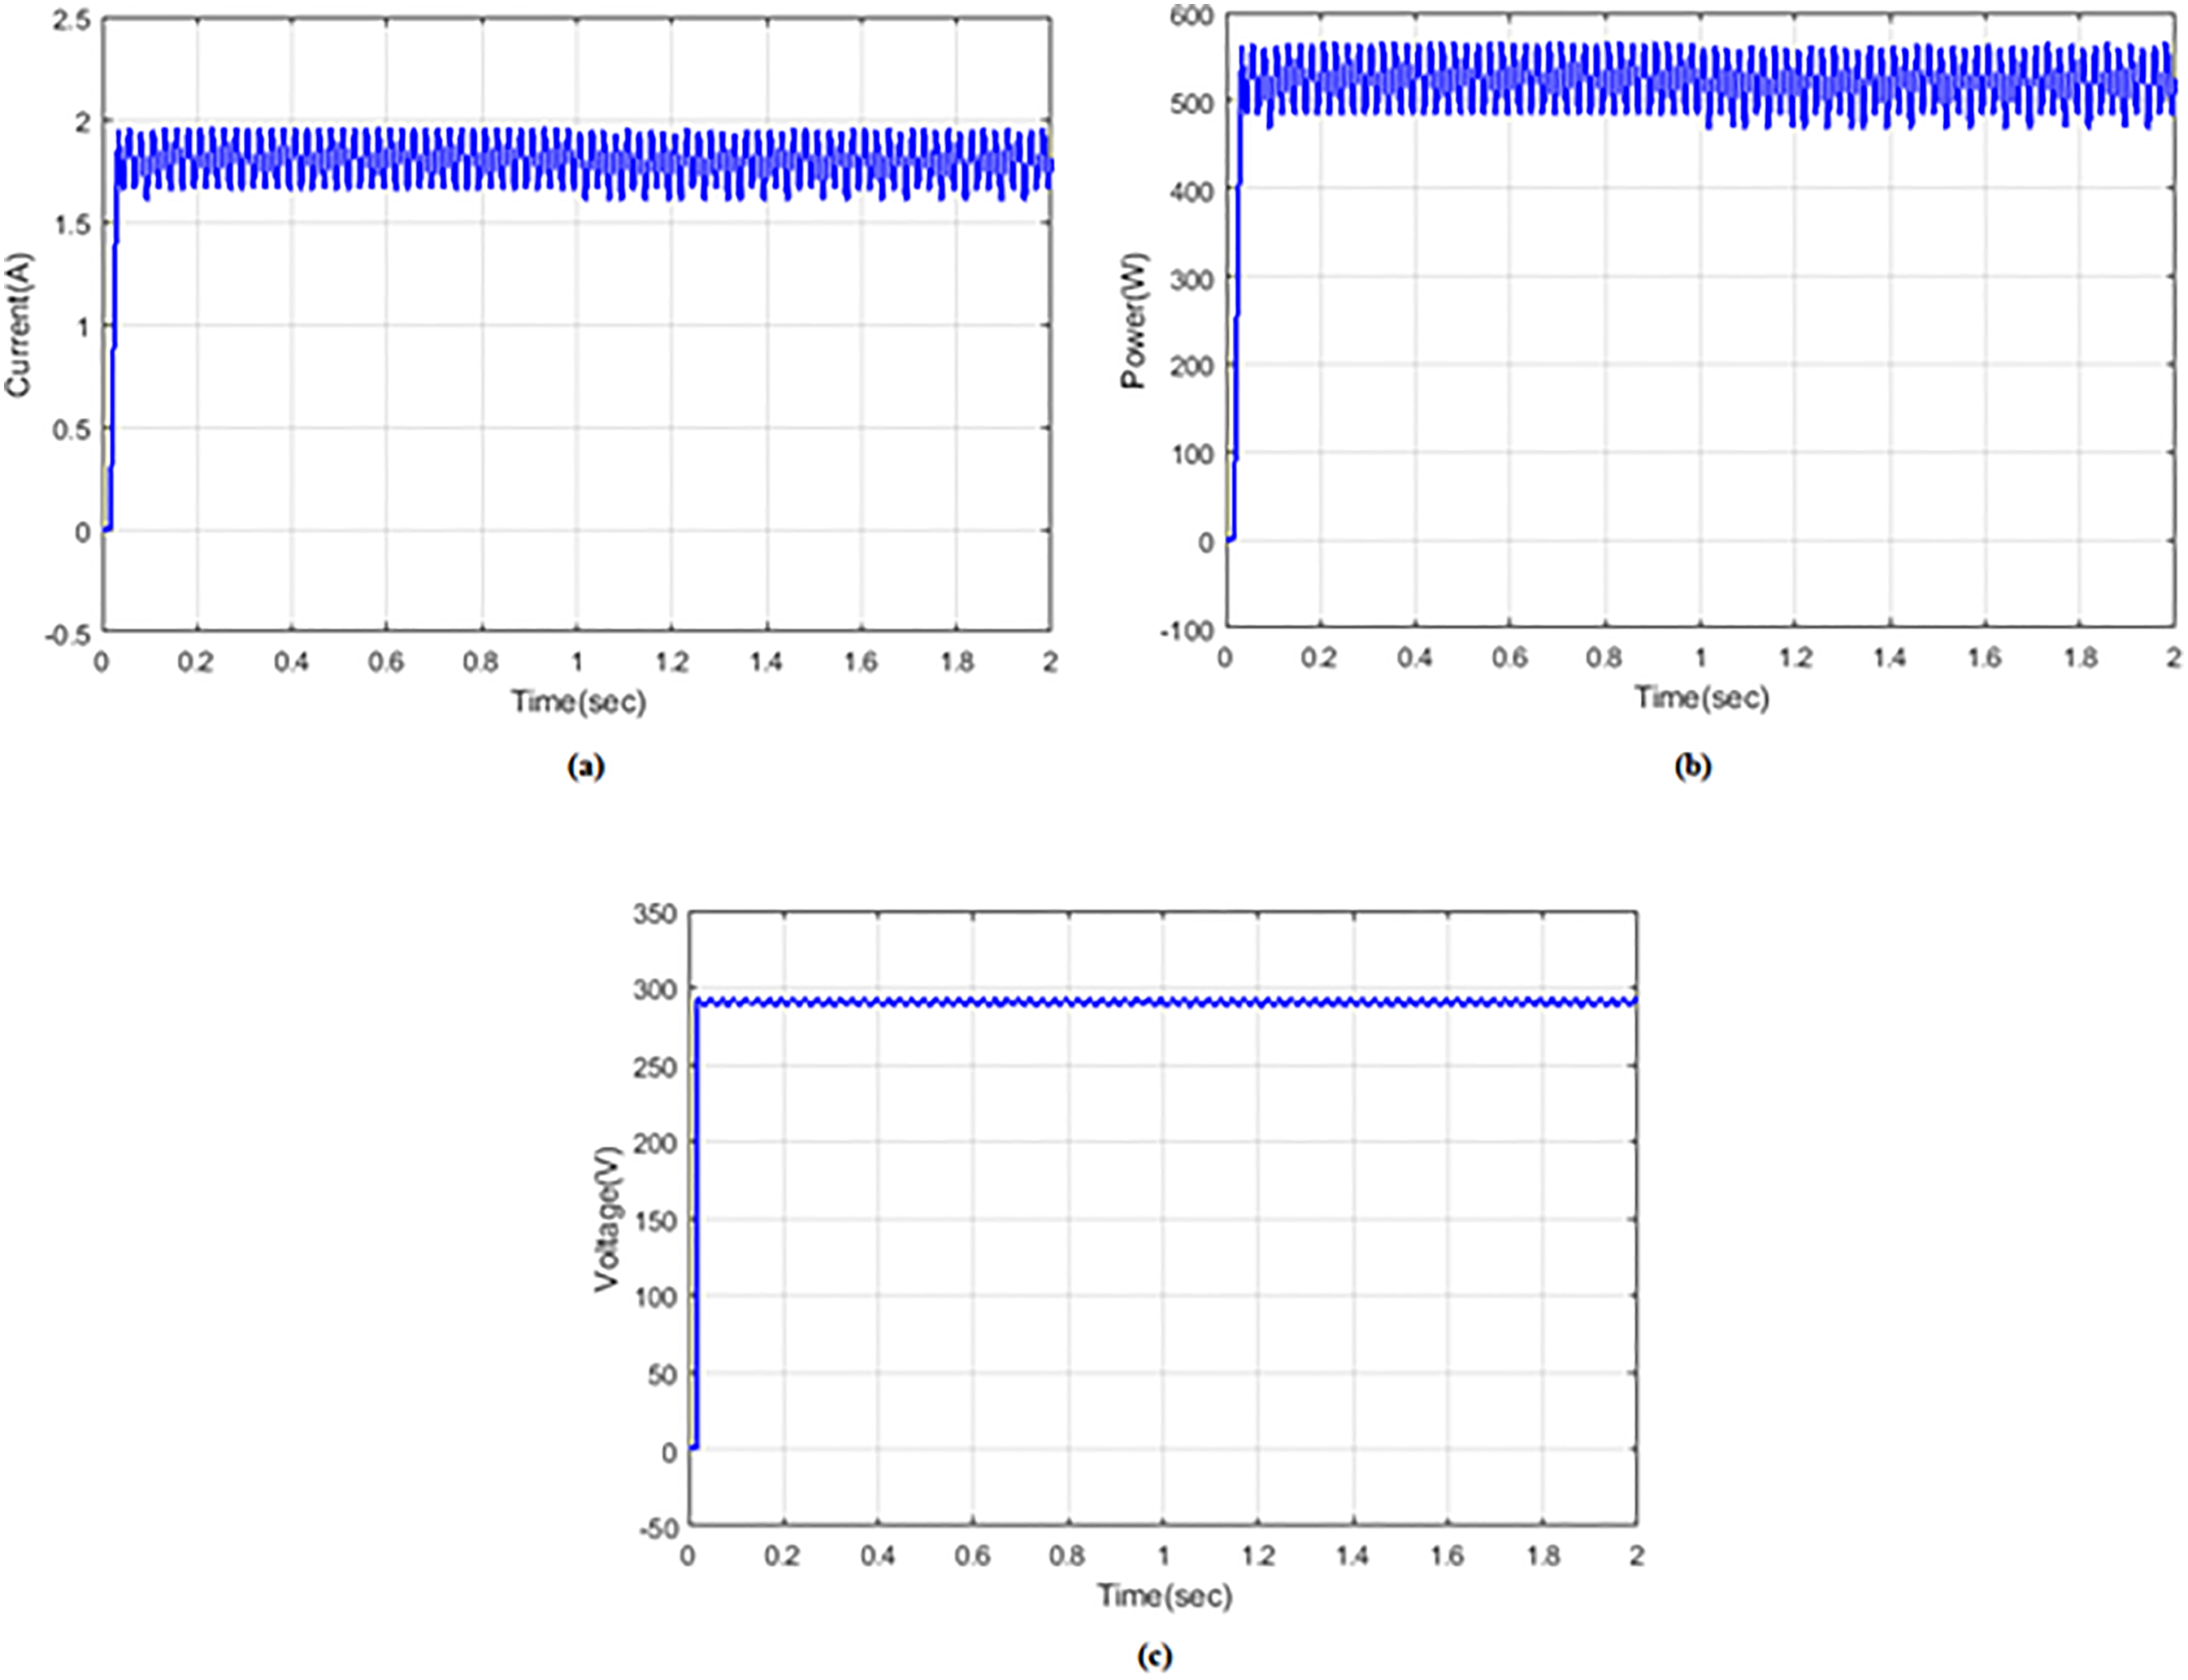
In this case, the proposed system performance is analyzed under PV irradiance change. If a grid-connected PV system is subjected to solar irradiance variation, the parameter such as current voltage and power is investigated. Figure 7 represents the input reference irradiance waveform of the proposed LA-HBO system. Figure 8 portrays the reference temperature of the proposed system. Figure 9 illustrates the capacitor current, voltage, and power waveform. In Figure 9(a), the capacitor current increases up to 2 A and remains constant till 1.1 s then there is a fluctuation from 1.1 time/s to 1.7 time/s in the current due to the PV irradiance. Again the current value of 2 A remains constant for the remaining time period. Figure 9(b) represents the capacitor power variation in which the power value emerged up to 550 W and remains constant till 1.1 time/s; then, power value decreased to 210 W at 1.2 s and remains the same during 1.2–1.6 time/s. Again the power rises to 550 W at 1.6 time/s and remains constant. Figure 9(c) illustrates the capacitor voltage waveform where the voltage increased to 295 V and remains at the same value till 1.2 time/s; then, the voltage value decreases to 160 V at 1.25 time/s and remains constant till 1.6 time/s; again, there is a sudden increase in voltage up to 295 V at 1.65 time/s and remains constant.
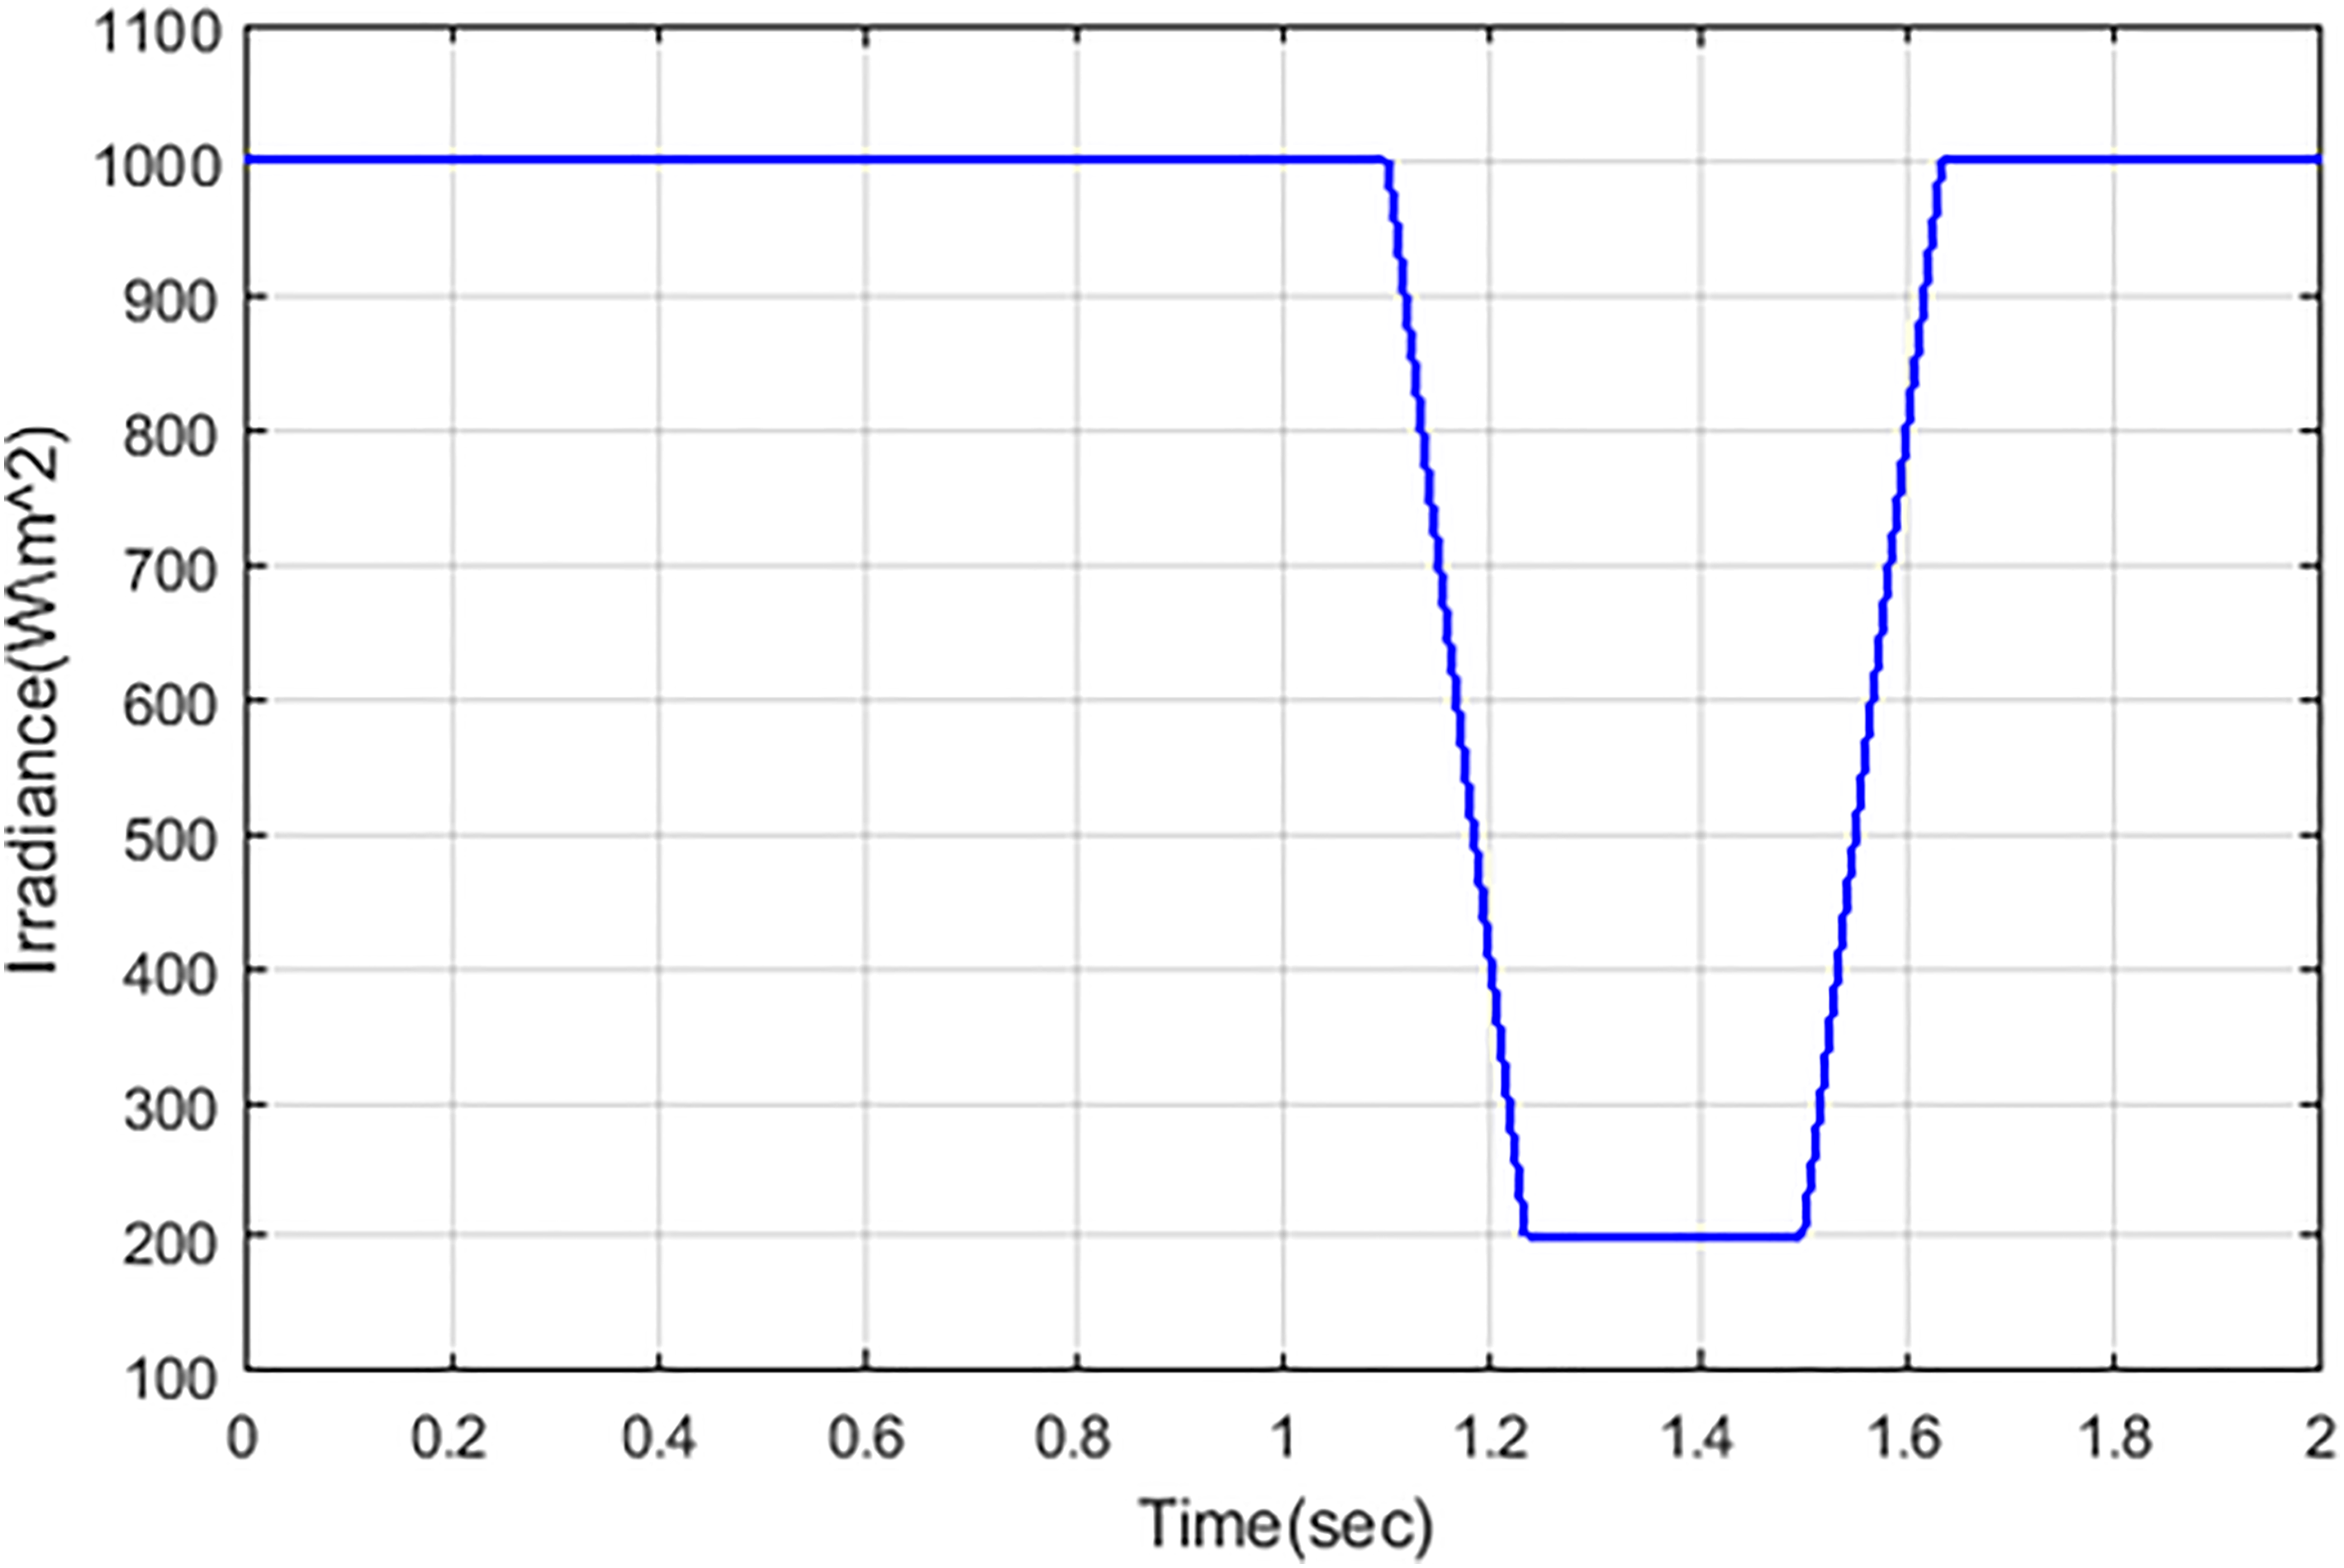
Reference irradiance LA-HBO.

Reference temperature LA-HBO.
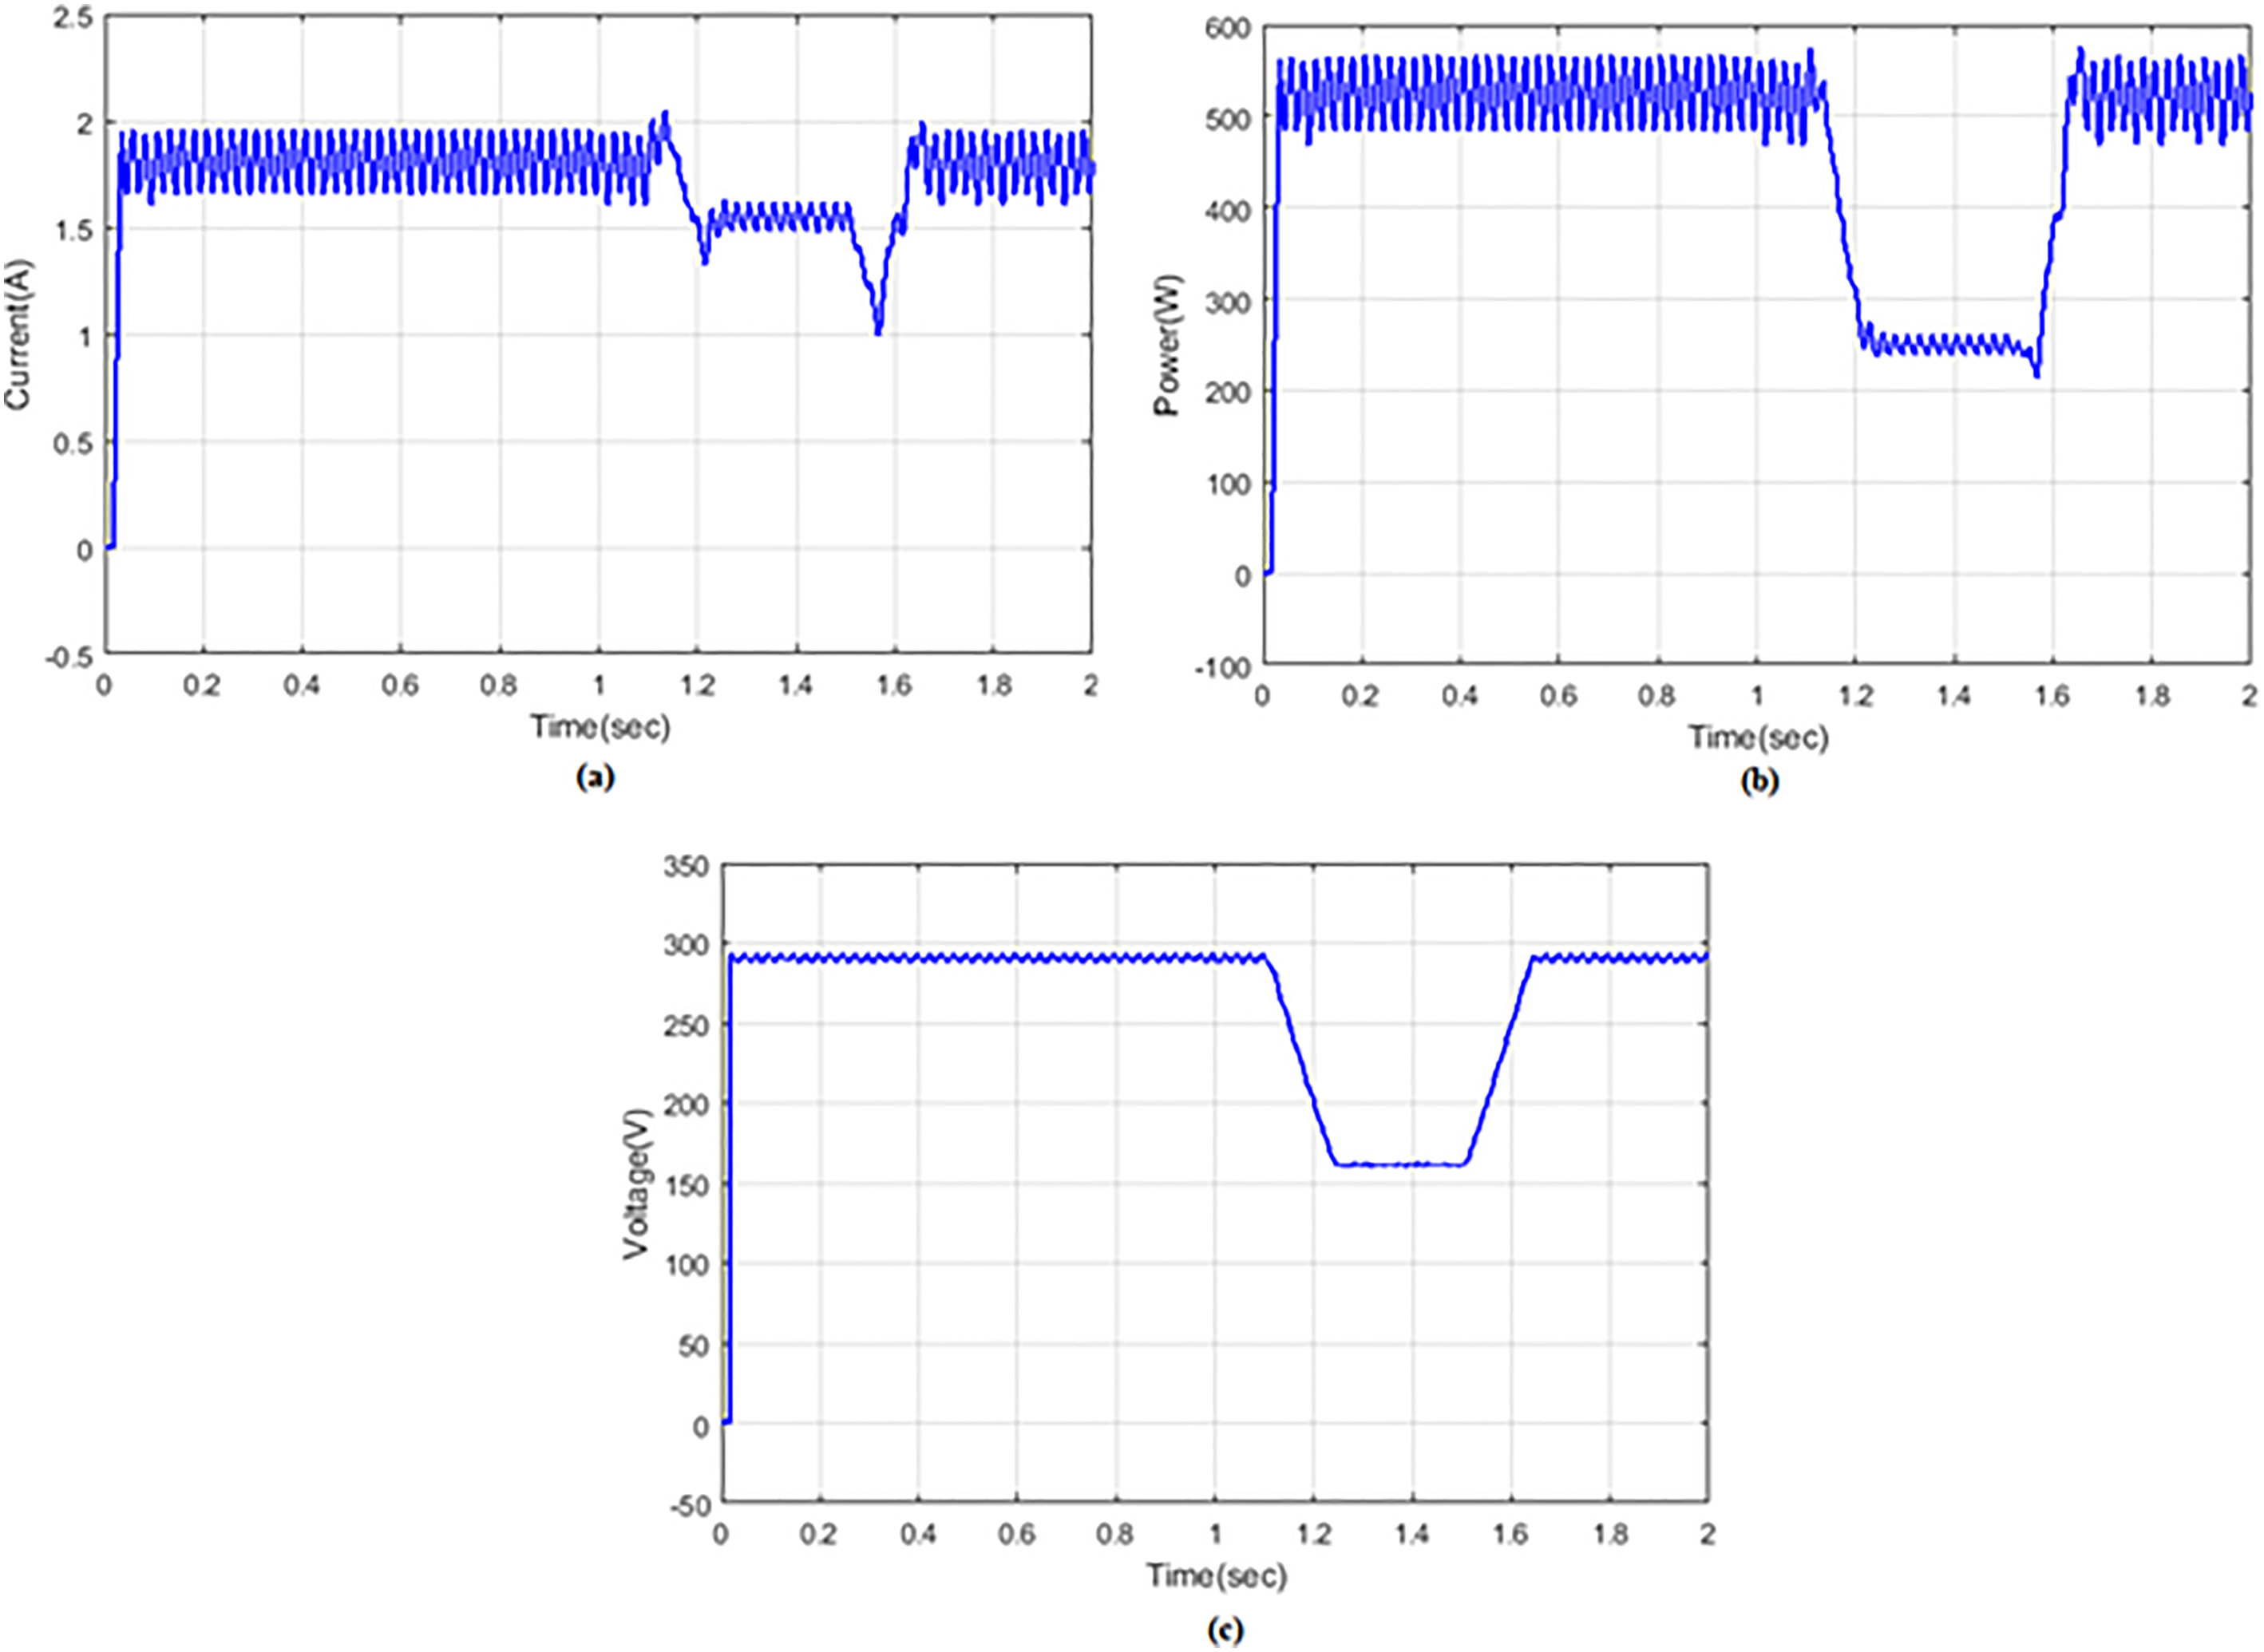
Capacitor: (a) current, (b) power, and (c) voltage.
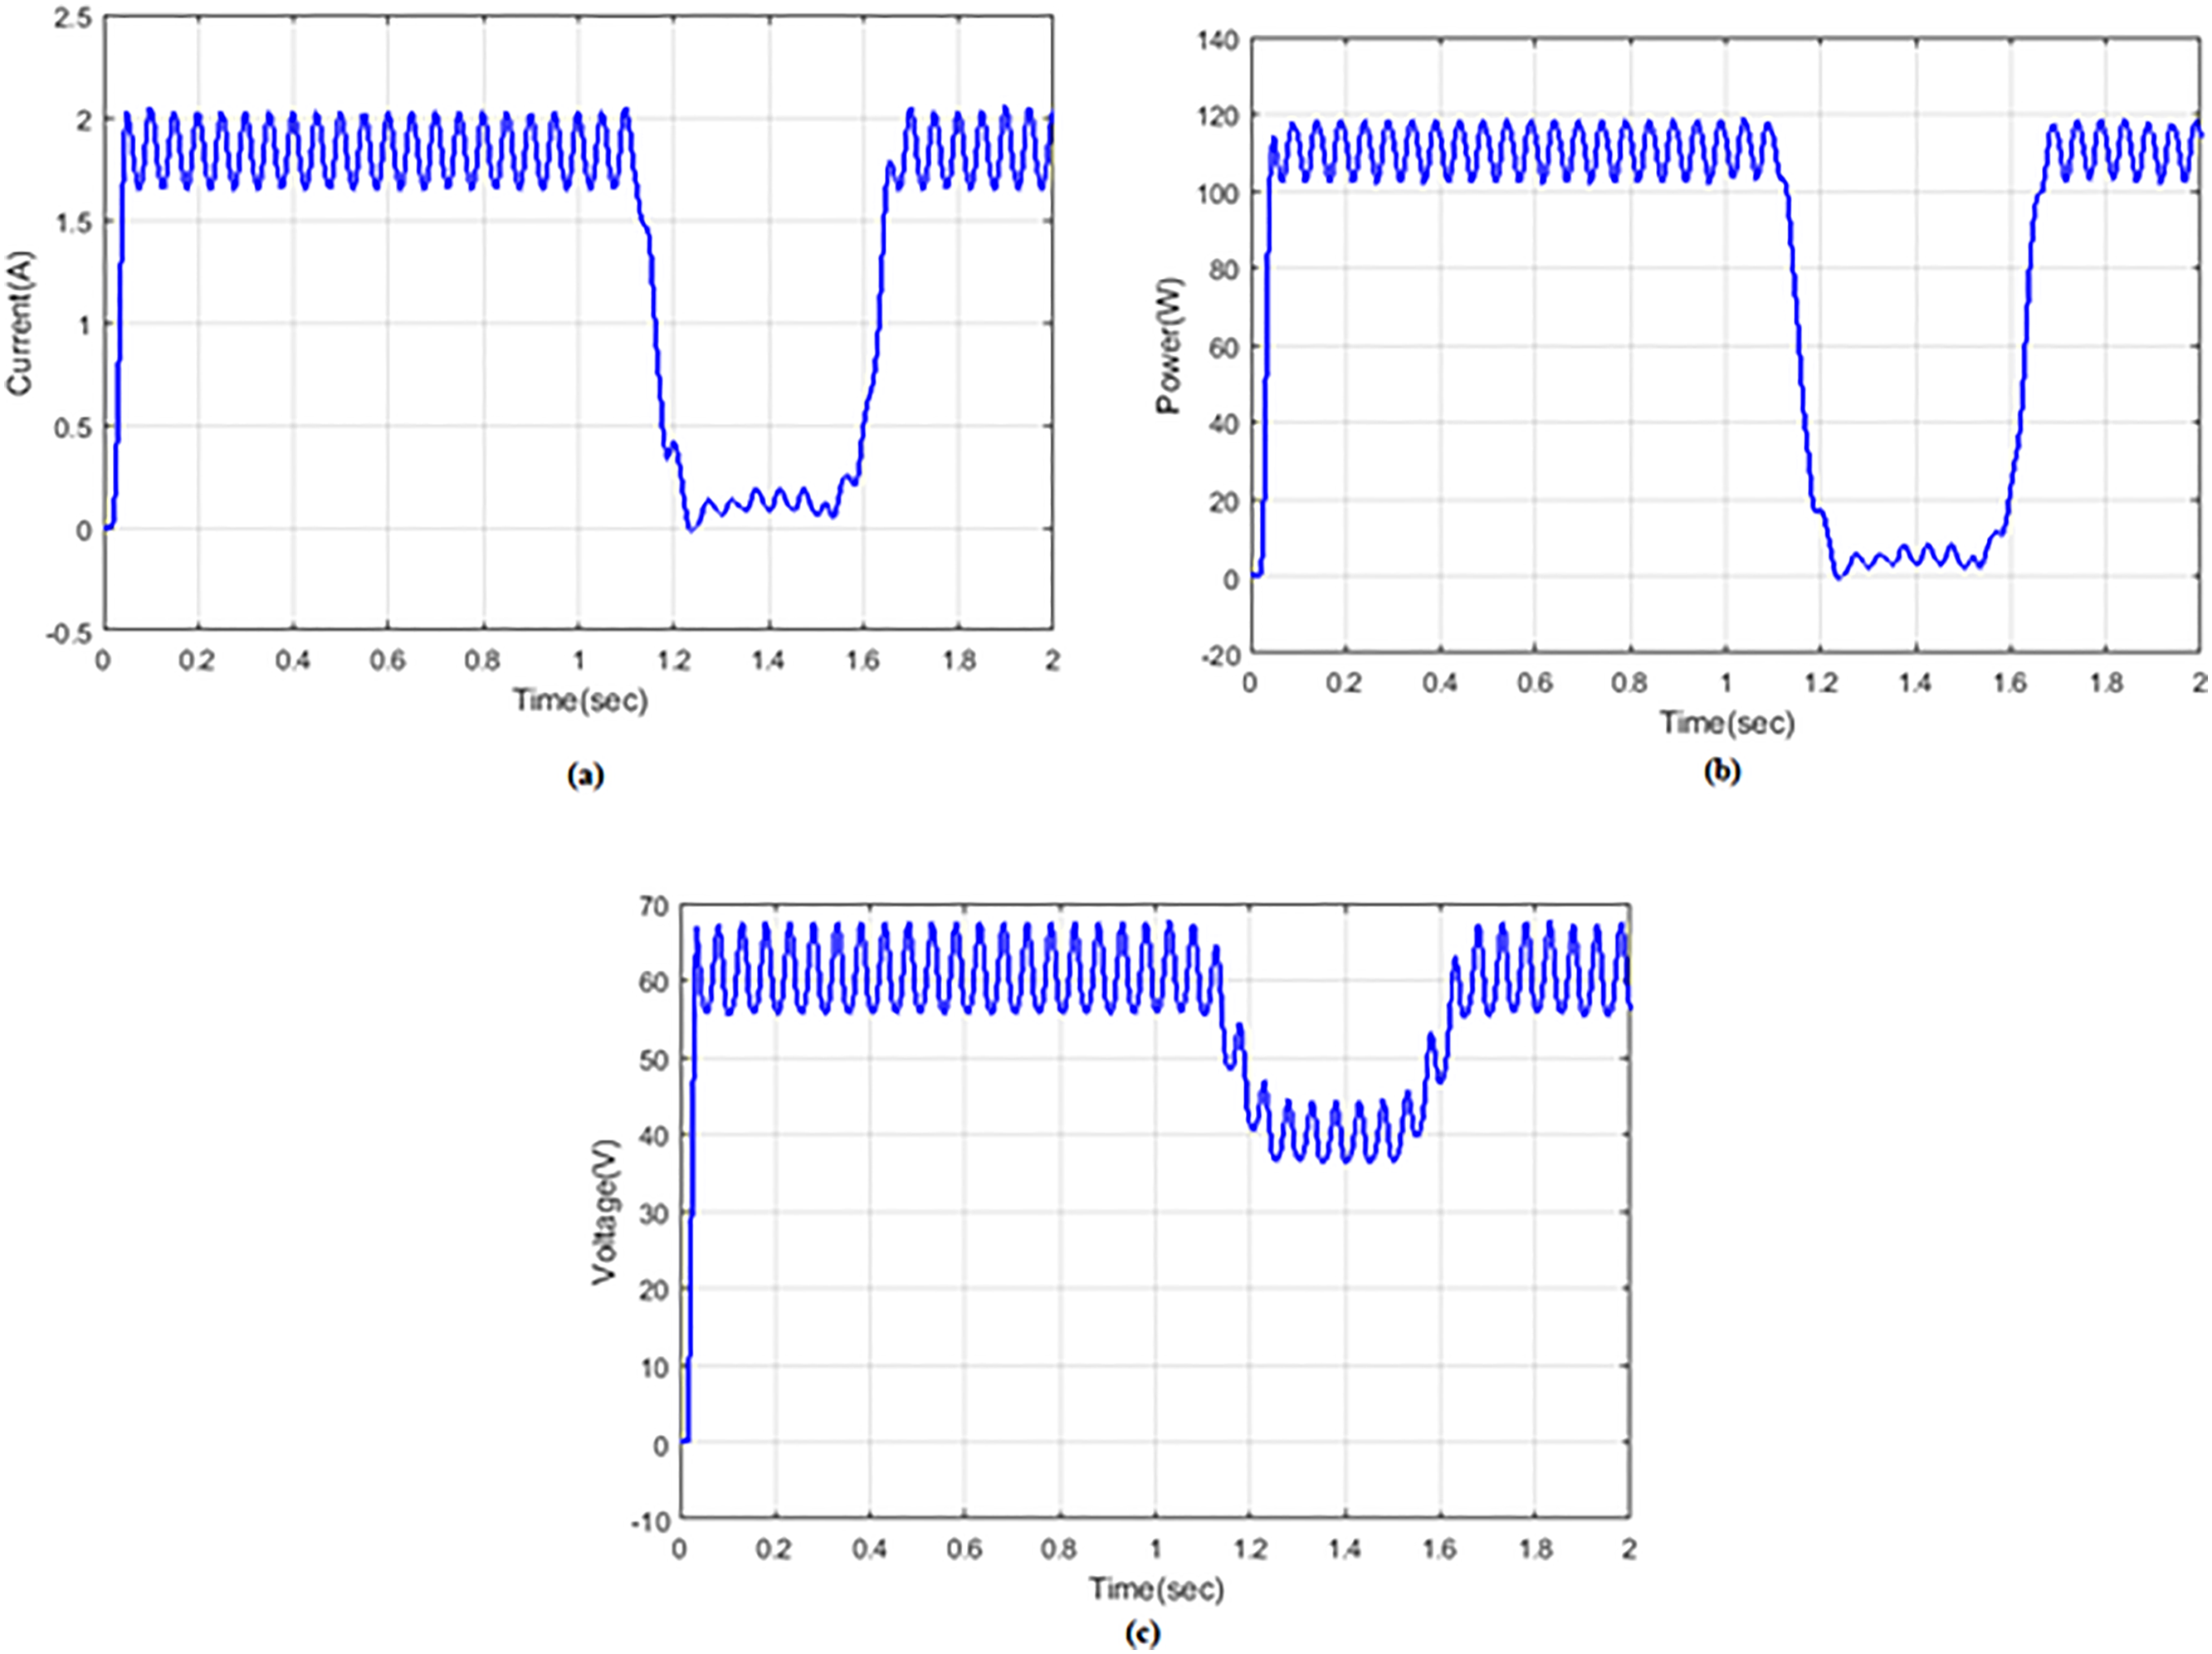
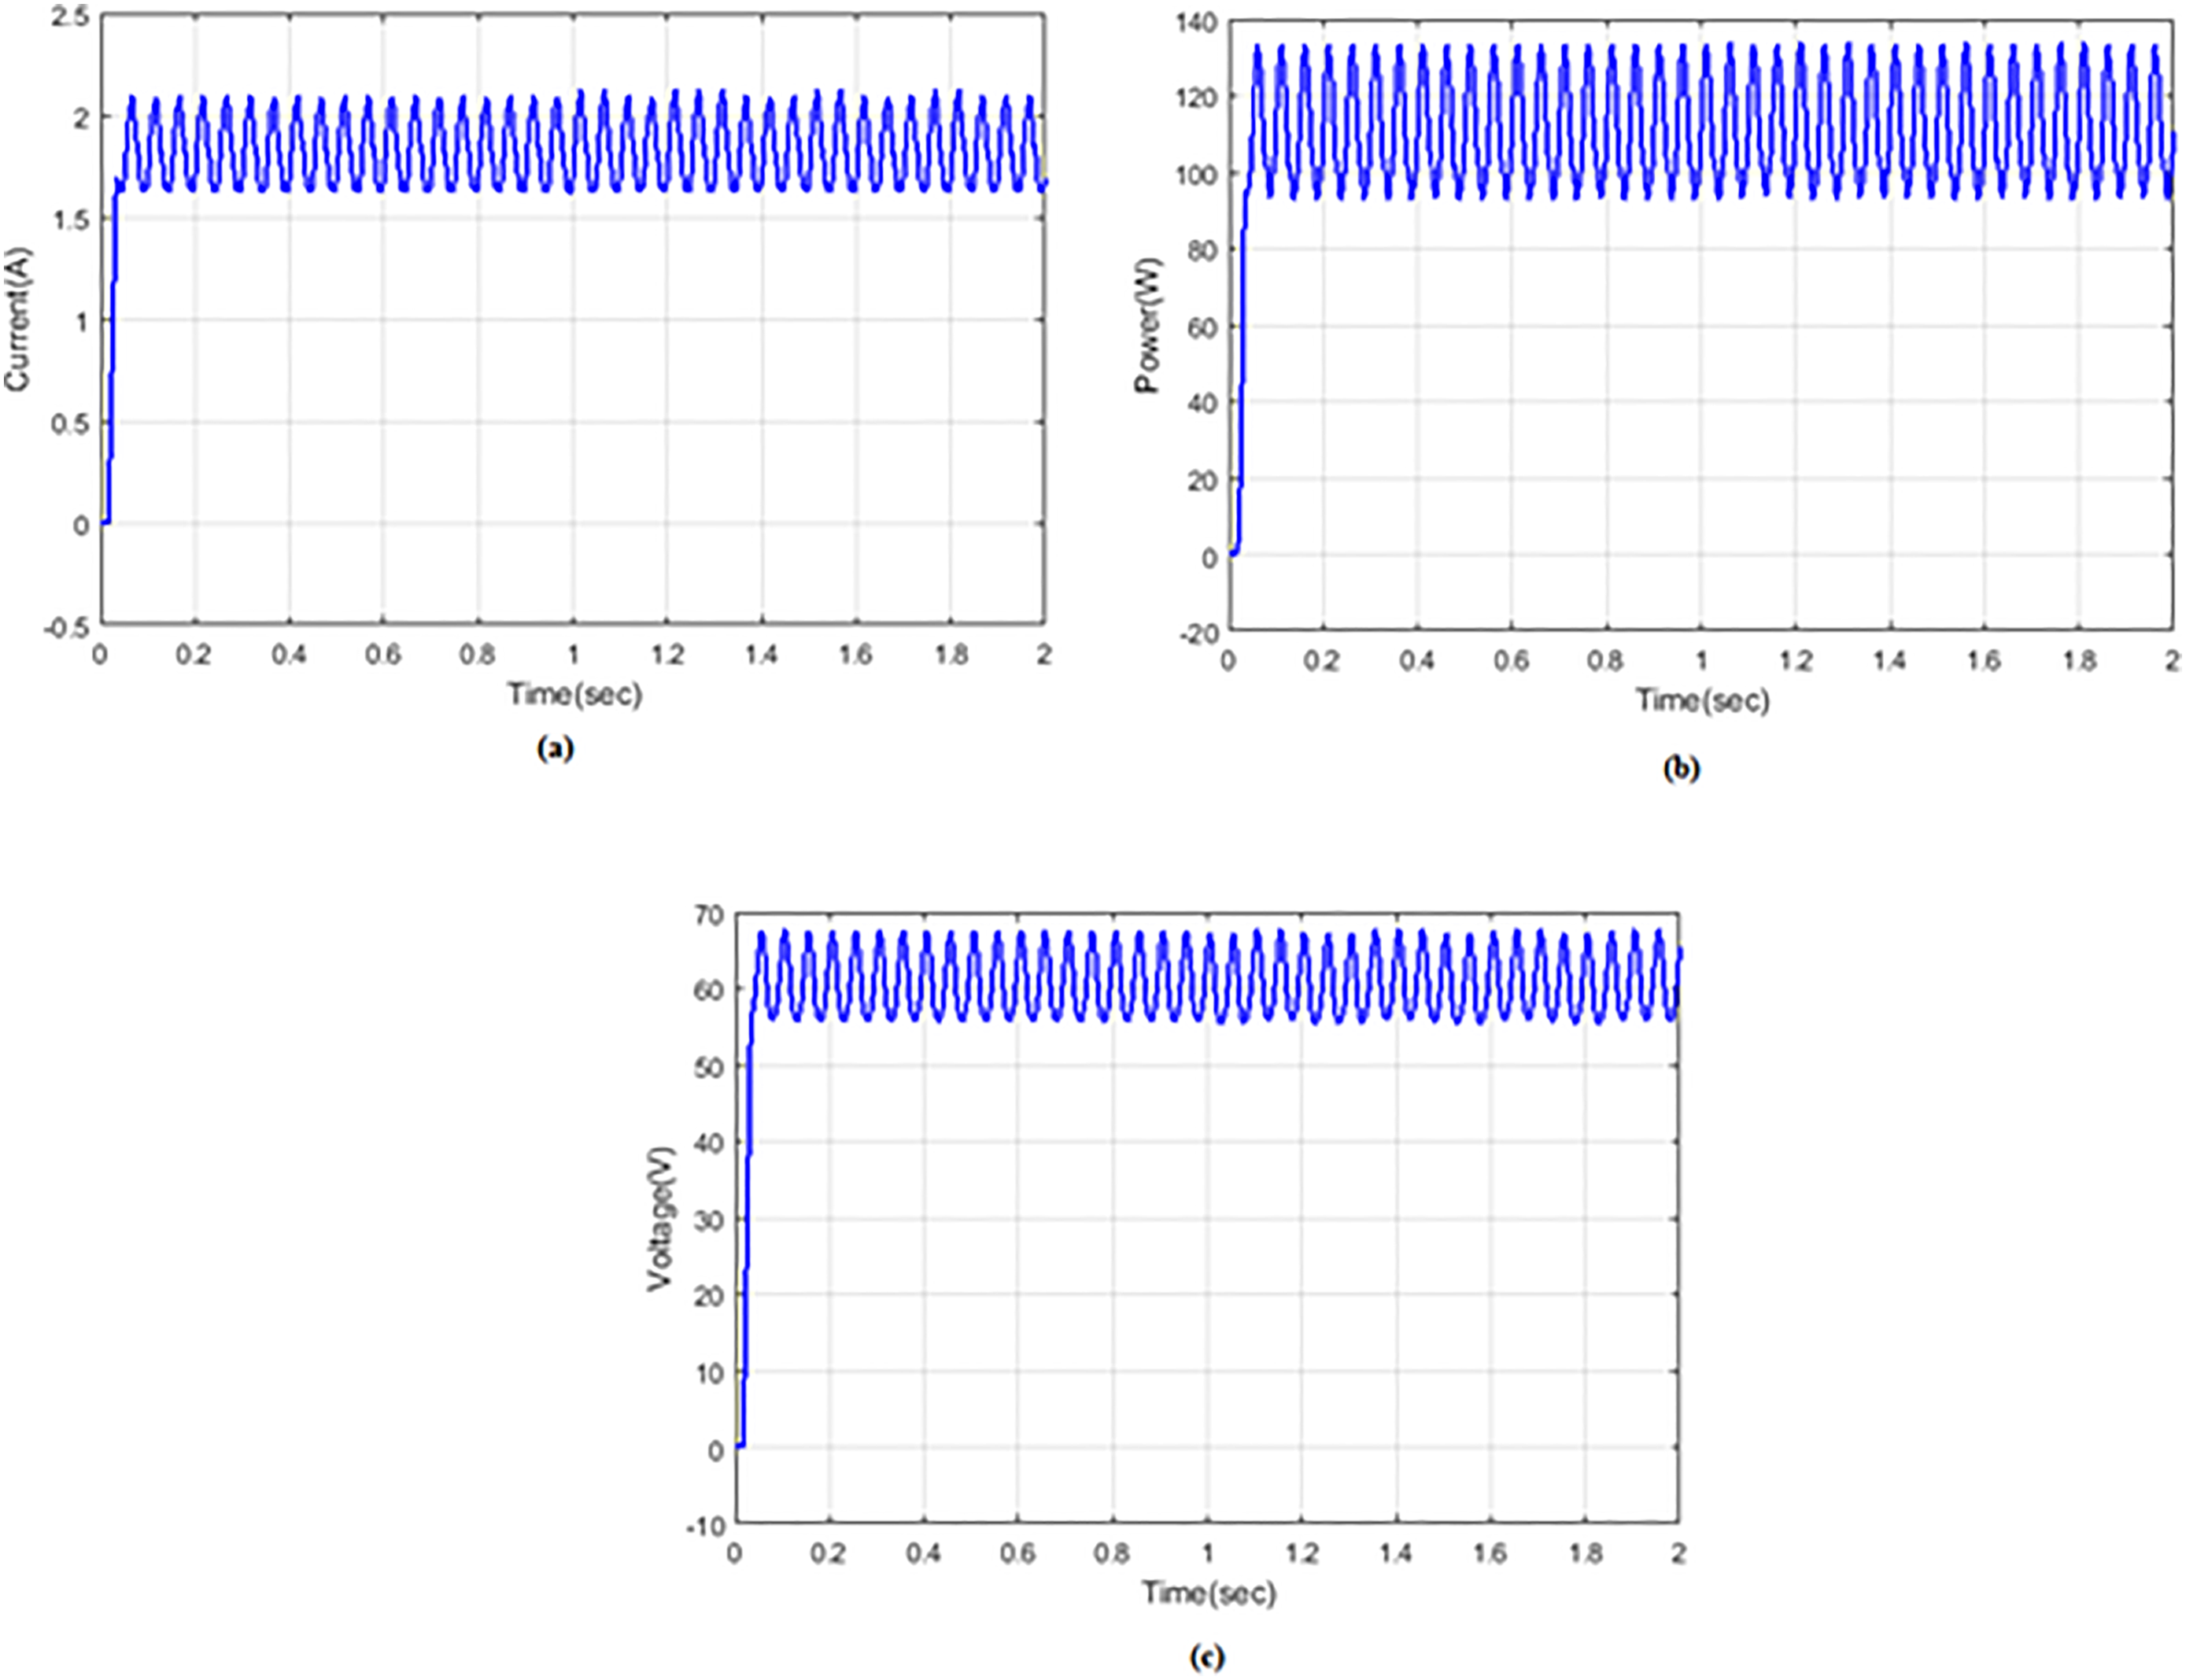
Figure 10 represents the inductor 1 current, voltage, and power waveform. In Figure 10(a), the inductor 1 current increased up to 2 A and remains constant during the time period of 0.1–1.08 time/s; then, there is a sudden decrease at 0.1 time/s due to the PV irradiance and remains constant during 1.22–1.6 time/s. Again, the current value increases to 2 A and remains constant for the remaining time period. Figure 10(b) represents the inductor 1 power variation in which the power value emerged up to 130 W and remains constant till 1.1 time/s; then, power value decreased to 0 W at 1.2 s and remains the same during 1.2–1.6 time/s. Again, the power rises to 120 W at 1.6 time/s and remains constant. Figure 10(c) shows the inductor 1 voltage waveform where the voltage increased to 68 V and remains at the same value till 1.1 time/s; then, the voltage value decreases to 38 V during 1.2–1.5 time/s. Again, there is a sudden increase in voltage up to 68 V at 1.5 time/s and remains constant.
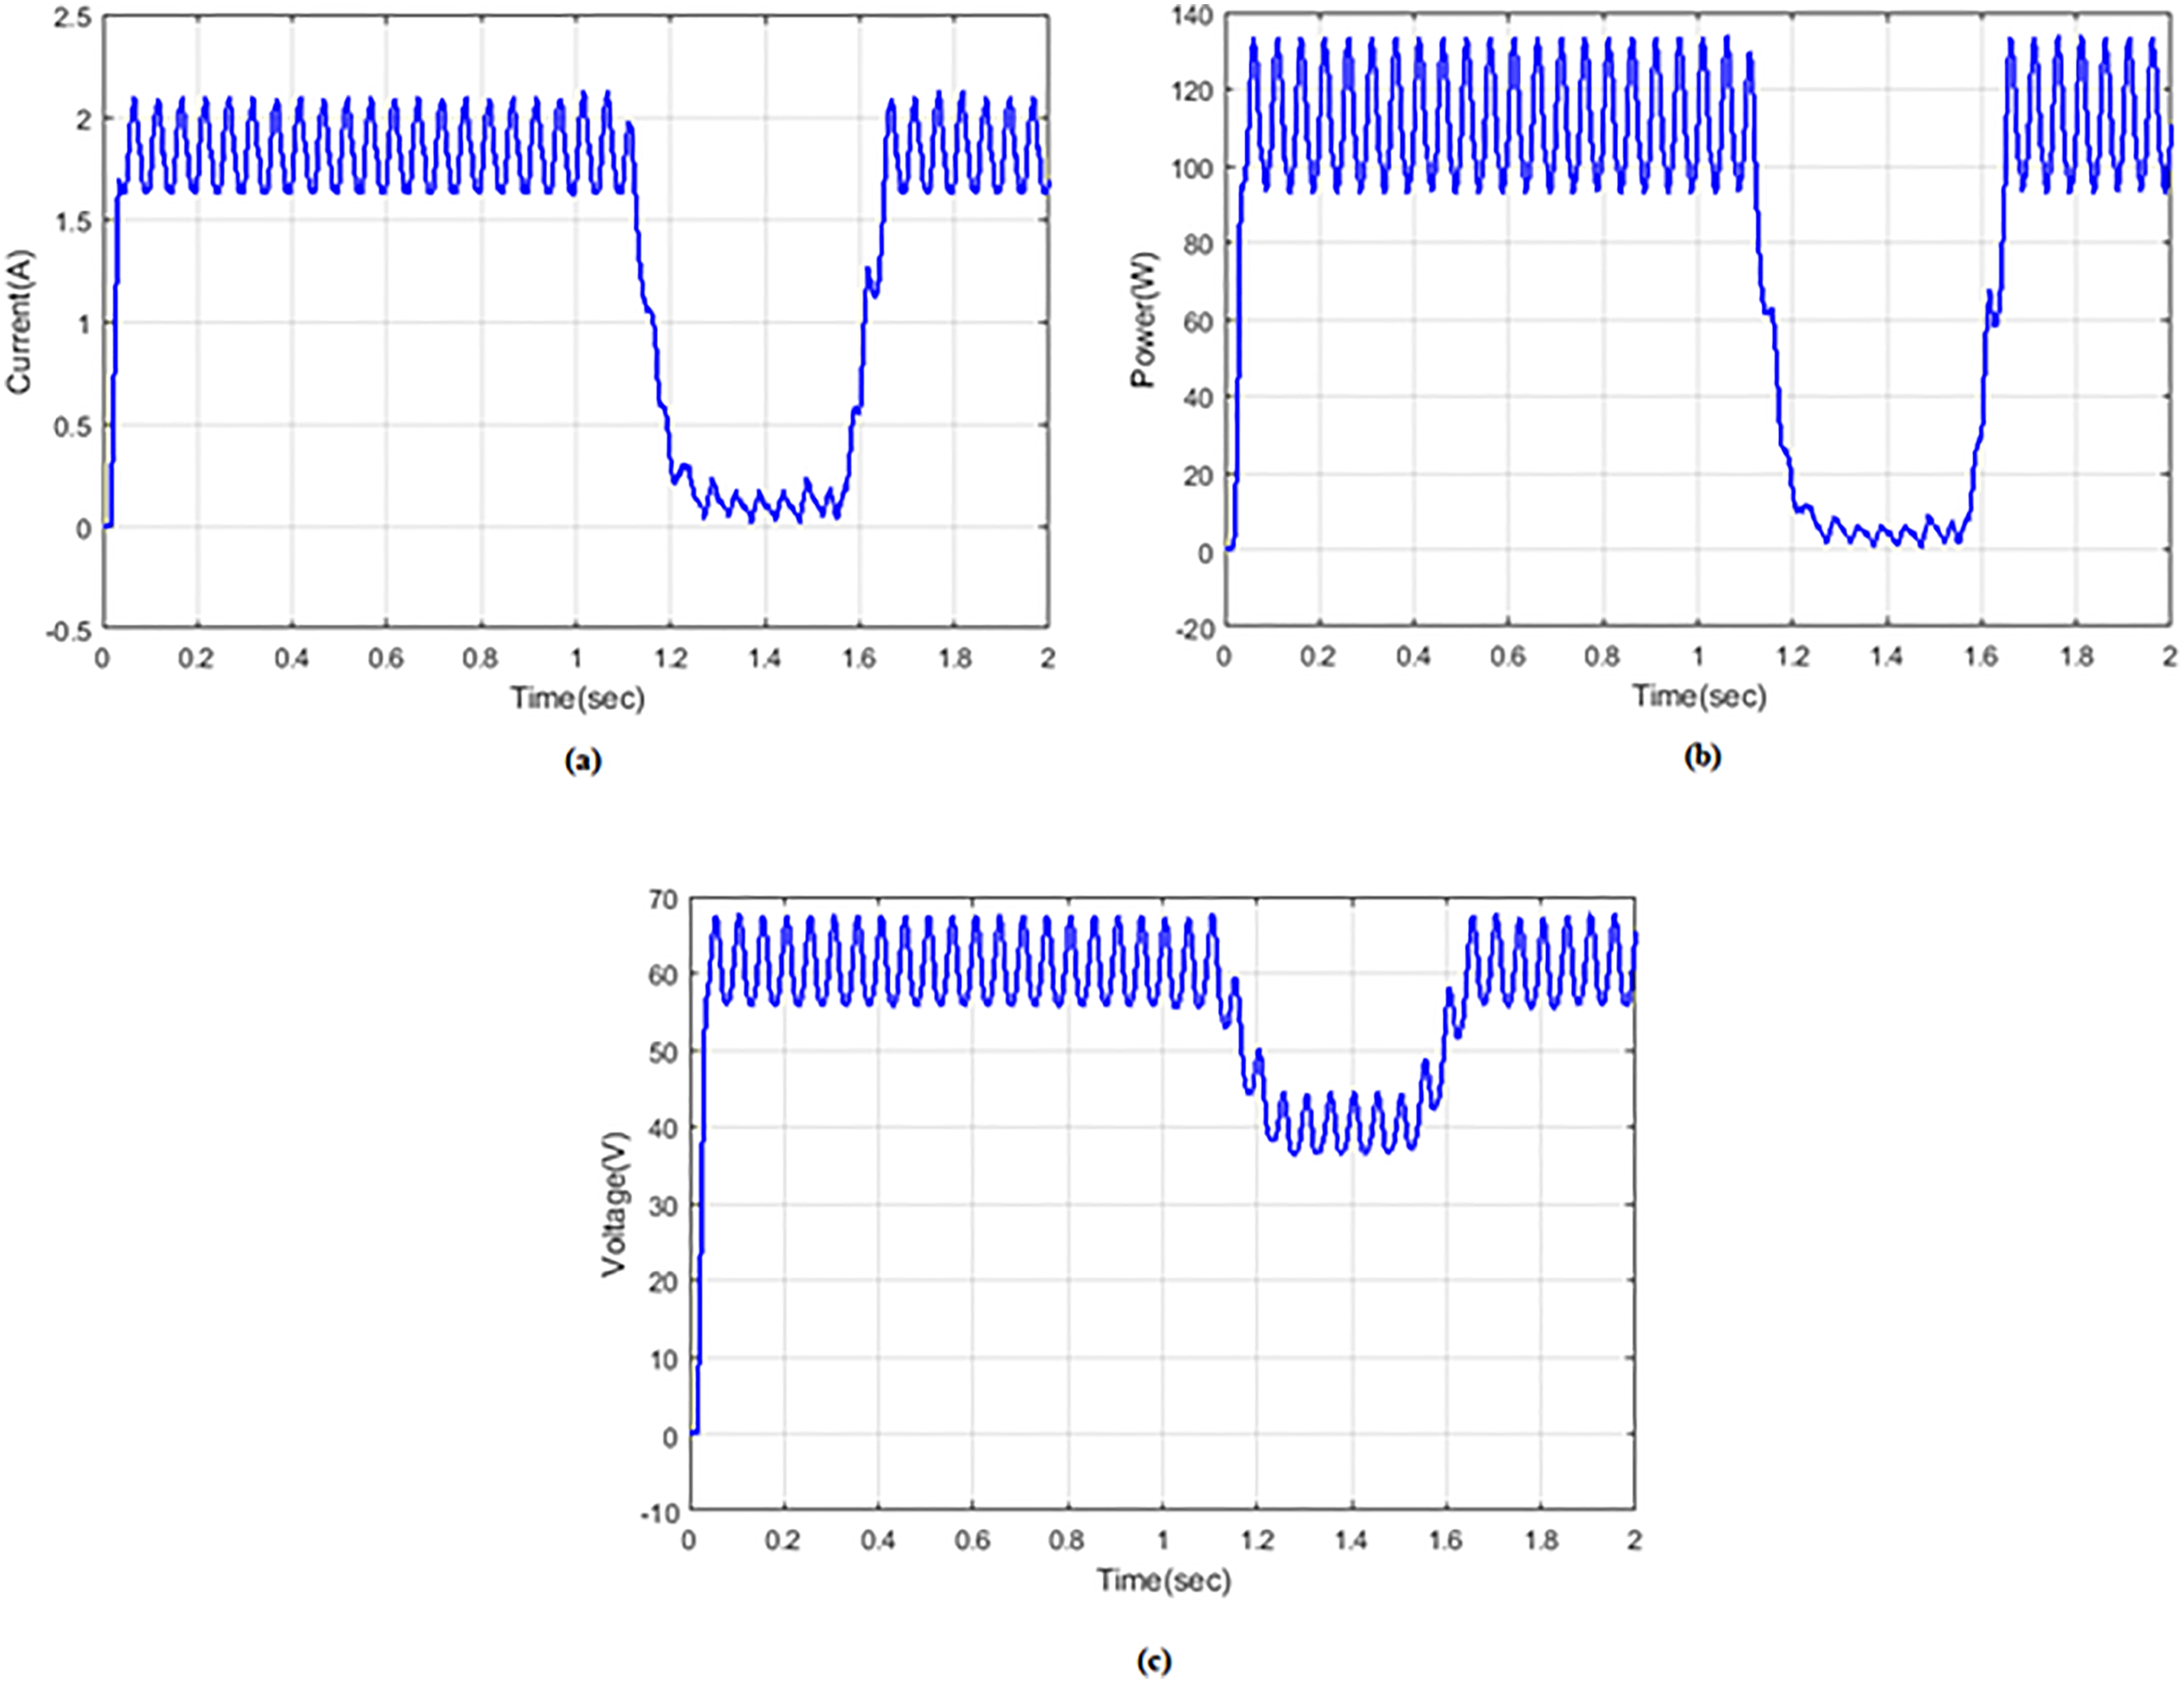
Inductor 1: (a) current, (b) power, and (c) voltage.
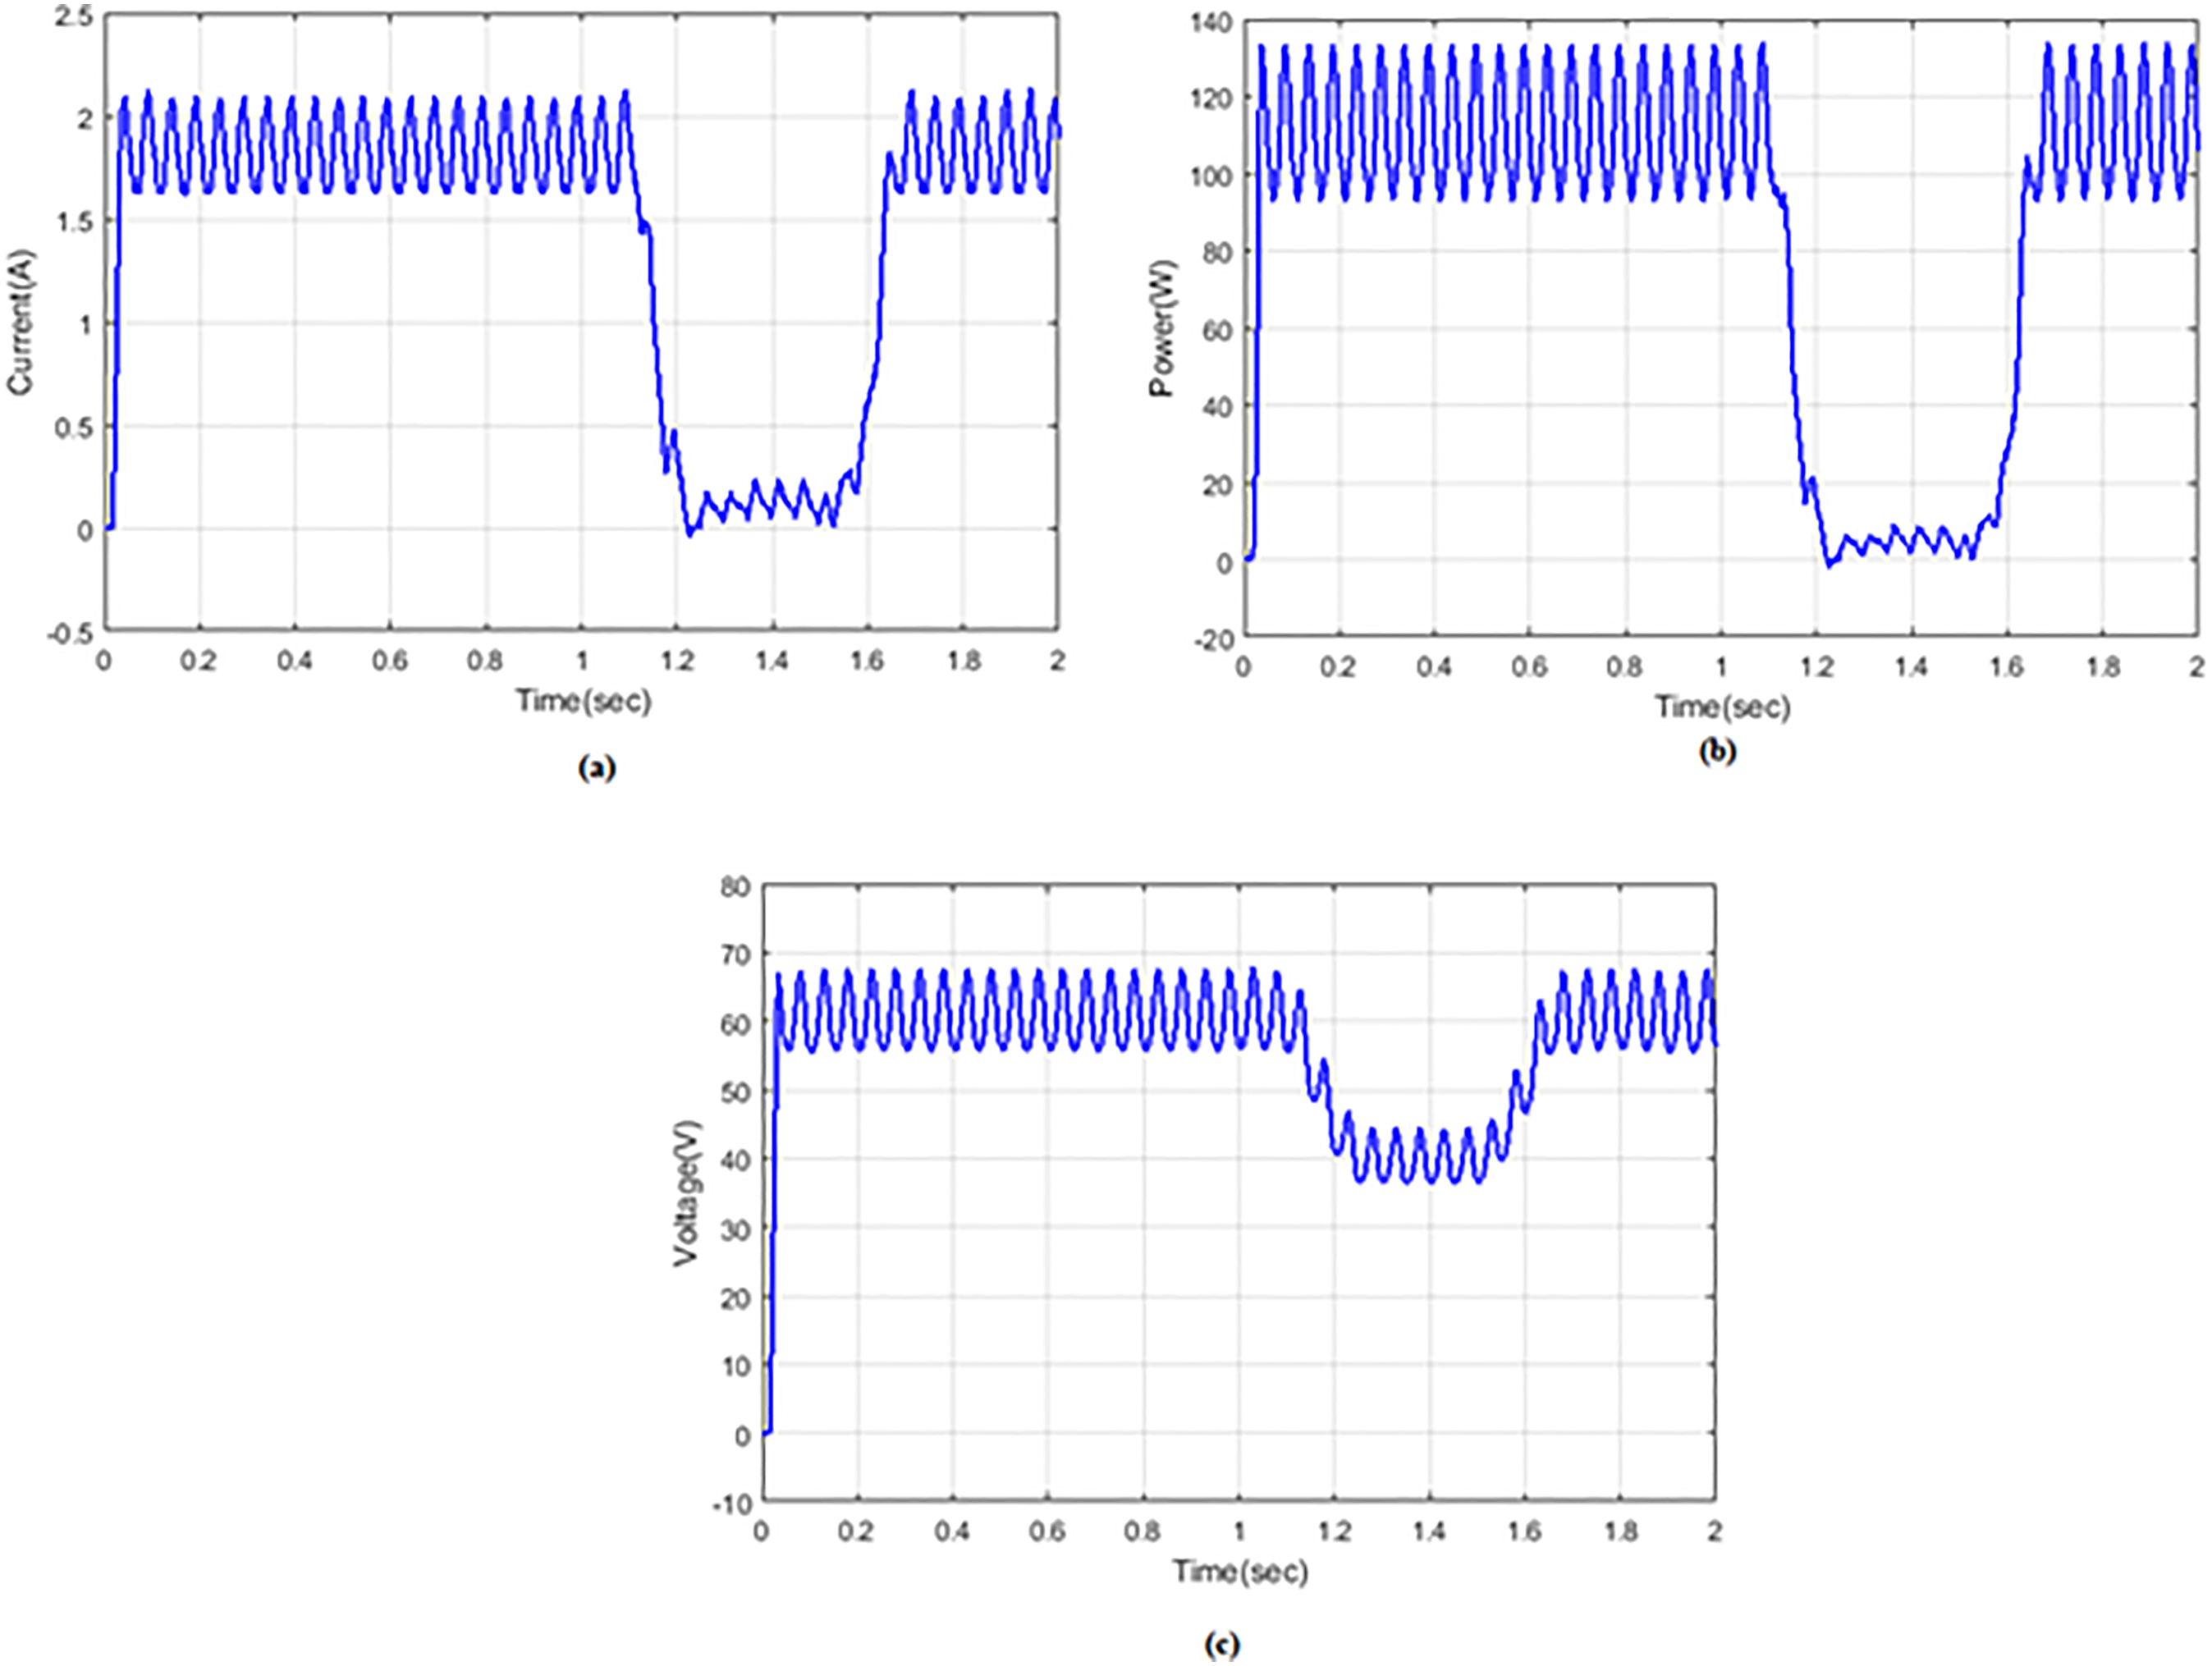
Figure 11 represents the inductor 2 current, voltage, and power waveform. In Figure 11(a), the inductor 2 current increased up to 2 A and remains constant during the time period of 0.01–1.1 time/s; then, there is a sudden decrease to 0 A during 1.2–1.5 time/s due to the PV irradiance. Again the current value increases to 2A at 1.5 time/s and remains constant for the remaining time period. Figure 11(b) represents the inductor 2 power variation in which the power value emerged from 0 to 110 and then increases to 120 W during time period of 0–0.1 time/s and remains constant during 0.1–1.1 time/s; then, power value decreased to 0 W during 1.2–1.5 time/s and remains the same. Again, the power rises to 120 W at 1.5 time/s and remains constant. Figure 11(c) shows the inductor 2 voltage waveform where the voltage increased to 68 V and remains at the same value till 1.1 time/s; then, the voltage value decreases to 35 V during 1.1–1.55 time/s. Again, there is a sudden increase in voltage up to 68 V at 1.55 time/s and remains constant.
Inductor 2: (a) current, (b) power, and (c) voltage.
Figure 12 represents the inductor 4 current, voltage, and power waveform. In Figure 12(a), the inductor 4 current increased up to 2 A and remains constant during the time period of 0.01–1.1 time/s; then, there is a sudden decrease to 0 A during 1.2–1.5 time/s due to the PV irradiance. Again, the current value increases to 2 A at 1.5 time/s and remains constant for the remaining time period. Figure 12(b) represents the inductor 4 power variation in which the power value emerged from 0 to 138 W and during the time period of 0–1.1 time/s, it remains constant. Then, the power value decreased to 0 W during 1.2–1.5 time/s and remains the same. Again, the power rises to 138 W at 1.65 time/s and remains constant. Figure 12(c) shows the inductor 4 voltage waveform where the voltage increased to 68 V and remains at the same value till 1.1 time/s; then, the voltage value decreases to 38 V during 1.1–1.55 time/s. Again, there is a sudden increase in voltage up to 68 V at 1 .65 time/s and remains constant.
Inductor 4: (a) current, (b) power, and (c) voltage.
Figure 13 represents load current, voltage, and power waveform. In Figure 13(a), the load current increased up to 27.5 A at 0.01 time/s and remains constant. Figure 13(b) represents the load power variation in which the power value emerged from 0 to 4000 W through time period of 0–0.01 time/s and it remains stable. Figure 13(c) shows that load voltage waveform where the voltage increased to 150 V at 0.01 time/s and it remainsstable.
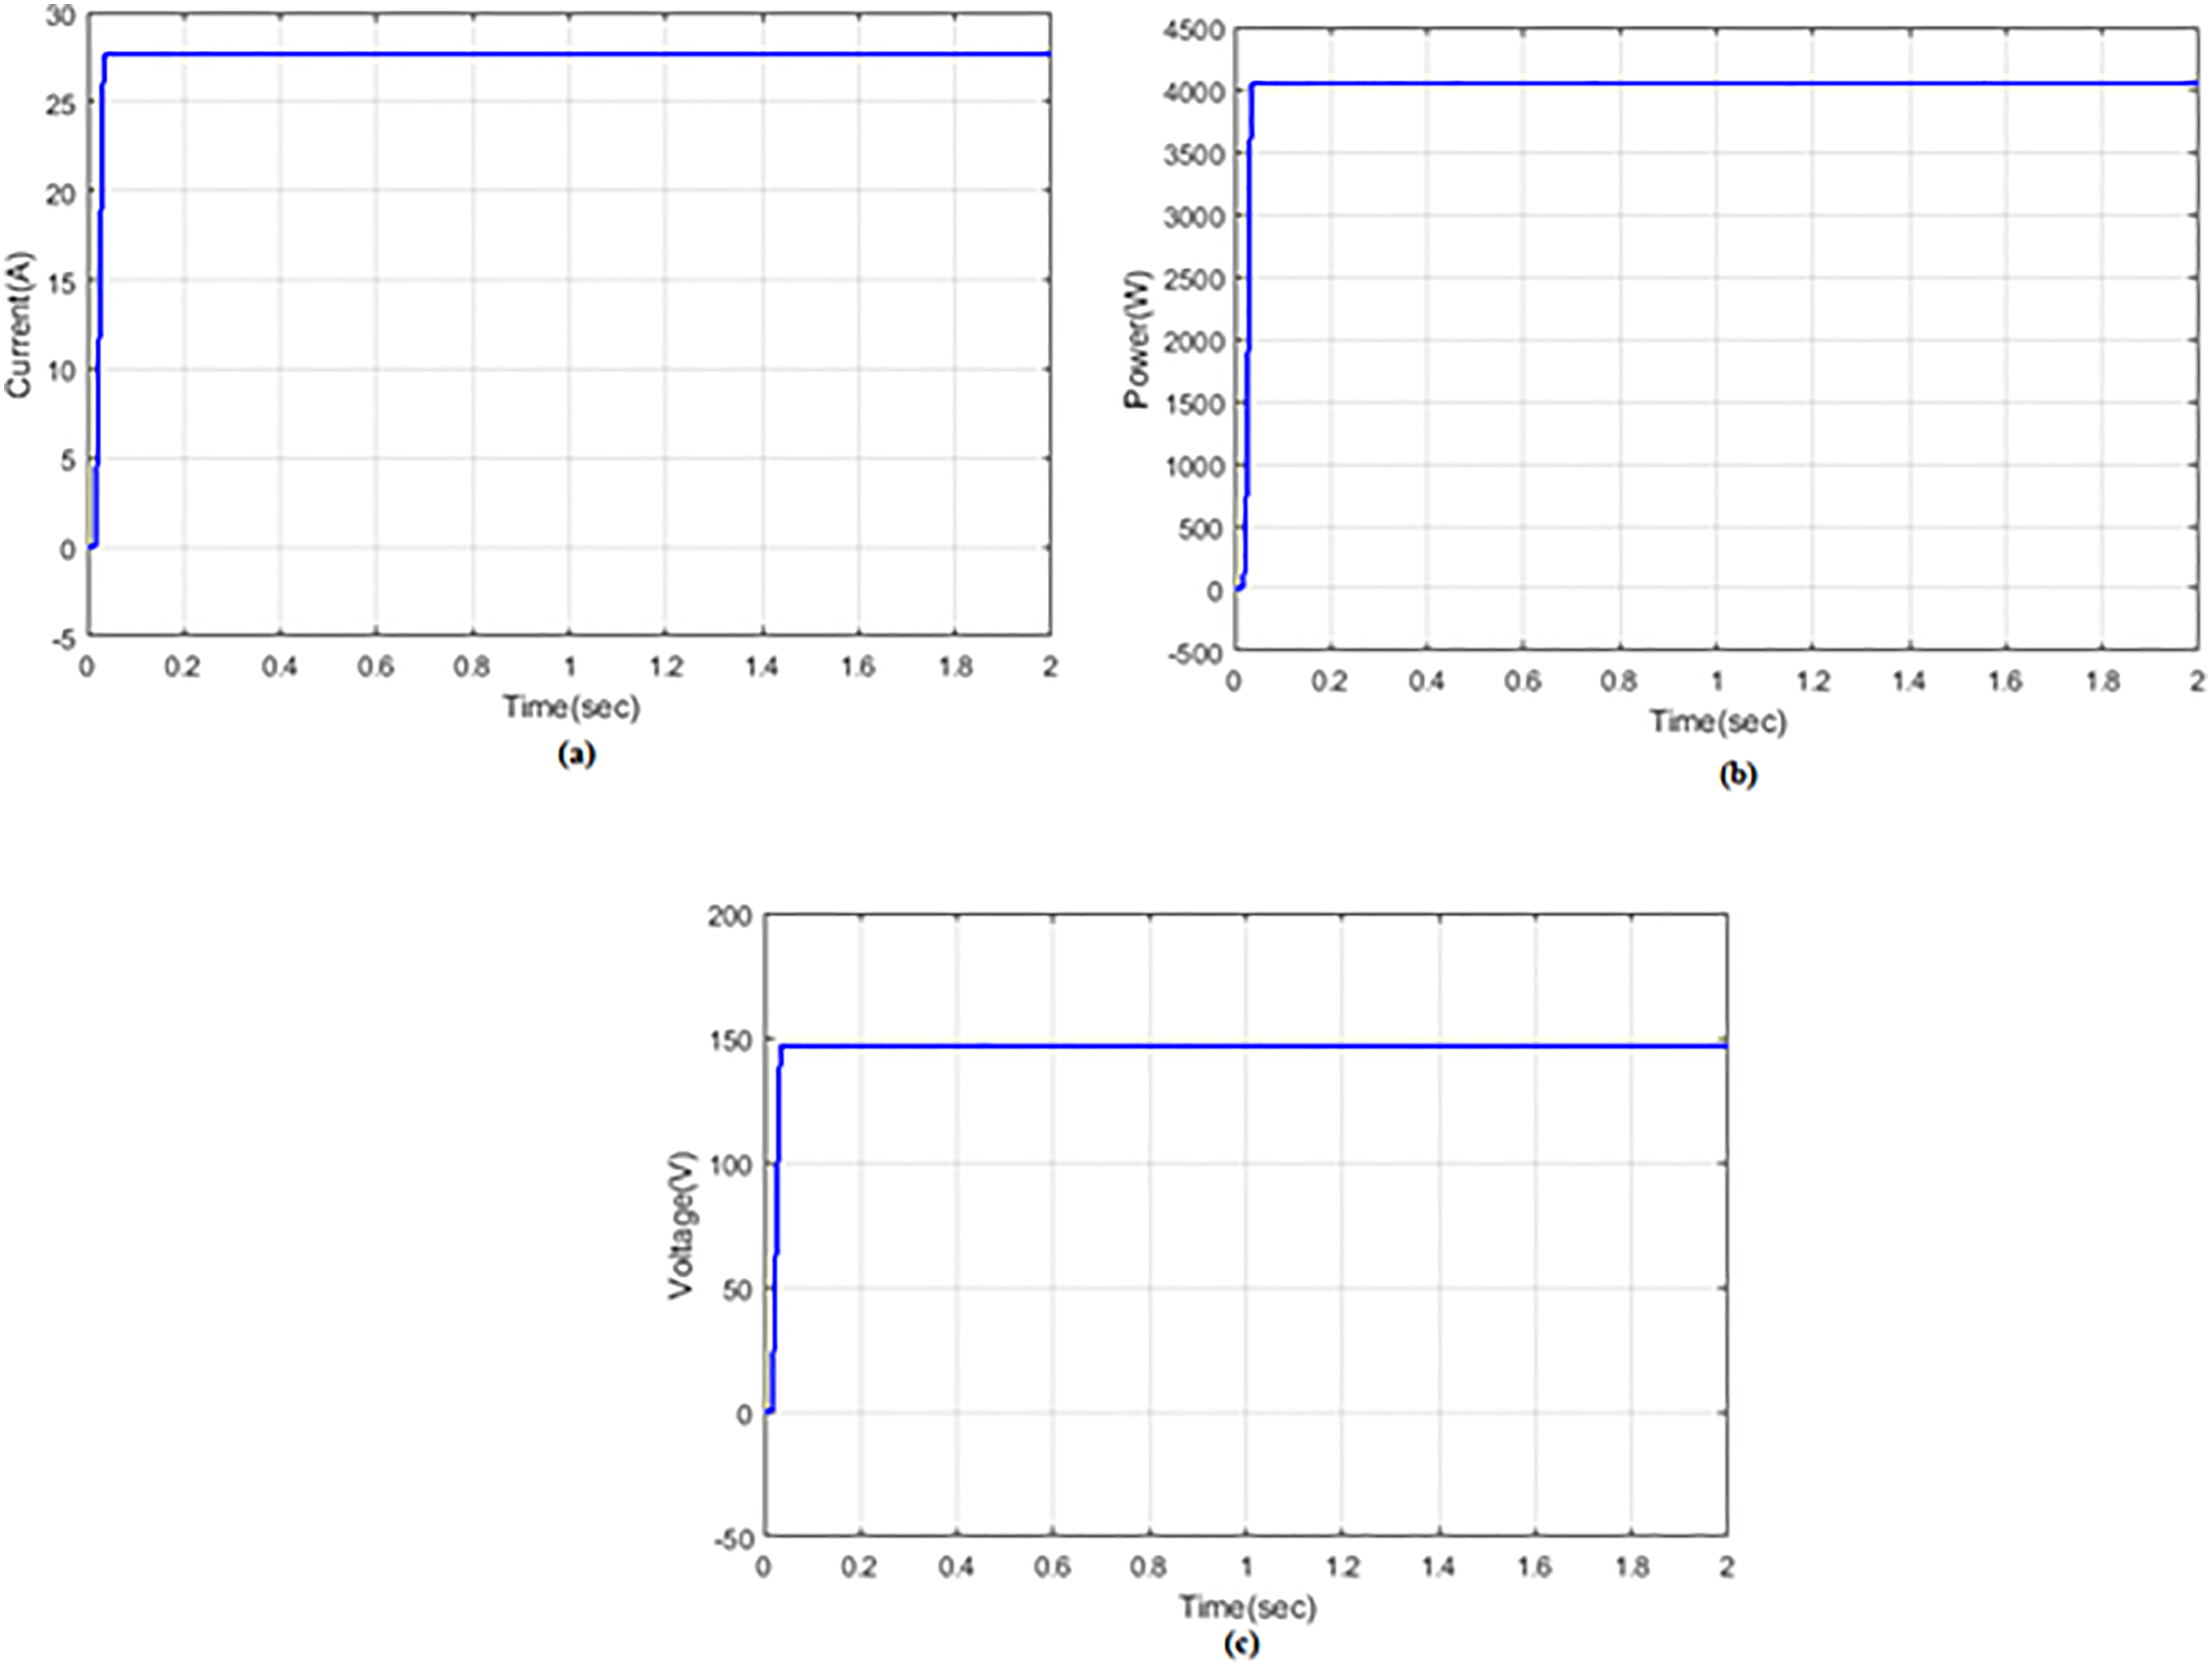
Load: (a) current, (b) power, and (c) voltage.
Figure 14 represents that PV current, voltage, and power waveform. In Figure 14(a), the PV current increased up to 84 A at 0.01 time/s and remains constant during the time period of 0.01–1.25 time/s; then, there is a sudden decrease to 10 A during 1.22–1.5 time/s due to PV irradiance. Again, the current value increases to 84 A at 1.5 time/s and remains constant for the remaining time period. Figure 14(b) represents the PV power variation in which the power value emerged from 2.4 W during the time interval 0–0.01 time/s and remains constant during 0.01–1.1 time/s. Then the power value decreased to 0 W during 1.1–1.21 time/s and remains the same. Again, the power rises to 2.4 W at 1.5 time/s and remains constant. Figure 14(c) shows the PV voltage waveform where the voltage increased to 290 V and remains at the same value till 1.1 time/s; then, the voltage value decreases to 160 V during 1.1–1.55 time/s. Again, there is a sudden increase in voltage up to 290 V at 1.65 time/s and remains constant.
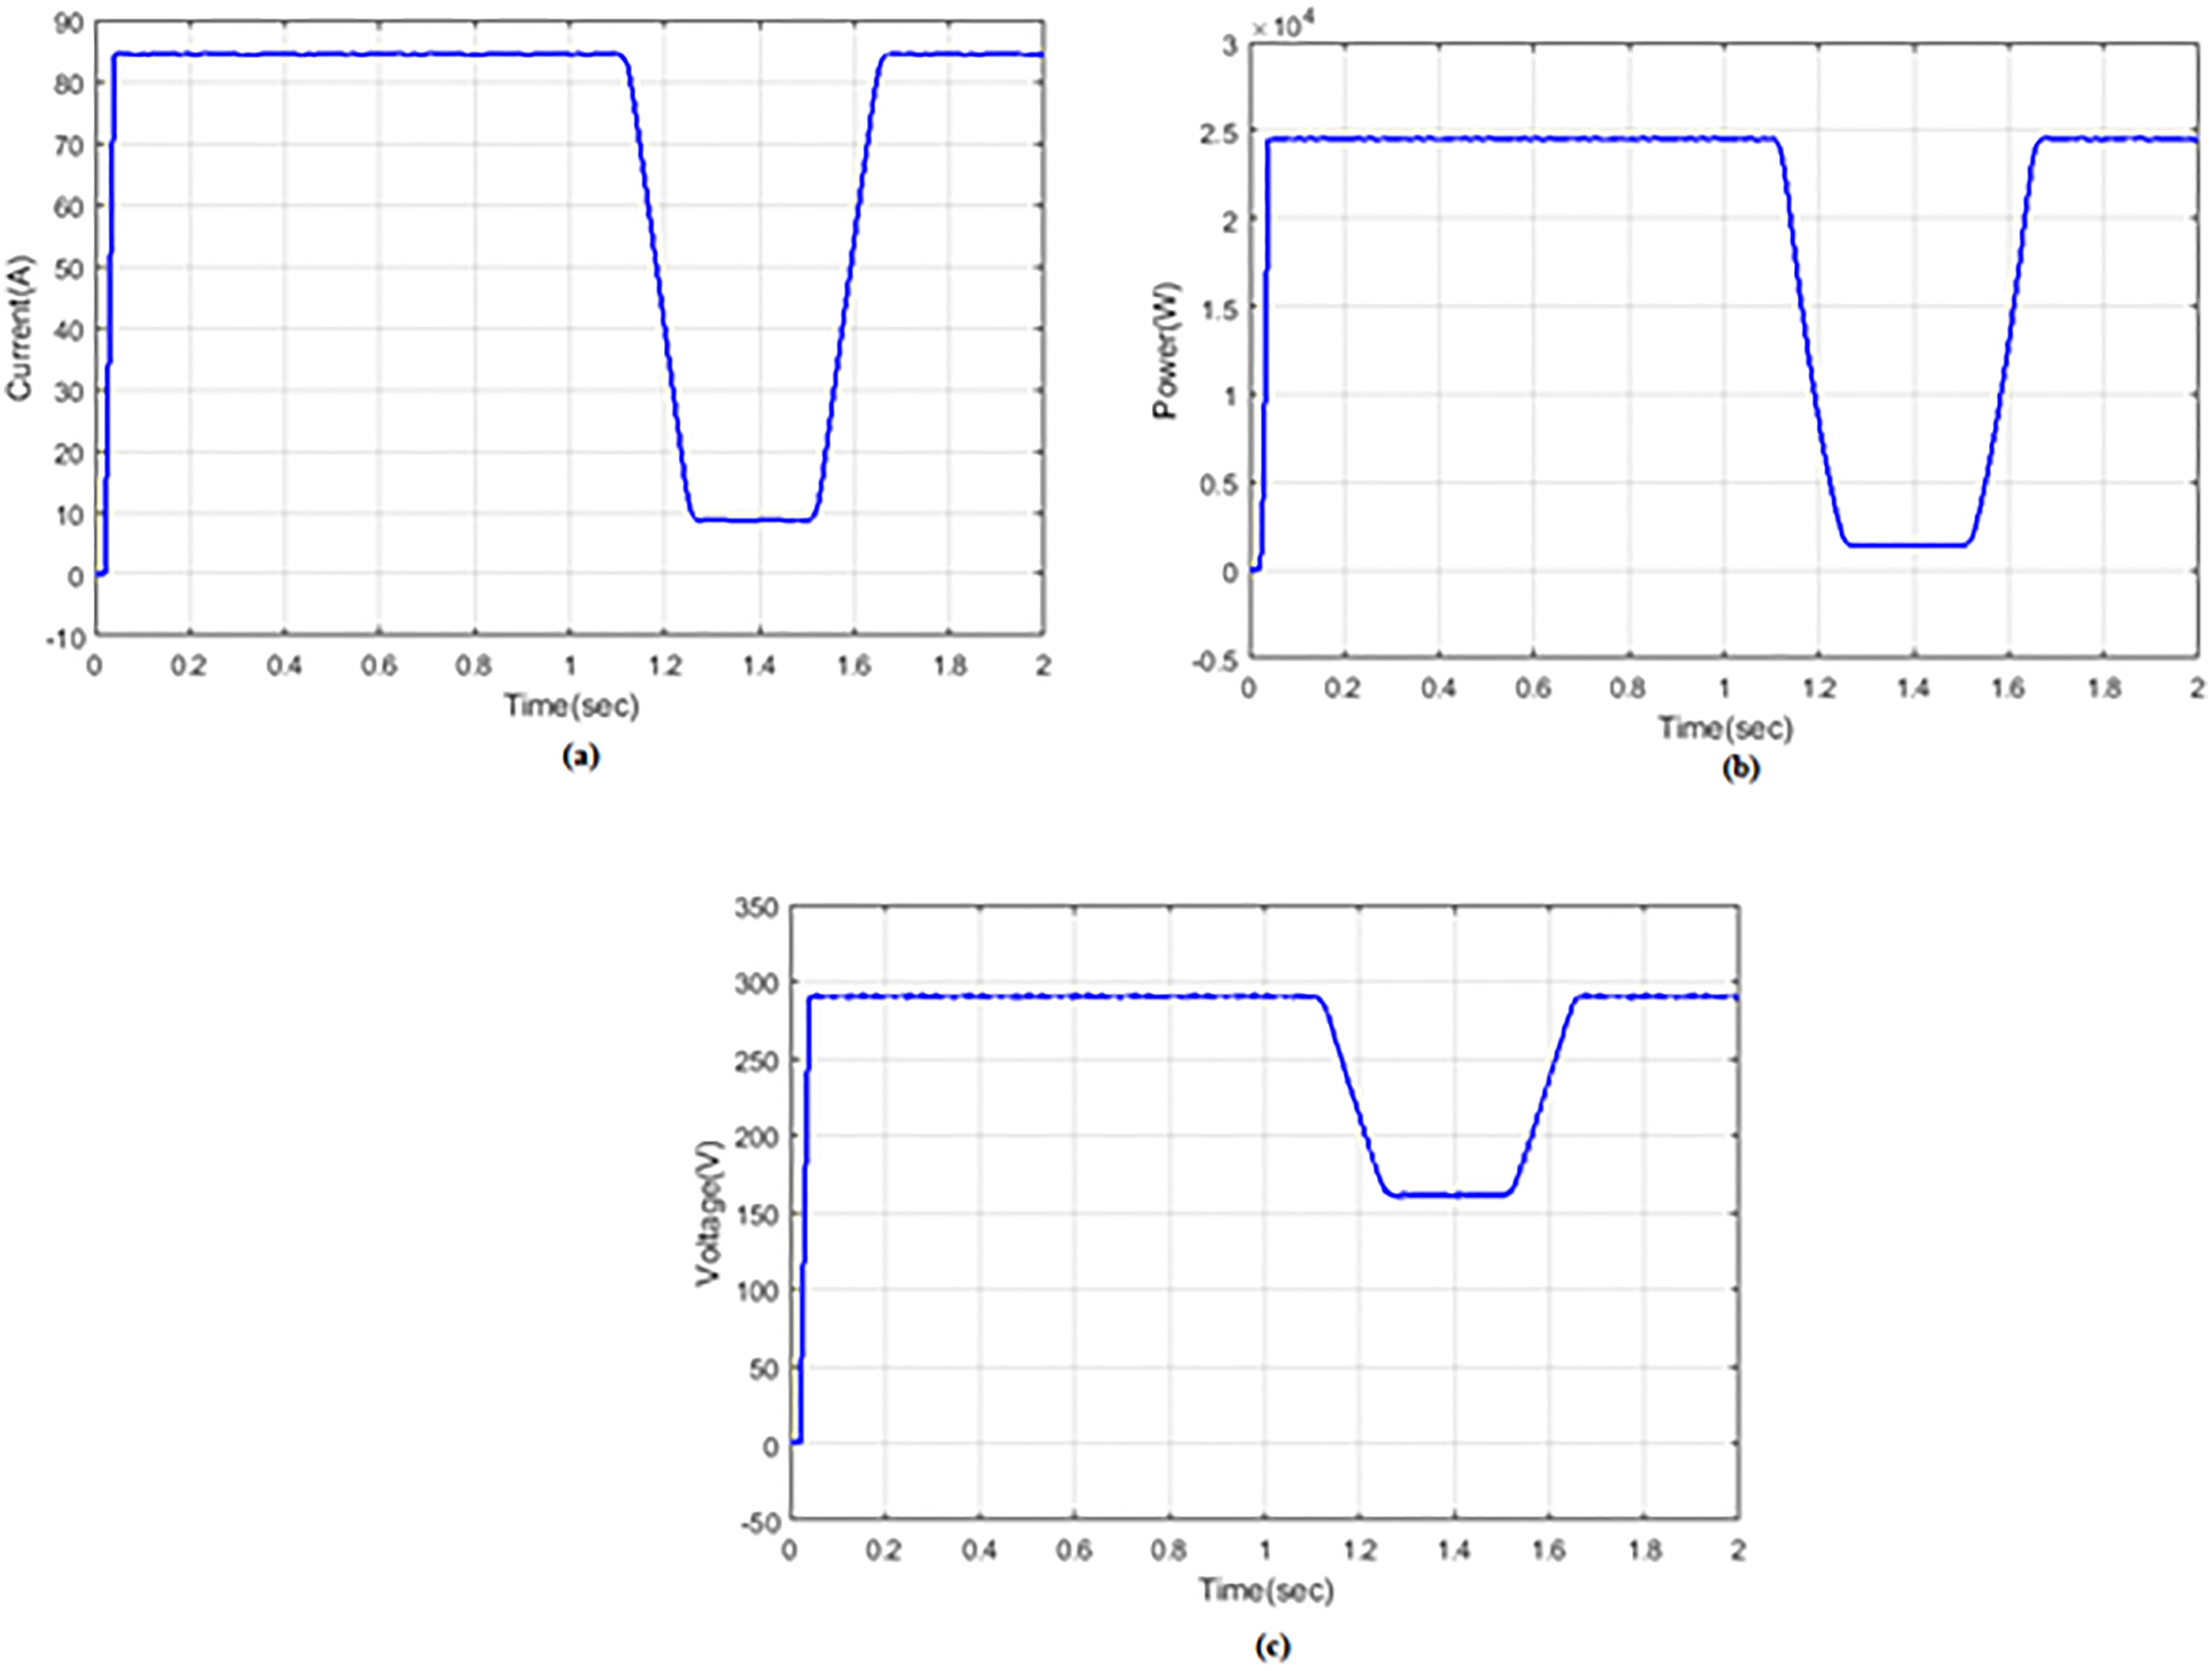
PV: (a) current, (b) power, and (c) voltage.
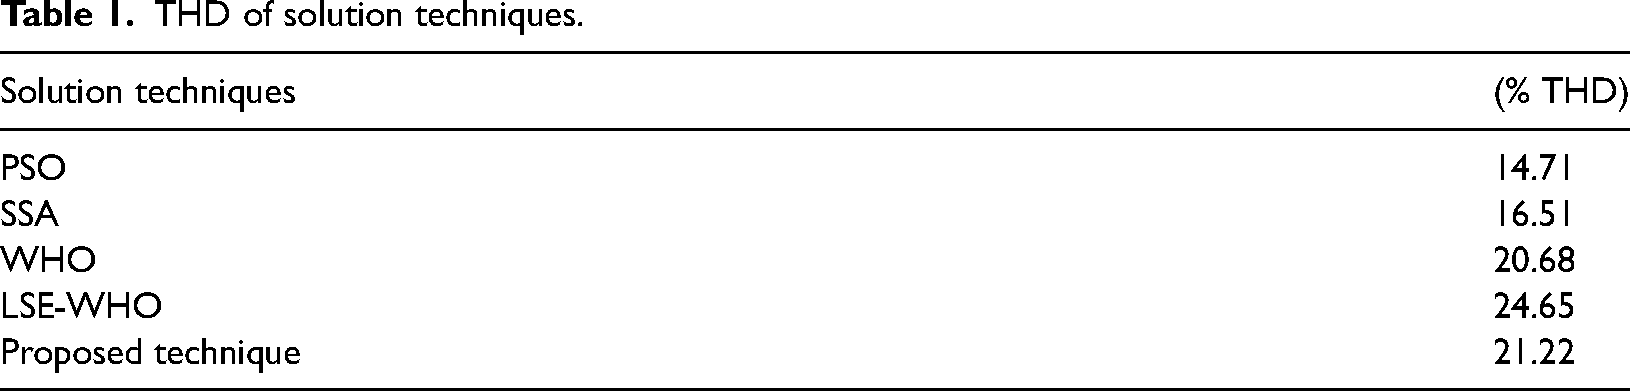
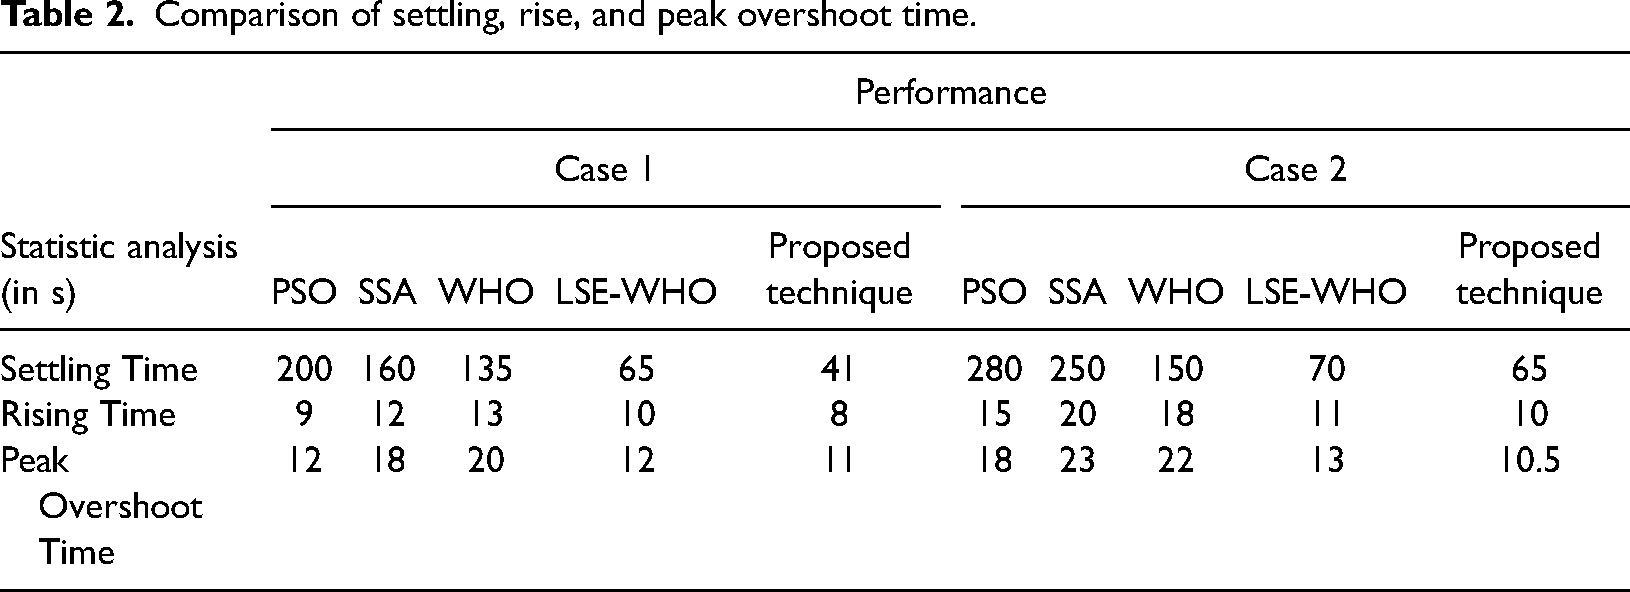
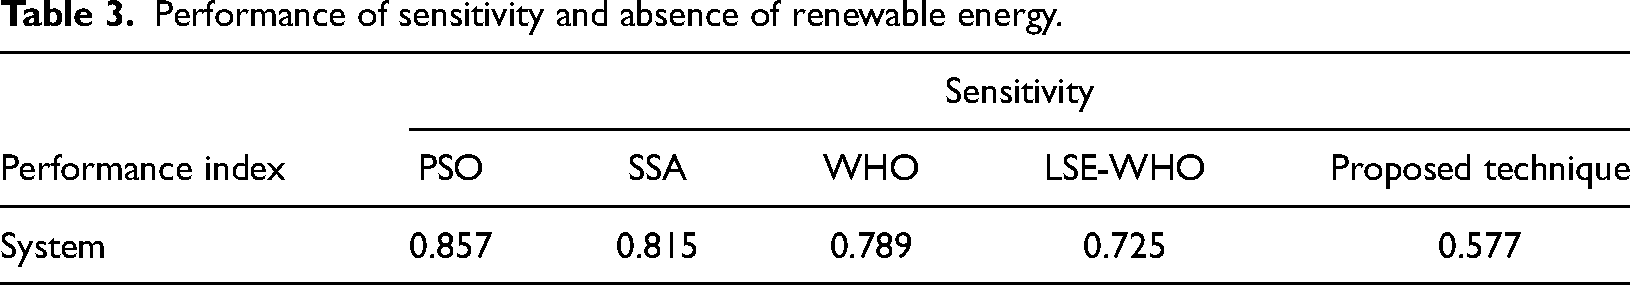
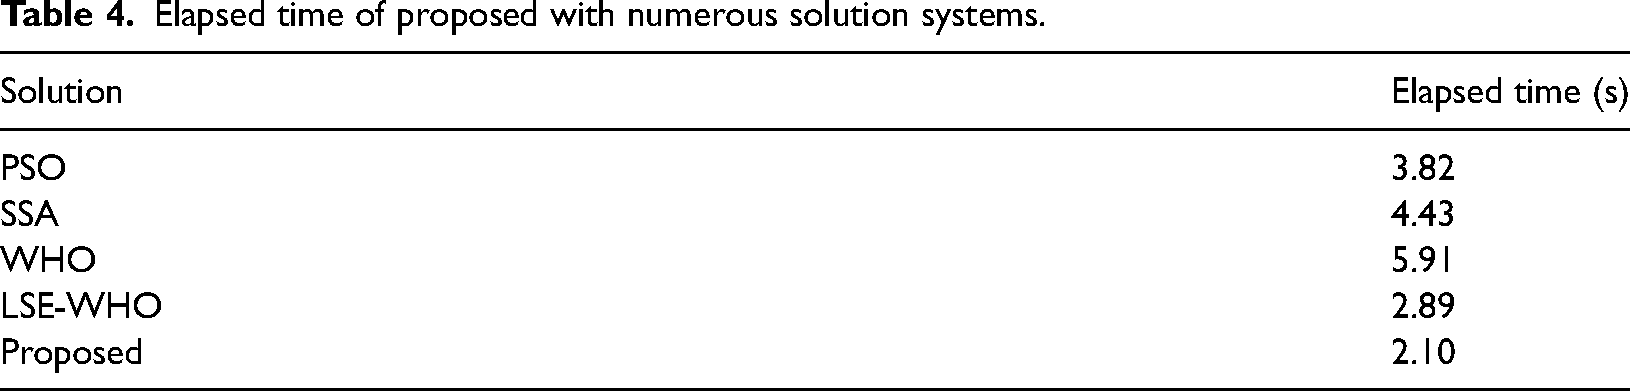
Figure 15 shows the performance comparison of the PV power of the proposed LA-HBO method with other existing methods such as LSE-WHO, WHO, SSA, and PSO. From the waveform, it is proved that the PV power value of the proposed system is higher than other existing systems. The total harmonic distortion (THD) of solution techniques is shown in Table 1. Comparison analysis of settling, rise, and peak overshoot time is shown in Table 2. Performance comparison of sensitivity and absence of renewable energy is shown in Table 3. Elapsed time of the proposed and several solution systems is provided in Table 4.
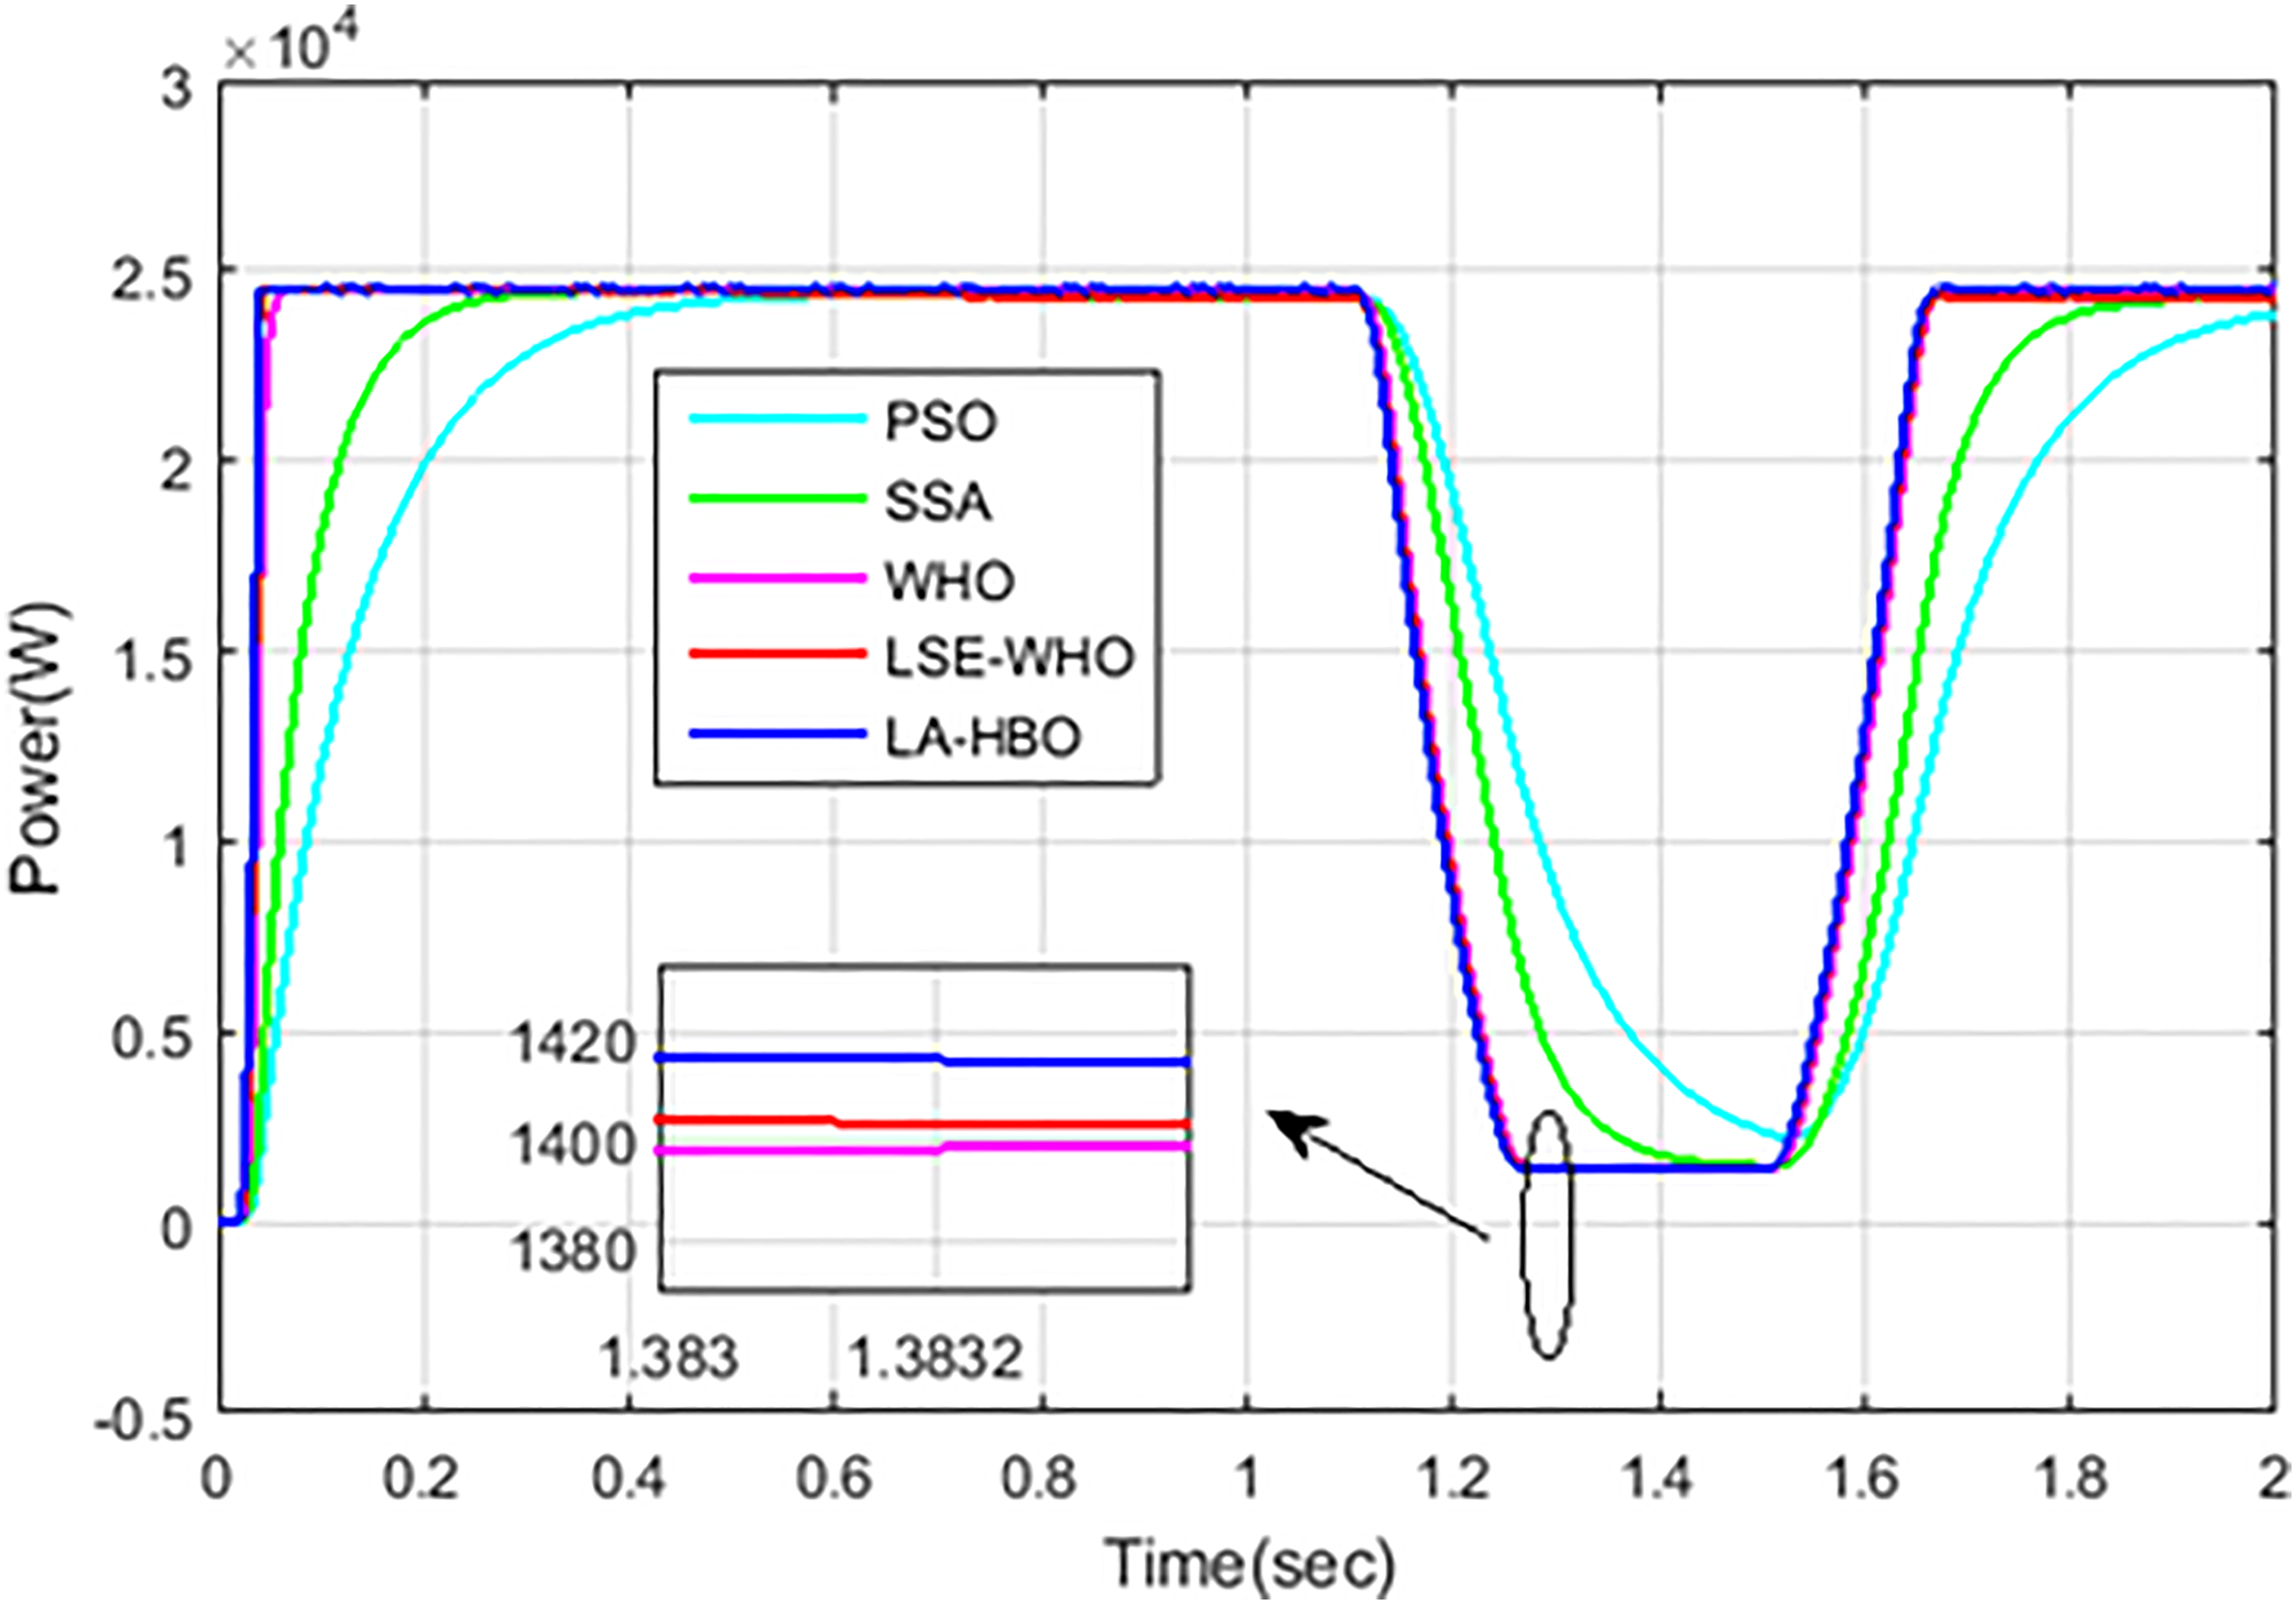
Performance comparison of PV power.
THD of solution techniques.
Comparison of settling, rise, and peak overshoot time.
Performance of sensitivity and absence of renewable energy.
Elapsed time of proposed with numerous solution systems.
Case 2: PV constant irradiance change
In this case, the proposed system performance is analyzed under PV constant irradiance change. When the grid-connected PV system is subjected to solar constant irradiance variation, the parameter such as current voltage and power is investigated for different components such as capacitor, inductor 1, inductor 2, and inductor 4. Figure 16 depicts the input reference irradiance waveform of proposed LA-HBO system. Figure 17 portrays the reference temperature of the proposed system. Figure 18 illustrates the capacitor current, voltage, and power waveform. In Figure 18(a) the capacitor current increased from 0 to 1.9A at time period of 0–0.01 time/s and remains constant. Figure 18(b) represents the capacitor power variation in which the power value emerged from 0 to 560 W during the time interval 0–0.01 time/s. Figure 18(c) demonstrates that capacitor voltage waveform where the voltage increased from 0 to 290 V during 0–0.01 time/s and remains constant.
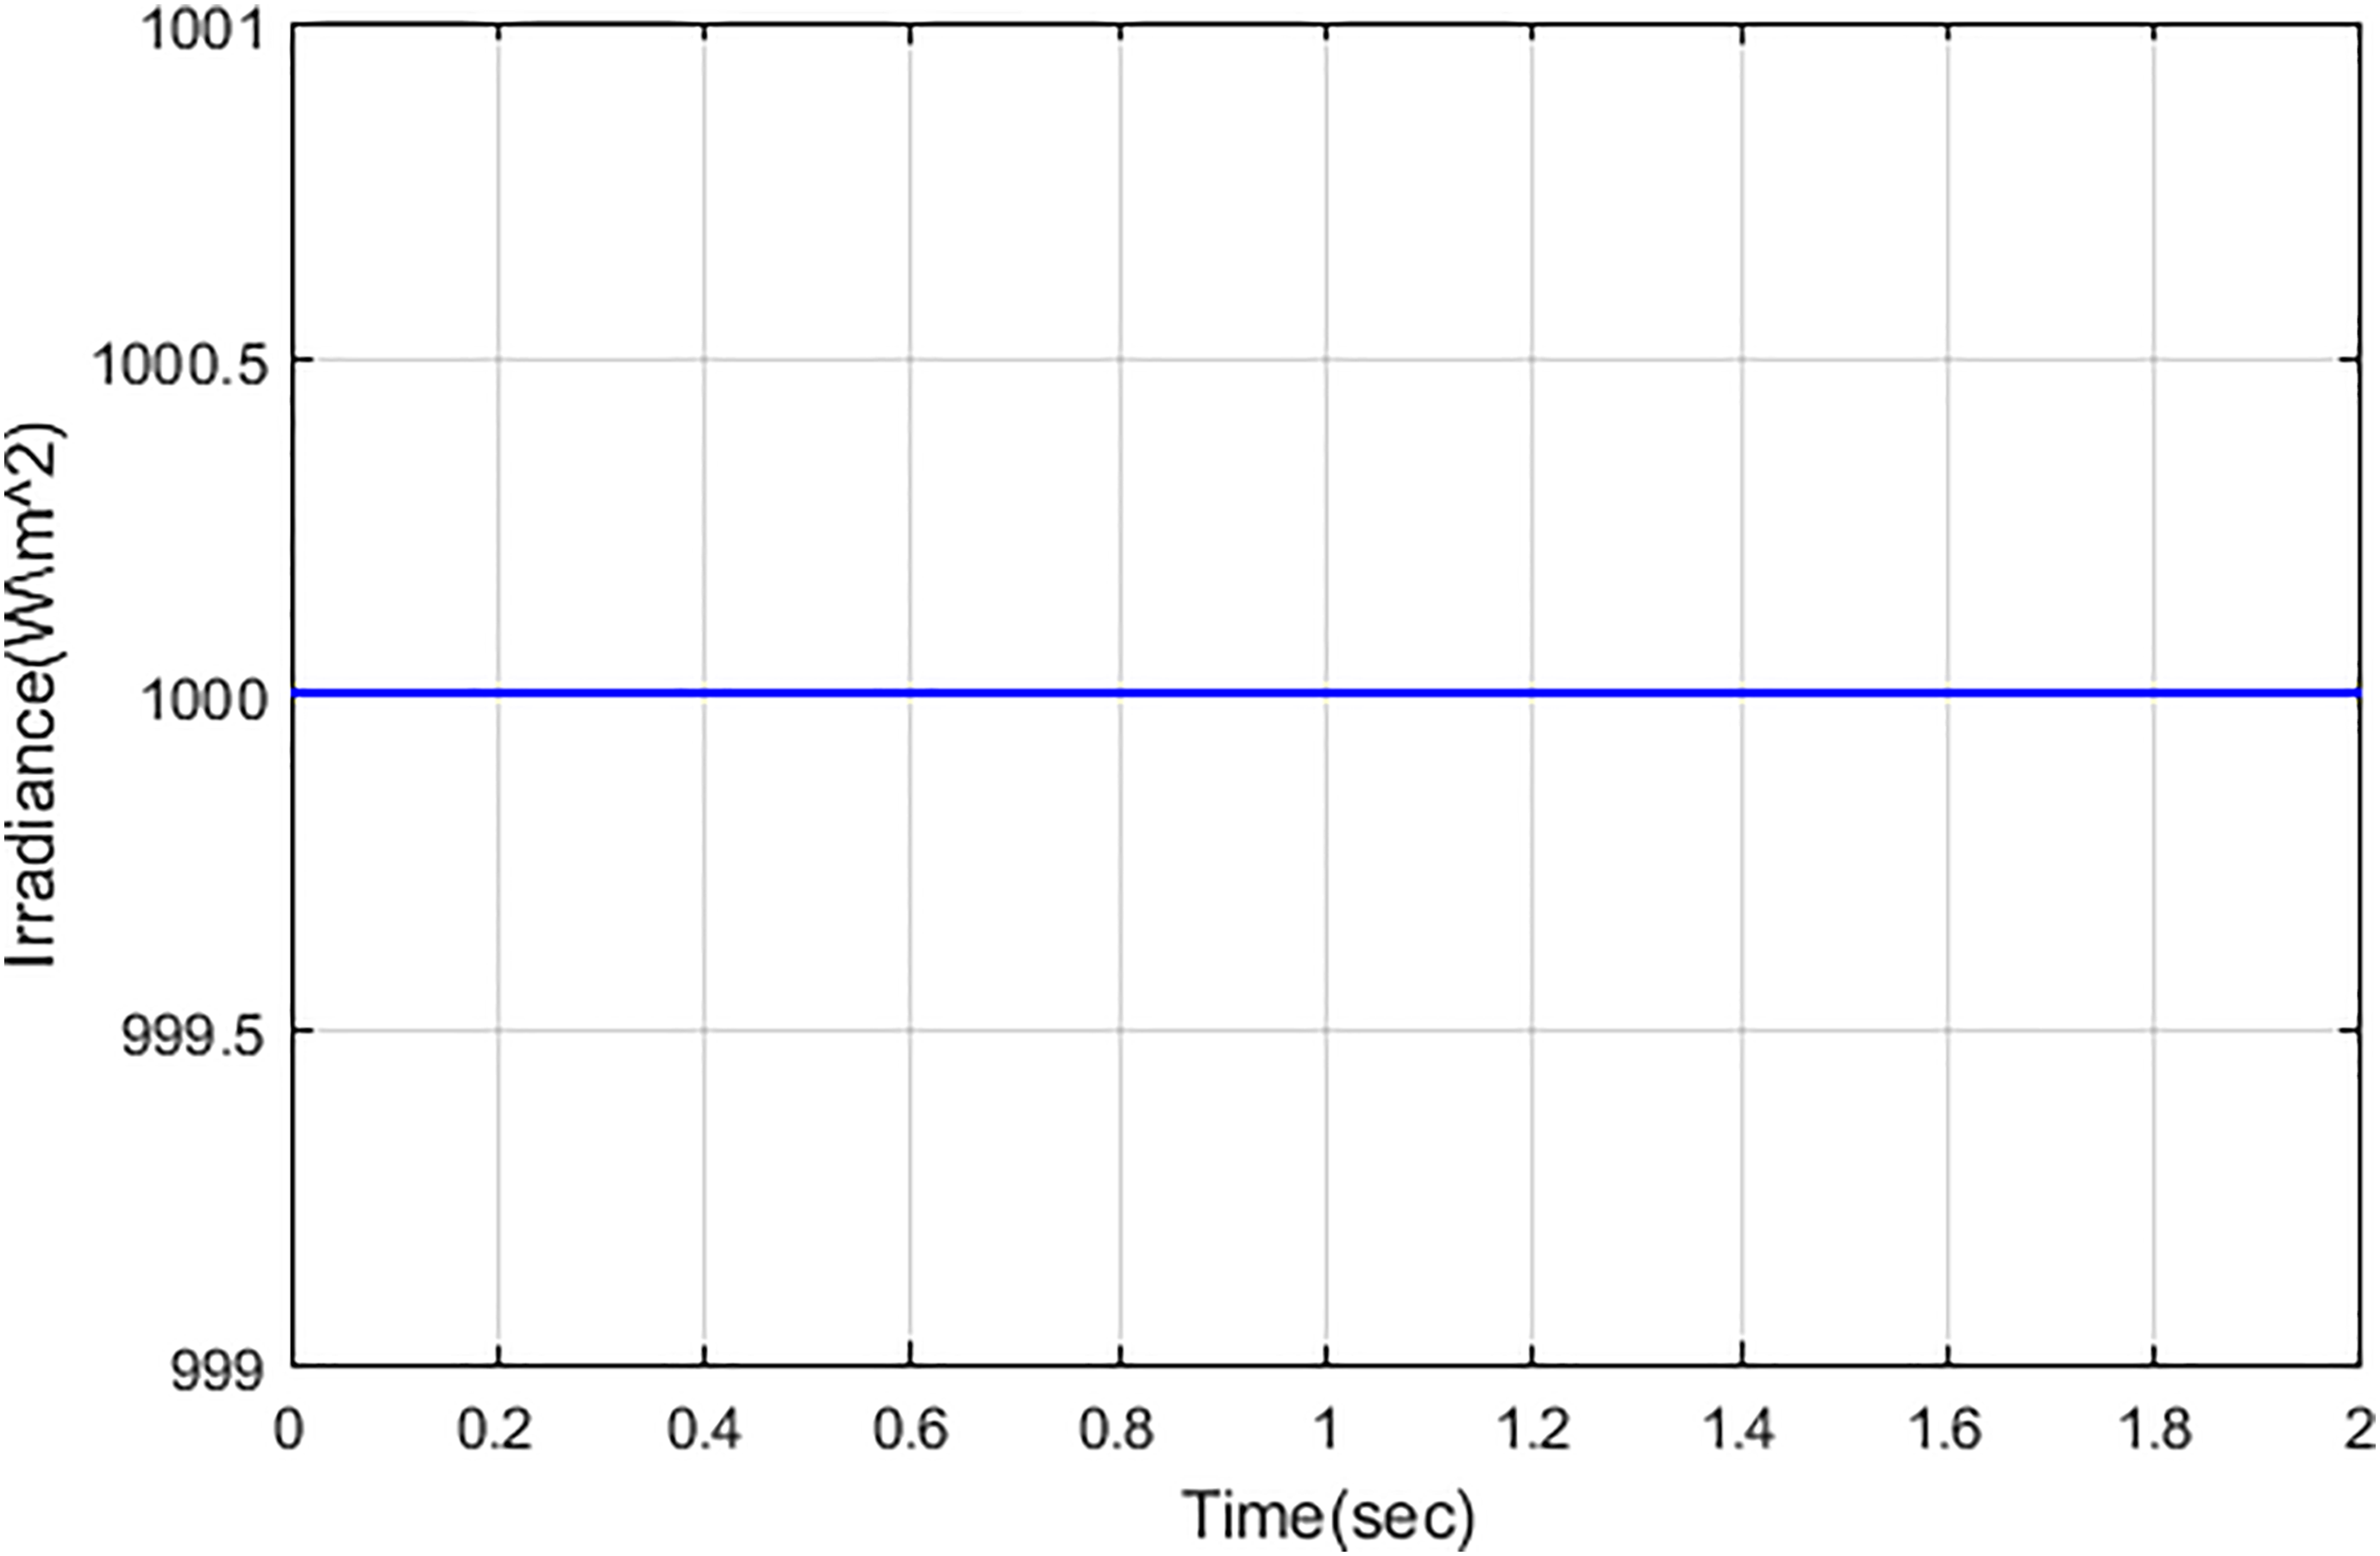
Reference irradiance LA-HBO.
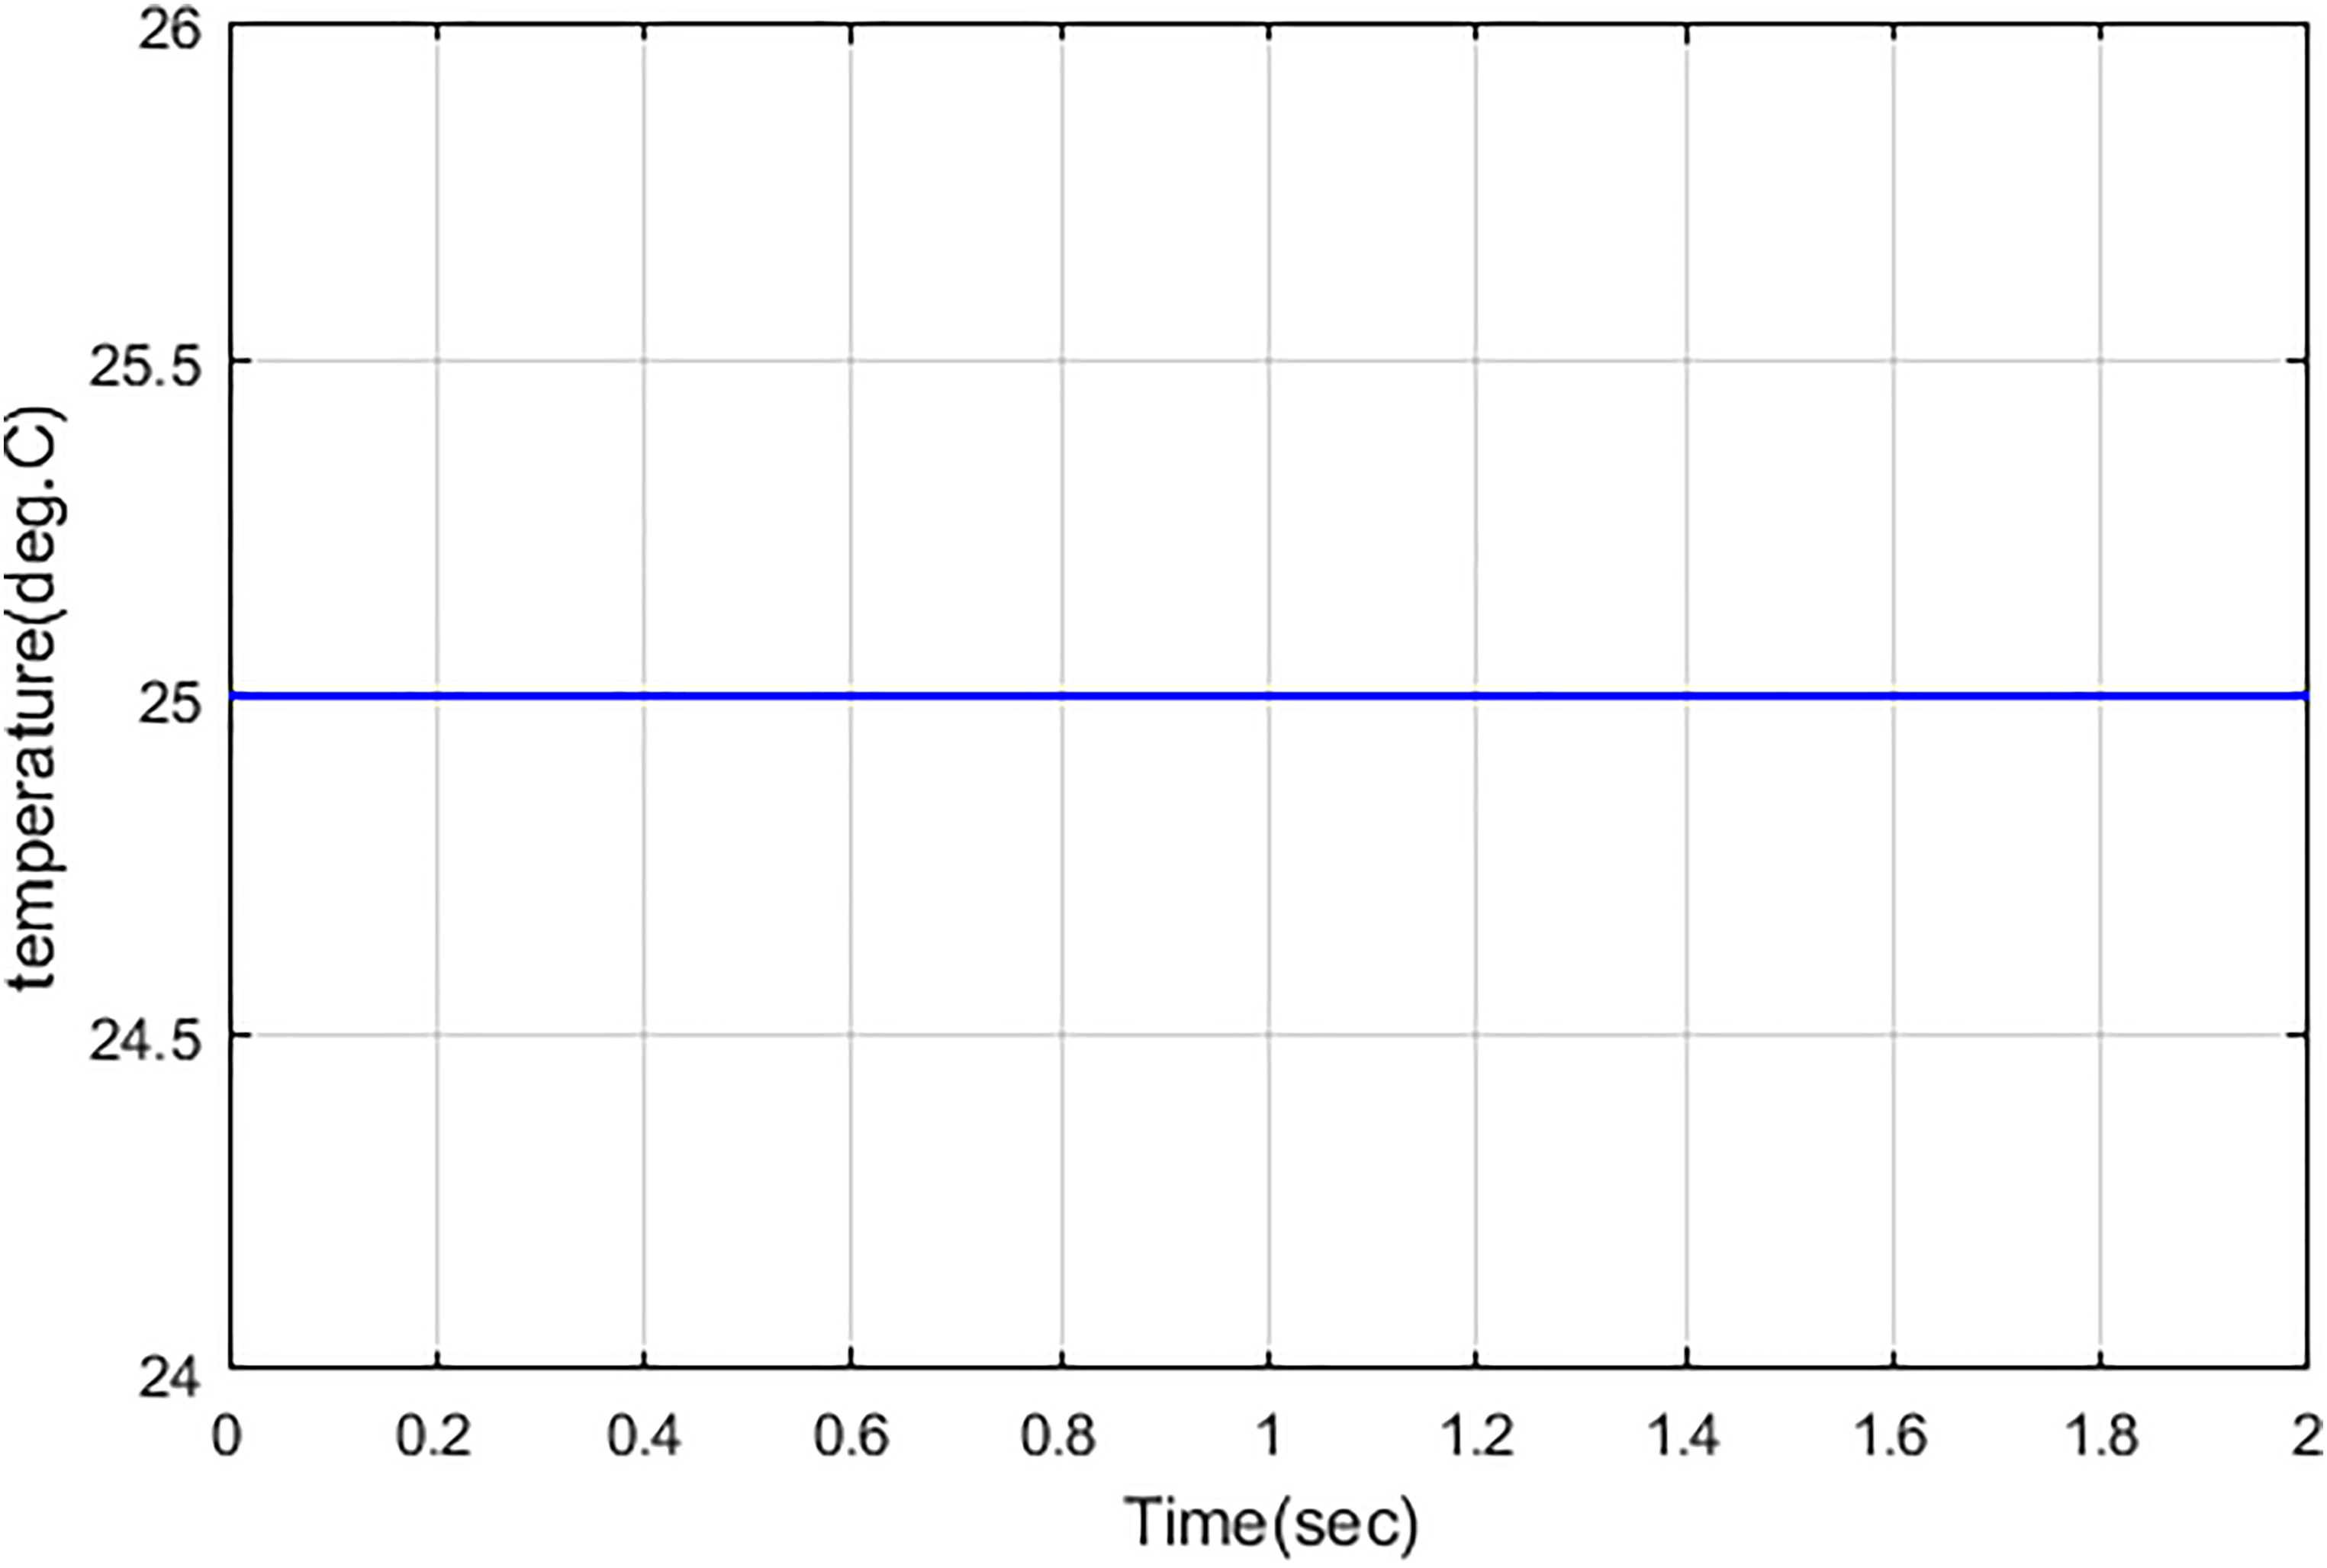
Reference temperature LA-HBO.
Capacitor: (a) current, (b) power, and (c) voltage.
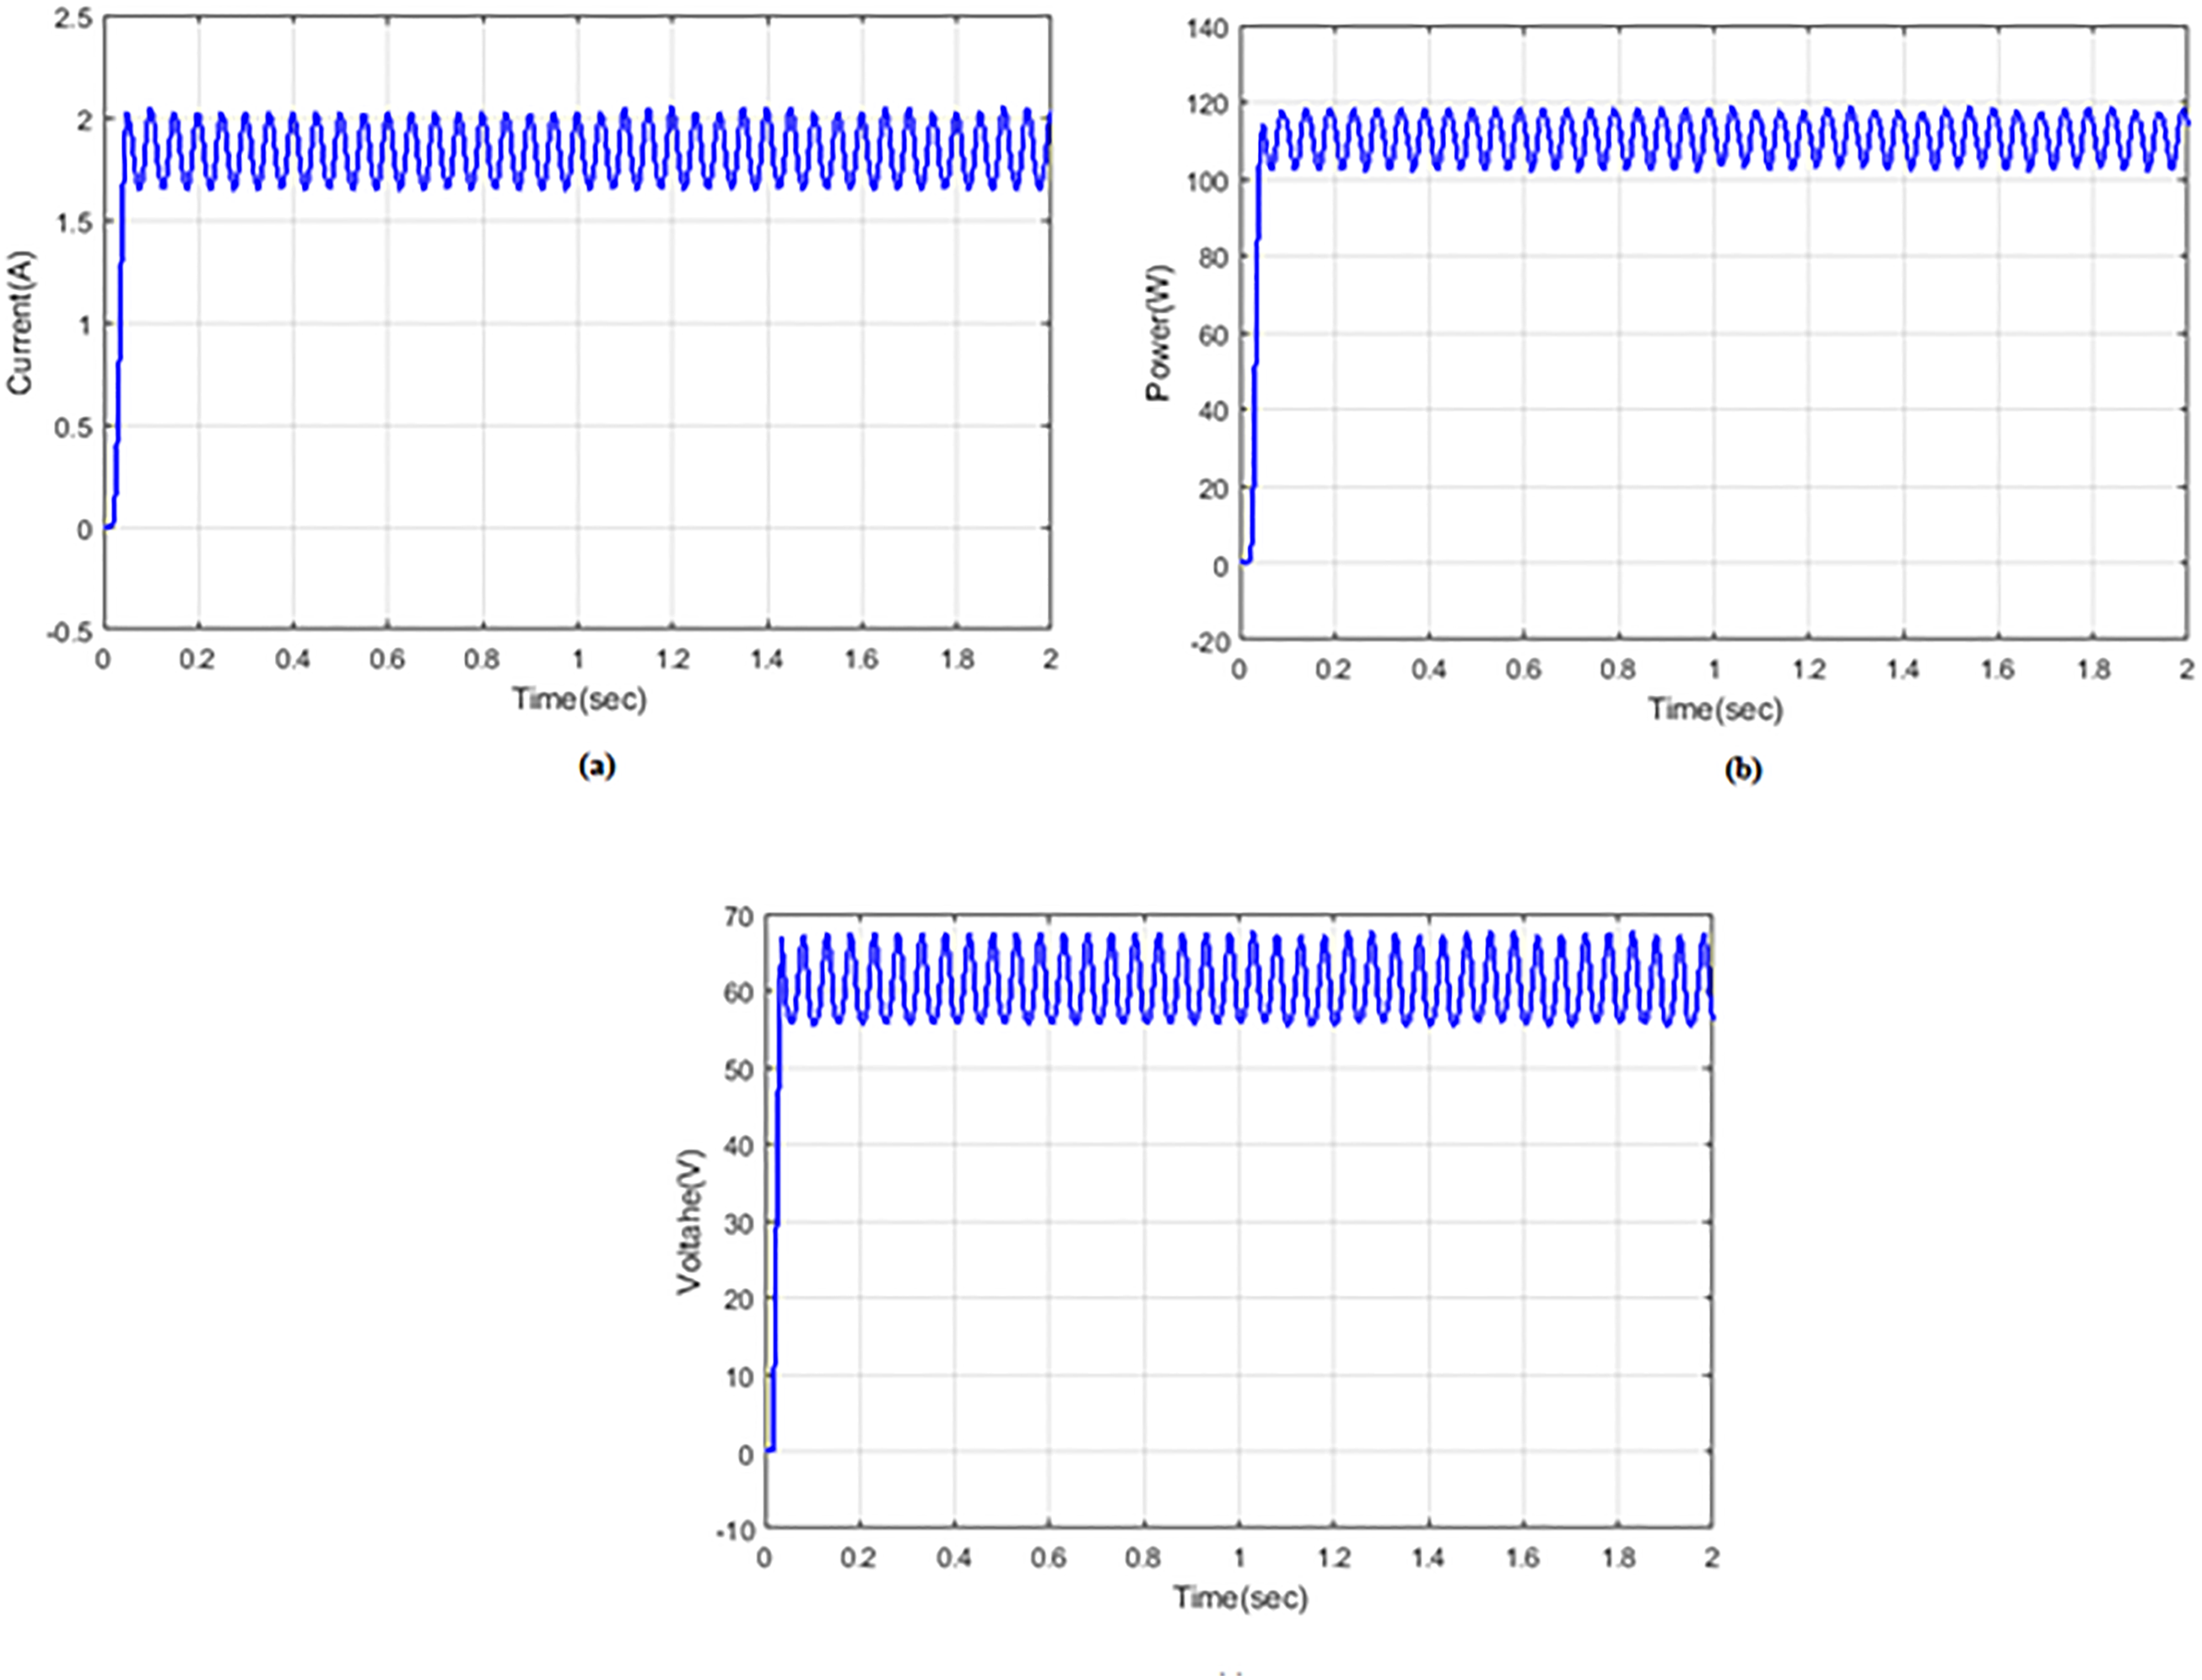
Figure 19 represents the inductor current, voltage, and power waveform. In Figure 19(a), the inductor current rises from 0 to 2 A at 0–0.01 time/s and remains constant. Figure 19(b) represents the inductor power variation in which the power value emerged from 0 to 130 W during the time period of 0–0.03 time/s. Figure 19(c) demonstrates an inductor voltage waveform where the voltage increases from 0 to 68 V during 0–0.03 time/s and remains constant.
Inductor 1: (a) current, (b) power, and (c) voltage.
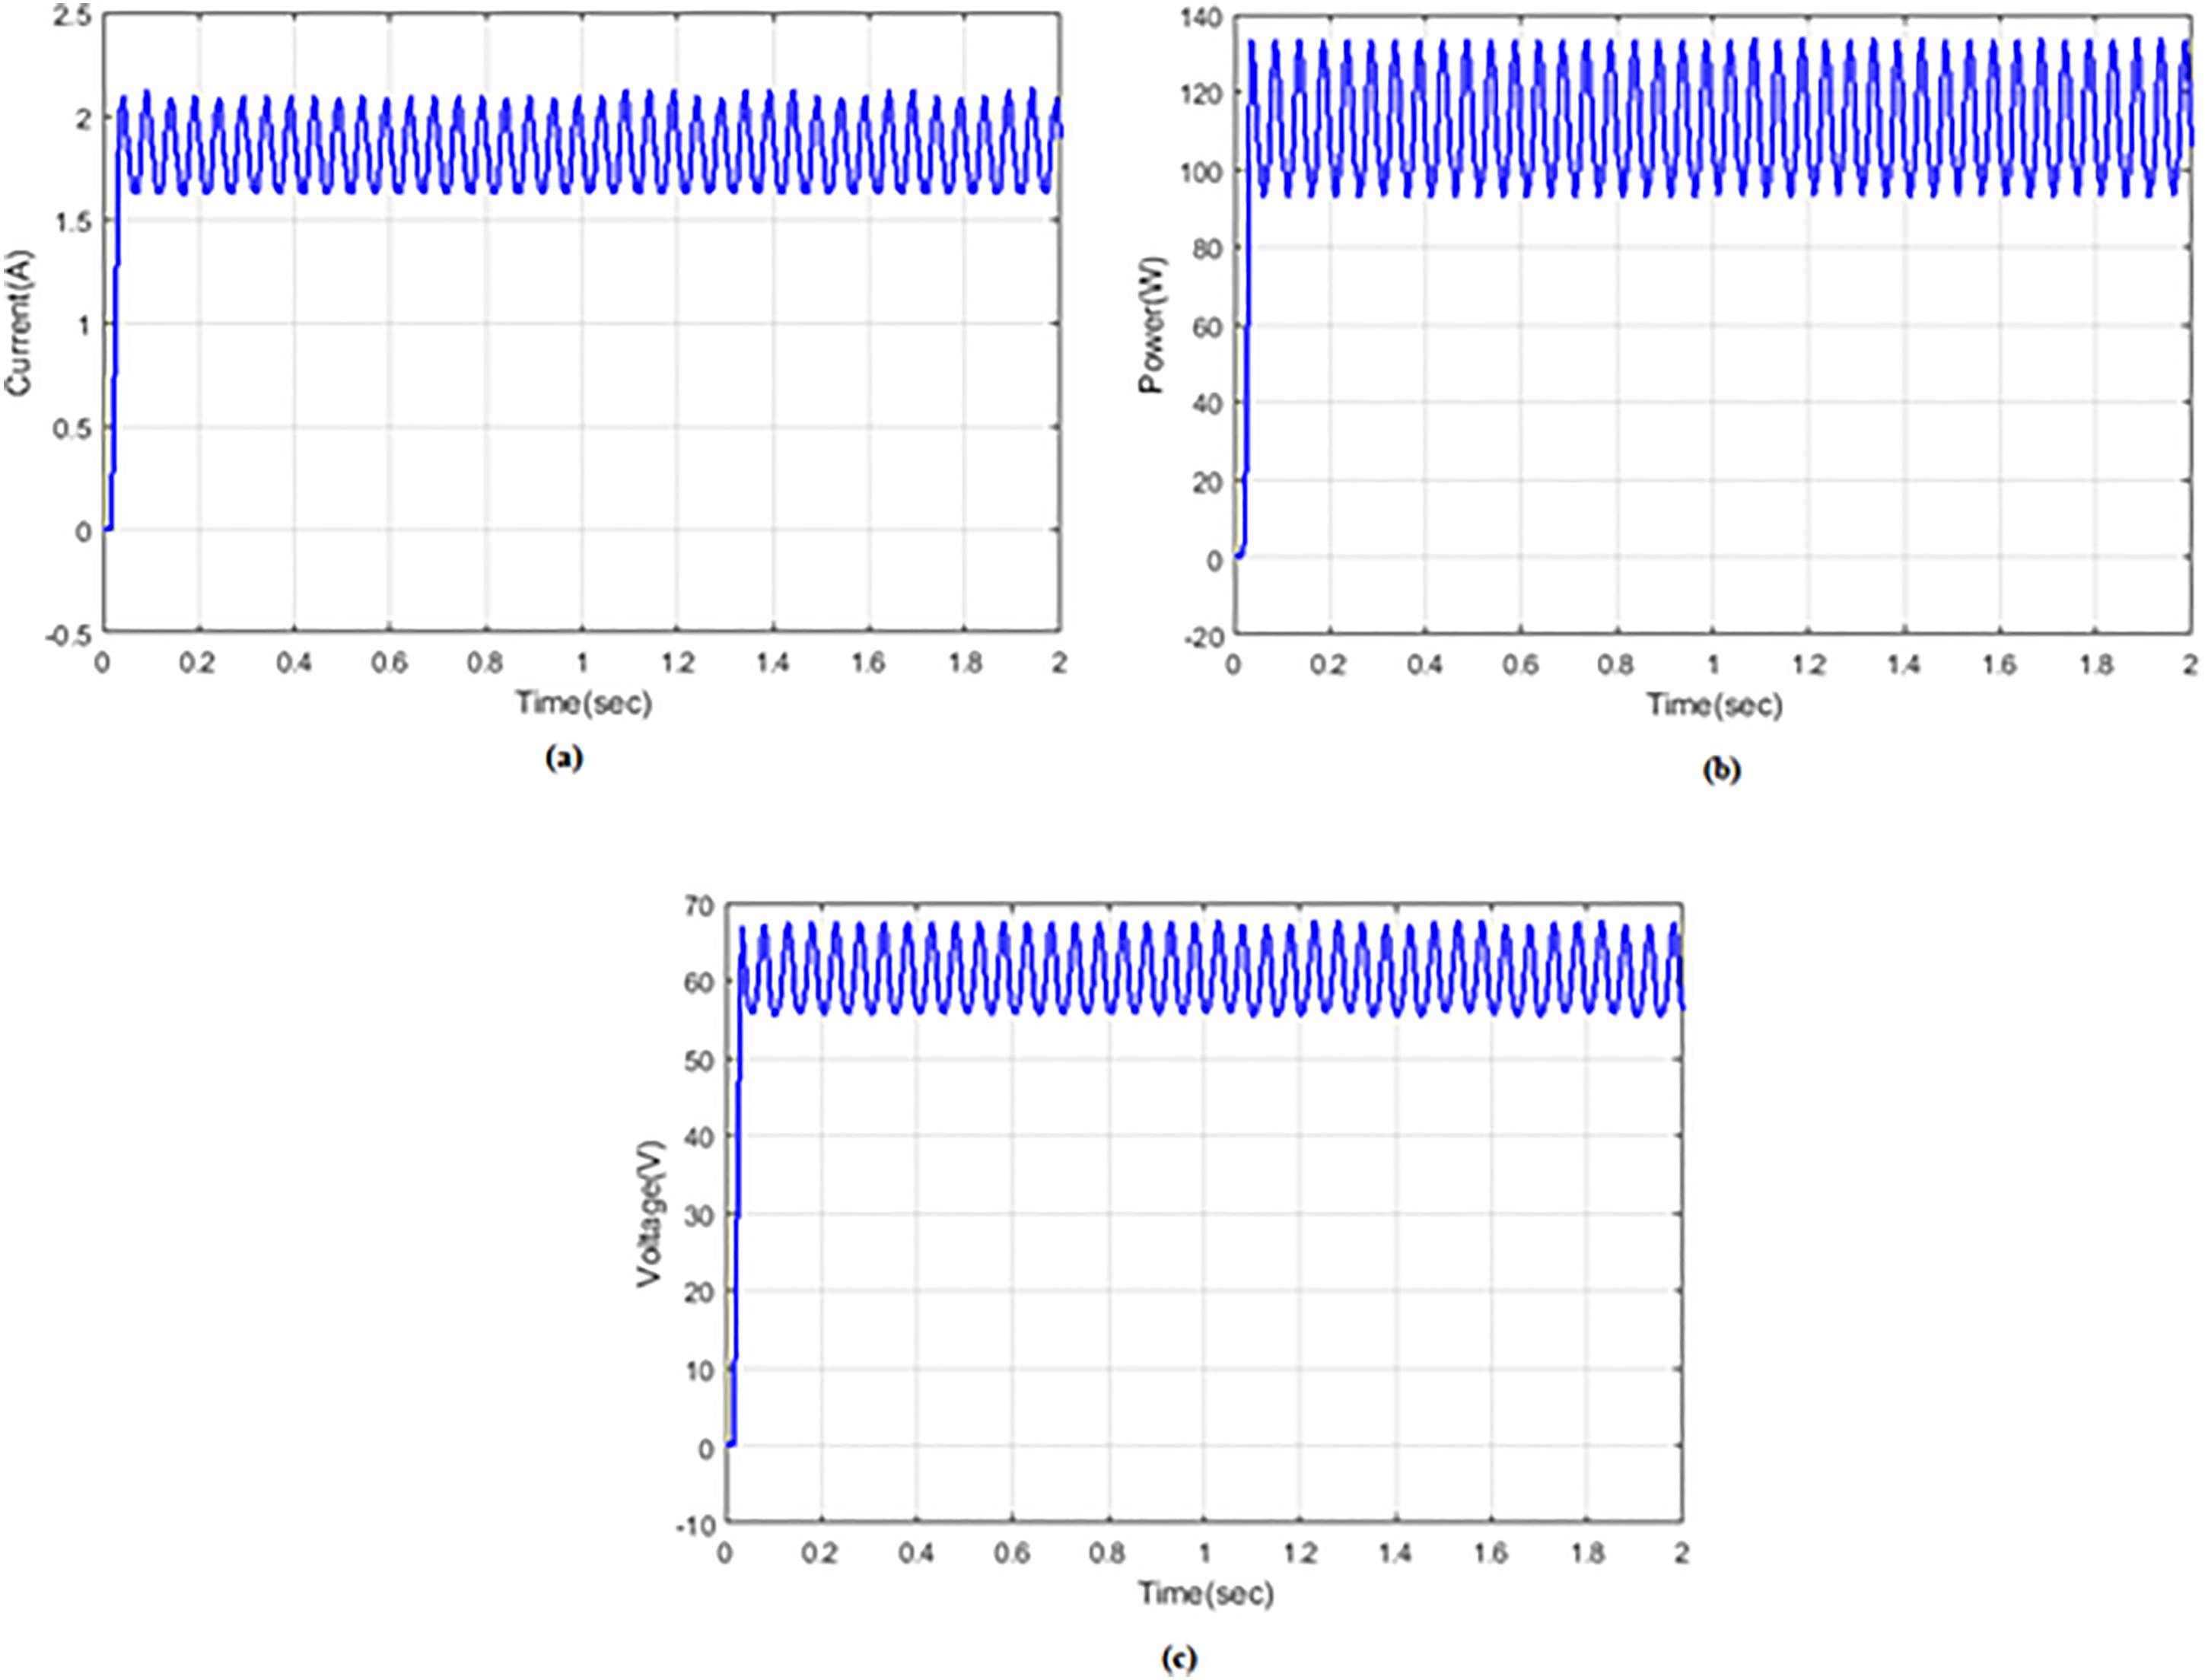
Figure 20 illustrates the inductor 2 current, voltage, and power waveform. In Figure 20(a), the inductor 2 current increased from 0 to 2A at 0–0.01 time/s and remains constant. Figure 20(b) represents the inductor 2 power variation in which the power value rises from 0 to 116 W again increases to 119 W throughout the time period of 0–0.1 time/s and it remains constant. Figure 20(c) illustrates the inductor 2 voltage waveform where the voltage increased from 0 to 68 V during 0–0.01 time/s and remains constant. Figure 21 illustrates the inductor 4 current, voltage, and power waveform. In Figure 21(a), the inductor 4 current increased from 0 to 2A at 0–0.01 time/s and remains constant. Figure 21(b) represents the inductor 4 power variation in which the power value rises from 0 to 138 W throughout the time period of 0–0.1 time/s and it remains constant. Figure 21(c) illustrates the inductor 4 voltage waveform where the voltage increased from 0 to 68 V during 0–0.01 time/s and remains constant.
Inductor 2: (a) current, (b) power, and (c) voltage.
Inductor 4: (a) current, (b) power, and (c) voltage.
Figure 22 illustrates the load current, voltage, and power waveform. In Figure 22(a), the load current increased from 0 to 27A at 0–0.01 time/s and remains constant. Figure 22(b) represents the load power variation in which the power value rises from 0 to 4000 W throughout the time period of 0–0.1 time/s and it remains constant. Figure 22(c) illustrates the load voltage waveform where the voltage increased from 0 to 149 V during 0–0.01 time/s and remains constant. Figure 23 illustrates the PV current, voltage, and power waveform.
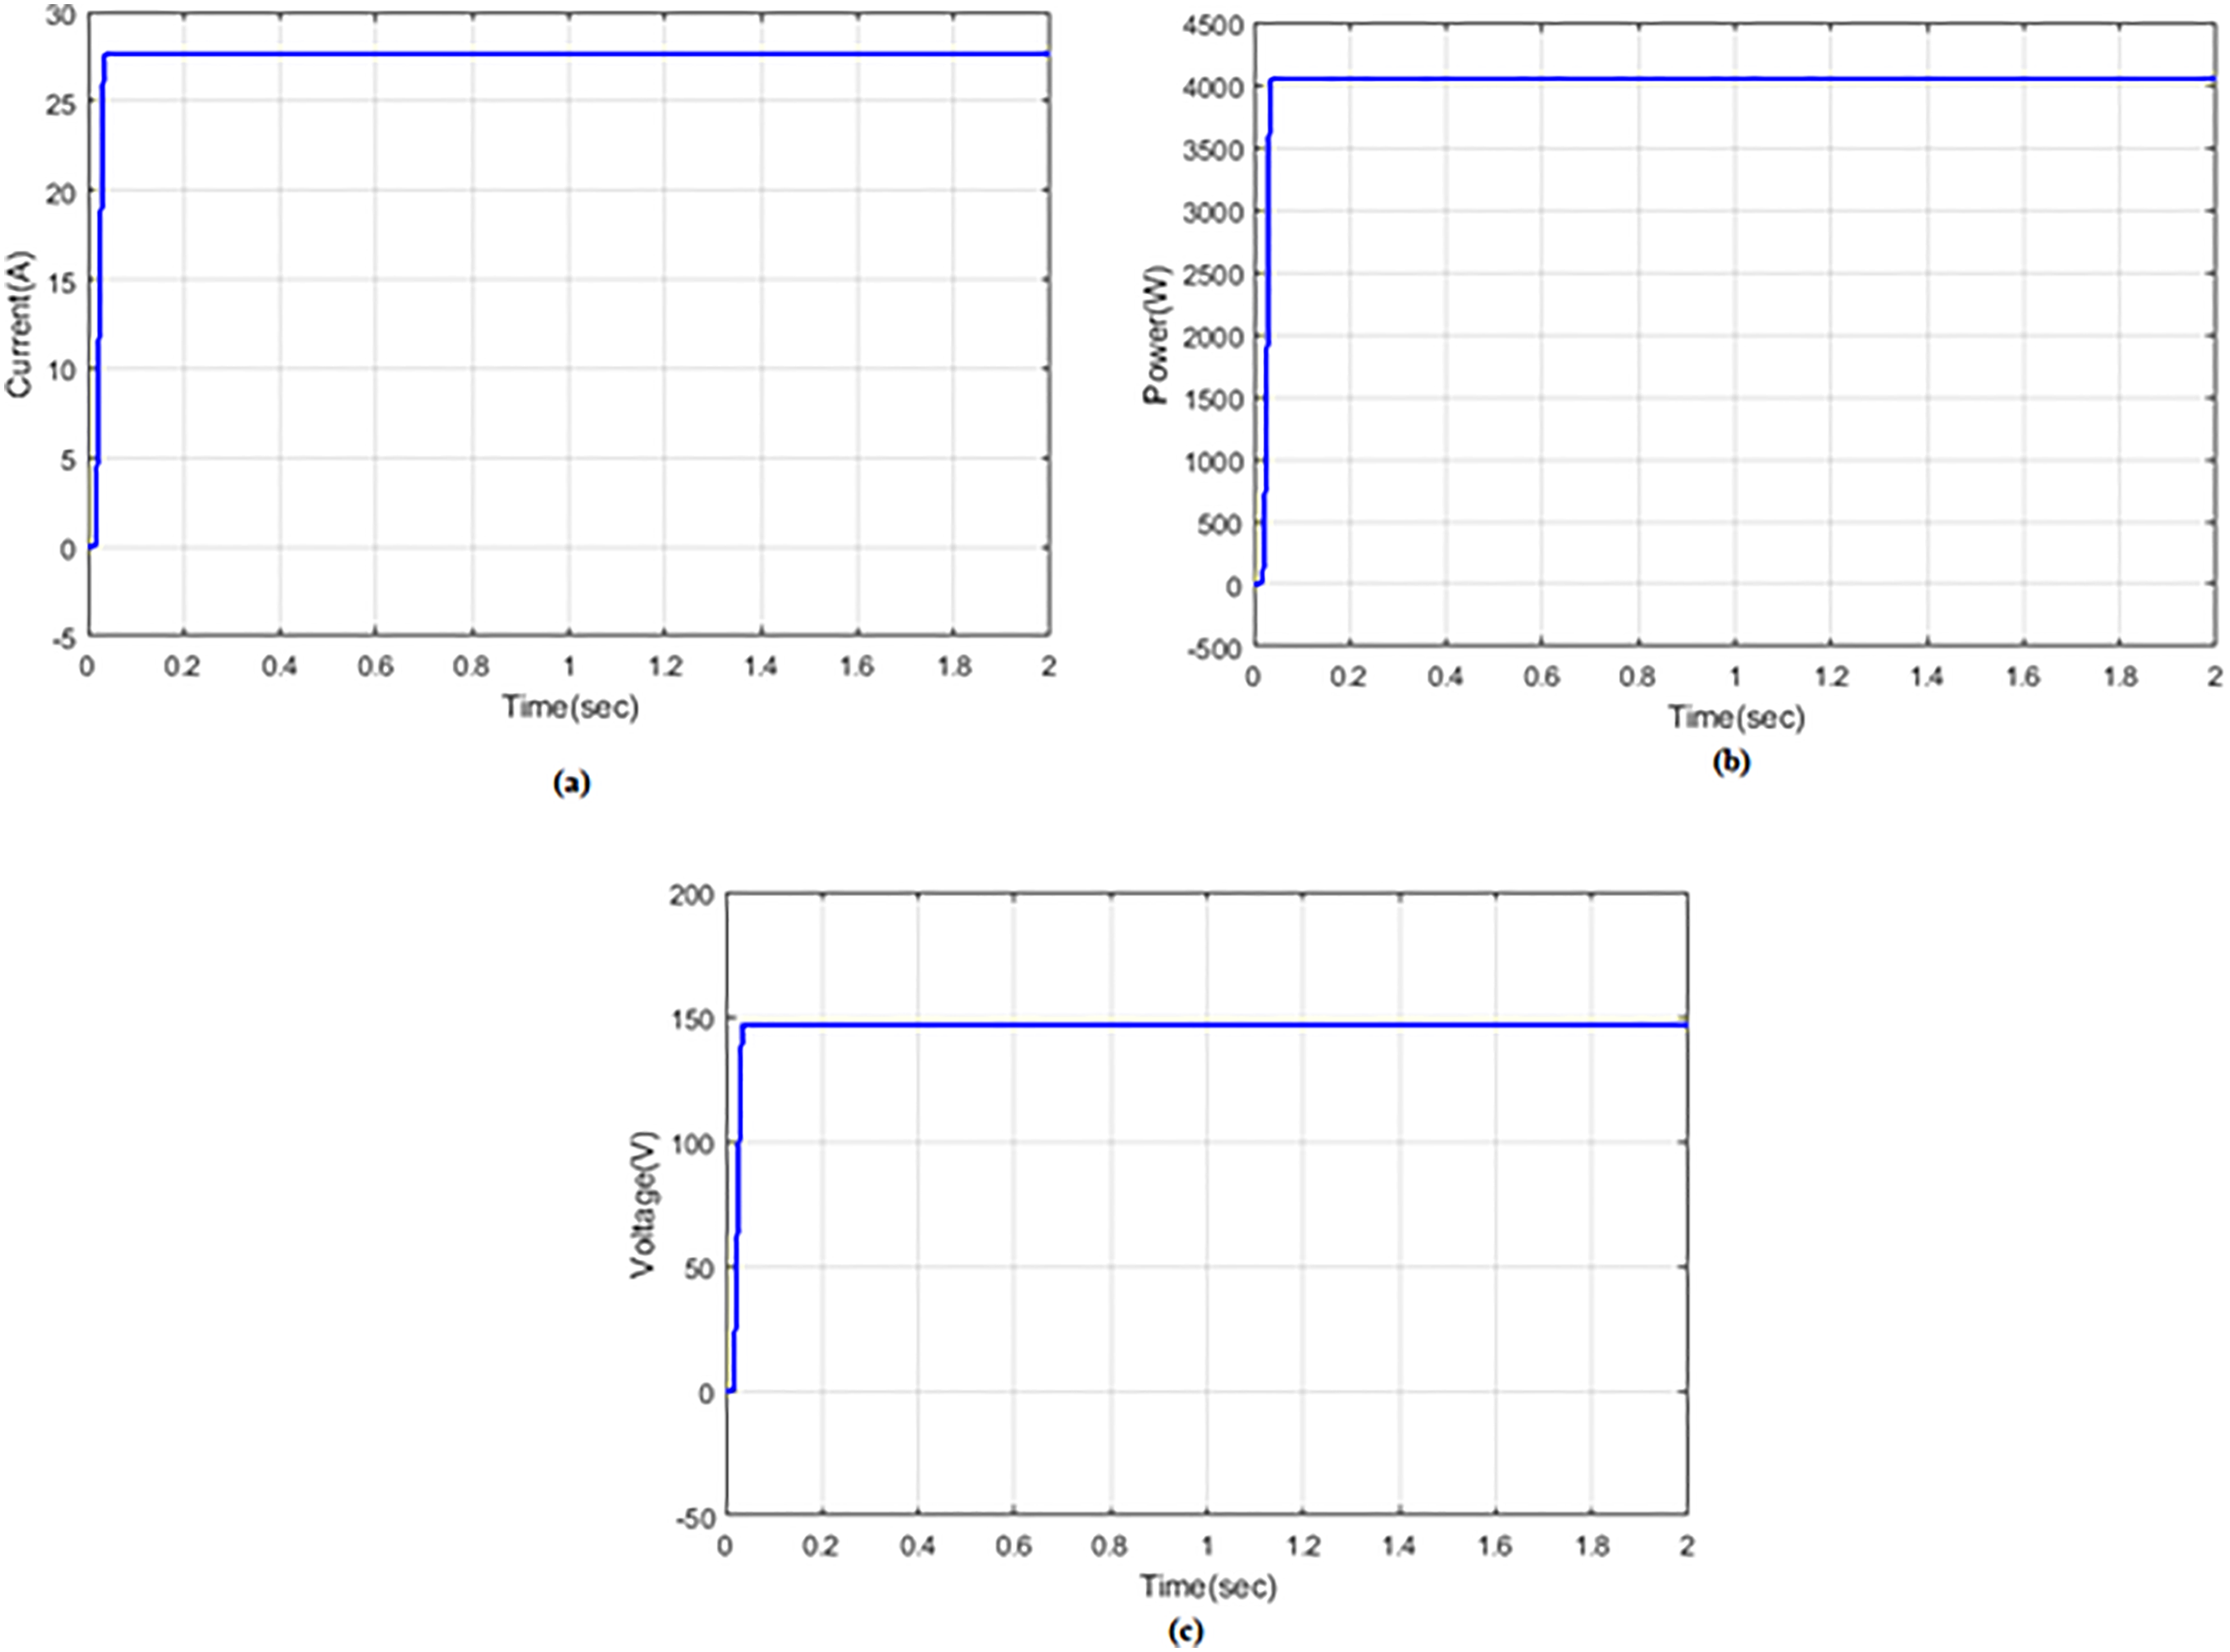
Load: (a) current, (b) power, and (c) voltage.
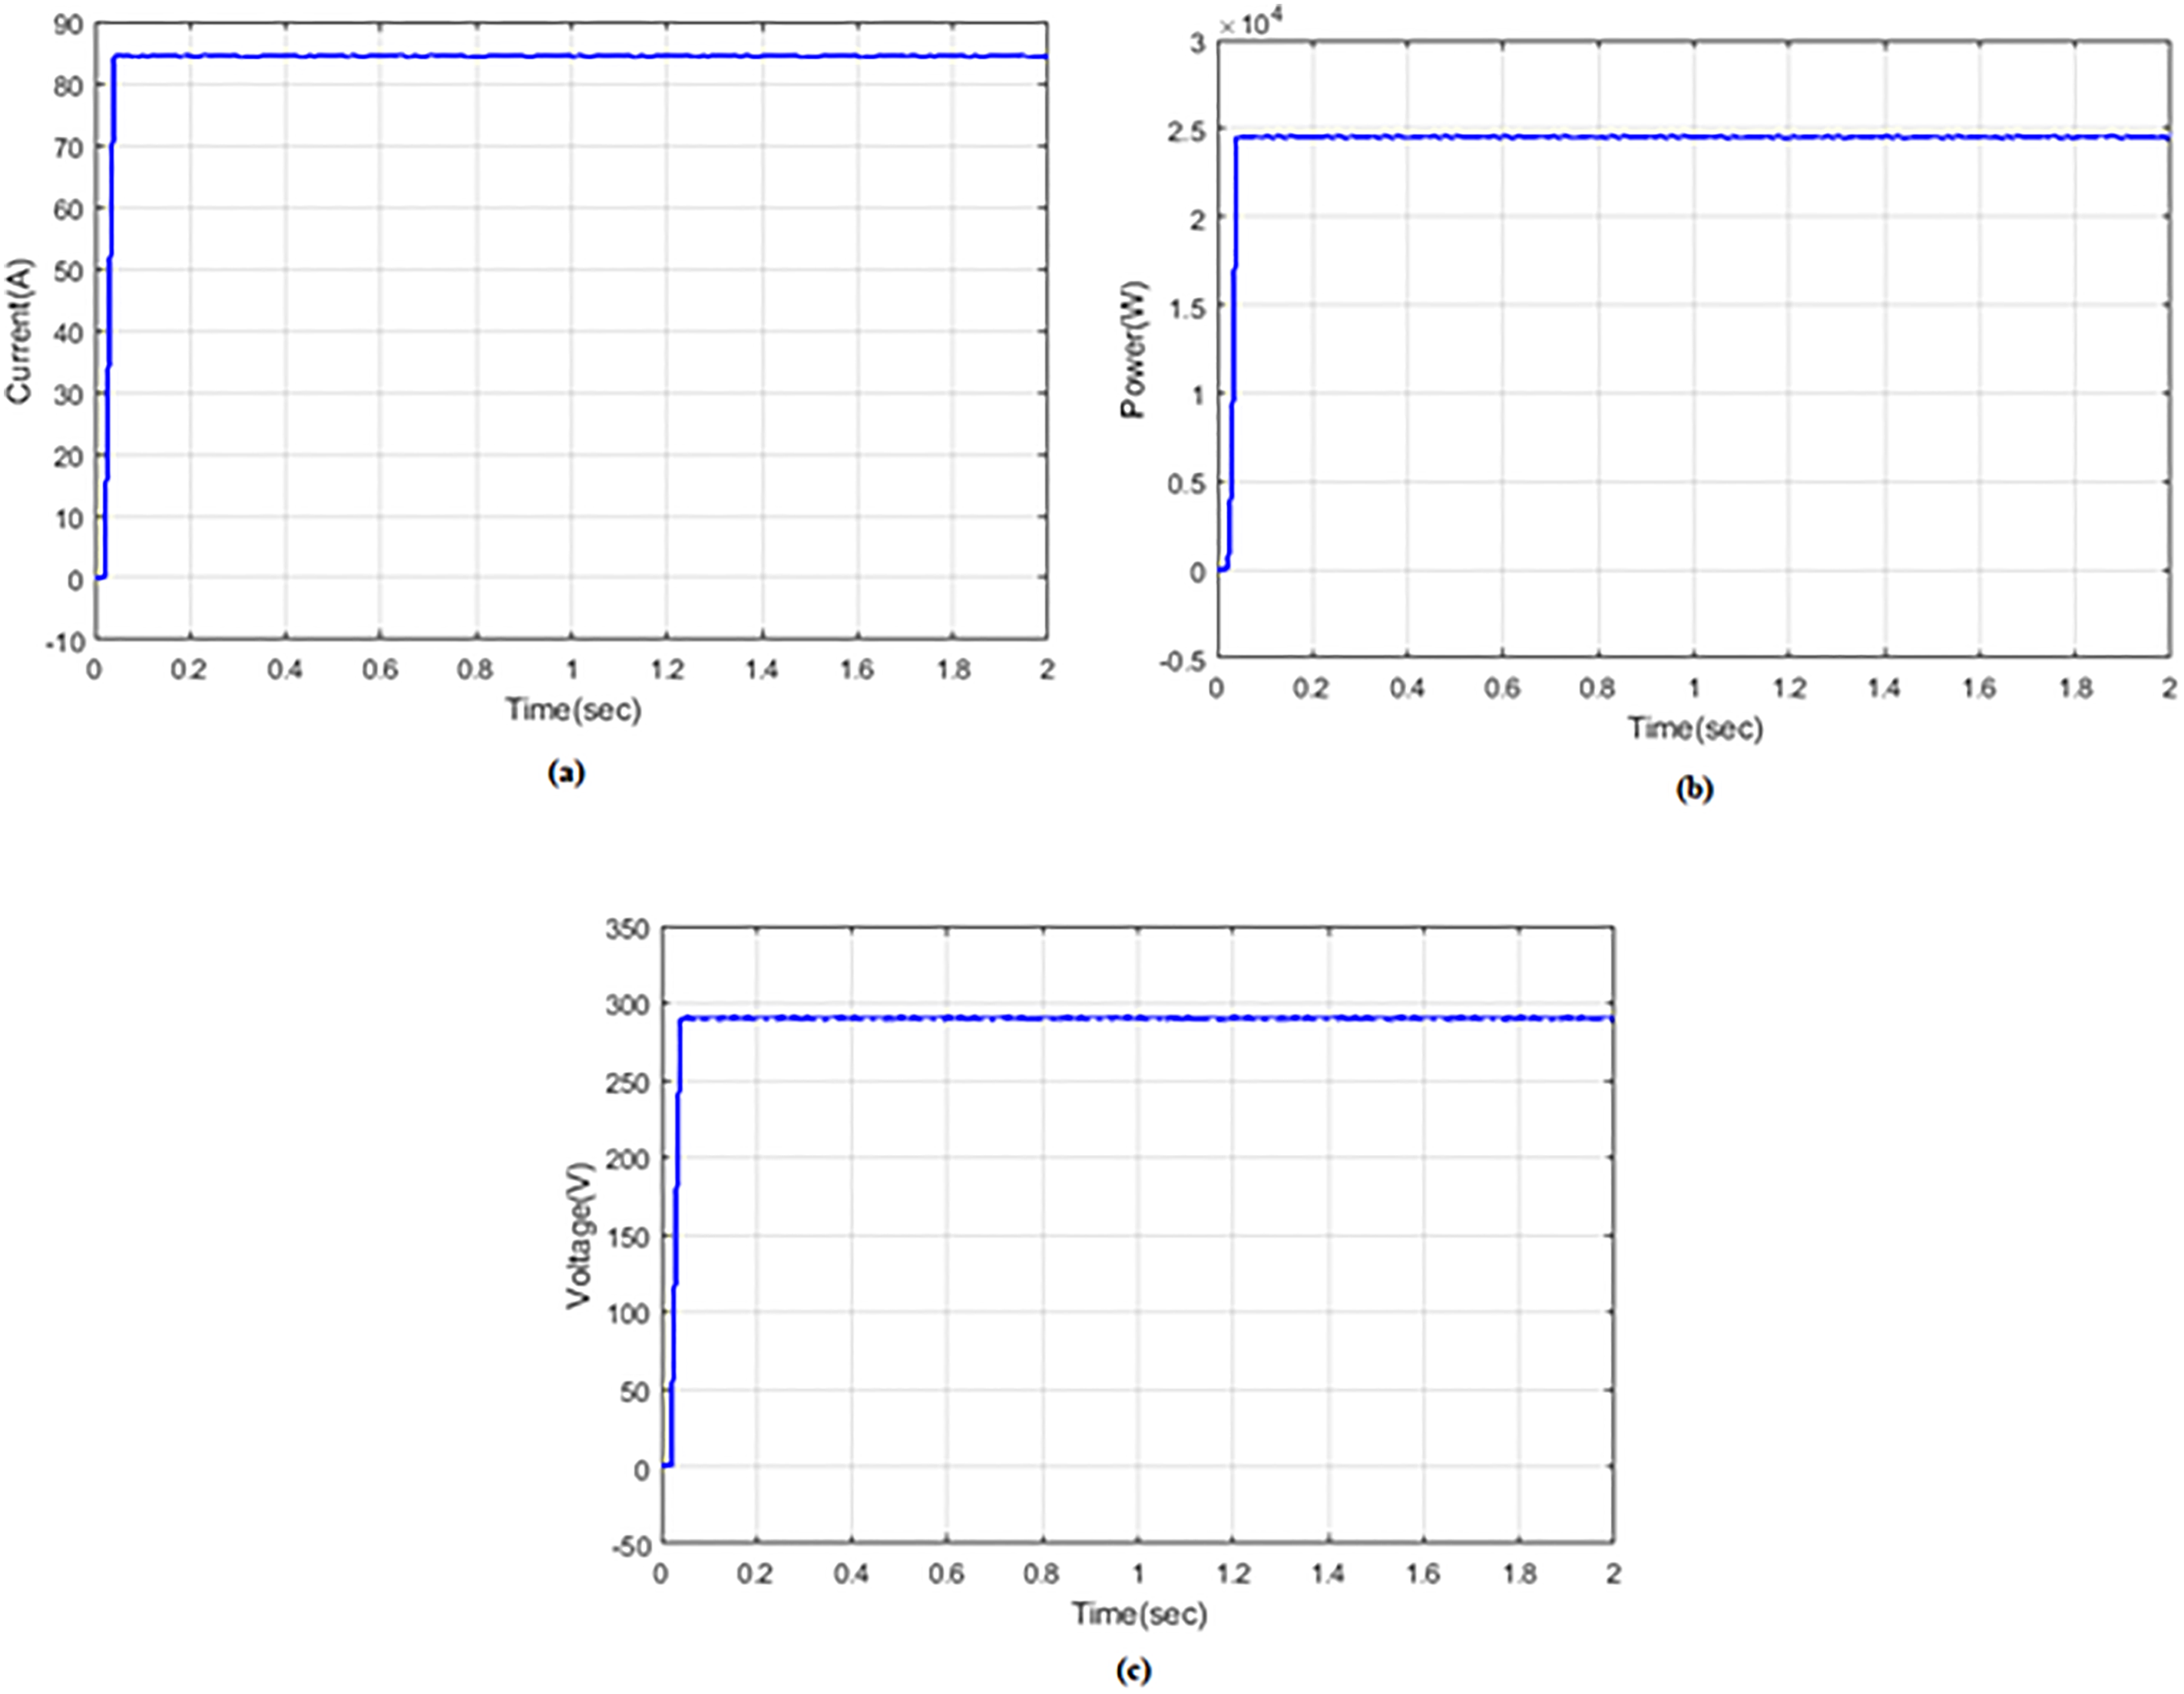
PV: (a) current, (b) power, and (c) voltage.
Figure 23(a) presents the PV current increased from 0 to 85 A at 0–0.01 time/s and remains constant. Figure 23(b) represents the PV power variation in which the power value rises from 0 to 2500 W throughout the time period of 0–0.1 time/s and it remains constant. Figure 23(c) illustrates the PV voltage waveform where the voltage increased from 0 to 295 V during 0–0.01 time/s and remains constant. Figure 24 shows the performance comparison of the PV power of the proposed LA-HBO method with other existing methods such as LSE-WHO, WHO, SSA, and PSO. From the waveform, it is validated that the PV power value of the proposed system is higher than other existing methods and there is no deviation.
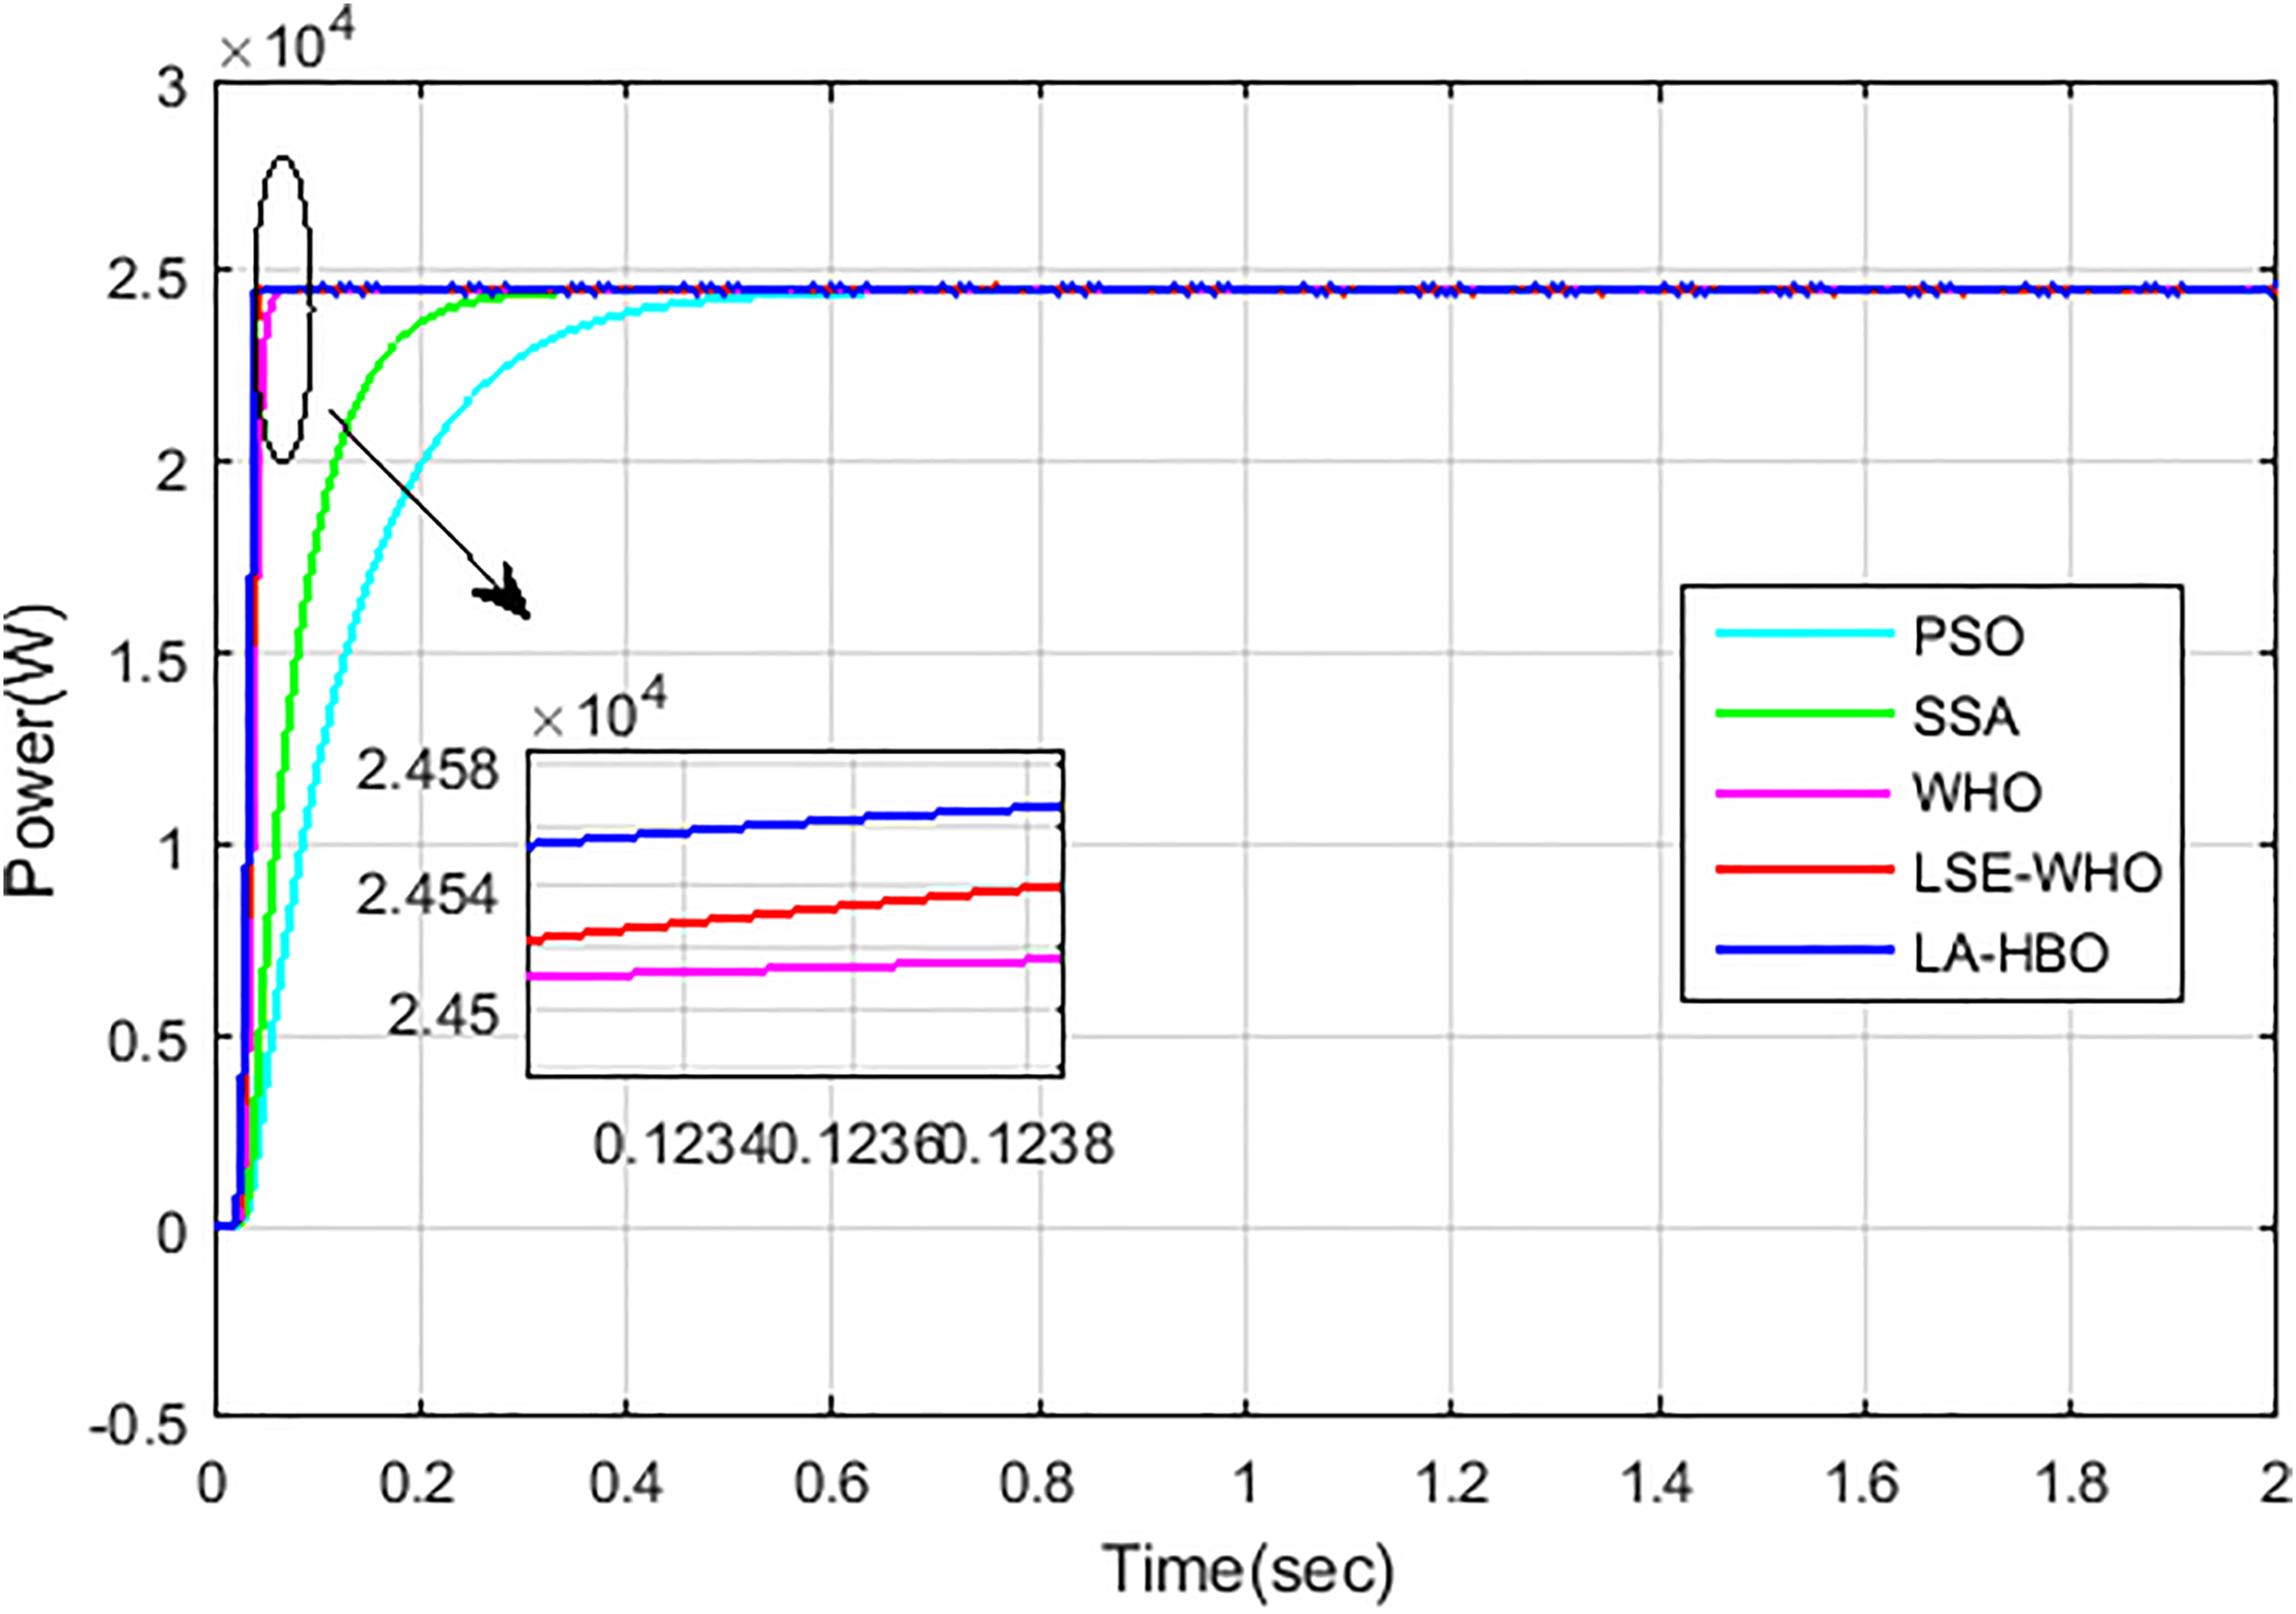
Performance comparison of PV power.
Discussion of obtained results and main accomplishments
Based on the findings of the forecast system, the focus on quality power supplies offers the best conclusion. The power quality on grid-coupled systems is assessed with two scenarios, and the outcomes are obtainable. The proposed control system has accomplished a lower THD value than the other systems portrayed in Table 1. The THD of the grid current was observed for every case, but PSO was unable to authenticate the THD value of the grid current. Furthermore, the benefits of the proposed system on the existing method are comprehensive in Table 2. The results signify that the proposed control system has accomplished less THD for grid current and voltage compared to other control systems. Therefore, the general understanding demonstrates that the projected system is better suited to enrich the power quality of the grid-coupled SPV system compared to other traditional systems.
Conclusion
The paper presented a grid-connected PV system using the LA-HBO method to improve power quality. In the proposed system, the interleaved inverter works with different control techniques in order to perform multifunctional operation and to improve power quality. The operation of the control approach is separated into two sections. In the first section, the power generated from PV using the LA technique. In the second section, self-charging of the DC-link voltage control loop using DBHCC by HBO technique is working. The reference signal is produced through the DC-link voltage control loop to remove power quality issues, and DBHCC produces a lesser switching frequency resulting in low switching losses. In the conclusion, the performance of the proposed system is determined by implementing the proposed system in the MATLAB platform and compared with existing approaches. The future scope of the control systems may be improved to design dissimilar control systems. The proposed system may be utilized with a battery-based system even in the absence of wind power. Artificial intelligence techniques may also be incorporated into the proposed system to accomplish better performance.
Footnotes
Data availability statement
Data sharing is not proper in this article as no novel data were created or examined in this study.
Declaration of conflicting interests
The authors declared no potential conflicts of interest with respect to the research, authorship, and/or publication of this article.
Funding
The authors received no financial support for the research, authorship, and/or publication of this article.
Ethical approval
.