
Abstract
The impact of renewable energy on economic growth has been controversial and the possible reason for this is that renewable energy is aggregation of sources with heterogeneous characteristics and different countries have different portfolio of renewable sources depending on their climate condition and technology maturity. This study examines the relationship between renewable energy sources such as solar, wind and bio energy and economic growth in 89 countries. For methodology, this paper adopted Islam's growth equation and performed Dynamic Panel Analysis based on Arellano-Bond GMM methodology. In addition to whole sample analysis, a sub-group analysis is performed between OECD and non-OECD countries, and between energy-importing and energy-exporting countries to examine how the relationship is affected by country's capital accumulation, technology maturity, energy cost, and energy security. The result shows that individual sources have the U-shaped relationships with growth, but the turning points where negative relationship changes to positive vary for different sources. For sub-group analysis, the U-shaped relationship was significant only in OECD countries and energy-importing countries. This shows that high technology development and capital accumulation of OECD countries and high energy cost and vulnerability to international energy market of energy-importing countries makes renewable sources more beneficial to economic growth.
Keywords
Introduction
The Global effort and pressure of carbon reduction have been enhanced in the recent decade. With the transition from the Kyoto Protocol to the Paris Agreement in 2015, carbon reduction obligations have been expanded and strengthened from 38 countries to 194 countries. Many countries presented ambitious carbon reduction targets in 2015, for example, the US set a target of 26–28% reduction compared to the 2005 level by 2025, the EU set a 40% reduction compared to the 1990 level by 2030, and Brazil set 43% reduction compared to the 2005 level by 2030. These initial goals were expanded and 27 countries including the UK, France, Canada, and South Korea set a net zero carbon emission target by 2050 to achieve climate neutrality. 1
Among the many sources of greenhouse gas emissions, the energy sector is the largest accounting for 73.2% of total carbon emissions. To achieve the ambitious net zero target by 2050, radical changes in the energy sector are inevitable, with renewable energy taking a central role in this transition. In 2019, the share of renewable energy in total electricity consumption was 39.5%, 36.2%, 25.8%, 18.2%, and 10.6% in Germany, the UK, China, Japan, and the US, respectively, and there is a strong momentum to further increase these shares shortly as the capacity costs of main renewable sources have been decreasing significantly.
At the same time, renewable energy investments in African nations and low-income developing regions have grown recently. The wide expansion of solar energy in Africa promotes the adoption of renewable energy production and its investment in the industry. 2 On the other hand, South America is one of the regions for experienced rapid renewable energy growth. They have high levels of daytime sunlight which benefits solar photovoltaic electricity generation and a high volume of winds. Latin American governments set their target of generating 70% of the country's total energy consumption by using renewable sources until 2030 and promoting rapid acceleration in renewable projects.
Renewable Energy is derived from natural sources that are sustainably replenished. Therefore, they produce fewer greenhouse gases than conventional fuel energies, which are currently the largest contributor to global climate change, accounting for nearly 75% of global greenhouse gas emissions. However, constructing a fully renewable energy system is not a simple task. Renewable energy has been considered a clean but expensive energy source compared to fossil fuels, with an increasing share of renewable sources in the power generation composition increasing energy costs, resulting in a rise in production costs as energy is an important production factor in the economy. The following literature from Pata,3,4 globalization and renewable energy consumption significantly reduce environmental pollution compared to non-renewable energy sources in the USA. On the other hand, in China, reducing human capital has become an important contributor to reducing environmental degradation. 5
Renewable energy has been considered a clean but expensive energy source compared to fossil fuels, with an increasing share of renewable sources in the power generation composition increasing energy costs, resulting in a rise in production costs as energy is an important production factor in the economy. However, the cost of renewable energy sources has fallen significantly by approximately 82% for solar photovoltaics and 38% for onshore wind in the past decade, 6 and in many countries, solar and wind energy have achieved grid parity, that is, their energy production costs have reached fossil fuel energy levels, thus drawing much attention to renewable energy sources as an effective option to achieve net zero carbon emission.
Along with the energy growth hypothesis that energy consumption has a positive effect on economic growth, several analyses were conducted on the impact of renewable energy consumption on economic growth. Initial studies showed that renewable energy harms economic growth, as the increasing electricity cost due to expensive renewable sources affects the GDP negatively. However, recent studies have shown that renewable energy can positively affect economic growth due to the rapidly decreasing cost, R&D promotion, capital accumulation from new investment, job creation, and replacement of fossil fuel imports. By combining negative and positive impacts, some studies, such as Cho and Lim, 7 have found a U-shaped relationship between renewable energy and economic growth, as in the early stage, renewable energy can negatively affect growth, but after a certain penetration level, renewable energy has a positive impact on the GDP.
This study aims to analyze the heterogeneous impact of individual renewable sources on economic growth as illustrated in Figure 1. We investigated empirical evidence of the varying impact of renewable sources on economic growth depending on their deployment stage. We believe that the relationship between renewable sources and economic growth has a U-shape relationship, which means it has a negative impact in the early stage and later has a positive impact when the industry gets actively expanding. The potential reason for this is that in the early stage, high energy costs undermine economic growth, but when the industry gets matured, its capital accumulation, R&D investment, increased employment, lower dependency on fossil fuel, and reduced energy cost can help boost economic growth. Along with the heterogeneous impact of renewable sources, we investigated this relationship within varying subgroups such as OECD/non-OECD and net energy exporting /net energy importing countries to analyze how economic development level or energy supply structure affects the relationship between renewable sources and economic growth.
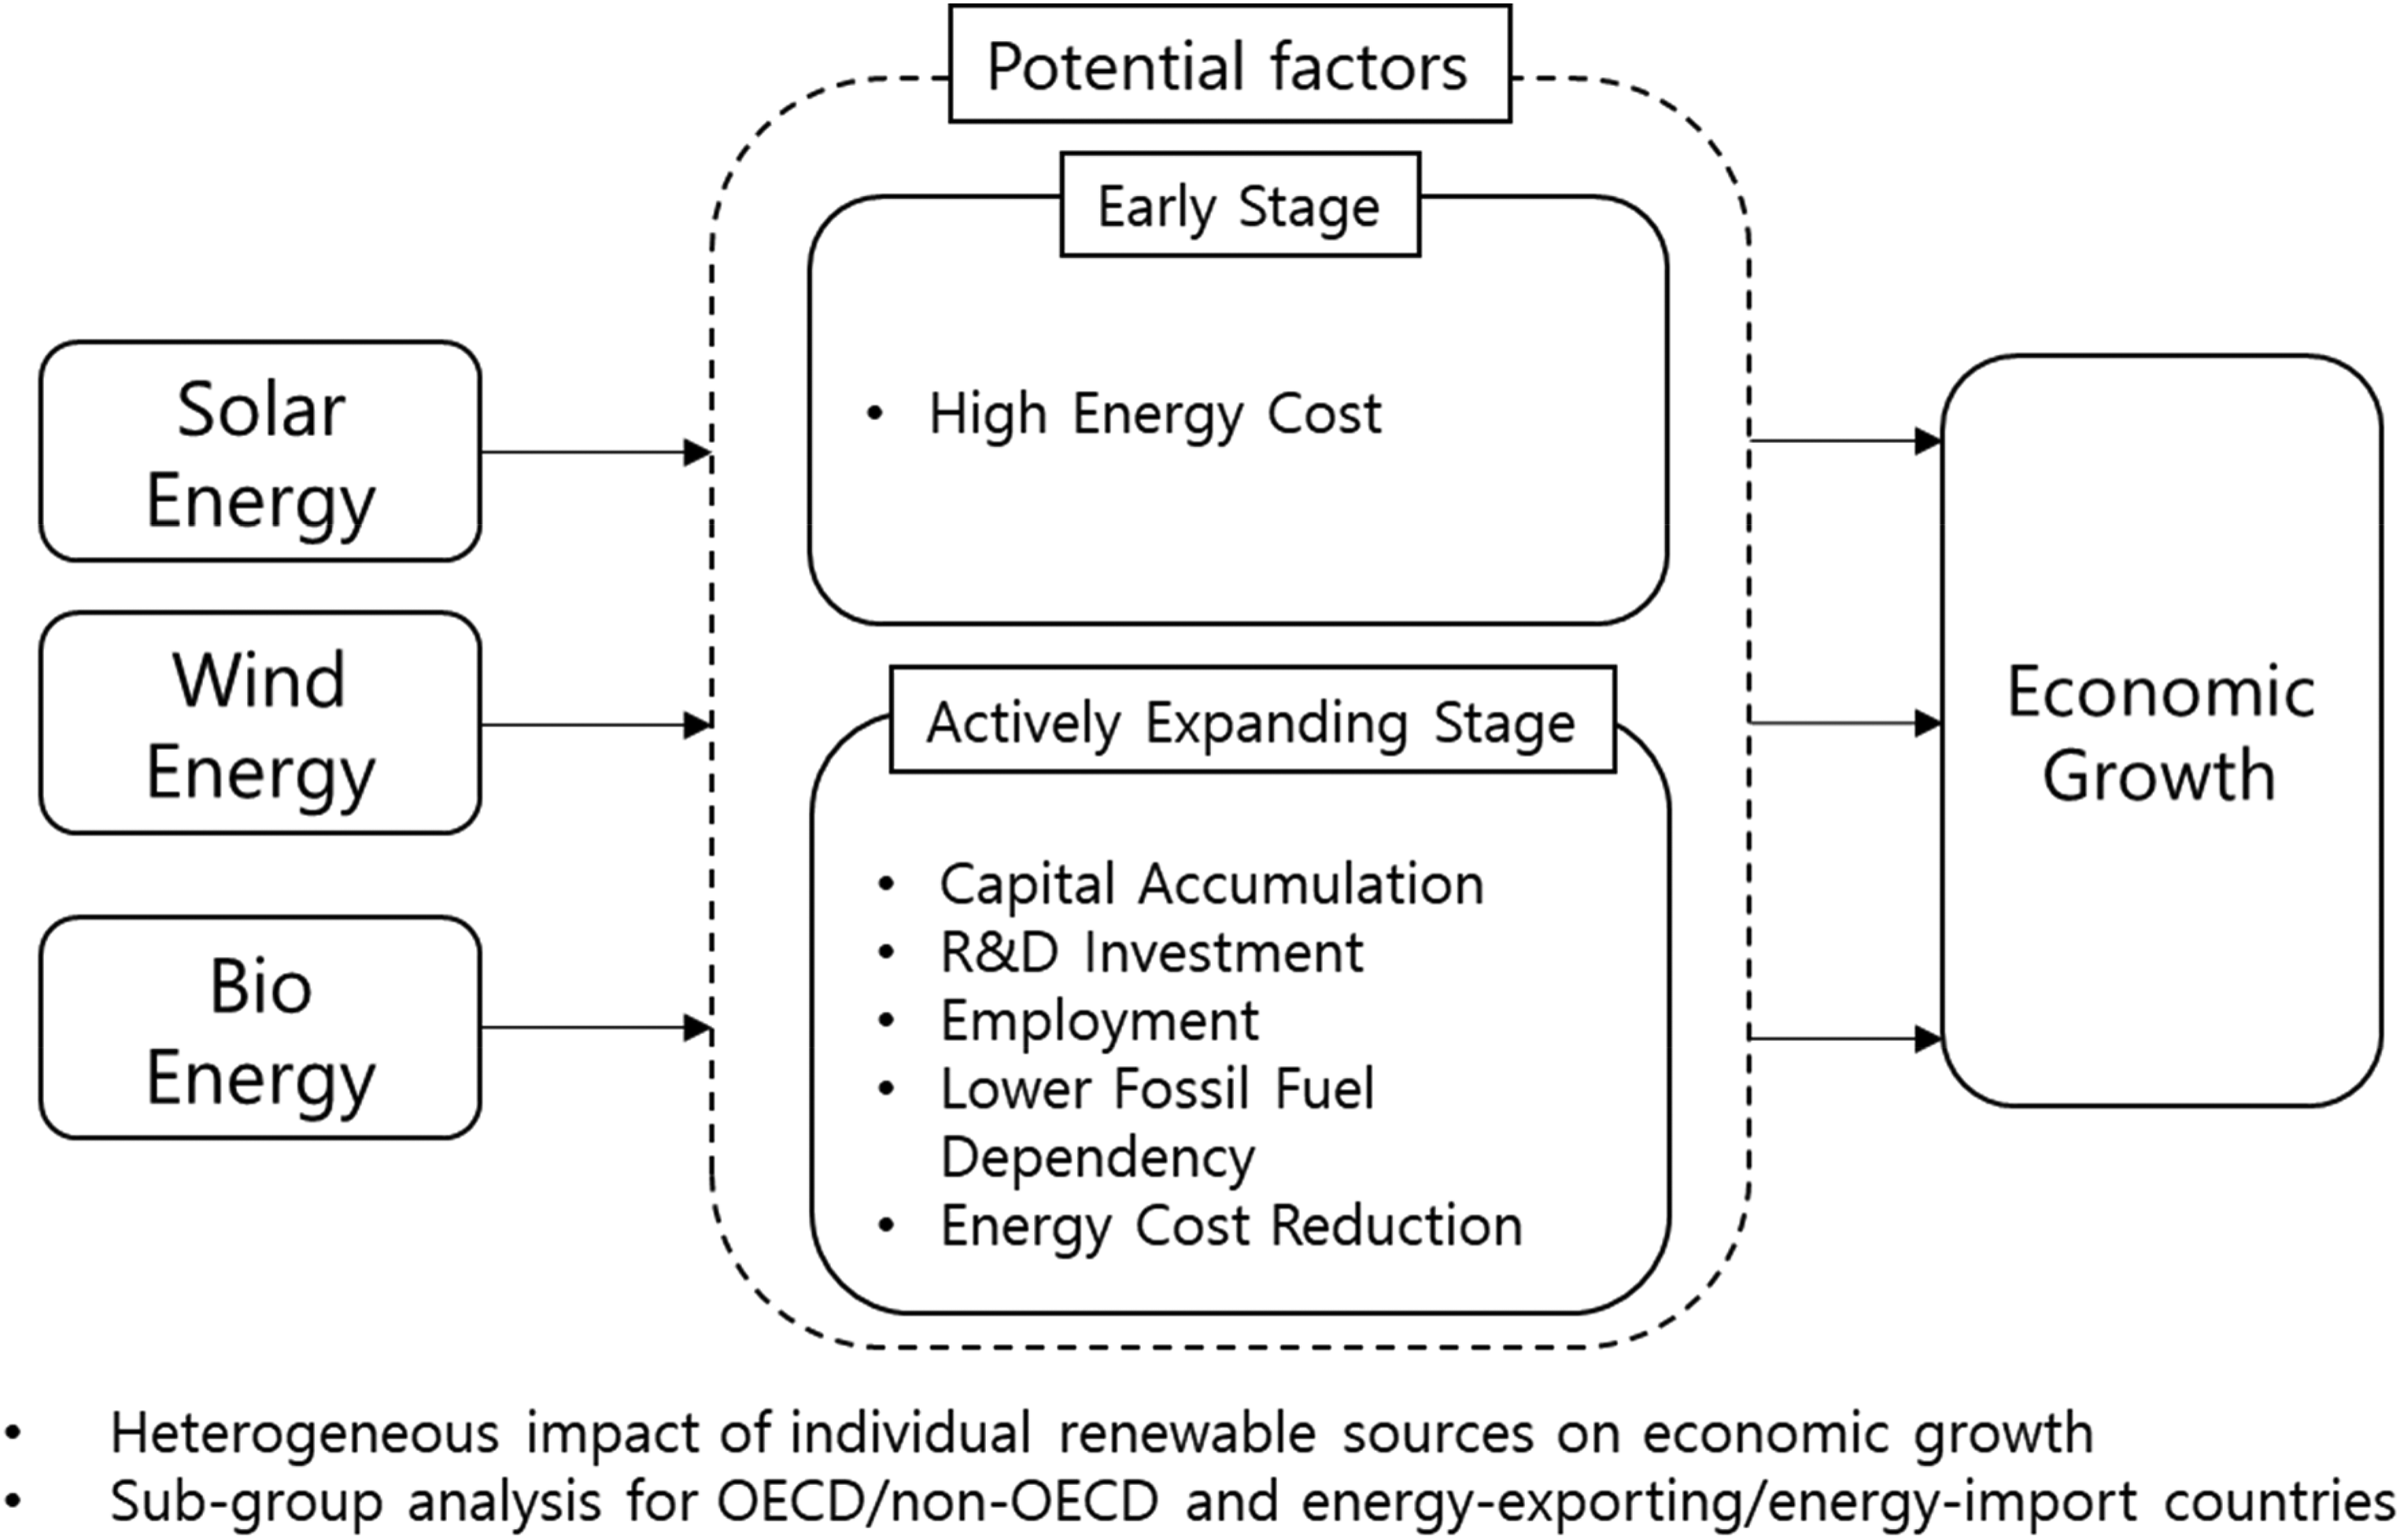
Structure of relationship between renewable sources and economic growth.
Therefore, it is important to investigate how different individual renewable sources affect economic growth to develop an optimal deployment plan for renewable sources to promote both environmental quality and economic growth. In this study, we performed a dynamic panel analysis on 89 countries from 1990 to 2018. We observed a significant U-shaped relationship for solar, wind, and bioenergy with economic growth, but turning points vary by different sources. Moreover, notably different results were observed between OECD and non-OECD groups, and net energy-exporting and net energy-importing groups.
The remainder of this paper is structured as follows. Literature review reviews the renewable energy and economic growth literature and outlines the main contributions of these studies. Model and data introduces the dynamic panel model and describes the data used in this study. Results presents the main empirical results. Finally, Conclusion and policy implications summarizes the conclusions and discusses the implications of this study.
Literature review
Many studies including Marques and Fuinhas, 8 Shahbaz et al., 9 and Kouton, 10 have explored the energy growth hypothesis, which states that energy demand drives economic growth. In general, studies investigating the relationship between renewable energy and economic growth can be divided into studies showing a negative impact and a positive impact.
On the one hand, studies showing that renewable energy negatively affects economic growth include Fang, 11 Asafu et al., 12 and Destek. 13 In Fang, 11 an empirical analysis of China showed that GDP per capita decreases when the share of renewable energy consumption increases. The paper pointed out that the reason for this is the reduction in production due to higher energy costs incurred by renewable sources. Asafu et al. 12 employed the pooled mean group estimator method in their analysis of 53 countries and found that renewable energy has a long-term negative impact on real GDP for energy-exporting developing countries, whereas it has a positive impact in energy-importing developed countries. A possible explanation is that energy-importing developed countries can gain additional advantages from renewable energy by replacing fossil fuel imports and reducing exposure to the volatility of fossil fuel prices as energy importers. In addition, developed countries can accommodate renewable energy more effectively due to their better capabilities for R&D investment and capital accumulation. However, in the case of energy-exporting developing countries, the relative cost of renewable energy to fossil fuels is much higher compared to energy-importing countries as they heavily depend on cheap fossil fuels; hence, the production cost increase due to higher energy costs incurred by renewable energy is much more severe. Destek 13 showed a negative relationship between renewable energy and GDP growth in newly industrialized countries such as Mexico and South Africa, based on the autoregressive distributed lag (ARDL) model, and suggested that investment in the renewable energy sector can be more burdensome for developing countries and harm economic growth before reaching an appropriate deployment level. Berradia et al. 14 show a bidirectional causality between economic growth and renewable energy consumption in the short and long run. Moreover, Emir and Bekun 15 discuss the same topic in Romania and says that there is uni-directional causality between energy consumption and economic growth.
On the other hand, studies showing that renewable energy has a positive impact on economic growth include Chien and Hu, 16 Zafar et al., 17 and Salim et al. 18 Chien and Hu 16 investigated whether renewable energy causes the expansion of new industries and job creation through capital accumulation and whether it affects GDP through energy import substitution. Pata3,4 stated the economic linkage between renewable energy and its surrounding economic environment. His analysis shows that China's clean energy encouragement policy in the agricultural sector and increasing investment in renewable energy boost environmental quality and agricultural productivity. Aydin and Pata 19 found that increasing renewable industry status by shocking REC policy can affect various economic factors including employment, GDP growth, and capital stock in the long term.
Chen et al. 20 demonstrated that there is a possible positive co-relationship between energy consumption and economic growth. Under the threshold models, investment in renewable energy sources positively affects non-OECD and developing countries’ well-being. More than that, the study by Olmo et al. 21 delivers their message regarding the relationship between renewable energy consumption and economic growth by examining the spatial relationship. Their estimation indicates that a 1% increase in total renewable energy consumption positively boosts gross domestic product by 0.025%. To 0.056%. In addition, the neighboring country's GDP increased from 0.03% to 0.054%.
Moreover, some studies investigated individual conventional renewable energy sources, which are hydroelectric and bio-energy. Aydin 22 researched BRICS countries from 1992 to 2013 using panel data analysis with a bootstrap panel causality test. Each country represents different results: Brazil and India show uni-directional causality from biomass energy consumption to economic growth, and the ones from China and South Africa have uni-directional causality from economic growth to biomass energy consumption. Russia was the only one whose causality test yields the bi-directional characteristic between two factors. Shahbaz 23 obtained a similar result using the VECM Granger causality test on the BRICS region from 1991–2015. He proposed a strong recommendation to increase the share of biomass energy as the first renewable energy source by providing evidence of the bi-directional causality existence in BRICS countries in both the short and long run. Plus, Bilgili and Ozturk 24 analyzed the impact of biomass consumption on GDP in 51 African nations using dynamic panel analysis, which shows that increasing biomass consumption boosts economic growth. More than that, Bildirici 25 found that increasing biomass consumption affects economic growth and that economic growth automatically stimulates biomass energy consumption again. Again, Bildirici and Gokmenoglu 26 implement another investigation on hydropower energy consumption. The research was conducted for G7 countries from 1961 to 2013 using MS-VAR and MS-granger causality methods. They found an interlinkage relationship between hydro energy consumption, carbon dioxide emissions, and economic growth. From the test, bi-directional Granger causality was found between carbon dioxide (CO2) emission and economic growth and energy consumption and hydro energy consumption is the granger cause of carbon dioxide emissions.
The simultaneous equation model showed that the capital accumulation effect due to renewable energy is statistically significant. Zafar et al. 17 showed that renewable energy causes economic growth in the Asia-Pacific Economic Cooperation (APEC) countries because renewable energy helps energy-importing countries that are less dependent on fossil fuels and reduces the volatility in fossil fuel prices. Additionally, they found that more proactive policies such as investment subsidies and tax incentives are needed to foster investment in renewable energy. Salim et al. 18 found unidirectional causality between renewable energy consumption and GDP growth, and bidirectional causality between industrial output and renewable energy in OECD countries. They showed that increasing renewable sources would enhance industrial output in developed countries, mitigate climate change, and ensure energy security.
Further, Cho and Lim 7 showed that by combining the results of both negative and positive impacts of renewable energy, a U-shaped relationship between renewable energy consumption and economic growth can be observed. That is, in the early stages of renewable energy deployment, it has a negative impact on economic growth due to high production costs, but after reaching a certain level, it creates momentum for economic growth through investment expansion and job creation.
Nevertheless, the literature on the relationship between individual renewable energy sources and economic growth is limited. Yildirim and Aslan 27 investigated the causal relationship between real GDP and renewable sources such as geothermal, hydro, and biomass energy in the US; however, they did not analyze the impact of major renewable sources such as wind and solar.
Therefore, this study makes three main contributions to the existing literature.
First, it analyzed the impact of three main individual renewable sources (i.e., solar, wind, and bioenergy) on economic growth based on Islam's 28 growth equation. Renewable Energy is an aggregation of several renewable sources whose technical characteristics are largely different. Solar, wind, and bioenergy have different levels of costs, technology maturity, capital accumulation, and job creation. It is necessary to distinguish the impact of individual renewable sources on economic growth to formulate an optimal portfolio strategy for renewable energy expansion.
Second, the difference between developed and developing countries with respect to the effects of individual renewable sources on economic growth is analyzed by dividing the 89 countries into OECD and non-OECD countries. In the previous studies, renewable energy was found to have positive effects in developed countries and negative effects in developing countries. The effects of renewable energy supply on economic growth are analyzed considering the nonlinearities of each individual source.
Third, in addition to grouping comparisons, we also made a new comparison between net energy-importing and net energy-exporting nations. The above comparison will help to identify how increasing energy independency and reducing fossil fuel price volatility by deploying renewable sources affect economic growth.
Model and data
Model
Most previous studies have focused on identifying Granger causality 29 between renewable energy and economic growth. However, a Granger causality method has two weak points. Firstly, the main objective of a causality model is to analyze how helpful one variable in predicting the other variable at t + 1; thus, it only captures short-term effects. Second, it is difficult to identify the magnitude of renewable energy effects on economic growth based on Granger causality as it only informs whether or not, a causal relationship exists or not.
Cho and Lim 7 discussed problems in models that consider renewable energy as an input factor for production, such as that given by Marques and Fuinhas. 8 They pointed out that this model does not include macro-related control variables such as government expenditure, inflation, human capital, trade openness, and so on, hence there is a possibility of an omitted variable problem. Additionally, when renewable energy is included in the model as an input factor for production, it highlights negative impacts due to production cost increases and disregards positive paths provided by renewable sources such as investment expansion, job creation, and replacement of fossil fuel imports. Finally, this model only captures short-term effects by analyzing the relationship between renewable energy share and real GDP simultaneously; thus, it tends to highlight negative short-term effects such as cost increase and disregard positive long-term effects such as R&D investment and capital accumulation.
The base model structured in the current study was built upon by dynamic regression model from Islam's
28
work on investigating economic growth. As shown below in equation (1), this model has a lagged dependent variable placed on the right-hand side of the equation activated as the independent variable, and the lag interval has been set to 5 years (


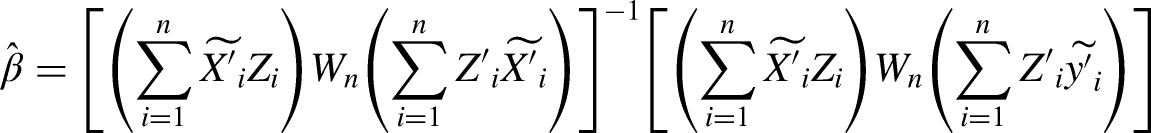
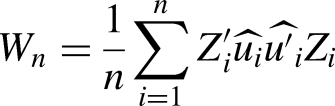
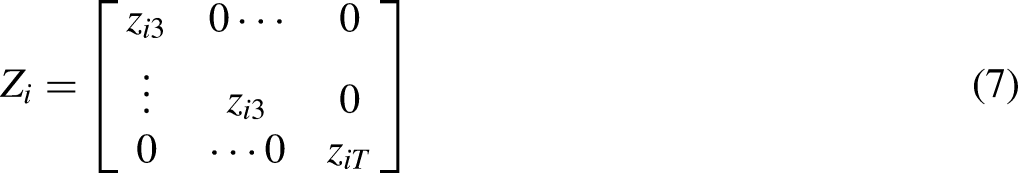

The following equations show the basic structure of the regression equation for aggregated renewable energy (RE), solar energy (SO), wind energy (WD), and bioenergy (BIO). By evaluating


Data
The study uses yearly data from 89 countries from 1995 to 2018. Among 118 countries that the World Development Indicators database reported regarding renewable generation, we selected 89 countries whose share of renewable generation is more than 0.01% of total electricity generation. Data on renewable generation from different sources are collected from the International Energy Agency (IEA), and the analysis is based on the renewable energy share of the total energy output. We investigate the impact of renewable sources, (i.e., solar, wind, and bioenergy) on economic growth.
As control variables affecting real GDP, macroeconomic variables such as; human resource variables and trade-related variables are included in the model. Other macroeconomic variables, such as government spending (GS), investment (INV), inflation rate (INF), lending interest rate (LINT), and taxes on income profit and capital gains (TX) are also included in the model. For human resource variables, the fertility rate (FR), the mortality rate (MR), and total secondary school male enrollment (EDUM) are included. For a trade-related variable, export growth (EXG) is included. These control variables are selected mainly based on previous surveys on determinants of economic growth,34,35 with some minor modifications made due to data availability. Control variables from Barro 35 gave us a good direction and advice for choosing appropriate and established economic growth contributors. All indicator variables significantly explained economic growth in cross-country panel analysis from his research on economic growth.
Table 1 shows summary statistics for the variables. Following Islam, 28 these variables are refined by 5-year moving-average with five consecutive term periods (t = 1995–1999, 2000–2004, 2005–2009, 2010–2014, 2015–2018), however, the last period covers only 4 years due to insufficient data collection in 2019.
Descriptive statistics.
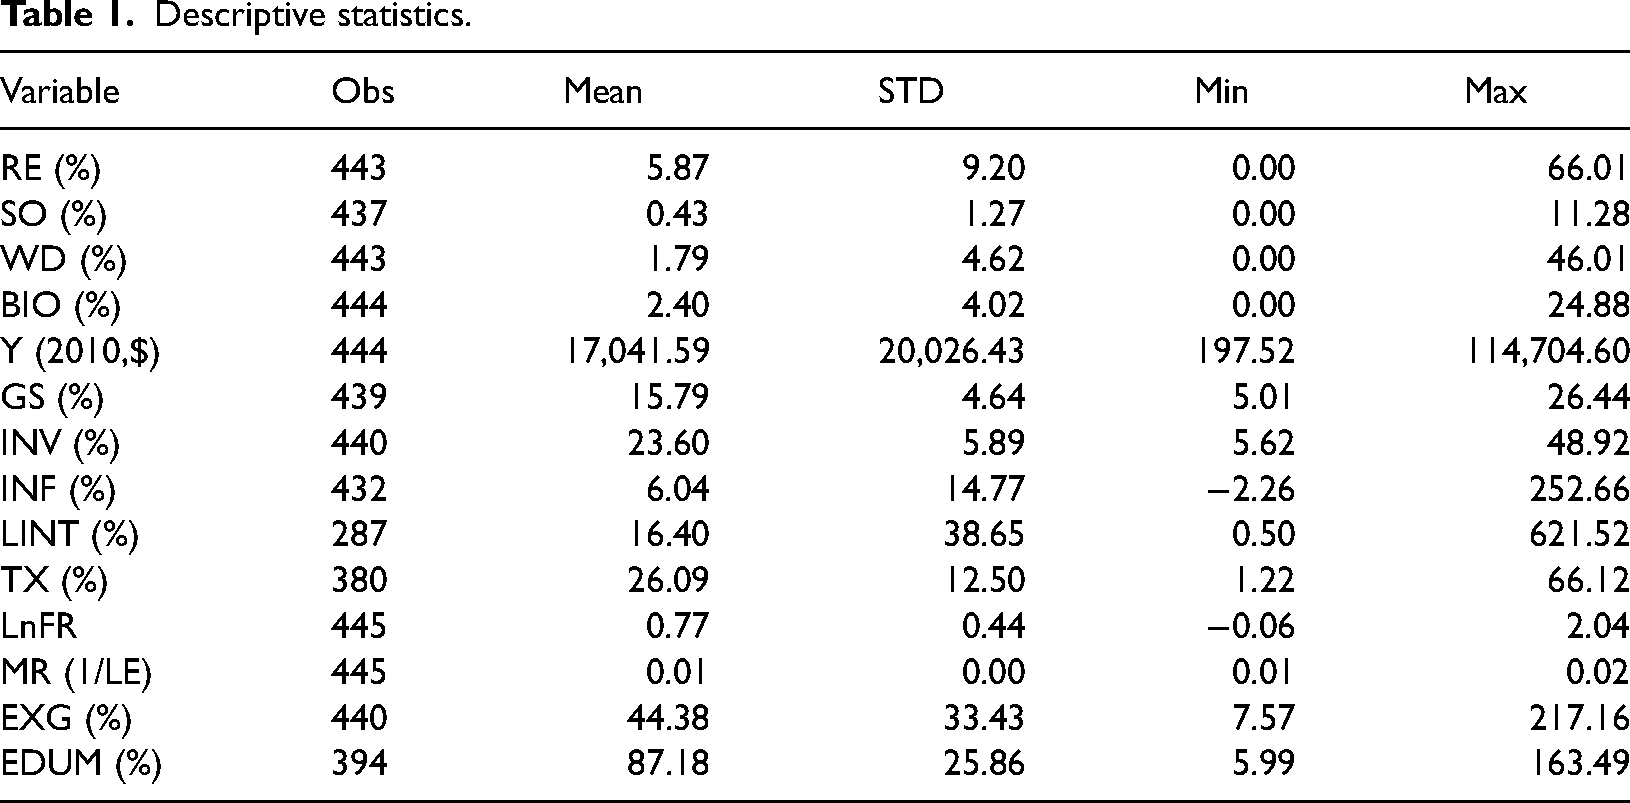
Figure 2 describes the share of renewable sources for each 5-year term period. The average share of total renewable energy in the total electricity output started from 2% at the beginning of the first term period, increasing to approximately 12% at the end of the last term period. Among renewable sources, the share of wind energy increases the largest by 6%p, while bioenergy increases steadily through the 28 years from 1.3% to 4.4% with a net increase of 3%p increase. Additionally, solar energy did not experience a noticeable percentage movement until 2010, when it started to increase, indicating that solar energy was not used worldwide until 2010; it has become a significant renewable source in the last ten years.
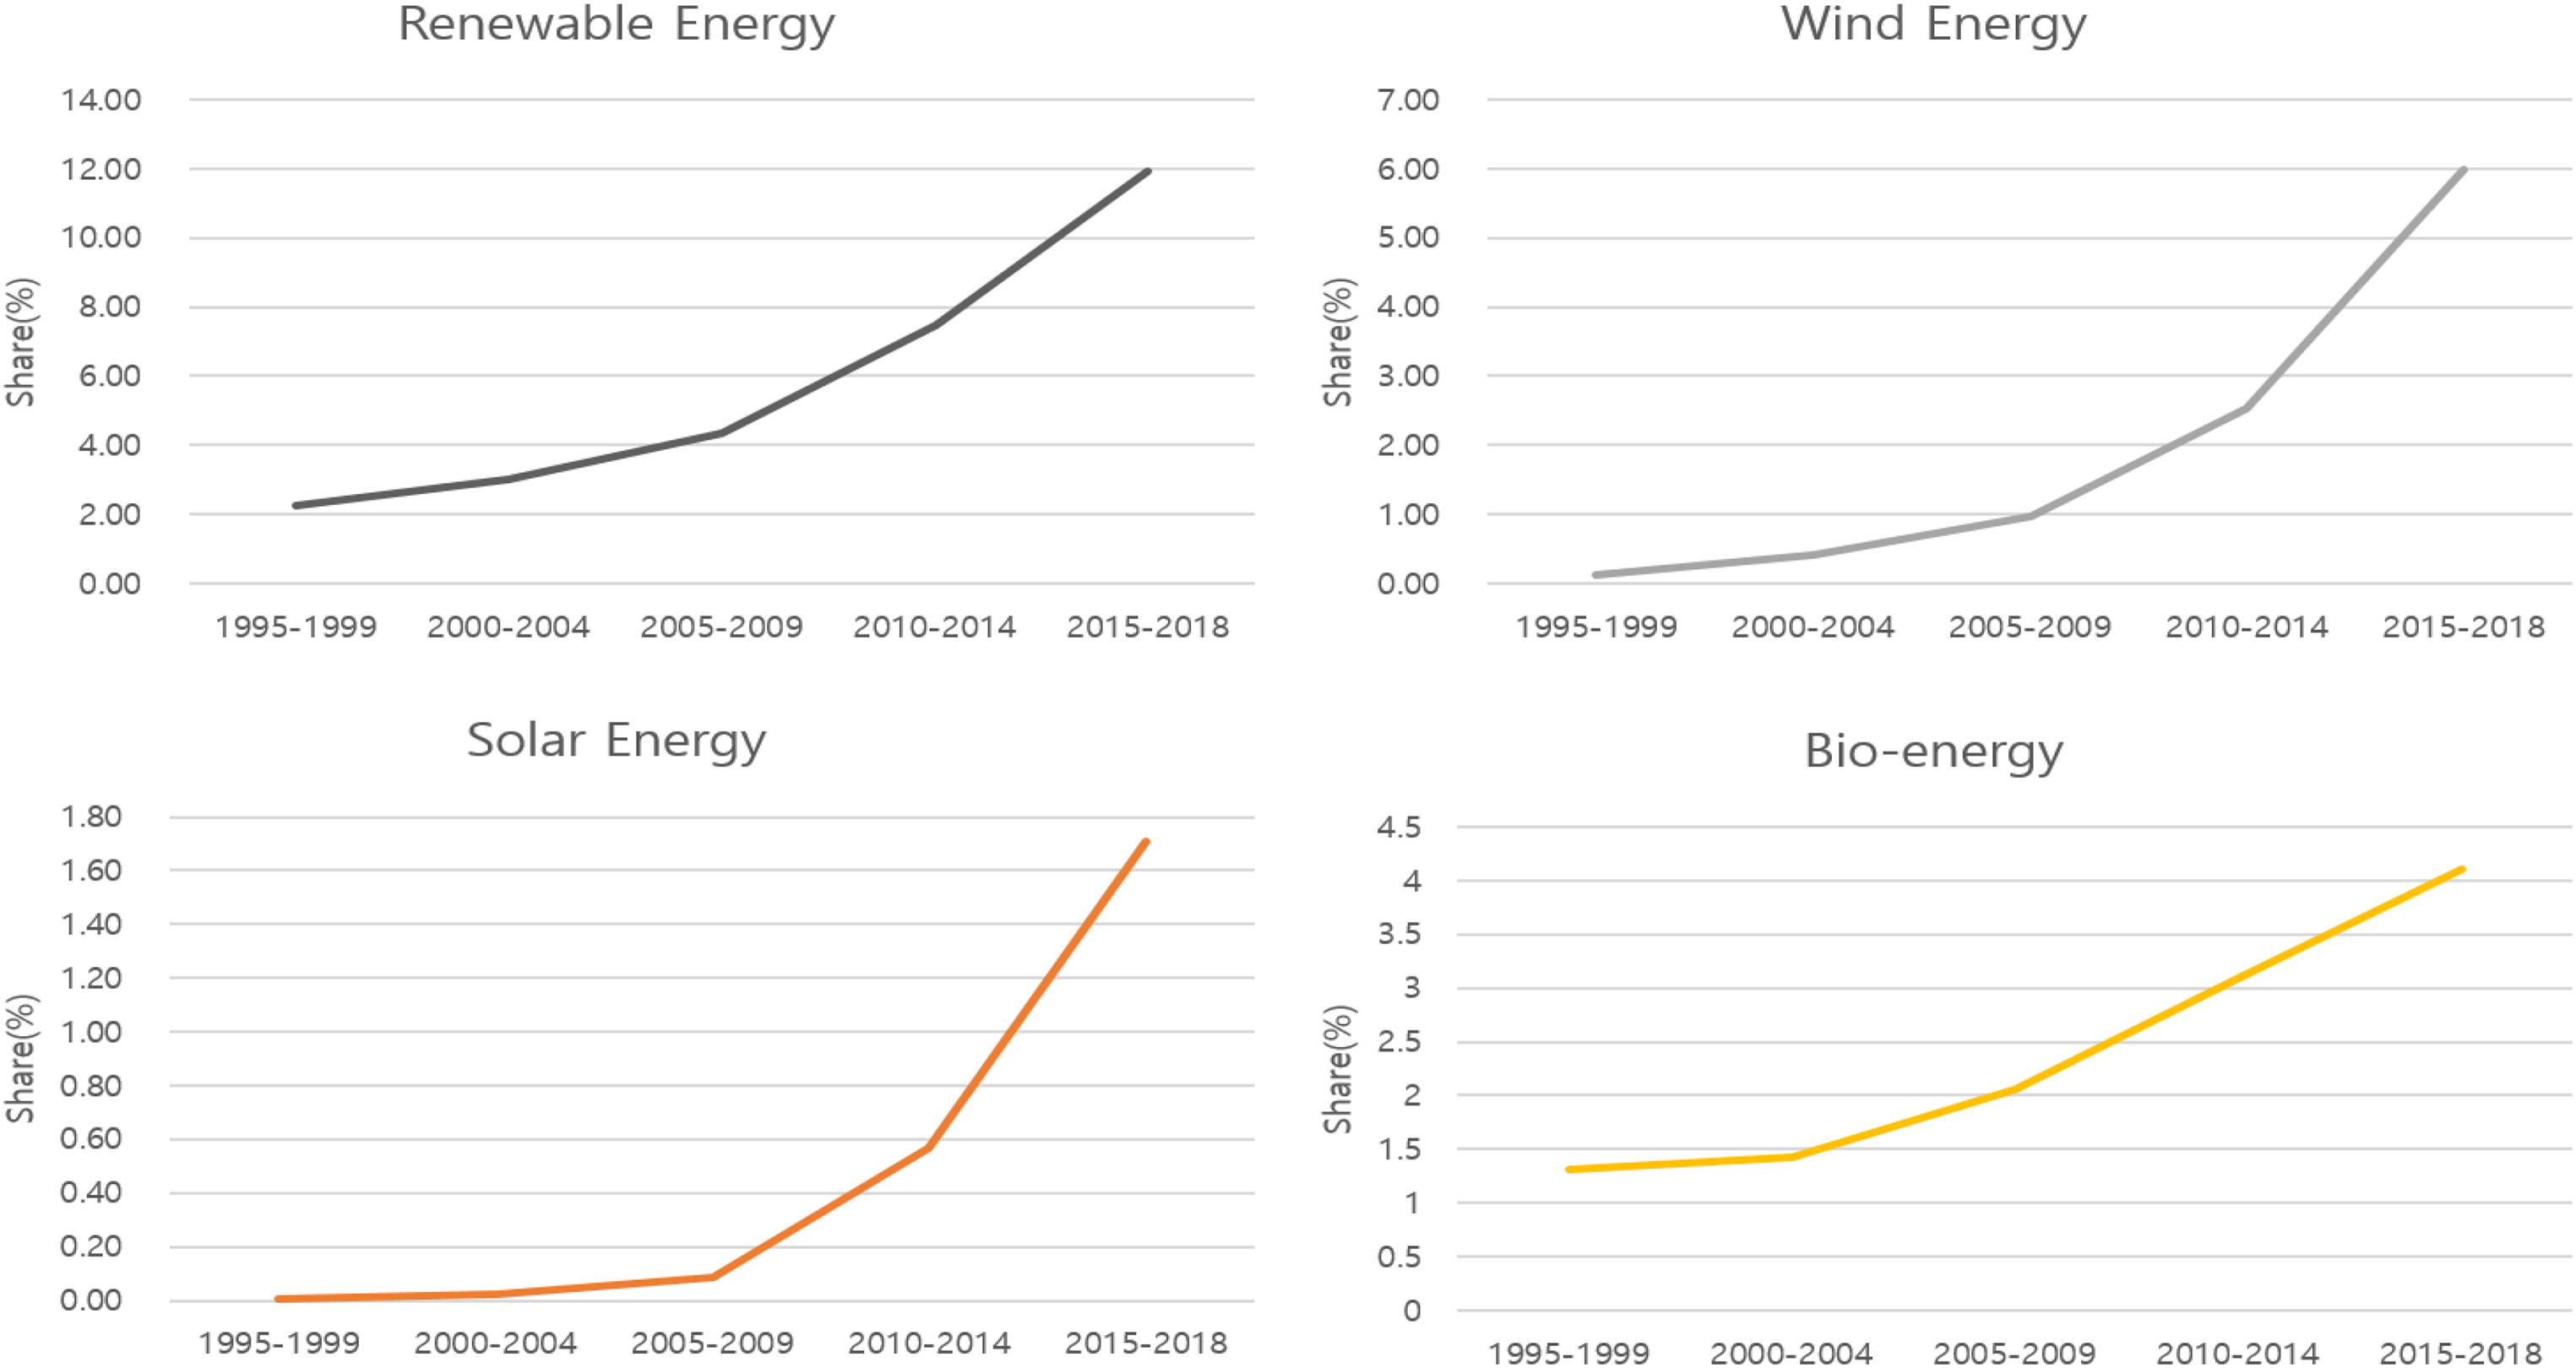
Share of renewable energy sources to total energy output from 1995–2018. 1
Results
In this study, we conducted tests on the following three hypotheses regarding the relationship between renewable energy sources and economic growth.
H1 : renewable sources and economic growth
Previous research has shown that renewable energy has a negative impact on economic growth by increasing production costs due to a higher energy cost compared to conventional fossil fuel energy, whereas more recent research has found a positive impact of renewable energy on economic growth through job creation, increased investment and capital accumulation. In addition, recent studies such as that by Cho and Lim 7 have shown that these two effects differ depending on the penetration level of renewable energy, resulting in negative effects at lower penetration levels and positive effects at higher penetration levels, thus showing a nonlinear U-shaped relationship between renewable energy and economic growth.
Building on these prior studies, this study tested the hypothesis that renewable sources such as solar, wind, and bioenergy have a nonlinear U-shape relationship with economic growth, with turning points that vary depending on the technology maturity level.
In the early stage of deployment for individual sources, the negative effects due to rising production costs vary because of different technical maturity levels. Therefore, with higher penetration levels for renewable sources, the positive impacts on the economy (e.g., job creation and capital accumulation) also vary based on the renewable source. Hence, the turning points of the U-shaped relationship, where negative impacts transition to positive impacts, vary according to the renewable source. In particular, the Levelized cost of energy (LCOE) of solar photovoltaics, wind energy, and bioenergy in 2019 was 0.05 to 0.19 USD/kWh, 0.04 to 0.18 USD/kWh, and 0.06 to 0.24 USD/kWh, respectively. In comparison, the LCOE of conventional fossil fuel generation is usually 0.1 to 0.15 USD/kWh, which shows that some countries have reached grid-parity but others have not, and that energy costs of individual sources vary in each country depending on the weather condition, penetration level, and technical maturity, which differentially affects economic growth.
Table 2 shows the empirical results of a linear relationship between economic growth and renewable sources including all renewable energy (RE), solar energy (SO), wind energy (WD), and bioenergy (BIO). The signs of the control variables are generally similar to those in Barro. 35 Investment, export, and education have a positive impact on economic growth, whereas government expansion, inflation, lending interest rates, fertility rates, and mortality rates have mostly negative impacts on economic growth. The applied control variables are found to be most appropriate as they properly explain economic growth at the 10% or lower significance level.
Results of a linear model for renewable sources.
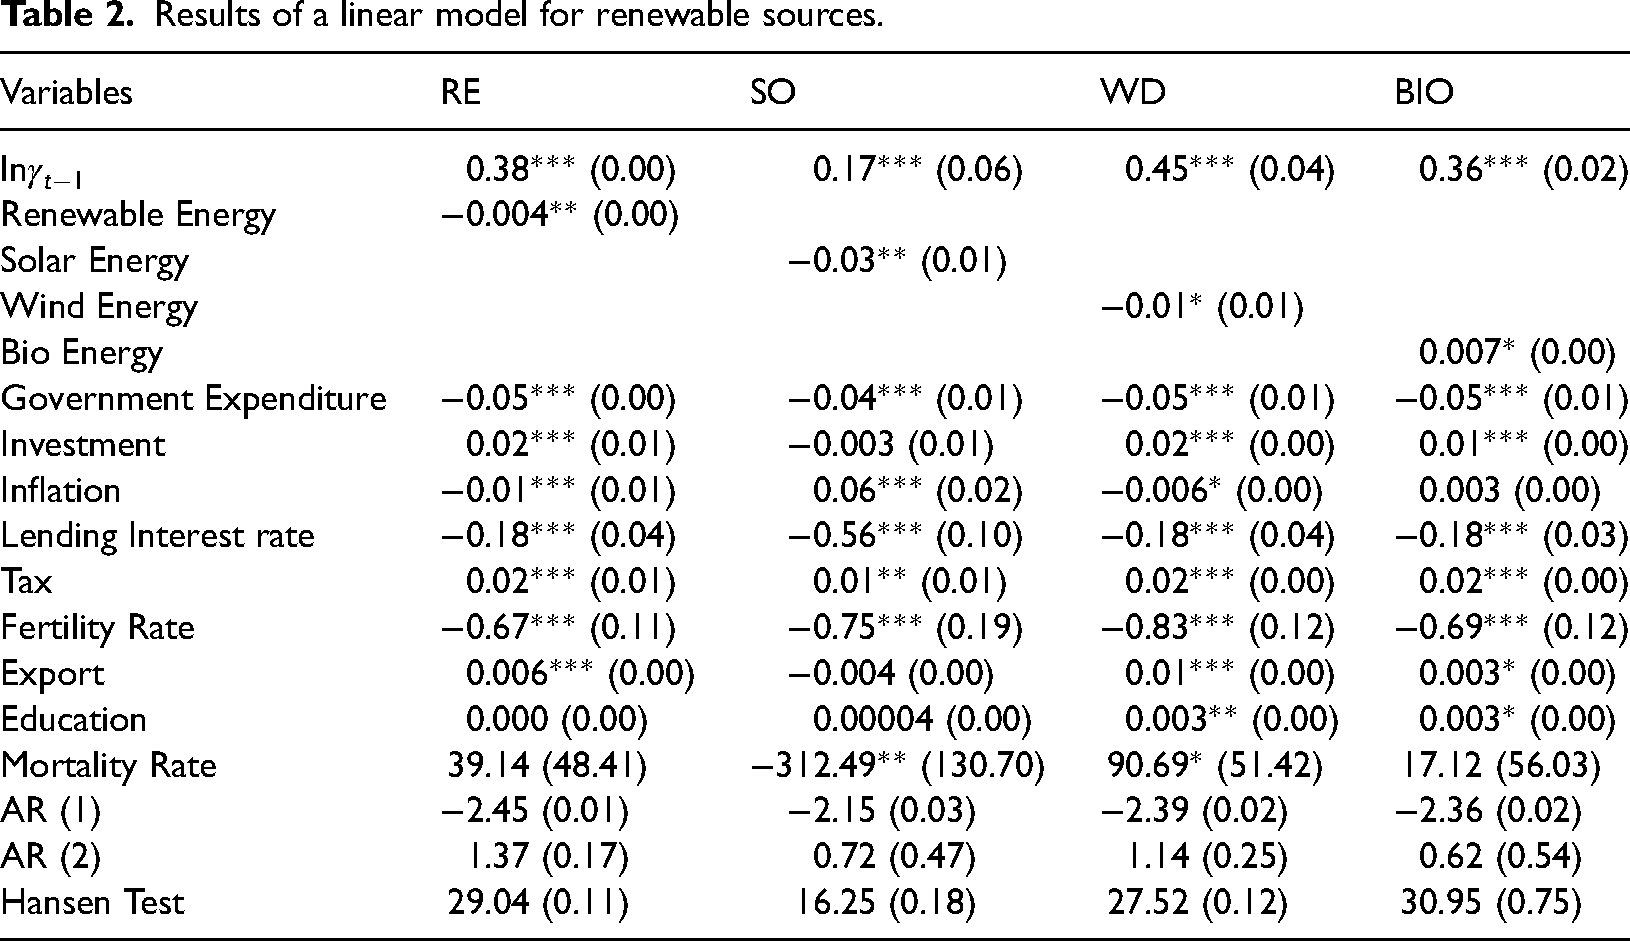
At the bottom of Table 2, the Hansen statistics and AR (1) and AR (2) are presented showing the results of the Hansen test and the Arellano-Bond autocorrelation test. AB-GMM has an overidentification problem because there is only one endogenous variable, but many instrument variables are used. The null hypothesis of the Hansen test is “over-identification is proper”, and when failing to reject it, the instrument variables used in the model can be determined to be appropriate. The result shows that applied instrument variables are proper at the 5% significance level as the presented p-values for the four models are between 0.07 and 0.18.
The Arellano-Bond autocorrelation test is a test to determine the time series dependencies of residual terms. Since the first-order difference model is applied for estimation based on GMM, we can determine that there are no time series dependencies if AR (1) has significant time series dependencies, whereas AR (2) does not. The analysis showed that the p-values of AR (1) are between 0.01 and 0.03, which are significant at the 5% level, and the p-values of AR (2) are between 0.17 and 0.54, thus not significant at the 5% level. Therefore, it is confirmed that there is no time series dependency.
The empirical result of the linear relationship between renewable sources and economic growth shows that there are significant negative relationships for RE, SO, and WD, and a positive relationship for BIO. From this, one can conclude that SO and WD are technology-based renewable sources and still expensive on average globally, compared to fossil fuels; thus, they still have a negative impact on growth considering only linear relationships. However, BIO, which includes traditional biomass as a major share, has a positive impact as it has been traditionally used and is still actively used in developing countries as a cheap source of energy.
Table 3 shows the nonlinear relationship between economic growth and renewable sources by adding a square term of individual sources to test hypothesis 1. The results show that linear terms and square terms are significant at the 5% level for all renewable sources, and the sign of the square term is positive, indicating a nonlinear U-shaped relationship, initially decreasing, and then increasing after a certain critical point.
Results of non-linear model for renewable sources.
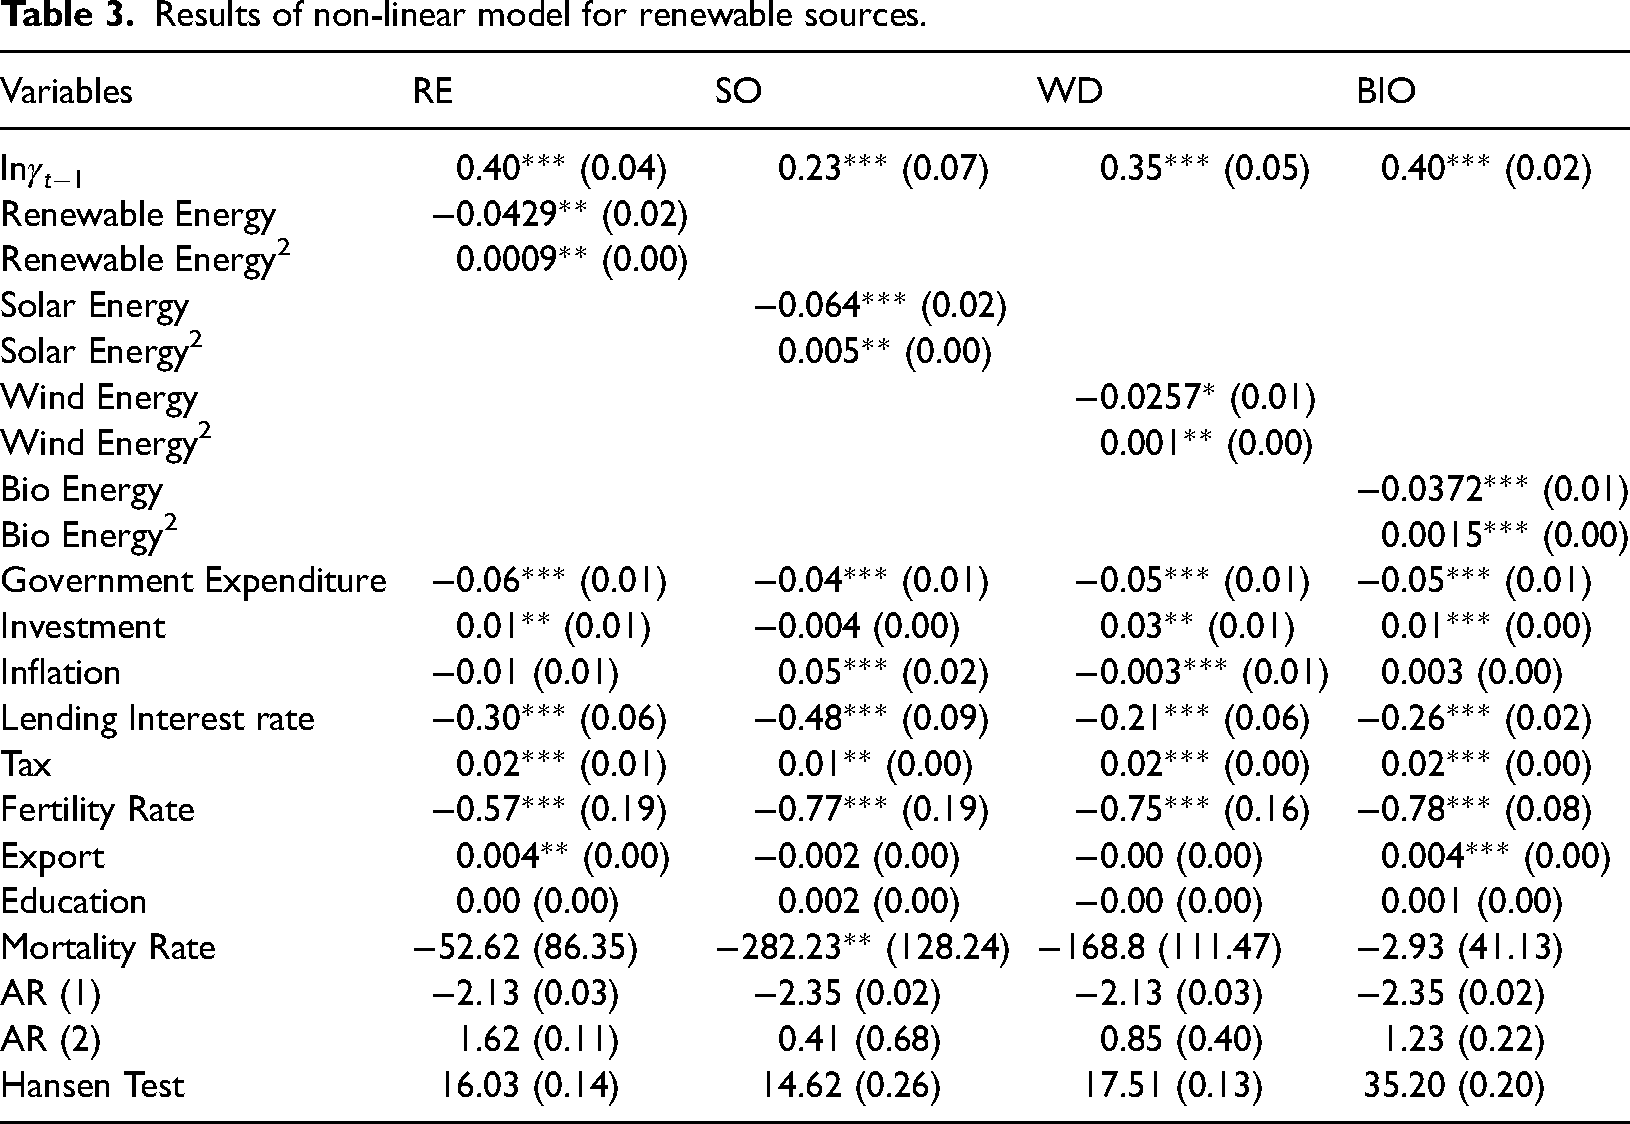
Table 4 shows the level of penetration for each renewable source and the turning points converting from negative to a positive relationship in a U-shaped relationship based on
Turning points estimation.

There are two main reasons why different turning points appear for each renewable source. First, there are big differences in the current levels of renewable energy shares in the total energy supply, with up to 11.3% of SO, 46.01% in WD, and 24.88% in BIO, in 89 countries. When the U-shaped relationship and turning points are statistically significant, it means that the current samples have negative relationships before the turning point and positive relationships after the turning point with economic growth; therefore, the level of turning point is somewhat affected by the current penetration level of each source. Second, energy production cost, technology maturity, and job creation have different effects based on renewable sources. Wind energy, a traditional renewable source that has been used for more than 50 years, has already been deployed considerably and technology maturity is high; thus, its turning point is estimated at a relatively high level of 12.45%. Conversely, solar energy has been actively deployed only in the past 10 years and cost reduction by technology development is still in progress; thus, reflecting this trend, the penetration level of 6.4% indicates the start of having a positive impact on economic growth. The results from Table 4 confirm that the turning points differ for each renewable source as postulated in H1.
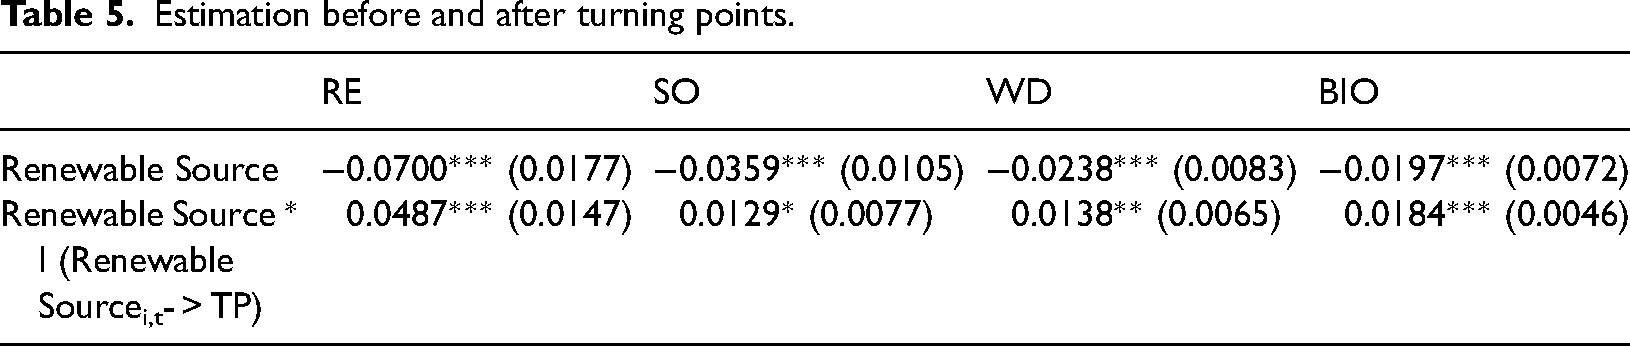
To confirm that the turning points estimated in Table 5 are valid, we estimated linear models for each source with a dummy variable indicating renewable source levels higher than turning points as shown in Table 4. The results show that all renewable sources have a significant negative impact on economic growth before the turning points, and a significant positive impact after the turning points. From the previous literature, an investigation from Bhattacharya et al. 36 yields a 16.2% value of reflection point, which is slightly lower than the above outcome. Moreover, the turning point estimation from Cho and Lim 7 detects 20.8%, which is very similar to 24.43% from our value calculation.
Estimation before and after turning points.
H2 : OECD and non-OECD countries
The higher pressure for carbon reduction on OECD countries makes them more active in deploying renewable sources and investing in related R&D, resulting in achieving grid-parity earlier compared to non-OECD countries. Additionally, OECD countries can benefit better from capital accumulation and job creation when the renewable energy industry expands as their capacity to accommodate new industries are larger. Therefore, turning points in the U-shaped relationship between renewable sources and economic growth for OECD countries will be lower compared to non-OECD countries.
Table 6 summarizes empirical results for linear and non-linear relationships between renewable sources and economic growth for OECD and non-OECD countries. The results show that a U-shaped relationship is significant for OECD countries. The turning points for OECD countries are slightly lower compared to the case of all countries presented in Table 4. Investigation from Cho and Lim 7 yields the reflection point of 18.8% from OECD and 19.1% from Annex 1 countries but acquires no values from the opposite party, non-OECD and Annex 2. Their values were lower than our accounted value, which is 24.18%, and very close to the previous outcome for investigating the whole country, which is 24.43%.
Linear and non-linear analysis; OECD vs non-OECD countries.
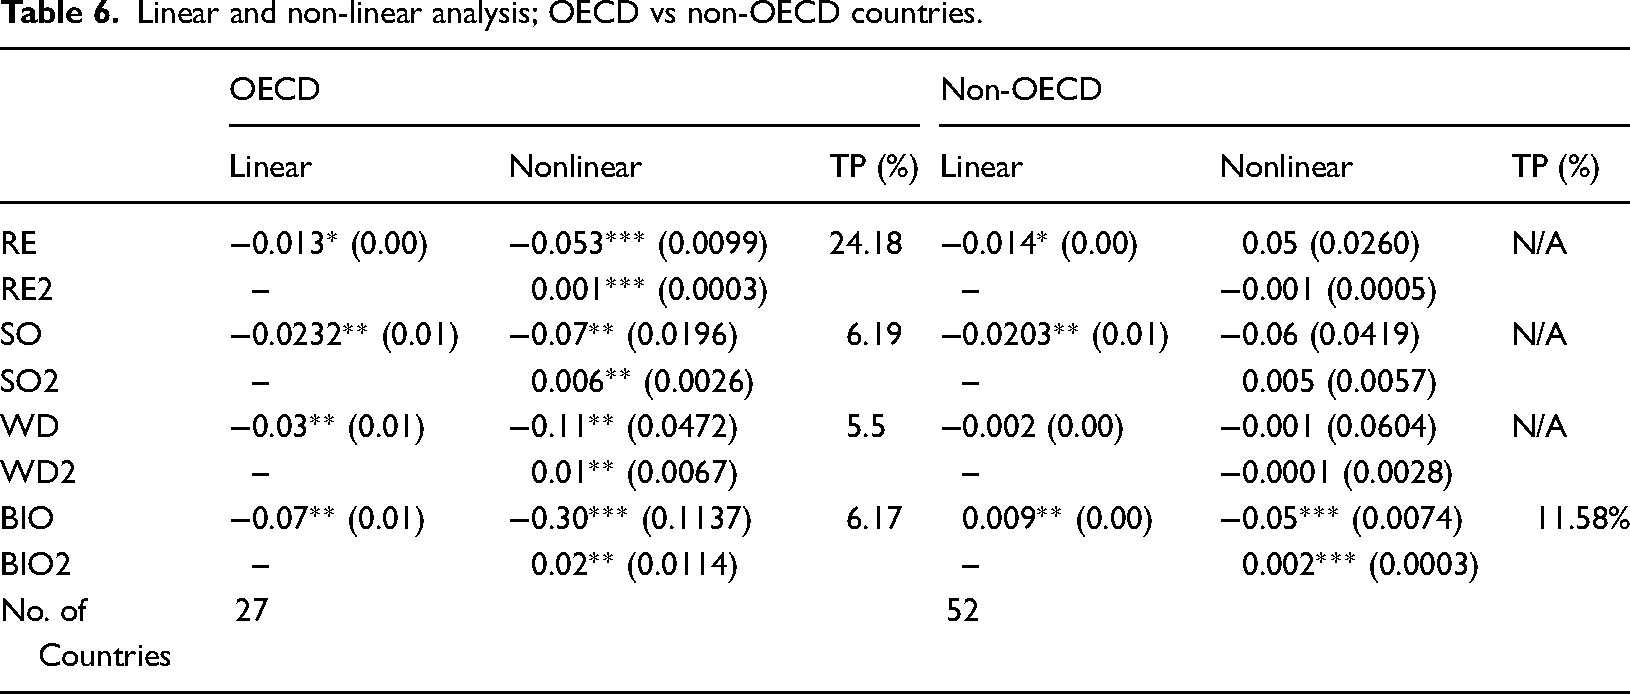
This is because renewable energy cost is generally lower due to higher technology maturity in OECD countries. In addition, in the model that only includes a linear term, renewable sources harm economic growth, which is similar to the analysis of all countries. However, bioenergy shows a positive sign in the analysis of all countries but is negative in OECD countries. This is because OECD countries have had a very small share of biomass in bioenergy since 1990, unlike developing countries; thus, the pure impact of new technologies such as bio-fuel is reflected for bioenergy in OECD countries. Hence, the impact on economic growth is negative, as for other renewable sources.
For non-OECD countries, the results show that nonlinear U-shaped relationships are not significant for RE, SO, and WD, while linear relationships are significantly negative for RE and SO. This is because technology-based renewable sources, such as SO and WD, have not been deployed beyond the turning point level so that they can have a positive impact on economic growth in non-OECD countries. However, for non-OECD countries, whose ratio of traditional biomass use is very high, BIO shows a positive linear relationship with economic growth, and a nonlinear U-shaped relationship is also confirmed as its level of penetration is relatively high.
To summarize the analysis of H2, OECD countries show significant U-shaped relationships between renewable sources and economic growth because renewable generation cost is low due to advanced technology, a larger job creation effect with the renewable energy penetration level of many OECD countries surpassing the turning points. Whereas, renewable sources in non-OECD countries do not have U-shaped relationships with economic growth because their technology maturity is still low and not many countries have deployed renewable sources beyond the turning points. A U-shaped relationship is observed only for BIO, whose major share is traditional biomass in non-OECD countries.
H3 : net energy-importing countries and net energy-exporting countries
Fossil fuel energy costs in net energy-importing countries, such as South Korea and Japan, are typically higher compared to net energy-exporting countries and are highly exposed to international energy price volatility as they have to purchase most of their energy needs from international markets. The energy price volatility induces higher risk for countries that have an energy-intensive industry structure. Therefore, net energy-importing countries can benefit more from renewable sources as they can reach grid-parity more easily and quickly as fossil fuel costs are already high and they are less exposed to fossil fuel price volatility because renewable energy is mostly produced domestically. Hence, net energy-importing countries can expect a lower turning point in the U-shaped relationship between renewable sources and economic growth compared to net energy-exporting countries.
Table 7 shows a comparison between net energy-importing countries and net energy-exporting countries with respect to the impact of renewable sources on economic growth. In net energy-exporting countries, all renewable sources in the non-linear model show insignificant results. This is because most net energy-exporting countries have a very low penetration level of renewable sources due to low fossil fuel costs, making achieving grid-parity very difficult, and consequently, renewable sources economically unfavorable.
Linear and non-linear analysis, net energy-importing vs net energy-exporting countries.
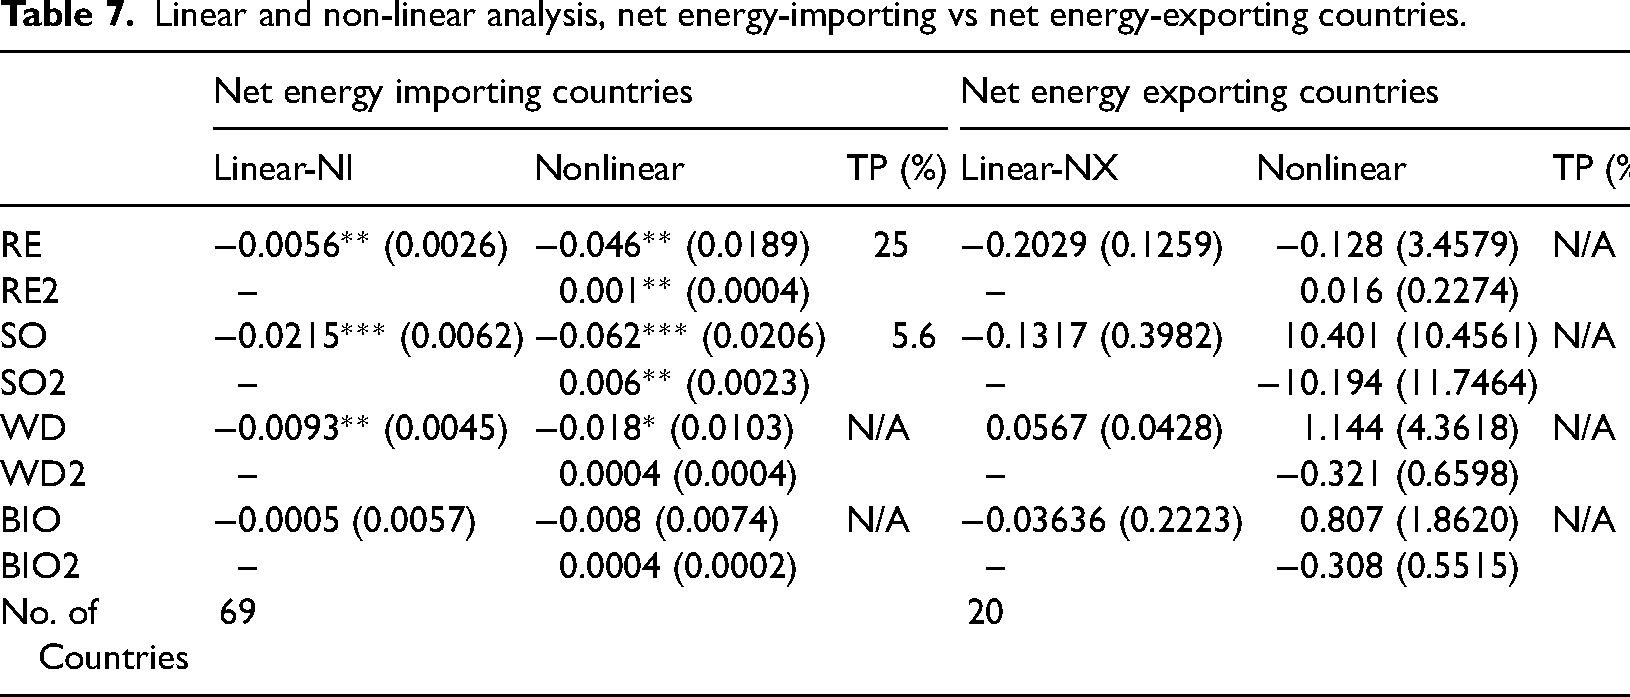
Conversely, in net energy-importing countries, RE and SO have significant U-shaped relationships with economic growth. Since the fossil fuel cost level of net energy-importing countries is high, and they have to import and also pay for transportation costs, renewable sources can achieve grid-parity relatively easy; thus, the overall energy cost in the net energy-importing countries can be reduced by renewable sources when technology maturity is enhanced. In addition, energy price volatility in net energy-importing countries is high, and this is a significant risk as shown by the oil shocks in the 1970s and 2010s. Renewable energy can contribute to mitigating this risk.
Conclusion and policy implications
This study analyzed nonlinear relationships between individual renewable sources and economic growth to understanding how the different characteristics and technology maturity levels of individual renewable sources have varying impacts on economic growth. Identifying these U-shaped relationships can help us understand the required penetration level for each source to convert the negative impact to a positive one. The main conclusions of this study can be summarized as follows.
First, the technical maturity and job creation effects of individual renewable sources are different; thus, we can confirm that the turning points in U-shaped relationships differ by renewable sources. In particular, the turning point of SO is estimated to be low: 6.2%; however, its penetration level is rapidly increasing, so it has a high potential to have a positive impact on economic growth in the near future.
Second, the effects of renewable sources on economic growth vary between OECD and non-OECD countries. While most renewable sources in OECD countries show significant U-shaped relationships, non-OECO countries do not have nonlinear relationships due to low technology development and penetration levels.
Third, net energy-importing countries show U-shaped relationships between renewable sources and economic growth because renewable sources are highly deployed as the relative cost of renewable sources to fossil fuels is low. Further, reducing the uncertainty of international fossil fuel prices is an additional benefit that renewable sources can bring to net energy-importing countries. Conversely, for net energy-exporting countries, the U-shaped relationships are not significant as the penetration levels of renewable sources are typically low; thus, the turning points have not yet been reached, and the relative prices of renewable sources to fossil fuels are high, making it difficult to achieve grid-parity.
Moreover, the results of this study provide the following policy implications.
First, expanding renewable sources to achieve net zero emission must be accompanied by promoting economic growth, and the key to this is to quickly reach grid-parity through technology development. Since non-OECD countries have low technology levels and energy-exporting countries have difficulty achieving grid-parity due to the low price of fossil fuels, they have no significant turning points that can convert the negative impact of renewable sources on economic growth to a positive one. To overcome this problem, continuous R&D investment can reduce the cost of renewable sources and help couple the deployment of renewable sources and economic growth.
Second, policies that financially support the deployment of renewable sources are needed in the low penetration stage because renewable sources adversely affect economic growth and they are not economically feasible to compete with fossil fuels. Policies such as feed-in tariff (FIT) and renewable portfolio standard (RPS) have been widely adopted in OECD countries to support the deployment of renewable sources. To have renewable sources deployed beyond the turning point level, governments need to actively intervene and implement policies that support the deployment of renewable sources. By doing so, we will be able to achieve the net zero carbon emission target by combining carbon mitigation and economic growth.
Third, since OECD countries account for 35% of carbon emissions from the global energy sector with the remaining 65% coming from non-OECD countries, it is necessary to replace fossil fuels with renewable sources in non-OECD countries to achieve the net zero carbon emission target. Therefore, global carbon emission mitigation programs such as the clean development mechanism (CDM) need to be further developed and activated so that technology transfer and financial support for developing countries are actively provided; thus, the penetration level of renewable sources can eventually reach the turning point that enables sustainable and voluntary deployment.
Finally, as a direction for future upcoming research, other renewable energies including newly arise as significant energy drivers which are hydrogen electricity, geothermal, and other renewable sources can be analyzed in the same manner. They need to be utilized more often and considered as research topics through many channels at some point shortly due to the globalization of the campaign against reducing co2 emissions. Furthermore, future studies need to focus on analyzing the intermediate point when renewables affect economic growth. In particular, investigating renewables and various economic growth factors, including human capital, trade openness, and advancing technological level, needs to be verified. Finally, due to the lack of missing data from non-OECD nations, OECD and well-developed countries can be examined solely by dividing the group into small-scale regional sectors based on many sub-categories such as regional characteristics, average income level, and scale; of investment in renewables.
Footnotes
Declaration of conflicting interests
The author(s) declared no potential conflicts of interest with respect to the research, authorship, and/or publication of this article.
Funding
The author(s) received no financial support for the research, authorship, and/or publication of this article.
Notes
Appendix
Net energy-importing and net energy-exporting countries.
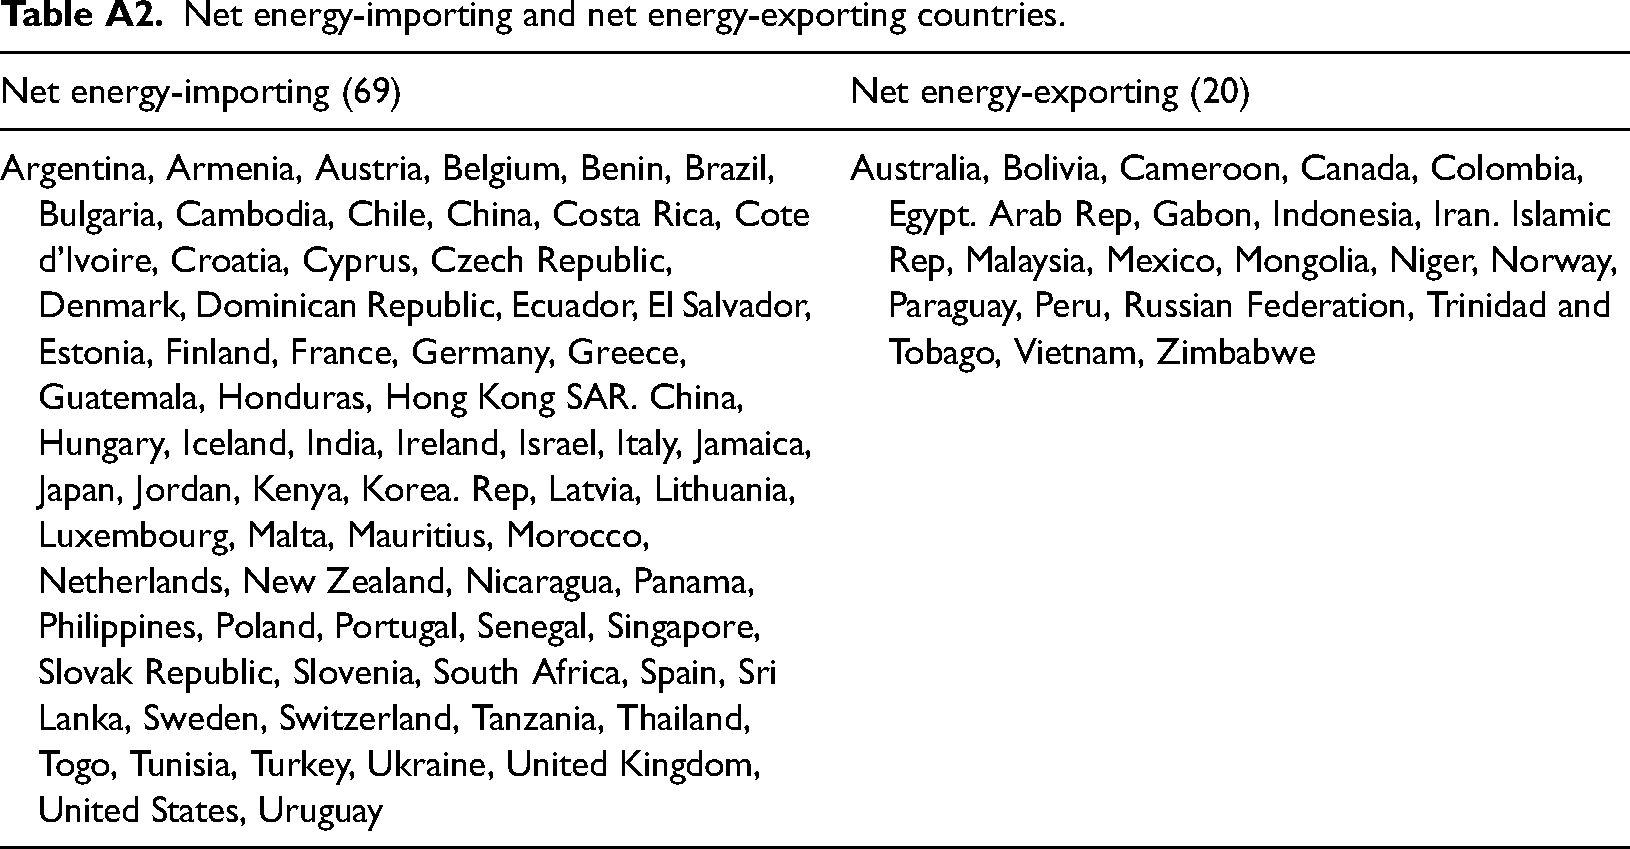
| Net energy-importing (69) | Net energy-exporting (20) |
|---|---|
| Argentina, Armenia, Austria, Belgium, Benin, Brazil, Bulgaria, Cambodia, Chile, China, Costa Rica, Cote d’Ivoire, Croatia, Cyprus, Czech Republic, Denmark, Dominican Republic, Ecuador, El Salvador, Estonia, Finland, France, Germany, Greece, Guatemala, Honduras, Hong Kong SAR. China, Hungary, Iceland, India, Ireland, Israel, Italy, Jamaica, Japan, Jordan, Kenya, Korea. Rep, Latvia, Lithuania, Luxembourg, Malta, Mauritius, Morocco, Netherlands, New Zealand, Nicaragua, Panama, Philippines, Poland, Portugal, Senegal, Singapore, Slovak Republic, Slovenia, South Africa, Spain, Sri Lanka, Sweden, Switzerland, Tanzania, Thailand, Togo, Tunisia, Turkey, Ukraine, United Kingdom, United States, Uruguay | Australia, Bolivia, Cameroon, Canada, Colombia, Egypt. Arab Rep, Gabon, Indonesia, Iran. Islamic Rep, Malaysia, Mexico, Mongolia, Niger, Norway, Paraguay, Peru, Russian Federation, Trinidad and Tobago, Vietnam, Zimbabwe |