
Abstract
The present millennium records the most devastating effects of global warming than what was evident in the pre-industrial era. The pervasive effects of global warming have raised concerns about the sustainability of the present and future generations. Hence, researchers are working assiduously towards proffering the most effective method of halting the surging emissions from global, regional, and national angles. This study contributes to the extant literature by providing the first empirical verification of how renewable energy, technological innovations, trade openness, and transport services impact carbon emissions in Germany. The empirical evidence is anchored on annual time series data from 1990 to 2020 estimated using the novel nonlinear ARDL to explore the positive and negative shocks associated with the short and long-run nexus. The wavelet coherence estimator is equally for ascertaining the multiple time scales in the time series and extends the knowledge frontier to the literature. The following findings are eminent from the overall analyses. First, long-run cointegration is supported among the variables of interest Second, only the adverse effects of renewable energy and technology are substantial enough to mitigate carbon emissions. The trade-induced emissions are established with the positive impacts of trade openness on carbon emissions. Transport services contribute significantly to carbon emissions in the long-run and short-run periods. However, mitigating effects of small magnitude are apparent in the long-run due to the perceived transition to green transportation. Policy implications supporting the transition to 100% renewable energy and green transportation are significant steps towards achieving Germany's carbon neutrality target.
Introduction
The need to resolve the pervasive challenges posed by global warming to the peaceful coexistence of humanity and the ecosystem remains one of the most debated topical issues in the present decade.1–3 Among many other plausible reasons, every stride recorded in increasing economic growth rates comes with environmental implications, making sustaining the environment an issue of concern for developed and developing countries globally. 4 Hence, policymakers, international organizations, and national governments are keen to achieve economic growth and ensure the environment is not neglected under the global advocacy for the sustainable development agenda pioneered by the United Nations sustainable development agenda (SDGs) 2030. In particular, the 2021 edition of the United Nations Climate Change Conference (COP26) held in Glasgow, United Kingdom, with closely 200 countries in attendance, stressed the need for governments to commit themselves to pursue global net-zero emissions by 2050 and equally maintaining global temperature rise within 1.5 degrees by 2030. 5
The pathway to reaching significant net-zero emissions by the target period has been drawn on several factors identified as leakages and injections to the global greenhouse gas (GHG) emissions. For instance, COP26 emphasizes the need to drastically reduce coal power, halt deforestation, and reduce subsidies on fossil fuels, estimated at around $5.9 trillion. While the standpoints above denote efforts towards minimizing injections to GHG emissions, initiating a gradual and persistent transition to renewable energy and promoting technological innovations are believed essential. The reason is that both indicators have been empirically proven as effective moderators of carbon emissions. The various efforts towards achieving global net-zero emissions have been recently propagated under the carbon neutrality advocacy of which renewable energy and technological innovation stand out. Besides, because achieving carbon neutrality is a global target, it becomes sacrosanct for all countries to embrace this ideology and practically work towards achieving it. More importantly, COP26 recorded the commitment of not less than 153 economies in taking practical actions on the Nationally Determined Contributions (NDCs), which account for approximately 80% of the world's GHG emissions. Germany is one of the countries that have pledged a commitment to net-zero emissions and worked assiduously towards achieving the target.
The action plan toward achieving carbon neutrality is projected for deliverance by 2045 in Germany. It equally sets a pilot target of reducing emissions by not less than 65% in 2030 and cutting it down to 88% by 2040. 6 The country enacted its first national climate law in 2019 and later revised it in 2021, focusing on achieving annual targets by 2030. In practical terms, Germany has achieved unprecedented progress in increasing renewable energy capacity, particularly on biomass, wind, and solar sources. 7 Along this line, Germany is ranked fifth globally regarding capacity in photovoltaics, ranks third in wind capacity in 2018, and globally recognized as a leading economy in renewable energy investments.7,8 For this reason, probing the extent to which renewable energy can enhance Germany's commitment toward net-zero emissions by 2045 has become a novel idea that is found wanting in academic and empirical studies.
Research objective/contribution
Against the above backdrop, the present study examines the hypothesis that renewable energy is a critical factor that stands a better chance of delivering carbon neutrality for nations pledging and working towards it in the nearest future. Besides, technological innovation has received strong empirical backing as a negative predictor of carbon emissions,9,10 implying its enhancement of carbon neutrality further underscores its consideration in the present study. Moreover, the need for nations to open to other economies is becoming inevitable, given the proposition that openness to the global enhances better and faster economic growth 11 motivates the inclusion of trade openness in this present study. The arguments on the trade environment are inconclusive, with diverging views advancing for positive and negative nexuses. Hence, the present study hopes to further throw more weight on either of the two perspectives in the most recent times. Furthermore, the criticality of transportation in hindering or promoting environmental sustainability is hard to overemphasize for at least three reasons. First, it is hard to isolate development from a well-structured transportation system. 12 Second, the increasing demand for infrastructure facilities further emphasizes the pertinence of the transport sector in determining sustainable growth. 13 Third, the preceding propositions on the role of transportation services in the growth path by an extension lead to an increase in carbon emissions 14
Drawing from the above propositions, the present study provides five novelties to the extant literature. First, this study is the first to empirically investigate Germany's renewable energy-carbon neutrality nexus since the country's official commitment to net-zero emissions in 2016. Hence, an empirical study of this nature is long overdue, especially for a country actively involved in the global drive towards a carbon-free environment and transition from dirty to clean energy sources. Second, consideration for the joint impacts of technological innovations, trade openness, and transportation in the carbon neutrality model, as investigated in this study remains the first for Germany's economy. Third, the choice of Germany as a scope of the study is worth lauding on four grounds as follows. (i) Germany was one of the first countries to domesticate the carbon neutrality target in its national law in 2019 and further modified it in 2021. Besides, as far back as November 2016, Germany has adopted the carbon reduction plan and remains the first to submit the long-term GHG emissions plan. (ii) Germany is one of the forerunners in developing renewable energy capacity. (iii) The active engagements of Germany in global intergovernmental organizations such as the G7 and G20 are indications that it is a force to be reckoned with in the global advocacy for carbon neutrality. (iv) Germany is ranked as the fourth-largest economy globally with the most sophisticated among European countries.7–15 The fourth contribution of this study is drawn from the methodological approach. The analysis accounts for structural breaks in the model by employing the Zivot-Andrew 16 unit root test Further, the empirical model is estimated using the recent nonlinear autoregressive distributed lag model (NARDL), which accounts for the asymmetric effects of the regressors on the outcome variable. 17 With NARDL, impacts of renewable energy and other explanatory variables are decomposed into positive and negative to give all-inclusive policy ingenuities to the extant literature. Furthermore, this study extends the knowledge frontier on carbon neutrality by employing the novel wavelet-based Granger Causality, which estimates multiple time scales in the time series model. 18 We are unaware of any study evaluating the renewable energy-carbon neutrality hypothesis within the wavelet coherence estimator to the best of our knowledge. The remainder of this study is planned thus. Section two focuses on relevant studies, section three presents the methodological approach, section four details the presentation and discussion of empirical results, and section five presents the conclusion and policy suggestions.
Literature review
This section discusses the prior environmental literature on the effect of renewable energy, technological innovation, trade openness and transport services on the quality of the environment.
Renewable energy and CO2 emissions
Extreme utilization of natural resources has resulted in the depletion of these resources, which has become a serious concern globally. Furthermore, alternative energy resources have garnered considerable focus worldwide to combat environmental deterioration. Renewable energy (REC) has been identified as an essential tool for reducing environmental pollution.19–21
Yuping et al. 22 studied the transitions of REC utilization and established that they aid in mitigating carbon emissions in Argentina. Recently, Adebayo et al. 23 suggested that REC reduces carbon emissions in Mexico, Indonesia, Nigeria, and Turkey (MINT) economies. Similar suggestions are validated by He et al. 24 using top in energy transiting economies. They concluded that REC mitigates carbon emissions. Similarly, Kirikkaleli & Adebayo 25 established that REC aid in mitigating carbon emissions in India. Ayobamiji et al. 26 confirmed that REC mitigates carbon emissions in Colombia. Conversely, Bekun et al. 27 found that REC does not have a significant connection with carbon emissions in South Africa. Adebayo et al. 11 confirmed that REC decreases carbon emissions in Sweden. Li et al. 28 concluded that REC mitigates the level of CO2 emissions in 147 economies.
Adebayo & Kirikkaleli 29 analysed the effect of REC on Japan's carbon emissions, and the research's empirical evidence confirmed that REC reduced carbon emissions. Also, Lei et al. 30 studied the effect of REC on carbon emissions in China. The research utilized the NARDL approach to analyse the dataset from 1991 to 2019, and they reinforced that REC mitigates carbon emissions in China. A similar outcome was endorsed by Abbasi et al. 31 ; the research used the DARDL approach in China. They concluded that the utilization of REC is critical for attaining long-term sustainability objectives and inhibits the utilization of fossil fuels in the energy mix. Ehigiamusoe & Dogan 32 conducted research for low-income economies on similar interaction; they approved the same conclusion that encouraging REC utilization reduces environmental deterioration. Li et al. 33 concluded that REC lowers carbon emissions in 120 economies. Adebayo et al. 34 investigated the effect of REC on CO2 emissions in United Kingdom over the period between 2020M1-2021M4. They concluded that REC mitigates CO2 emissions. Nathaniel et al., 35 's work in G7 nations confirmed that REC mitigates carbon emissions. Li & Leung 36 confirmed the same effect of REC in European nations using the dataset between 1985 and 2018.
Technological innovation and CO2 emissions
Some researchers have looked at the effects of technological innovation (TECIN) on carbon emissions for a group of economies and specific nations, but their results are mixed. For instance, Adebayo et al. 37 reported that TEC intensifies carbon emissions in Portugal. Chen et al. 38 also confirmed that the positive shock in TECIN aggravates CO2 emissions, whereas the negative shock in TECIN mitigates emissions in Brazil, Russia, India, China and South Africa (BRICS) economies. Also, Su et al. 39 found that TECIN increases emissions in Brazil. Conversely, Abid et al. 40 reported that TECIN lessens emissions levels in G-8 economies. Suki et al. 41 also stated that TECIN mitigates Malaysia's emissions level. Cheng et al. 42 showed that TECIN has a detrimental effect on emissions in Organisation for Economic Co-operation and Development (OECD) economies. Razzaq et al. 43 also reported that an increase in TECIN level mitigates emissions in China. Chien et al. 44 investigated the effect of TECIN on emissions in Pakistan. They confirmed that TECIN has a negative connection with emissions. Shao et al. 45 research the next eleven economies to examine the effect of TECIN on carbon emissions. They concluded that promoting the growth of TECIN reduces environmental deterioration. Qayyum et al. 46 concluded that expanding TECIN in India has a mitigating impact on emissions. Shan et al. 47 suggested that TECIN reduces carbon emissions in Turkey. Weimin et al., 48 reported that the positive shock in TECIN mitigates emissions, whereas the negative shock in TECIN aggravates CO2 emissions in 46 developing nations. Khattak & Ahmad 49 and You et al. 50 also established the same outcome in OECD nations and the USA, respectively. You et al., 51 established TECIN decreases CO2 emissions in the USA. Khattak & Ahmad 52 investigated the BRICS economies to explore the impact of TECIN on carbon emissions. They suggested that TECIN decreases CO2 emissions. Xin et al., 53 investigated the asymmetric impact of TECIN on carbon emissions in the USA. They suggested that TECIN lowers the emissions level in the USA. Ding et al., 54 look into the effect of TECIN in G7 nations and suggest that TECIN mitigates the emissions level in these nations. Ahmad & Zheng 55 employed the dataset of the BRICS economies spanning from 1990q1-2016q4 to inspect the effect of TECIN on emissions. They suggested that TECIN lowers emissions in BRICS nations. Xiaosan et al., 56 concluded that green TECIN contributes to the quality of the environment in China. The study of Ahmad et al., 57 in OECD reported the same results. Conversely, Ahmad et al.'s 58 study in OECD confirmed that TECIN aggravates the level of CO2 emissions in OECD nations.
Trade openness and CO2 emissions
Li et al. 59 established that trade openness exacerbates emissions in China, thereby deferring the achievement of carbon neutrality. Ibrahim & Ajide 60 suggested that trade openness encouraged increased emissions in G-7 economies between 1990 and 2019. Pata & Caglar’s 61 inspection in China using the dataset between 1980 and 2016 found that trade openness enhances the level of emissions in China. Udeagha & Ngepah 62 explores the effect of trade openness on emissions in South Africa. They concluded that the expansion in the trade openness drives the emissions in the country. Wang & Wang 63 looked into the influence of trade openness on emissions in 104 economies between 2000 and 2014. They found an inverted U-shaped interconnection between trade openness and emission, suggesting the reversal of the positive interaction in the long term. Conversely, Kim 64 established that trade openness mitigates carbon emissions in OECD economies for the period spanning between 1990 and 2018. Hossain et al. 65 studied the effect of trade openness on emissions in Bangladesh over the period between 1980 and 2016. They found that trade openness reduces emissions in Bangladesh. Weili et al. 66 study of 176 economies found that trade openness also reduces emissions over the timeline between 2000 and 2019. Liguo et al., 67 concluded that trade openness exacerbates the degradation of the environment in the USA. Wang et al., 68 concluded that global trade increases the global CO2 emissions by 25%. Wang and Zhang 69 utilized the dataset of 182 nations over the timeline between 1990 and 2015. The authors confirmed that trade openness increases CO2 emissions in rich economies, while for poor nations, trade openness mitigates CO2 emissions. Can et al., 70 analysed the dataset of 31 OECD nations between 2007 and 2017 and concluded that trade openness reduces CO2 emissions. Another research by Can et al., 71 also confirms a similar effect in the case of OECD economies.
Transport services and CO2 emissions
Different studies employed various modes of transport to probe into the effect of transport services on the environment. For instance, Hassan et al. 72 analysed the impact of public service transport on carbon emissions using the period between 1985 and 2018 in China. They employed the DARDL and found that public service transport contributes to the level of emissions in China. Habib et al. 73 probed into the effect of air transport services on emissions in G-20 economies between 1990 and 2016. They concluded that air freight transport, air passenger transport, and air transport's intensity positively impact these economies’ carbon emissions. Using the period spanning from 2008 to 2017 in the USA, Jiang et al. 74 suggested that passenger transport intensity is crucial for lowering emissions from road passenger transportation. Changes in transportation layout are generating a transition in emissions across different patterns of passenger transportation. Furthermore, they argued that reducing freight transport intensity is the most significant measure for reducing carbon emissions. Zhao et al. 75 analysed a dataset of thirty Chinese provinces and found that smart transportation reduces carbon emissions.
Data and methodology
The current methodological approach relies on three pillars to advance the nexuses of renewable energy, technological innovations, trade openness, and transport services on carbon emissions in Germany. The pillars follow the following subsections thus; data description and source, theoretical foundation, and empirical model.
Data description and sources
The present study employs annual time series data to gauge the nexuses among renewable energy, technological innovations, trade openness, transport services, and carbon emissions in Germany from 1990 to 2020. The empirical data are collected from four different sources. For instance, carbon emissions measured by CO2 emissions (metric tons per capita) is sourced from Climate Watch. 2020. GHG Emissions Data Base. Washington, DC- USA. Renewable energy measured by renewable electricity net generation (billion kWh) is collected from the US energy information administration. Technological innovations captured by Individuals using the internet (% of the population) are sourced from International Telecommunication Union (ITU). Trade openness proxied by trade value added to GDP and transport services captured by Transport services (% of service exports, BoP) are sourced from Word Development Indicators. Details of the variables and sources are presented in Table 1.
Data description.
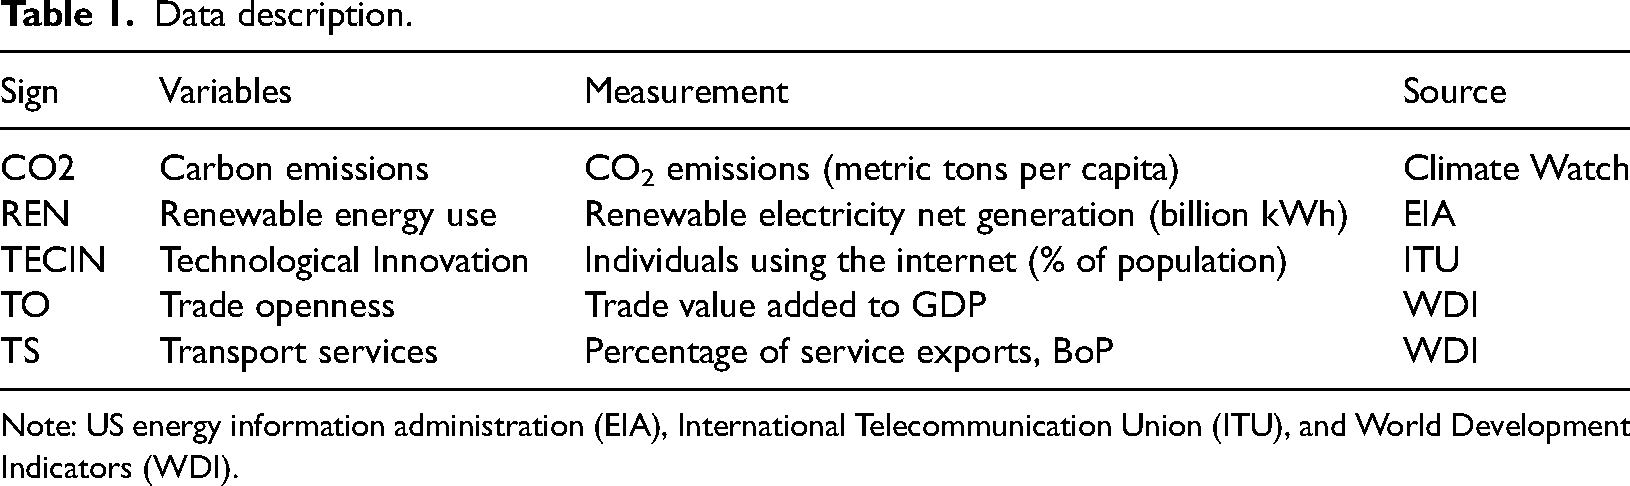
Note: US energy information administration (EIA), International Telecommunication Union (ITU), and World Development Indicators (WDI).
Theoretical foundation
The theoretical underpinning guiding the functional relationship between the outcome variables and the regressors advanced in the section thus.
To start with, renewable energy has been empirically proven as an effective propellant towards mitigating the surge in carbon emissions. This justifies why policymakers and research pundits are supporting the adoption of 100% renewable energy as a practical way towards achieving zero-emissions by 2050. Besides, renewable energy remains the most reliable substitution to fossil fuel energy believed to exacerbate GHG emissions. Asides from substituting fossil fuels, renewable is cheap and eco-friendly in a way that sustainable development is enhanced.76,
77
For this reason, couple of empirical studies submits that renewable energy moderates the increase in carbon emissions.19–21 Consequently, we hypothesize a negative effect of renewable energy on carbon emissions thus
The present era is experiencing advancements in technological in a greater length with achievement recorded in all spheres of human endeavours ranging from economic, political, health and environment. These remarkable achievements in technological innovations co statute the reasons why achieving net zero emissions will remain a mirage in the absence of technology. Empirically, such, the moderating roles of technology on environmental pollutants have been extensively documented.40,41–43 The preceding propositions lead us to hypothesize a negative technology-carbon emissions nexus as follow
The trade-led environmental quality has been advanced from two perspectives with a specific focus on positive and negative impacts. In the former case of positive effect, trade openness is believed to enhance the import of carbon-embedded products which add to the stock of pollutant in the destination country. Consequently, a positive relationship has been empirically reported in the literature.59–61 Conversely, some studies find empirical support to advance that trade openness mitigates the surge in carbon emissions.63,64–78 To this end, both positive and negative signs are anticipated thus
The compounding issues of global warming remain on the upward trend despite the increasing calls towards mitigating it. For many reasons, the continued dependence on fossil fuels in the transportation sector remains an essential driving factor of surging GHG emissions. Consequently, the persistent increase in the global population rate mounts increased pressure on the transportation sector with an analogous carbon-inducing impact. Alluding to this submission, copious empirical studies document positive relationship between transport services and carbon emissions.72,73 As such, we anticipate a positive transport service-carbon emissions nexus as follows
Empirical model
Drawing from the above theoretical framework and the recent empirical studies,17,
79
with modifications to suit the objective of the current research, the estimable renewable energy-carbon emissions nexus can be modelled as follows;
NARDL estimator by
81
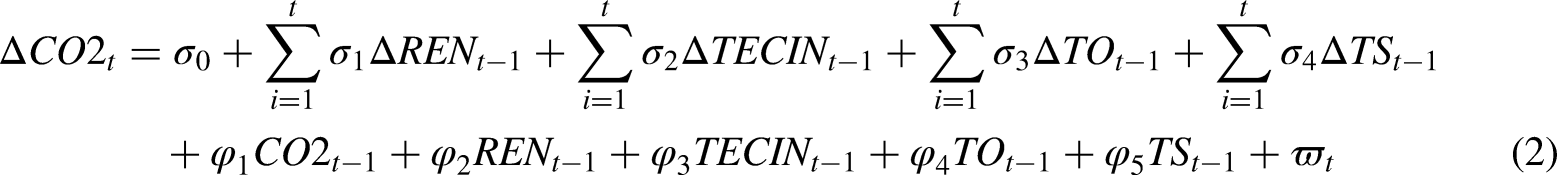
accounts for asymmetric effects in the long run and short run nexuses without losing counts on the asymmetries in the dynamic adjustment. The estimator specifically makes it possible to obtain instantaneous positive and negative impacts of regressors on the outcome variable. Besides, NADRL is robust for an empirical model with mixed order of I(0) and I(1). Besides, the estimator is robust for providing long-run inference based on bounds-testing without subjection to the integration orders of the indicators (Shin et al., 2014). The NARDL model for the current study states thus;


Empirical results
The emanating empirical outcomes in the present study are presented and subsequently discussed, intending to deduce practical policy inferences toward delivering on the targets of net-zero emissions for Germany. By extension, the suggested policies would be extrapolated to other developed and developing countries pursuing the carbon neutrality agenda.
Preliminary analysis
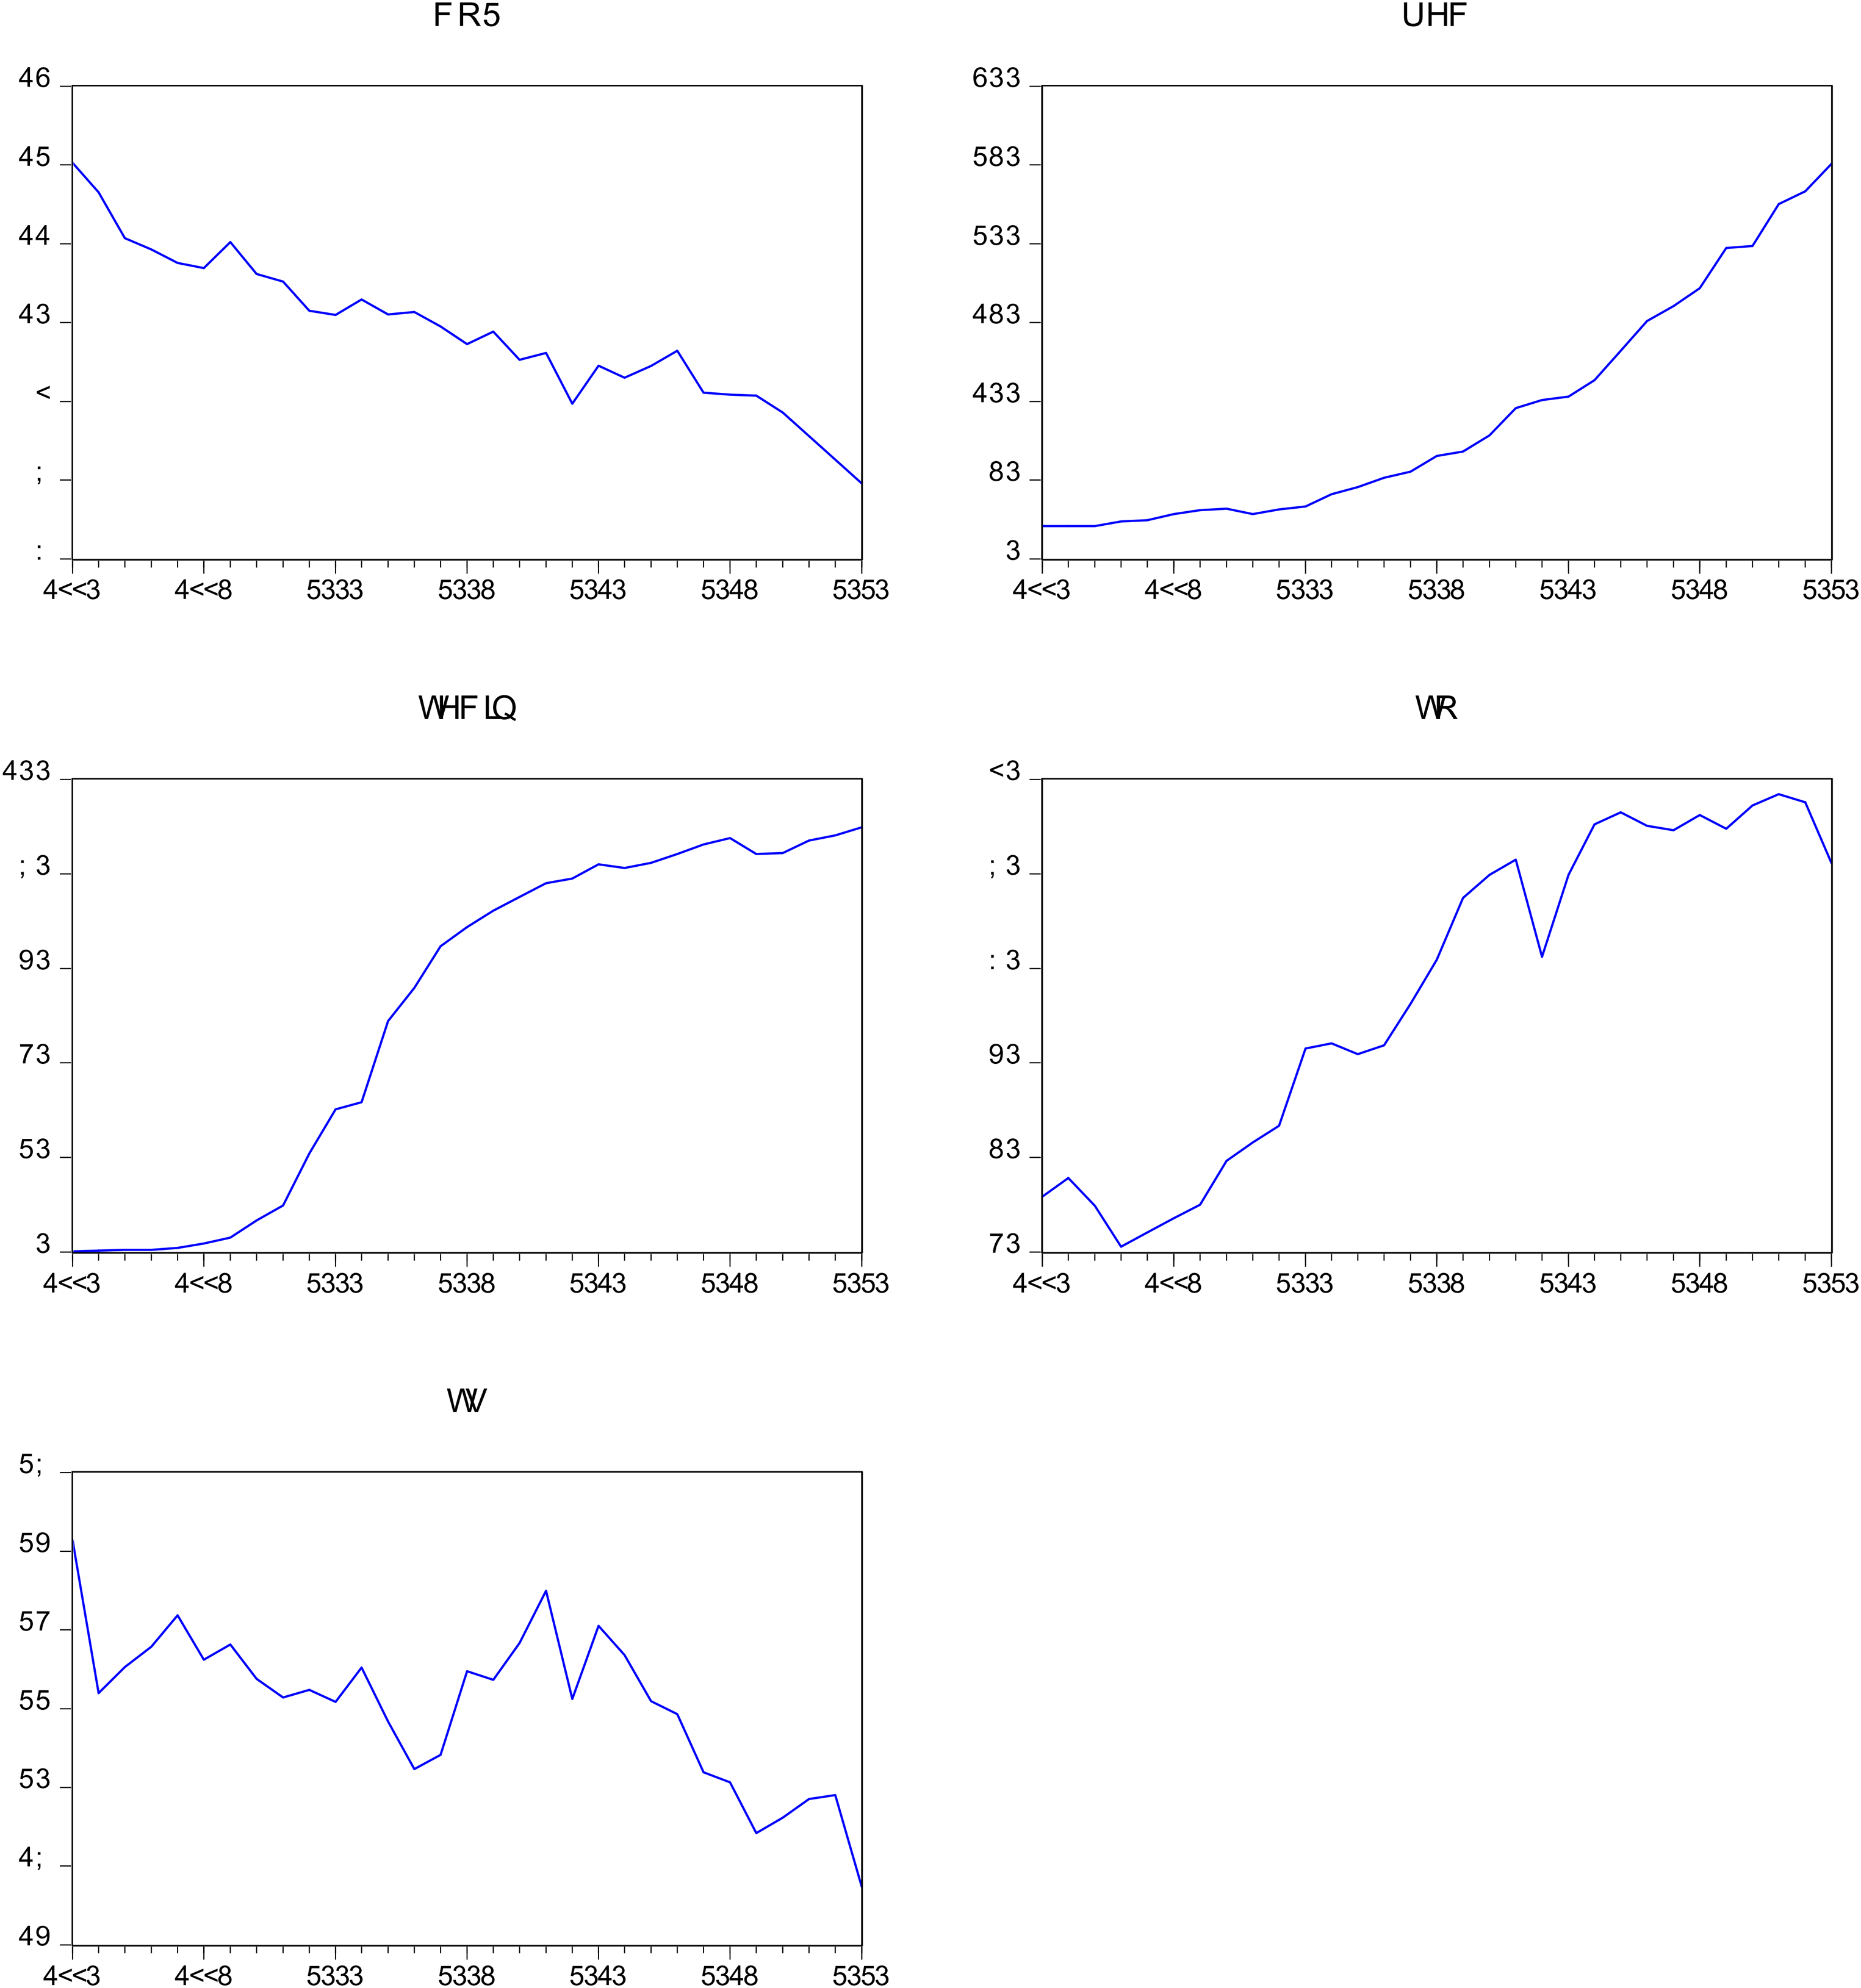
To enhance in-depth analyses in the current study, we explore three angles to provide extensive preliminary analyses of the dataset and the respective behaviours of each indicator. Hence, the analyses in this subsection cover descriptive statistics, normality test, correlation analysis, and trend analysis. Starting with the descriptive statistics in Table 2, it is evident that the mean value of carbon emissions stands at 9.89%, renewable energy averages 91.4%, technological innovation has a mean value of 51.2%, trade openness averages 67.6%. In comparison, transport services has the value of 22.1%. All variables display highly level of volatility considering the values of standard deviation except for carbon emissions and transport services. This is equally supported by the trend in Figure 1, which depicts rising levels of renewable energy, technological innovations, and trade openness. In contrast, carbon emissions and transport services maintain downward slope suggesting decoupling state of emissions and transition away from emission-intensive transport system. The normality test shows the dataset is normally distributed going by the values of skewness and kurtosis suggesting the dataset is balanced and not heavily tailed. Jarque-Bera further confirms the normality of the dataset due to insignificant probability observable from all the indicators.
Trend analysis of the variables.
Descriptive statistics and normality test.
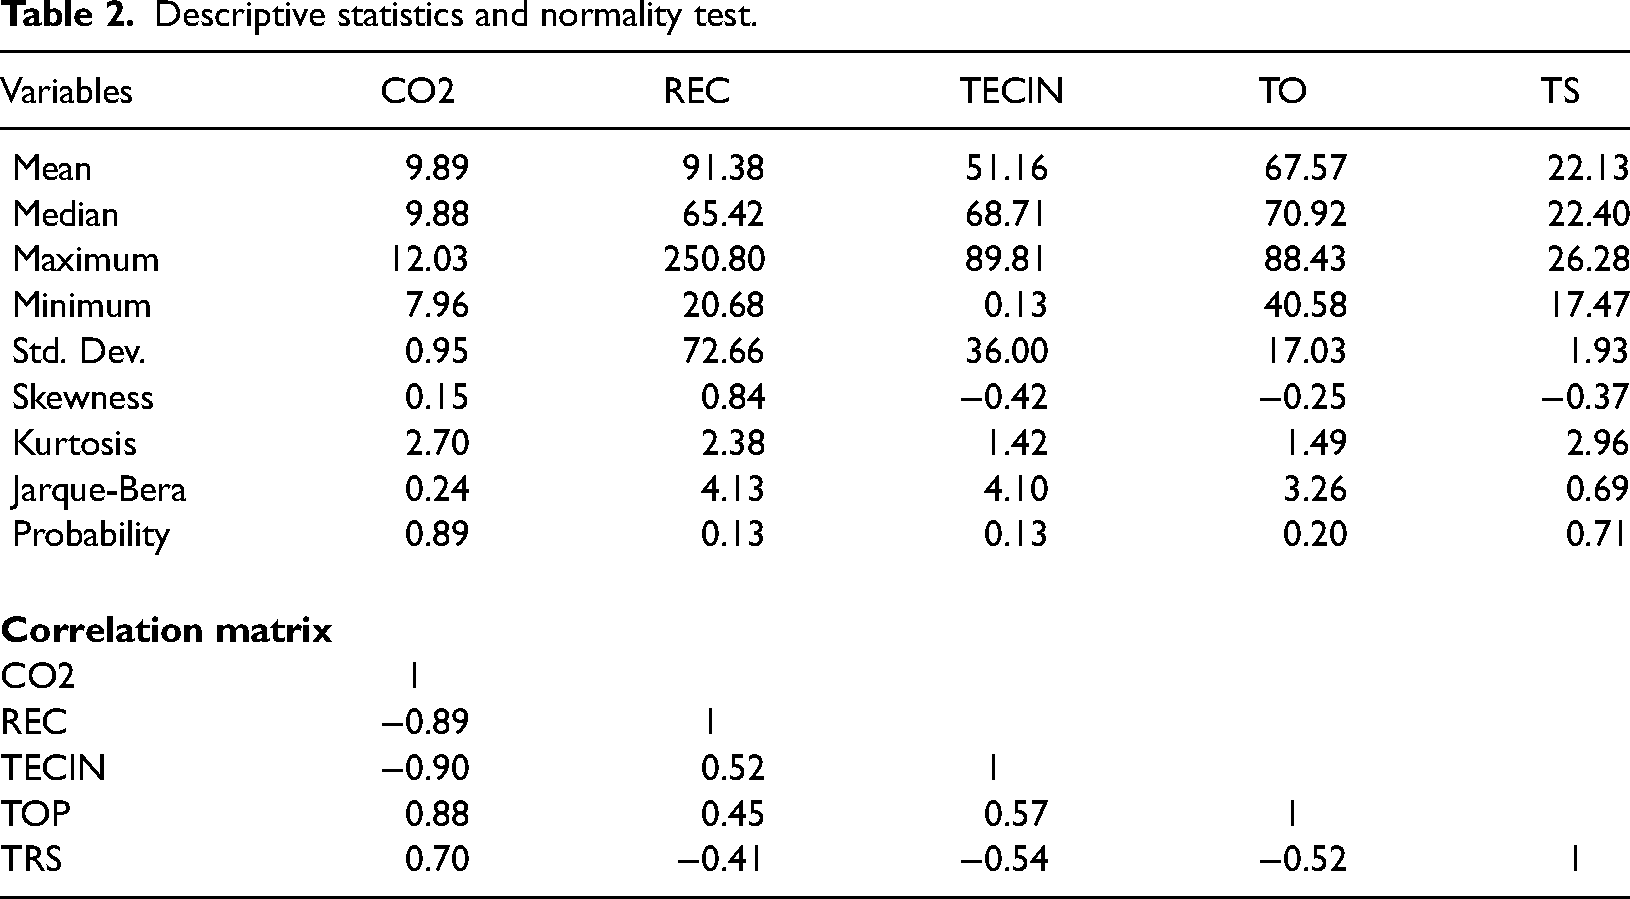
The extent of correlation among the variables is presented in Table 2 where carbon emissions depict high level of connection with all the variables. Contrarily, the correlation among the regressors is low, suggesting the model is free from any form of multicollinearity issue. Interestingly, all the regressors display the signs in accordance with our a priori expectations. Specifically, renewable energy and technological innovations negatively correlate with carbon emissions, suggesting their moderating impacts while alternatively promoting the drive towards a carbon neutral environment. In contrast, trade openness and transport services positively correlate with carbon emissions implying their inducing effects on the volume of emissions in Germany.
Stationarity test
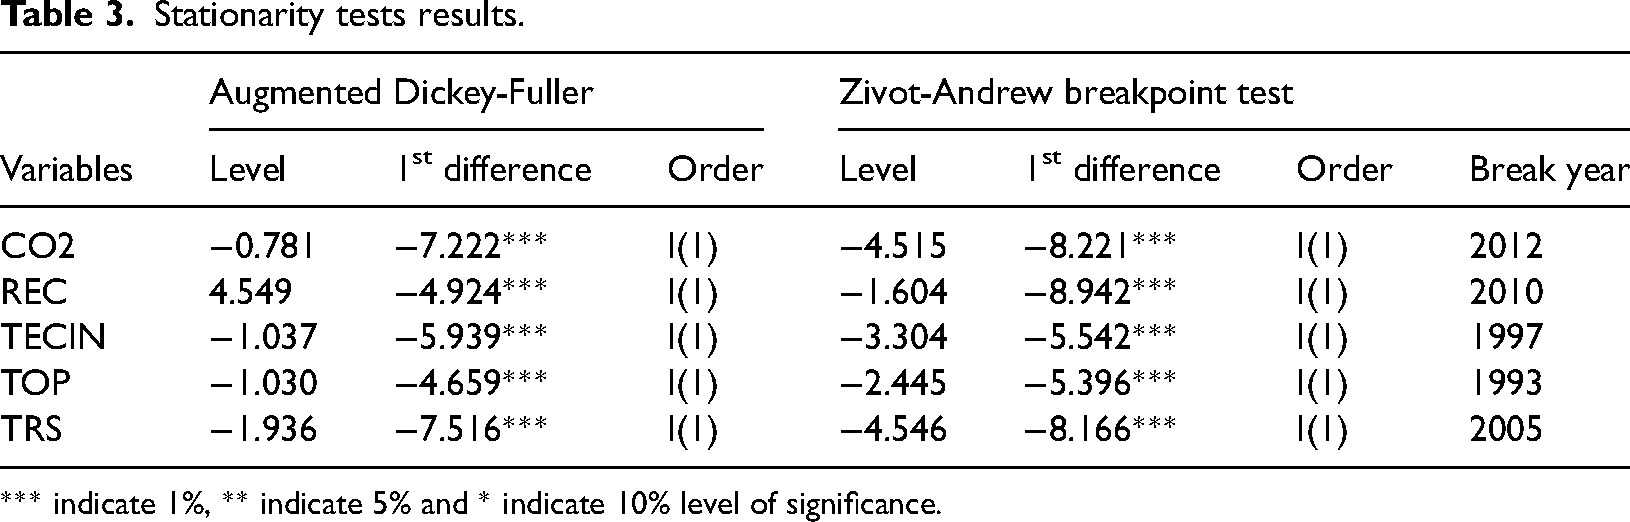
Having confirmed the dataset's characteristics, we test the series’ suitability for the empirical analysis using both conventional (Augmented Dickey-Fuller) and advanced (Zivot-Andrew breakpoint test) unit root tests. The ability of the ADF stationarity test to provide reliable and valid estimates has motivated the extensive adoption of the test in annual time series empirical studies. The consideration of the Zivot-Andrew test anchors the robustness of the test for the presence of structural break. The results of the stationarity tests are presented in Table 3 with an indication of all the series becoming stationary after the first difference. More so, the structural beaks for each of the indicators are identified; thus; CO2 (2012), REC (2010), TECIN (1997), TOP (1993), and TRS (2005). These highlighted years coincide with major structural events in Germany's economy, particularly with the reunification of the German economy from 1990 to 1992, which could be related to the 1993 and 1997 shocks on trade openness and technological innovations. Besides, the volatility instigated by the 2008 global financial crisis can be attributed to the structural breaks of 2010 and 2012 for renewable energy and carbon emissions.
Stationarity tests results.
*** indicate 1%, ** indicate 5% and * indicate 10% level of significance.
Longrun cointegration results
After obtaining clarity on the stationarity status of the dataset, this study examines the long-run association among the parameters by employing the nonlinear bounds test The results are presented in Table 4a. The results reveal substantial evidence justifying the existence of cointegration among the indicators in the long run. The decision is premised on the fact that the F-statistic value of 7.0 is higher than the upper and lower bounds critical values at a 5% significance level. The existence of structural breakpoints could distort the estimates from traditional cointegration based on Bound Tests estimator. To check the robustness of the cointegration results, we employ the novel Gregory-Hansen Test for cointegration is employed due to its ability to account for the presence of structural break in an empirical model. The results in Table 4b indicate that the null hypothesis of no cointegration is rejected following the ADF and Za statistics whose absolute values are higher than the critical values at 5% level. Hence, we conclude that cointegration exists in the current empirical model.
Results of asymmetric bound testing for cointegration nexus.
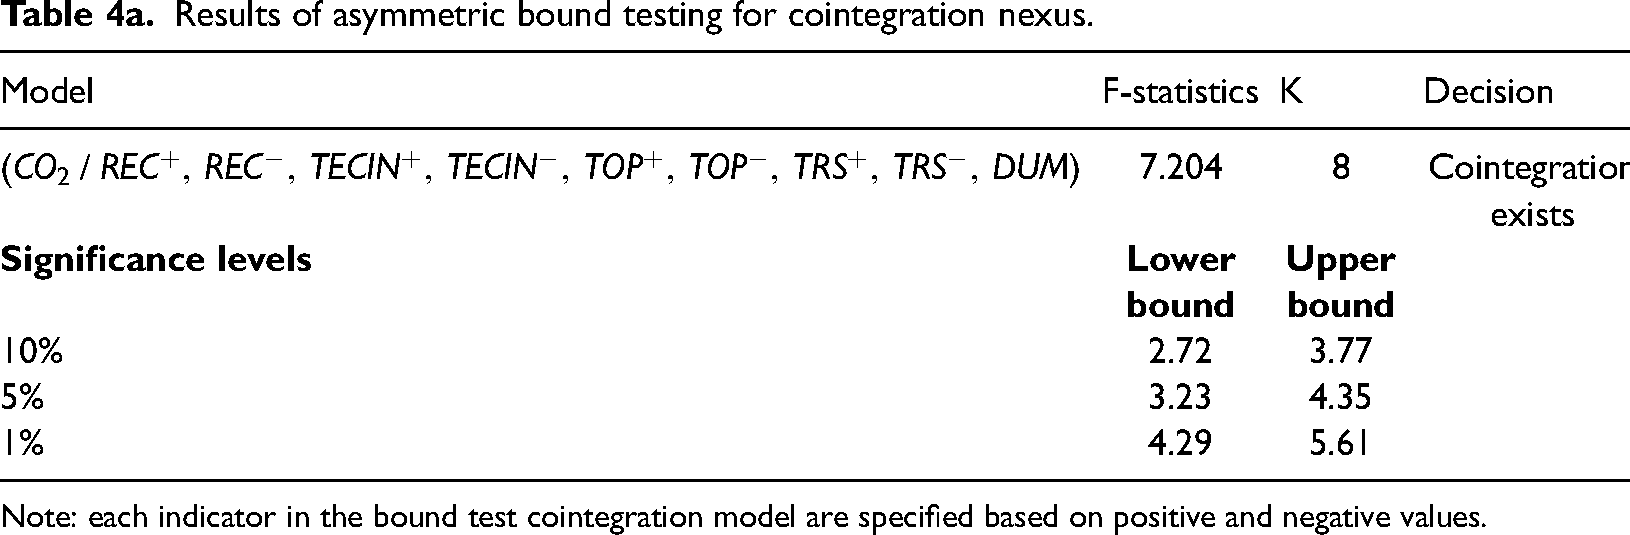
Note: each indicator in the bound test cointegration model are specified based on positive and negative values.
Results of gregory-hansen test for cointegration.
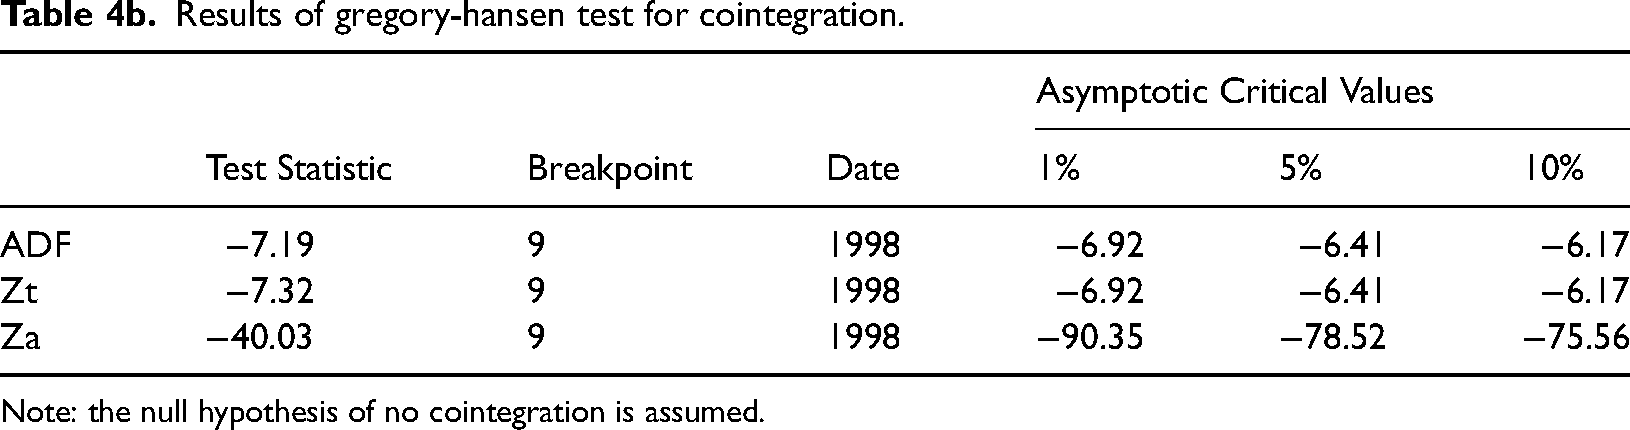
Note: the null hypothesis of no cointegration is assumed.
Longrun asymmetric results
Consequent upon the confirmation of longrun association in the NARDL bounds test results, the long-run relationship can thus be estimated based on the NARDL model. Findings from the long-run NARDL, which are presented in Table 5, reveal that renewable energy negatively predicts carbon emissions in the longrun. Intuitively, a 1% rise in renewable energy consumption leads to a corresponding 1.012% decrease in carbon emissions in Germany. Consequently, it can be concluded that renewable energy promotes carbon neutrality through its moderating effect on carbon emissions. The insignificant nature of renewable energy in short run analysis can be attributed to the fact that a reasonable time lag is required for renewable energy to offset the inducing effects of fossil fuels and other carbon emissions propellants with regards to environmental quality. Besides, the transition from fossil fuels to renewable energy will sometimes analogously apply to the ensuing environmental consequences. The moderating impacts of renewable energy on carbon emissions agree well with Awan et al., 82 Kirikkaleli et al., 83 and Sun et al., 84 which provide empirically backed evidence of negative renewable energy-carbon emissions nexus.
Longrun asymmetric results.
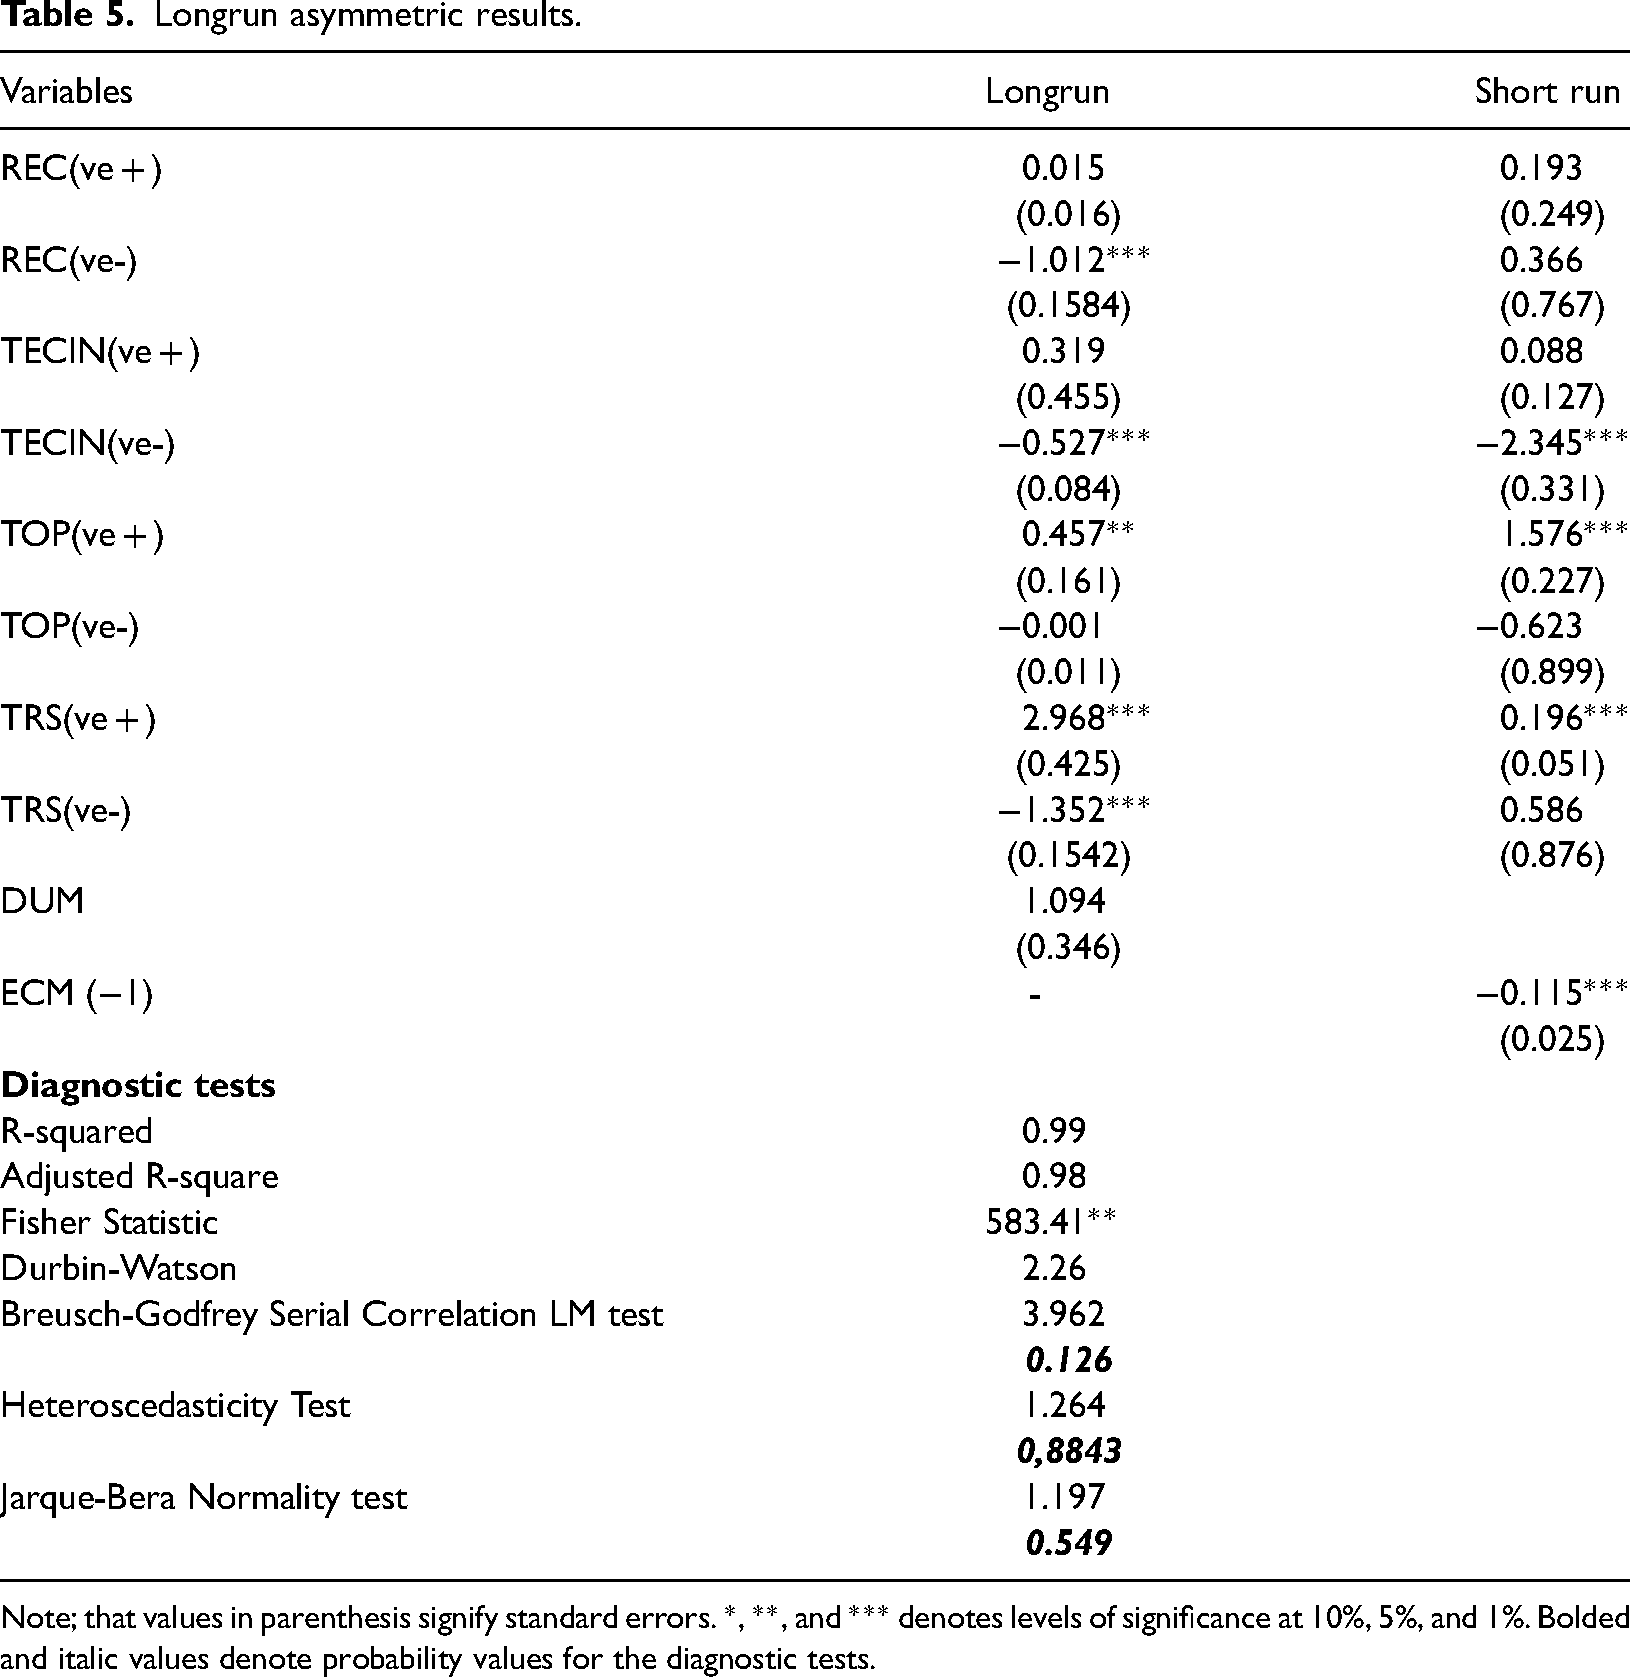
Note; that values in parenthesis signify standard errors. *, **, and *** denotes levels of significance at 10%, 5%, and 1%. Bolded and italic values denote probability values for the diagnostic tests.
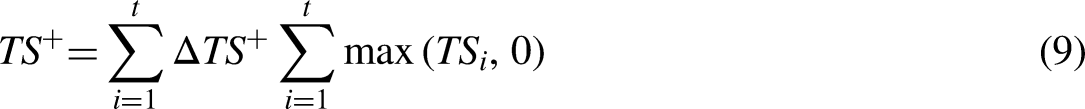
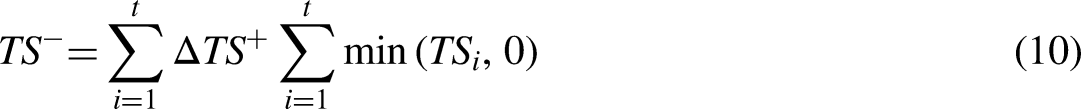
The impacts of technological innovations satisfy our a priori expectation of negative signs advancing that technological innovation promotes the pathway to carbon neutrality in Germany. The reported negative effects are evident both in the long and short runs suggesting technology's instantaneous and far-reaching environmental impacts. Previous studies such as Ma et al., 85 Suki et al., 41 and Hussain et al. 86 support the findings in the current study by providing evidence advancing the abating role of technological innovations on carbon emissions. Trade openness positively predicts carbon emissions suggesting the former contributes to the surge in the latter. This is plausible considering the possibility of shifting environmental burden through carbon-embedded products which are imported to Germany. Besides, as much as the Pollution Haven Hypothesis (PHH) exposits a transfer of environmental pollution from developed to developing nations, the global interconnectedness rate suggests that highly industrialized countries cannot be isolated. More so, the majority of the developed countries like Germany are pursuing economic policies aiming at a shift to service-driven economy. At the same time, they rely on the importation of goods from other countries. With this paradigm shift in mind, the possibility of trade openness driving the surge in carbon emission is no gainsaying. This result is inconsonant with Usman et al. 87 and Li & Haneklaus, 88 which find a positive relationship between trade openness and carbon emissions. The impacts of transport services are two-fold comprising positive and negative signs. This is an indication that transport services at one point contribute to carbon emissions in Germany and, at another time, reduce it. How relevant is this result to economic intuition? The logical explanation that can be provided for these diverging effects is that majority of the transport system in Germany relies on fossil fuels import than it does on renewable energy. For instance, available statistics show that in European Union (EU) countries for Germany is inclusive, sales of cars consuming petrol and diesel are on the rise. At the same time, transportation, specifically international shipping, accounts for a 5% increase in GHG emissions between 2015 and 2017. 89 In summary, the report notes that transport increases oil consumption and by extension, contributes significantly to the surge in GHG emissions of the EU countries. 89 In contrast, the negative effects of transport services on carbon emissions can be attributed to the renewable energy-induced transport service. From both ends, it should be noted that the magnitude effects of a positive sign of transport services (2.968) outweigh the negative sign (1.352). The various diagnostic tests conducted provide empirical evidence to support the estimated model's reliability and validity, which equally suggest the plausibility of the emanating policy implications.
Wavelet coherence (WTC) test
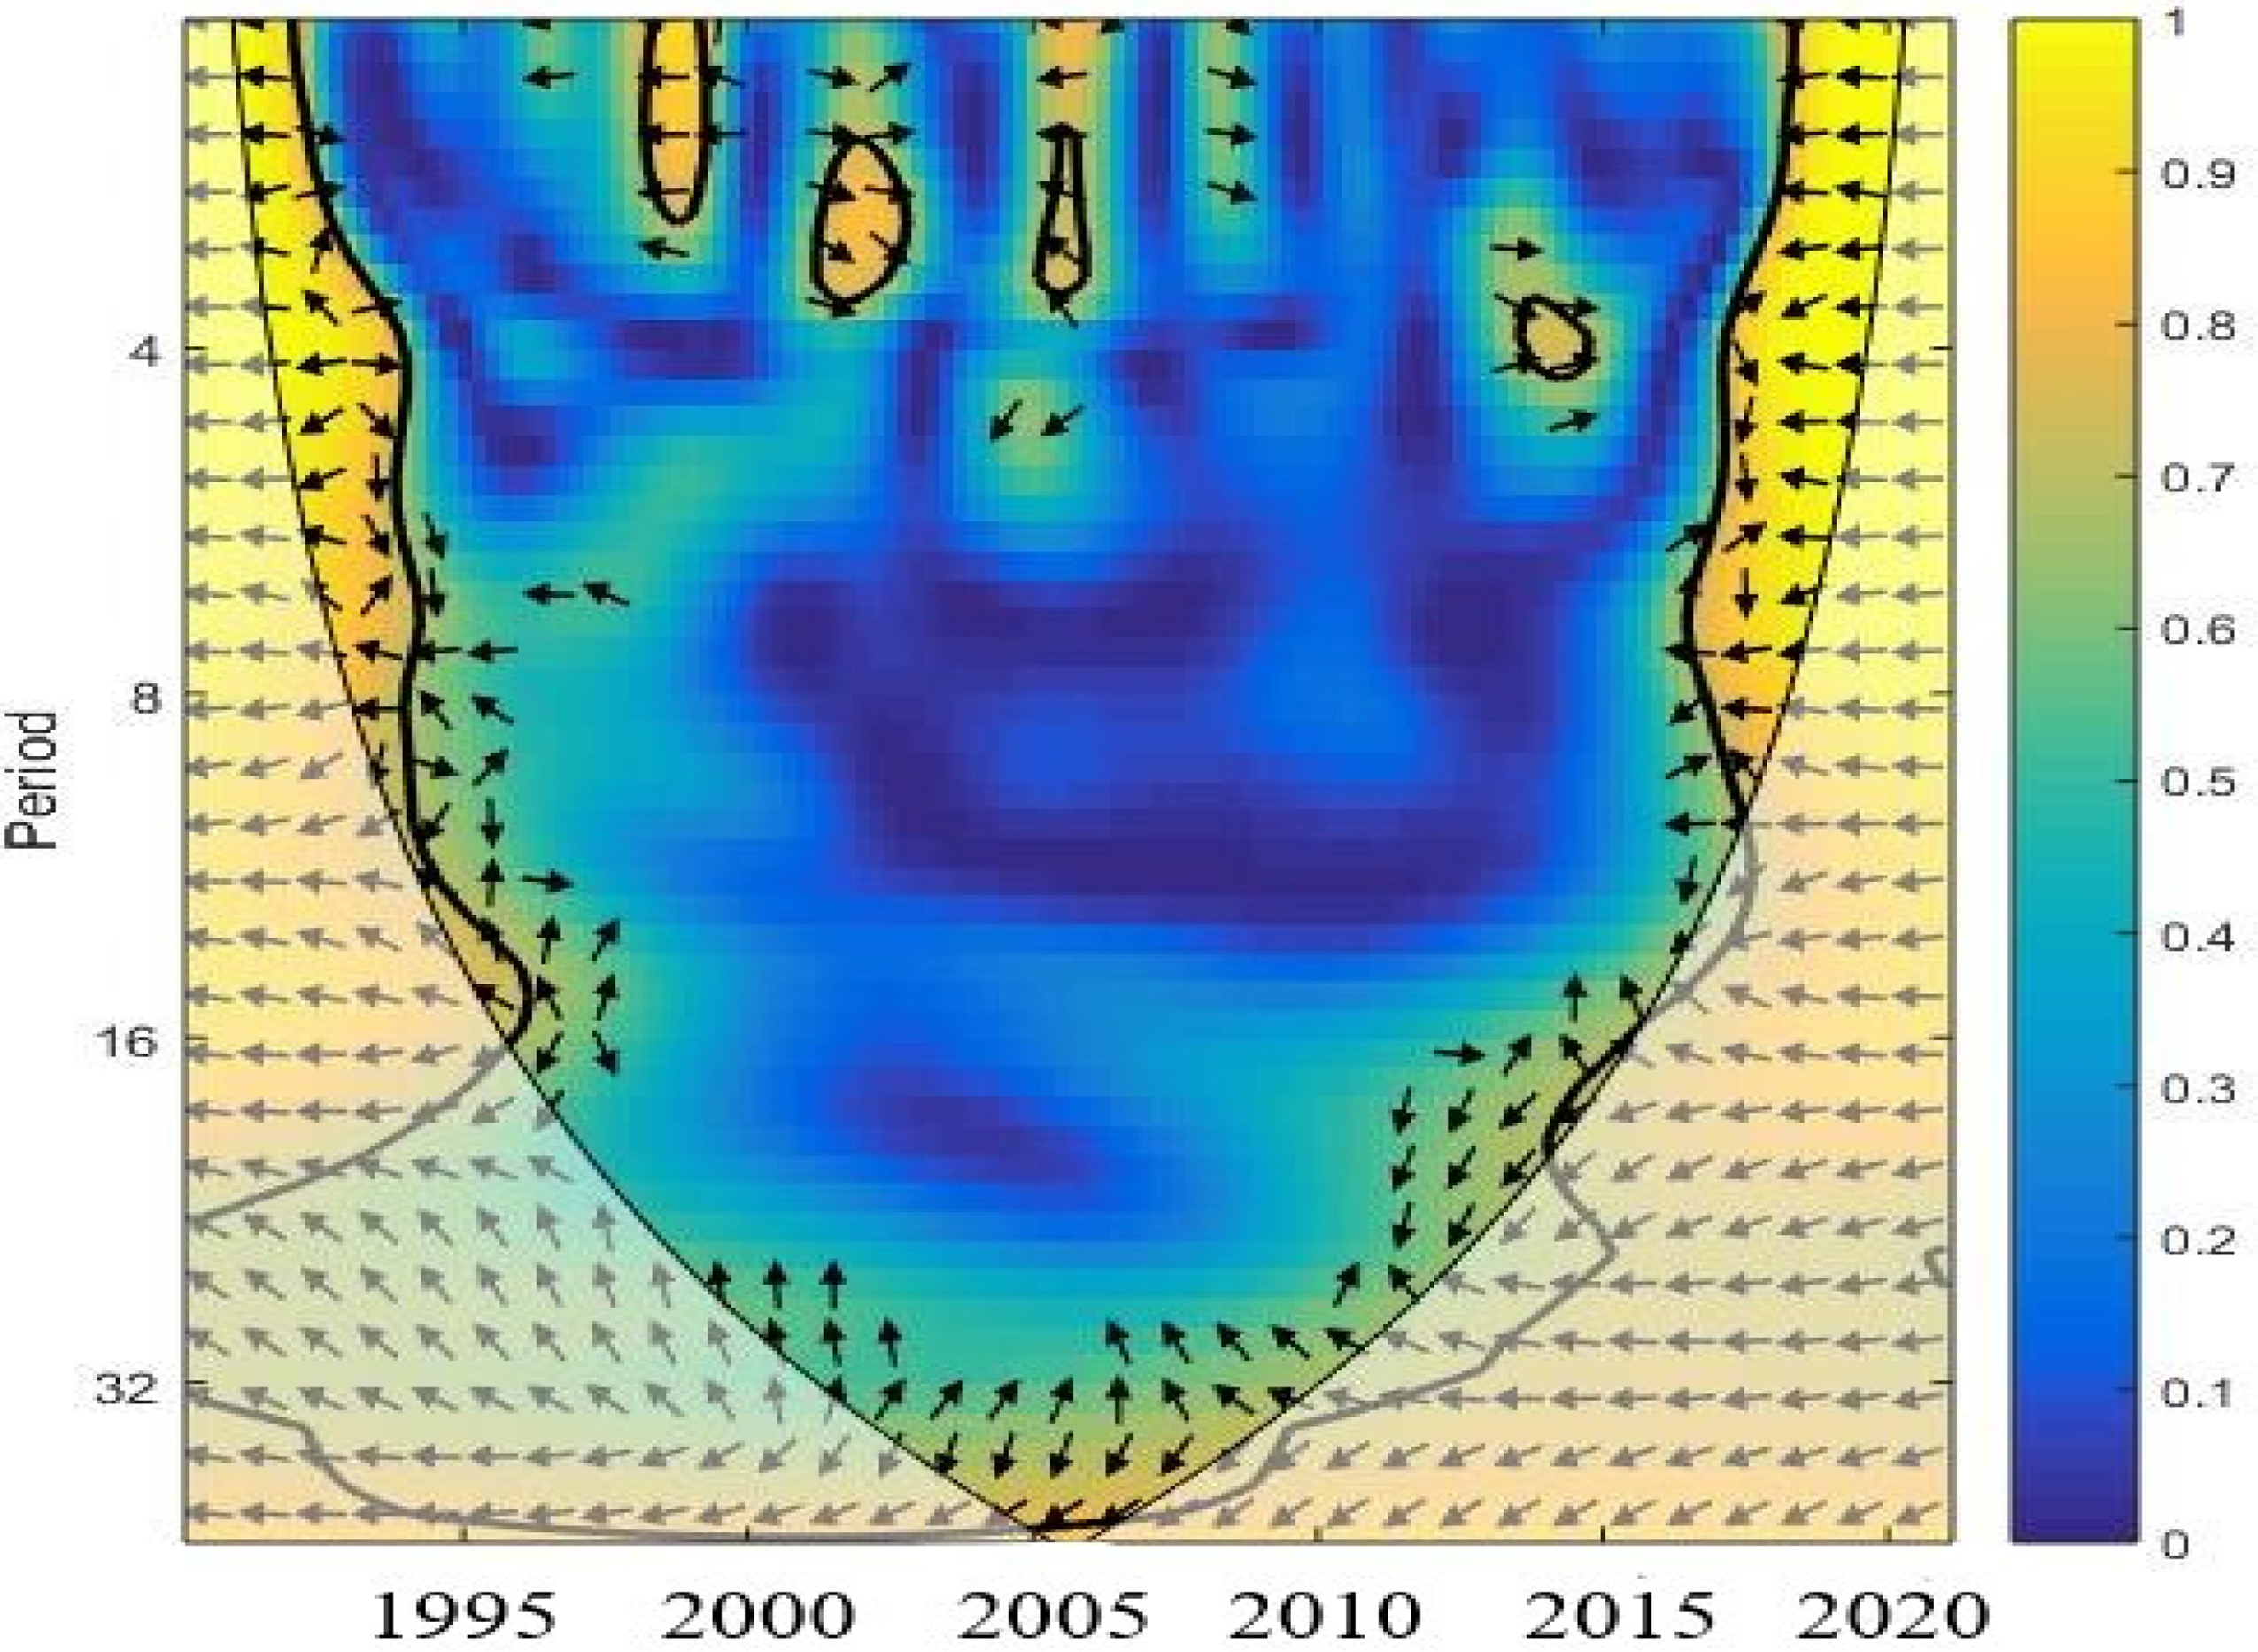
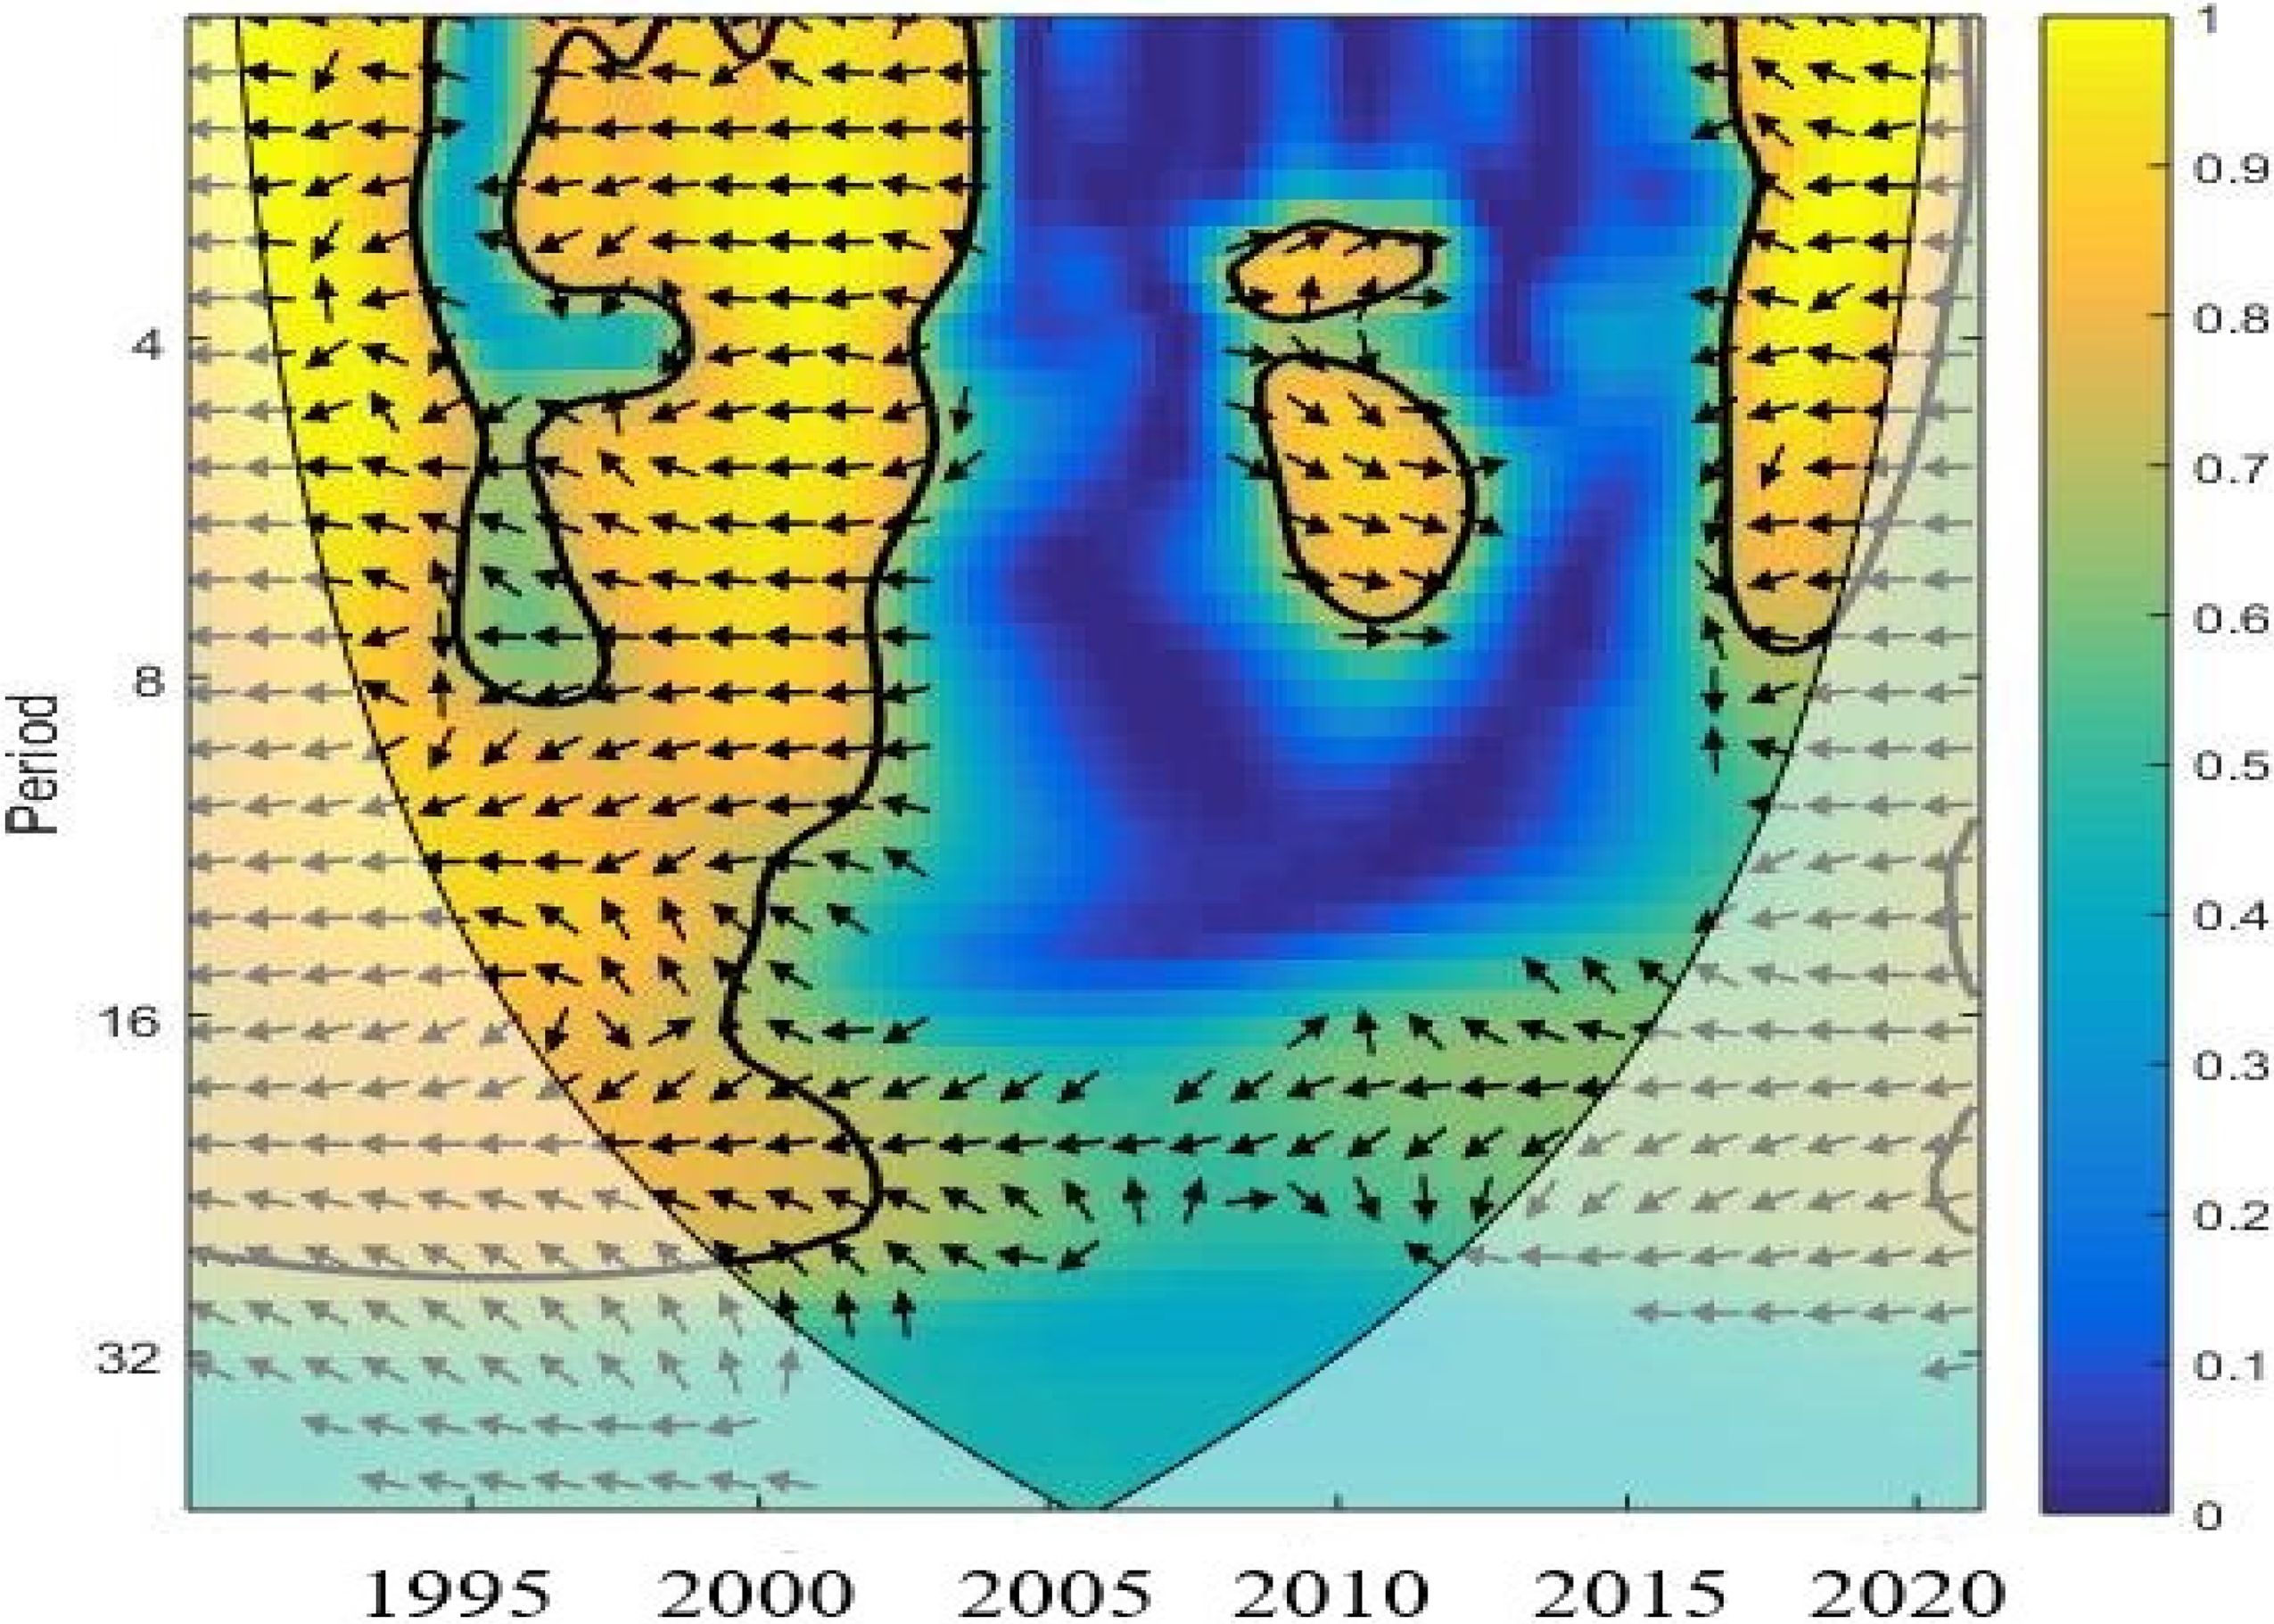
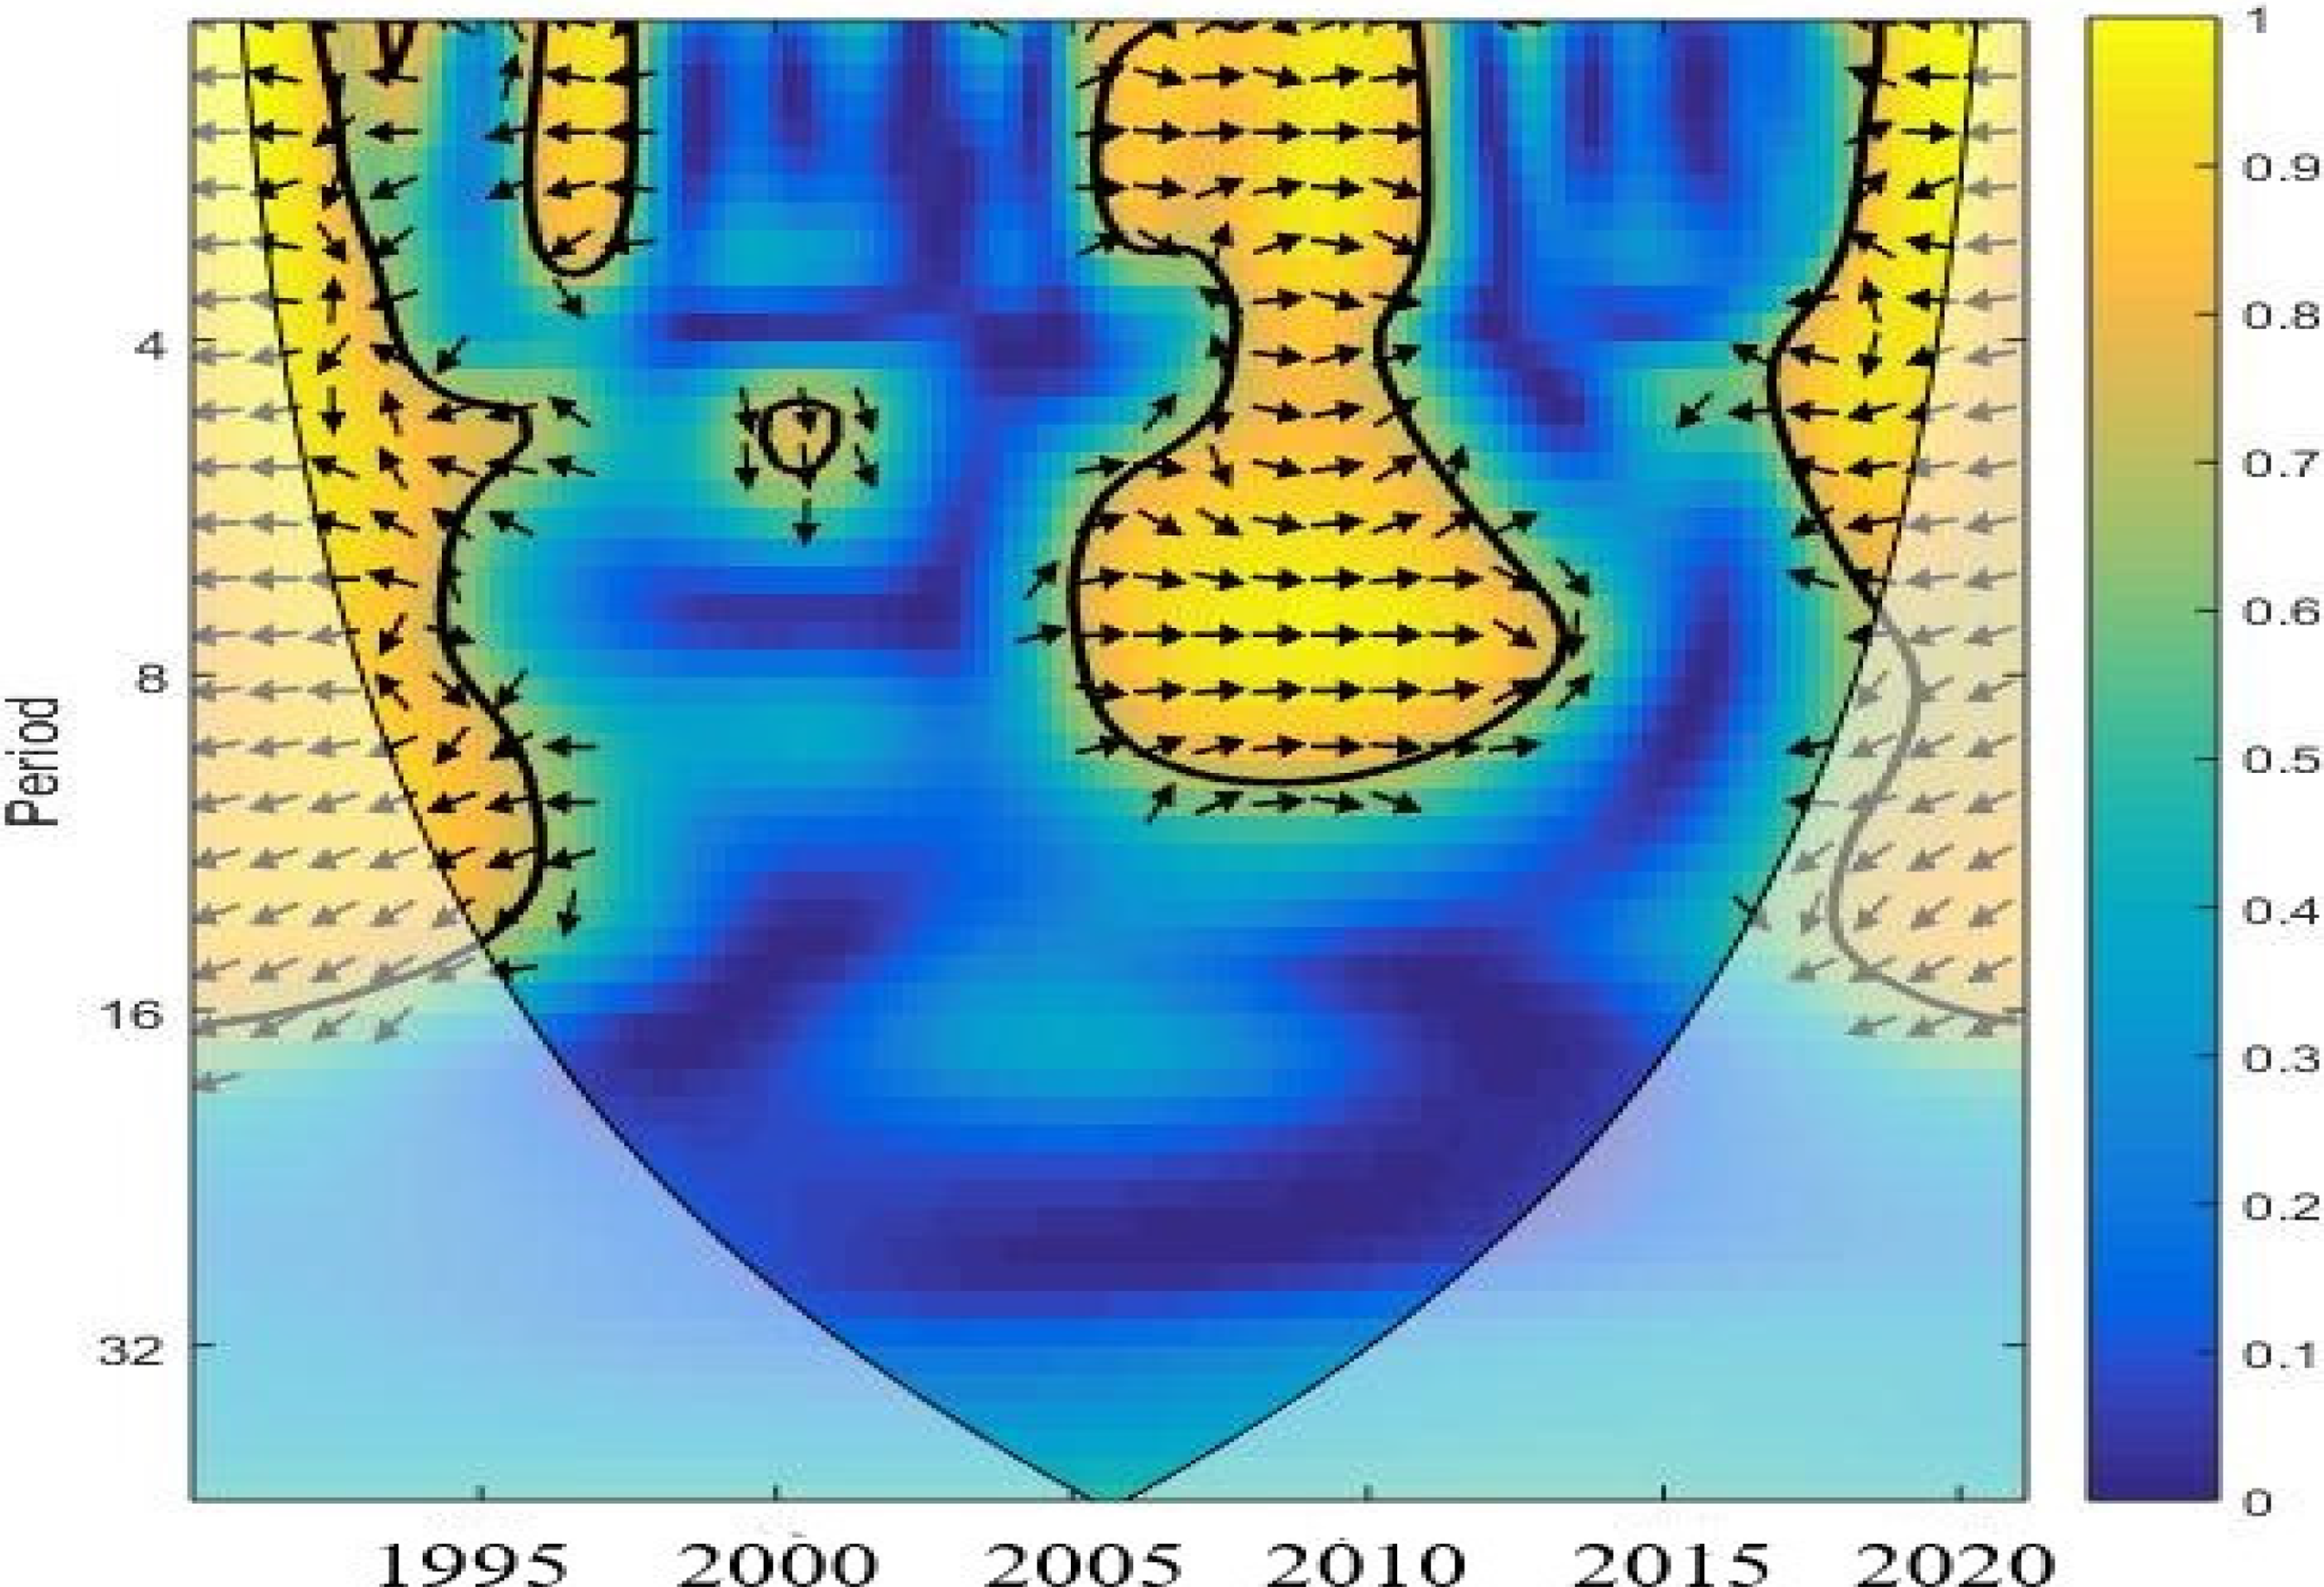
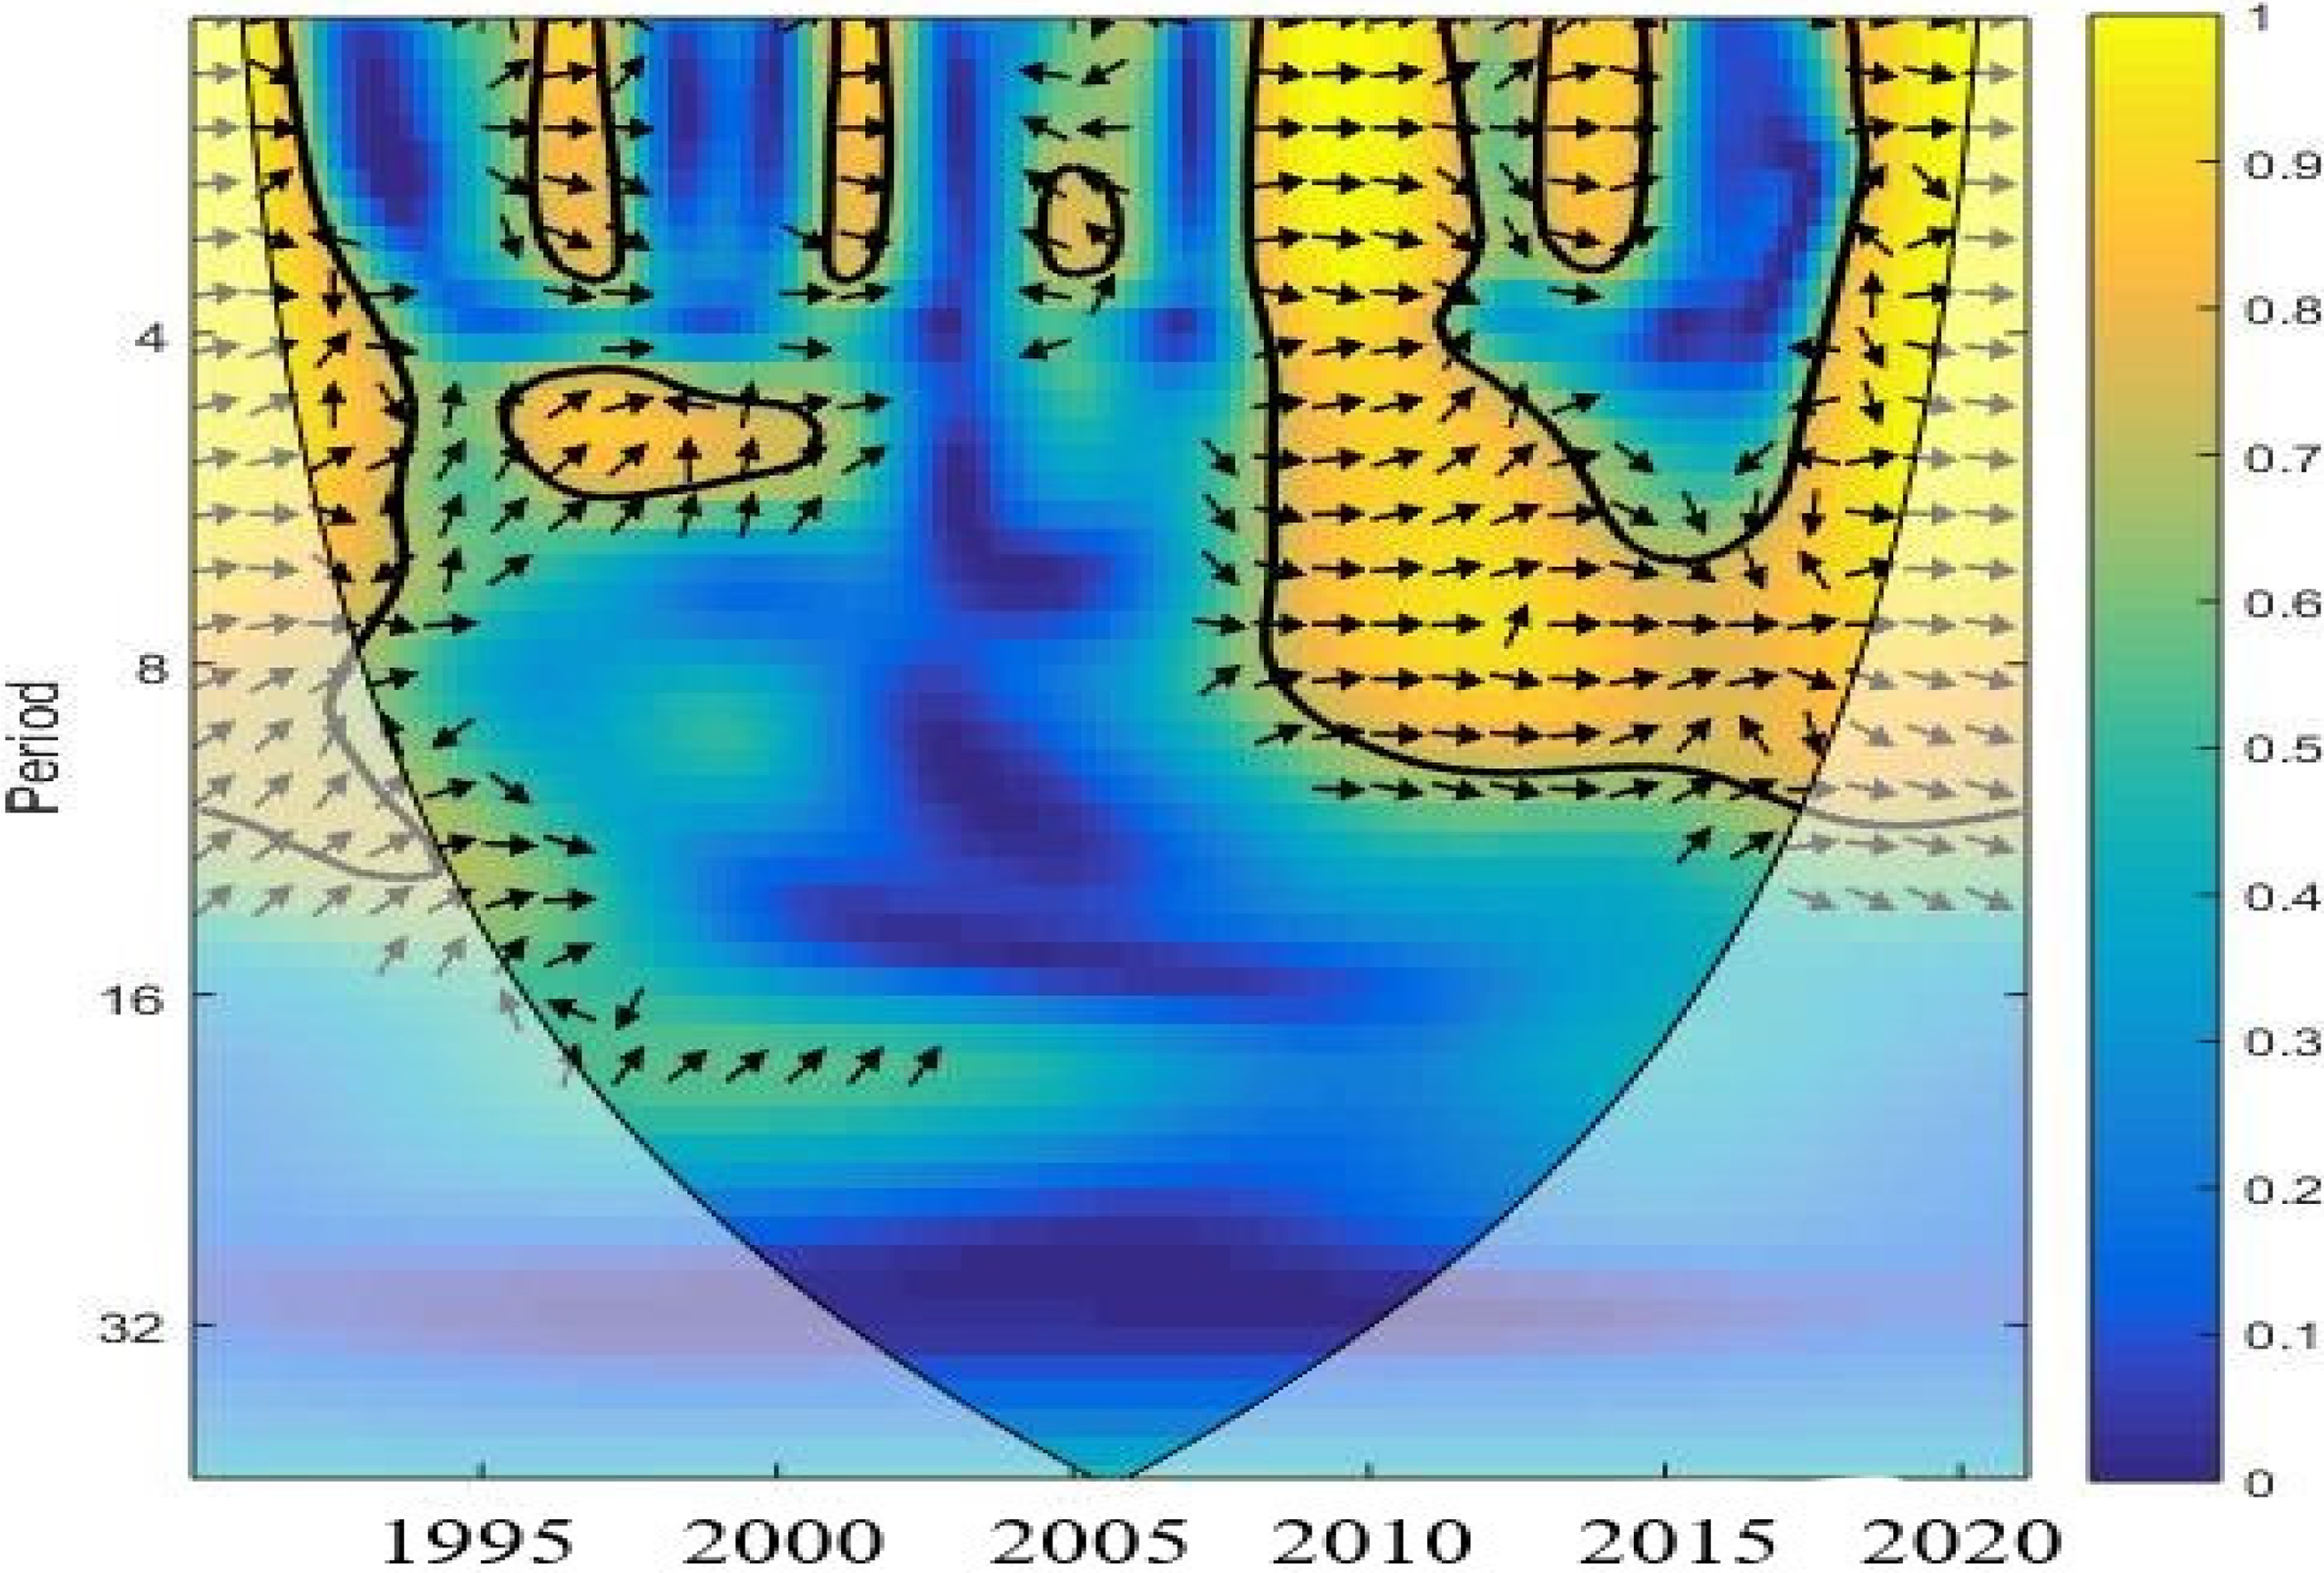
This study applied the WTC approach to uncover the co-movement between carbon emissions and exogenous variables (REC, TECIN, TOP and TRS) at different periods and frequencies. This approach, which is centred on mathematics, is utilized to collect previously undisclosed evidence. As a result, the study probed into the interrelationships between variables at various frequencies. The cone region where the WTC is interpreted is known as the COI–cone of influence. The significance level centred on simulations is denoted as the black border. In Figure (1–4), 0–4, 4–8 and 8–32 denoted by short, medium and long term, respectively. Furthermore, frequency and time are denoted as the vertical and horizontal axes. The colour blue and yellow colour denotes the corresponding low and high dependence between series. The rightward and leftward arrows also depict in-phase and out-of-phase interaction. Moreover, the direction of the arrows moving from leftward-down (rightward-up) reflects that the second series leads (causes) the first series, whereas the arrows’ direction moving from leftward-up (rightward-down) indicate that the first variable leads (causes) the second series. The outcomes of the WTC are illustrated below:
The WTC between carbon emissions and REC from 1990 to 2020 is denoted in Figure 2. The bulk of the arrows are pointing left in the short and medium term, from 1994 to 1997 as well as 2015 to 2016, on a scale of 0–16, indicating a negative linkage between carbon emissions and REC, with REC leading carbon emissions. In the ong, medium and short term, between 1990 and 1998 and between 2011 and 2018, there is an adverse connection between carbon emission and REC, with REC leading carbon emissions. As a result, REC improves environmental quality in Germany's short, medium and long run.
The WTC between carbon emissions and TECIN from 1990 to 2020 is presented in Figure 3. In the long, medium and short term, several arrows are pointing leftward from 1990 to 2004 and 2016 to 2020, on a scale of 0–32, suggesting that there is a negative connection between carbon emissions and TECIN, with carbon emissions leading TEC. Between 2009–2011, the arrow movement right on the scale of 4–8, denoting a positive connection between TECIN and carbon emissions, with TEC leading carbon emissions. This shows that TECIN mitigates carbon emissions in Germany.
Wavelet coherence between CO2 and renewable energy.
The WTC between carbon emissions and TOP from 1990 to 2020 is presented in Figure 4. Between 1990 and 1999, since several arrows are pointing leftwards on the scale of 0–16, affirming that there is an adverse connection is uncovered between carbon emissions and TOP in the short and medium term, with TOP leading carbon emissions. Between 2004 and 2014, the bulk of the arrows is facing right on the scale of 0–8, indicating a positive connection between TOP and carbon emissions, with TOP leading carbon emissions. Between 2016 and 2020, several arrows are pointing left on the scale of 0–16, affirming that a negative relation is detected between TOP and carbon emissions, with TOP leading carbon emissions. Thus, TOP have an adverse connection with carbon emissions in Germany.
Wavelet coherence between CO2 and technological innovation.
The WTC between carbon emissions and TRS from 1990 to 2020 is presented as Figure 5. Between 1990 and 1996, several arrows are pointing rightward on the scale of 0–8, affirming a positive connection between carbon emissions and TRS in small and medium terms, with TRS leading carbon emissions. Between 2000 and 2006, the arrows point to the right on the scale of 0–4, showing a positive interaction between TRS and carbon emissions in the short term, with TRS leading carbon emissions. The bulk of the arrows points rightward on the scale of 0–16 between 2009 and 2020, indicating a positive interconnection between TRS and carbon emissions, with carbon emission leading to TRS. Hence, TRS increases carbon emissions in Germany.
Wavelet coherence between CO2 and trade openness.
Wavelet coherence between CO2 and transport service.
Conclusion
The present study adopts the novel nonlinear ARDL model to gauge the positive and negative impacts of renewable energy, technological innovation, trade openness, and transport services on carbon emissions in Germany. The empirical analysis stretches from 1990 to 2020. The empirical data is subjected to various econometric procedures such as structural breakpoint unit root, cointegration test, nonlinear ARDL estimation, and wavelet coherence analysis. Feedbacks from the empirical results show that longrun nexus is supported among the variables based on the outcomes of the bound test for cointegration. Feedbacks from the NARDL analyses reveal that renewable energy and technological innovations moderate the surge in carbon emissions while trade openness and transport services drive emissions. These results are found robust based on estimates obtained from the wavelet analysis, especially regarding the moderating roles of renewable energy and technological innovations on carbon emissions.
Policy implications
Consequently, provides the following suggestions. First, the mitigating impacts of renewable energy on carbon emissions are a confirmation of the belief that transition to renewable energy will effectively surmount the pervasive environmental and health issues caused by rising carbon emissions. as such, investment in renewable energy products and services should be encouraged both from the macro and micro levels. The government can implement tax-free policies for companies adopting between 70% to 90% renewable energy sources for their production and operation processes. Renewable energy-intensive products could also be subsidized for citizens to enhance affordability and accessibility. Technological innovations’ moderating impacts on carbon emissions can be maintained by promoting research and development in Germany. More so, investing in the infrastructure to meet the rising population could also help promote technological innovations. The carbon-inducing trade openness can be addressed through trade policy guiding the inflows and outflows of goods and services in Germany. Specifically, focus can be given to the imports aspects that are observed to induce carbon emissions mostly. Transport services contribution to carbon emissions can be resolved through the adoption of green and electric transportation systems.
Limitations and future research opportunities
Finally, the present research has several limitations. For example, this research solely looked at Germany and ignored other emerging and developed countries. Such research could be carried out in the future among advanced and developing nations to generalize the findings. Additionally, the study has a flaw in that it employs CO2 emissions, a poor indicator of environmental deterioration; hence, future studies can take other indicators like load capacity factor and ecological footprint into consideration. Moreover, this paper may not incorporate other pertinent indicators: external debt, geopolitical risk, economic complexity, financial development, and political stability. Lastly, the policy suggestions that come from this research may be a vital part of Germany's and other developed and developing countries continued environmental sustainability.
Footnotes
Data availability
The data for the analysis in this study is available upon request
Declaration of conflicting interests
The author(s) declared no potential conflicts of interest with respect to the research, authorship, and/or publication of this article.
Funding
The author(s) received no financial support for the research, authorship, and/or publication of this article