
Abstract
With the signing of the Paris Agreement in 2016, countries began to explore new economic models to get rid of the high emissions and high pollution caused by the traditional extensive economic model. Circular economy (CE) is regarded as an important way to achieve carbon neutrality, yet there is little literature has explored the relationship between the two. This paper aims to provide evidence and suggestions for developing circular economy strategies in emerging developing countries such as China by exploring the relationship between circular economy and carbon emissions. In this study, urban carbon emissions were measured by using high-resolution carbon emission data and the circular economy of 285 cities in China from 2009 to 2018 was estimated using a data envelopment analysis (SBM-DEA) model based on a super effective slackness measure. Then, the spatial impact of the circular economy was analyzed based on the spatial Durbin model. The empirical results are as follows: first, carbon intensity shows a positive spatial correlation, with most cities clustered in high-high (H-H) and low-low (L-L) types. Second, it was found that CE has a significant negative impact on the carbon intensity of local cities and neighboring cities. Third, based on regional heterogeneity, CE has significant negative direct and indirect effects in central and western cities. In contrast, CE has only significant direct effects (negative values) in eastern cities.
Introduction
Problems of imbalance and unsustainability in China's economic development are becoming more and more serious . 1 By 2019, China has become the world's largest carbon emitter 2 , and environmental governance becomes an obstacle to achieving sustainable development. Since the concept of circular economy was introduced, 3 it has been regarded as an important tool for achieving sustainable development. The circular economy aims to change the traditional linear economic model of 'extraction-production-waste', delinking economic development from resource extraction and environmental pollution, creating more socio-economic value with less resource input, and thus achieving sustainable development. 4 Therefore, it is of significance to explore the impact of the circular economy on carbon emissions.
The existing literature on circular economy has mainly focused on a single industry or a single city, 5 and few scholars have explored the impact on macro-level carbon governance. Wang et al. 6 took a typical coal-fired power generation industrial park as a research object and found that a circular economy can significantly reduce carbon emissions. Fang et al. 7 used carbon footprint as a proxy indicator for circular economy performance and investigated the urban carbon footprint of China Guiyang from 2002 to 2012, and found that a circular economy can substantially save resources and reduce carbon emissions. Xue et al. 8 analyzed the carbon footprint using a life-cycle estimation method and compared the traditional pig farming model with a biogas-based circular pig farming model, finding that the circular pig farming model can reduce carbon emissions and bring economic benefits through carbon trading. Gallego-Schmid 9 found that material reuse was the best solution for improving energy efficiency as well as achieving significant carbon reductions, targeting the EU construction industry as a study. Cities, as a combination of population, resources and environment, contribute over 70% of global carbon emissions. 10 According to the calculation of the China Recycling Economy Association, China's recycling economy will contribute more than 25% to urban carbon reduction during the 13th Five-Year Plan period. 11 On one hand, the circular economy effectively improves resource utilization and reduces carbon emissions through resource conservation to change the ways of products and materials are produced and used. On the other hand, the circular economy helps to break down regional market barriers and build up factor recycling channels to enhance the resource recycling efficiency so as to achieve the goal of carbon neutrality. We seek to explore the idea that a circular economy is a potential pathway to carbon neutrality by quantifying the circular economy in cities.
In summary, the potential contributions of this study are as follows: 1) Unlike existing studies that focus on circular economy measurement, this study is the first paper to explore the relationship between circular economy and carbon emissions with an econometric analysis method. Second, Instead of using the IPCC method to measure carbon emissions 12 , we measured carbon emissions in Chinese cities using high-resolution carbon emission data, which can comprehensively cover all Chinese cities. It provides us with further details on the spatial distribution of carbon emissions and helps us understand the current status of carbon emission reduction in China. 2) Unlike existing studies based on the entropy weight method(EWM), we attempt to use a high-efficiency SBM to overcome the selection bias of the EWM to accurately assess the circular economy of 285 cities in China from 2009–2018. 3) We introduce a spatial econometric model to explore the spatial effects of the circular economy. Based on the adjacency matrix, geographic distance matrix and economic distance matrix of 285 cities, we explored the direct effect and spatial spillover effect of circular economy on carbon emissions. It hoped to provide empirical evidence and suggestions for the formulation and improvement of circular economy strategies in developing countries such as China.
The rest of the paper is organized as follows. Section 2 provides the theoretical analysis, section 3 provides the data and model design, while section 4 provides the results and discussion. Section 5 presents the conclusions and policy implications.
Theoretical analysis
With the introduction of the circular economy concept, more and more scholars have attempted to quantify the circular economy through various methods, 13 such as life cycle assessment (LCA), the entropy weight method (EWM), and fuzzy clustering methods.14–16 These methods integrate circular economy-related indicators by weights to obtain a single circular economy score. However, the arbitrariness, inconsistent nature of the indicators can lead to errors in the assessment. 17 The data envelopment analysis(DEA) model has been proposed to address the bias due to the subjectivity of weight determination and is widely used in environmental economics. 18 For example, Pagotto and Halog 19 used a DEA model to evaluate the economic and environmental efficiency of various sub-sectors of the Australian food system. Giannakitsidou et al. 20 used a radial DEA model to evaluate the environmental and circular economy performance of 26 EU countries. However when inputs are excessive or outputs are insufficient, this leads to efficiency bias. And modern societies produce with wastewater, flue gas, and stationary waste, and these undesired outputs need to be considered in environmental science, 21 but traditional DEA models are not suitable for undesired outputs. 22 To overcome these problems, Tone 23 proposed a super-efficient slack based measure-DEA model(SBM-DEA) that allows for efficiency scores greater than 1. Long 24 estimated the eco-efficiency of the Chinese 35 cities by considering undesirable outputs based on the SBM-DEA model. Avdiushchenko and Zając 25 combined the undesired output of the super-efficiency SBM-DEA model to estimate the eco-efficiency of circular economy chains in coal mining areas.
Based on the above analysis, we found that the super-efficiency SBM-DEA model not only mitigates the shortcomings of the traditional DEA method and weighting method, but also obtain accurate efficiency values by introducing undesired outputs. Therefore, we estimated the circular economy of Chinese cities using the super-efficiency SBM-DEA model.
The carbon governance literature mainly explores the drivers of carbon emission from the perspectives of environmental regulations, energy structure, foreign direct investment, green technology innovation, subsidies, and the digital economy26,27,28, however, few scholars have explored the circular economy. As a new economic development model, the circular economy transforms the traditional single economic model of resource-product-waste emission into a recyclable, multi-directional transformation, multi-level utilization, and waste emission-free economic model.
The impact of circular economy on carbon governance is explained in four main ways. First, a low-carbon circular production system can reduce carbon emissions. 29 Hou et al. 30 found that promoting green transformation and upgrading of the industry can reduce carbon emissions using Chinese industrial panel data from 2010 to 2015. Rao et al. 31 evaluated the sustainability of India's agro-ecosystems sustainable development that helps to cope with climate extremes caused by greenhouse gas emissions. Secondly, the circular economy promotes the development of green and low-carbon distribution systems and infrastructure, which contribute to carbon emission reduction. 32 Xu et al. 33 found that the development of new energy vehicles can reduce carbon emissions using data from eight major countries from 2009–2017. Li et al. 34 mentioned that green logistics has an important role in improving the green economy. Thirdly, a circular economy can build a sound green technological innovation system, which can reduce carbon emissions. 35 Zhang et al. 26 found that green technological innovation can improve the industrial structure and enhance urban carbon governance. Fourth, although the circular economy is primarily based on market economy drivers, originating from government intervention, sound environmental regulations can promote carbon neutrality. 36 Ulucak et al. 37 found that environmental regulations contribute to carbon emission reduction in BRICS countries. And the circular economy breaks down regional market barriers 38 and the circular economy accelerates the flow of factors such as innovative technologies, clean energy use, and various resources. These factor flows not only affect local carbon governance, but also indirectly the carbon governance of neighboring regions. 39
Data and model design
Sample
We explored the spatial distribution of carbon intensity and the spatial heterogeneity of the circular economy in China 285 cities using data from 2009–2018 as the original sample. First, considering the unbalanced infrastructure, economic development among Chinese cities. this can lead to unbalanced levels of circular economy development among cities. Therefore, it is difficult to capture micro-level changes through provincial panel data. Second, we attempt to provide more detailed evidence for city managers to formulate targeted policies through city panel data analysis. Finally, considering the data availability, we selected 285 cities as our study population. City carbon emission data were obtained from the Global Atmospheric Research Emissions Database, and city characteristics variables were from the China City Statistical Yearbook. Data for cities with missing information were from the China Environmental Statistical Yearbook and the Regional Economic Statistical Yearbook, and a total of 2850 annual city observations were obtained.
Definition of variables
Urban carbon intensity(UCI)
Considering the accuracy and comprehensiveness of the data, this paper uses the Global Atmospheric Research Emissions Database (GARED: https://edgar.jrc.ec.europa.eu/) to measure urban carbon emissions. 40 This data provides a set of global carbon emission data on a 0.1deg x 0.1deg grid map. We used Arcgis 10.2 software to match the Chinese prefecture-level city map data, and then obtained urban carbon emission data based on city boundaries. Finally, the urban carbon intensity is measured as the ratio of urban carbon emissions to urban GDP. 41
Circular economy (Ce)
Our research approach was built on existing research 42 to determine circular economy performance through a undesirable super-efficiency-SBM model as a measure of urban circular economy. As mentioned in section 2.1, the undesirable super-efficiency-SBM model can effectively address the problems posed by the radial and angular aspects of the traditional Data envelopment analysis (DEA). In addition, we consider undesirable outputs to improve the accuracy of the measurement. 43
The circular economy is assumed to be measured for n decision making units (DMUs), denoted as
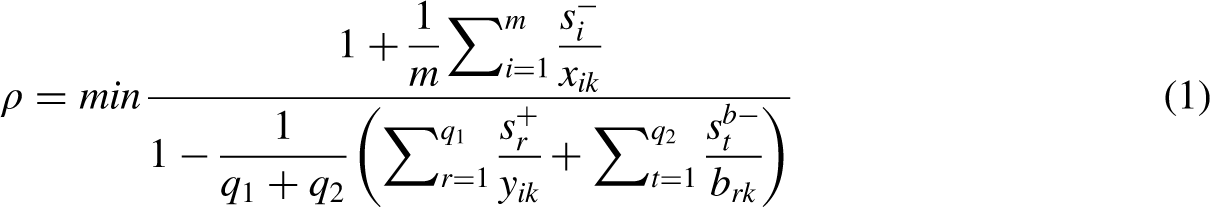
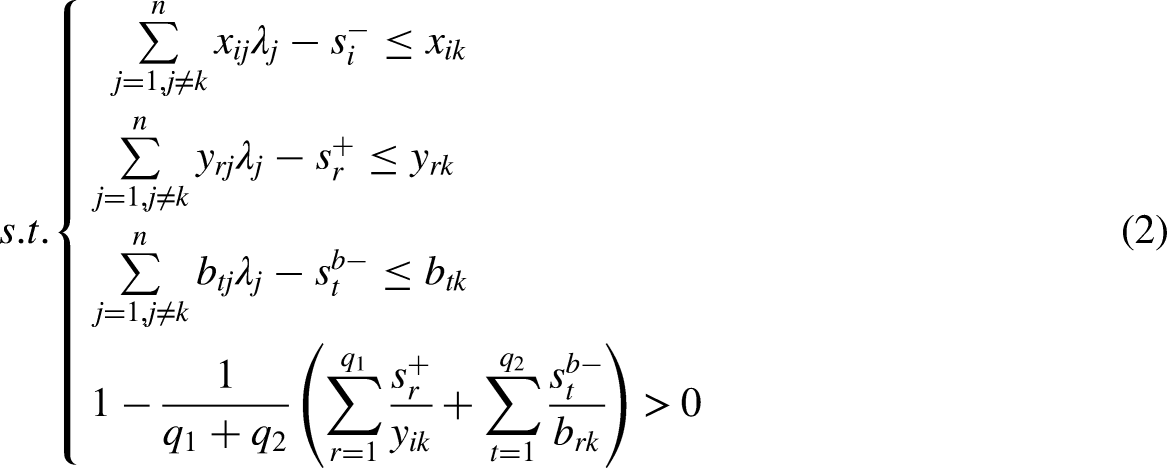
Referring to the circular economy index literature11,44 and considering the availability of data. Based on the principles of reduce, reuse and recycle (3R), the circular economy aims to decouple economic development and environmental pollution by recycling resources and using limited resources. Therefore, we have chosen the input-output indicators include six input factors, five desired outputs and three undesired outputs. The input factors include resource inputs: capital (calculated using the permanent inventory method 45 ), labor, land and resources (total electricity consumption); And environmental treatment intensity: pollution control investment and wastewater treatment capacity. Desired outputs include economic outputs: regional GDP and environmental treatment output: wastewater treatment rate, domestic waste treatment rate, industrial dust removal rate and industrial solid waste utilization rate (resource recycling indicator). Non-desired outputs include three indicators: industrial wastewater, industrial dust and industrial sulphur dioxide. All data were obtained from the China City Statistical Yearbook and the Environment Statistical Yearbook.
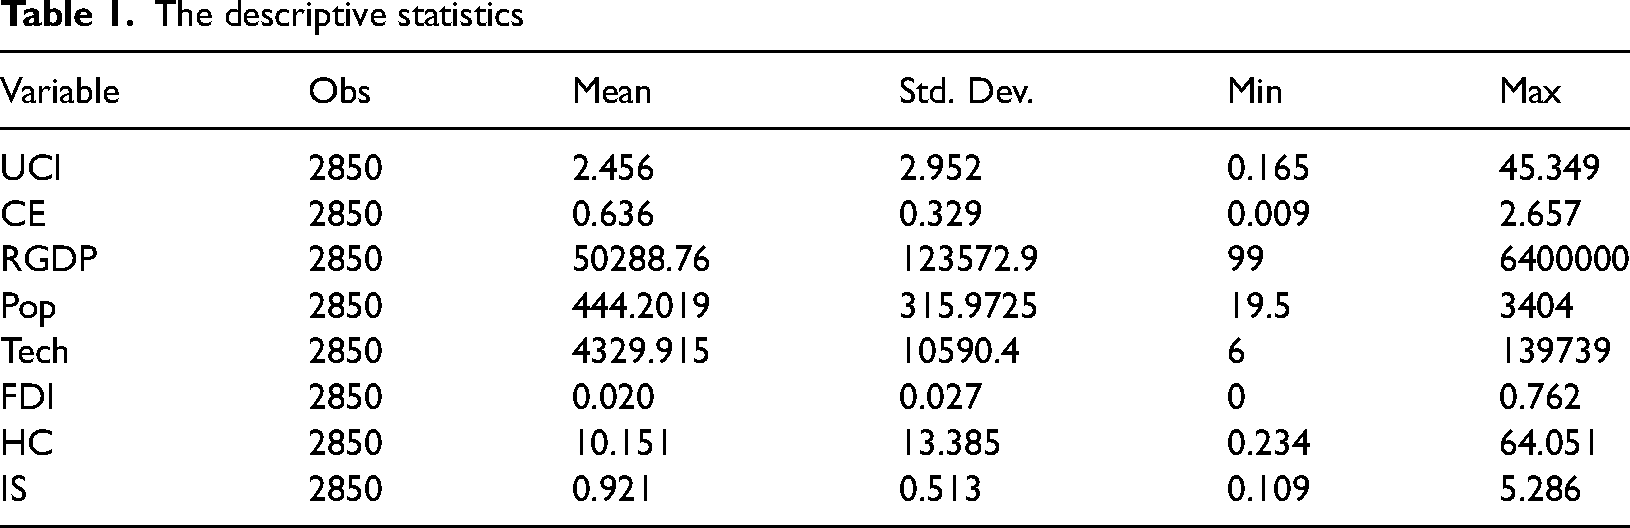
Based on existing studies,41,46 the following control variables were chosen. Affluence (RGDP) is measured by GDP per capita Population size (Pop) is the natural logarithm of the resident population of the city (10,000 people). Innovation level (Tech) is measured as the natural logarithm of the number of patent applications in the city. Industrial structure (IS) is measured as the ratio of tertiary sector output to secondary sector output. Real foreign investment (FDI) is measured as the ratio of real foreign utilized investment to real GDP. Human resources (HC) is measured as the ratio of the number of students in tertiary education to the total urban population.
Model design
Baseline model
To effectively explore the spatial effects of the circular economy on urban carbon intensity, we refer to the STIRPAT model to construct a model.
47


The carbon emissions literature tends to explore spatial dependence, which is in consideration of the fact that cities do not exist independently.
48
We use a spatial econometric model to examine the spillover effects of the circular economy on carbon emissions.
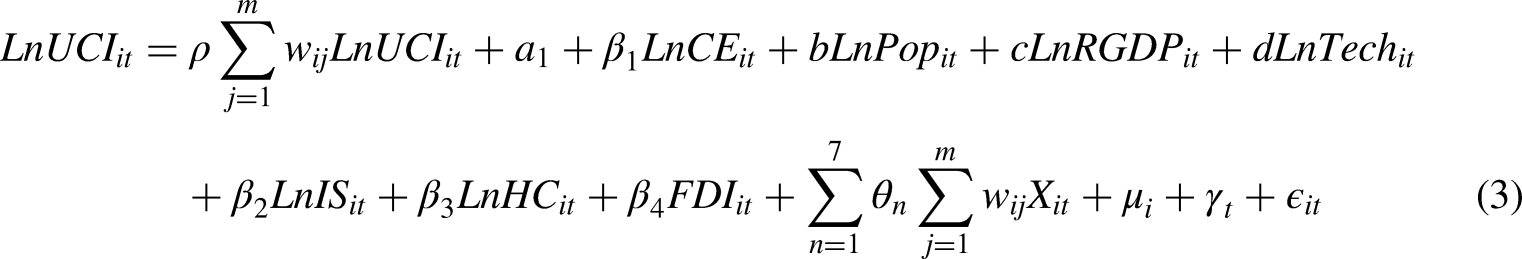
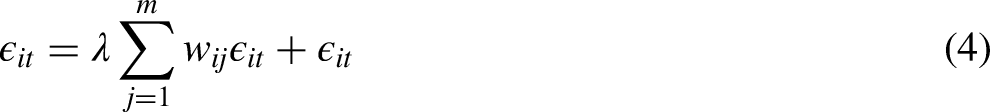
Currently, spatial econometric models can be divided into three models. The dependent variables are spatially correlated and are denoted as spatial lagged models (
We used the global Moran's I index to test the spatial relevance of the CEI. The spatial weight matrix(w) was divided into being a geographic distance matrix(

The geographic distance matrix(
The adjacency matrix(


The descriptive statistics for the variables used are shown in Table 1. In addition, the mean of the VIF coefficients for all variables was 2.04, which is much less than 10; therefore, there is no multicollinearity problem.
The descriptive statistics
Spatial correlation test
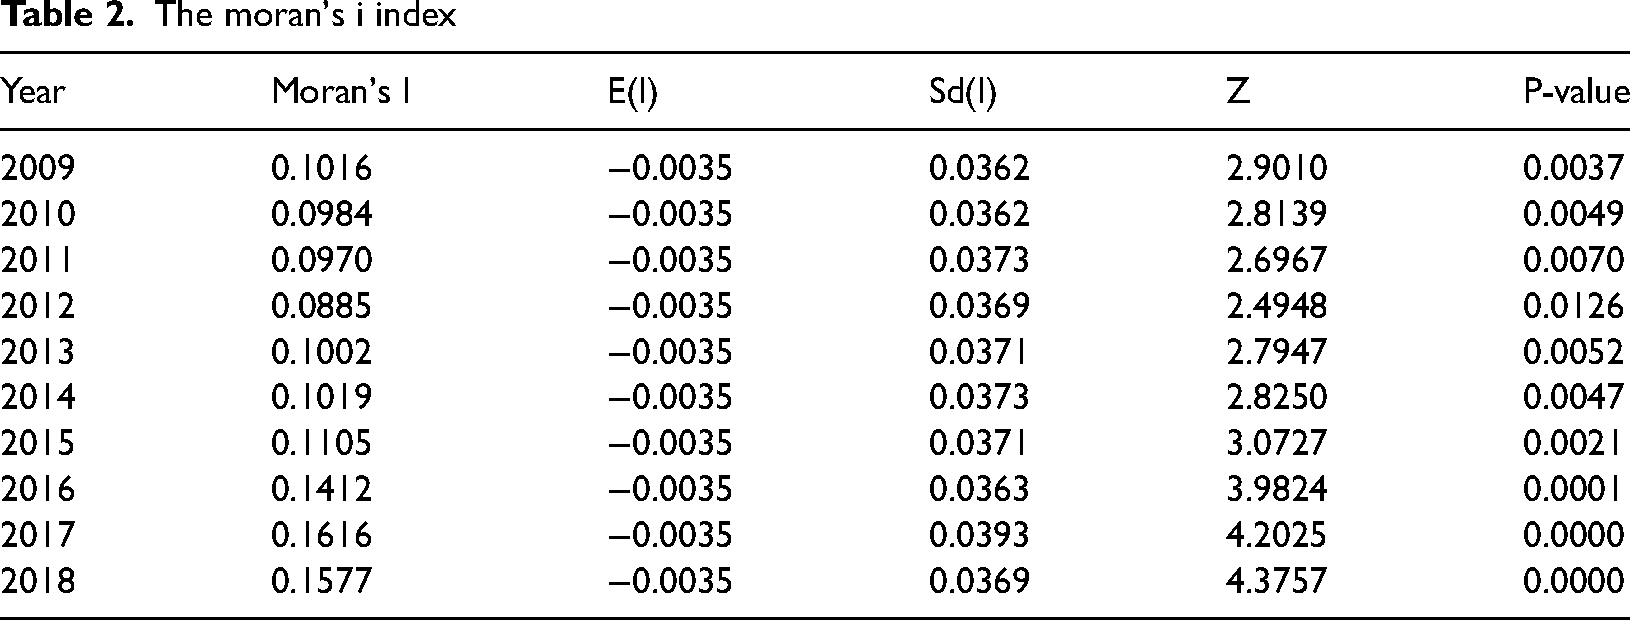
Before conducting the regression analysis, the Moran I index was used to test the spatial correlation of urban carbon intensity. The value is [-1,1], where [0,1] value indicates spatial aggregation and [-1,0] value indicates spatial dispersion. Table 2 shows that carbon intensity has a significant positive spatial correlation in all years.
The moran's i index
The moran's i index
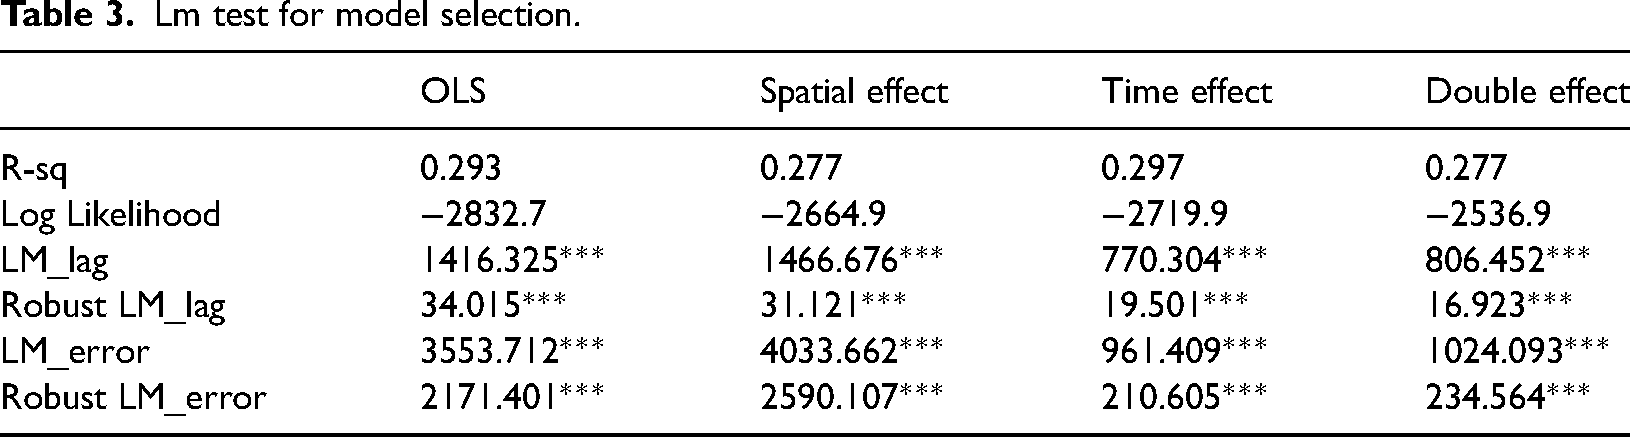
Lm test for model selection.
We depict scatter plots (Moran I) for 2009, 2012, 2015 and 2018. quadrant I and quadrant III imply the presence of positive spatial autocorrelation, namely, quadrant I is where the high values of the city are surrounded by high values and quadrant III is where the low values of the city are surrounded by low values. Whereas, quadrant II and quadrant IV indicate the presence of negative spatial autocorrelation. As seen in Figure 1, we found that most cities are in quadrants I (high-high) and III (low-low). Therefore, a spatial econometric model is needed to analyze the factors affecting carbon intensity.
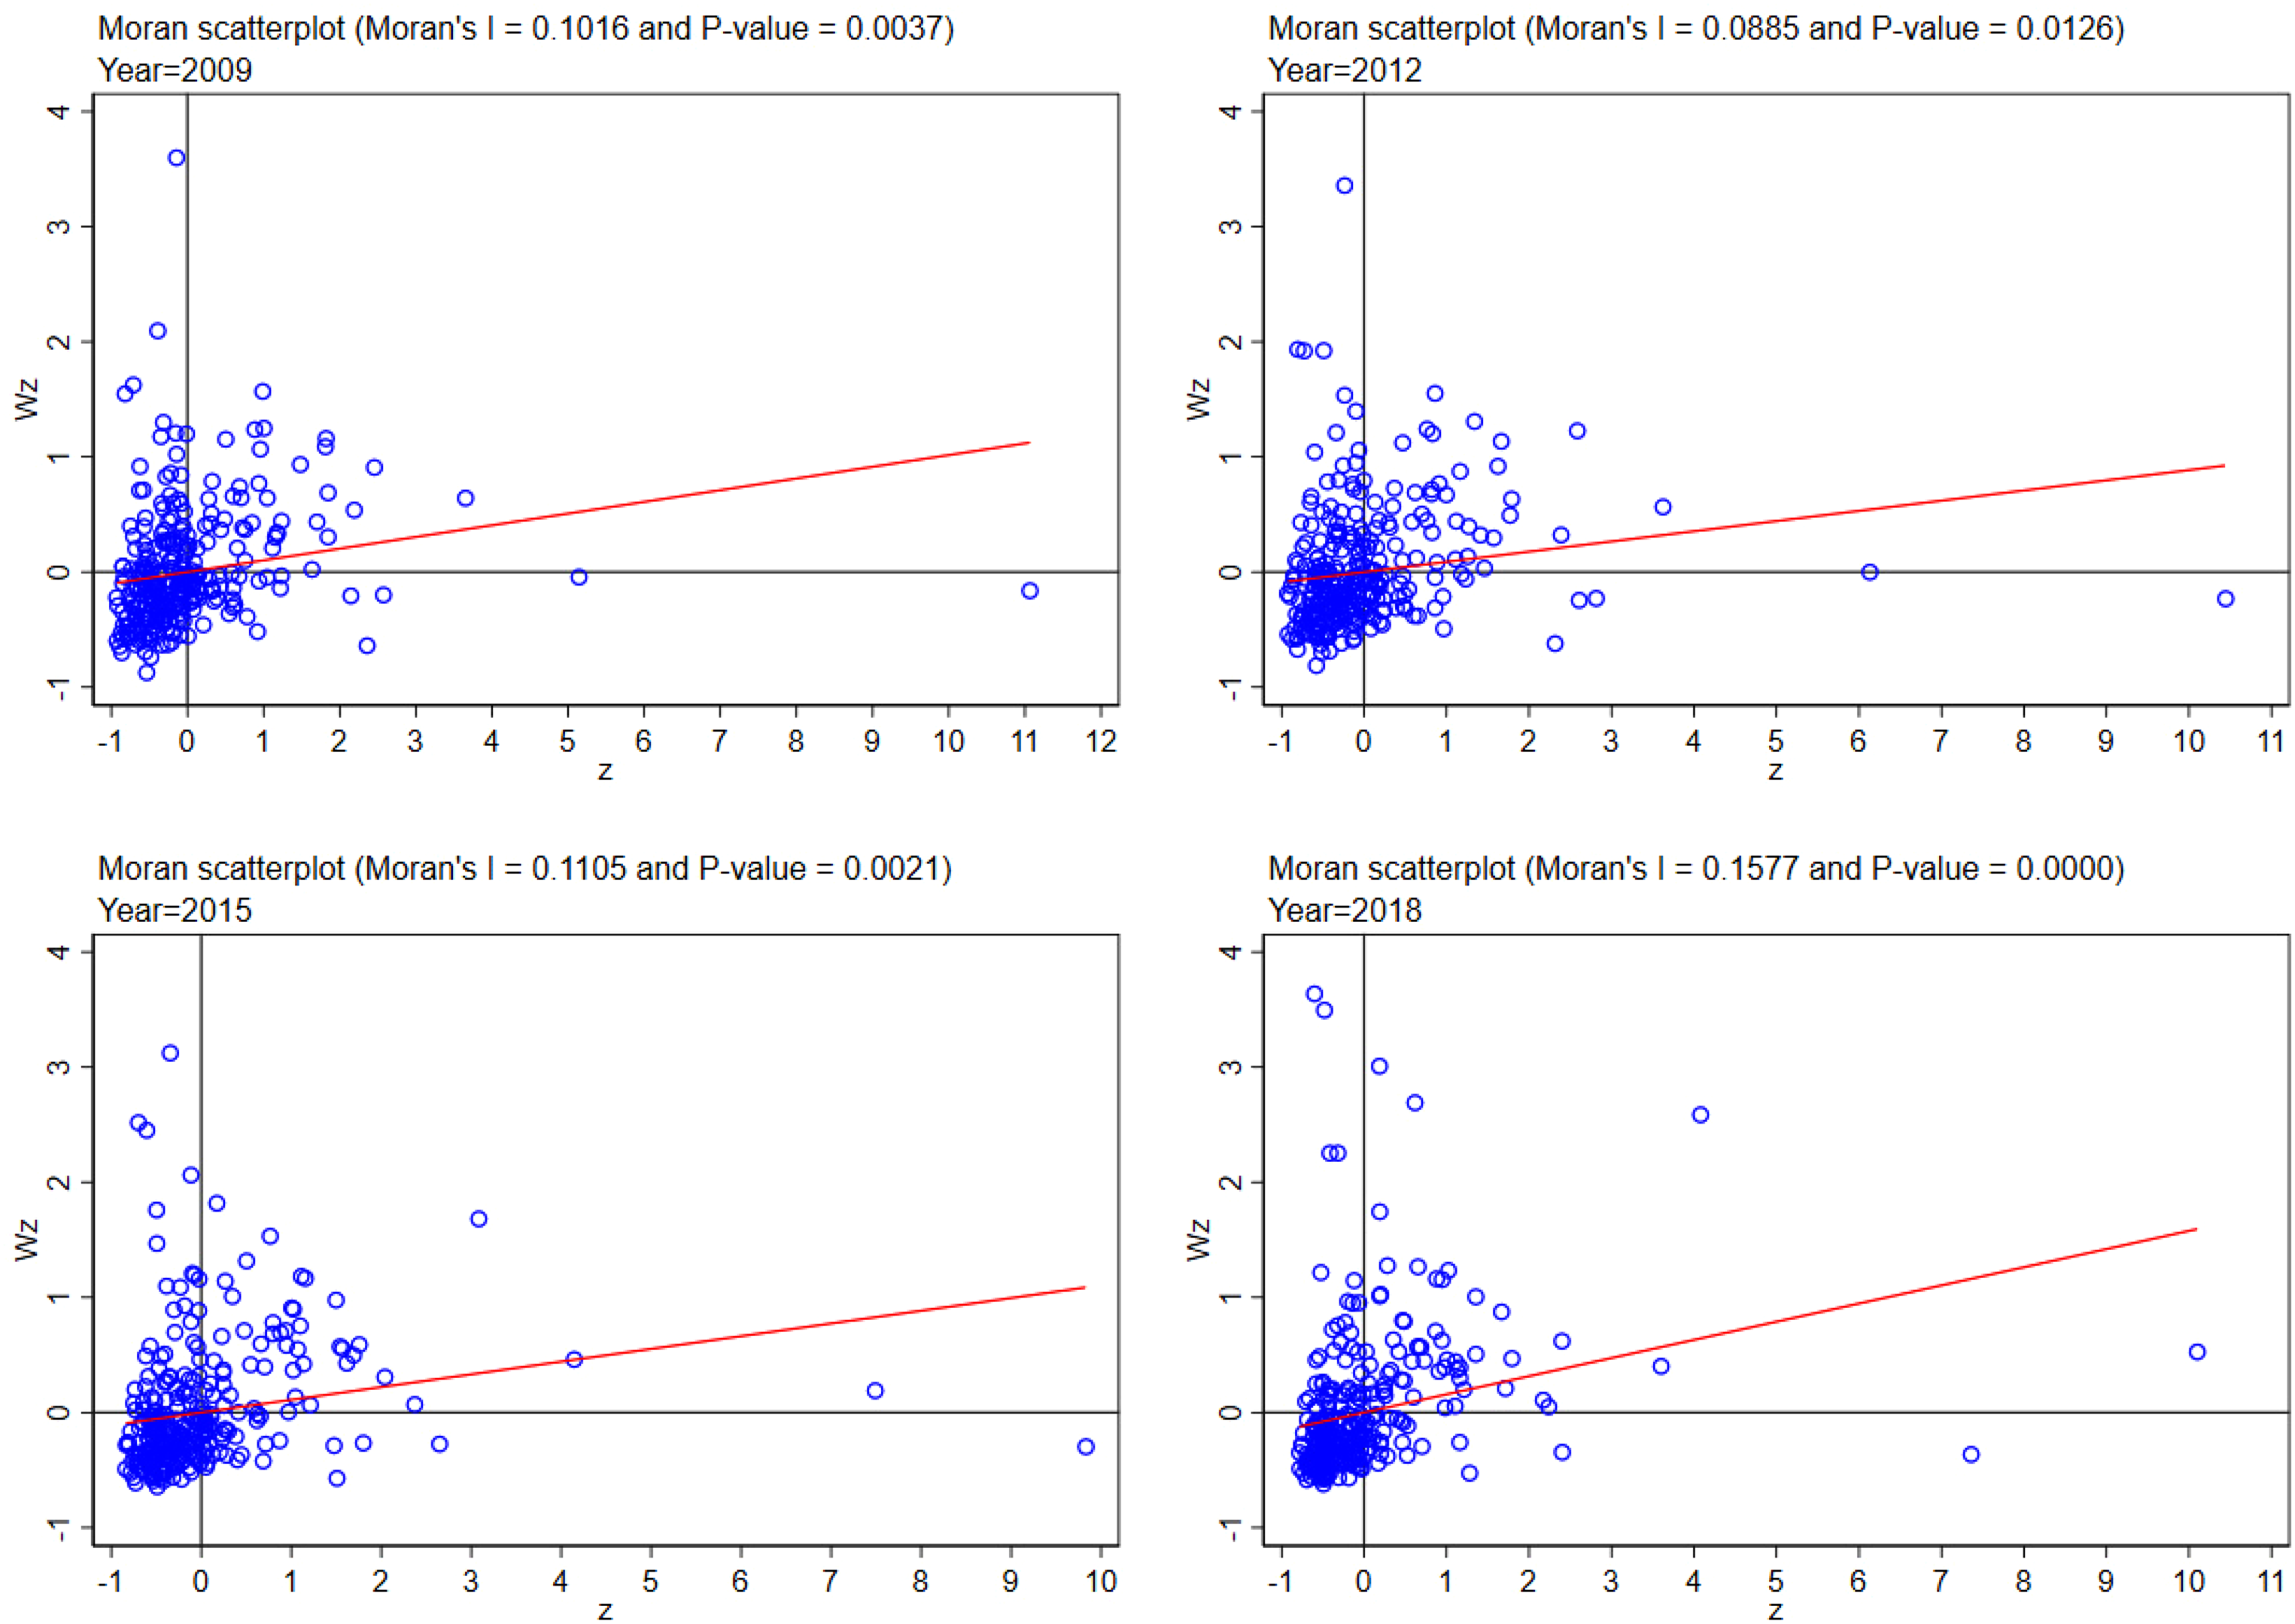
Moran's I scatter plots.
In addition, combined with the LISA map in Figure 2, the high carbon intensity cities are mainly distributed in the central region according to the geographic distance matrix. This may be determined by the fact that these cities are the major coal regions in China. Low carbon intensity cities are mainly distributed in the economically developed eastern coastal regions. The distribution of other types of cities is relatively scattered. In general, urban carbon intensity shows spatial correlation and thus requires the use of spatial econometric models for analysis.
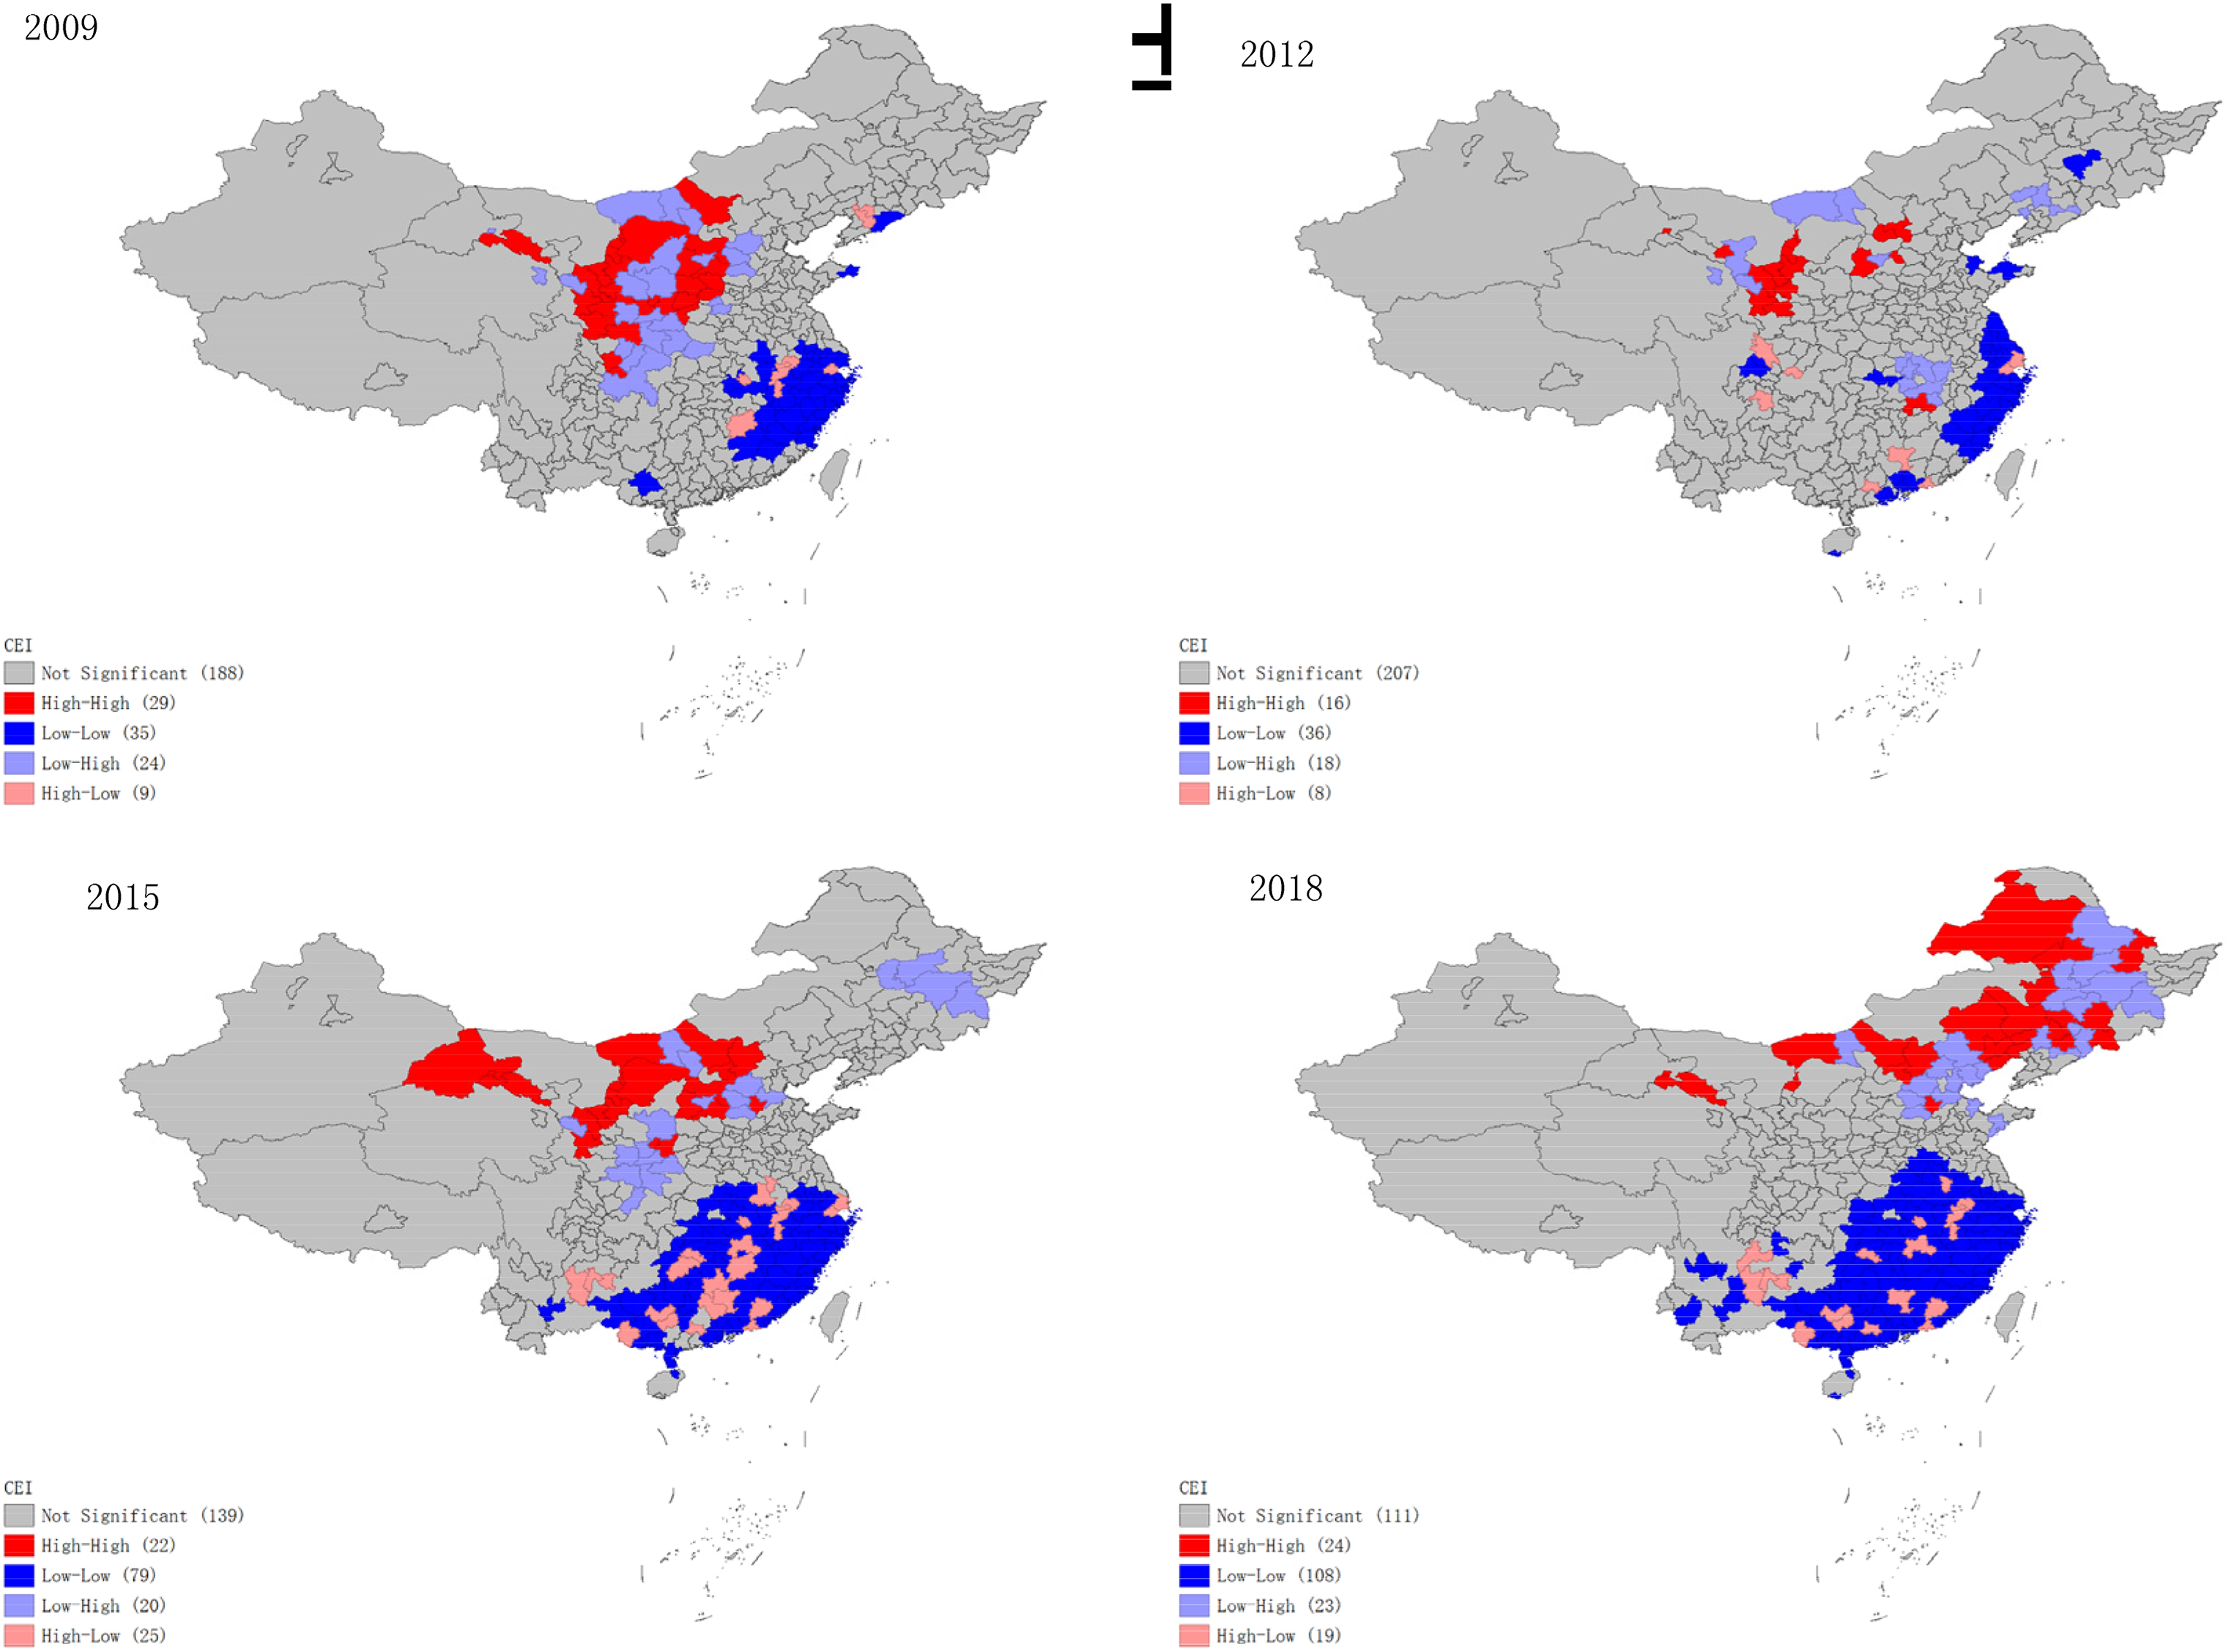
The LISA map.
To determine the optimal model, we provide regression results of four models in Table 3: OLS, spatial fixed effects, time fixed effects and spatial-time fixed effects, where LM_lag, LM_error, and robust LM_lags and errors are significant at the 1% level. First, the
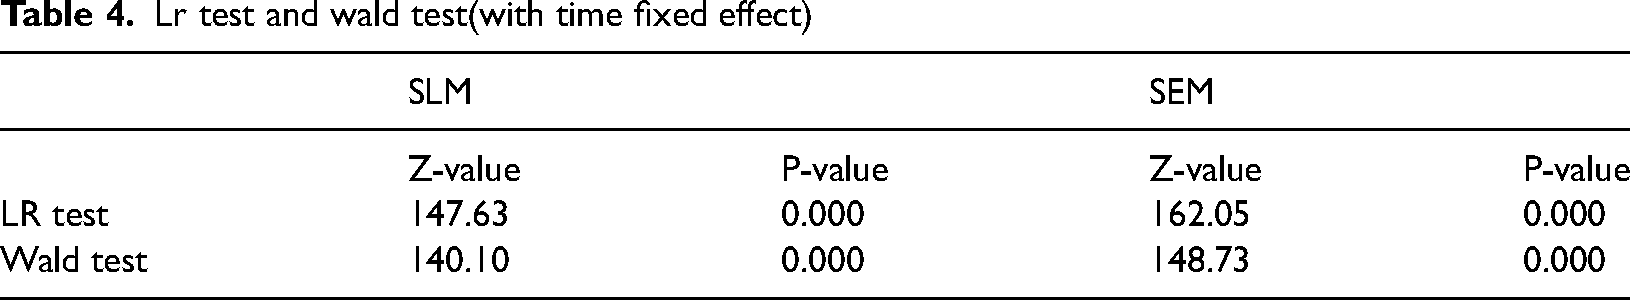
The original hypothesis of the LR and Wald tests was that spatial dubin model(SDM) could be degraded into spatial lag model(SLM) and spatial error model(SEM). Table 4 shows that coefficients of both are significant and the original hypothesis is rejected. Therefore, we choose SDM.
Lr test and wald test(with time fixed effect)
Lr test and wald test(with time fixed effect)
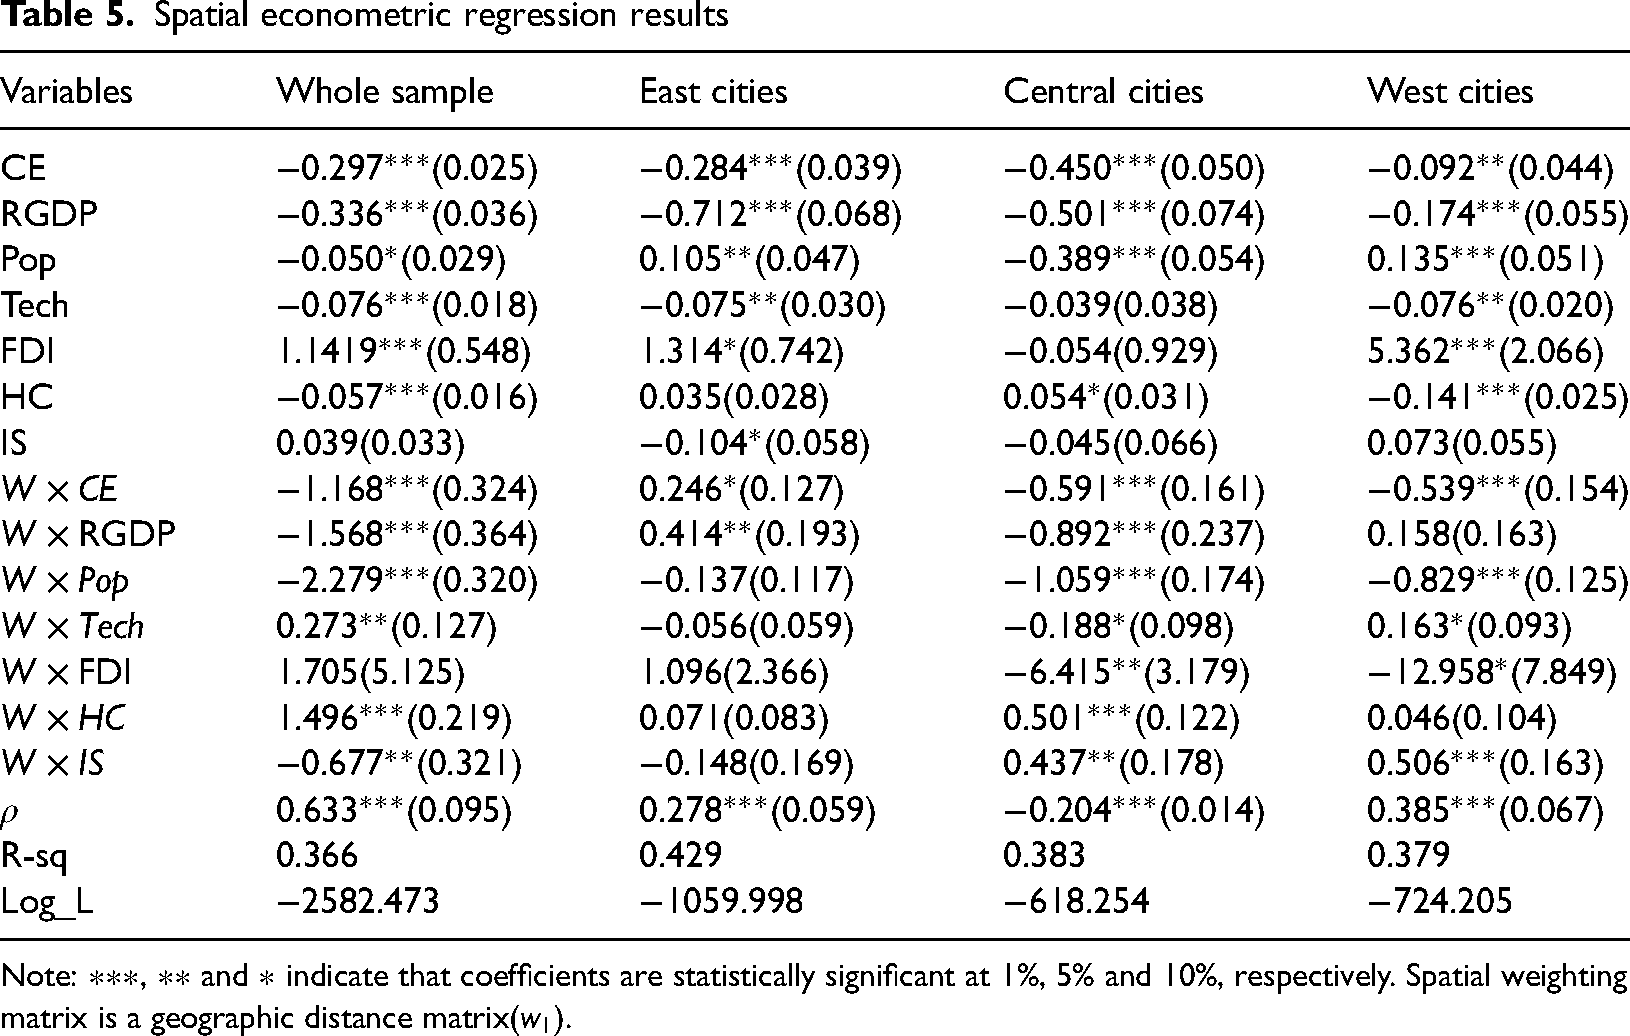
We divided the sample into East, Central and West based on geographical location. Overall, the coefficient of CE is −0.297 at the 1% significance level. the coefficient of
The coefficients of the circular economy in the eastern, central and western regions are −0.284, −0.450 and −0.092 at the 1% significance level, respectively. The impact of the circular economy on urban carbon intensity decreases in descending order in the central, eastern and western regions.
Considering that the point estimation method(in SDM model) may lead to bias in regression results of Table 5. 15 Therefore, we further decomposed the impact of the CE on CEI into a direct effect, an indirect effect(spillover effect) and a total effect (Table 6).
Spatial econometric regression results
Spatial econometric regression results
Note: ∗∗∗, ∗∗ and ∗ indicate that coefficients are statistically significant at 1%, 5% and 10%, respectively. Spatial weighting matrix is a geographic distance matrix(
The direct, indirect and total effects on CEI.
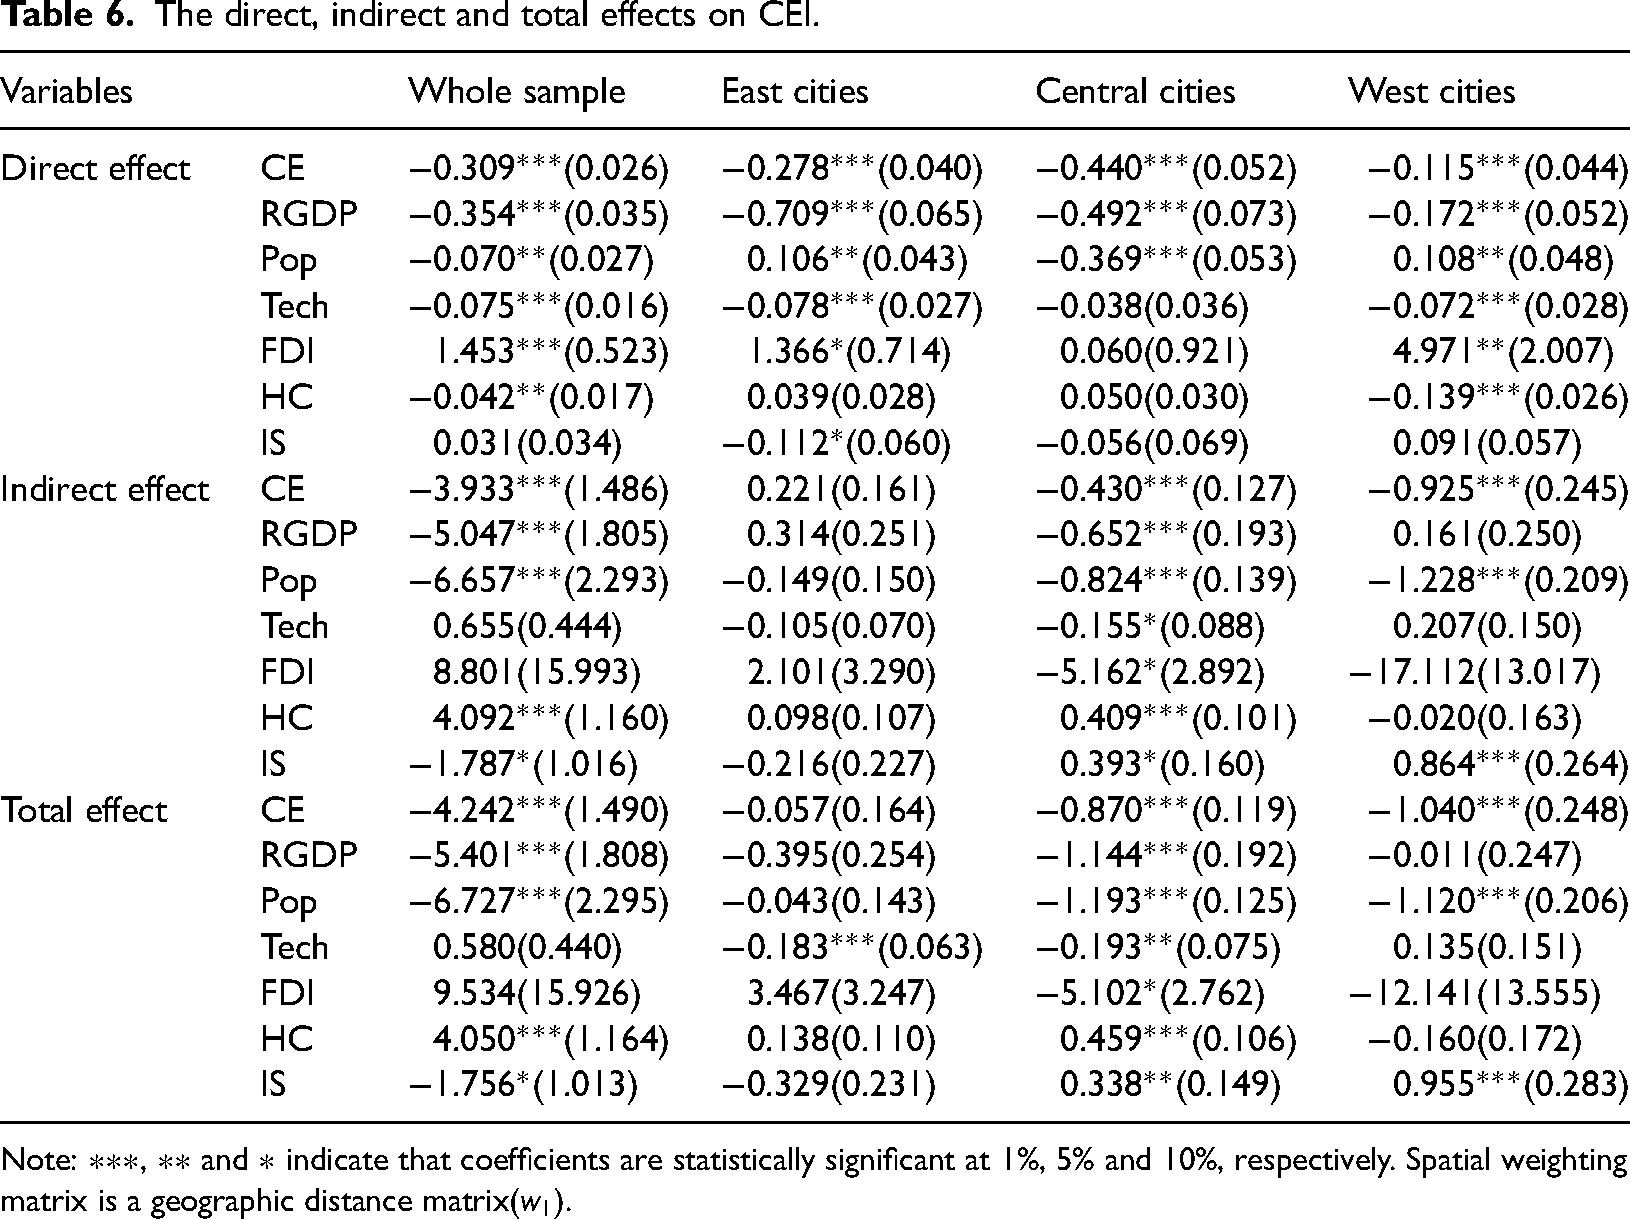
Note: ∗∗∗, ∗∗ and ∗ indicate that coefficients are statistically significant at 1%, 5% and 10%, respectively. Spatial weighting matrix is a geographic distance matrix(
Robustness test
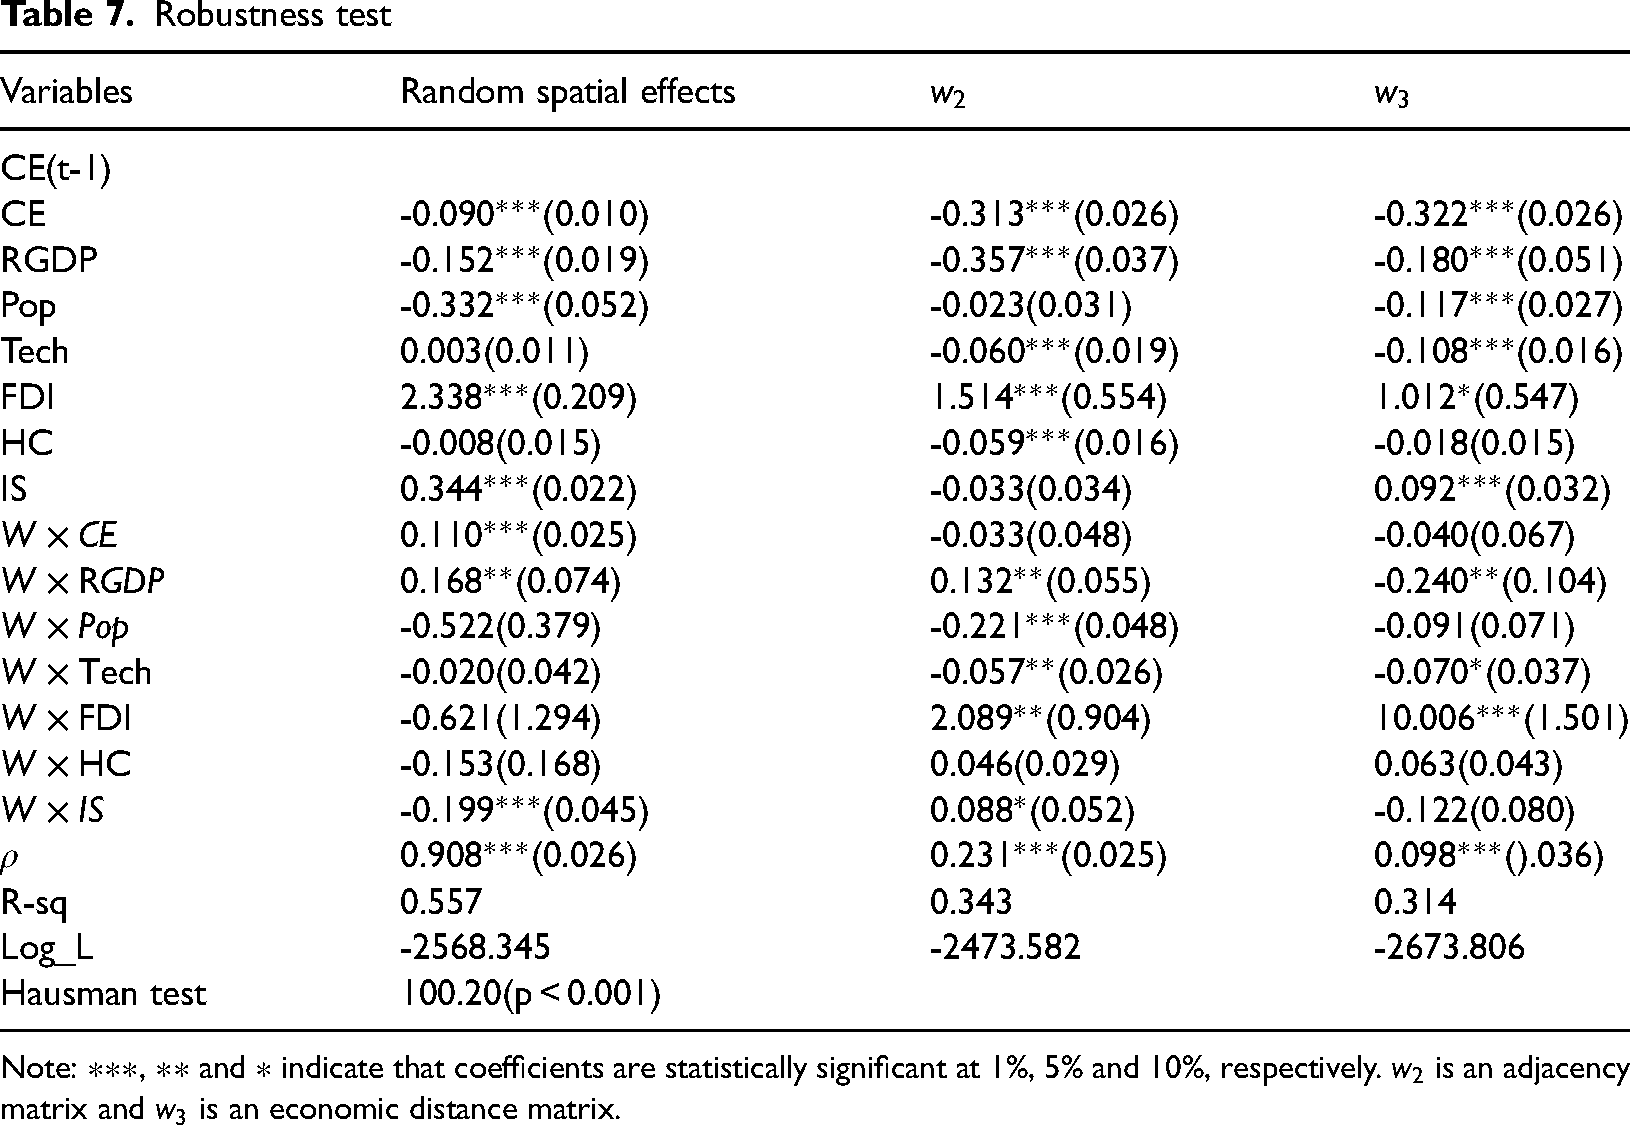
Note: ∗∗∗, ∗∗ and ∗ indicate that coefficients are statistically significant at 1%, 5% and 10%, respectively.
For the whole sample, the direct and indirect effects of CE on UCI were −0.021 and −2.102 at the 1% significance level, respectively. As a new economic development model, the circular economy embodies a strong carbon reduction effect. It not only improves the carbon governance of local cities, but also affects the carbon emissions of neighboring cities. The RGDP, Pop, Tech and HC have a negative impact on UCI of local cities, while FDI has a positive impact on UCI. This means that the idea of blindly attracting foreign investment to achieve high economic growth has become obsolete. Residents have become concerned about the quality of their living environment along with economic development. The level of technology shows a significant negative impact due to the large amount of technology, clean energy development, promoting industrial transformation and upgrading, and improving carbon governance. RGDP, Pop and IS have a significant negative impact. This suggests that increasing RGDP, Pop and IS in neighboring cities can reduce the carbon intensity of local cities. In the eastern cities, the direct effect of CE is −0.278 at the 1% significance level. The indirect effect is 0.221, which is not significant. In central cities, CE reflects significant direct and indirect effects (−0.440 and −0.430). In the western cities, the direct effect and indirect effect of CE were −0.115 and −0.925 at the 1% significance level. It can be seen that the effect of circular economy is different between different regions.
In Table 7, we provide a random effects model, an adjacency matrix, and an economic distance matrix to test the stability of the regression findings. It can be seen that the results are consistent with those in Table 2, which suggests that our regression results are plausible.
Discussion
Our study makes several important contributions to the existing literature. Many scholars have focused on the connotation and measurement of the circular economy, while few have explored the effects of the circular economy with econometric analysis. Therefore, this paper explores the relationship between circular economy and carbon emissions from an urban perspective. First, it was found that for the whole sample, CE not only improves the carbon governance of local cities, but also affects the carbon intensity of neighboring cities. This is similar to the finding of Cui and Zhang, 51 who found that the circular economy has a positive impact on carbon production efficiency and contribute to carbon emission reduction. One possible reason is that the circular economy achieves low consumption, low emission and efficient economic development of cities through the utilization and recycling of resources, such as clean energy, green technology, industrial restructuring and ecological agriculture construction. The direct and indirect effects of the circular economy are complementary and both of them have a greater impact on carbon emissions. It also indicates that circular economy is an effective economic development model to achieve the goal of sustainable development.
Second, we divided the sample cities by geographical location into eastern, central and western cities. It was found that in the eastern cities, CE has a significant negative direct effect, while the indirect effect is not significant. On one hand, the negative direct effect suggests that CE facilitates urban carbon reduction, which is similar to Xue et al. 8 who found that ecological agriculture can reduce carbon intensity, we extend this finding to circular economy. One possible explanation is that the eastern region is the most market-oriented region in China, and the integration of various resources promotes efficient and low-energy output of the circular economy, which in turn reduces carbon intensity. On the other hand, the insignificant indirect effects suggest that the impact of CE is not meaningful for the carbon intensity of neighboring cities. One possible reason is that the regulatory pressure is serous in the east, 52 such as the presence of five carbon trading pilots (out of seven in the whole country) and some low-carbon city pilots. These factors are likely to promote firms to relocate to neighboring cities to avoid the strong environmental pressures. Therefore, the impact of circular economy is not significant on carbon emissions in neighboring cities. These facts suggest that the government should focus on regional coordinated development and give full play the role of market economy. Third, in the central cities, it was found that both the direct and indirect effects of CE are significantly negative. In terms of the spatial distribution of carbon intensity, the L-L shape gradually spread to the central and western regions from 2009 to 2018, and high energy-consuming and high-polluting enterprises moved from the east to the central, leading to a gradual increase of carbon emissions in central cities. 53 Moreover, the economic development of central cities is more balanced, and the circular economy breaks down regional market barriers, and plays an optimal role. 54 Fourth, in western cities, both direct and indirect effects of CE are significantly negative. One possible explanation is that the influx of market elements, technology and resources under the national "Western Development" policy has led to the initial formation of a circular economy in economically backward western cities. 55 Western cities have relatively low carbon emissions and better ecological environment, and the circular economy has the impact of low carbon emission reduction. Finally, it was found that the impact of circular economy decreases from the central, eastern to western cities. It may be because the eastern and central cities have high marketability and developed various factors (infrastructure, technology, and resources), reflecting the strength of circular economy. 56 In contrast, western cities fall behind in economic development, where the circular economy shows a weaker effect. Eastern cities are mainly dominated by low-carbon industries such as finance, service and light industry, and circular economy is less effective in reducing carbon emissions. 57 On the contrary, high energy-consuming and high-emission industries are clustered in the central region, where the circular economy embodies a better effect. 58
In general, circular economy is an effective tool to achieve the goal of carbon emission reduction. The circular economy shows great potential for carbon reduction in local cities, while the spillover effects of the circular economy vary in different regions. This suggests that the imbalance of development between cities leads to unbalanced circular economy, which in turn affects the goal of achieving carbon neutrality in the whole region. 59 This requires the central government and local governments to fully understand this point and adjust their strategies on time to coordinate balanced development to achieve the goal of carbon neutrality nationwide.
Conclusions and policy implications
The circular economy is taken as an important economic model for achieving sustainable development. Previous investigations have focused on a single sector, a single city, or circular economy measurements, but rarely explored the impact of the circular economy on urban carbon emissions. 60 In this study, urban carbon emissions were measured and the spatial distribution of carbon emissions by using the high-resolution carbon emission data. In addition, we quantified the urban circular economy using a super-efficiency SBM-DEA model and the impact of the circular economy on carbon emissions was analyzed using panel data of 285 Chinese cities from 2009–2018.
First, the urban carbon intensity showed an upward trend from 2009–2018, and a spatial distribution in each city. The Moran I index is all positive, reflecting a positive spatial correlation. Most cities are clustered in the H-H and L-L types. The L-L type indicates a gradual increase in the quantity of cities with lower carbon intensity due to the influence of neighboring cities, and it spreads from the eastern coastal region to the central and western regions. The H-H type shows a movement from the large coal provinces in the central and northern region to the northeast, which indicates that the northeast region is still characterized by high consumption and high emissions as a heavy industrial area. 61 Second, there is regional heterogeneity in the impact of the circular economy. In general, the circular economy has a significant dampening effect on carbon intensity not only in local cities but also in neighboring cities. In the eastern region, the circular economy only has a significant negative impact on the carbon intensity of local cities. In the central and western regions, the circular economy has a negative impact on the carbon intensity of both local and neighboring cities. The stability of the results was tested with an adjacency matrix and economic distance matrix.
Based on the above conclusions, the following policy recommendations are put forward from the perspective of circular economy and carbon governance. Firstly, different cities should consider their characteristics and promote the construction of circular economy. For the eastern cities, not only focus on the circular economy construction, it is also important to break down regional market barriers and achieve economic integration, thus improving the resource recycling efficiency. For the central and western cities, the construction of infrastructure should be increased to complement the circular economy strategy, such as high-speed rail, highways, aviation and digital technology. In addition, the migration of high-consumption, high-emission enterprises to the central and western cities has not only brought rapid economic development, but also led to high carbon emissions. While admitting these enterprises, the central and western cities should increase the use of clean energy and absorb green technologies from the eastern regions to promote industrial transformation and upgrading and reduce carbon emissions. Although the circular economy benefits from market-driven, the government is needed to promote the circular economy construction. The government should take into account the characteristics of the central and western regions and increase cooperation between cities in the eastern, central and western regions to achieve coordinated development. For example, measures include encouraging the central and western regions to introduce scientific and technological achievements of the eastern region, encouraging the central and western regions to absorb the experience of the advanced ecological economy construction in the east, and increasing one-to-one support (eastern cities to central and western cities).
There are also some limitations in this paper. Firstly, the dynamic impacts of the circular economy has not been captured due to the availability of data. Secondly, not only considered the impact of the circular economy under regional heterogeneity, urban heterogeneity also needs to be taken into account, such as city size, and urban resource endowment. Thirdly, the pathways of the circular economy are worth exploring, such as innovation, industrial structure, and resource consumption structure. The impacts of the circular economy will be further explored in future research.
Footnotes
Declaration of conflicting interests
The author(s) declared no potential conflicts of interest with respect to the research, authorship, and/or publication of this article.
Funding
The author(s) received no financial support for the research, authorship, and/or publication of this article