
Abstract
This paper aims to investigate the impact of social, economic, and political variables on per capita ecological footprint consumption in the NEXT Eleven economies over the period 1984- 2018. The study utilized the dynamic heterogeneous panel estimators of Cross-Sectionally Augmented Auto-regressive Distributive Lag (CS-ARDL) along with the estimator with a multifactor error structure. The study also estimated the cross-Sectionally augmented distributed lag (CS-DL) model while for robustness check the augmented mean group (AMG) and cross-Sectionally augmented error correction method (CS-ECM) is also considered. The study finding maintains that the impact of GDP per capita, multifaceted phenomena of financial development, and military expenditure is positive and significant suggesting that a unit increase in these variables deteriorates the environment in the NEXT Eleven economies. In contrast, higher life expectancy and government stability improve the environment in the long run. The findings of the study suggest that eco-friendly technologies to be used in the production process, as well as projects using outdated technologies, should be discouraged along with the assurance of government stability and reduction of military expenditure in the NEXT Eleven economies.
Keywords
Introduction
It is since the 1970s when the human demand for the quantity of nature needed to support the economy starts exceeding its supply. 1 The excess demand by a human for nature creates extra pressure which leads to the overuse of natural resources. This overuse of natural resources causes changes in land use, extraction of resources for rent-seeking purposes, deforestation and overfishing leading to depletion of resources, over pollution due to unnecessary use of natural resources and as a result disturbing the life of flora and fauna. 2 The most dangerous is the impact of unwanted environmental changes on marginalized segments of society, who are more vulnerable to climate change. These extreme changes in climate due to excessive use of nature transform into the shape of water shortages, famine, and floods among others in developing countries. 3
The tremendous economic growth of the NEXT Eleven economies 1 in the late 1990s was due to the transition of these economies from agriculture to service and industrial base economies along with the bundle of natural resources. Nevertheless, the improvement in the economic situation of these countries is at the cost of environmental degradation such as poor quality of air, water, and land, the rapid growth in urbanization, and population. The ecological management in these economies is negatively impacted because of the race for economic growth in these economies. The Carbon emissions (CO2) due to high energy consumption in the process of industrial production in these countries are very high which poses a threat to the natural environment of the economies.
The environmental economist is always warning the ever-increasing economies about the ecological cost of rapid economic growth. The geometric growth in the CO2 emissions caused by industrialization has immense side effects 2 stemming from the release of harmful gases. According to 4 and, 5 the extreme changes in climate due to the high release of harmful gases increase the frequency of health-related issues for the poor. According to the United Nations report, (1999–00), 80% of the world's diseases among the poorest 20% of the population are caused by polluted water, air, and land because of rapid industrialization.
Therefore to protect the environment of these economies (i.e., conserve/sustain their natural capital) so that the emissions of greenhouse gas (i.e., CO2, N2O, and CH4) reduce to their sustainable level, an urgent and optimal policy is the need of the time. Since these economies are now aware of the harmful consequences of environmental degradation at the community and government level, the concern for the countries is now how to achieve high economic growth without putting the environment at risk. Though currently using unsustainable sources of energy, the NEXT-11 countries are in the phase of transition to an environmentally friendly energy system. The current pattern of economic growth trajectory in NEXT-11 requires a huge amount of consumption of fossil fuels which raises concerns about an increased ecological footprint. 6
Besides conventional factors such as financial development, trade openness, CO2 emissions, energy consumption, GDP growth, population growth, urbanization, and technology among others, political and social factors such as, government stability and life expectancy at birth also have a significant long term impact in determining environmental sustainability. According to 7 as opposed to authoritarian regimes environmental protection is given more priority than in the political regime of civil liberties. Empirical studies find mixed results regarding the impact of political and institutional variables on environmental quality. For example, 8 and 9 maintain that developing a country's environment is given more attention in a democratic form of government and hence improved positively. In contrast, studies exist that find that there is no direct association between environmental quality and a democratic form of government 10 and in the worst case, it may negatively influence the environment. 11
The concept behind the positive correlation between higher life expectancy and environmental protection is stemmed from the fact that countries invest more in environmental quality where life expectancy is high or even for the future of their descendants. Moreover, according to 12 how people value the future depends on life expectancy. If life expectancy is high in a particular country, people will value the future more and will invest more in the environment, and the other way round if life expectancy is low. Those who find an opposite relationship between life expectancy and environmental sustainability maintain that the greediness for accumulating more physical and human capital goes side by side with the increase in life expectancy and as a result environmental degradation. 12
A plethora of studies can be found in the recent literature that investigates, in general, the role of environmental emissions on economic development, 13 the role of environmental taxes and technological innovations on the carbon-free economy, 14 the role played by the renewable energy, capital formation, and labor force among others on the economic growth of developed and developing countries, 15 the adverse impact of waste generation on environmental sustainability 16 as well as the role of the environmental regulation policies and industry 4.0 technologies on practices of circular economy.14,17 These all are important papers on environmental sustainability, however, these are related to other aspects of environmental sustainability than an ecological footprint.
Intense research has been done so far in the area of environmental sustainability but uses different methods, different variables, and different groups of sample countries with they tested different research hypotheses and tried to find answers to different research questions. In the context of NEXT-11 countries, very limited studies can be found conducted research in the area of environmental quality/sustainability.6,18–20 Among these studies, only 18 use ecological footprint as dependent variable, while the rest of the three studies utilized CO2 emissions as a measure of environmental degradation. Moreover, 18 investigate the effect of only urbanization, GDP, and energy consumption on ecological footprint. However, this study is aimed to explore the role of social (life expectancy at birth), economic (Growth of GDP per capita, Financial Development Index), and political variables (Military Expenditure as a share of GDP, Government Stability) on ecological footprints which are previously not taken into account in the context of NEXT-11 countries. Also, it is argued that omitting a relevant variable(s) from the model can result in inefficient estimates of parameters. 21 The second main contribution would is the use of second-generation panel data methods. The study utilized the cross-section dependency test of 22 and slope heterogeneity test of 23 as well as the second-generation panel unit root test of. 24 The study utilized the dynamic heterogeneous panel estimators of Cross-Sectionally Augmented Auto-regressive Distributive Lag (CS-ARDL) along with the estimator with a multifactor error structure. The study also estimated the cross-Sectionally augmented distributed lag (CS-DL) model while for robustness check the augmented mean group (AMG) and cross-Sectionally augmented error correction method (CS-ECM) is also considered.
The main objectives of the study are described below:
To investigate the role of economic variables (Growth of GDP per capita, Financial Development Index) on the ecological footprint in the NEXT-11 countries, while utilizing second-generation panel data methods To explore the role of political variables (Military Expenditure as a share of GDP, Government Stability) on the ecological footprint in the NEXT-11 countries, while utilizing second-generation panel data methods To analyze the role of social variables (life expectancy at birth) on the ecological footprint in NEXT-11 countries, while utilizing second-generation panel data methods To draw policy implications for all the stakeholders involved such as environmentalists, donor agencies/consultants, and academics among others to design measures for environmental sustainability and improvement in the standard of living.
The relevant literature regarding the determinants of environmental degradation/sustainability is discussed in Section 2. Section 3 is about the variables, data sources, and econometric methodology used in the study. Similarly, section 4 provides the study results and its discussion while section 5 concludes the study and provides possible policy implications based on study findings.
Literature review
An extensive amount of studies exist that examined the impact of various factors on ecological sustainability. An ecological footprint can be determined from many strands of economic, energy, social, financial, demographic, and political variables. Different studies used a different strand of socio-economic variables as a determinant of ecological sustainability. Also, different studies used different measures of economic, energy, social, demographic, and political variables to determine its relationship with ecological sustainability and come up with different results in terms of magnitude and direction of the relationship. In this section, we tried to summarize the possible various domains of determinants of ecological footprint. We also discuss how this research is different than the already done work in the area of ecological sustainability.
A number of studies have recently been conducted to investigate what determines the sustainability of ecological footprint.25–31 These studies used different determinants of ecological footprint, different econometric methods, and different datasets, as well as the analysis, which has been carried out for the various group of countries. For example,25,26 used CO2 emissions, globalization, and renewable energy for BRICS economies as determinants of the ecological footprint from 1971 to 2016. Moreover, the study utilized Fourier autoregressive distributive lag (F-ARDL) model as a method of data analysis. Besides the existence of a long-run relationship among variables of interest, study findings suggest that environmental suitability is positively associated with renewable energy while negatively associated with globalization.
Similarly, 30 tested the validity of the environmental Kuznets curve hypothesis for China from 1965 to 2016 while utilizing the Fourier autoregressive distributive lag (F-ARDL) model along with a time-varying causality test for data analysis. Results indicate that economic complexity and energy consumption are positively associated with ecological footprint both in the short-run and long-run. In line with25,26,30 analyzes the role of economic complexity along with globalization and renewable and non-renewable energy on the ecological footprint in the USA from 1980 to 2016 while utilizing the co-integration econometric methods. The study find evidence in favor of the inverted U-shaped EKC hypothesis in the USA. Apart from the inverse relationship between environmental degradation and economic complexity as a proxy for economic development, the study also maintains that renewable energy and globalization play a significant role reduction of environmental pollution.
With an objective to investigate the supply-side determinants of environmental degradation, 27 examine the role of energy intensity, natural resource rent along with human capital on load capacity factors which take into account both the demand and side and supply concern of environmental degradation. The study was taken in China from 1981 to 2017 in a dynamic autoregressive distributed lag (ARDL) framework. Results suggest that the load capacity factor is inversely related to the increase in energy intensity, resource rent as well as per capita income while positively related to human capital. Another study by 28 in which he analyzes the role of trade openness, globalization, and renewable energy consumption on CO2 emissions and ecological footprint in China from 1980 to 2016. The study utilized an augmented ARDL approach with structural breaks for data analysis. The study did not find evidence in favor of the EKC hypothesis for China while a U-shaped relationship was found between income and environmental pollution (both CO2 emissions and ecological footprint). Moreover, it was found that human capital does not drive environmental pollution in the long run while trade openness and globalization do increase environmental pollution. Does natural resource abundance drive environmental pollution i.e., CO2 emissions and ecological footprint? This research question has been tested by, 29 in a panel context for the top ten countries with the largest ecological footprint. The study employed an estimator robust to cross-section dependence for parameter estimations. The analysis is carried out from 1992 to 2016 where results show that the variables under consideration are co-integrated. Results maintain that environmental quality is reduced by natural resource abundance while the increase in human development and renewable energy consumption improve environmental quality. For more reading on sustainable development through technological revolution, sustainability by determining the linkages between renewable energy source, transportation infrastructure and economic growth as well as sustainability through efficient use of energy, the prominent work include but not limited to32–34
Little attention has been given to the socio-political determinants of ecological sustainability in the quantitative empirical literature that investigate the relationship between environmental sustainability and its determinants. The studies that explored the determinants of ecological footprint for the NEXT Eleven economies so far used non-political factors in their studies. For example, 35 examine the role of globalization in determining ecological sustainability for 146 countries including the NEXT Eleven economies. Another study by 36 for 139 countries examined the impact of three proxies of financial development such as domestic credit to the private sector by banks, domestic credit to the private sector, and domestic credit provided by the financial sector considerably improving environmental sustainability. Similarly, 37 captured the environmental quality from four indicators including carbon emission (CO2), ecological footprint (EF), methane emission (CH4), and Nitrous Oxide emission (N2 O), and examined how these are influenced by bio-capacity and human capital in NEXT Eleven economies. The rest of the studies related to NEXT Eleven economies examined the determinants of other environmental quality than an ecological footprint. To our limited knowledge, this would be the first study in the NEXT Eleven countries that would investigate the impact of per capita GDP growth, military expenditure as a share of GDP, financial inclusion index, life expectancy at birth (total years), and government stability on environmental sustainability i.e., ecological footprint.
Conceptual framework/theoretical background
Different theories have different perspectives to explain sources of environmental degradation. The sources of fluctuation in ecological footprint can be explained from the theories related to environmental degradation. The most influential theories that are closely related to ecological footprint include but are not limited to the Treadmill of Production Theory, Ecological Modernization Theory, and Treadmill of Destruction Theory. These are explained in detail below.
The theory of ecological modernization
According to Ecological modernization theory, the possible solution to the environmental problem is the post-industrial modern societies, as it would invest in such production technologies that would be environment friendly. The theory postulates that with the help of government, industry, and civil society green economy can be promoted. Moreover, this theory maintains that for solving environmental problems growth is initially inevitable. According to, 38 the two main pillars for environmental sustainability are technological development and economic growth; therefore it is considered the main component of the solution to problems of the environment. According to 39 ecological modernization is a social theory. This is so because this theory with the help of political commitment applies the private eco-efficiencies and overall environmental reforms to the civil society, and state-society synergy. However, what is crucial in the theory is that increases efficiency in production so that fewer inputs are used.
The theory of treadmill of production
The argument behind the Treadmill of production theory is that with limited resources output cannot be expanded but at the cost of environmental degradation. The prime motive of businessmen is to accumulate more capital and earn more profit; therefore capitalists find ways and means to expand their production capacity at any cost One argument that is totally in contrast to the ecological modernization theory is that economic growth and technological development is not a solution to environmental problems because according to the treadmill of production theory higher technological advancement and economic growth will generate more investment and higher demand. The result will be depletion of resources and which causes environmental degradation.40,41
The theory of treadmill of destruction
This theory specifically focuses on the effects of militarism on the environment. Ecological impacts are produced not only from military institutions, behaviors, and technologies; the harmful impacts to the environment can also be sourced from warfare. 42 To sustain the overall infrastructure of the country during armed conflict, a handful amount of non-renewable energy is consumed. 43 The resulting greenhouse gas emissions in response to the consumption of fossil fuels in a bulk during warfare are the main argument behind the treadmill of destruction theory. Moreover, according to this theory warfare encourage military weaponry together with military campaigns. Accordingly, enormous amounts of fossil and nuclear fuels are consumed in planes, tanks, and ships. As a result the chemical contamination of ecosystems and devastation of landscapes. 44
Methodology
Description of variables and model specification
The basic aim of this study is to investigate the determinants of per capita ecological footprint in the NEXT Eleven countries in a panel data context utilizing the CS-ARDL econometric method. The ecological footprint measures total environmental impact and are directly obtained from the Global Footprint Network. The ecological footprint is the net measure of the nature that we have (the difference between what we have and what we have used). The ecological “footprint measures demand on nature, which results from specific human activities” (Global Footprint Network, 2006). The relation of military expenditure as a share of GDP with the ecological footprint is negative because advancement in the military is linked with geopolitics and domestic pressures which in turn generate various forms of environmental degradation. Therefore, the treadmill of destruction theory weakens the concern for environmental protection. In this paper, the level of economic development is represented by the GDP per capita. This has also negative relation to environmental sustainability as more economic development means more production and more production means more natural resources are used in the production process.
Following, 45 the financial development index is the matrix of financial system characteristics. This measure of financial development is defined as a combination of depth, access, stability, and efficiency of financial markets. The link between financial developments with the improvement of environmental quality is through the attraction of environmental-friendly projects. In contrast, environmental degradation increases when the inflow of foreign direct investment increases as a result of a well-developed financial system. 46 Life expectancy at birth is the average number of years a newborn can expect to live, with the prevailing death rates. This average number of years can increase or decrease depending on the rate of depletion of the environment. We are growing our global economy to sustain our lifestyles and increasing longevity at the expense of future generations. One of the components in the construction of the human development index is the life expectancy at birth. According to the World Health Organization (2007) ranking of countries for HDI, failed states (low ranking of HDI) are the least transparent with the most perceived corruption for extracting natural resources. They have relatively small ecological footprints and small ecological reserves. These countries are involved in conflicts over natural resources with forces of globalization.
The ability of the government to stay in office for a due time along with to carry out its declared program(s) is termed as government stability. The process and governance structure of the environment can put pressure on the ecological footprint through standards, regulation, and management as well as legal and political institutions.47,48 The following indicators represent the performance of the government institutions as well as their effectiveness and capacity. These indicators include but are not limited to law and order, corruption, bureaucratic quality, democratic accountability, government stability, along with regime type.The respect for eco-rights may reduce and as a result, the ecological pressure may increase in countries where there are high external or internal conflicts which in turn weakens the institutions, loss of productivity, and destroyed infrastructure.
Taking insights from the literature, in our empirical model, the dependent variable i.e., ecological footprint is determined by a combination of socio-economic and political variables. The algebraic expression is as follows:

Data and econometric techniques used in the study
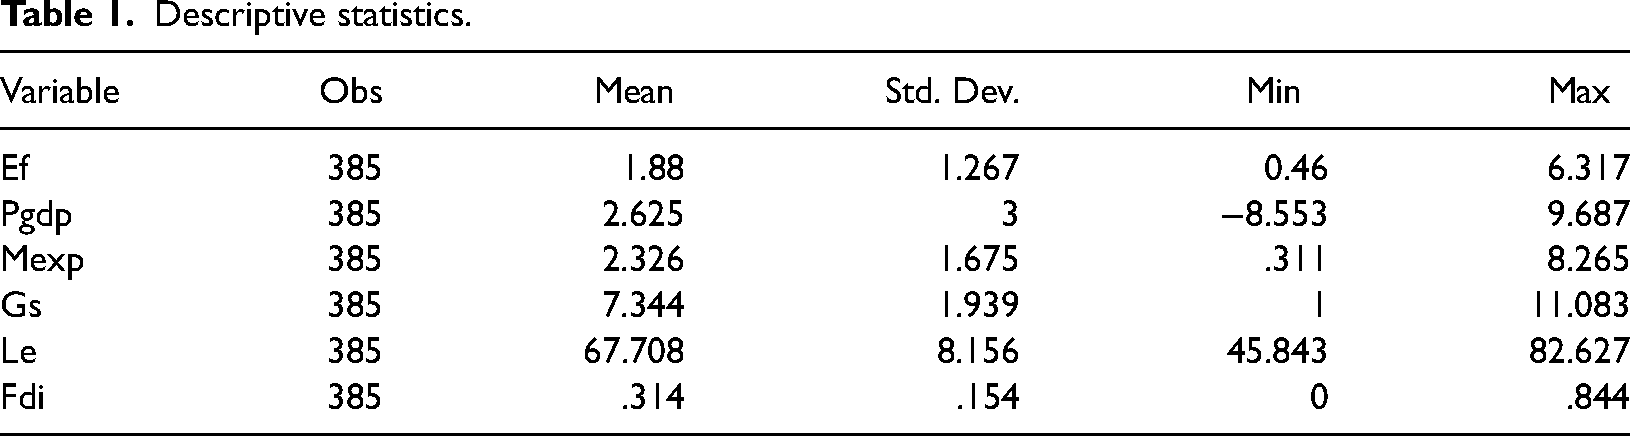
The main focus of our study is to investigate the long-run effects of economic, social, and political factors on per capita ecological footprint consumption in the NEXT Eleven economies. For this purpose, we used balanced panel data of 11 economies from 1984 to 2018. The selection of this period is based on data availability for each variable. Different variables are extracted from different sources. The ecological footprint data is extracted from the global footprint network, per capita GDP growth and military expenditure as a share of GDP from the World Bank, government stability from the International Country Risk Guide (ICRG), life expectancy at birth (total years) from World Development Indicators (WDI), Financial Development Index from International Monetary Fund (IMF). Table 1 below shows that 5 explanatory variables are used as determinants of ecological footprint.
Descriptive statistics.
Estimators and empirical framework
Before testing co-integration and dynamic analysis, it is necessary to test for slope heterogeneity and the cross-sectional dependence (CD) in the data. The results of the cross-section dependence test can help us to identify which generation of unit root test we are supposed to use in our analysis. Some factors that cause cross-sectional dependence include unanticipated oil price shock, integration of economic and financial markets across countries, global financial crises, and the correlation among residuals as well as some unobserved omitted common factors. The issue of cross-section dependency needs to be taken into account because it can cause many problems such as spurious results, size distortion, and biasedness in stationarity results during analysis.49,50 For this purpose, the study utilizes the 22 cross-sectional dependency test
In the context of seemingly unrelated regression estimation,
22
has proposed the following test statistic for the null of cross-section independence;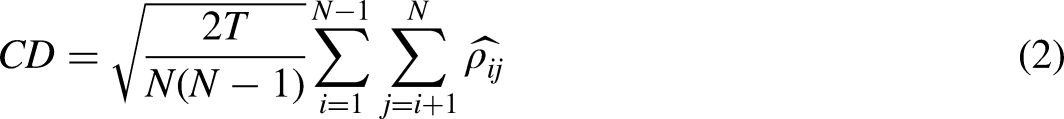
Another potential problem in the panel data is the problem of slope heterogeneity. This problem can cause inconsistencies in panel estimators as the conventional panel estimator assumes that slopes are humongous. Therefore, it is important to check the slope heterogeneity before the final estimation of the model. Keeping in view the aforementioned reason the given study employs the
23
test for testing slope heterogeneity. The two test statistics i.e., delta tilde (Δ˜HS) and adjusted delta tilde (Δ˜AHS) of
23
slope heterogeneity test are given as follows:

The specification of the CIPS test is as follows:


The CS-ARDL approach
To examine the long-run impact of economic, social, and political variables on per capita ecological footprint consumption, this study utilized the dynamic heterogeneous panel estimator's approach of the autoregressive distributive lag (ARDL) model. The panel ARDL specification with lag order of 
Where the time series and cross-sectional units are represented respectively by 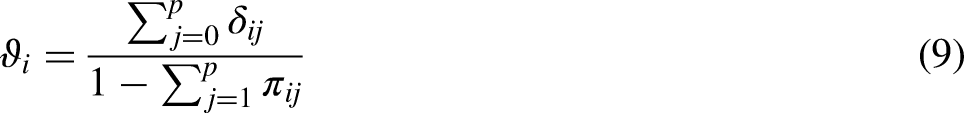

Since our cross-sections i.e., N and period i.e., T are quite large, therefore estimating a heterogeneous panel through different approaches is an obvious option, where approaches differ in terms of the degree of heterogeneity. The model parameters can be estimated either through the pooled mean group, dynamic fixed effect, or through the mean group. The slope coefficients and intercepts both are considered homogeneous in the first approach, while only intercepts vary across groups in the second approach. The estimators of these approaches produce unreliable results in case the impact of regressors is heterogeneous. As a result, the mean group (MG) estimator introduced by 52 is used to account for heterogeneity in the slopes and intercepts.
However, the aforementioned three approaches may also produce biased results because all of these three approaches assume that cross-sections are independent of each other which is not always true. Therefore, if the cross-sections are dependent it may produce a biased result. Nevertheless, some approaches take into account the issue of cross-sectional dependence in the estimation of parameters such as the cross-Sectionally augmented ARDL (CS-ARDL), the cross-Sectionally augmented distributed lag (CS-DL) of, 53 the common correlated effects mean group (CCEMG) estimator of 24 and the augmented mean group (AMG) estimation of. 54
The common correlated effects mean group (CCEMG) estimator presented by
24
is algebraically expressed as follows:
The CS-ARDL approach is used to investigate the determinants of environmental sustainability in a dynamic manner where both short and long-run parameters of the models are estimated. This econometric approach was proposed by.
55
The performance of this test is robust and efficient as compared to other panel data models such as mean group, pooled mean group, augmented mean group, and common correlated effect mean group
18
as explained above. The CS-ARDL model in its general form is expressed as follows:
The long-run estimators (unit specific for CS-ARDL and mean group for CCEMG) of CS-ARDL and CCEMG approaches are given as follows: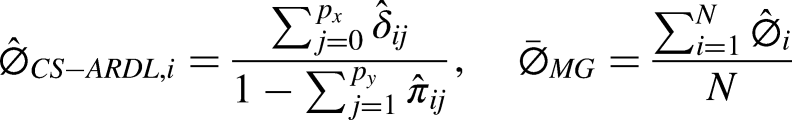
Therefore to overcome these issues of the CS-ARDL model,
53
proposed the distributed lag (CS-DL) version of the ARDL model as follows:
Both CS-ARDL and CS-DL also have some drawbacks as pointed out by. 53 The long-run effects of CS-DL are consistent only if there is no feedback effect of lagged values of the dependent variable to the explanatory variables. Also, consistent estimates of the CS-ARDL are sensitive to the selection of the cross-sectional lags. On the other hand, the estimates of the CS-DL are suitable in case of reasonably large time dimension i.e., T.
The AMG estimate according to
54
is given as follows:
The error correction approach is also used in this paper to estimate the long-run impacts of social, economic, and political variables on per capita ecological footprint consumption in the NEXT Eleven economies from 1984 − 2018.
The transformation of equation (8) according to
56
is as follows:
Both the CS-DL approach and error correction model give direct estimates of the group-specific long-run effect, i.e., 
Panel causality test
The causal relationship between variables is tested through the
57
test which is useful no matter whether the T is larger or smaller than N. Also this test provides efficient estimates in the case of the heterogeneous and balanced panel as well as in case of cross-section dependence. Moreover, the test is an extension of the conventional Granger causality test by including the cross-sectional information. The general form of
57
test is algebraically expressed as follows: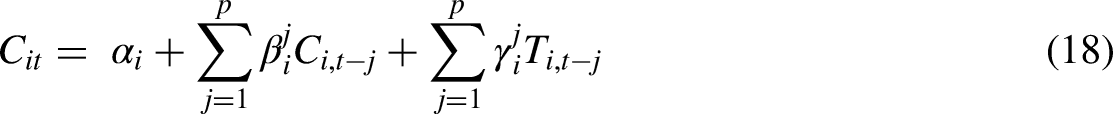
Results and discussions
The basic summary statistics of the variables under-considered are given in table 1 below. It can be seen from the table that the standard deviation is relatively high for le and pgdpg as compared to other variables. This higher standard deviation is also evident from the difference between the max and min value for the said variable.
Before establishing any kind of relationship between variables under consideration, it is pertinent to check whether the panel suffers from slope heterogeneity and cross-sectional dependency problems or not. In this paper, we applied the 23 test of slope heterogeneity and the 22 test of cross-sectional independence. The results of both tests are provided in table 2 below. The upper panel of Table 2 suggests that slope coefficients are heterogeneous while the lower panel of the table indicates that cross-sections are dependent on each other. Cross-sectional dependency implies that any policy change regarding one variable under consideration in any of the NEXT Eleven countries could have implications for changes in other variables in other NEXT-11 countries. In other words, a shock in one variable in one country could have far-reaching effects on other variables in other cross-sectional units58,59
Tests of slope homogeneity and cross-section independence (SCH and CSI).

When cross-sections are dependent and coefficients are heterogeneous then application of the first-generation unit root test is impotent. The best alternative in such a situation is the second generation panel unit root test of the CIPS unit root test.60–62 The results of the second-generation panel unit test are given in table 3, which suggests that some of the variables under consideration are I(0) and some are I(1) which confirms the use of CS-ARDL in our analysis.
Panel unit root test that accounts for cross-section dependence.
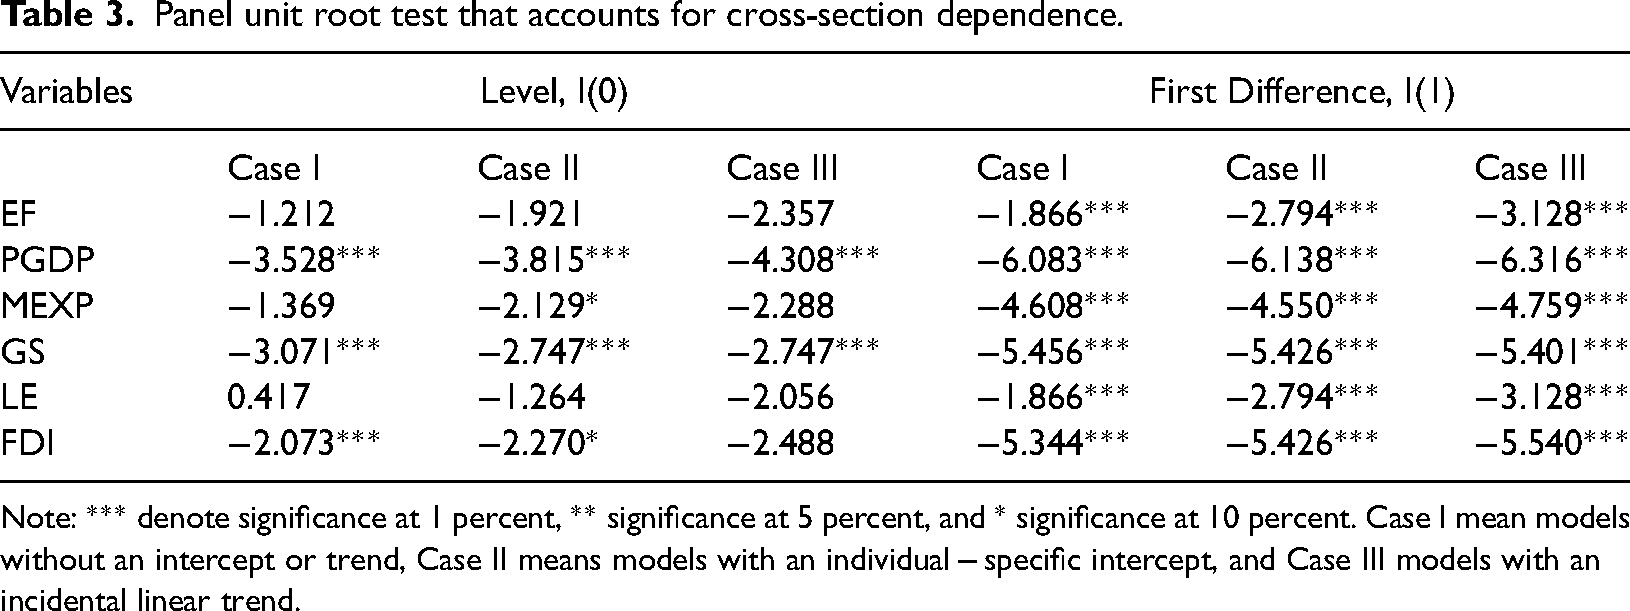
Note: *** denote significance at 1 percent, ** significance at 5 percent, and * significance at 10 percent. Case I mean models without an intercept or trend, Case II means models with an individual − specific intercept, and Case III models with an incidental linear trend.
The estimation results of the standard mean group (MG), pooled mean group (PMG), and dynamic fixed effect (DFE) are summarized in table 4 below. The results come from estimating equation (16). As is evident from the results, economic, social, and political variables have a significant impact on ecological footprint and so the results are according to the theory. The above results become invalid if there is cross-sectional dependence in the error term. The same is tested through the cross-section dependence test of, 22 which is based on the residual pairwise correlation coefficients. The test results show that the null hypothesis of cross-section independence is rejected for all three models. Since the cross-sections are dependent on each other as highlighted by the CD test, therefore the standard mean group estimators are not valid. In the next sections, we estimate the model parameters through CCEMG, CS-DL, CS-ARDL, and CS-ECM which take into account the cross-sectional dependency issue.
Results based on PMG, mg, and DFE.
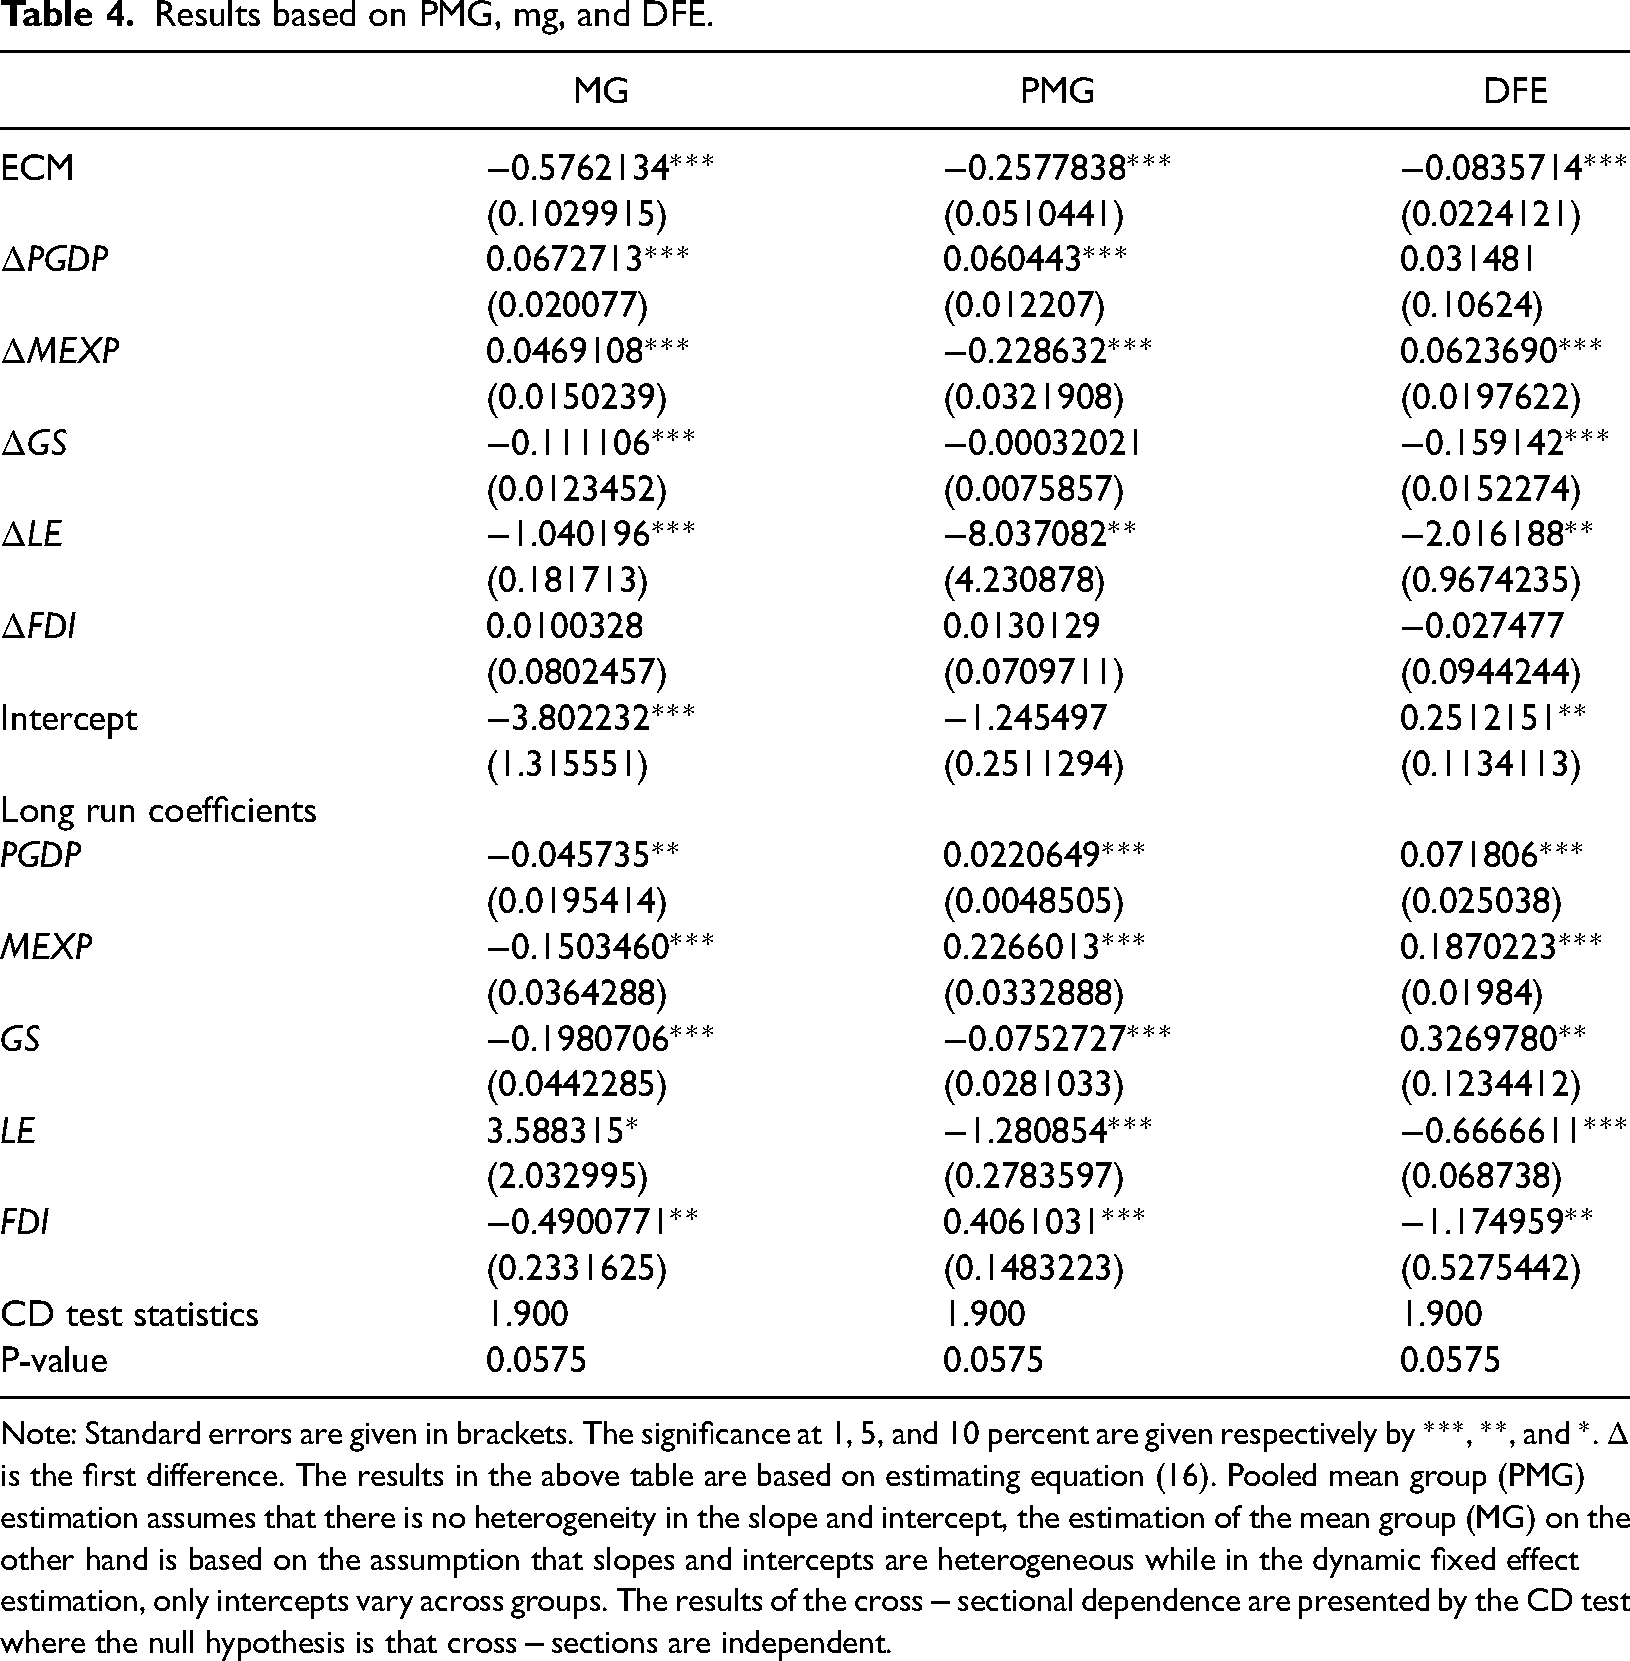
Note: Standard errors are given in brackets. The significance at 1, 5, and 10 percent are given respectively by ***, **, and *.
The results of CCEMG and CS-ARDL as given in equations (11) and (12) are presented in this section. The outlier robust method of 63 is used to construct the coefficients and standard error in the CCEMG estimator. To address the issue of cross-sectional dependence and control for unobserved common factors, cross-section averages are added to the model estimation. According to, 55 the implications of static CCEMG are misleading in a case where there are lagged dependent variables in the model. This can cause an endogeneity problem in the model where consistent results cannot be achieved by adding simple contemporaneous cross-sectional averages. The dynamic CCE estimator can address this shortcoming by adding a sufficient number of lags of cross-section averages. However, according to, 53 the generalization of the DCCE estimator can lead us to, the CS-ARDL estimator. 64
Mutual interdependencies among countries have increased as a result of political and growing economic interest. 65 The dynamic (both short run and long run) relationship between variables is assessed by employing the CS-ARDL method where the results are given in Table 5 below.
Results based on CCEMG and cs-ARDL.
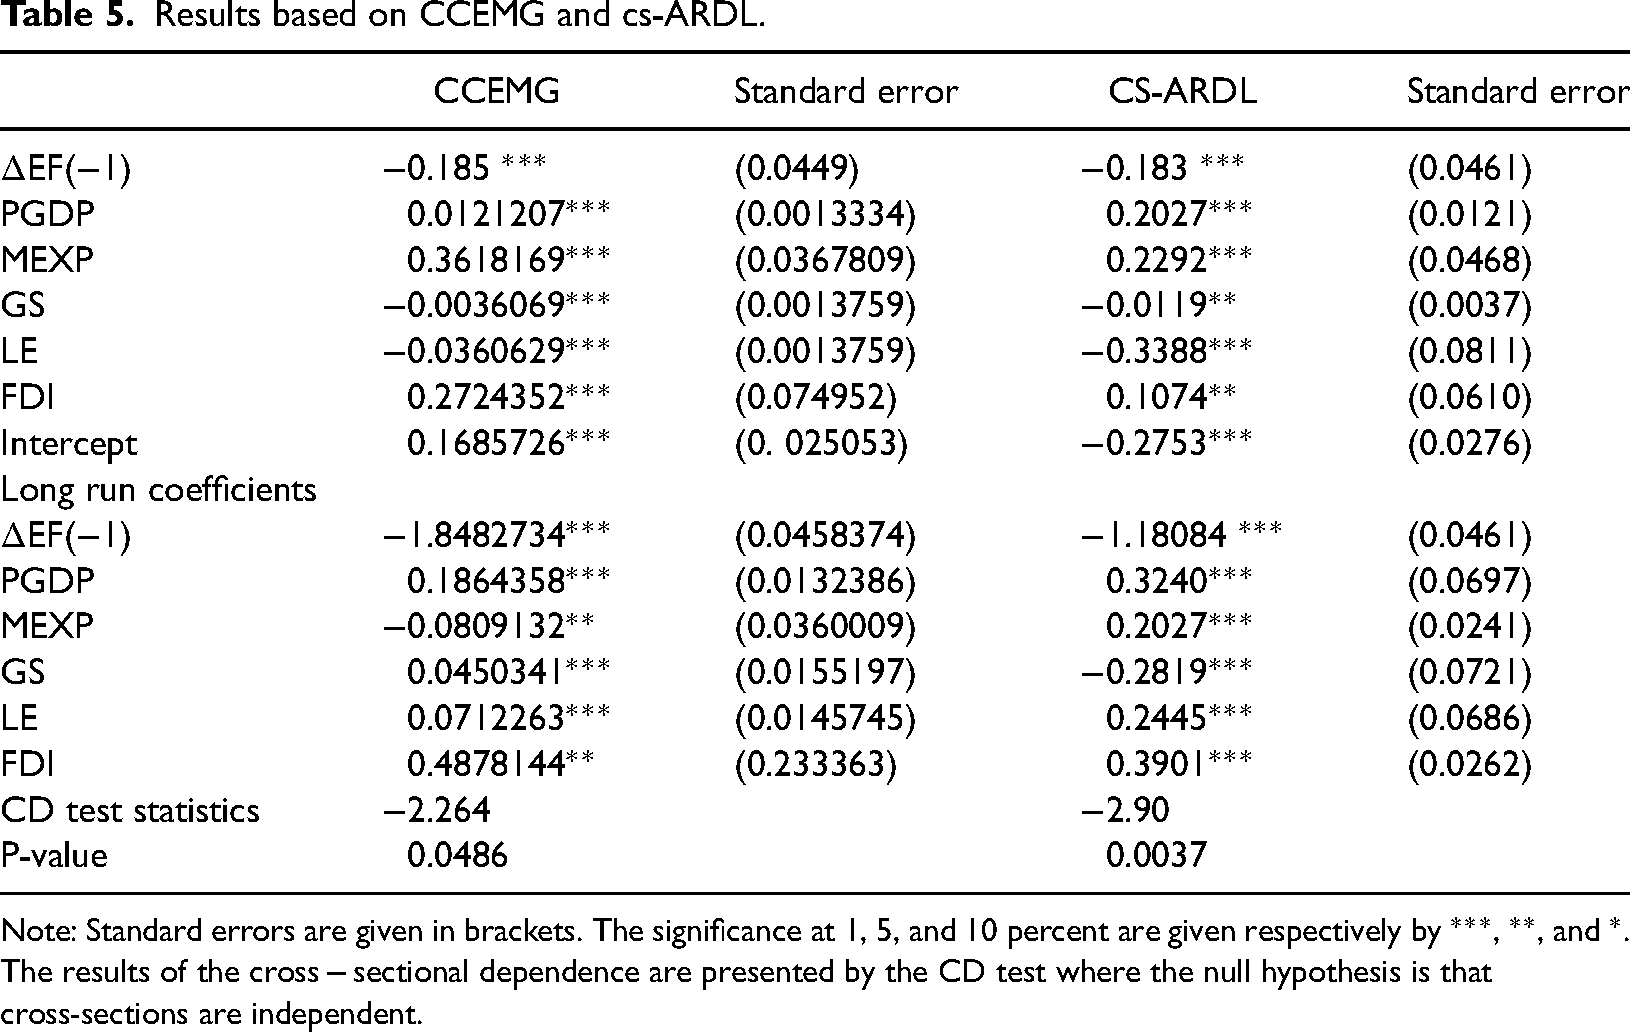
Note: Standard errors are given in brackets. The significance at 1, 5, and 10 percent are given respectively by ***, **, and *. The results of the cross − sectional dependence are presented by the CD test where the null hypothesis is that cross-sections are independent.
As far as the impact of GDP per capita on ecological footprint is concerned, the effect is positive and significant. It could also be deduced from the results that the relationship between GDP and environmental degradation is weakened by weak environmental standards and slow economic growth. An increase in ecological footprint in response to an increase in GDP per capita could be because of the use of obsolete technologies in the production process which in turn negatively affect energy efficiency. 46 Our results match with the findings of.66–69
This study used multifaceted phenomena of financial development comprised of financial markets and financial institution development in terms of access, depth, and efficiency. The effect of this variable on environmental quality i.e., ecological footprint could be positive or negative. This happens by reducing CO2 emissions while financing environment-friendly technological innovations. 70 Alternatively, a better and sound financial system is positively associated with improved economic growth which in turn increases CO2 emissions and as a result reduces environmental quality. 71
The results for the financial development show that the estimated coefficient associated with this variable is positive and significant. A stable and efficient financial system means that development and non-development projects are financed easily and so depletion of natural resources at a higher rate. In our case, a 1% increase in financial development in the NEXT Eleven economies could degrade the environment by 0.1074 and 0.3901 in the long run and short run respectively. Our results are consistent with other studies in the literature, they come up with the same positive impact of financial development on the iconological footprint. To name a few includes.14,72–75
The impact of life expectancy at birth on environmental quality could be positive or negative depending on whether the nations are concerned about the future of their descendants or not. The more people are concerned about their longevity i.e., life expectancy at birth, the more they are willing to invest in environmental quality. 76 The opposite case occurs in countries where with the increase in longevity, people start accumulating more human and physical capital which in turn deteriorates the environment. 12 Our empirical results show that the impact of life expectancy n ecological footprint is −0.3388 in the long run, which means that an increase in life expectancy by 1% decreases the per capita ecological consumption by 0.3388%.
Governance, political institution, and their quality play a significant role in environmental management and its regulation. Studies used different indicators to examine the impact of government stability on ecological footprint. In this regard, 77 used governance quality as an indicator of government stability, and 78 use institutional quality index constructed from six indicators including the military in politics, corruption control, government stability, law and order, bureaucracy quality and democratic accountability while 79 use democratic accountability index as an indicator of government stability. All of these indicators in the above studies are negatively associated with an ecological footprint, indicating that environmental quality improves as a result of improvement in government stability. Our results are consistent with these studies, a 1% improvement in government stability leads to −0.0119 and −0.2819 in the short-run and long-run respectively.
Before the introduction of the “treadmill of destruction” theory by Hooks and Smith (2005), the impact of military expenditure on environmental quality was not explored. The theory maintains that the environment is negatively affected by militarism in peacetime as well as in wartime. Our results in this regard maintain that military spending increases ecological footprint in the short-run as well as in the long run which is consistent with the results of.44,80–82 The justification of the findings lies in the fact that the higher the military spending higher the use of resources that generate waste that pollutes the land and water in specific and the environment in general. Also, the productive use of land is restricted because of the excessive use of land for military operations, military bases, and military exercises.
To directly estimate the long-run impact of social, economic, and political determinants on ecological footprint, the CS-DL approach of 53 is used in this section. The same direct long-run impact is also estimated through CS-ECM which takes into consideration the multifactor error structure. The results are provided in table 6 below.
Results based on cs-dl and cs-ECM.
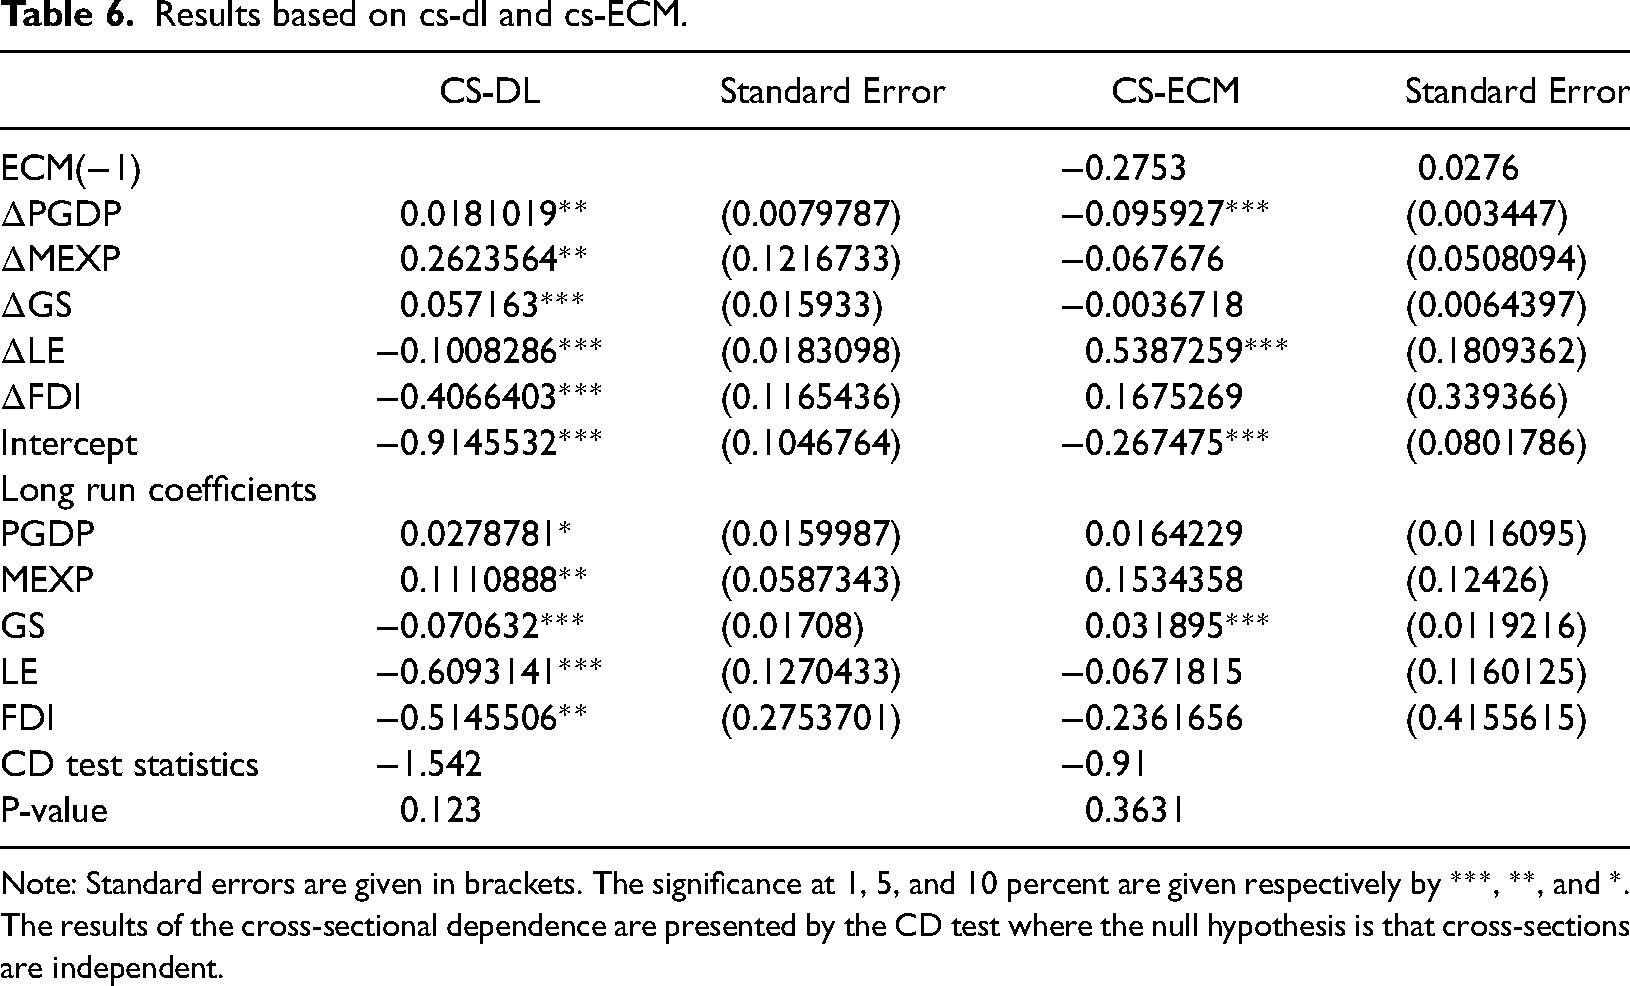
Note: Standard errors are given in brackets. The significance at 1, 5, and 10 percent are given respectively by ***, **, and *. The results of the cross-sectional dependence are presented by the CD test where the null hypothesis is that cross-sections are independent.
The error correction term is the speed of adjustment to equilibrium in the long run if there is disequilibrium in the short run. The value of this term is −0.2753, which means that the dependent variable i.e., ecological footprint establishes equilibrium with a speed of −0.2753 per period. Speaking differently, in case of deviation of the system from the long-run equilibrium path, it is restored automatically speed of −0.2753 per period.
The point of concern here is to compare the estimates of CS-ECM with that of conventional ECM (mean group) given in table 4. The result does not differ significantly with the inclusion of cross-sectional lags in the latter ECM model. In the CS-ECM model, the long-run coefficients are calculated as the ratio of the coefficients of the independent variables over the coefficient of the lagged dependent variable. Therefore, this method could be considered the semi-direct approach as compared to the CS-DL approach to estimate the long-run impacts of the economic, political, and social variables on the ecological footprint in the NEXT Eleven economies. The CS-DL approach on the other hand doesn't include the lagged dependent variable as regressors to estimate the direct long-run effects, and so is considered the most reliable estimation results. The results of this approach are more or less the same as compared to CEEMG, CS-ARDL, and CS-ECM models.
The AMG estimator of 54 is estimated in this section through the estimation of equation (15). Similarly, the outlier robust method of 63 is used to estimate the parameters and standard errors, where the results are summarized in Table 7 below. The long-run estimates of AMG and CCEMG are similar except that the first method uses the common dynamic process to explicitly control for the multifactor error structure while CCEMG includes cross-sectional averages to implicitly handle these factors. The significance of the common dynamic process in table 7 shows that common factors significantly affect the per capita ecological footprint consumption over time in the NEXT Eleven economies. Our results reiterate the results of CS-ARDL. Results in table 7 indicate that a 1% increase in GDP per capita, military expenditure, and financial development index increases ecological footprint by 0.2523, 0.0111, and 0.1440% respectively. Similarly, a 1% increase in government stability and life expectancy at birth decreases ecological footprint by −0.1308 and −0.2217 respectively.
Robustness check: results of augmented mean group (AMG).
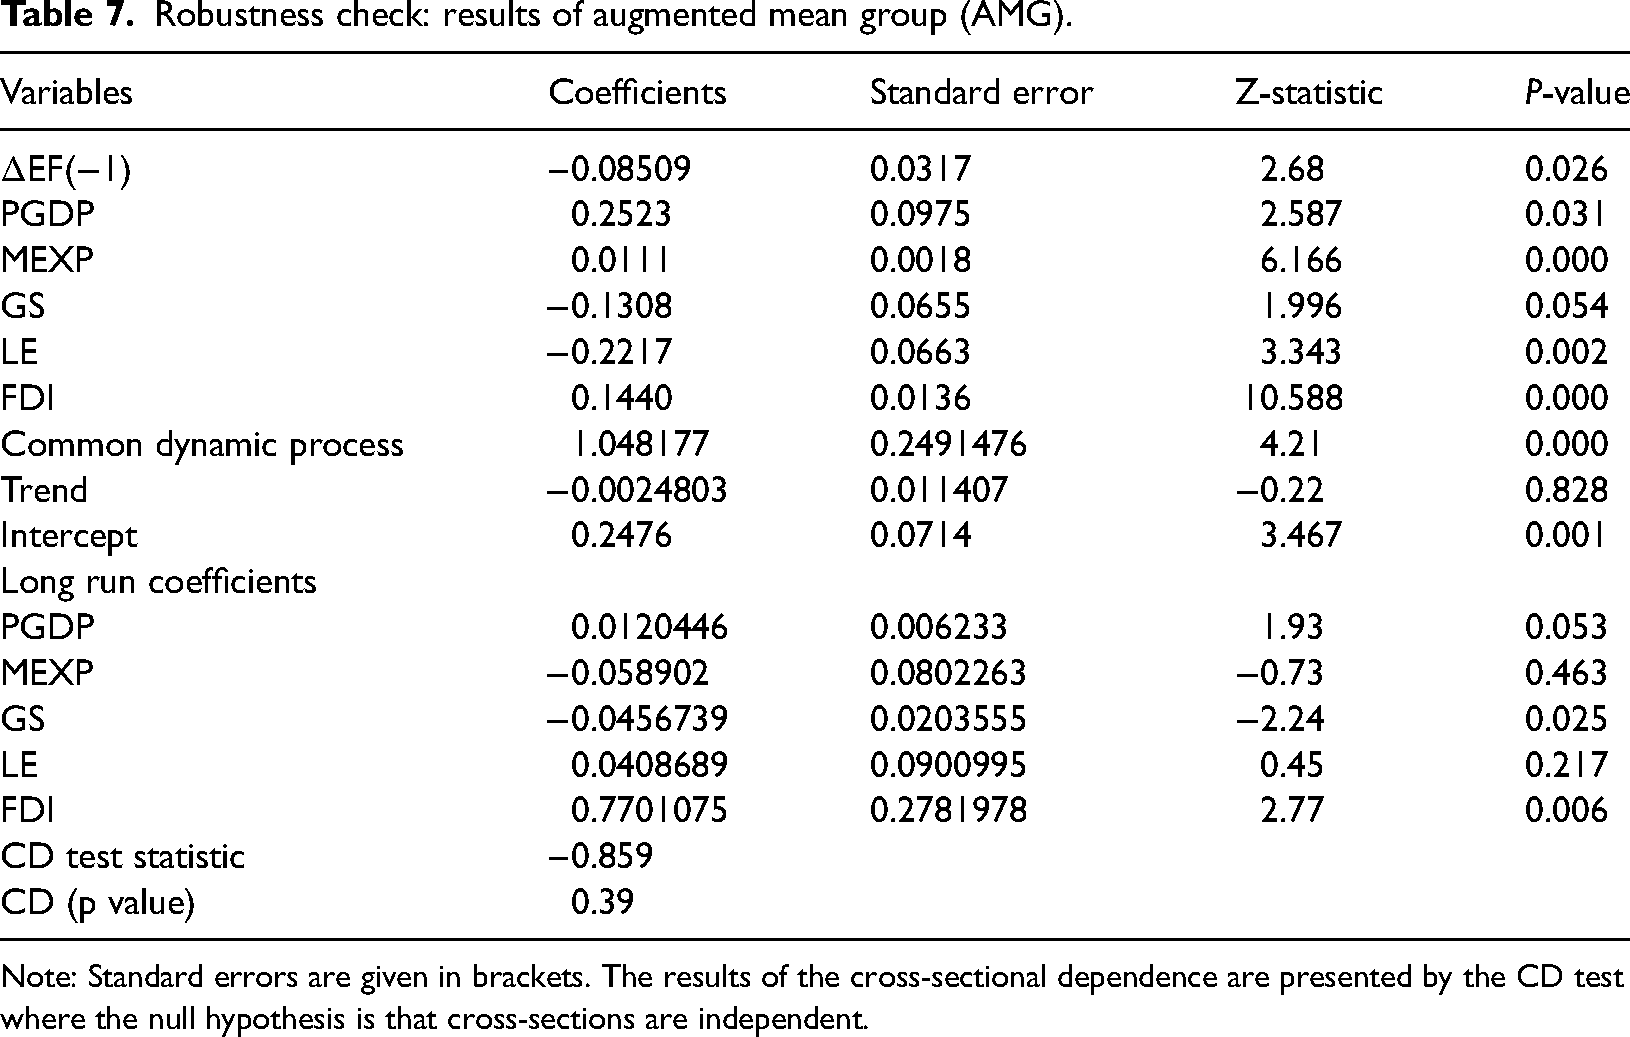
Note: Standard errors are given in brackets. The results of the cross-sectional dependence are presented by the CD test where the null hypothesis is that cross-sections are independent.
Sustainability of environment (i.e., ecological footprint as an indicator) is also been investigated by a number of studies.25–31 These studies used different determinants of ecological footprint, different econometric methods, and different datasets, as well as the analysis, which has been carried out for the various group of countries. For example, 28 found that human capital does not drive environmental pollution in the long run while trade openness and globalization do increase environmental pollution. Similarly, 29 maintain that environmental quality is reduced by natural resource abundance while the increase in human development and renewable energy consumption improve environmental quality.
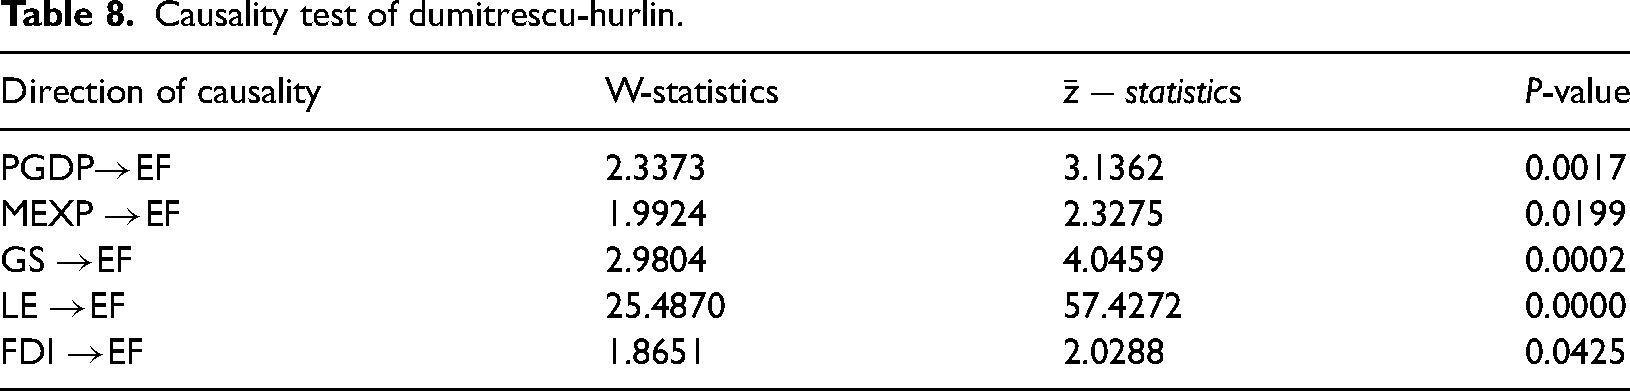
Last but not the least, the causality results of the Dumitrescu–Hurlin causality test are provided in table 8 below. Test result confirms unidirectional causality between variables, which means that any policy changes in independent variables have consequences for the dependent variable which is per capita ecological footprint consumption.
Causality test of dumitrescu-hurlin.
Conclusion and policy suggestions
Conclusion
A plethora of work can be found investigating the relationship between environmental sustainability in terms of ecological footprint and its determinants. However, studies either examined the economic determinates of ecological footprint or social determinants, ignoring the socio-economic and political determinates together in a single study. In the context of NEXT-11 countries, very limited studies can be found conducted research in the area of environmental quality/sustainability, investigating the effect of urbanization, GDP, and energy consumption on ecological footprint among others. However, this study is aimed to explore the role of social (life expectancy at birth), economic (Growth of GDP per capita, Financial Development Index), and political variables (Military Expenditure as a share of GDP, Government Stability) on ecological footprints which are previously not taken into account in the context of NEXT-11 countries. We do this because omitting a relevant variable(s) from the model can result in inefficient estimates of parameters. 21 Therefore, the given study explored the dynamic relationship between ecological footprint and its socio-economic determinants using panel data from the NEXT Eleven economies. As a first-hand test on data, the study used slope heterogeneity and cross-section dependence test to determine which econometric method to be used. Based on the results of these tests, we utilized the CS-ARDL test in our empirical analysis to quantify the relationship between variables. The paper also applied the causality technique to validate the coefficients in the CS-ARDL estimation.
We found that cross-sections are dependent on each and slopes are heterogeneous through slope heterogeneity and cross-section dependency test Results based on Westerlund co-integration test indicate that variables under consideration are correlated in the long run. The impact of GDP per capita on ecological footprint is positive and significant which could be because of the use of obsolete technologies in the production process which in turn negatively affects energy efficiency. The impact of multifaceted phenomena of financial development on environmental quality i.e., ecological footprint is positive and significant. An increase in life expectancy by 1% decreases the per capita ecological consumption by 0.3388%, suggesting that the people are concerned more about their longevity i.e., life expectancy at birth and so they are willing to invest more in environmental quality. It was also found that improvement in government stability leads to improvement in environmental quality. Our results are also consistent with the notion of the treadmill of destruction theory, which maintains that the environment is negatively affected by militarism in peacetime as well as in wartime. This is so because the higher the military spending higher is the use of resources that generate waste that pollutes the land and water in specific and the environment in general.
Policy suggestions
Several implications can be deduced from the findings of this study. First, in line of results of the impact of financial development index on ecological footprint in NEXT Eleven economies, financing of environment related projects should be prioritized based on whether eco-friendly technologies are used in the projects or not. The allocation of funds should be discouraged for those projects where outdated technologies are used. Second, government stability on the political as well as economic front could be ensured by taking on board all the relevant stakeholders and addressing their concerns. Military expenditure could be reduced or at least could be prioritized. In other words military expenditure needs to be regime specific, in wartime it could be increased and vice versa. It is the need of the time to promote awareness campaign for the people to let them know that the secret of long life lie in the conservation of environment. Moreover, government stability plays significant role in environmental management and its regulation. Since our results are in line with these claims, therefore attention could be given to assure political stability in the country. For future research, the analysis could be carried out by adding more countries from different regions of the world. However, if we are concerned about the asymmetric relationship between ecological footprint and its underlying determinants, the Markov-regime switching econometric model needs to be utilized.
Footnotes
Declaration of conflicting interests
The authors declared no potential conflicts of interest with respect to the research, authorship, and/or publication of this article.
Funding
The authors received no financial support for the research, authorship, and/or publication of this article.
Ethical Approval
It is solemnly declare that our work does not contain any type (fully or partially) of human involved, animal involved orother unethical research.