
Abstract
In the context of ecological environment construction, how to create a new development pattern in which environment and economy are coordinated has become an important goal of the Chinese government. From the perspective of the symbiotic development of resource-based industries and non-resource industries, this study discusses the path of green credit optimization of energy consumption structure by using the space Durbin model, based on the panel data from 30 Chinese provinces from 2006 to 2019. The study results are as follows: Both green credit and energy consumption structure have a significant positive spatial correlation. Furthermore, the energy consumption structure of local and adjacent areas is significantly optimized by green credit. Additionally, for non-resource-based regions, although green credit has no spatial spillover, it can significantly improve the local energy consumption structure, while green credit in resource-based regions significantly inhibits the optimization of the energy consumption structure in local and adjacent regions. Finally, from the perspective of the symbiotic development of resource-based industries and non-resource industries, although green credit can significantly improve the local energy consumption structure, it will inhibit the optimization of the energy consumption structure in adjacent areas. Therefore, government departments not only need to implement green credit policies according to local conditions but also actively guide exchanges and cooperation between resource-based industries and non-resource industries. This move promotes the symbiotic development of resource-based industries and non-resource industries and simultaneously improves the utilization efficiency of green credit, and optimizes the energy consumption structure.
Introduction
In the past 40 years, although China has achieved rapid economic growth due to coal consumption as the main energy source, and since the end of 2015, 1 the haze problem in North China began to appear frequently. 2 Large-scale carbon emissions may be the main reason for the formation of smog, and the increasingly serious environmental pollution problem will hinder the sustainable development of China's economy. 3 Therefore, the issue of energy structure and environmental pollution has been paid more and more attention by people.4–7 In order to implement the development concept of green ecology and solve the problem of high carbon emission energy consumption, the Chinese government aims to achieve the carbon peak in 2030 and the carbon neutrality goal in 2060. Optimizing the energy consumption structure is considered one of the paths to achieving this goal. 8 In 2006, the provinces with a low-level energy consumption structure mainly included 14 provinces, including Jiangxi and Shanxi, while the provinces with a high-level energy consumption structure were only five provinces, including Hainan and Shanghai (see Figure 1). Until 2007, the concept of “green credit” was formally proposed by China and piloted in small-scale areas. In 2012, the “Green Credit Guidelines” was officially released, which aim to force banks and other financial institutions to provide loans with lower interest rates to environmentally friendly enterprises through the “carrot and stick” policy and to limit the financing of “three high” enterprises. With the continuous implementation of the policy, China's green credit policy has been gradually improved and has met international standards. 9 At the same time, in addition to such imperative green credit policies, market-based measures such as green fund projects and green project databases are implemented by Chinese local governments through environmental protection investment in order to better support the transformation and upgrading of enterprises. Generally speaking, GC mainly coordinates financial resources among enterprises through differentiated interest rate policies, encourages enterprises to invest in green projects such as energy conservation and emission reduction, and helps banks avoid environmental risks to a certain extent. 10 Although, through unremitting efforts, the number of provinces with advanced ECS in China increased to 13 in 2019, the ECS of RR such as Shanxi has not been improved, and the ECS of individual provinces such as Inner Mongolia is still showing a worsening trend (see Figure 1).
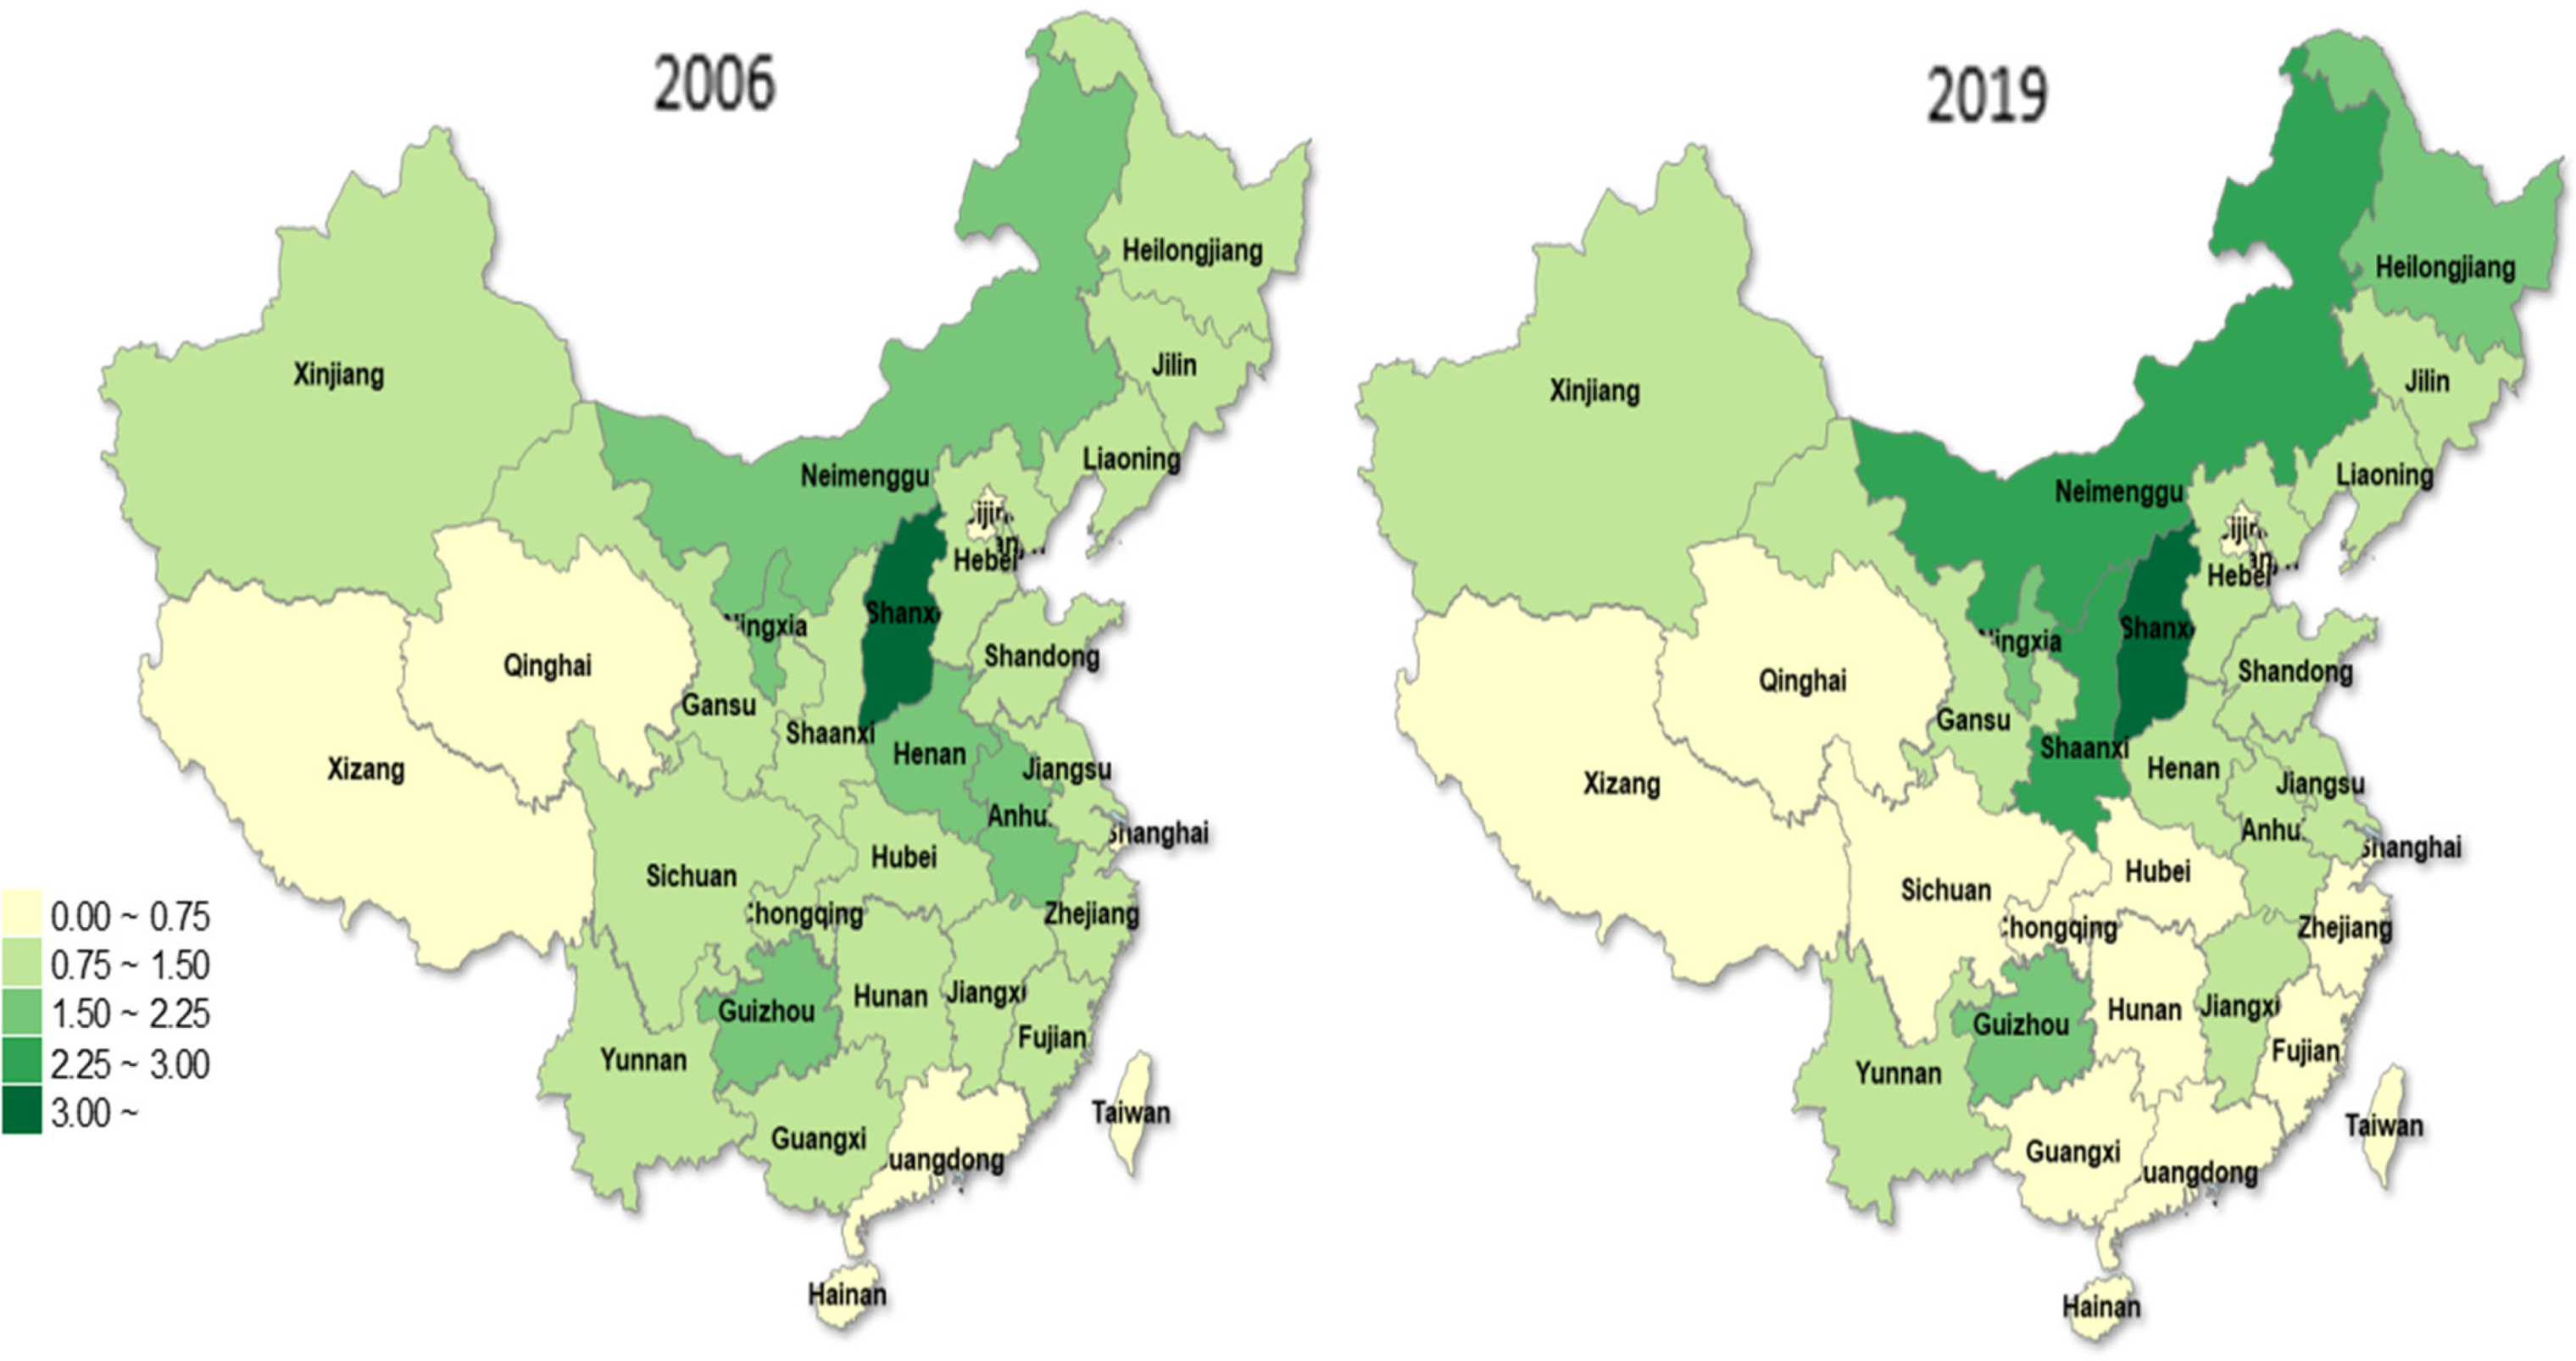
Distribution map of energy consumption structure in China's provinces in 2006 and 2019.
Therefore, the current GC as a whole needs further discussion. Meanwhile, due to the long-standing resource-dependent development model, China's RR has gradually fallen into the “resource curse” trap. Therefore, the current GC may not reach the scale to promote ECS improvement in such regions. However, the “industrial symbiosis" 1 proposed by Frosch(1989) can better resolve the predicament that ECS cannot be effectively improved by GC in some areas of China. The symbiotic development of RI and NRI will improve the utilization efficiency of GC through the advantages of resource integration, technology sharing and information disclosure, thereby optimizing the ECS. Therefore, this study mainly discusses the relationship between GC and ECS from the perspective of the symbiotic development of RI and NRI.
This study aims to make the following contributions.: First, although there is much literature on the structure of energy consumption, there are few pieces of literature related to GC and using the spatial Durbin model to explore the impact of GC on the ECS. Second, due to the differences in the development patterns of RR and NRR, this study will explore the impact of GC on ECS in RR and NRR, respectively. Third, although there are many literature exploring “symbiosis theory”, most of them are case studies or empirical analysis from the perspective of industrial chain, and there is few literature based on the symbiotic development of RI and NRI in industry.
The remainder of this study is as follows: Section 2 mainly introduces the mechanism of the impact of GC on the ECS and discusses the mechanism of the impact of GC on the ECS from the perspective of the symbiotic development of RI and NRI. Methods and data are presented in Section 3 of this study. The 4 section mainly presents the empirical results and discussion. The 5 section is the conclusion and relevant policy recommendations.
Mechanisms and hypotheses
The mechanism of the impact of GC on ECS
First, from the perspective of factor allocation, in order to reduce the consumption of coal and fossil energy, GC adjusts the financial resources between “three high” 2 enterprises and SME to increase the production cost of “three high” enterprises and restricts their investment size. From the perspective of direct and indirect financing, although “three high” enterprises can directly finance through financial instruments such as stocks and bonds, indirect financing, mainly based on bank credit, is still the main financing channel for Chinese enterprises. 11 Furthermore, banks can judge whether a company is a green development model by monitoring its investment projects. 12 Specifically, for environmentally unfriendly projects, measures such as raising the loan interest rate and shortening the loan period 13 are used to limit their scale expansion. At the same time, for green and sustainable projects of SME, financial institutions such as banks support their development by reducing loan interest rates. In addition, from the perspective of credit guarantee, most of the “three high” enterprises are large or state-owned enterprises. Therefore, under certain circumstances, to maintain the existing profit level, such enterprises can alleviate their financing difficulties through corporate credit and goods credit 14 (Hunjra et al., 2014). However, based on the resource dependence theory and in the absence of foreign aid, 15 “three high” companies will face increasingly stringent financing constraints, resulting in increased default risk and reduced profits. Therefore, under the background of green credit policy, “three high” enterprises and SME will adopt a sustainable development model to reduce energy consumption, such as coal and oil. In this vein, GC has a significant role in optimizing the ECS.
Second, from the perspective of technological innovation, GC provides lower loan interest rates for environment-friendly projects, promotes the upgrading of production technology of enterprises, improves their energy utilization efficiency, and then improves the overall ECS. However, for enterprises of different scales, from the perspective of technological innovation, there are differences in the optimization path of GC to ECS. In the case of large enterprises, due to the large sunk costs formed by stranded assets such as old equipment and factories, enterprises are reluctant to carry out innovative production activities with long periods and high risks. However, with the implementation of green innovation policies, the asset collateral value of equipment with high emissions will continue to decrease, which will force enterprises to flow funds into innovative production activities. Meanwhile, in the short term, when the cash flow of large enterprises is affected by green innovation policies,16,17 they can avoid falling into liquidity difficulties through “incremental innovation" 3 . 18 In addition, in the case of SME, from the perspective of indirect financing, since the Bank of China generally believes that large enterprises have a good reputation and strong payment ability, SME face greater financing constraints. In order to improve their corporate profits, SME can only avoid “discrimination” in financing by banks and other financial institutions through GC. And from the perspective of direct financing, under the background of the green credit policy that has been paid more and more attention, based on the investment signal theory, SME can also obtain funds through direct financing channels so as to upgrade the level of production technology and optimize the ECS. Therefore, based on the above discussion, no matter from the perspective of large enterprises or SME, from the perspective of technological innovation, GC has a significant role in optimizing the ECS.
Finally, from the perspective of government supervision, financial institutions such as banks cooperate with local government regulators
19
to track and supervise the productive activities of enterprises. In addition, punitive measures such as high-interest rates and public criticism are implemented for companies whose pollution emissions exceed the threshold, forcing the “three high” companies to optimize their ECS. Government supervision is mainly divided into direct supervision and indirect supervision. Direct supervision mainly refers to the direct participation of local governments in the lending activities of banks and other financial institutions to “three high” enterprises through administrative means. This move avoids the possibility of “three high” enterprises participating in environmental fraud and enhances the legitimacy of enterprises, thereby improving the utilization efficiency of GC and promoting the optimization of ECS. At the same time, based on the theory of legitimacy, especially in emerging markets such as China,20,21 companies that actively participate in green and sustainable development activities are more closely linked with local governments. The close connection with the local government is more conducive to the transformation and upgrading and high-quality development of enterprises. In addition, indirect supervision mainly involves local governments regulating production methods through market means. Specifically, local governments conduct environmental investments by establishing special green funds. This move not only broadens the financing channels of green development enterprises
22
but also activates the “three high” enterprises to replace coal and fossil energy with renewable energy. Therefore, from the perspective of government supervision, GC plays a significant role in optimizing the ECS. Based on the above discussion, this study proposes the following hypothesis:
From the perspective of symbiotic development of RI and NRI, the impact mechanism of GC on ECS
First, the advantages of resource integration mainly complete the improvement of ECS through two aspects: direct impact and indirect impact. From the perspective of direct impact, RI and NRI will form a closed loop at the resource level, reducing the use of coal and fossil energy and optimizing the ECS. Specifically, RI sells wastes from productive processes such as cinder to NRI at lower prices so that NRI can better carry out productive activities from the perspective of industrial chain extension. At the same time, NRI also sell wastes that can be used as fuels to RI, thereby forming resource recycling and improving energy utilization efficiency. In addition, from the perspective of indirect impact, the advantages of resource integration will complete the optimization of ECS by improving the utilization efficiency of GC. In the case of resource integration advantages, enterprises aiming at “maximizing profits” will not only focus on their main business but seek further profit space in terms of waste. However, since the transformation of waste from “waste” into “treasure” requires a lot of financial support, both RI and NRI will actively use green credit financing channels. Therefore, the utilization efficiency of GC is improved, thereby optimizing the ECS.
Second, the advantages of technology sharing mainly refer to the development mode of mutual cooperation and mutual exchange between RI and NRI from the perspective of symbiotic development, thereby improving the utilization efficiency of GC and optimizing the ECS. Under the pressure of huge sunk costs such as old equipment and factories, RI can obtain funds through GC in the short term and adopt “incremental innovation” methods to improve energy efficiency.16,17 But in the long run, this move will reduce the efficiency of GC utilization and cause enterprises to fall into the “technical barriers” trap. However, compared with RI, NRI with higher production technology are more capable of technological innovation. Therefore, NRI can more fully utilize the funds obtained through GC, thereby improving the utilization efficiency of GC as a whole. So, the interaction and cooperation between RI and NRI will be more favorable. In addition, under the advantages of technology sharing, NRI will investigate the productive activities of RI so as to develop targeted tools with higher production efficiency and then complete the improvement of ECS.23,24 Therefore, in the context of mutual cooperation between RI and NRI, the advantages of technology sharing will optimize the ECS by improving the utilization efficiency of GC.
Finally, in the case of government assistance and long-term cooperation, the advantage of information disclosure will reduce transaction costs and other expenses between RI and NRI by improving the authenticity of the information. The reduction of transaction costs and other expenses improves the utilization efficiency of GC, thereby completing the improvement of ECS. In contemporary times, the diversification of information acquisition channels will increase the difficulty of identifying information. And, RI and NRI will pay higher capital and time costs to obtain real and effective information. However, with the assistance of the government, financial institutions will supervise companies through the Internet and other means. 25 Such measures enhance the legitimacy of RI and NRI, improve the accuracy of information disclosure, and reduce the cost of capital and time for companies to obtain information. At the same time, under the background of long-term cooperation, the cooperation between RI and NRI will become closer, and transaction costs and other expenses will also be reduced, increasing the efficiency of GC utilization. Therefore, with the advantage of information disclosure, the utilization efficiency of GC is improved, and the optimization of ECS is also completed.
Based on the above discussion, this study puts forward the hypothesis H2: the symbiotic development of RI and NRI will improve the utilization efficiency of GC through the advantages of resource integration, technology sharing, and information disclosure, and then complete the optimization of ECS. (Figure 2)
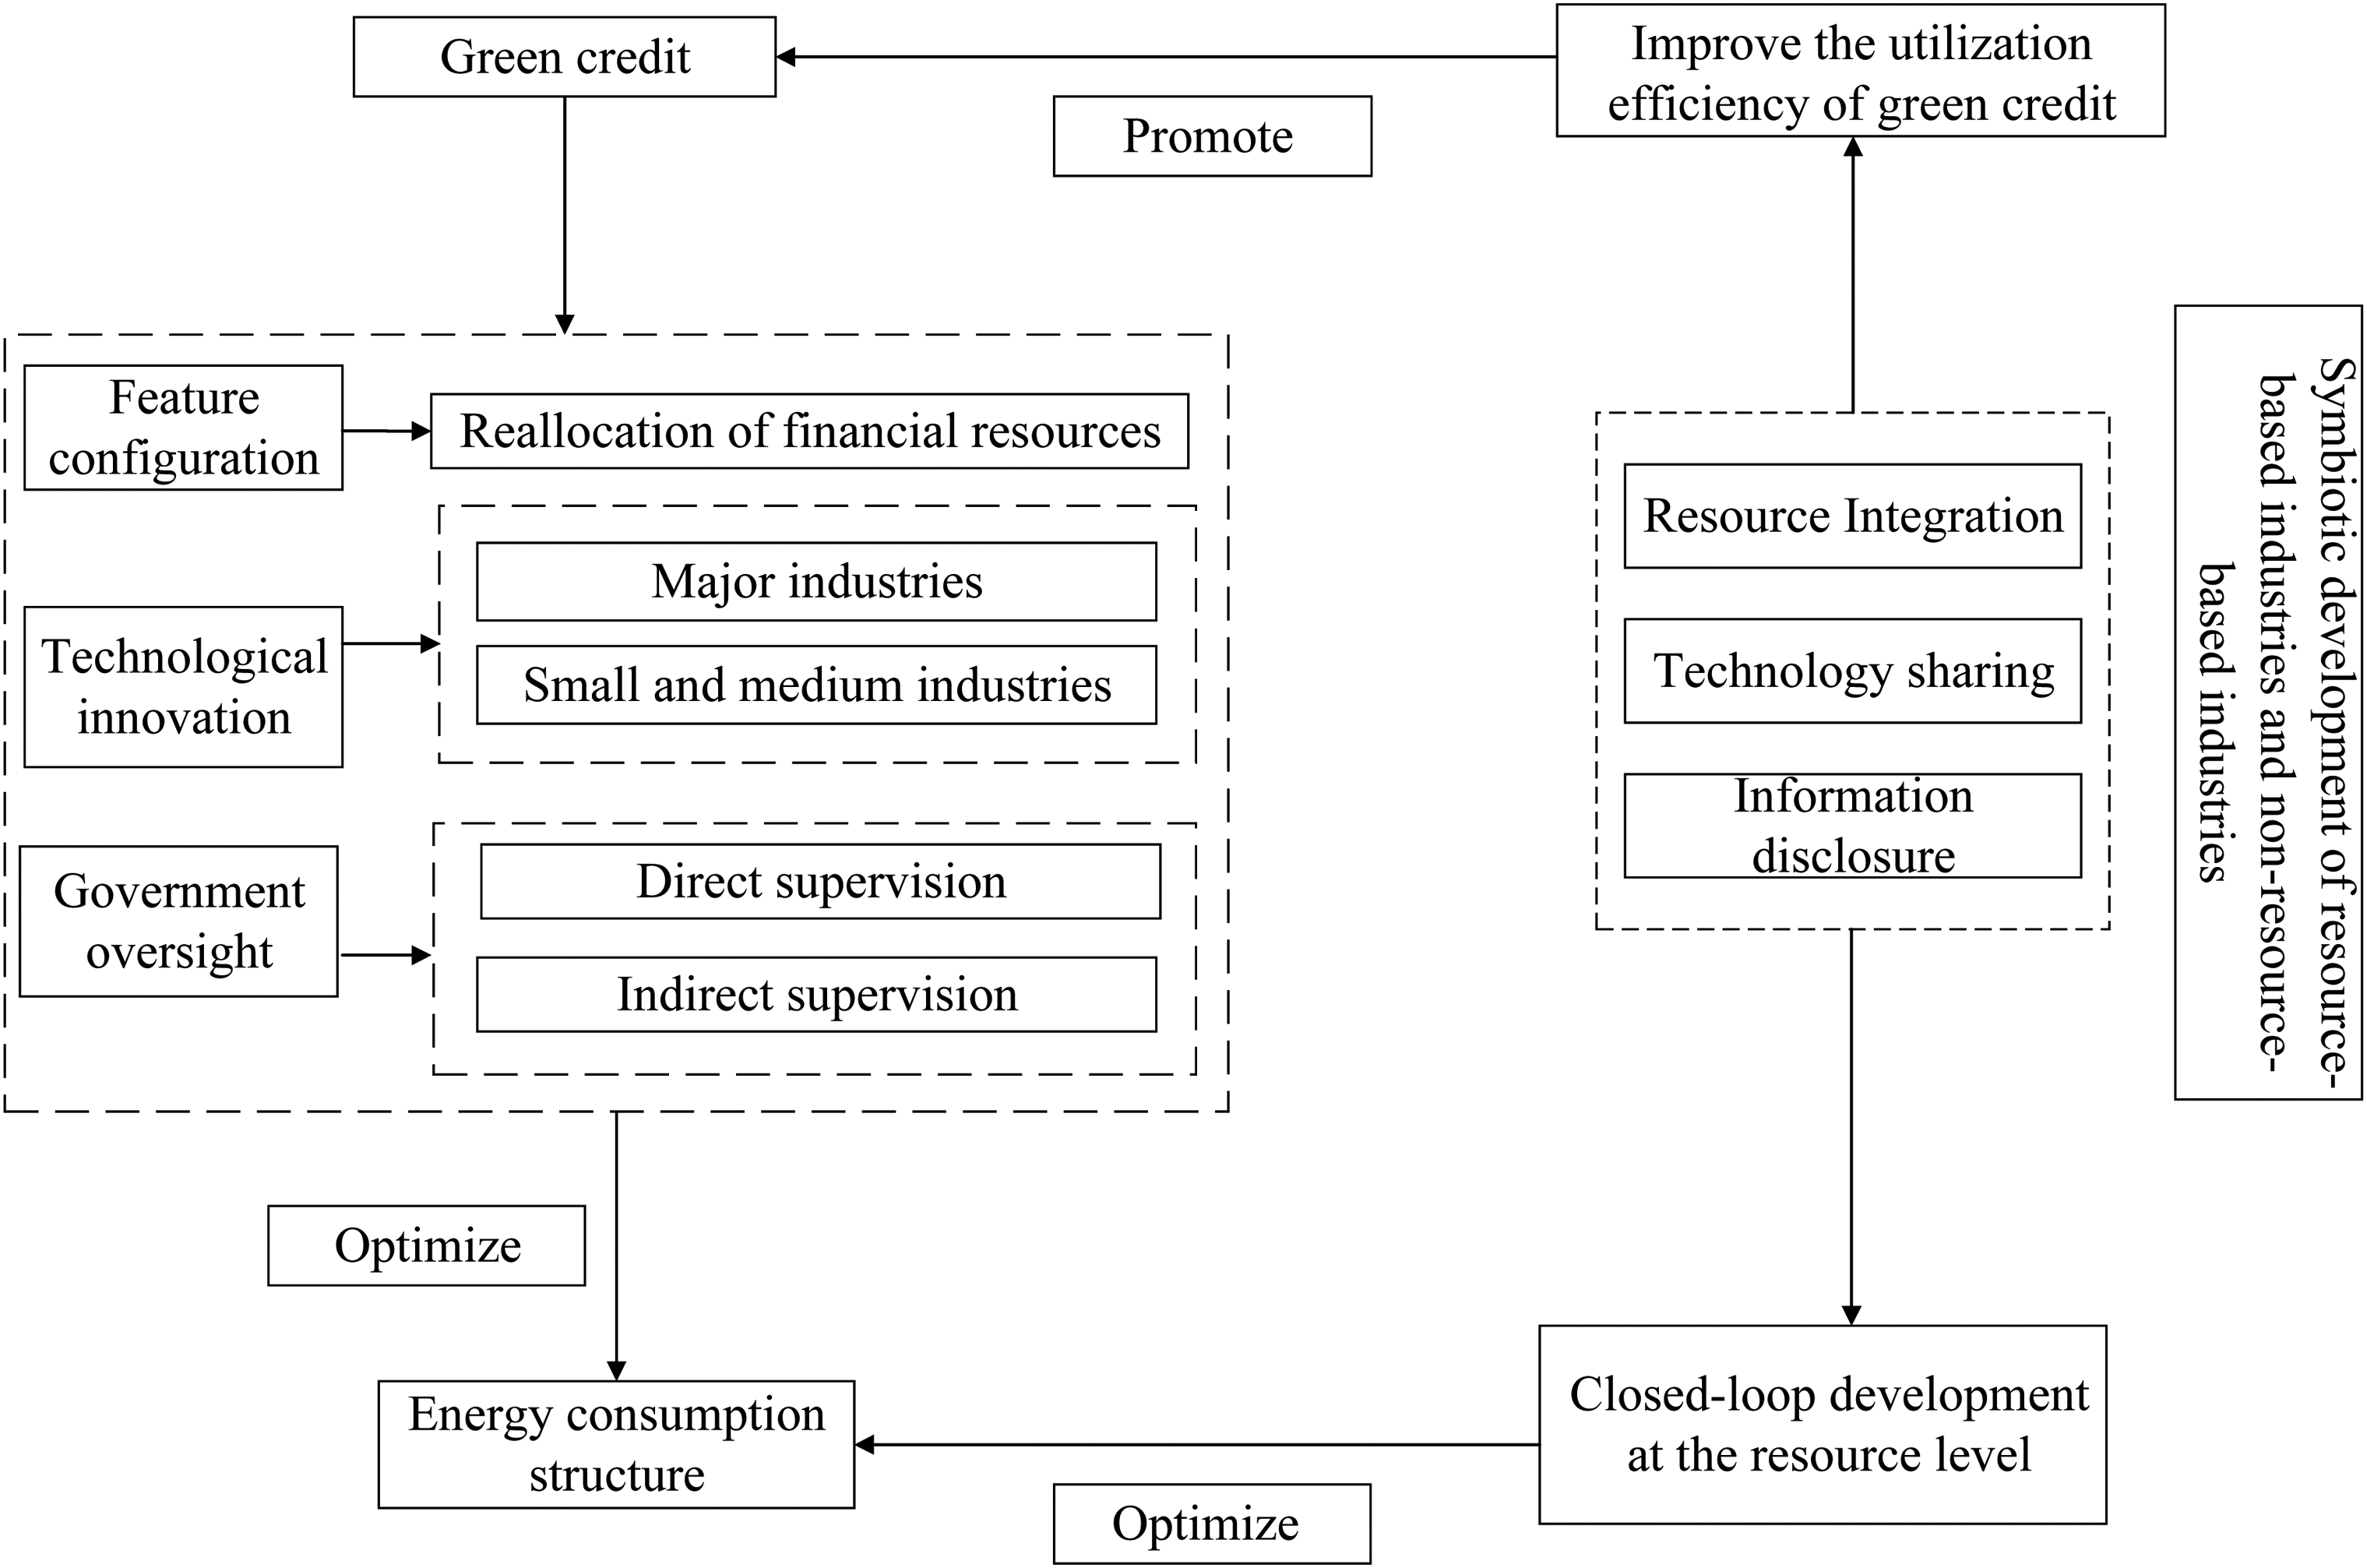
Diagram of conduction mechanism.
Methods and data
Econometric methodology
Benchmark regression model
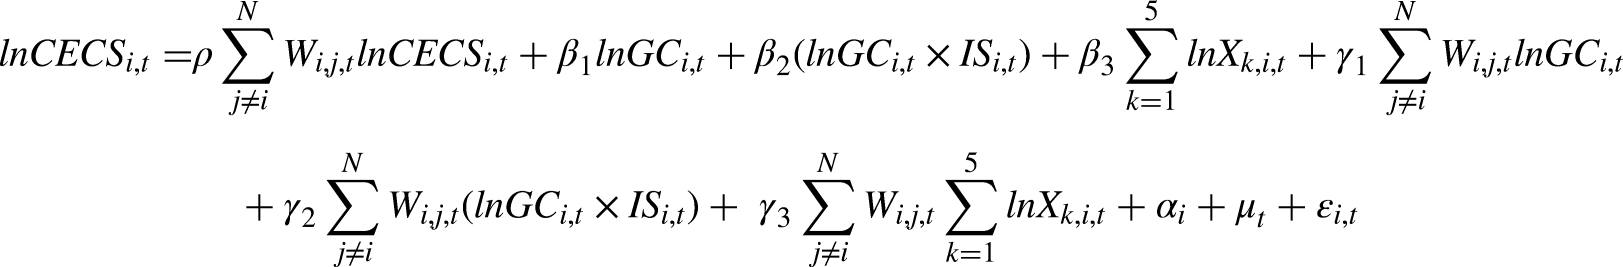
To analyze the effect of GC on ECS, a basic regression model was constructed and introduced surrogate variables for GC and ECS, and control variables associated with ECS, to verify the relationship between GC and ECS. The following basic econometric model is obtained:

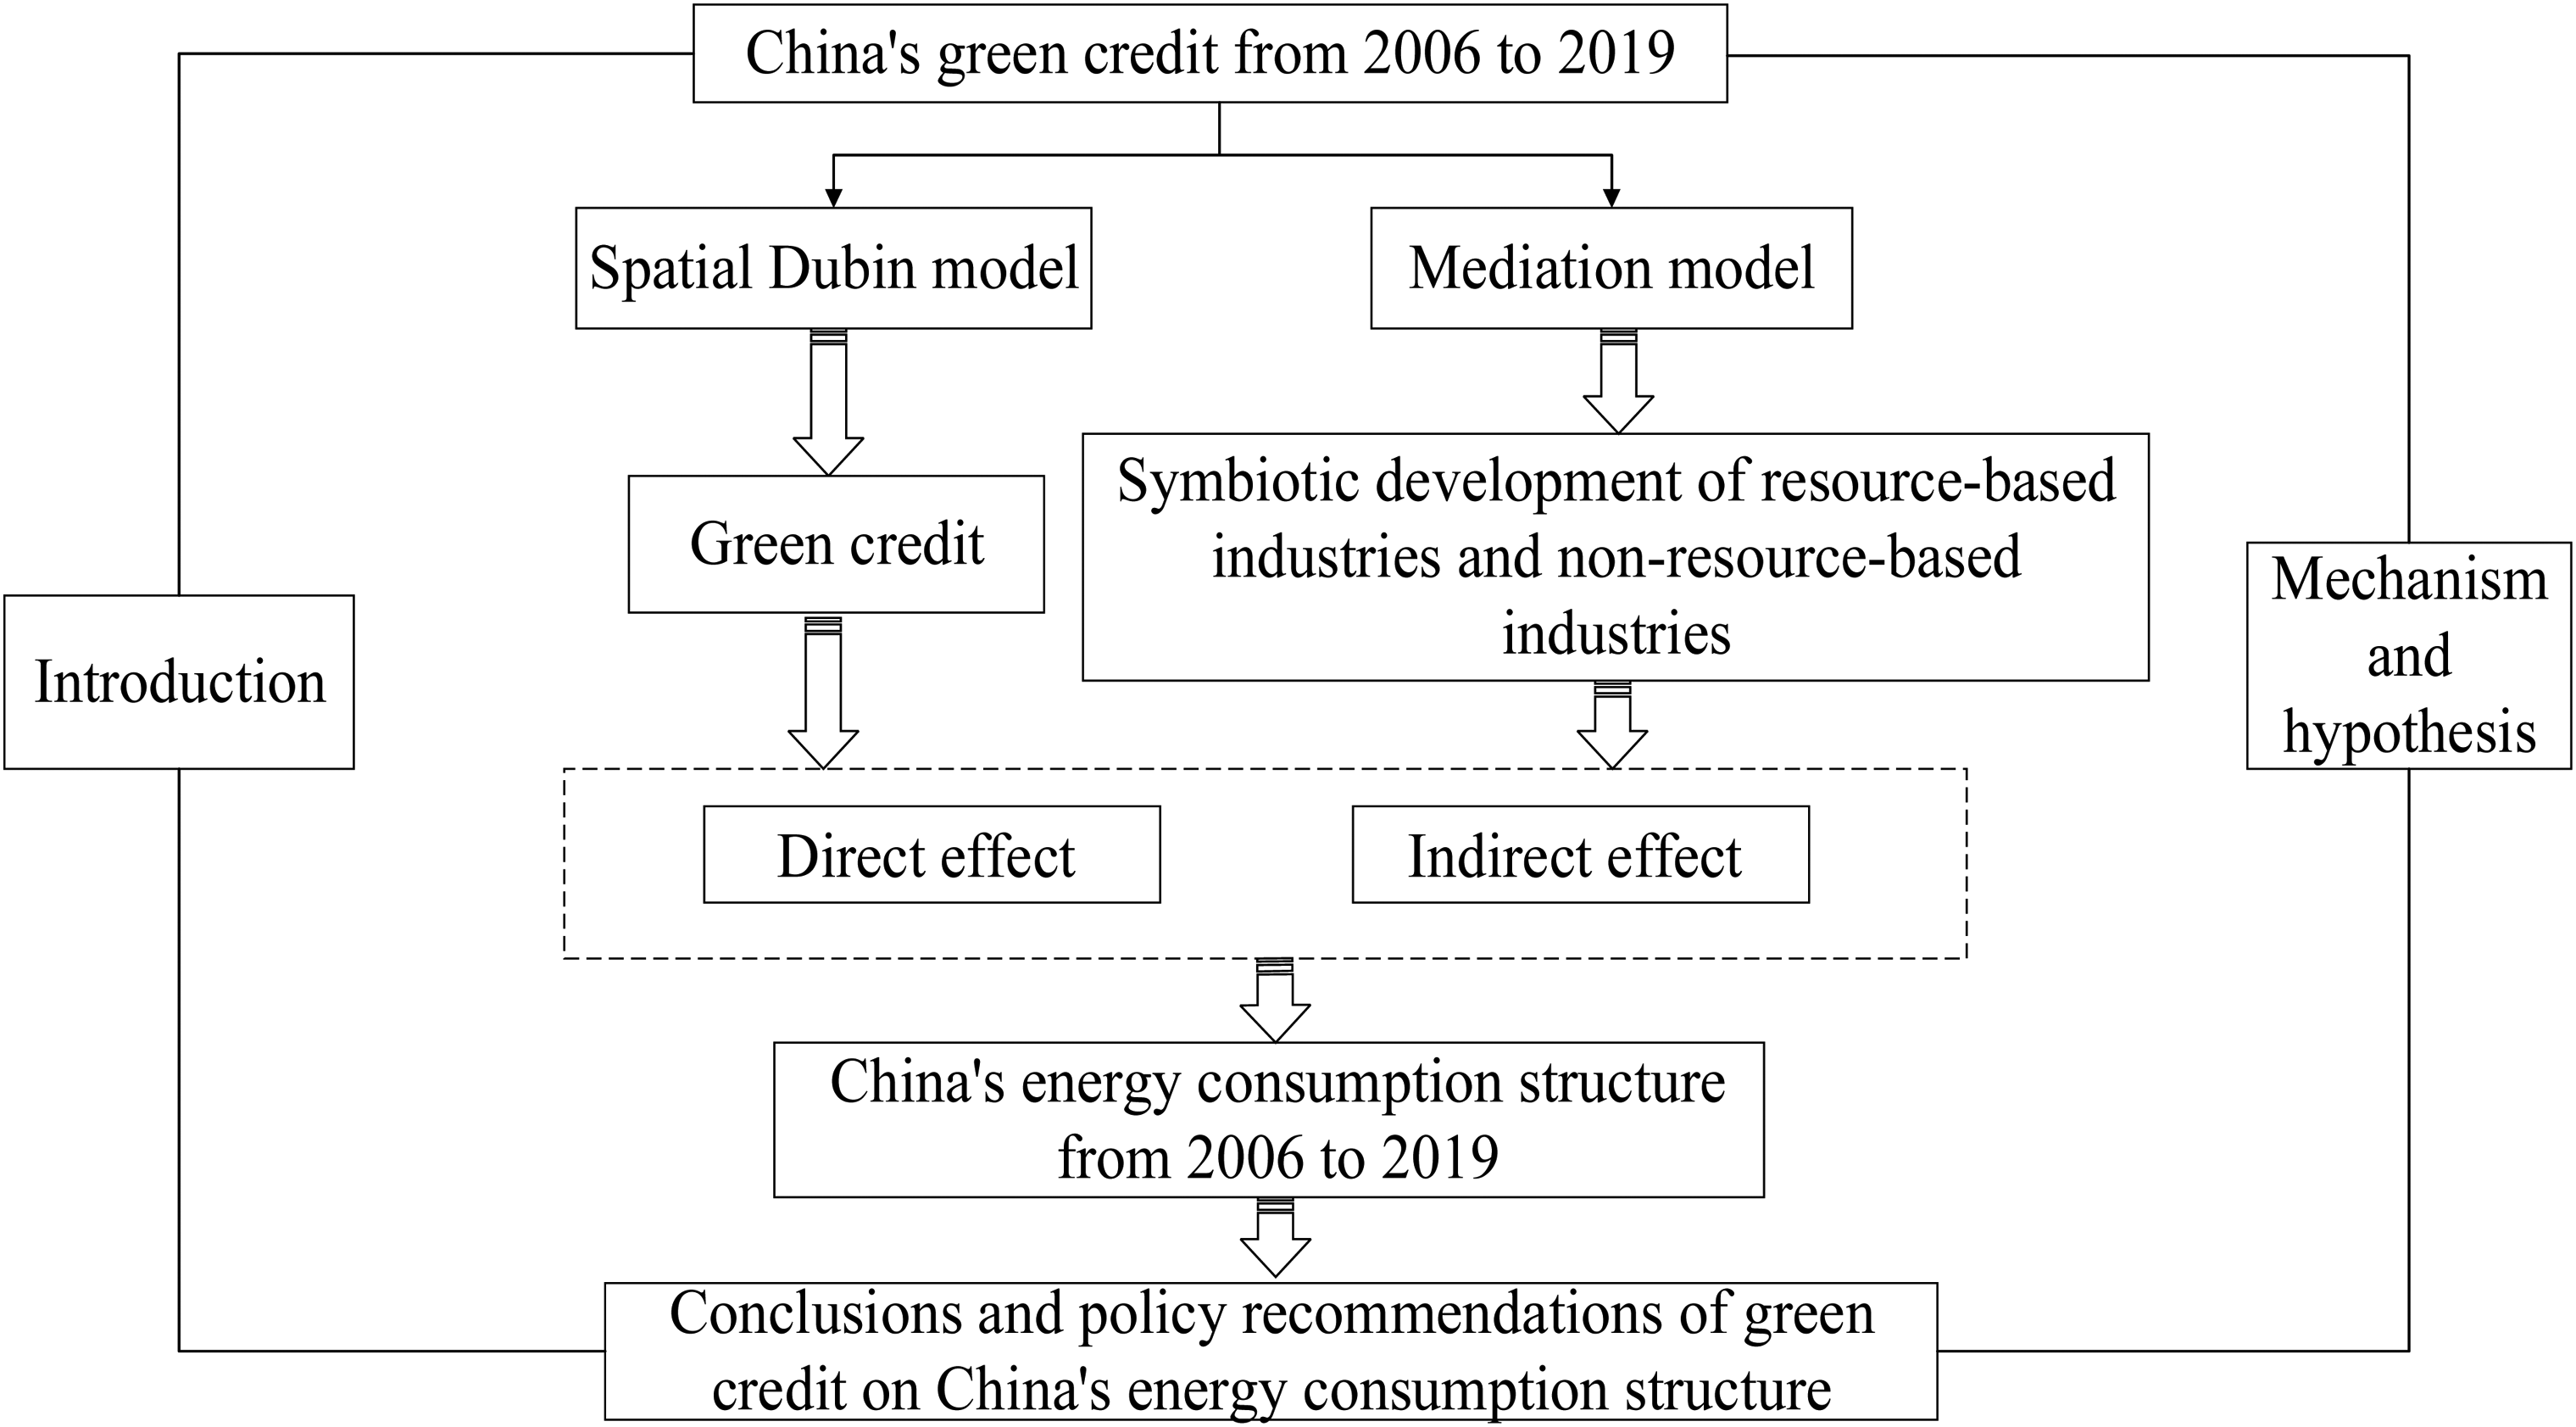
Research framework.
Spatial Durbin model
The design of the spatial Durbin model
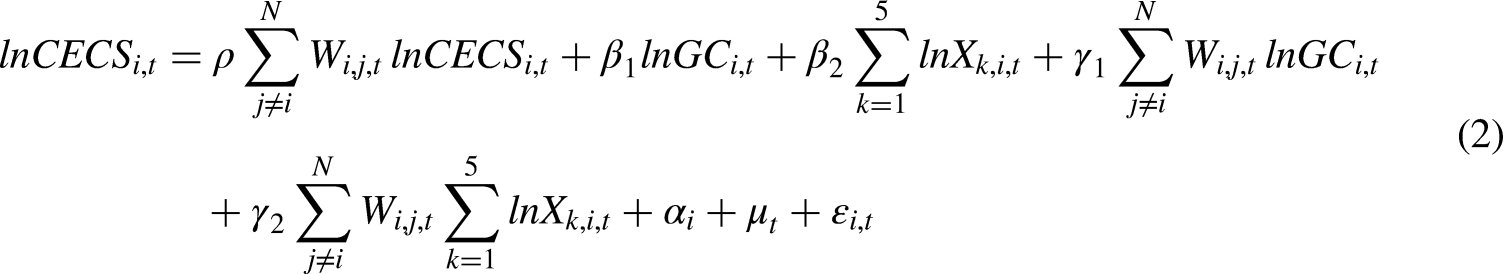
Due to the strong spatial correlation between GC and ECS, although the basic regression model cannot explore the influence of GC on ECS in the case of variable spatial correlation, the spatial Durbin model can well reflect the spatial correlation between variables,
26
so the spatial econometric model was adopted in this study. The model is represented as follows:
The design of the mediation model
GC will reduce production losses, improve production efficiency, and reduce transaction costs through the advantages of resource integration, technology sharing and information disclosure, so as to achieve the goal of improving ECS. Therefore, in order to verify the above theory, this study adds the interaction term of GC and industry symbiosis to model (2), and obtains the following model:
The design of the spatial weight matrix
According to Tobler's first law of geography, all things are related, but nearby things are more related than distant things.20,21,27 Therefore, the geographic adjacency matrix is the main matrix of this study, while the geographic distance matrix and the economic distance matrix are used as stability tests. The formula for calculating the geographic adjacency matrix is as follows:
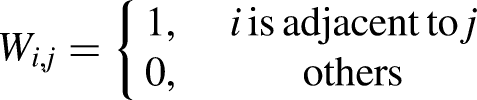
Here,
Data
Explained variable
There are two main methods for measuring ECS: direct method and indirect method. The direct method refers to the proportion of various types of energy consumption to total energy consumption.
28
If the ratio of energy consumption of high pollution classes to total energy consumption decreases, the ECS is optimized. The indirect rule refers to the output value of energy-intensive industries as a proportion of GDP.
29
However, considering the availability of data and the fact that China mainly uses coal as the main energy source,
30
this study uses the ratio of coal consumption to total energy consumption in the direct method to represent the ECS.
31
The specific calculation is as follows:

Here,
Core explanatory variable
GC indicators are mainly divided into positive indicators and negative indicators. The negative indicator refers to the ratio of the interest expenditure of the six high-energy-consuming industries 4 to the total interest expense of the above-scale industries. Positive indicators refer to the ratio of the loan amount of energy-saving and emission reduction projects to the total loan amount, the green loan amount in industrial pollution control investment, and other indicators. However, considering the continuity and availability of data, this study uses a negative indicator of GC. 32
Mediator
At present, the measurement method of industrial symbiosis is mainly from the perspective of the industrial chain, by examining the relationship between upstream and downstream industries and calculating the integration, interaction, and coordination of upstream and downstream industries based on data such as intermediate inputs and industrial added value. 33 However, if the relationship between industries is not upstream and downstream, the existing calculation methods will not be able to measure the industrial symbiosis. Therefore, this study draws on the “symbiosis theory” in the field of ecology to divide different industries into different groups, and according to the endogenous growth rate of different groups in the overall system, the symbiotic relationship between different industries is divided into competition, neutrality, and symbiosis. The specific calculation steps are as follows:
First, since TFP can comprehensively reflect the level of production, operation, and technological innovation of an industry, this study uses TFP as a surrogate indicator of the development status of RI and NRI. Meanwhile, considering the availability and continuity of data, this study uses industrial sales output value as an output indicator. The labor input in the input index is represented by the average number of employees in each industry, and the capital input is the capital stock
34
: Calculate the depreciation rate of the current year through the ratio of the depreciation of the current year to the original value of the fixed assets in the previous year, and then use the difference between the original value of the fixed assets to construct the asset investment amount series, and combine the fixed asset investment price index to obtain the comparable investment amount. Finally, the formula is:

Here,
Second, due to the serious lack of the values of individual industries in some provinces, this study first calculated the input and output of RI and NRI 5 in each region based on the input and output indicators of various industries in each region, using the arithmetic square method. Then, the TFP of the RI and the NRI was calculated for each region.
Third, comparing the TFP of RI and NRI with the TFP of the previous year, respectively, If the TFP of RI and NRI has not changed compared with the previous year, it means that the endogenous growth rate of RI and NRI in the overall system has not increased during the current period. RI and NRI are in a neutral relationship and are assigned a value of 0. If the TFP of RI and NRI has increased compared with the previous year, it indicates that the endogenous growth rate of RI and NRI in the overall system has increased during the current period. RI and NRI are in a symbiotic relationship and are assigned a value of 1. If the TFP of RI (NRI) decreases compared with the previous year, or the TFP of RI and NRI decreases compared with the previous year. It shows that the endogenous growth rate of RI (NRI) in the overall system has declined during the current period, or the endogenous growth rates of RI and NRI in the overall system have declined. RI and NRI are in a competitive relationship and are assigned a value of −1. The specific formula is as follows:
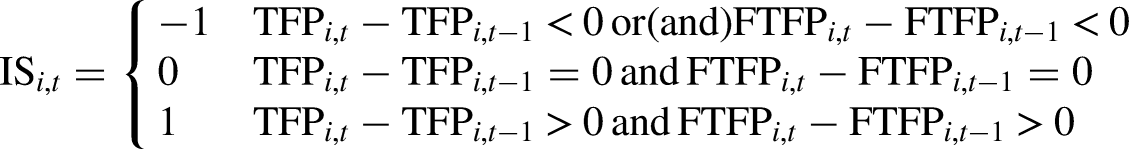
Here,
Control variables
First, this study uses per capita GDP (PGDP) to represent the level of economic development of a place. Second, the energy endowment is expressed in terms of energy self-sufficiency (EI) and per capita energy production (PI). Energy self-sufficiency is mainly calculated by the ratio of energy consumption to energy production. The energy production per capita is mainly obtained by dividing the total energy production at the end of the year by the total population at the end of the year. 35 Third, the R&D intensity (RD) is represented by the ratio of the scientific research expenditure of industrial enterprises above the designated size to the fixed investment of the whole society. 36 Finally, the energy price (PR) is one of the important factors in determining the regional energy consumption, which is represented by the fuel price index of each province, and took the value of 1 in 2006.37,38
Data sources
First, considering the lack of data in regions such as Tibet, Hong Kong, and Macau, the panel data of 30 provinces in China from 2006 to 2019 were finally selected. Second, the data used in this study are all from the economy prediction system database and “China Industrial Statistical Yearbook.” Table 1 is mainly for symbols, variables and descriptive statistics. Among them, Inner Mongolia had the highest energy self-sufficiency rate of 7.907 in 2016.
Descriptive statistics.
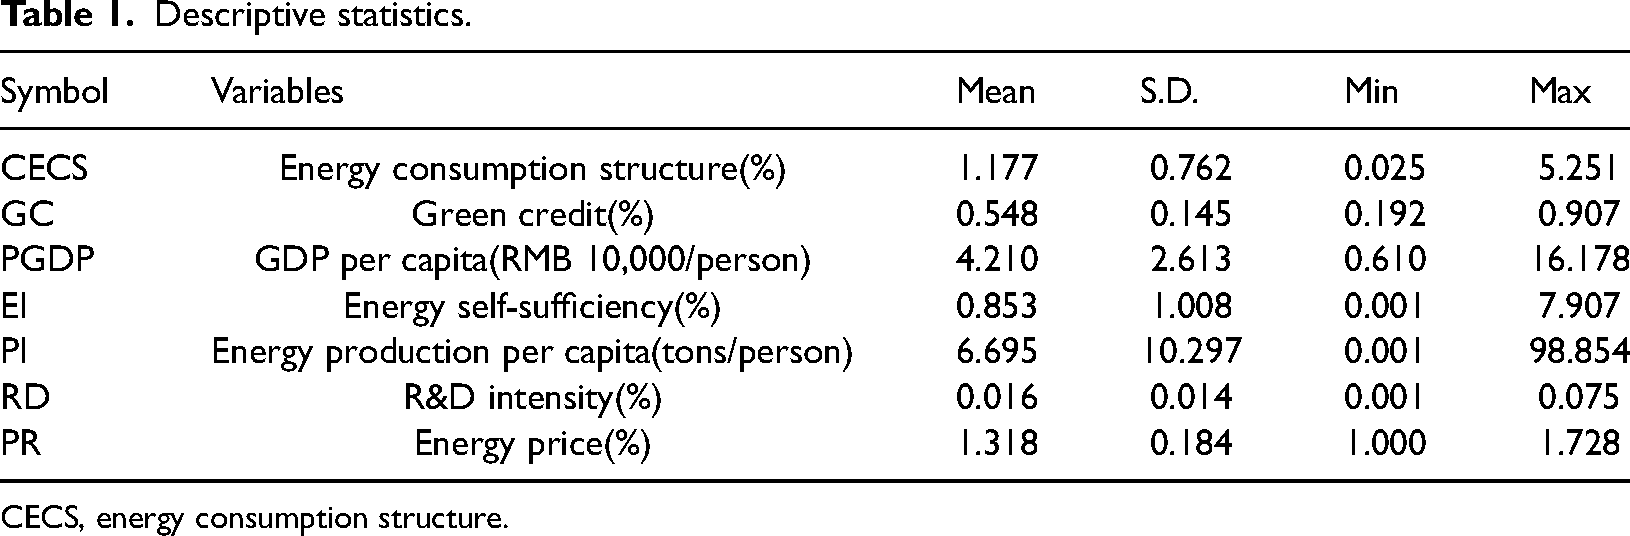
CECS, energy consumption structure.
Results and discussion
Spatial autocorrelation test
This study examines whether there is a spatial correlation between regional ECS and GC according to the significance level of the Moran I index (see Table 2). The ECS is significantly positive at the level of 1%, and the spatial correlation coefficient shows a trend of first rising and then falling as a whole. Although GC is also significantly positive at the 1% level, the overall spatial correlation coefficient shows a gradual upward trend. The results show that with the continuous deepening of ecological environment construction and market-oriented reform, the ECS and GC among regions are in a state of top-to-bottom competition. In addition, the local Moran I scatter plots in 2006 and 2019 also prove that both the ECS and GC have significant positive spatial correlations (see Figures 4 and 5). Therefore, this study should adopt a spatial econometric model.
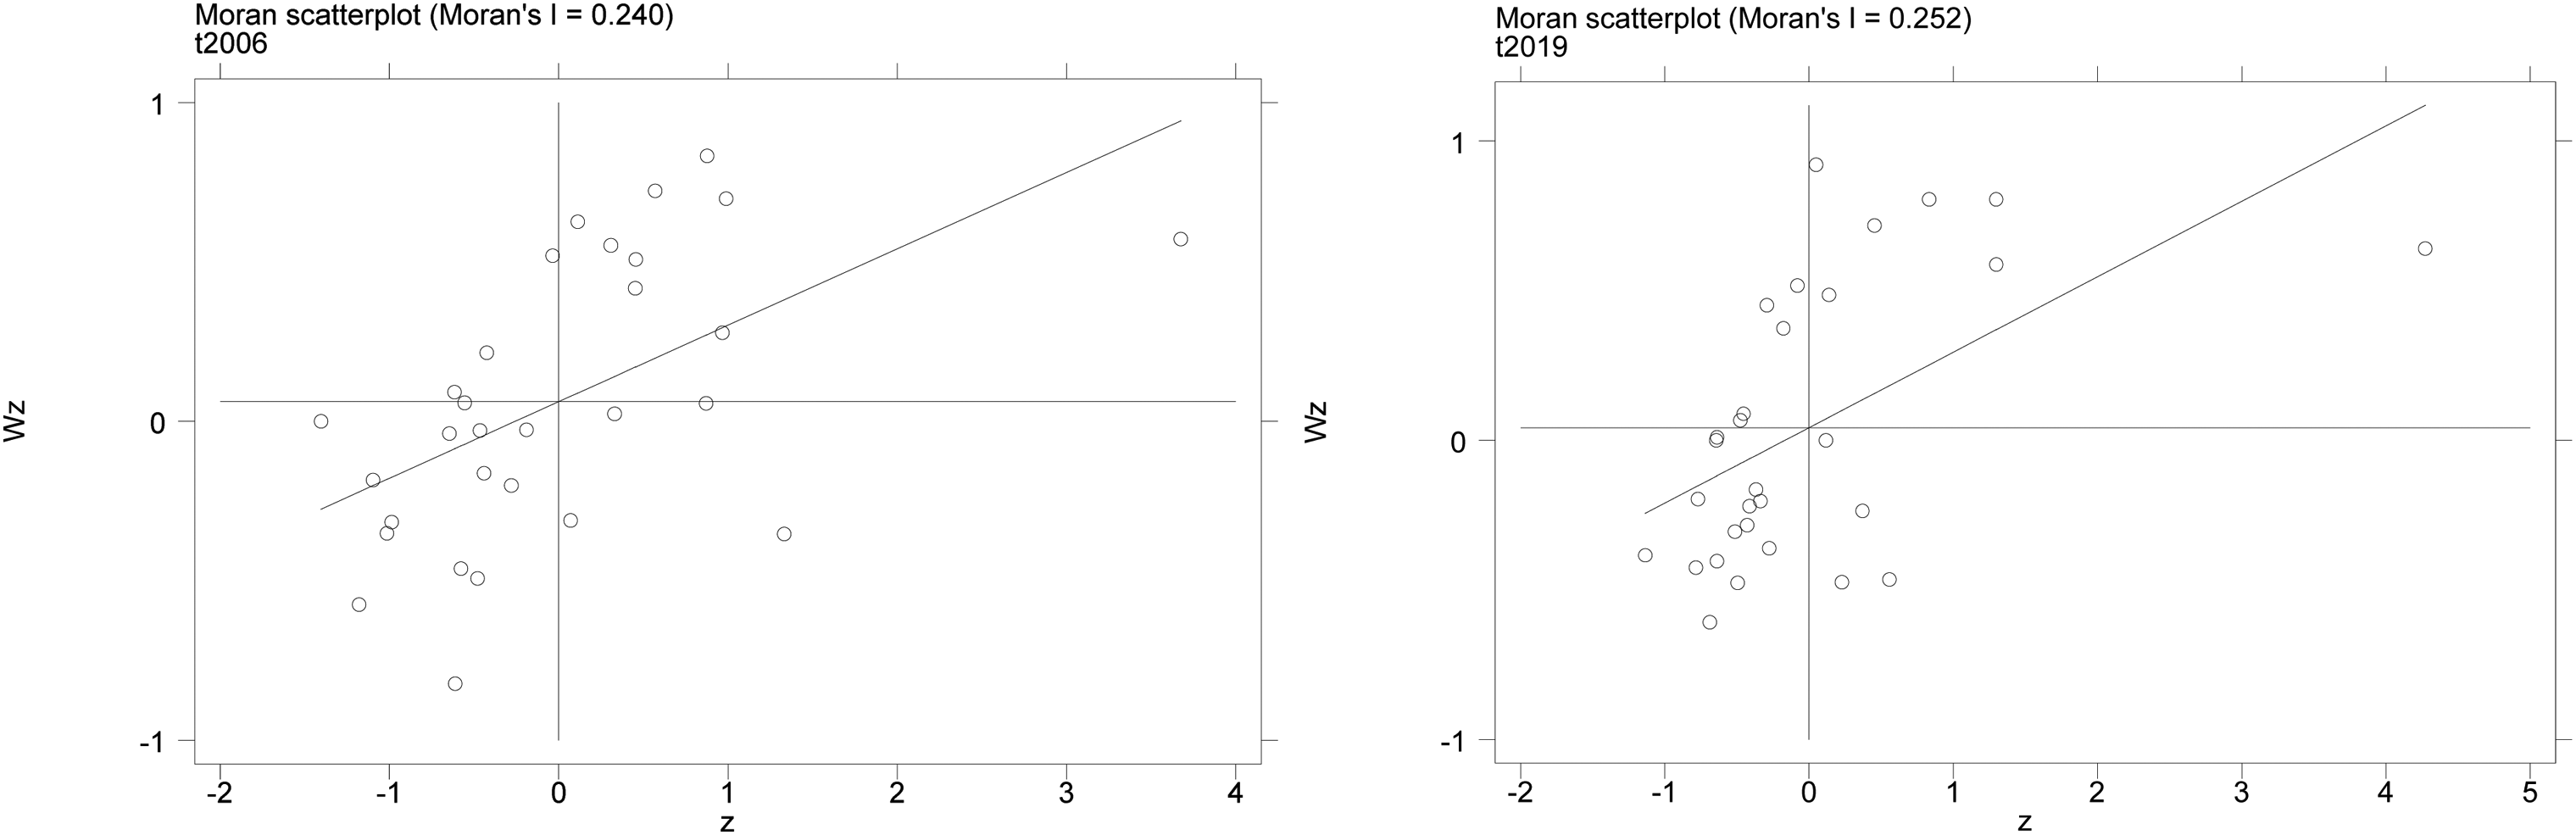
Partial Moran I scatter plot of energy consumption structure.
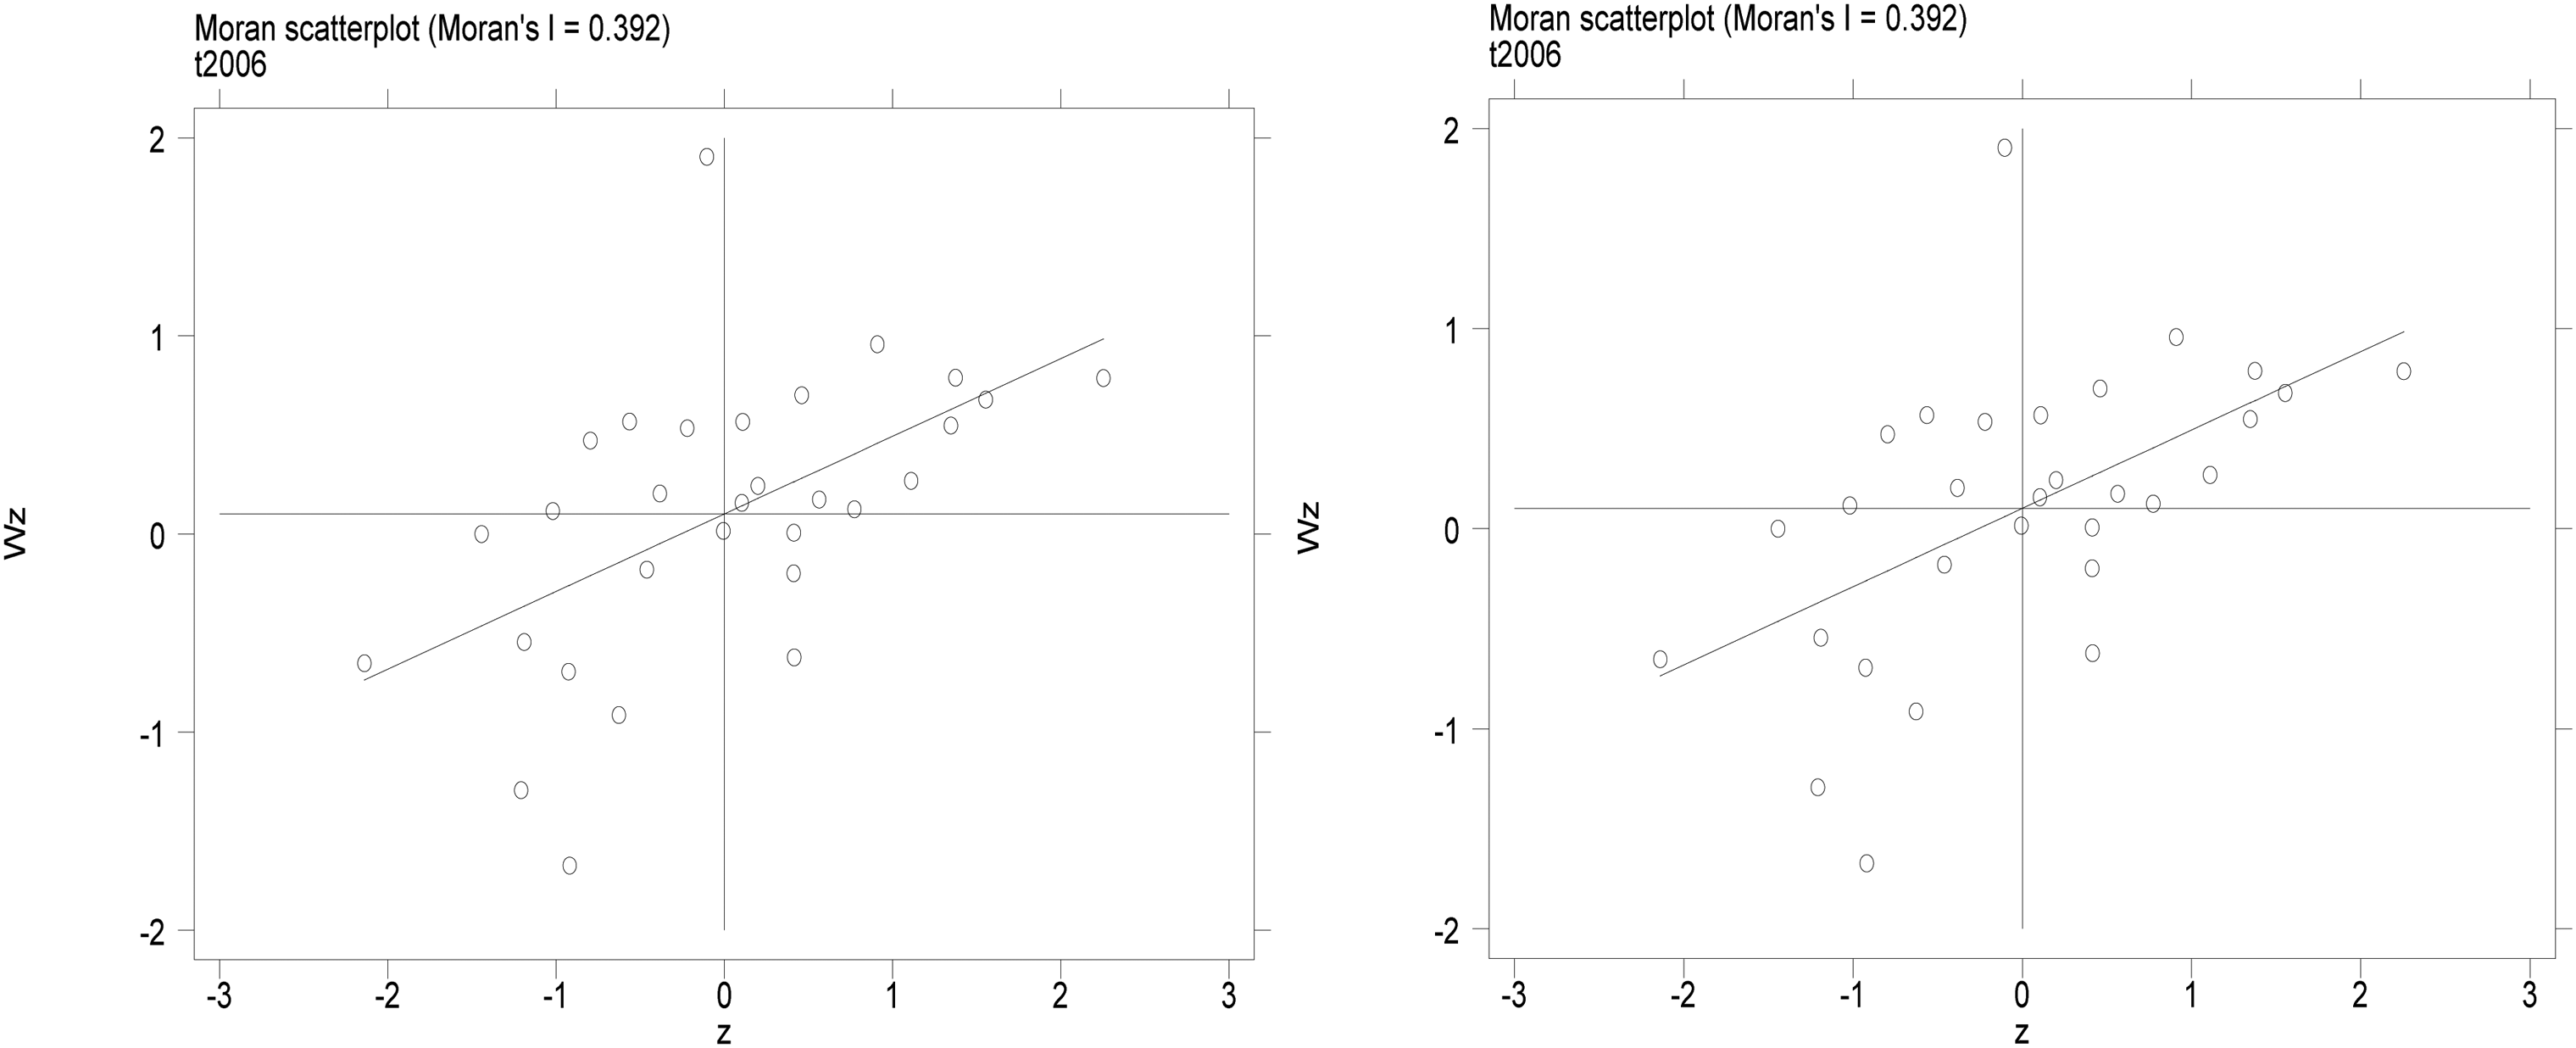
Partial Moran I scatter plot of green credit.
Moran I index.
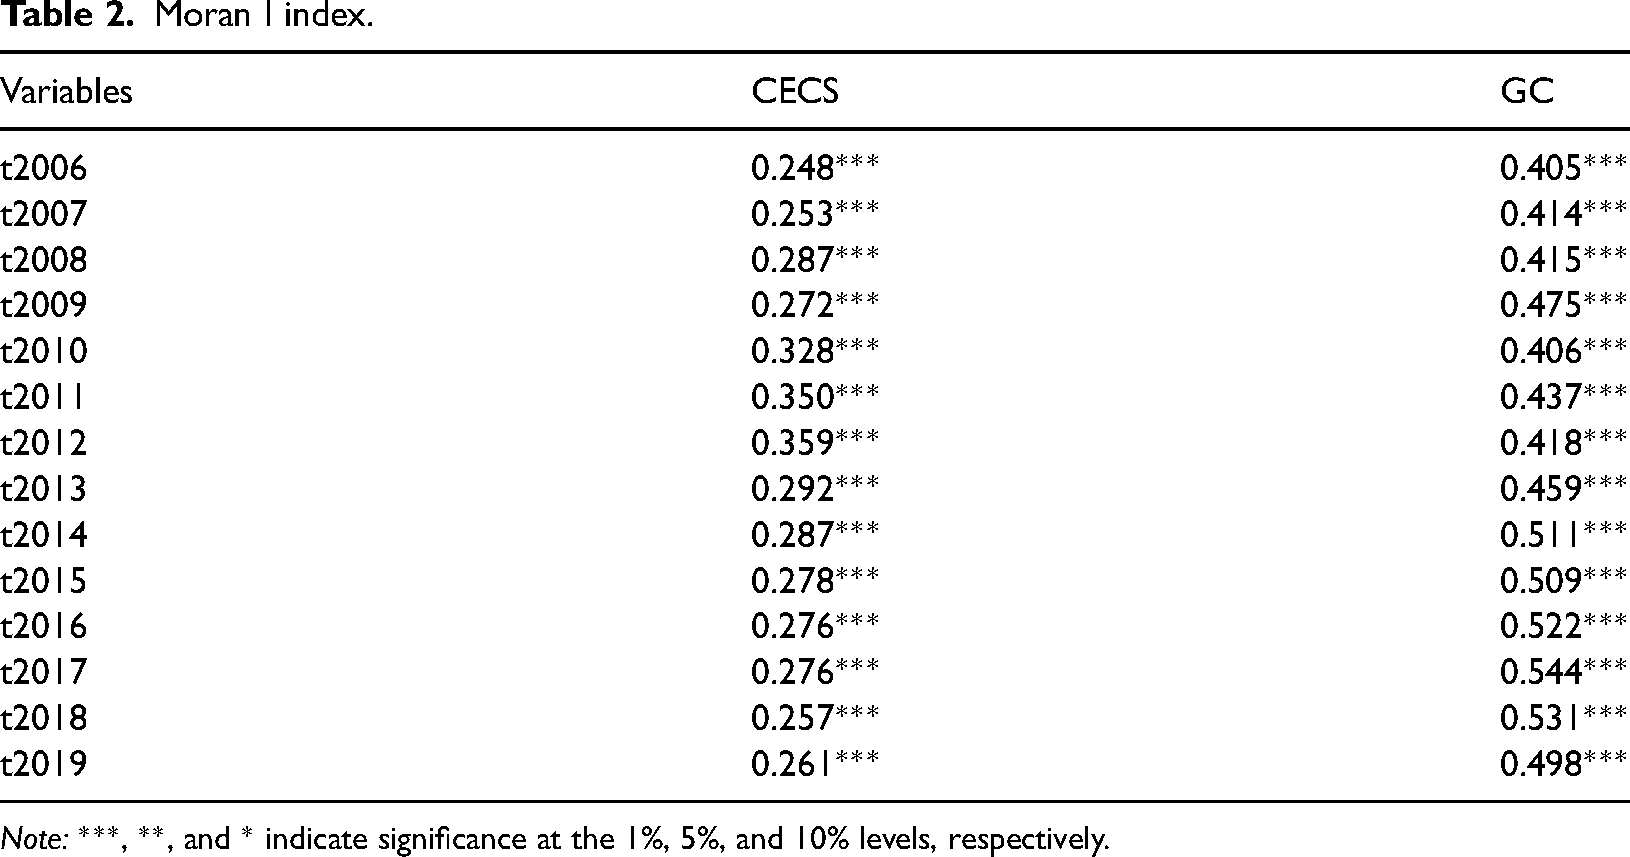
Note: ***, **, and * indicate significance at the 1%, 5%, and 10% levels, respectively.
Baseline estimation
In order to select an appropriate spatial econometric model, the following steps were carried out in this study (see Table 3): First, according on the results of the stationarity test, the null hypothesis of the unit root of the panel should be rejected. Second, the results of the lagrange multiplier test, likelihood ratio test (LR), and Wald tests all reject the null hypothesis at the 1% level, that is, the spatial Doberman model should be used. Third, the
Benchmark estimation results.
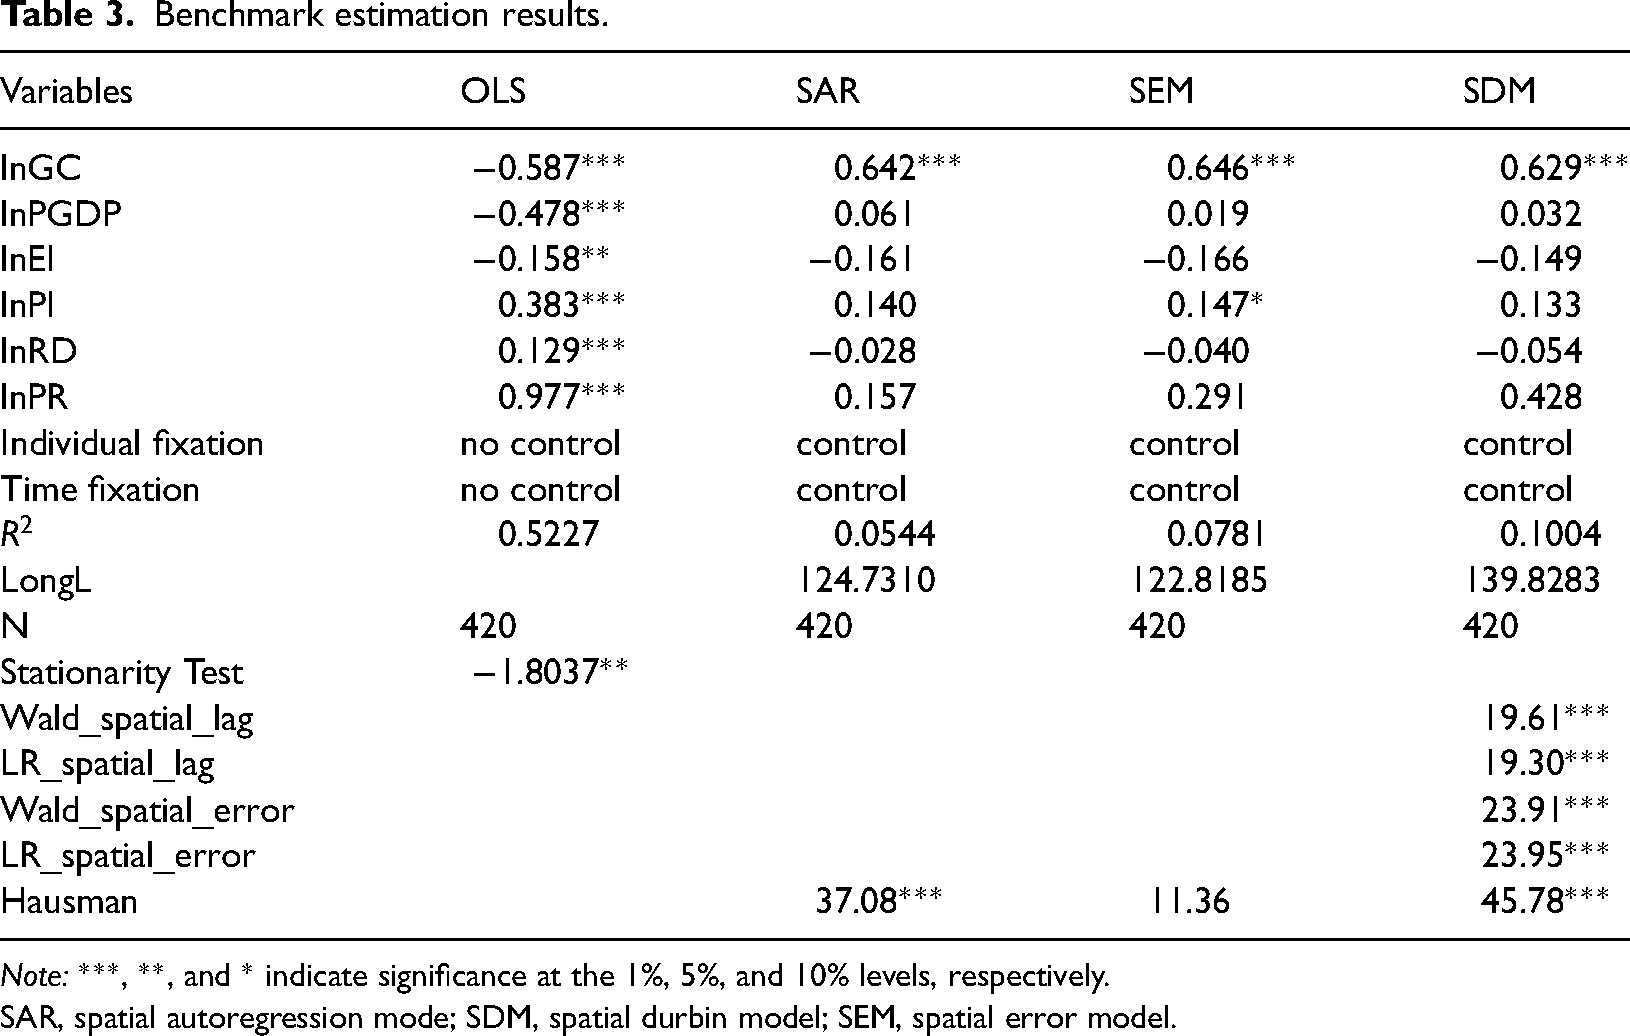
Note: ***, **, and * indicate significance at the 1%, 5%, and 10% levels, respectively.
SAR, spatial autoregression mode; SDM, spatial durbin model; SEM, spatial error model.
In order to better verify the research hypothesis that GC can effectively improve the ECS, this study uses four models to prove it (see Table 3). The results show that: except for the ordinary least squares (OLS) basic regression model, the other models all show that the coefficient of GC is significantly positive at the 1% level. At the same time, since the substitute variable of GC is a negative indicator, it is concluded that GC has a significant optimization effect on the ECS, and the research hypothesis H1 is preliminarily verified. This may be the result of the influence of GC on the ECS in terms of factor allocation, technological innovation, and government supervision. First, from the perspective of factor allocation, GC, with the assistance of government departments, used various means such as unannounced visits to examine whether the “three high” enterprises have transformed their extensive development models. Moreover, for enterprises that emit excessive pollutants, financial institutions will increase their loan interest rates, thereby limiting the expansion of their investment scale. In addition, GC has also taken measures such as lowering the loan interest rate and slowing down the repayment period to encourage environment-friendly enterprises to adhere to a green and sustainable development model, thereby promoting the optimization of the overall ECS of society. Second, from the perspective of technological innovation, GC mainly uses the policy of “carrot and stick” to encourage enterprises to change their production and operation methods and improve energy utilization efficiency by flowing more funds into productive activities such as technological innovation. Finally, from the perspective of government supervision, local governments not only take administrative measures to restrict the use of coal and fossil energy by “three high” enterprises but also actively use market measures to encourage enterprises to use renewable energy such as solar energy and wind energy, thereby completing the improvement of ECS.39,40
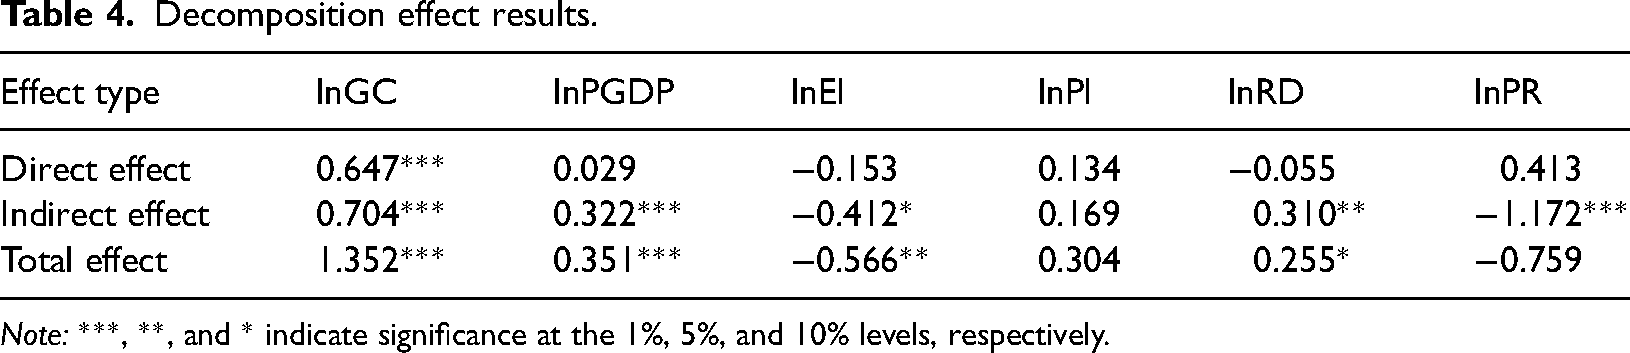
Decomposition effect
This study judges whether it has a spatial spillover effect by testing the significance of the indirect effect of explanatory variables (see Table 4). From the perspective of the GC, the coefficients of direct and indirect effects are significantly positive at the 1% level; that is, GC has a significant optimization effect on the ECS of local and adjacent regions and further verifies the research hypothesis H1. This may be the result of China's market-oriented reforms and the continuous improvement of infrastructure such as transportation. First, the deepening market reform has promoted the efficiency of resource allocation, reduced the difficulty of enterprise loans, and increased their willingness to invest accordingly.23,24 When the financial reserve of a local financial institution is relatively sufficient, it can issue green loans to enterprises in neighboring areas through diversified financial instruments, so as to better meet the needs of neighboring enterprises for GC, and then achieve the goal of ECS optimization. Second, with the continuous improvement of infrastructure such as transportation, the flow of labor between regions will become more convenient. Therefore, local enterprises can recruit knowledge-based and technical talents in adjacent areas through the funds obtained by green credit to complete the upgrading of production technology and improve the ECS.
Decomposition effect results.
Note: ***, **, and * indicate significance at the 1%, 5%, and 10% levels, respectively.
Meanwhile, the direct effect of PGDP is not significant, while the indirect effect is significantly positive at the 1% level; that is, PGDP can significantly inhibit the optimization of ECS in adjacent regions. This may be the result of competition among local governments. Since the promotion of local officials in China is mainly based on gross domestic product (GDP), local officials tend to choose an “extensive” development model in order to signal their ability to higher-level governments. This development model relies on energy consumption to enhance the level of local economic development, 41 thus inhibiting the optimization of the ECS. In addition, the coefficient of the direct effect of RD is negative and not significant, and the indirect effect is significantly positive at the 5% level. That is to say, although the RD cannot have an impact on the local ECS, it can significantly inhibit the optimization of the ECS in adjacent regions. This may be the result of the current low level of RD. Due to the “long cycle” characteristic of technological innovation, although local governments have gradually increased their emphasis on green innovation, the current level of innovation cannot significantly impact the local ECS.
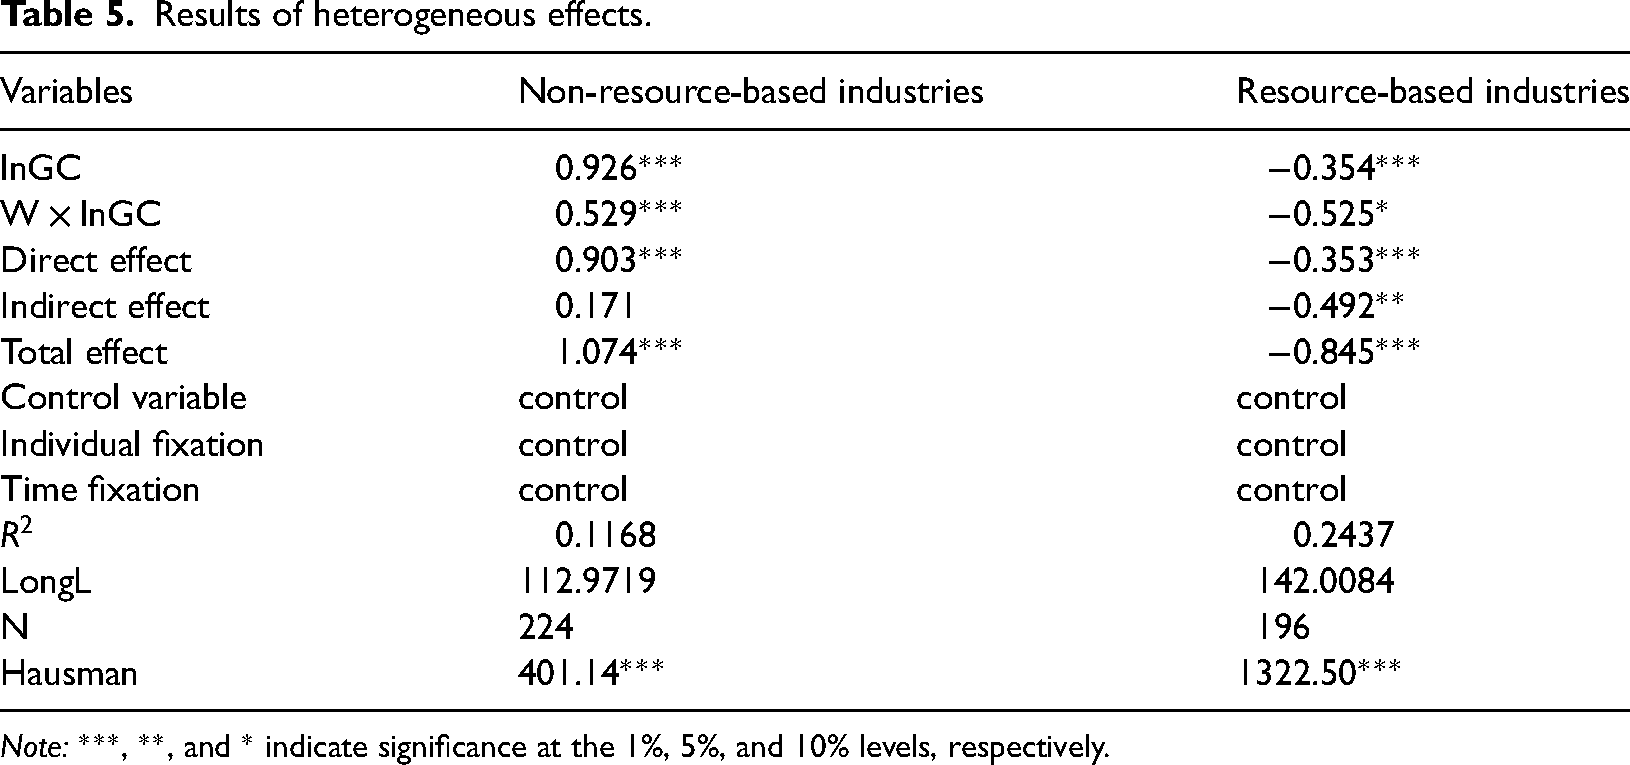
Heterogeneous effects
Due to the differences in resource abundance between different regions in China, this study divides the sample into RR and NRR 6 , and draws the following conclusions (see Table 5). The results of NRR are similar to those of the whole country. The coefficient of direct effect is significantly positive at the 1% level, and the coefficient of indirect effect is not significant, but its sign is positive. That is to say, GC in NRR has a significant optimization effect on the local ECS but has no spatial spillover effect. However, the results of RR are quite different from those of the whole country, and the coefficients of direct and indirect effects are significantly negative. That is, GC in RR significantly inhibits the optimization of the ECS in local and adjacent regions.
Results of heterogeneous effects.
Note: ***, **, and * indicate significance at the 1%, 5%, and 10% levels, respectively.
This study believes that the sunk cost, brain drain, and low-cost advantage of coal in RR are the main reasons for the above results. First, in terms of sunk costs, since RI, such as extractive industries, are the pillar industries of RR, compared with NRR, RR has higher sunk costs and more difficult transformation. At the same time, because the current scale of GC cannot offset the losses caused by abandoning old equipment, the ECS in RR has not been effectively improved. Second, in terms of brain drain, knowledge-based talents tend to flow to the eastern coastal areas with higher economic development levels, resulting in a shortage of talents in resource-based areas. Therefore, although RR has recognized that technological innovation is an important way to break the “resource curse,” the lack of knowledge-based talents makes the current level of innovation in RR fail to reach the level of improving the ECS. In addition, although RR can use GC funds to attract talents through preferential policies and other measures, due to the rigid requirements of economic development, local governments will increase energy intensity to make up for the fiscal gap caused by this policy. As a result, the consumption of coal and fossil energy increases, which in turn inhibits the optimization of the ECS. Finally, in terms of the low-cost advantage of coal, although the green credit policy can implement measures such as tracking and monitoring the productive activities of enterprises to ensure that it is a green development model, it mainly monitors the emission of pollutants such as sulfur dioxide and air smoke and dust from enterprises. Therefore, profit-seeking “three high” enterprises will conduct terminal governance through technological innovation to achieve the goal of green development while still pursuing the low-cost advantages of coal and fossil energy, thus failing to complete the improvement of the ECS. In addition, although the Chinese government has tried to directly limit the coal consumption of enterprises through mandatory environmental regulations such as the coal consumption restriction policy, 42 some scholars have pointed out that this policy has not been able to improve the ECS. 43
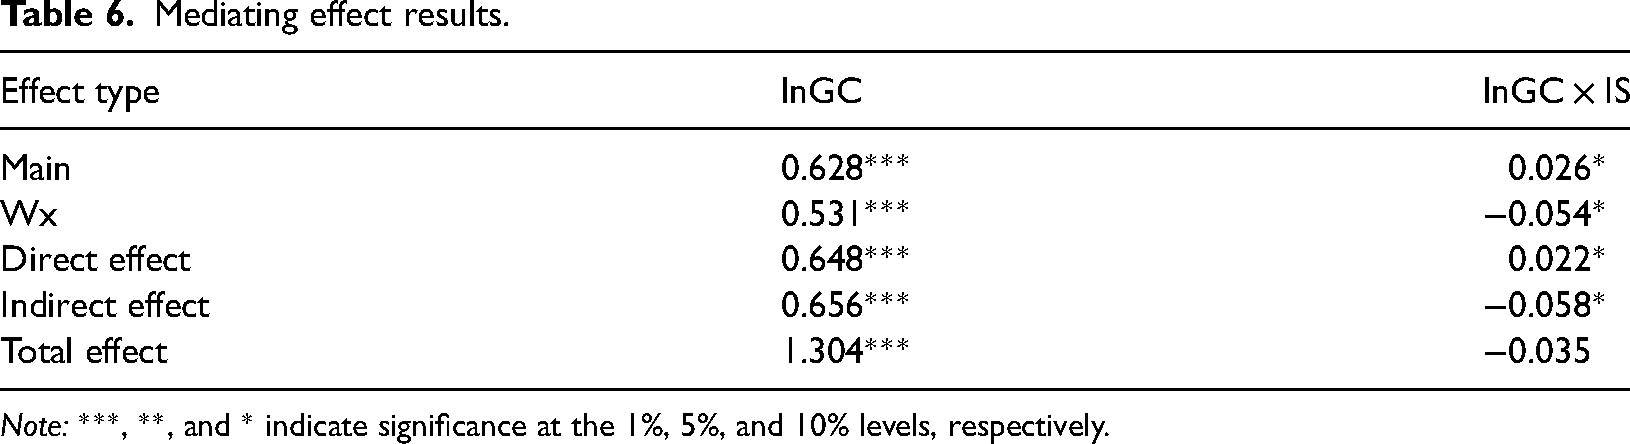
Mediation effect
In order to verify the research hypothesis that GC can effectively improve the ECS from the perspective of the symbiotic development of RI and NRI, this study uses model (3) to prove it, and draws the following conclusions (see Table 6): The coefficient of the direct effect of the
Mediating effect results.
Note: ***, **, and * indicate significance at the 1%, 5%, and 10% levels, respectively.
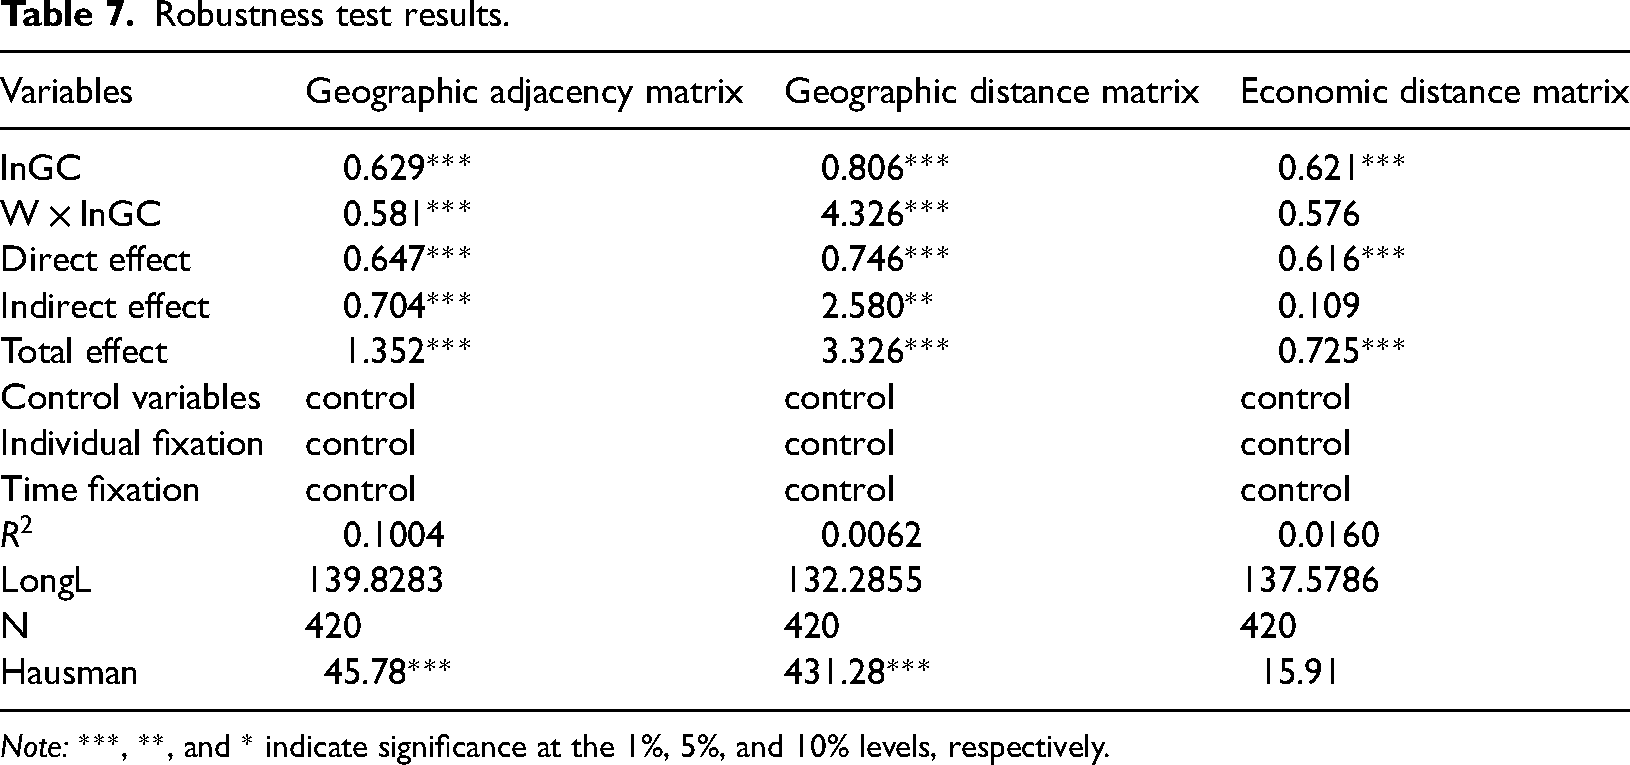
Robustness test
Since the spatial weight matrix is the basis of the spatial econometric model, this study verifies whether the relationship between GC and ECS is robust by replacing the spatial weight matrix with a geographic distance matrix and an economic distance matrix (see Table 7). The findings show that the results are essentially the same, meaning the conclusions of this study have certain robustness.
Robustness test results.
Note: ***, **, and * indicate significance at the 1%, 5%, and 10% levels, respectively.
Conclusions and policy recommendations
From the perspective of the symbiotic development of RI and NRI, this study discusses the path of GC optimization of ECS by using the space Durbin model, based on the panel data from 30 Chinese provinces from 2006 to 2019. The study results are as follows: First, both GC and ECS have a significant positive spatial correlation. Second, at a national level, GC can significantly optimize the ECS in local and adjacent regions. Third, from the different regions, the GC of the NRR can not significantly affect the ECS of the neighborhood, but it can effectively improve the local ECS.However, the GC of RR showed a significant inhibition effect on the optimization of both local and adjacent ECS. Finally, from the perspective of the symbiotic development of RI and NRI, although GC can significantly improve the local ECS, it will have a significant inhibitory effect on the optimization of the ECS in adjacent areas. The conclusion is still true after a series of stability tests. However, this study fails to analyze from a more microscopic perspective, and such issues will be the direction of future research. The following essential and useful policy proposals are endorsed in light of these findings:
First, from the national level, the role of GC in promoting the optimization of ECS should continue to be strengthened. Local governments should strengthen the preferential treatment and industry coverage of GC, actively use we-media and other means to expand the communication channels of green credit policies, and ensure that investment signals play their due role. Meanwhile, to reduce enterprises’ difficulty in engaging in technological innovation activities, local governments should further reduce loan interest rates for green investment projects such as energy conservation and emission reduction, set up more green fund projects, and establish a more comprehensive green project database. In addition, local governments should strengthen cooperation with financial institutions such as banks and reduce the possibility of enterprises participating in green cleaning and environmental fraud by means of tracking and supervision. This move is more targeted to set loan interest rates for green investment projects, rather than to judge based on the size of the enterprise, to reduce SME's financing constraints.
Second, from the perspective of the differences between RR and NRR, local governments should implement green credit policies according to local conditions to better play the role of GC in optimizing the ECS. Although the governments of RR have implemented relatively strict environmental regulations and other measures, the incentive tools for “three high” enterprises are relatively lacking. Therefore, local governments should provide financial support to enterprises in disguised form through policies such as environmental subsidies and pollution tax reductions to break through the existing cash flow dilemma and realize their own transformation and upgrading. Furthermore, to further improve the utilization efficiency of GC, the problem of brain drain in resource-based areas needs to be solved urgently. RR with strong innovation ability should improve the preferential treatment for knowledge-based talents by reducing the down payment amount for house purchase, so as to ensure that the local trained talents serve the local people. RR with weak innovation capabilities should prioritize improving local infrastructure construction and gradually participate in talent introduction after ensuring stable economic development.
Finally, from the perspective of inter-industry symbiosis development, the symbiosis level between RI and NRI should be strengthened. Local governments not only need to deepen the reform of the market system by simplifying administrative procedures and other means to realize the free flow of capital and labor, but also need to improve the infrastructure and build more industrial parks, so as to improve the degree of symbiosis between RI and NRI. Also, local governments should take the lead in organizing collaborative activities between RI and NRI. The strengthening of communication activities between enterprises is conducive to the formation of resource integration advantages so that enterprises can consider production and business models from the perspective of industrial chain extension. In addition, the development of exchange activities will gradually eliminate the gap between enterprises, which is conducive to the formation of advantages such as information disclosure and technology sharing.
Footnotes
Declaration of conflicting interests
The author(s) declared no potential conflicts of interest with respect to the research, authorship, and/or publication of this article.
Funding
The author(s) disclosed receipt of the following financial support for the research, authorship, and/or publication of this article: This work was supported by the Xinjiang Natural Science Foundation (grant number 2021D01B28, the Xinjiang Social Science Foundation (grant number 22CYJ011), the University-level Scientific Research Fund of Xinjiang University of Finance and Economics (grant number 2022XGC035, 2020XYB003), the Scientific Research Fund of Yili Normal University Xinjiang Social Governance and Development Research Center (grant number XJSHZL202109).