
Abstract
Most sub-Saharan African electricity generation is through renewable energy sources. However, the pace of renewable expansion is slow, mirrored by the region's low per capita electric power consumption and electricity access. The study examines the determinants of renewable electricity generation adoption in sub-Saharan Africa (SSA) countries using content description and a panel ARDL analysis. Findings from this study show that hydroelectric power is the long-standing renewable electricity source in the region. The deployment of non-hydro renewable electricity sources is slow despite its vast potential. In most evaluated countries, renewable electricity targets are below actual realization. Also, policies are ineffective in driving renewable electricity adoption, as indicated by the negative relationship between renewable electricity generation and policy enactments in SSA. Foreign direct investment and financial development significantly negatively impact renewable electricity adoption, suggesting that both factors do not expand renewable electricity generation. Feasible strategies for increasing non-hydro renewable electricity use include activating renewable energy support mechanisms and their uptake. In addition, governments in SSA should strengthen their legal and institutional frameworks and encourage lessening bottlenecks and bureaucracies associated with renewable electricity investment.
Introduction
Globally, sub-Saharan Africa (SSA) has one of the lowest electric power consumption rates per capita, indicating a lack of electricity access for its growing population. Therefore, except for a few fossil fuel-dependent countries, most countries in the SSA relied on renewables for electricity generation. This situation is partly due to fossil fuel subsidies, poor regulatory and institutional quality, and the high level of macroeconomic risk.1,2 However, the pace of renewable electricity expansion is constrained by environmental factors such as water resources, rain, wind, sun exposure, or unfavorable climatic conditions that imply high maintenance costs. Nevertheless, taking full advantage of renewable energy can support the existing grid system. This result could be achieved by integrating renewable energy such as small hydro, wind, and solar to meet peak demand and the eventual transition to reliable electricity sources.
Due to the skill gap and lack of technical know-how, the governments in SSA have relied on policy support mechanisms to encourage the adoption of renewable electricity technologies (RET). These measures are meant to facilitate the evolution and trends in the regulatory and non-regulatory environment to support renewable energy in the electric power sector. Consequently, several SSA countries have developed national renewable policies to fast-track the integration of renewable electricity generation. For instance, in 2014, Kenya designed its first comprehensive draft of the National Energy Policy with a renewable energy plan. A plethora of mechanisms like the renewable energy incentives and funding, feed-in-tariff, and setting-up of the Renewable Energy Research Centre were outlined in the policy document. 3 This initiative is to enable more growth in renewable energy. Likewise, in 2015 Nigeria passed its National Renewable Energy and Energy Efficiency Policy (NREEEP). 4 Short to long-term targets for grid-connected electricity and self-generation from RET (small hydro, wind, biomass, and solar) were set to fast-track electricity security and access in the country. Thus, while legal and institutional arrangements have mostly remained weak across the region, potentials through renewable energy are high.
As cited in Hafner et al., 5 the African Development Bank 6 estimated Africa's renewable electricity potential at 350 Gigawatts (GW) for hydroelectricity, 15 GW for geothermal, and 1000 GW for solar. Unlocking these potentials has a high chance of lifting the continent out of its decadal darkness and economic backwardness. Despite this seemingly enabling environment, the SSA (excluding South Africa) suffers from unreliable electricity supply due partly to inefficiencies of the existing systems. This situation results from poor maintenance and low-level investment in electricity infrastructure. Sometimes up to 30 percent of the available electricity generation in Africa ends up in distribution and transmission losses. 7 This situation has implications for the level of access and economic productivity. Although the population with access to electricity has doubled over the last two decades, progress remains uneven across some regional rural and urban locations (see Figure 1). Likewise, most industrial establishments and households resolve to self-generation using alternative power such as diesel and gasoline generating sets. These alternatives are estimated to be expensive and amount to over half the total installed grid. 9
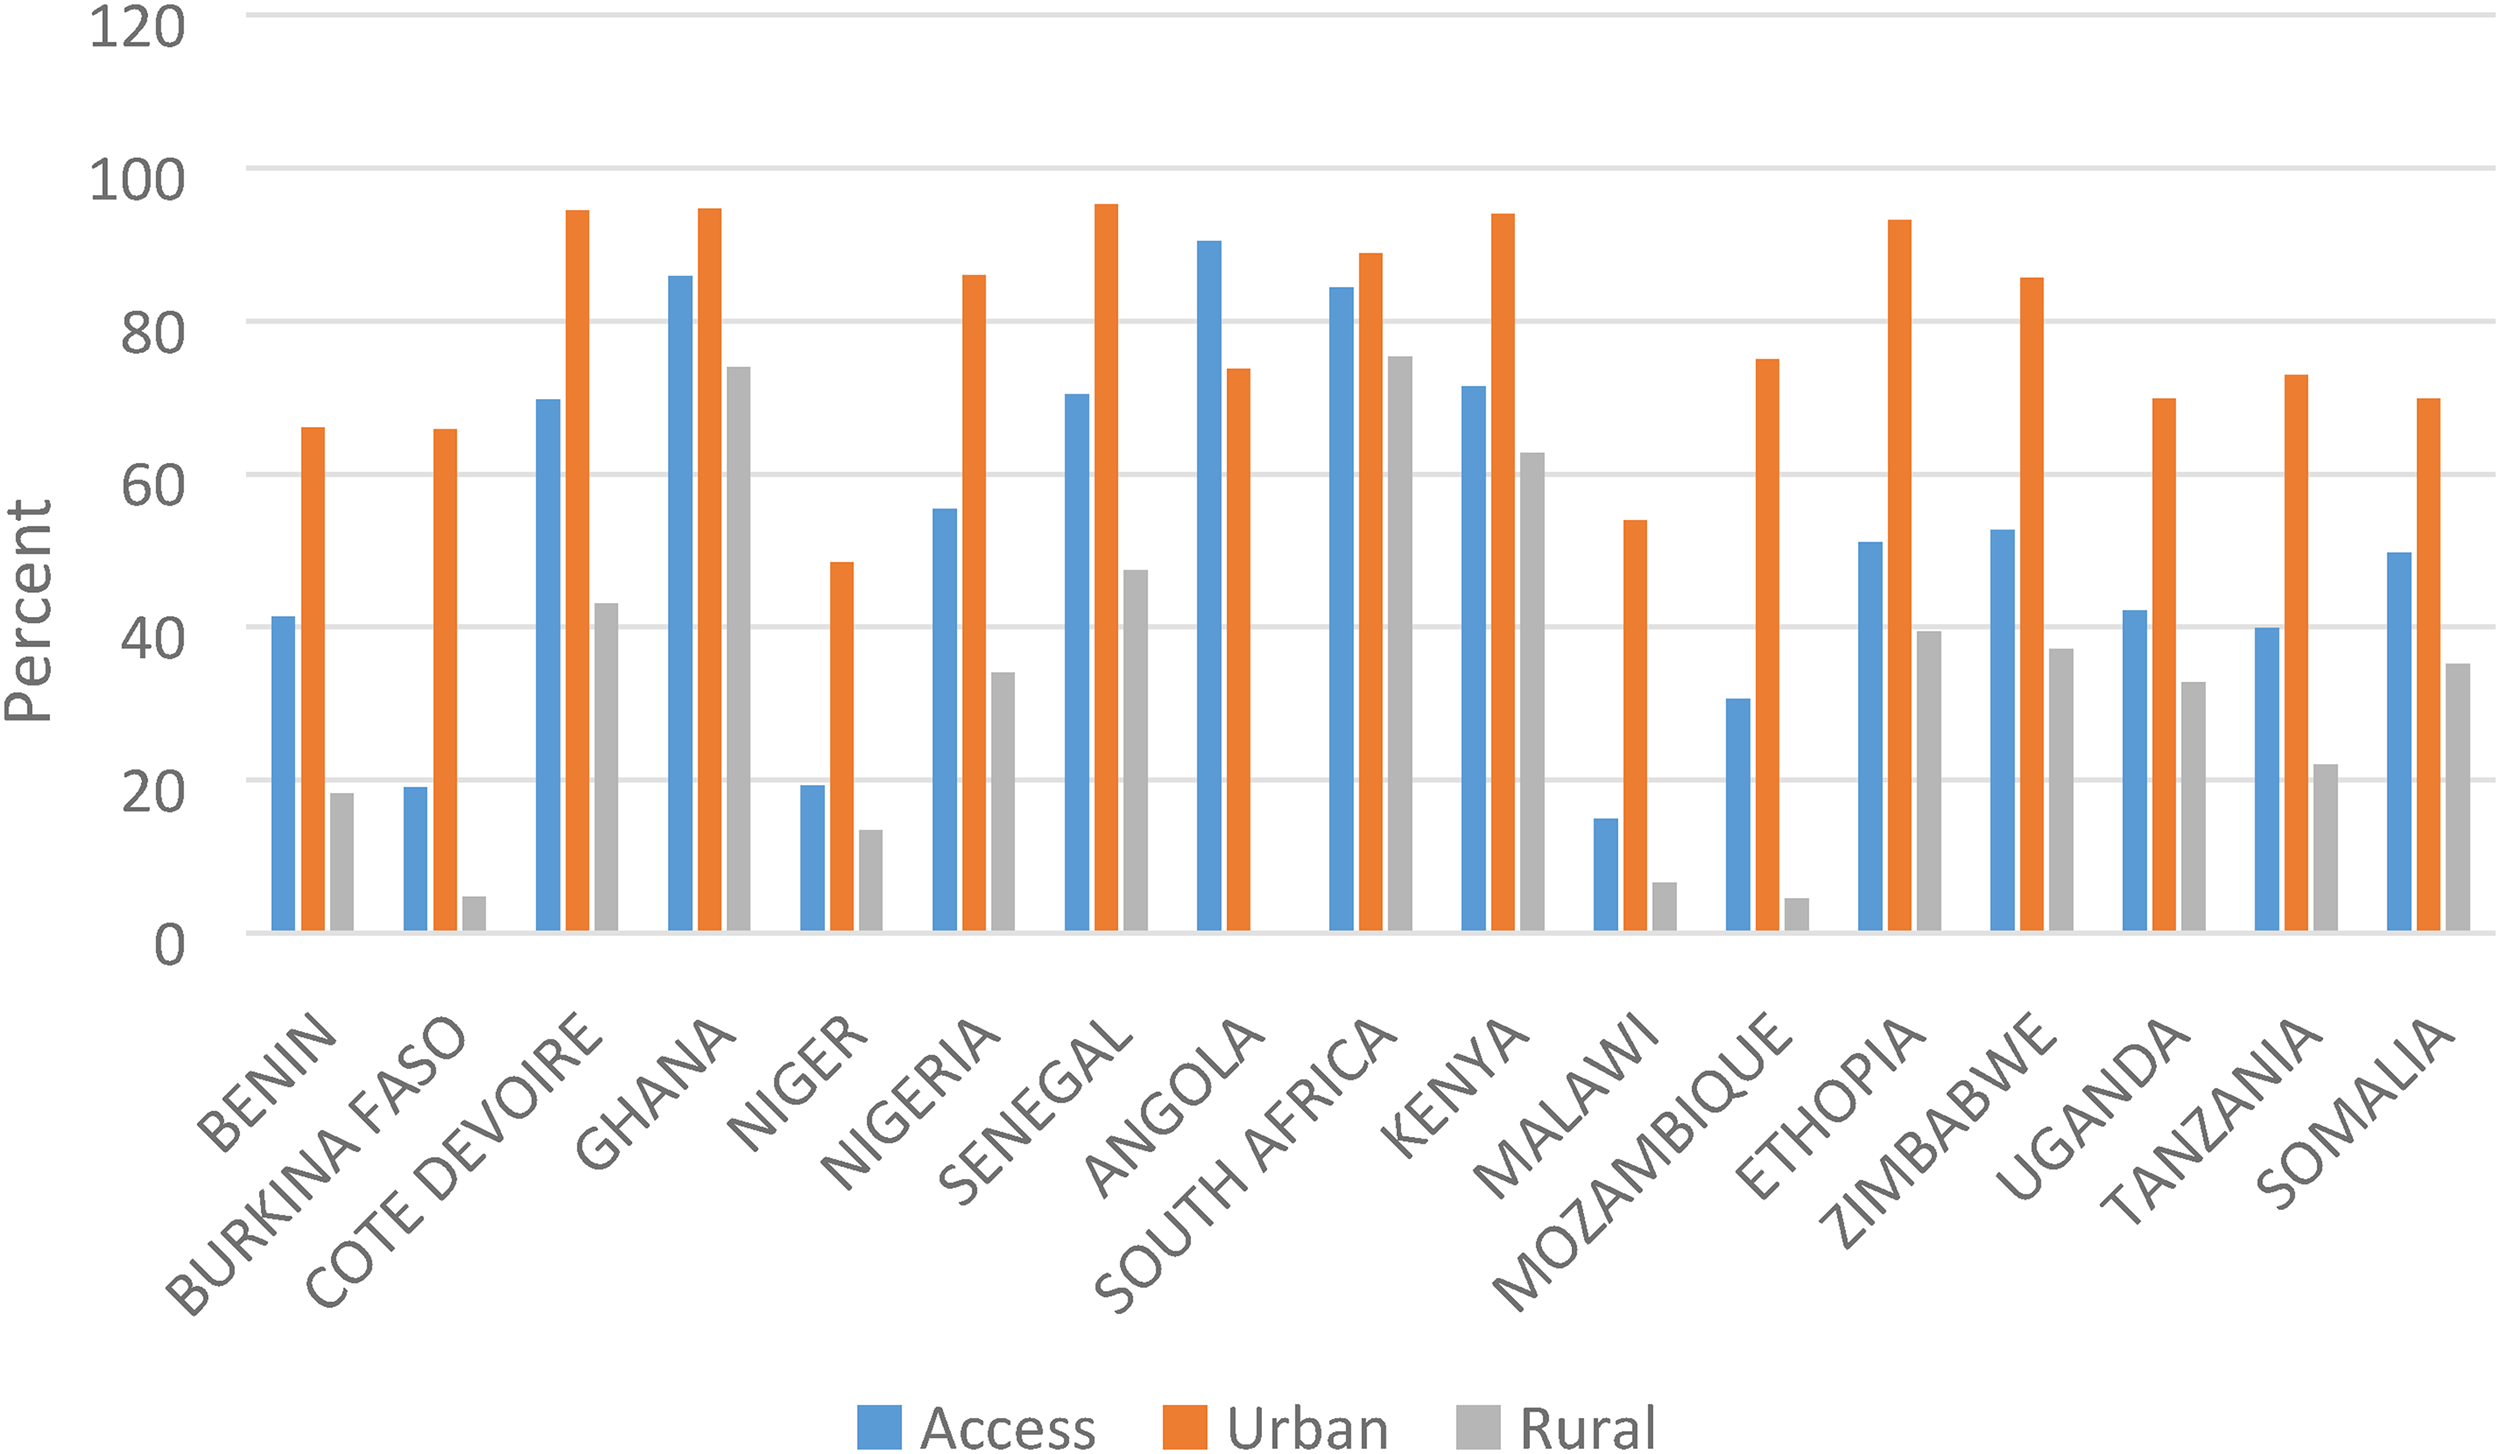
Population with electricity access in sub-Saharan African countries, 2020.
Interestingly, fossil-fuel-dependent countries like Nigeria and South Africa continued to experience energy transition challenges. For instance, Nigeria and South Africa ranked 109th and 114th out of 115th on the global Energy Transition Index (ETI), while non-fossil fuel-dependent countries like Namibia and Kenya ranked 62nd and 71st in 2019; respectively. The ETI benchmarks countries are based on two indicators, (i) energy system performance and (ii) readiness for transition to a sustainable and reliable energy future (Energy Transition Index Report 2019, World Economic Forum). Lagging countries like Nigeria and South Africa demonstrate the inertia of legacy systems and the need for an enabling environment. 10 On the other hand, modestly performed countries like Kenya are diverse in primary energy mix adoption and natural resource endowments. For instance, Kenya scored 51 percent in energy transition readiness in 2019, a situation facilitated by capable institutions and regulatory frameworks. This outcome is far above Nigeria's energy transition readiness score of 35 percent for the same period. However, considering the available renewable energy resources in SSA, the region may have a more diversified electricity generation portfolio if regulatory and institutional mechanisms are implemented.
The electrification strategy in the region has been dominated mostly by fossil fuels like coal, oil, and natural gas. Asides from being finite, fossil fuel consumption has a negative implication for the climate. The electricity and heat sector produces the highest CO2 emissions ahead of the transport sector, accounting for about 42.6 percent of Africa's total CO2 emissions. Therefore, the need for supplementary or even alternatives that are ideally non-depletable and free of carbon dioxide emissions is required to enhance the security of electric power supply and environmental sustainability.
To ensure the security of supply and increased access to the unserved and underserved communities, predominantly the rural ones, SSA must intensify efforts towards achieving its renewable energy policy for increased electricity access. Partly, this may facilitate progress and renewable energy transition. Also, the study provides contributions for scaling up modalities for abating the negative impact of climate change that has remained a source of global concern. Hence, this study assesses the determinants of renewable electricity generation adoption in SSA. The study adopts content descriptive and econometric analysis. The content analysis makes it possible to assess the country-specific characteristics and the depth and effectiveness of renewable energy policy for renewable development in SSA. The econometric analysis was used to estimate the drivers and barriers to renewable electricity adoption in SSA. For this purpose, the autoregressive distributed lag (ARDL) methodology was used.
These assessments are essential in several ways. First, the literature has established that the cost of renewable energy technologies is becoming cheap and out-competing non-renewable energy technologies, even in short-run costs. 11 The development is due to the minimal marginal cost against fuel generators that attract higher marginal costs. 11 Also, technological learning has continued to reduce the unit costs of electricity production, making investments in renewable energy technologies more economically attractive. 12 a As such, SSA stands to gain from its renewable energy potential for increased electricity access. This issue makes it imperative to empirically investigate the factors that may drive or impede the adoption of renewable energy technologies through econometric analysis. This assessment is crucial for identifying the role of renewable policy enactment and other environmental factors on SSA renewable electricity adoption. Hence, this study empirically examines the drivers and barriers to renewable electricity adoption in SSA.
Empirical studies in the literature were either country-specific16,17 or panel in nature.18–21 This study is also a panel analysis, but similar to it in the literature is the study by Muibi and Omoju, 17 which is country-specific. Unlike the existing literature, this study considered the role of renewable energy policy in facilitating the integration of renewables in electricity generation. Elsewhere, experience and skill accumulation enable the broad adoption of renewable technologies. In laggard economies that are less technologically advanced, public policy 22 could serve as a lever for developing renewable electricity generation. Unlike similar cross-country panel studies,23,24 this study takes cognizance of the level of Africa's renewable energy development and integration in the electricity sector. Across the energy sector, Africa's electricity has recorded tremendous progress ahead of other sectors in renewable electricity adoption. b This situation is due to the need for increased electricity access and sustainability. Thus, this study assessed the determinants of African renewable technology adoption by using data on electricity generation from renewable energy sources c .
The selected macroeconomic determinants of renewable electricity adoption are trade openness, financial development, and fossil fuel consumption. Beyond these macroeconomic variables, (i) Gross Domestic Product (GDP) per capita (level of economic development), (ii) foreign direct investment (FDI), and (iii) human capital are established in the literature as other factors that account for the adoption of renewable energy in developing countries.25,26 Following Pohl et al., 27 the national renewable energy policy enactment is also included in the analysis. Thus, this study examines the drivers of renewable electricity adoption in SSA using recent data (1990–2018) and the variables listed above. Beyond the empirical analysis, we also review the effectiveness of renewable electricity generation development in SSA. This issue provides an insight into the progress and challenges of deploying renewable electricity generation across contextual settings.
Including the introduction, the study is divided into five sections. The literature review is presented in section 2. Section 3 explains the data and methodology strategy. Empirical findings from the study are discussed in section 4. The last section concludes.
Literature review
Progress in technological change like renewable energy technology adoption is not likely to occur in a smooth pattern. 28 This pattern includes drivers and barriers which may lead to subsequent technological breakthroughs or slow deployment. 22 On the constraints to renewable electric power deployment, Foster et al. 29 found that the cost of fossil fuel power generation responds to the large-scale penetration of renewables making the renewable energy transition slower or more costly than anticipated. The approach followed is based on the supply-demand analysis. Similarly, Omri and Nguyen 19 discovered that higher oil prices were a barrier to renewable energy consumption in 64 countries from 1990 to 2011. Lin et al. 30 found that trade openness constricts renewable electricity consumption in Malaysia. The analysis applied a vector error correction model (VECM) with data from 1980 to 2015. According to He et al., 31 policy incentives (tariff surcharge subsidy) are not a significant determinant of RET in China. The study focuses on 29 provinces in China, applying a dynamic panel approach.
The subsequent narrative presents extant studies on the drivers of renewable energy adoption in the literature. For instance, a study by Bekun and Alola 24 examined the determinants of renewable energy consumption, particularly emphasizing twelve agrarian sub-Saharan African economies. The study has utilized a panel ARDL model with a dataset covering 1990 to 2014. Their results reveal that economic growth is a barrier to renewable energy consumption in SSA economies in the long run. Also, fossil fuel electricity generation significantly reduces clean energy consumption. Using the same temporal scope, 1990–2014, Silva et al. 23 found that economic development (GDP per capita) and increased energy use accounted for renewable energy development. This outcome was drawn from their evaluation of the determinants of renewable energy growth in 17 SSA countries using a panel ARDL data analysis.
In another study by Pohl et al. 27 on the determinants of renewable electricity technology adoption in developing countries, results show that factor endowments and the level of economic development are the driving determinants of hydropower electricity generation. Their analysis was a panel data approach estimation with data from 1980 to 2008. Similarly, Omri and Nguyen 19 evaluate the determinants of renewable electricity consumption in 64 countries from 1990 to 2011. They used a dynamic system-generalized method of moments (GMM) panel model across three homogenous income groups (high, middle, and low-income countries). An increase in carbon emissions and trade openness are among the significant drivers of renewable energy penetration across the different income groups. Muibi and Omoju 17 examine Nigeria's drivers of renewable electricity technology adoption. The study employed the Johansen cointegration and vector error correction methods using data from 1981 to 2011. They found that trade openness stimulates an increase in the share of renewable electricity in total electricity consumption. Finally, Lee et al. 32 investigated the determinants of renewable energy in Malaysia using an ARDL approach from 1980 to 2015. The study found that economic growth and FDI drive renewable electricity deployment.
Rafiq et al. 33 assess the drivers of renewable energy adoption in China and India. Their study approach adopts the Granger causality test with data from 1972 to 2011. Their empirical results show that, in the long run, carbon emission leads to increased adoption of renewable energy generation in India and China. He et al. 31 examine the drivers of technological innovation in renewables, focusing on 29 provinces in China based on a dynamic panel approach. They established that research and development intensity is the most important driver for all renewables in China.
Additionally, studies like Carley 34 and Marques and Fuinhas 35 established that public policy factors support the diffusion of renewable energy. Specifically, Carley 34 used a fixed-effects vector decomposition model to assess the linkage between state Renewable Portfolio Standard (RPS) policy implementation and the percentage of renewable energy electricity generation across the United States. The empirical findings reveal that implementation of the RPS does not determine the increase in renewable electricity generation, but in each additional year that a state has an RPS policy, the total amount of renewable energy generation increases. Marques and Fuinhas 35 found that public policy measures such as incentives or subsidies are significant factors that determine improved renewable energy use. The study analyzed a Panel Corrected Standard Errors estimator for European countries.
Several studies in the literature have assessed the determinants of renewable electricity generation. However, these analyses are across different income groups, using similar macroeconomic variables and various measures (share of renewable electricity consumption/generation) of renewable electricity adoption. On the other hand, country-specific studies in SSA consider only selected macroeconomic variables like GDP, trade openness, financial development, and fossil fuel consumption. Other macroeconomic variables, such as GDP per capita used to capture the level of development, FDI, human capital, and public policy factors, are found to be other factors that account for the renewable electricity penetration.25,26–35 Thus, in addition to macroeconomic variables, this study accounted for the role of national renewable energy policy legislation on renewable electricity adoption in SSA.
Data and methodology
Data
The dataset used is an annual series from eighteen (18) SSA countries, spanning 1990 to 2018. Firstly, the countries selected were based on data availability for the analysis period. Secondly, hydroelectric power is the prominent renewable energy across almost all the countries selected compared to other renewables. Lastly, electricity generation is mainly through the centralized grid system. The off-grid system is relatively a new concept in most of these countries, and as such, information is limited. These similar characteristics remove any form of selection bias that may limit the reliability and validity of the empirical analysis. A complete list of countries is in the Appendix (Table A1). In addition, the data are from secondary sources through various online databases and past relevant studies (Table 1).
Summary of dataset.
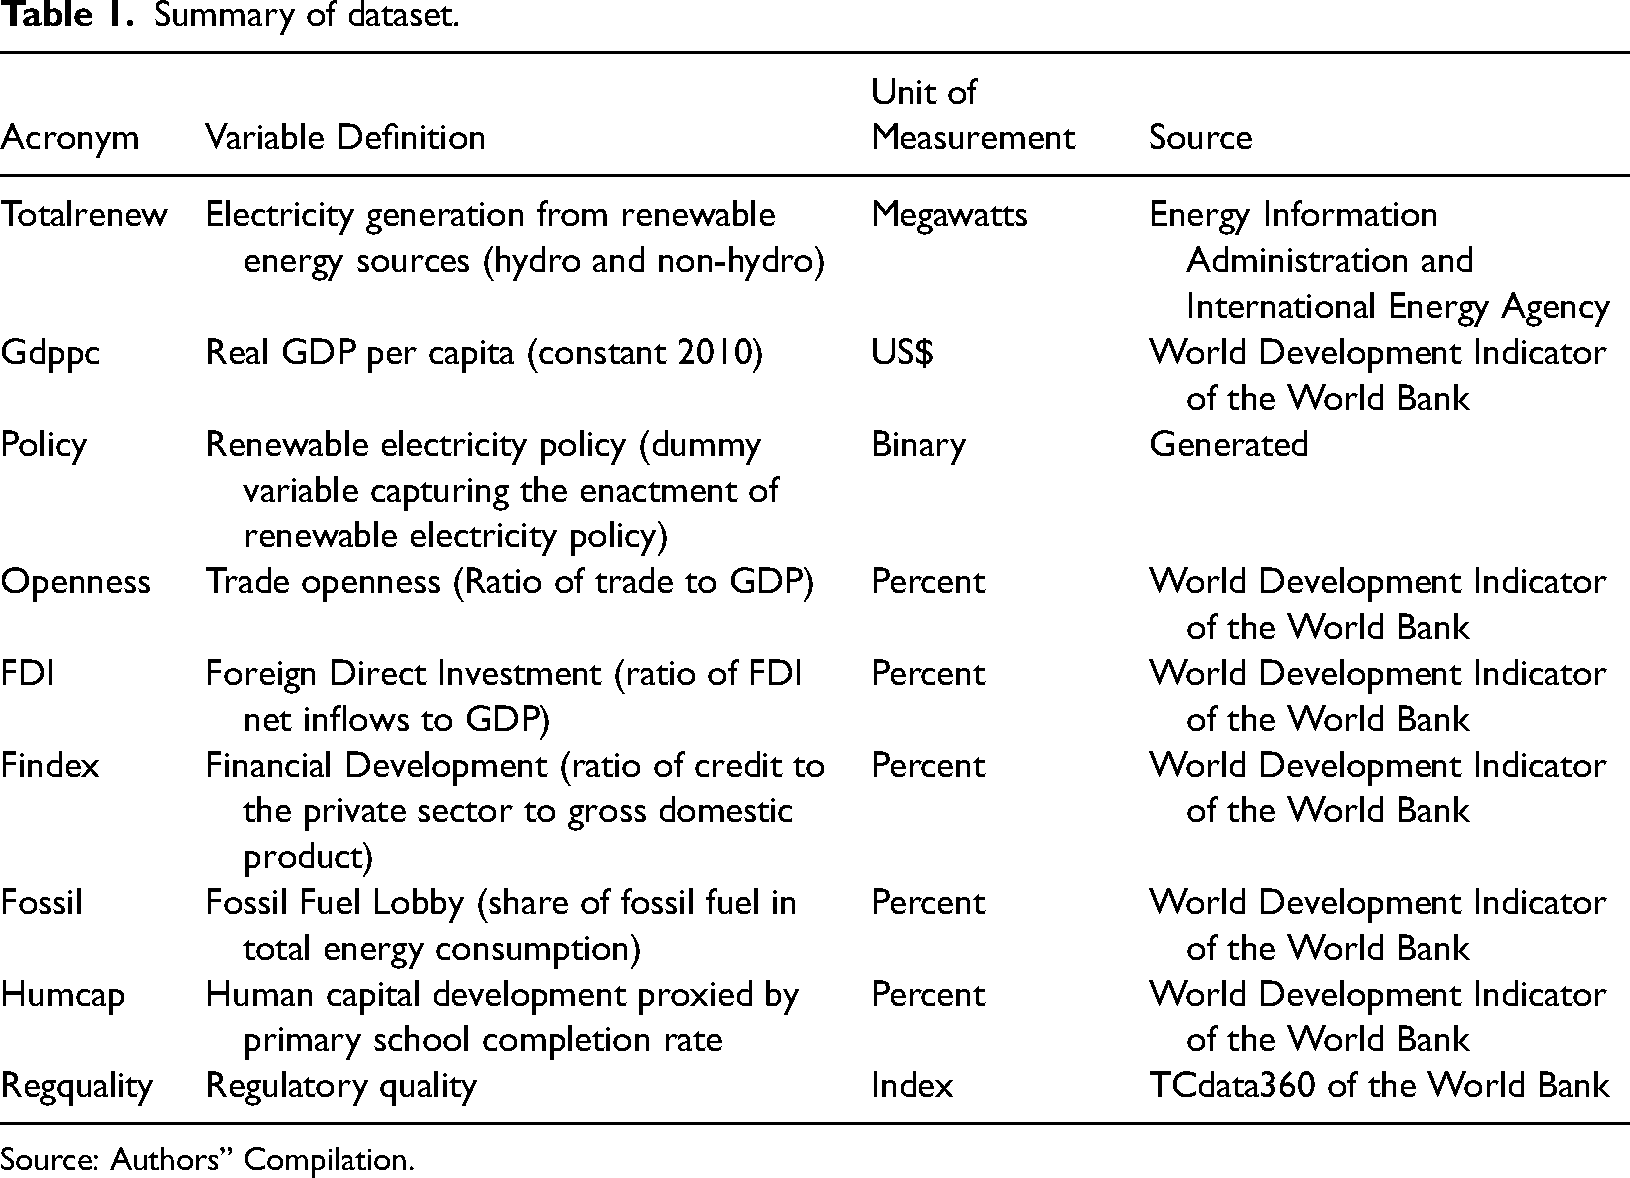
Source: Authors” Compilation.
The selected variables are a mix of macroeconomic and political indicators. The macroeconomic variables were selected and justified as determinants of renewable electricity adoption in developing countries 17 ,19,23–27,32. These variables include GDP per capita, FDI, trade openness, financial development, human capital, and fossil fuel consumption (fossil fuel lobby). Renewable energy policy ratification across the selected countries measures its political relevance. Although Pohl et al. 27 examined the determinants of renewable electricity generation across a comprehensive range of electricity technologies (e.g., hydro, wind, solar, and geothermal), due to the paucity of disaggregated data, this study only considered aggregate renewable electricity generation. In addition, indicators of energy transition and electricity access are used.
Table 1 summarises the dataset used in the econometric analysis. The GDP per capita measures the level of economic development that serves as an impetus for investment in renewable electricity projects. Intuitively, countries with a higher GDP per capita can attract new domestic or foreign investment more quickly than those with lower values. The level of investment in that context also could diminish or enhance financial market development for sustainability financing. Trade openness and human capital development facilitate skill transfer and technical know-how. The legacy of the fossil fuel system sustained through various fiscal subsidy regimes in most SSA countries could affect the rate of renewable electricity adoption depending on government determination to aid welfarism at a cost to the environment. These environmental factors could drive or impede the development of renewable electricity generation.
Methodology
The study used content and econometric analysis. The content analysis was based on a systematic review of development around renewable electricity generation in SSA. The review provides some insight into the achievements and challenges of renewable energy policies/programs vis-à-vis electricity generation in SSA. In addition, key indicators that measure the development of renewable electricity generation were examined. These indicators include the share of renewable electricity in total electricity generation, energy transition index, and electricity access.
For the content analysis, we narrowed our sample to eight countries with the highest share of renewable energy in on-grid electricity generation. Our selection criterion is based on a rule of thumb. Countries with 500 MW and above renewable electricity generation were considered to facilitate a balanced review. The lesson learned could suffice in drawing implications and suggestions across the countries, including those with fewer megawatts of renewable electricity generation.
The econometric analysis, based on a panel Autoregressive Distributed Lag (ARDL) approach, was adopted to examine the long-run determinants of renewable electricity adoption in SSA. To this effect, the analysis is within a technology diffusion framework. The macroeconomic determinants of renewable electricity adoption (aggregation of electricity generation from hydro and non-hydro renewable technologies) were used as control variables d .
A typical practice in panel analysis with a long time series is determining the series stationarity through a unit root test. The ARDL approach is based on the assumption that series are integrated of order zero, I(0), one, I(1), or a mixture of both. Therefore, testing the stationarity level is a precondition for the analysis. Two types of panel unit root tests that are most appropriate for a heterogeneous panel model are considered in this study. The first unit root test is the Levin–Lin–Chu test, 37 which assumes individual unit shares a common AR(1) coefficient, but takes cognizance of individual and time effects. The second is the Im-Pesaran-Shin test, 38 which assumes unit root in individual processes. The two tests are ideal for a heterogeneous panel model, and the outcome is usually reinforcing.
Specifically, a panel model of the kind specified by Silva et al. 23 is adopted. A panel ARDL model of 18 countries over 28 years is analyzed (Table A1, in Appendix). Specifically, the panel ARDL with pooled mean group (PMG) estimator by Pesaran, Shin, and Smith 39 is adopted. The PMG estimator limits the long-run coefficients to be identical across groups but with different short-run coefficients across groups. These unique characteristics make it suitable for our dataset, which has long time series (T) and many crosses (N). The panel ARDL model has an advantage over the cointegration tests focused only on non-stationary variables. Indeed, the ARDL model performs better than the models developed by Engle and Granger 40 , Hansen and Phillips, 41 Johansen, 42 and Flavio and Cleomar. 43 It also performs better, irrespective of whether variables are stationary, non-stationary, or mutually cointegrated. 39 The order of integration with a mixture of I(0) and I(1) variables makes this method apt.
The short and long-run model estimated is specified in eq. (1) and (2). In the conditional ARDL (p, q1… q4) and (p, q1), the long-run model for generation from renewable electricity technology is estimated based on the specification in equation (1).

Empirical results and discussions
Effectiveness of renewable energy policy in promoting adoption of renewables for electricity generation
Unlike developed countries, renewable energy policies in developing countries, including SSA, are deployed to increase electricity access in the region. As such, support mechanisms are required to scale up the electrification rate in SSA. The expansion of a centralized grid system proved insufficient and expensive in enhancing electricity supply and access across urban and rural locations. Thus, this study measures the effectiveness of the RE policy using quantitative indicators such as on-grid RE generation, energy transition index, and electricity access in countries with high RE development in the region e . The country-specific analysis, adopted herein, has an advantage over the Policy Effectiveness Index, which measures the effectiveness of overall renewable policy without accounting for heterogeneity associated with a specific context. 45 However, due to the paucity of data, the analysis is based on the outcome of the above indicators. Thus, the approach may limit country comparison on the level of effectiveness of RE policies. However, it will guide policymakers and practitioners on what works best in the selected countries (Angola, Ethiopia, Ghana, Kenya, Mozambique, Nigeria, South Africa, and Zambia).
Angola
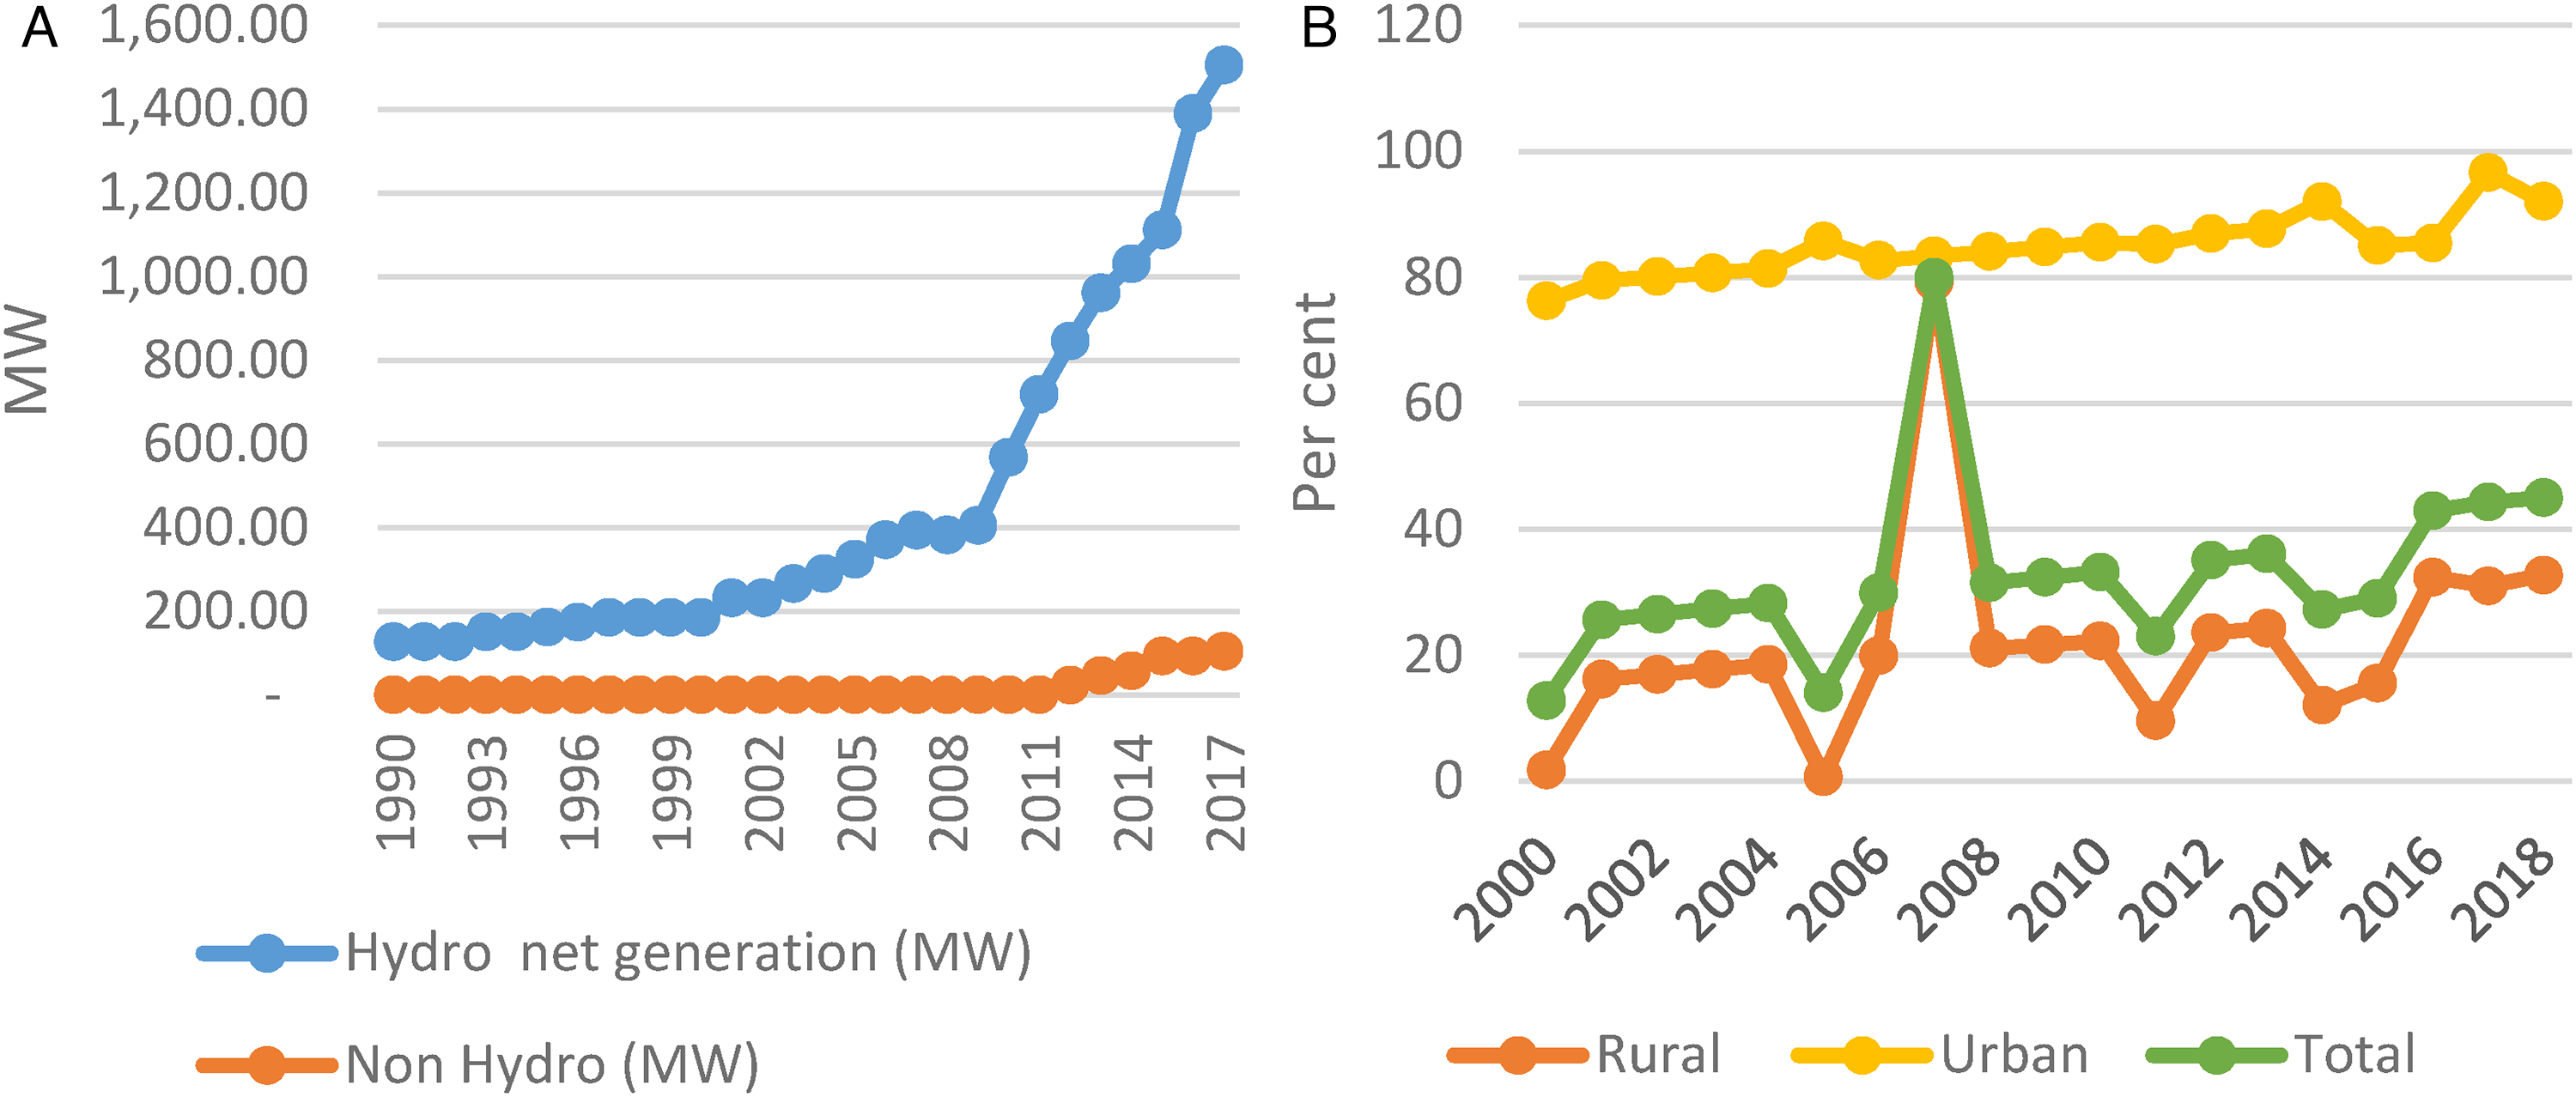
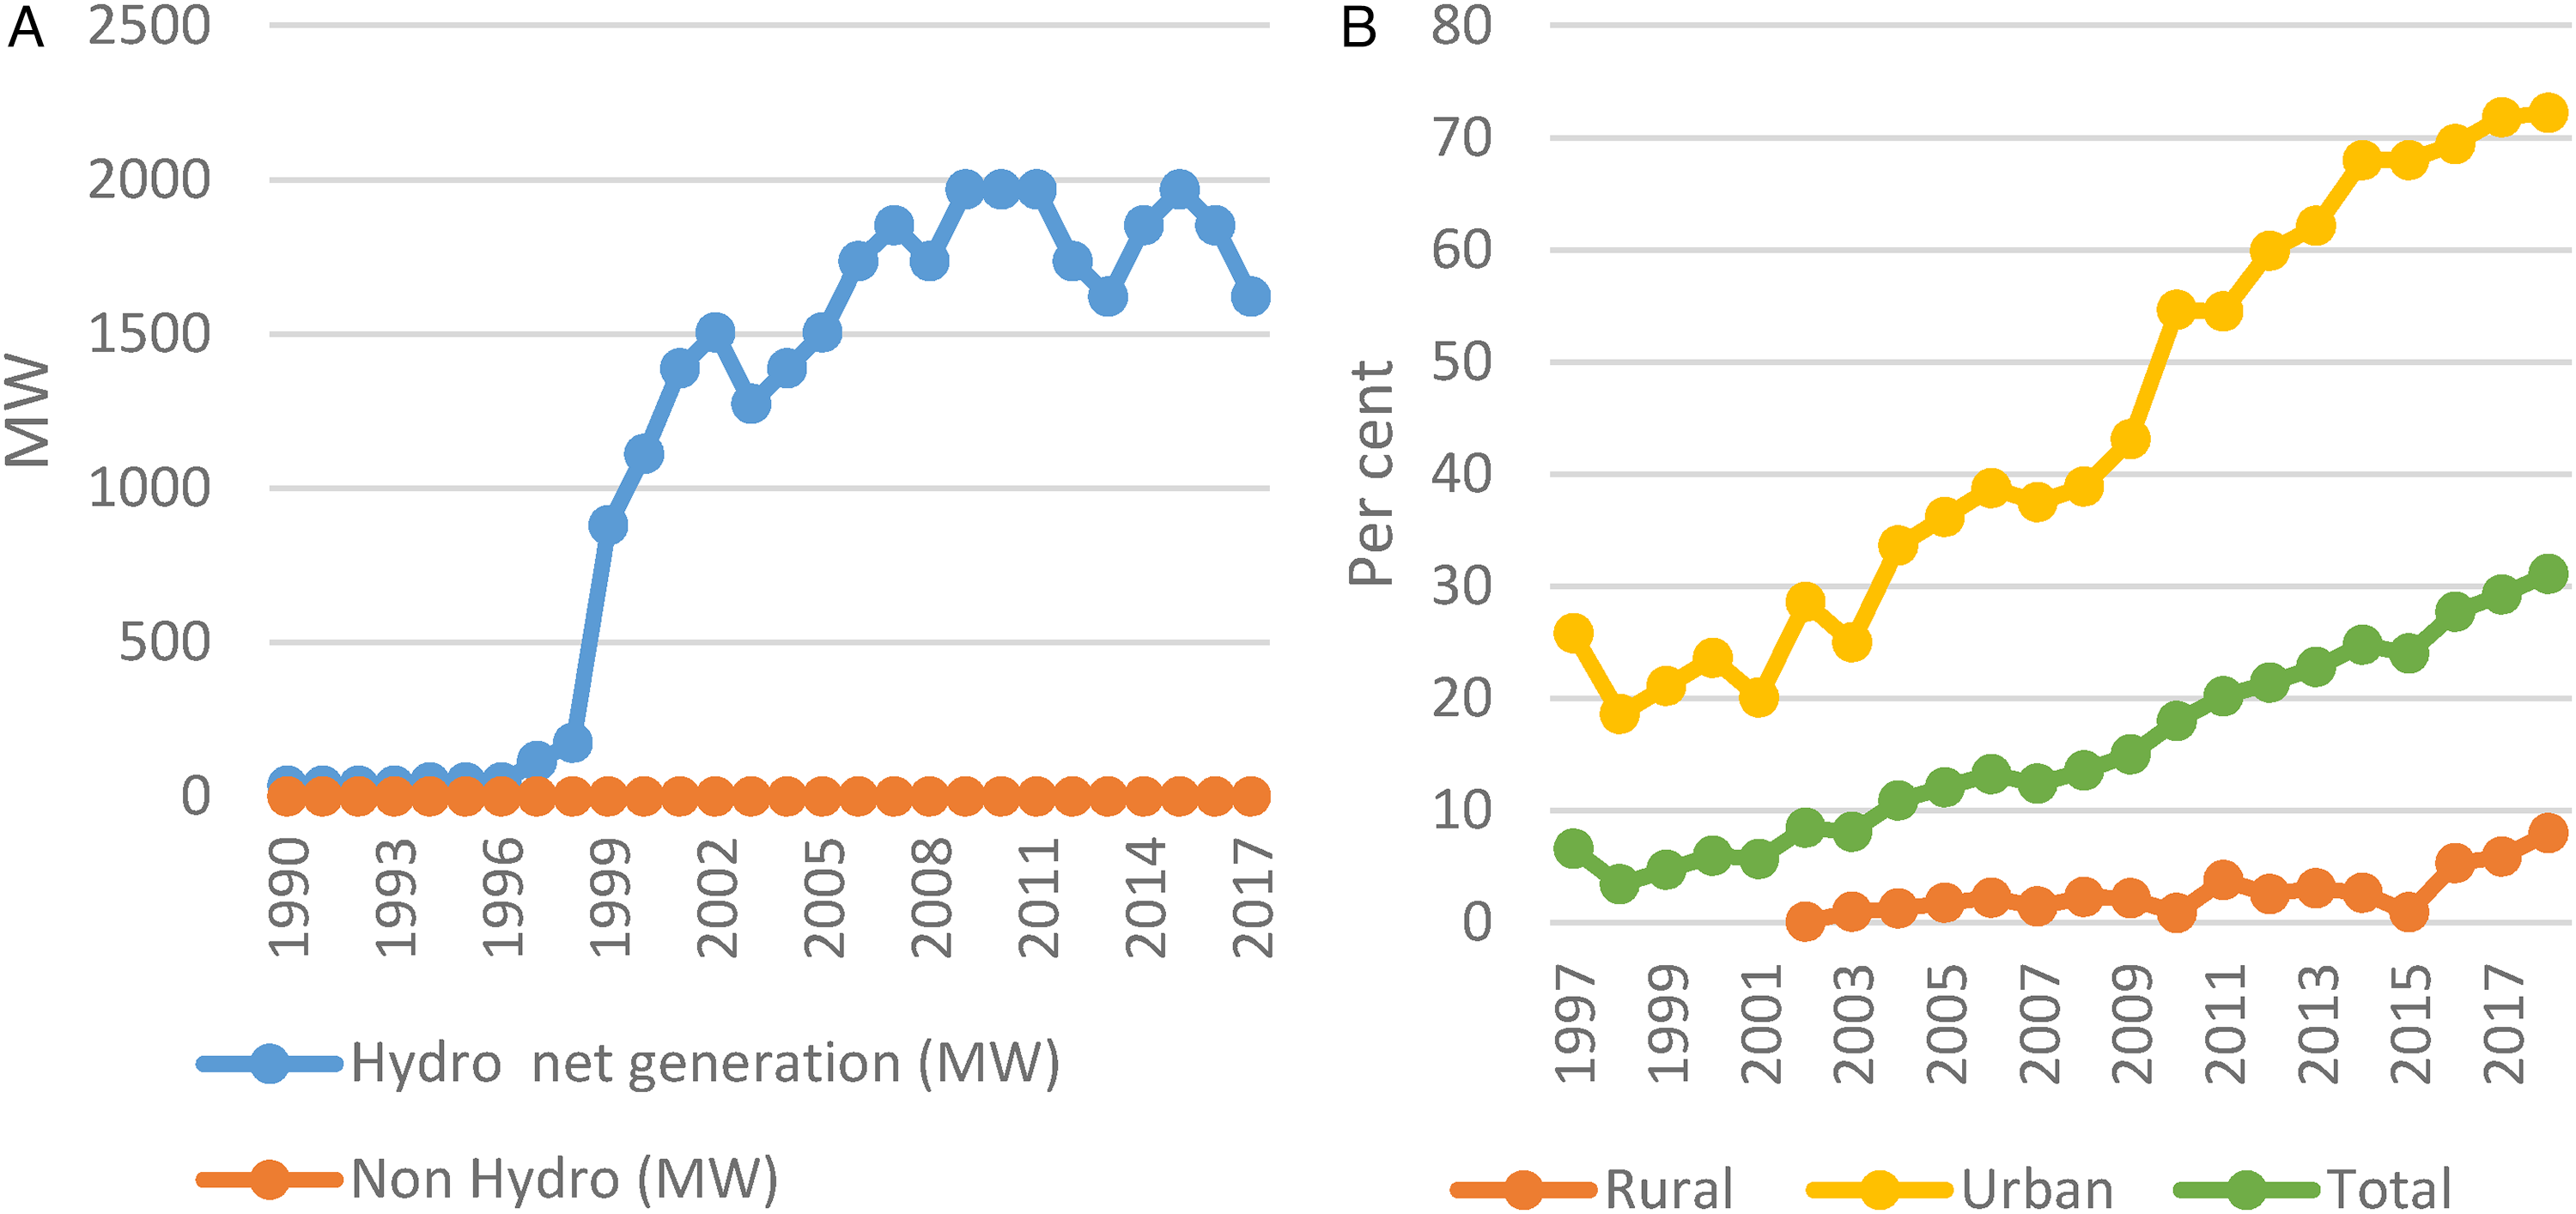
In Angola, hydropower accounts for 70 percent of total electricity generation in 2018. 46 The share of hydroelectric power makes Angola one of the countries with high renewables integration in SSA's electricity generation mix. Hydro remains a top priority for increasing electricity access and sustainability. Although efforts abound to scale the penetration of other renewables besides hydroelectric power, the deployment rate is slow. As shown in Figure 2, panel A, the contribution of non-hydro to total renewables before 2016 was zero. From 2016 through 2017, solar and bioenergy accounted for 23 MW in electricity generation despite potential from other renewables.
Renewable electricity generation and electricity access in Angola. Panel A: Trend in Renewable Electricity Generation in Angola.
Potentials from renewable and non-renewable energy abound for electricity generation and increased access in Angola. Regarding fossil fuel deposits and crude oil production, Angola is ranked the second largest in SSA, with a proven reserve of 8190 million barrels. 47 The country has potential for electricity generation across renewable resources like solar, hydro, bioenergy, and wind. For instance, Angola has a high solar resource potential, with an annual average global horizontal radiation between 1.350 and 2.070 kWh/m2/year. 48 However, for Angola's over 20 million population, electricity access is just 43 percent (Figure 2, Panel B). The situation is grave in rural areas as only about 3 percent of the population can access electricity.
On the other hand, about 74 percent of the population in the urban areas has electricity access. The marked disparity between rural and urban areas indicates a gap in infrastructure and investment in the electricity sector value chain. Infrastructures are available in a few main cities, where the public sector and wealthier consumers are located. 48
Angola's low electricity access suffers from a lack of legal and institutional frameworks that could lead to widespread electrification, especially in rural areas. The Government of Angola has set a target of 9900 MW of installed generation capacity and a 60 percent national electrification rate by 2025. 49 However, this plan is mainly for the urban areas. 48 In addition, the country has not established the recently approved national rural electrification agency. Setting up this institution with adequate resource mobilization would scale up rural electrification efforts in Angola. Besides, there are no support mechanisms for the diffusion of intermittent renewable resources.
The lack of legal and institutional frameworks has partly discouraged the private investment required to expand electricity infrastructure. In addition, the government has continuously relied on its budgetary allocation to finance the electricity sector. This situation limits private-sector resources in the country's electrification strategy. A more conducive environment could stimulate private sector interest in Angola's electrification drive for increased access and sustainability.
Ethiopia
Ethiopia is one of East Africa's countries leading renewable electricity transitions. The country's renewable electricity is mainly through hydroelectric sources. In total primary energy supply, renewable energy accounted for 89 percent in 2017. 50 Also, Ethiopia's Energy Transition Index improved by 4 points when its ranking increased to 95 in 2019 as against 99 in 2018 (Table 2). However, the rank declined to 97 in 2020, probably due to the impact of the COVID-19 pandemic on the electricity sector. Renewable sources dominate the country's electricity mix in the electricity sector with 98 percent. The country's electricity generation capacity, at 4554 MW, comprises 98 percent hydroelectricity, 0.2 percent solar, 7 percent wind, 6 percent bioenergy, and 0.2 percent geothermal.
Energy transition Index, Ethiopia.
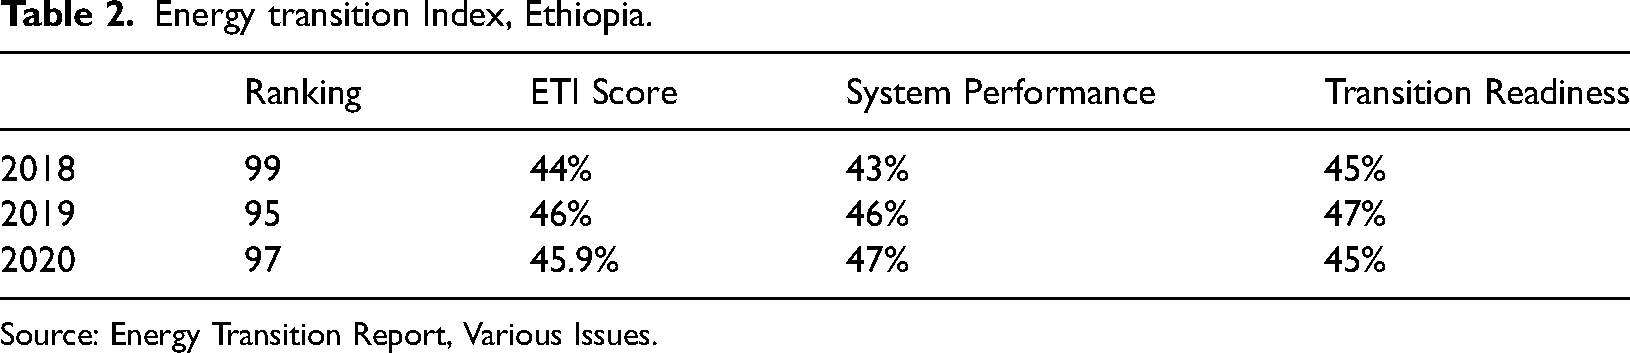
Source: Energy Transition Report, Various Issues.
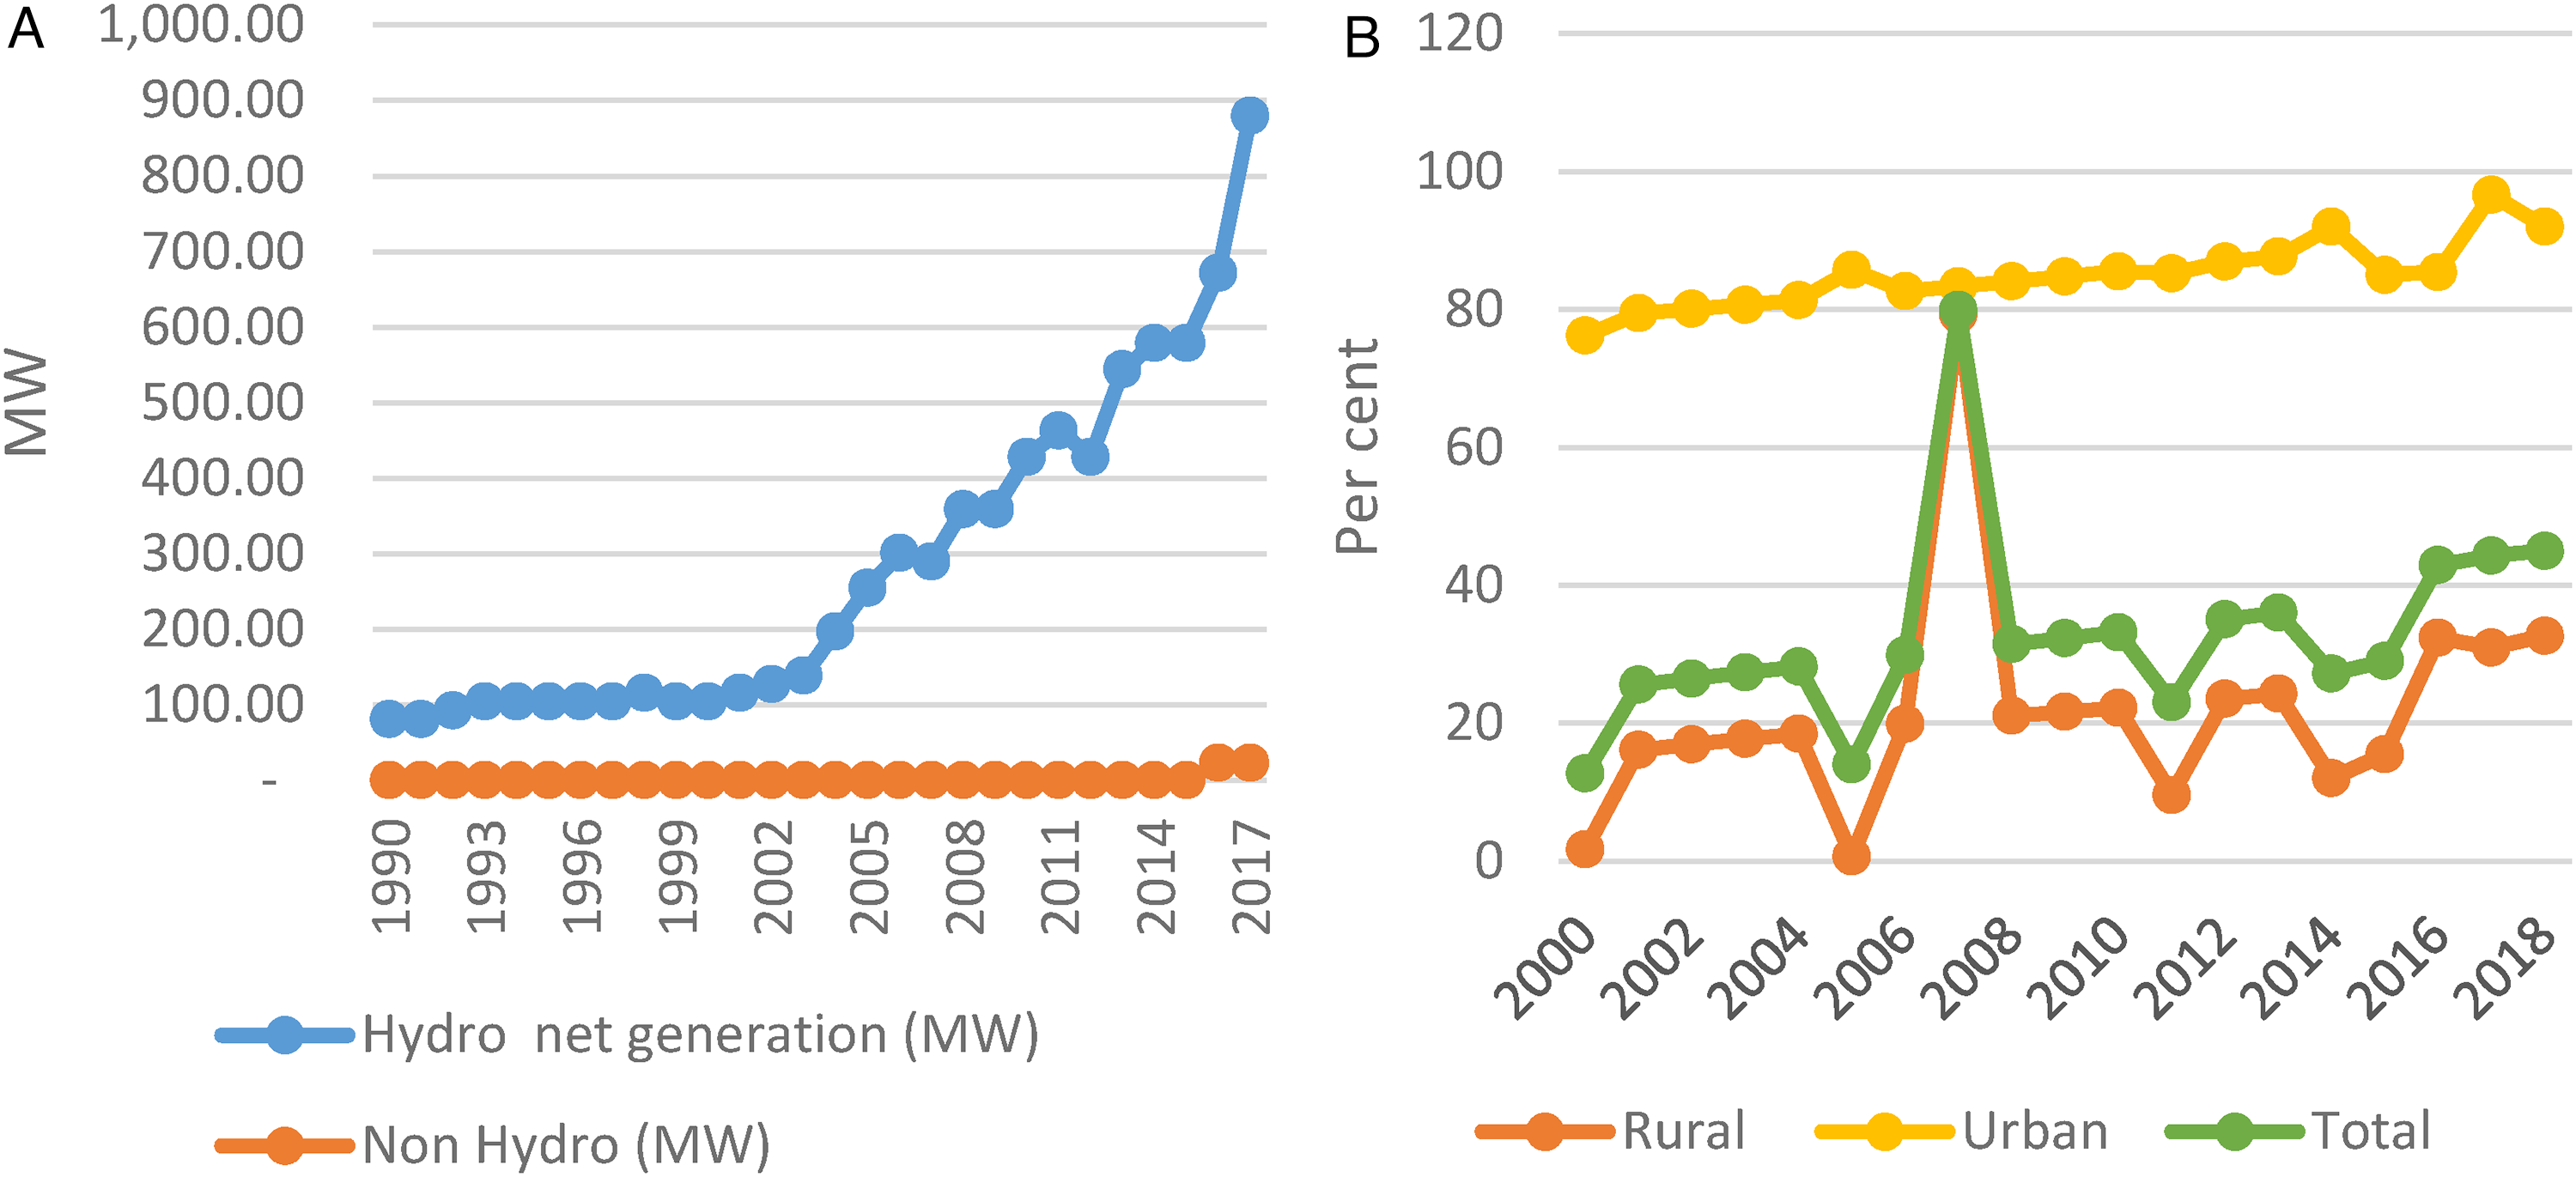
From 2000 to 2018, the population with access to electricity more than doubled to about 45 percent. However, the urban and rural gap is vast, with urban electricity access reaching 92 percent to 32 percent in rural Ethiopia (Figure 3, Panel B). This situation is because Ethiopia's electricity sector is public sector driven with little space for the private sector. Private sector participation in the electricity sector is a recent development as large utility-scale projects inhibit the integration of off-grid systems. Thus, the emphasis on the centralized grid system and the limited private sector participation is one of the many factors inhibiting electricity access in Ethiopia, especially in the rural areas. No known policy mechanism could stimulate private sector investment and encourage the distributed renewable electricity asides from hydropower.
Renewable electricity generation and electricity access in Ethiopia panel A: trend in renewable electricity generation in Ethiopia.
Legal and institutional support could expedite the financing of off-grid renewable electricity, considering Ethiopia's seemingly large renewable energy potential. Renewable energy potential for 100 GW of wind power and 7 GW of geothermal exists in Ethiopia (EEP, 2016, as cited in . 51 The resources provide an opportunity to expand electricity access through off-grid technologies. Support mechanisms like the feed-in tariff, net metering, and other financial incentives will fast-track the country's electrification rate, especially at the rural level, for increased access and economic growth. Thus, continuous support for large utility-scale electricity projects may delay progress in energy transition and other benefits that may accrue.
Ghana
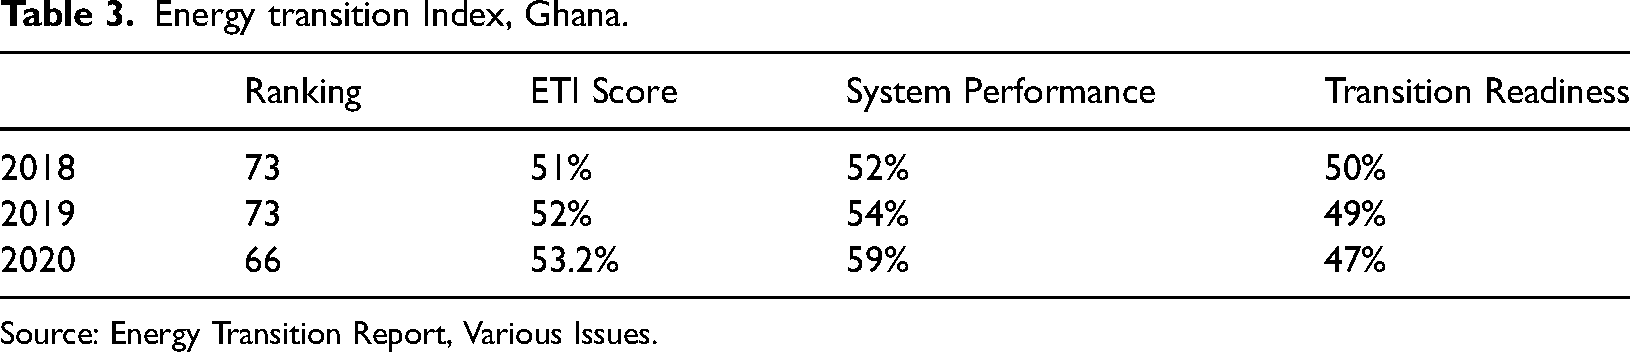
Unlike the other SAS countries examined, Ghana's electricity generation is mainly through non-renewable energy sources, particularly oil. In 2019, hydroelectric and solar power accounted for 34 percent of total electricity generation capacity. Accordingly, hydroelectric, solar power, and bioenergy were 36 percent, 0.2 percent, and 2 percent of the available generation in 2019. Figure 4 of panel A reflects a widening gap between hydropower and other renewables. Like other SSA countries, hydropower is Ghana's conventional and long-standing renewable energy. In contrast, the country's low energy transition index confirms a limited penetration of non-hydro renewable energy (Table 3). In addition, the country's RE development is impeded by its limited learning and experience curve and a challenging investment environment due to the perceived high macroeconomic risk. 52
Renewable electricity generation and electricity access in Ghana. Panel A: Trend in Renewable Electricity Generation in Ghana.
Energy transition Index, Ghana.
Source: Energy Transition Report, Various Issues.
Ghana is one of the countries with increased electricity access in sub-Saharan Africa. The population with electricity access increased to about 79 percent in 2018 (Figure 4, Panel B). Unlike other countries, electricity access has grown consistently across Ghana's urban and rural locations. The country's aggressive electrification strategy facilitated its electrification rate across rural and urban areas. A good example is the Self-Help Electrification Programme (SHEP), which led to the extension of electricity to about 82.5 percent of the population by the end of 2016. 53
Legal and institutional frameworks exist for promoting the penetration of non-hydroelectric renewable electricity. For instance, Ghana has active net metering and a feed-in tariff for electricity generated from renewable sources. These legislations explain Ghana's better performance in the Energy Transition Index ranking. The country's ranking improved from 77 in 2018 to 66 in 2020 (Table 3). This situation is due to the country's system performance, which has recently scaled to 59 percent. Hence, Ghana has expanded and increased electricity access across urban and rural locations.
Kenya
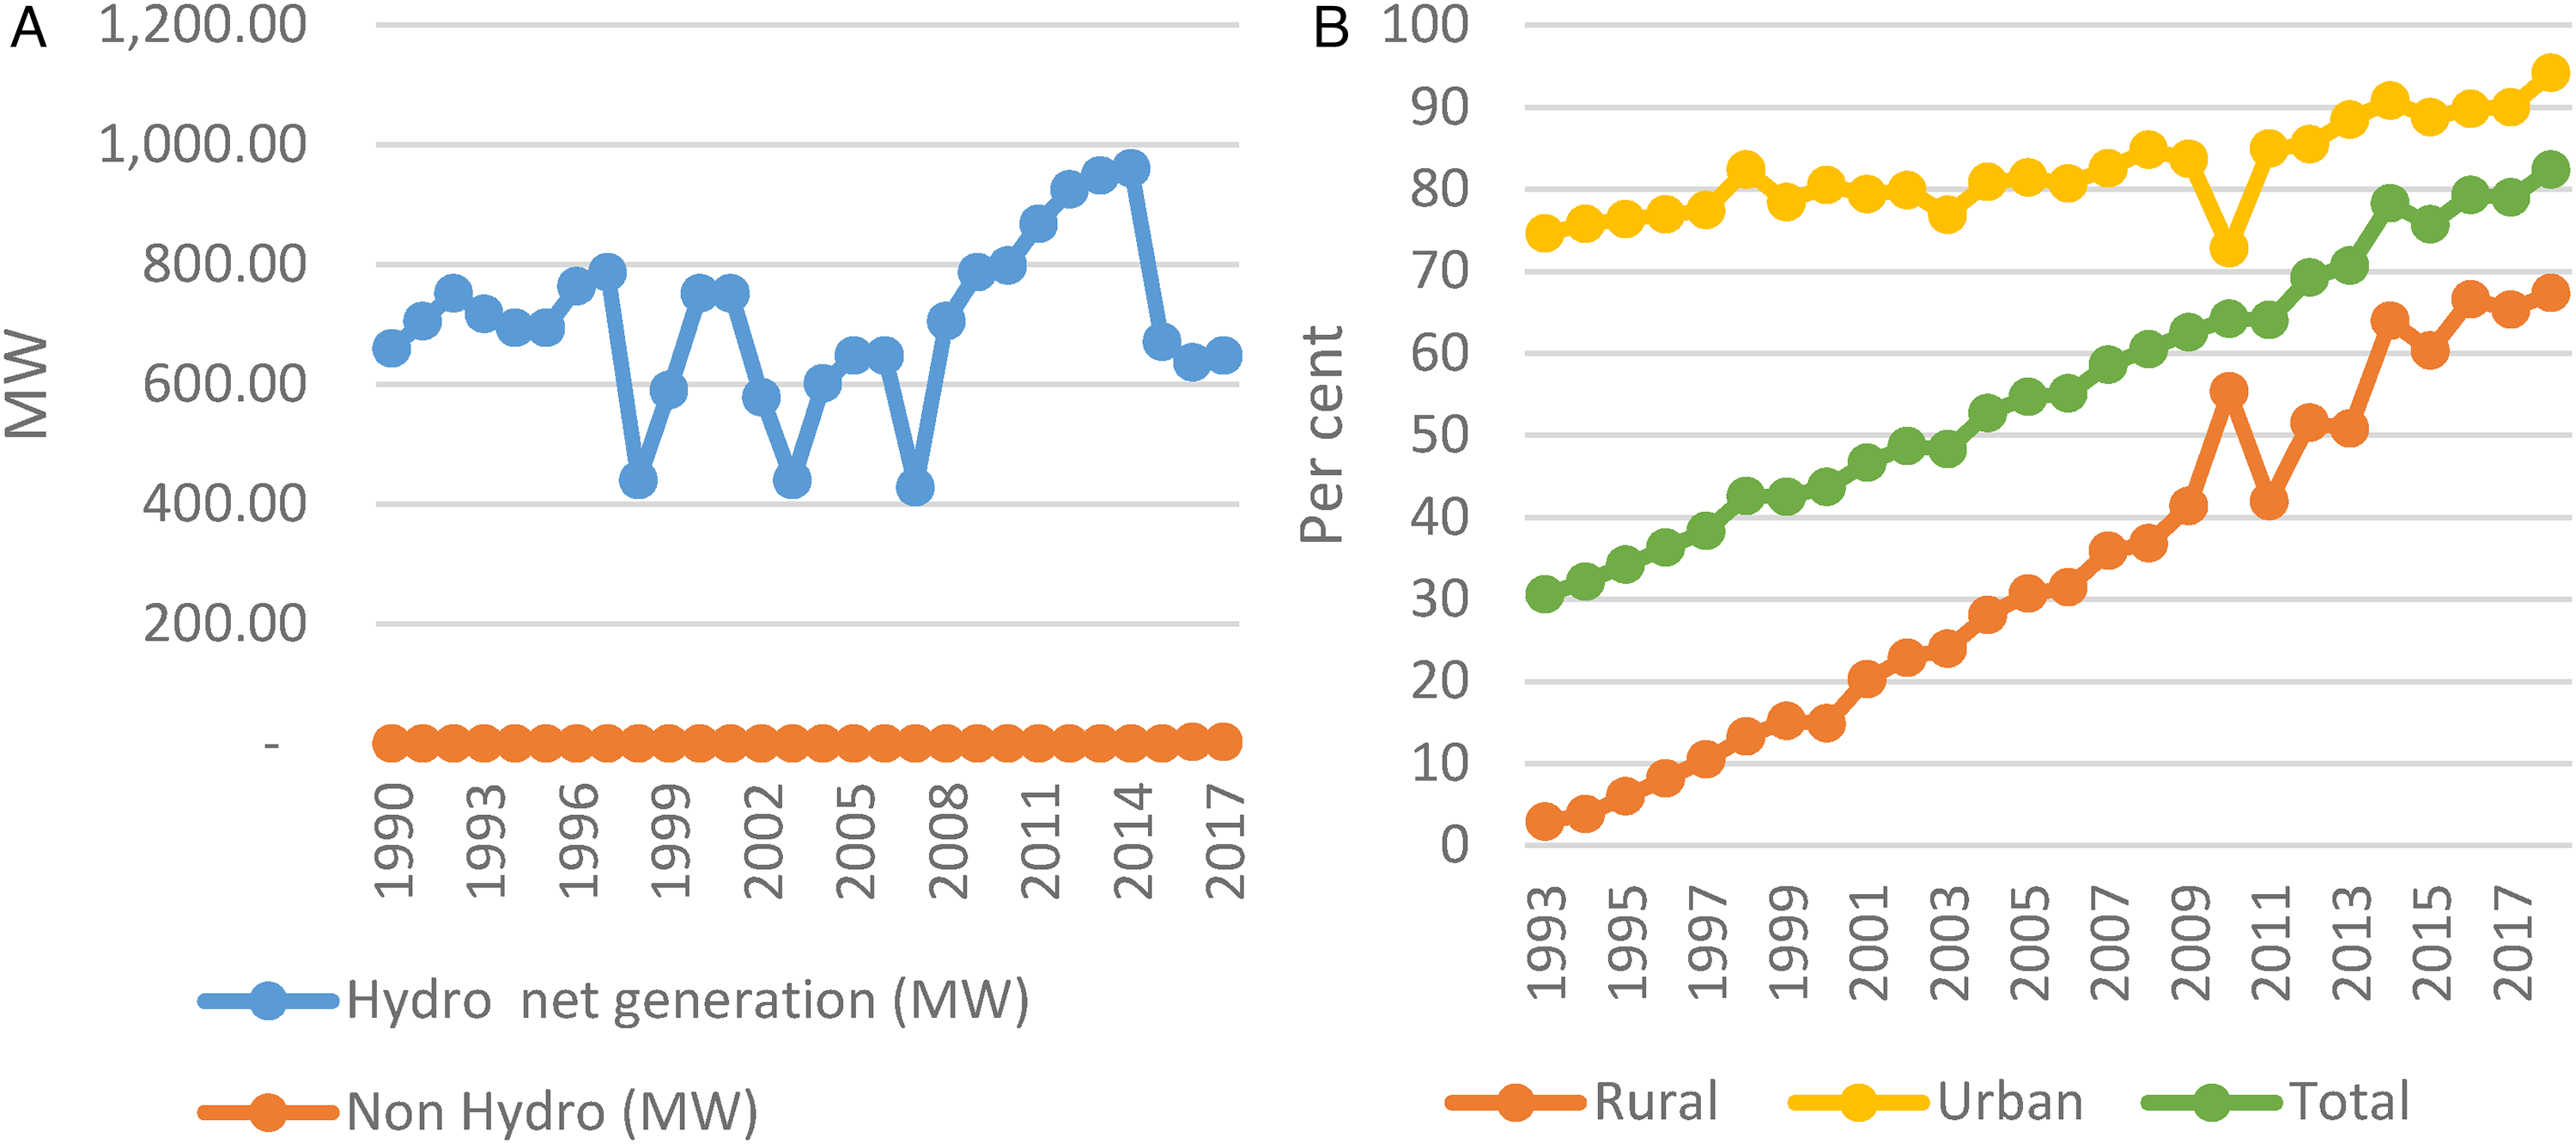
The RE situation in Kenya is impressive. The on-grid electricity capacity generation mix comprises; 20 percent non-renewable and 80 percent renewable electricity (IRENA, 2019). Available generation from RE in 2017 was 370.4 MW from hydropower and 578.8 MW of non-hydro power. Unlike elsewhere in SSA, Kenya's renewable electricity generation is dominated by geothermal energy. Besides, the contribution of geothermal makes Kenya one of the leading countries with geothermal RE.
Kenya recorded progress in its electrification strategy, as shown in the electricity access rate. The total population with access to electricity increased tremendously from 10.9 percent in 1993 to 75 percent in 2018 (Figure 5, Panel B). Likewise, access to electricity in urban and rural locations is almost even. The success is on the backdrop of a solid legal and institutional framework aiding the expansion of the electrification rate for improved access. Second, the electricity sector is one of the most liberalized in East Africa. The government is an enabler, allowing the private sector to take center stage in the sector. Kenya has consistently leveraged this strategy to finance its renewable electricity projects and, by extension, electricity access.
Renewable electricity generation and electricity access in Kenya. Panel A: Trend in Renewable Electricity Generation in Kenya.
In 2018 and 2019, the Kenyan energy transition index was 71, respectively (Table 4). Thus, the country was 54 percent transition ready, even though its energy transition index declined by 8 points to 79 in 2020. Specific policies include the 2012 feed-in-tariff for renewables, 2015 tax incentives promoting renewables, and the 2018 national energy policy. These strategies led to the country's increased share of renewables and electricity access. As a result, Kenya aims to reach 100 percent electricity access by 2022. Moreover, the grid is the principal least-cost solution for those without access. 55 f
Mozambique
Mozambique's electricity generation mix comprises 81 percent renewable energy and 19 percent non-renewable energy (IRENA, 2019). Renewable energy from hydro (79 percent), solar (2 percent), and bioenergy (1 percent) are the existing resources in the country. Electricity generation from hydroelectricity power was 1620 MW (Figure 6, Panel B). The generation is basically through on-grid and stand-alone systems.
Renewable electricity generation and electricity access in Mozambique. Panel A: Trend in Renewable Electricity Generation in Mozambique.
The country's population with electricity access is one of the lowest in sub-Saharan Africa. In 2018, electricity access was 31.1 percent, with a wide disparity between urban and rural populations. This situation suggests that about 69 percent of the population lacks electricity access. While the urban population has 72.2 percent electricity access, the rural population has about 8 percent. The lack of strategic measures and mechanisms decelerates the electrification strategy amid vast renewable energy resources in Mozambique.
Weak institutions and legal frameworks are plausible in constricting Mozambique's energy transition index. Mozambique's energy transition index consistently ranked above 100 in 2018 (Table 4). Low system performance undermines the country's ability to transition to clean energy sources. Shifting the goal post requires a mix of strategies and financial investment in the country's electricity sector.
Energy transition Index, Mozambique.
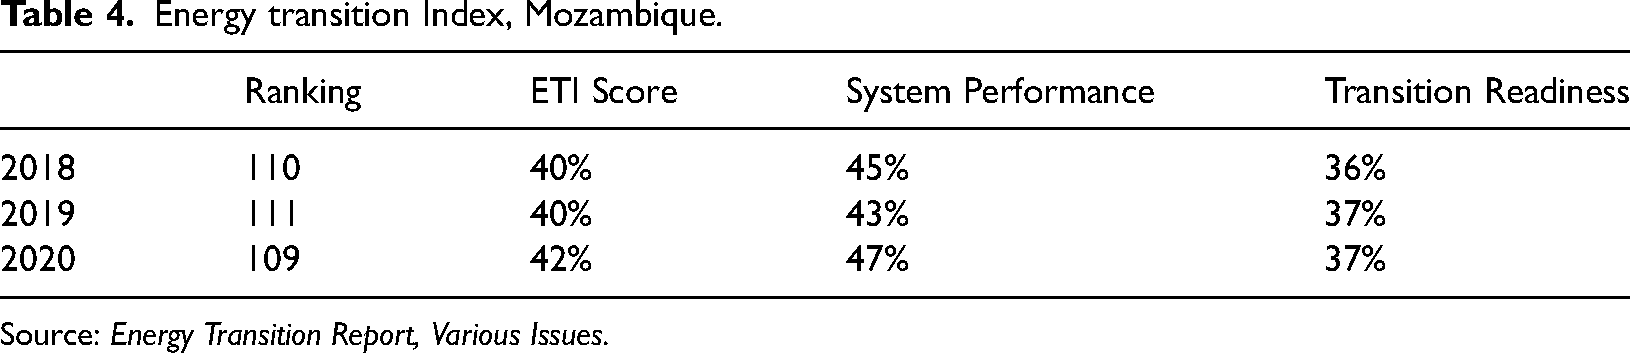
Source: Energy Transition Report, Various Issues.
Energy transition Index, Kenya.
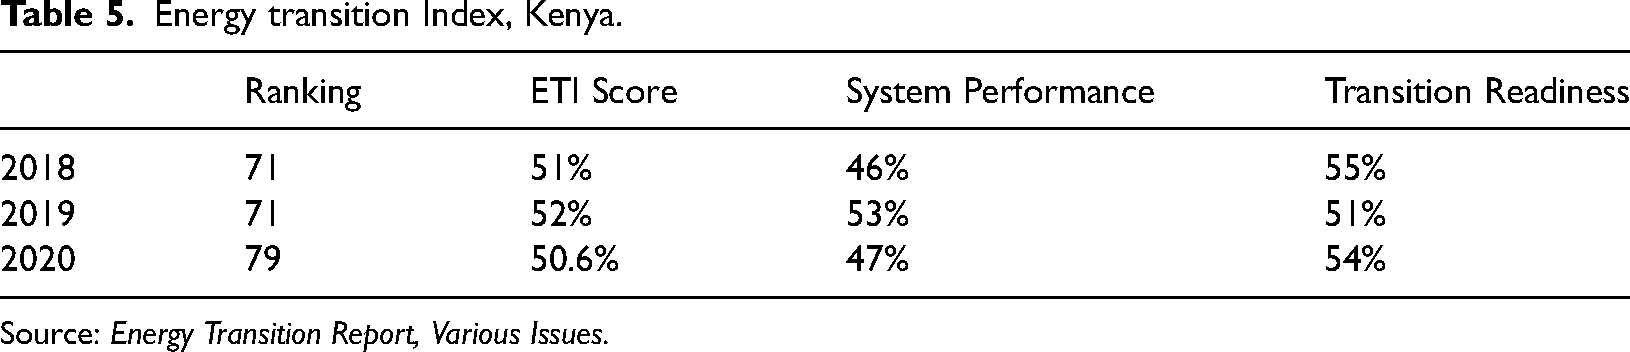
Source: Energy Transition Report, Various Issues.
Nigeria
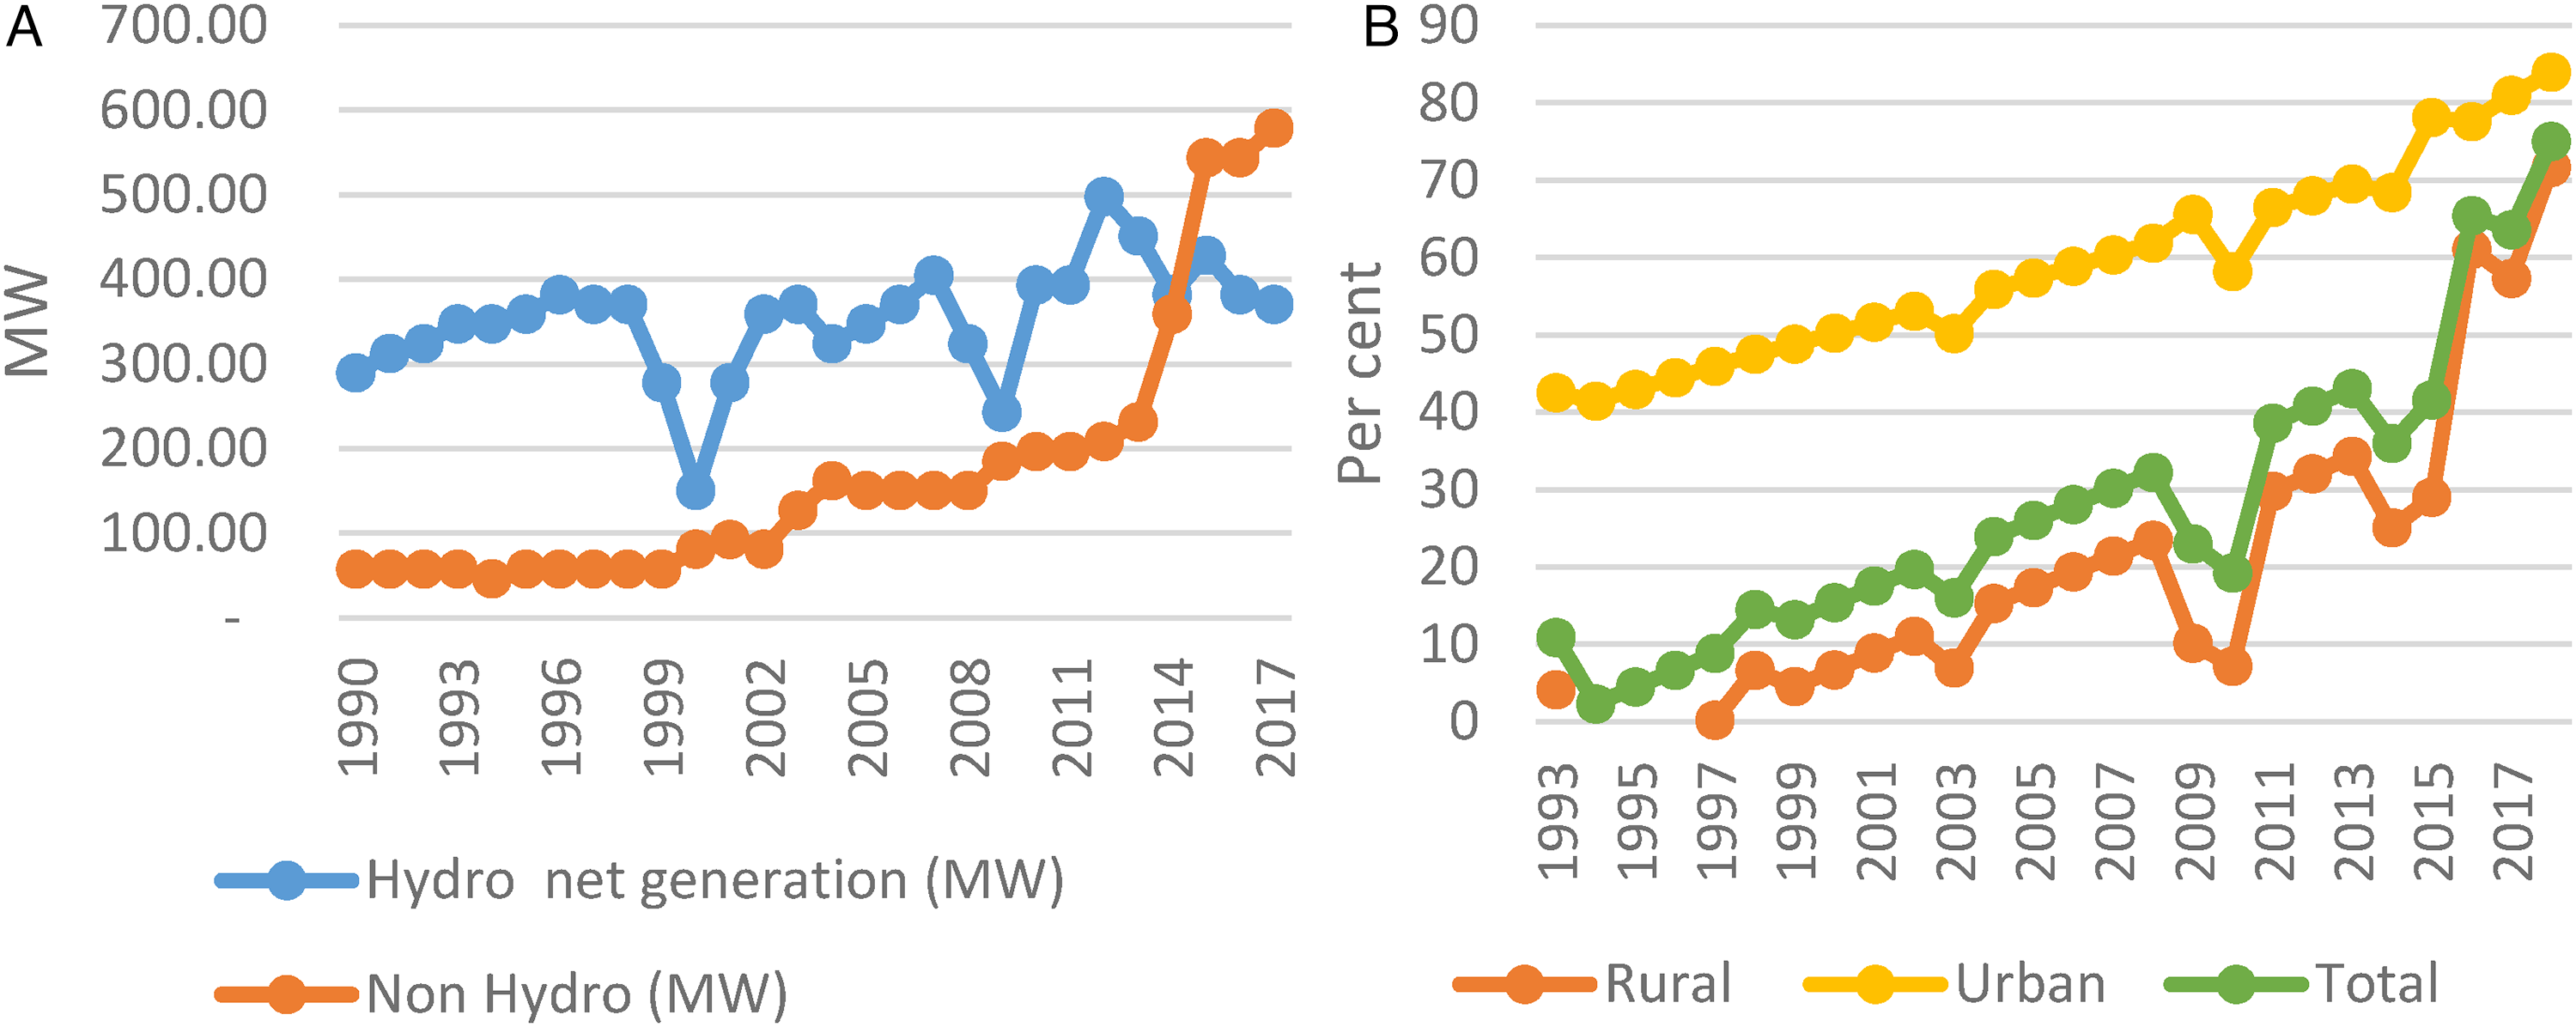
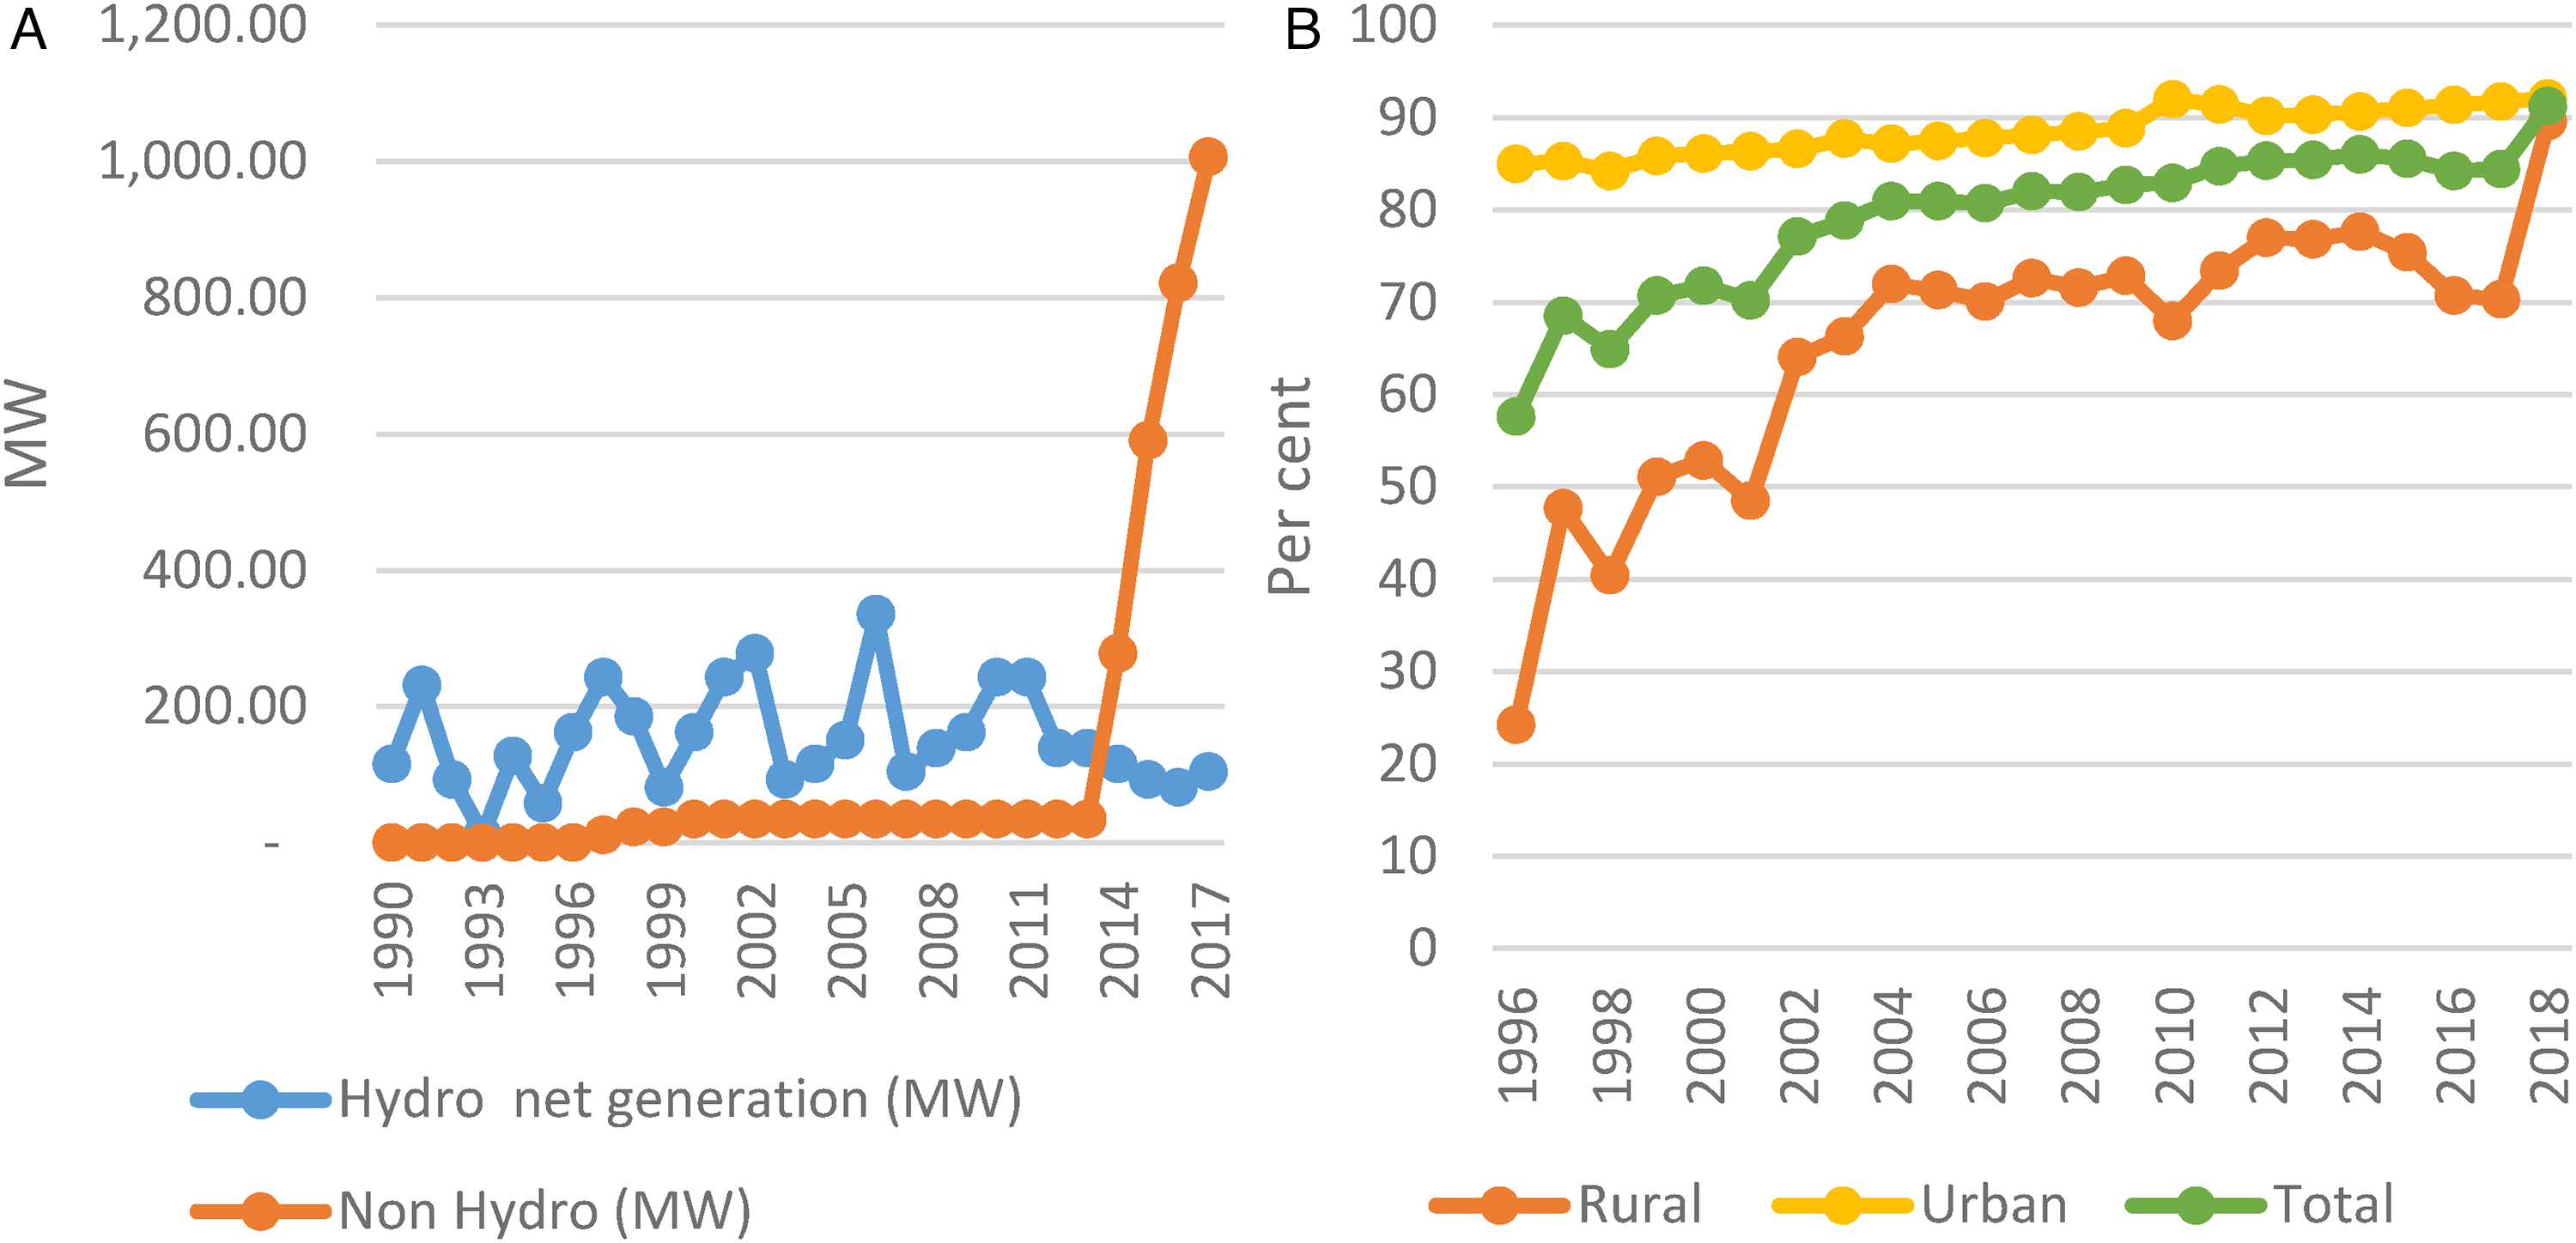
Nigeria, an African giant, has 16.1 percent renewable electricity capacity and 83.5 percent non-renewable. The share of non-renewable sources reveals the dominance of fossil fuels in the country. Total renewable is made up of hydropower (15.98 percent), solar (0.2), wind (0.02), and bioenergy (0.08). Electricity generation shows that available electricity from hydro was 636.57 MW in 2017 (Figure 7, Panel A). The Nigerian hydro renewable electricity is on-grid from three large power plants. Other off-grid renewable electricity initiatives are gradually emerging due to government and individual commitments. However, a considerable gap exists based on Nigeria's renewable electricity plans and achievements.
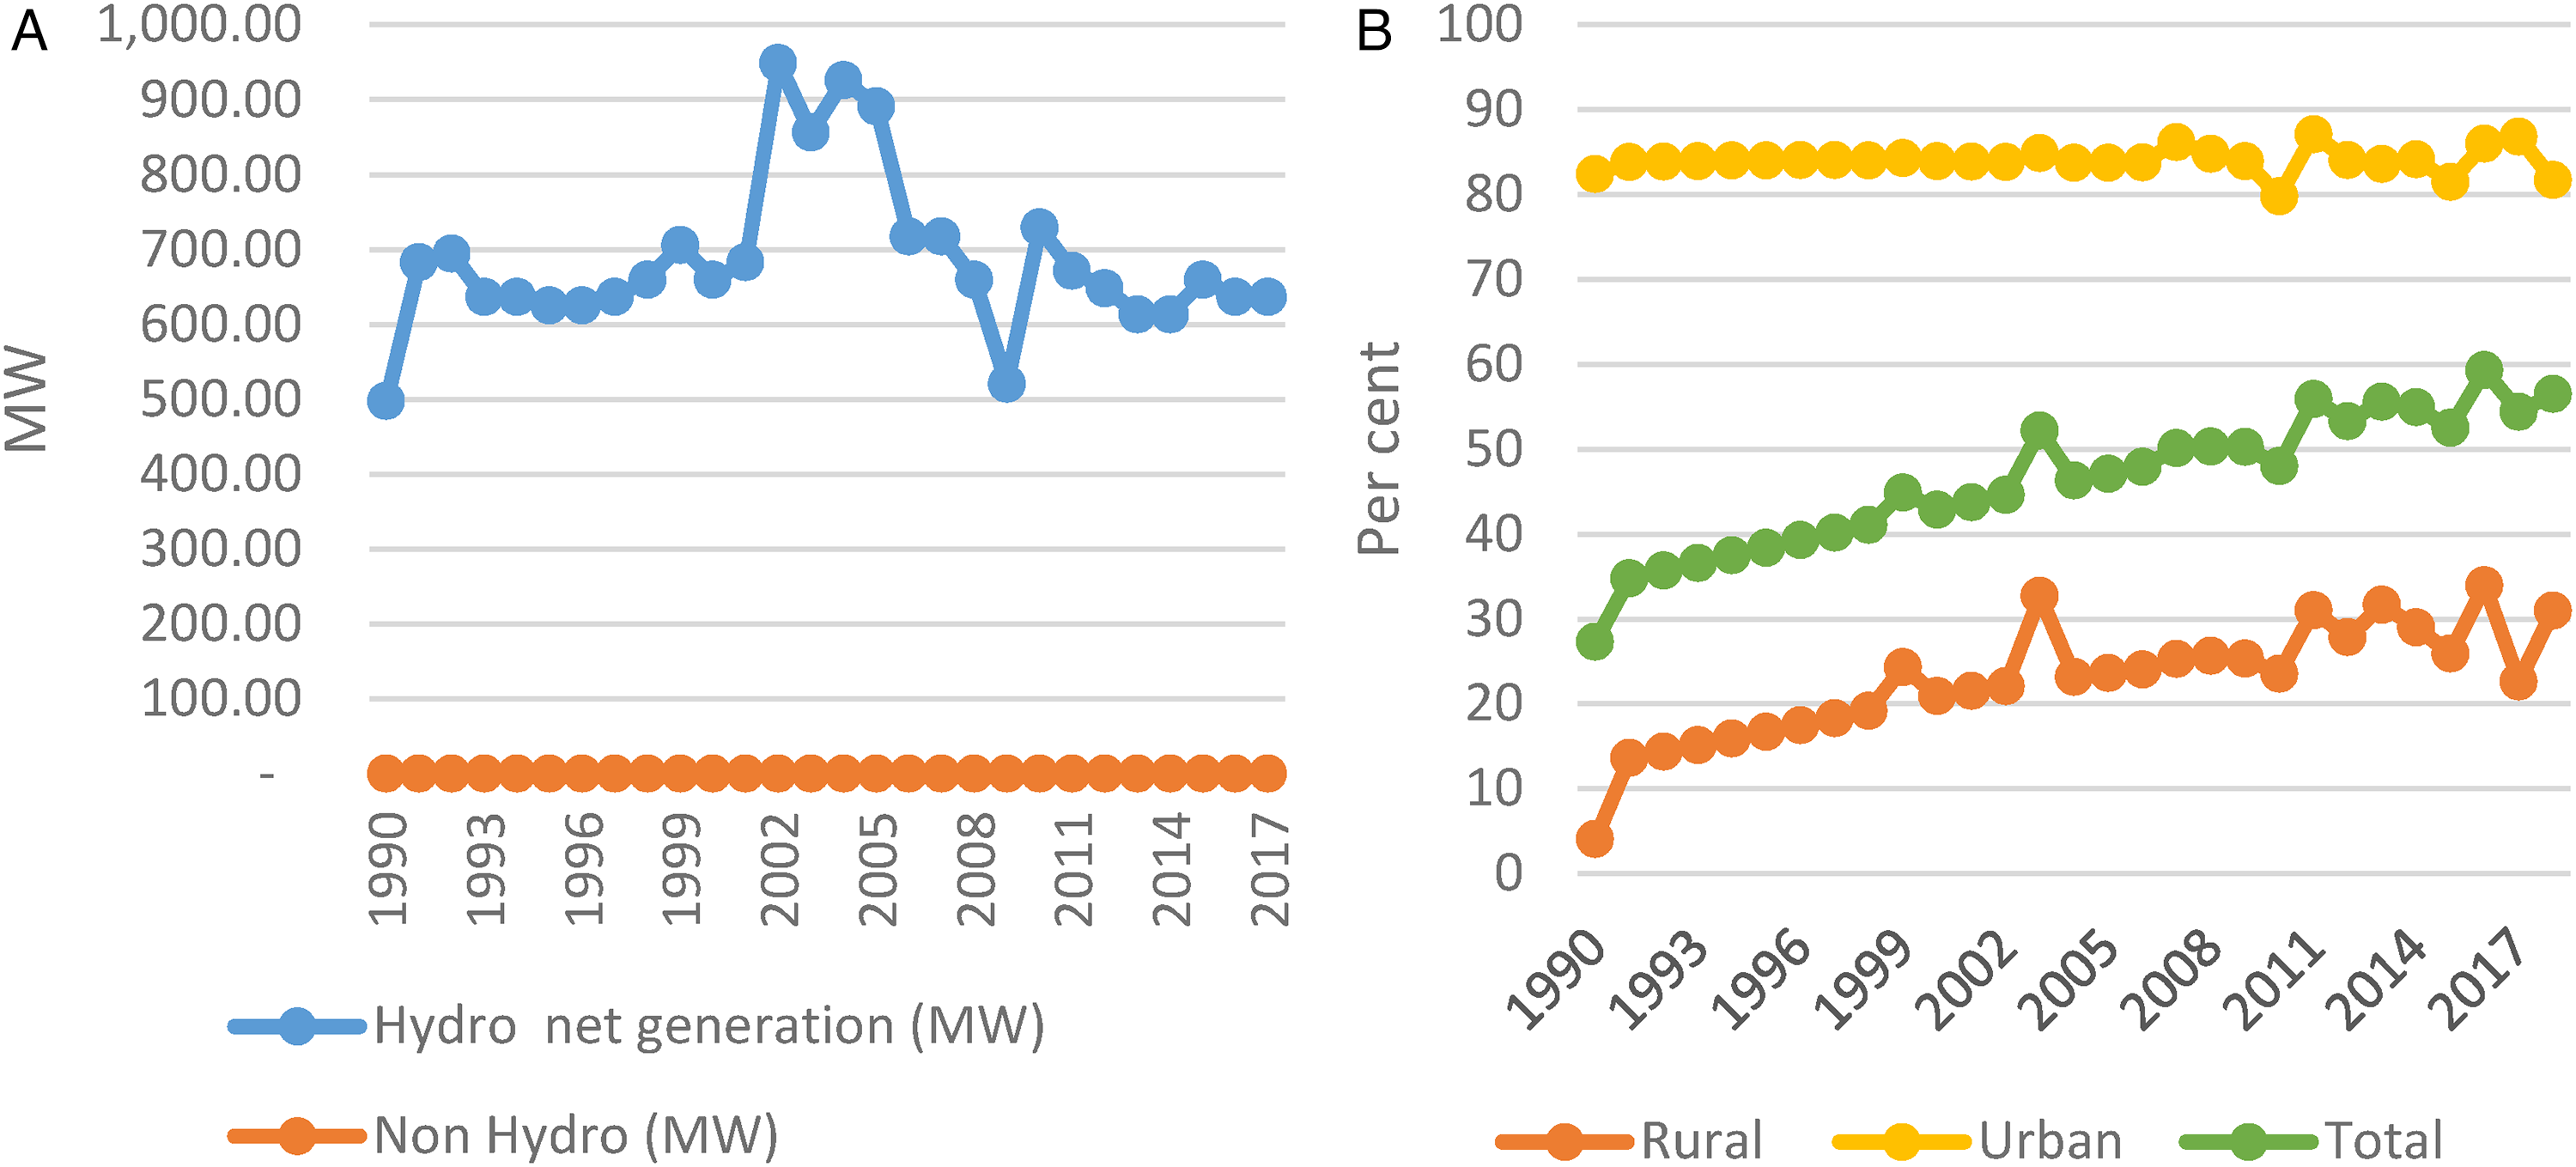
Renewable electricity generation and electricity access in Nigeria. Panel A: Trend in Renewable Electricity Generation in Nigeria.
Electricity access in the country has increased but is uneven between urban and rural populations. In 2018, 56.5 percent of the population had electricity access, with 81.7 percent urban and 31 percent rural access (Figure 7, Panel B). However, the country's electrification strategy, skewed to a centralized on-grid, delineates most rural locations without infrastructure and requisite investments. A few off-grid rural electrification strategies exist through the Nigeria Electrification Programme, but policy accelerated measures could lead to universal electricity access.
Unlike non-fossil fuel endowed countries, Nigeria's Energy Transition Index is among the lowest globally (Table 5). The slow transition alludes to inertia associated with institutions and frameworks and poor system performance. This situation has decelerated the energy transition pace as the investment environment remained unattractive for large-scale green energy. A key policy like the 2015 Nigerian Energy and Energy Efficiency Policy outlined specific incentives, including the renewable feed-in tariff and zero import duty for renewable energy equipment. However, up till the present, non-of these incentives are effective. Although financial incentives like tax waivers are available for renewable energy projects under government and public-private arrangements, stand-alone projects in most private domains are excluded from such benefits. Thus, renewable energy technologies are expensive and unaffordable in Nigeria.
Energy transition Index, Nigeria.
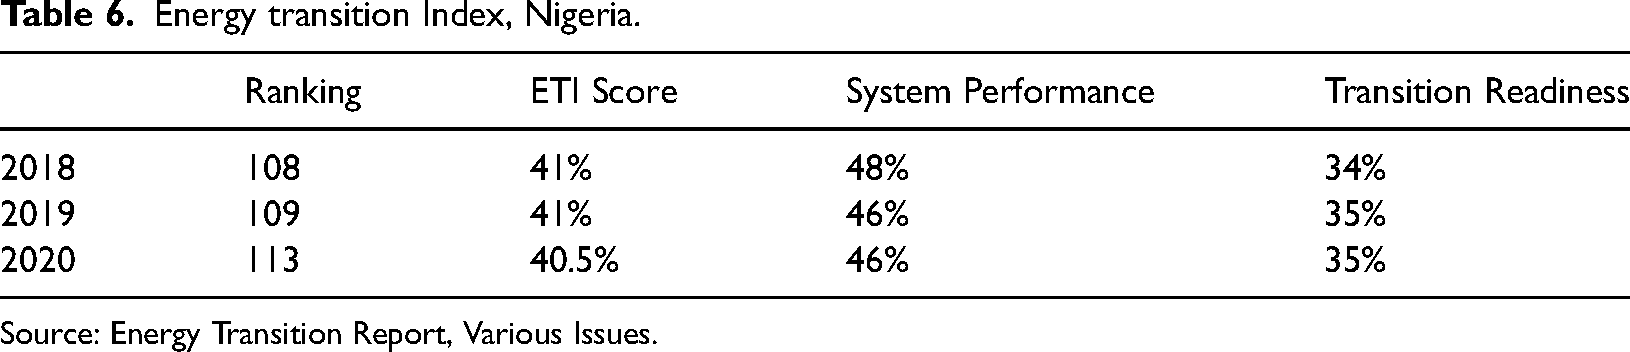
Source: Energy Transition Report, Various Issues.
South Africa
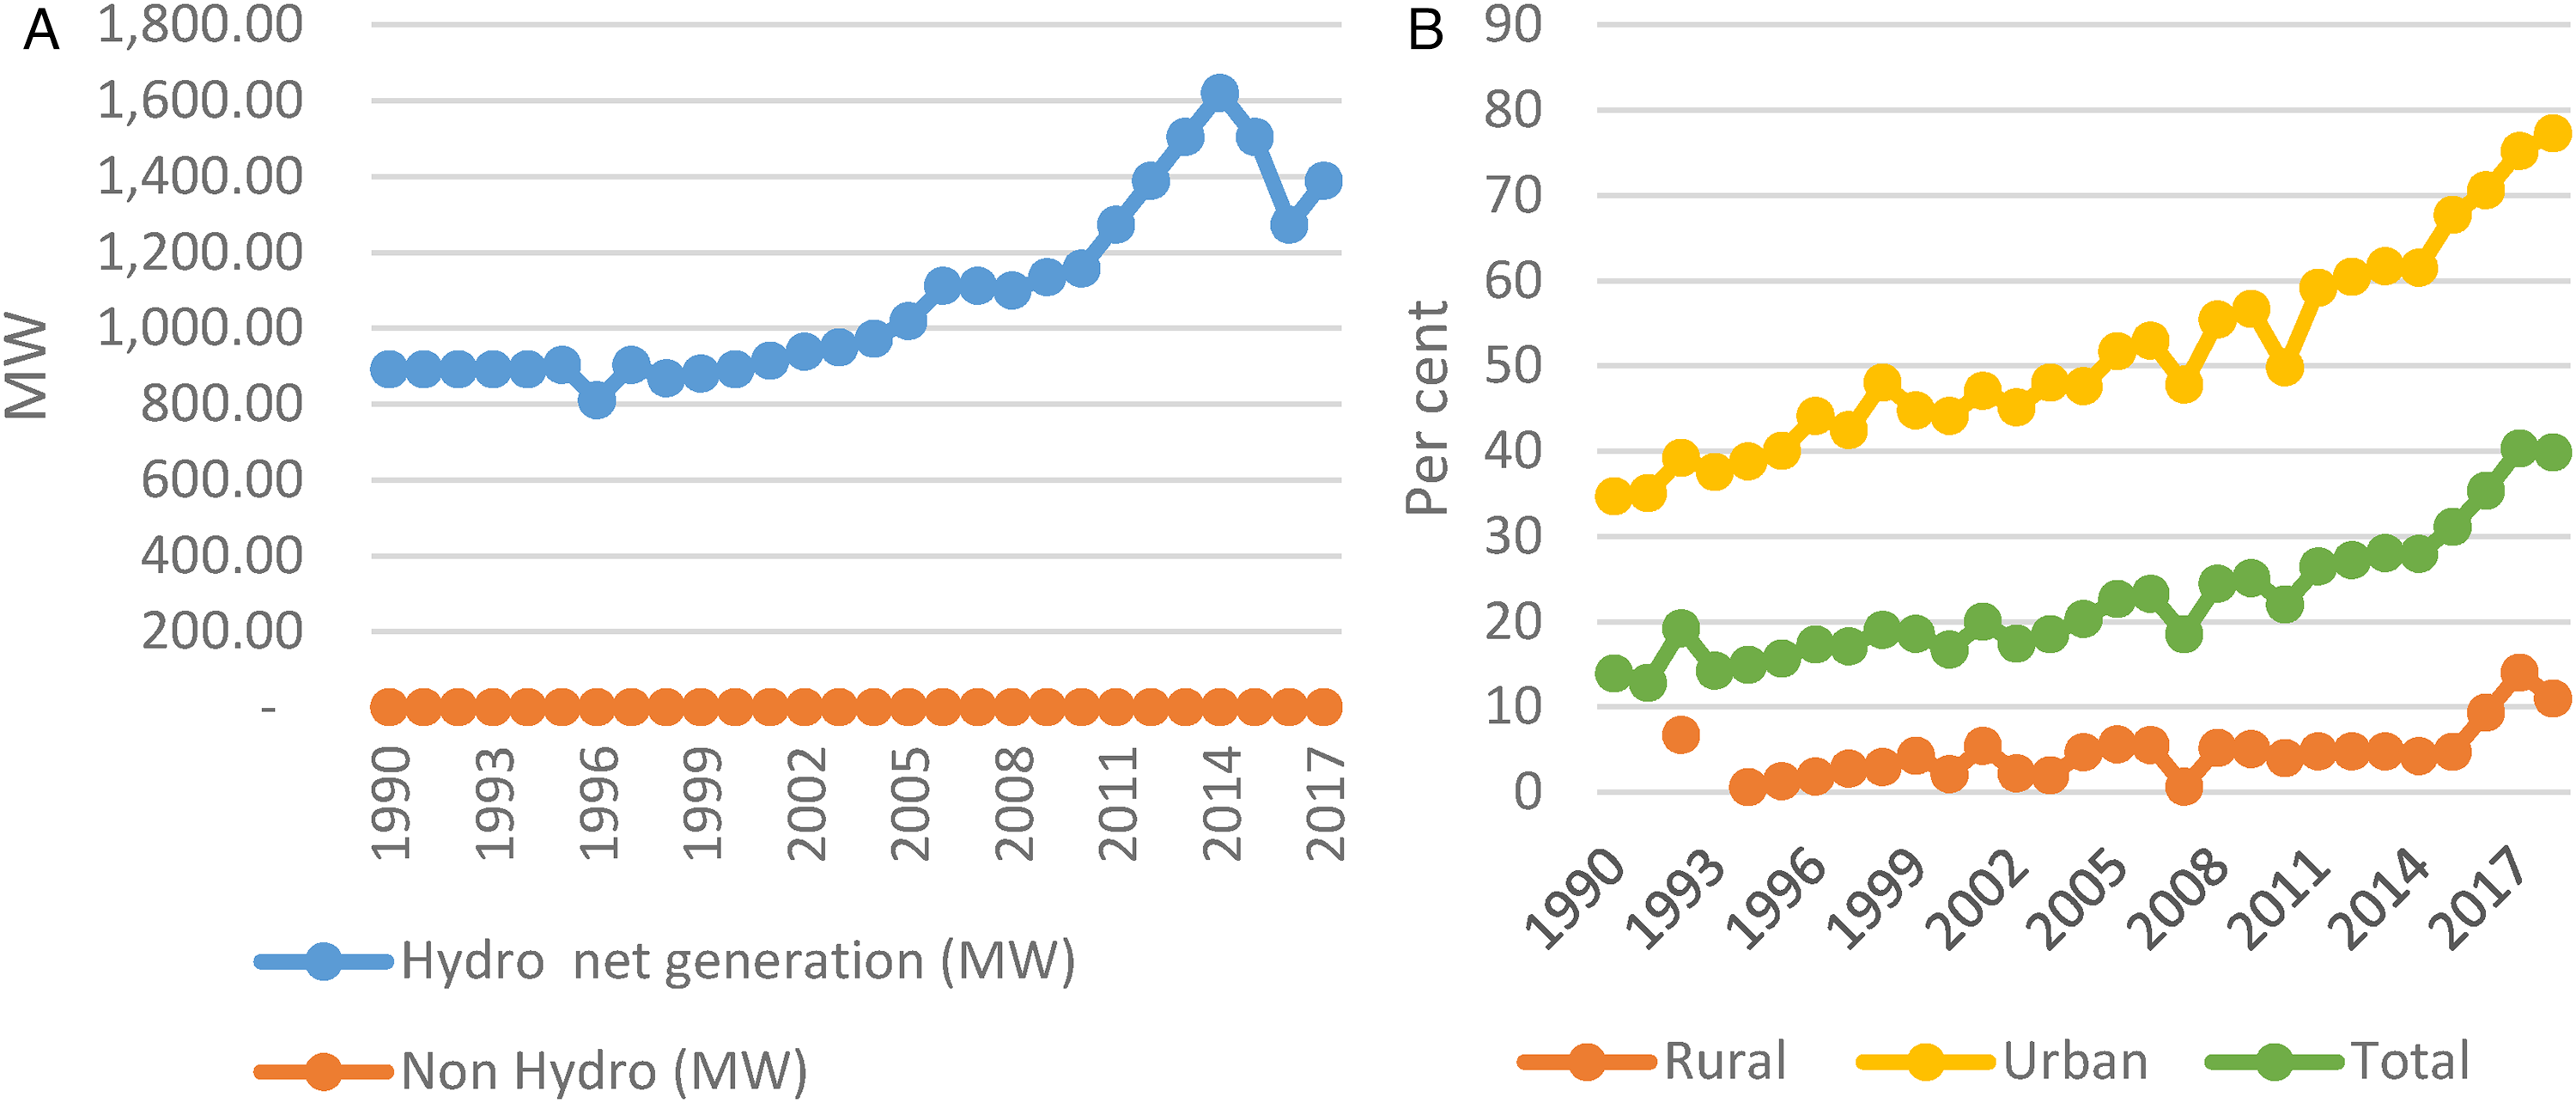
South Africa has the most advanced electricity sector in the SSA. Indeed, the country had 55,265 MW of electricity generation capacity in 2019 (IRENA, 2019). Non-renewable energy accounts for 89 percent, while renewables are 11 percent of the total capacity. Renewable energy is from solar (5.5 percent), wind (3.8 percent), hydro (1.3 percent), and bioenergy (0.8 percent). Available electricity generation from renewables was mainly through hydropower in the early periods. However, the narrative changed in 2014 as non-hydro sources produced more electricity in the country (Figure 8, Panel A). In addition, there are deliberate intentions to decommission the country's coal-based power stations to provide more integration of renewable energy in the near future j .
Renewable electricity generation and electricity access in South Africa. Panel A: Trend in Renewable Electricity Generation in South Africa.
Besides, South Africa's total electricity access of about 91 percent is among the highest in sub-Saharan Africa due to years of investment commitment (Figure 8, Panel B). The scenario is similar across rural and urban regions, suggesting a high electrification rate in South Africa. The share of non-renewable energy sources dominates the electrification strategy in the country. Steadily, investments in renewable energy sources are growing in recent times k . The renewable energy transition drivers are specific strategies like the 2019 Integrated Resource Plan and the 2011 Renewable Energy Independent Power Producer Programme.
The dominant role of fossil fuels also inhibits the rapid deployment of renewables in the South African electricity generation mix. For three consecutive years, 2018-2020, the South African energy transition index remained above 100 due to a lower than the average energy transition readiness score (Table 6). This result raises questions about the commitment to reducing the share of fossil fuels in the country's electricity portfolio.
Energy transition Index, South Africa.
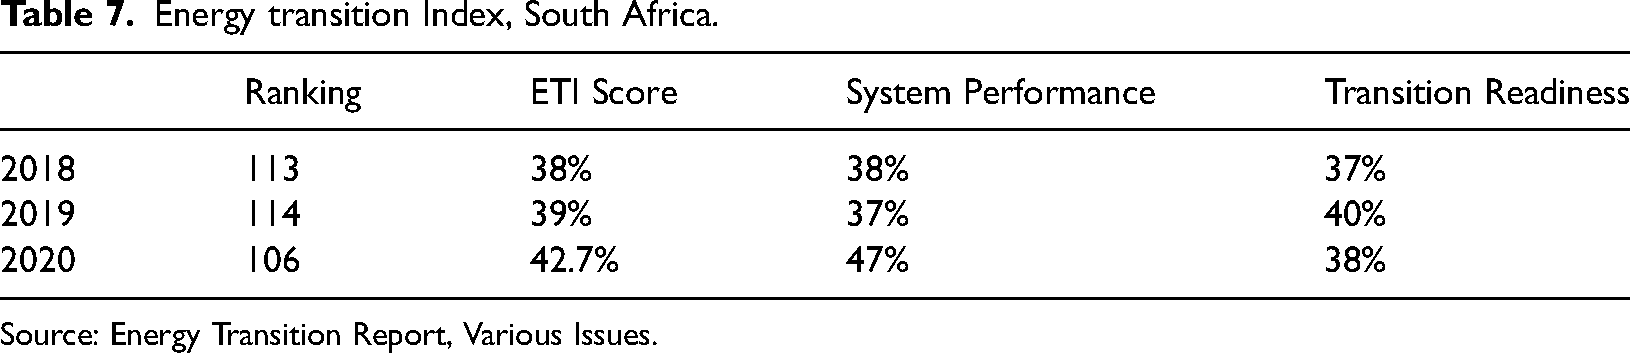
Source: Energy Transition Report, Various Issues.
Zambia
Zambia relies mainly on renewable electricity sources. The country's electricity generation capacity comprises 2538 MW of renewable and 524 MW of non-renewable sources (IRENA, 2019). The share of renewable energy distribution is from hydropower (78 percent), solar energy (3 percent), and bioenergy (1 percent). Actual renewable electricity generation from 1990 to 2017 is almost all from hydropower (Figure 9, Panel A). The dominant share of hydropower in the country is due to its great potential.
Renewable electricity generation and electricity access in Namibia. Panel A: Trend in Renewable Electricity Generation in Namibia.
By 2018, the population with access to electricity was 39.8 percent vs. 13.9 percent in 1990 (Figure 9, Panel B). However, the perceived progress did not spread equally; rural access was 11 percent across rural and urban populations compared to 77.2 percent urban access. Lack of investment and drive for economic development dampened progress in increasing electricity access. Although the country has initiated measures like the 2003 Rural Electrification Act and the 2015 Scaling Solar Program (IEA, 2020), the renewable energy transition is sluggish (Table 7). Nevertheless, with the right mix of policies and political will, large renewable energy potentials exist for increasing electricity access.
Energy transition Index, Zambia.
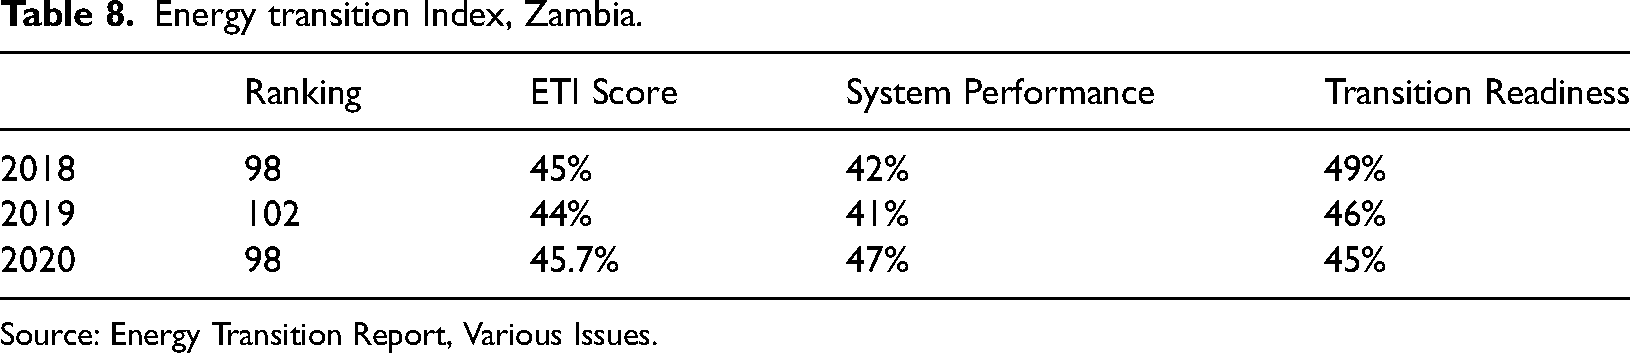
Source: Energy Transition Report, Various Issues.
The narrative above indicates that renewable electricity in SSA is through hydroelectric power due to its long existence and the high costs of variable renewables. Government support mechanisms provide a platform for integrating renewable electricity projects into the region's electricity generation mix. Countries in the SSA are also inclined to pursue the deployment of various renewables, as revealed in the respective country targets.
Overall, the deployment of non-hydro renewable electricity sources is slow despite colossal potential. In most countries evaluated, renewable electricity targets are below actual realization. This issue confirms the slow rate of the renewable energy transition, partly due to a lack of active renewable electricity policy in the region. Where support mechanisms exist, they favor integrating large hydropower projects, especially for on-grid electrification, except in Kenya, with a large share of electricity generation from geothermal sources.
Macroeconomic drivers and barriers of renewable electricity adoption in Africa
Summary statistics
Table 8 presents the summary statistics of the dataset used in this study. The variables are (i) the electricity generation from renewable energy sources (Totalrenew), (ii) GDP per capita (Gdppc), (iii) trade openness (Openness), (iv) foreign direct investment (FDI), (v) financial development (Findex), (vi) fossil fuel energy consumption (Fossil), (vii) renewable electricity policy (Policy), (viii) human capital development (Prsc), and (ix) government regulatory quality (Regquality).
Summary statistics.
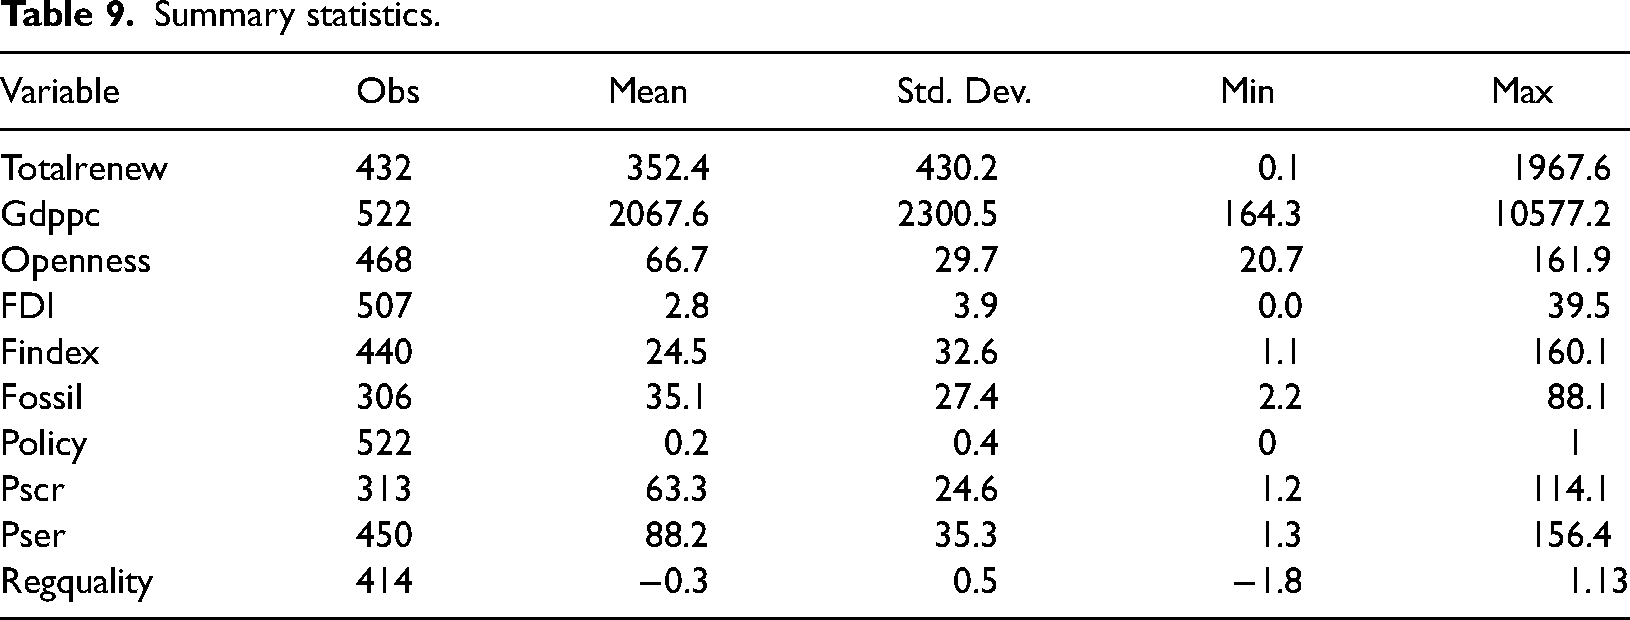
The average renewable electricity generated was 352.4 MW across the 18 SSA countries from 1990 to 2018. The variable has a standard deviation of 430.2, suggesting that large fluctuations occurred around the mean value, with a minimum and maximum of 0.1 MW and 1967.6 MW, respectively. This situation confirms the challenges of grid instability due to the high level of infrastructural decay and low investment drive in the SSA. Per capita GDP showed a larger pattern of deviation, with the value ranging from US$ 164.3 to US$ 10,577.2 across the countries. This situation suggests a low level of economic development in most SSA countries, which may serve as a disincentive to private investment in renewable technologies. Likewise, variables like trade openness, FDI, and financial development averaged about 68 percent, 3 percent, and 25 percent in the sampled period. These selected variables are about 28 percent, 4 percent, and 33 percent dispersed around their respective mean values. Fossil fuel energy consumption was 35.1 percent on average. Nonetheless, a maximum of 88.1 percent indicates high fossil fuel energy consumption in some of the selected countries, while consumption in others is low (2.2 percent).
Some countries have advanced human capital development (114.1 percent). Some other countries are on the lower rung of the ladder (1.2 percent). However, across the selected countries, regulatory quality seems weak (−1.3) and modest in some countries (1.13). The modest regulatory quality reflects weak institutional power and efficiency that may limit the implementation of public policies, even for renewables.
Unit root results
An ARDL analysis requires that the order of integration of all variables does not exceed I(1), as ARDL estimation is hinged on the basic assumption that the series is either I(0), I(1), or a mixture of both.56,57 For confirmation, the Levin–Lin–Chu test 37 and the Im-Pesaran-Shin test 38 were used to test the presence of unit roots. The findings are shown in Table 9. Both results indicate that the series is a mixture of I(0) and I(1). This outcome provides a sufficient condition to proceed in testing the long-run cointegrating relationship of the models.
Unit root test results.
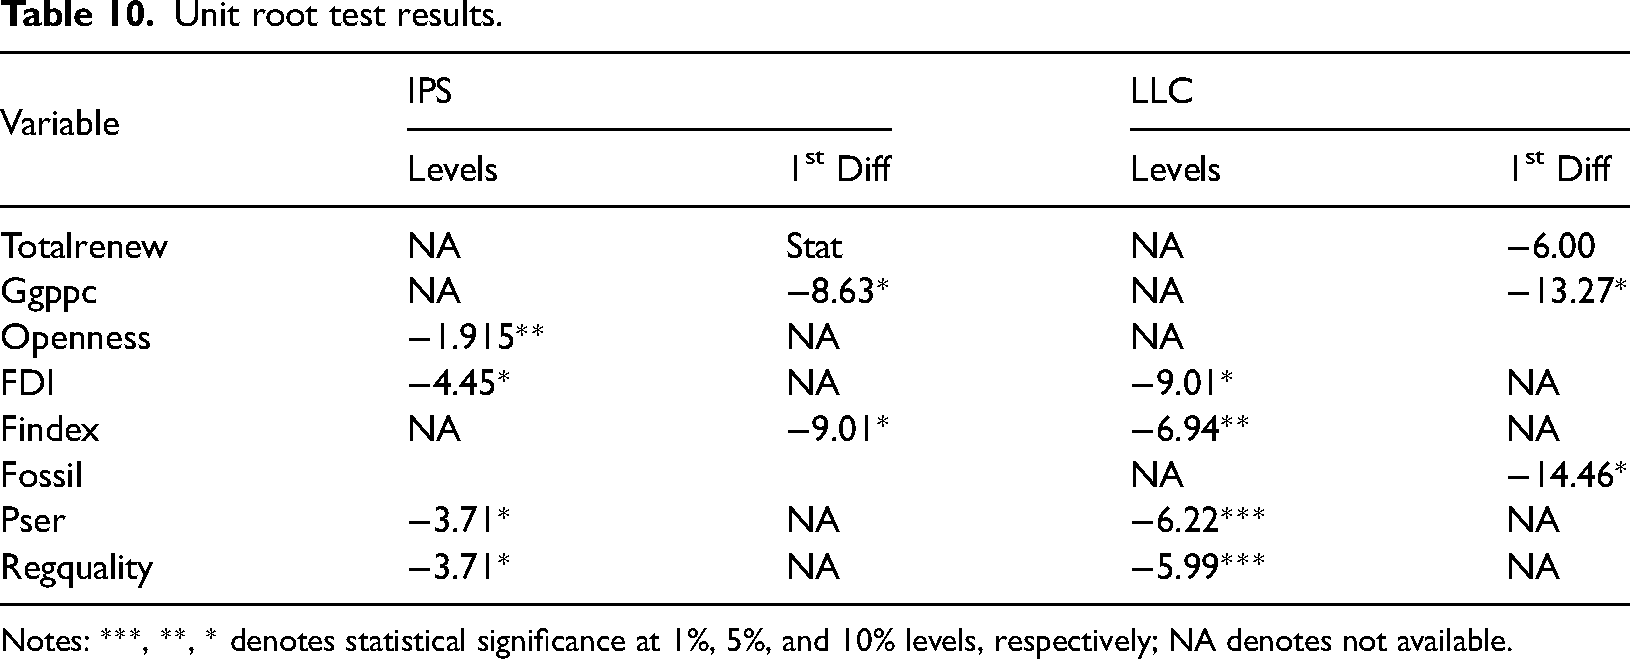
Notes: ***, **, * denotes statistical significance at 1%, 5%, and 10% levels, respectively; NA denotes not available.
Macroeconomic drivers of renewable electricity adoption
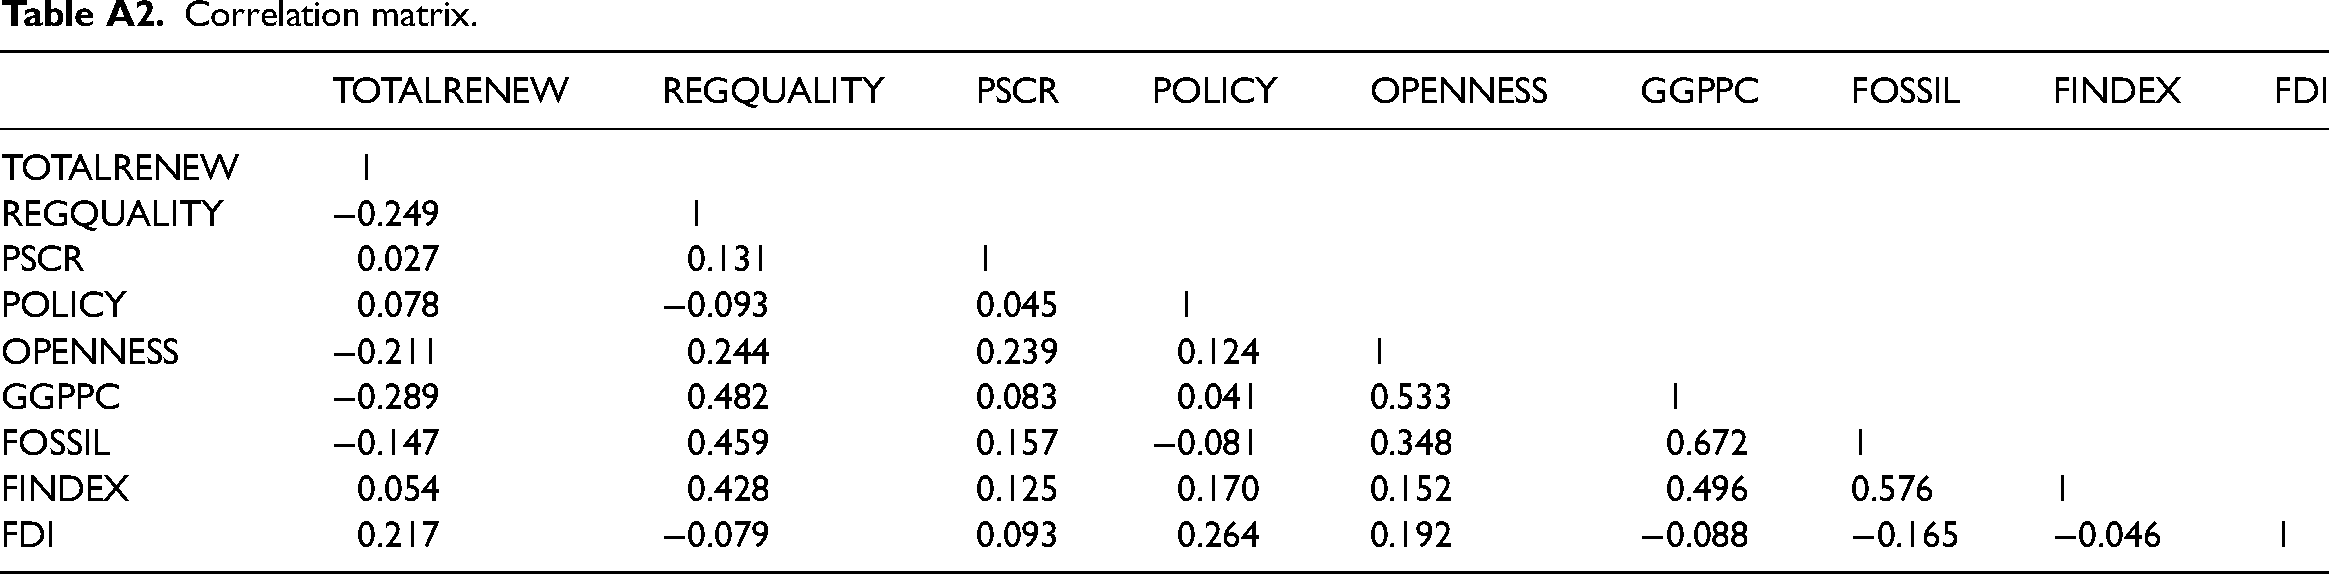
Table 11 presents the long-run and short-run estimations of the macroeconomic drivers of adopting renewable electricity technology in SSA. The emphasis here is on the long-run coefficients since the PMG estimator imposes homogeneity in the long-run estimators but not the short-run estimates. 23 This outcome affects the estimated short-run consistency across the countries. Besides, the correlation matrix result (Table A2, in Appendix) did not indicate a presence of multicollinearity. This result implies that our PMG estimates are precise and adequate to capture the variation in our cross-country analysis.
Panel ARDL - long and short-run impacts - PMG estimation.
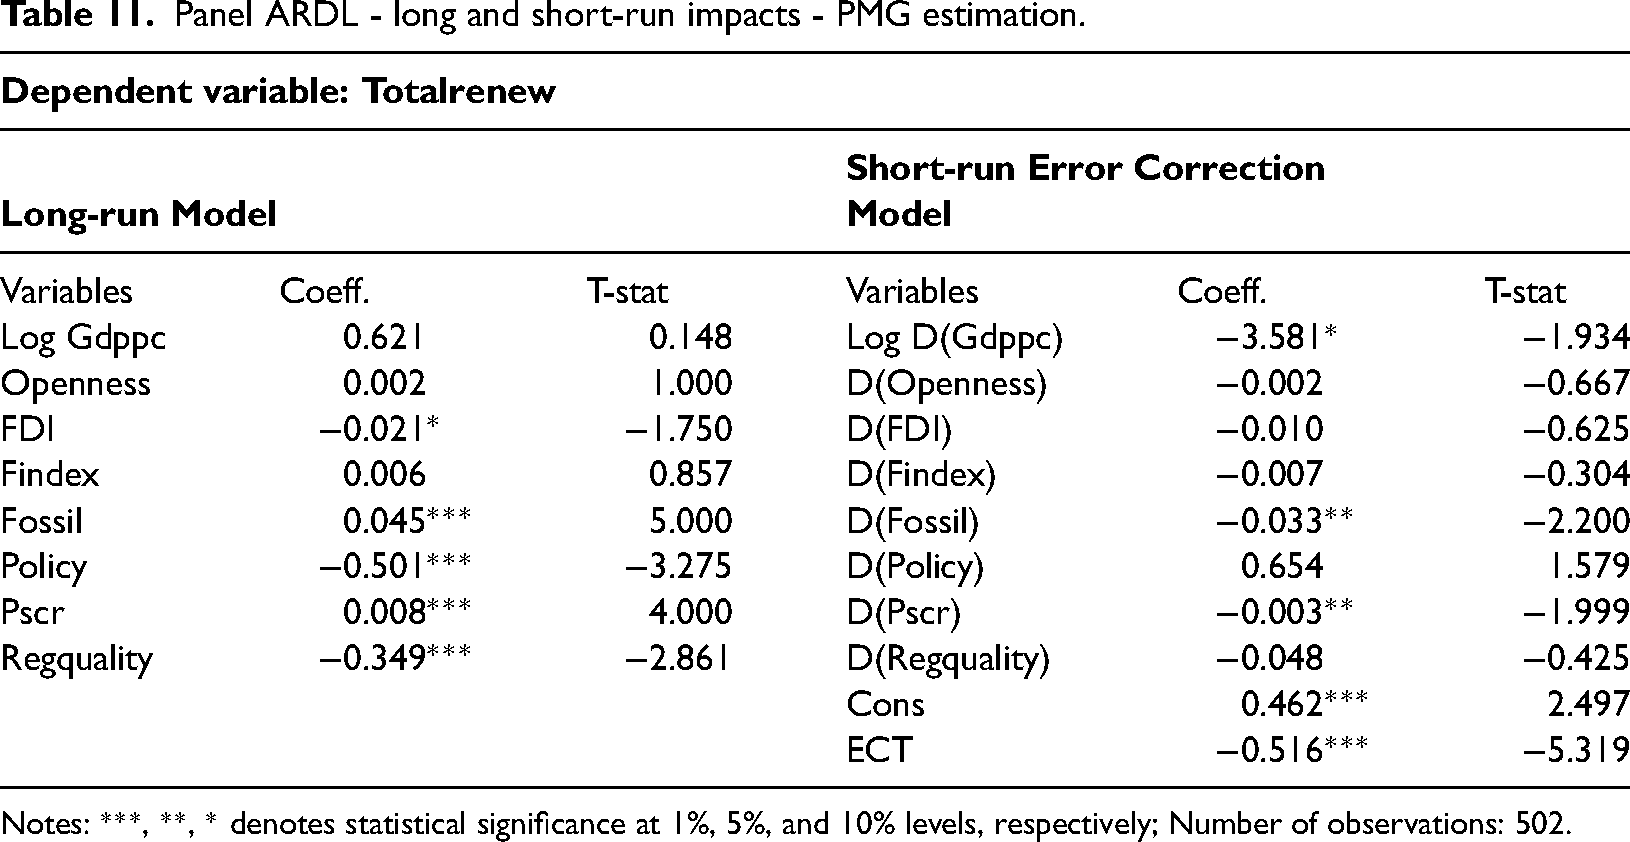
Notes: ***, **, * denotes statistical significance at 1%, 5%, and 10% levels, respectively; Number of observations: 502.
The estimates indicate that fossil fuel energy consumption and human capital development are the long-run drivers of renewable electricity adoption in SSA. For example, a 1 percent increase in fossil fuel energy consumption engenders a 0.04 percent increase in renewable electricity generation. Contrary to the literature, 17 the fossil fuel lobby is expected to be a barrier to renewable electricity adoption, especially in countries with high dependence on fossil fuel energy resources. 54 In this case, however, increased fossil fuel consumption may engender a rise in the adoption of renewable electricity technology in SSA due to widespread climate change concerns and the need to increase electricity access in the Sahara. Even though fossil fuel energy consumption is high, the need for sustainability and electrification allows for the gradual integration of renewables. In addition, an improvement in human capital development, proxied by primary school completion rate, slightly increased the adoption rate of renewable electricity by 0.008 percent. This situation implies that education is an enabler and could enhance the skill acquisition drive for developing renewable energy technologies. Our result conforms to findings 36 that show a positive correlation between knowledge accumulation and renewable electricity diffusion.
On the flip side, FDI, renewable electricity policy, and government regulatory quality negatively impacted renewable electricity adoption. Firstly, the increased influx of FDI does not facilitate the adoption of renewable electricity technologies in SSA. This result is inconsistent with other studies 27 that found that the inflow of FDI facilitates the penetration of the market for green technologies in developing countries. Likewise, policy mechanisms for inducing renewable electricity adoption may not have played a desired role across the SSA, where the market tends to be uncompetitive. Based on the findings, policy mechanisms could be binding constraints to renewable electricity adoption and energy transition in the SSA (2013; WEF, 2020). The finding aligns with our results in section 4.1. Likewise, regulatory quality inhibits the integration of renewables in SSA. This result confirms our earlier findings that weak institutions could adversely impact the implementation of enacted renewable energy policies and be a disincentive to new regional investment. Thus, a weak regulatory environment is a likely reason for the counterintuitive impact of FDI and renewable electricity policy on the widespread renewable electricity diffusion. The regulatory space impedes private sector development, including implementing renewable electricity-related policies.
There is no evidence that the level of economic development proxied by GDP per capita, trade openness, and financial sector development support renewable energy generation technology adoption in the SSA. Notably, SSA has one of the lowest rates of economic development globally, which is partly a challenge for new investment in RE technologies. Second, the insignificant role of trade openness could be due to the region's stringent conditions attached to trade facilitation. Most countries in the SSA region have a high level of trade-related bureaucracy and bottlenecks that hinders the trade flow of RETs. Besides, policy inconsistencies are other challenges that limit the importation of RETs. Third, the level of financial sector development may not be sufficient to attract the penetration of RETs, hence the neutral relationship. Beyond government support, a developed financial market is an impetus for sustainability financing.
The short-run model performed to expectation as the error correction term (ECT) indicates a negative sign and is significant at a 1 percent statistical level. The result suggests that, on average, deviations from the long-run equilibrium path are adjusted at 52 percent each period.
Conclusions and recommendations for policy
Electricity generation in most SSA is from renewable energy sources. However, renewable expansion's pace is constrained by environmental factors such as water resources, rain, wind, sun exposure, or unfavorable climatic conditions that imply high maintenance costs. Nevertheless, the widespread distribution of renewables can enhance electricity supply security by increasing access to the unserved and underserved communities in the region. The study contributes to scaling up modalities for an eventual energy transition towards sustainability. The study assesses renewable electricity generation adoption determinants for 18 SSA countries.
Key and significant findings revealed that hydroelectric power is the long-standing renewable electricity in the region compared to variable renewables like solar and wind. Hydropower accounts for most of the renewable electricity generation. We established the drivers and barriers of renewable electricity generation. In SSA, the drivers of renewable electricity generation include fossil fuel energy consumption and human capital development. Increased fossil fuel consumption raises concern about the environment and climate sustainability, culminating in the increased adoption of renewables. Improvement in knowledge accumulation in the region also engendered a gradual increase in the adoption rate of renewables for electricity generation. However, the FDI, the enactment of renewable electricity policy, and regulatory policy are barriers to integrating renewable electricity generation in SSA. The possible reason could be the regulatory and institutional environment that impedes the implementation of enacted renewable energy policies and new investment in the region. Also, where institutions are weak, there are tendencies for poor regulatory quality.
Three recommendations follow. First, national governments in the region should expedite action towards strengthening their legal and institutional framework in activating their renewable electricity mandate. Indeed, specific renewable energy strategies for distributed electricity generation mix and access should be implemented. These strategies include tax incentives, renewable energy feed-in-tariff, import duty waivers, and other programs outlined in various national energy policies, including rural electrification strategies. In addition, a review of government support mechanisms and their uptake could accelerate renewable energy development for increased electricity generation. Second, against risk factors like fragile regulatory quality, governments must strengthen their legal and institutional frameworks, amongst other factors. This situation will encourage investment in variable renewable electricity projects due to limited bottlenecks and bureaucracy usually associated with obtaining renewable energy permitting processes and defining and standardizing institutional mandates. Third, the region's low level of financial development and the uncertainties around system intermittency may limit and delay investment in renewable energy projects. Therefore, governments should encourage financial institutions to offer instruments, like partial loan guarantee schemes to secure loans for green energy projects.
Our analysis is limited due to the lack of disaggregated renewable electricity data, which may affect the study's outcome by considering hydro energy as a measure of renewables. Ideally, various forms of renewables should be considered. Similar studies 36 in the literature also alluded to the problem of data paucity, especially from variable renewables. As a comparative or country-specific analysis, we suggest that future studies conduct a detailed assessment of solar and wind energy penetration, primarily through the off-grid system. This issue is essential in understanding the pace of off-grid electrification strategies and the pathways that will enhance electricity access in SSA.
Footnotes
Acknowledgements
CeBER R&D unit funded by national funds through FCT – Fundação para a Ciência e a Tecnologia, I.P., project UIDB/05037/2020.
Declaration of conflicting interests
The author(s) declared no potential conflicts of interest with respect to the research, authorship, and/or publication of this article.
Funding
The author(s) disclosed receipt of the following financial support for the research, authorship, and/or publication of this article: This work was supported by the Fundação para a Ciência e a Tecnologia, (grant number project UIDB/05037/2020).
Ethical approval
The study does not involves human subjects and/or animals and also not includes case reports/case series.
Notes
Appendix
Correlation matrix.
| TOTALRENEW | REGQUALITY | PSCR | POLICY | OPENNESS | GGPPC | FOSSIL | FINDEX | FDI | |
|---|---|---|---|---|---|---|---|---|---|
| TOTALRENEW | 1 | ||||||||
| REGQUALITY | −0.249 | 1 | |||||||
| PSCR | 0.027 | 0.131 | 1 | ||||||
| POLICY | 0.078 | −0.093 | 0.045 | 1 | |||||
| OPENNESS | −0.211 | 0.244 | 0.239 | 0.124 | 1 | ||||
| GGPPC | −0.289 | 0.482 | 0.083 | 0.041 | 0.533 | 1 | |||
| FOSSIL | −0.147 | 0.459 | 0.157 | −0.081 | 0.348 | 0.672 | 1 | ||
| FINDEX | 0.054 | 0.428 | 0.125 | 0.170 | 0.152 | 0.496 | 0.576 | 1 | |
| FDI | 0.217 | −0.079 | 0.093 | 0.264 | 0.192 | −0.088 | −0.165 | −0.046 | 1 |